Zip Codes with the Highest Percentage of Population Employed in Health Diagnosing & Treating in Tennessee
RELATED REPORTS & OPTIONS
Health Diagnosing & Treating
Tennessee
Compare Zip Codes
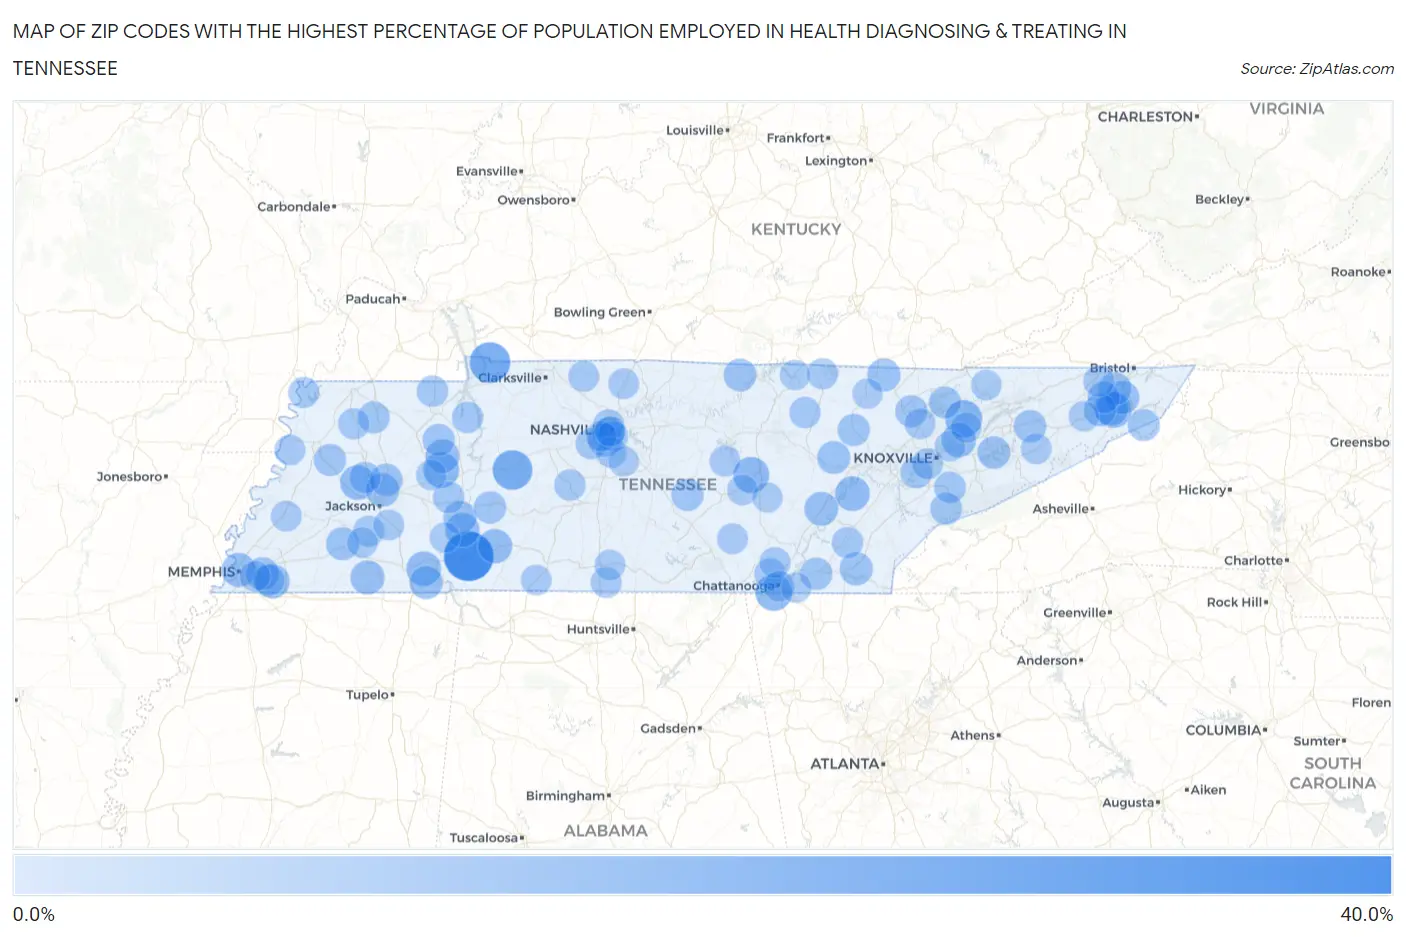
Map of Zip Codes with the Highest Percentage of Population Employed in Health Diagnosing & Treating in Tennessee
0.0%
40.0%
Zip Codes with the Highest Percentage of Population Employed in Health Diagnosing & Treating in Tennessee
| Zip Code | % Employed | vs State | vs National | |
| 1. | 38475 | 37.5% | 6.9%(+30.6)#1 | 6.2%(+31.2)#131 |
| 2. | 37028 | 24.1% | 6.9%(+17.3)#2 | 6.2%(+17.9)#357 |
| 3. | 37140 | 22.9% | 6.9%(+16.1)#3 | 6.2%(+16.7)#395 |
| 4. | 37848 | 19.0% | 6.9%(+12.2)#4 | 6.2%(+12.8)#611 |
| 5. | 37350 | 18.5% | 6.9%(+11.7)#5 | 6.2%(+12.3)#659 |
| 6. | 38579 | 17.6% | 6.9%(+10.7)#6 | 6.2%(+11.3)#759 |
| 7. | 38387 | 17.2% | 6.9%(+10.4)#7 | 6.2%(+11.0)#791 |
| 8. | 37614 | 17.2% | 6.9%(+10.3)#8 | 6.2%(+11.0)#794 |
| 9. | 38337 | 15.8% | 6.9%(+8.92)#9 | 6.2%(+9.54)#993 |
| 10. | 37880 | 15.7% | 6.9%(+8.80)#10 | 6.2%(+9.41)#1,007 |
| 11. | 38379 | 15.5% | 6.9%(+8.66)#11 | 6.2%(+9.28)#1,036 |
| 12. | 37806 | 15.4% | 6.9%(+8.52)#12 | 6.2%(+9.14)#1,060 |
| 13. | 38485 | 15.2% | 6.9%(+8.38)#13 | 6.2%(+9.00)#1,097 |
| 14. | 38139 | 15.2% | 6.9%(+8.34)#14 | 6.2%(+8.95)#1,106 |
| 15. | 38103 | 14.9% | 6.9%(+8.07)#15 | 6.2%(+8.69)#1,171 |
| 16. | 38311 | 14.9% | 6.9%(+8.04)#16 | 6.2%(+8.65)#1,174 |
| 17. | 38052 | 14.7% | 6.9%(+7.87)#17 | 6.2%(+8.49)#1,212 |
| 18. | 38318 | 14.5% | 6.9%(+7.62)#18 | 6.2%(+8.24)#1,269 |
| 19. | 37332 | 14.4% | 6.9%(+7.50)#19 | 6.2%(+8.12)#1,305 |
| 20. | 37604 | 14.2% | 6.9%(+7.39)#20 | 6.2%(+8.00)#1,342 |
| 21. | 38362 | 14.1% | 6.9%(+7.27)#21 | 6.2%(+7.89)#1,376 |
| 22. | 37694 | 14.0% | 6.9%(+7.18)#22 | 6.2%(+7.79)#1,398 |
| 23. | 37215 | 14.0% | 6.9%(+7.16)#23 | 6.2%(+7.77)#1,405 |
| 24. | 38357 | 13.7% | 6.9%(+6.86)#24 | 6.2%(+7.48)#1,504 |
| 25. | 37892 | 13.6% | 6.9%(+6.77)#25 | 6.2%(+7.39)#1,535 |
| 26. | 37307 | 13.6% | 6.9%(+6.70)#26 | 6.2%(+7.32)#1,551 |
| 27. | 38075 | 13.4% | 6.9%(+6.54)#27 | 6.2%(+7.15)#1,613 |
| 28. | 38120 | 13.4% | 6.9%(+6.50)#28 | 6.2%(+7.11)#1,621 |
| 29. | 38329 | 13.3% | 6.9%(+6.45)#29 | 6.2%(+7.07)#1,634 |
| 30. | 37723 | 13.2% | 6.9%(+6.33)#30 | 6.2%(+6.95)#1,672 |
| 31. | 37686 | 13.1% | 6.9%(+6.26)#31 | 6.2%(+6.88)#1,703 |
| 32. | 38575 | 13.1% | 6.9%(+6.19)#32 | 6.2%(+6.81)#1,723 |
| 33. | 37725 | 12.9% | 6.9%(+6.05)#33 | 6.2%(+6.67)#1,774 |
| 34. | 38355 | 12.8% | 6.9%(+5.98)#34 | 6.2%(+6.60)#1,806 |
| 35. | 37659 | 12.7% | 6.9%(+5.81)#35 | 6.2%(+6.43)#1,878 |
| 36. | 37810 | 12.7% | 6.9%(+5.80)#36 | 6.2%(+6.42)#1,883 |
| 37. | 37353 | 12.5% | 6.9%(+5.64)#37 | 6.2%(+6.26)#1,950 |
| 38. | 37212 | 12.5% | 6.9%(+5.62)#38 | 6.2%(+6.23)#1,973 |
| 39. | 37770 | 12.3% | 6.9%(+5.46)#39 | 6.2%(+6.07)#2,050 |
| 40. | 37096 | 12.3% | 6.9%(+5.43)#40 | 6.2%(+6.05)#2,059 |
| 41. | 38070 | 12.3% | 6.9%(+5.42)#41 | 6.2%(+6.04)#2,070 |
| 42. | 38342 | 12.2% | 6.9%(+5.35)#42 | 6.2%(+5.96)#2,101 |
| 43. | 37615 | 12.1% | 6.9%(+5.25)#43 | 6.2%(+5.86)#2,161 |
| 44. | 37026 | 12.1% | 6.9%(+5.23)#44 | 6.2%(+5.85)#2,167 |
| 45. | 37757 | 12.1% | 6.9%(+5.20)#45 | 6.2%(+5.82)#2,192 |
| 46. | 37687 | 11.8% | 6.9%(+4.97)#46 | 6.2%(+5.59)#2,309 |
| 47. | 38255 | 11.7% | 6.9%(+4.86)#47 | 6.2%(+5.47)#2,374 |
| 48. | 37882 | 11.6% | 6.9%(+4.77)#48 | 6.2%(+5.39)#2,422 |
| 49. | 37866 | 11.6% | 6.9%(+4.76)#49 | 6.2%(+5.37)#2,438 |
| 50. | 37922 | 11.6% | 6.9%(+4.72)#50 | 6.2%(+5.33)#2,472 |
| 51. | 37886 | 11.5% | 6.9%(+4.63)#51 | 6.2%(+5.24)#2,531 |
| 52. | 38138 | 11.5% | 6.9%(+4.62)#52 | 6.2%(+5.24)#2,533 |
| 53. | 38328 | 11.3% | 6.9%(+4.44)#53 | 6.2%(+5.06)#2,657 |
| 54. | 38251 | 11.2% | 6.9%(+4.32)#54 | 6.2%(+4.94)#2,756 |
| 55. | 37221 | 11.0% | 6.9%(+4.16)#55 | 6.2%(+4.78)#2,873 |
| 56. | 37370 | 11.0% | 6.9%(+4.11)#56 | 6.2%(+4.73)#2,907 |
| 57. | 38589 | 11.0% | 6.9%(+4.10)#57 | 6.2%(+4.71)#2,917 |
| 58. | 38221 | 10.9% | 6.9%(+4.08)#58 | 6.2%(+4.70)#2,931 |
| 59. | 38343 | 10.9% | 6.9%(+4.07)#59 | 6.2%(+4.68)#2,943 |
| 60. | 38233 | 10.9% | 6.9%(+4.02)#60 | 6.2%(+4.64)#2,972 |
| 61. | 38482 | 10.9% | 6.9%(+4.02)#61 | 6.2%(+4.63)#2,981 |
| 62. | 38356 | 10.9% | 6.9%(+4.00)#62 | 6.2%(+4.61)#3,000 |
| 63. | 37228 | 10.8% | 6.9%(+3.94)#63 | 6.2%(+4.56)#3,050 |
| 64. | 37919 | 10.7% | 6.9%(+3.80)#64 | 6.2%(+4.41)#3,174 |
| 65. | 37664 | 10.6% | 6.9%(+3.73)#65 | 6.2%(+4.35)#3,230 |
| 66. | 38577 | 10.6% | 6.9%(+3.71)#66 | 6.2%(+4.33)#3,243 |
| 67. | 37405 | 10.5% | 6.9%(+3.62)#67 | 6.2%(+4.24)#3,327 |
| 68. | 37032 | 10.4% | 6.9%(+3.58)#68 | 6.2%(+4.20)#3,368 |
| 69. | 37377 | 10.4% | 6.9%(+3.56)#69 | 6.2%(+4.18)#3,388 |
| 70. | 38079 | 10.4% | 6.9%(+3.56)#70 | 6.2%(+4.17)#3,393 |
| 71. | 37204 | 10.4% | 6.9%(+3.53)#71 | 6.2%(+4.15)#3,415 |
| 72. | 38449 | 10.4% | 6.9%(+3.50)#72 | 6.2%(+4.12)#3,454 |
| 73. | 37313 | 10.4% | 6.9%(+3.49)#73 | 6.2%(+4.11)#3,463 |
| 74. | 38366 | 10.3% | 6.9%(+3.47)#74 | 6.2%(+4.09)#3,489 |
| 75. | 37828 | 10.3% | 6.9%(+3.44)#75 | 6.2%(+4.06)#3,526 |
| 76. | 37166 | 10.3% | 6.9%(+3.41)#76 | 6.2%(+4.03)#3,569 |
| 77. | 38030 | 10.2% | 6.9%(+3.29)#77 | 6.2%(+3.91)#3,689 |
| 78. | 37188 | 10.2% | 6.9%(+3.29)#78 | 6.2%(+3.91)#3,694 |
| 79. | 37843 | 10.2% | 6.9%(+3.29)#79 | 6.2%(+3.91)#3,696 |
| 80. | 38019 | 10.1% | 6.9%(+3.25)#80 | 6.2%(+3.87)#3,747 |
| 81. | 37408 | 10.1% | 6.9%(+3.25)#81 | 6.2%(+3.86)#3,748 |
| 82. | 38117 | 10.1% | 6.9%(+3.22)#82 | 6.2%(+3.84)#3,790 |
| 83. | 38381 | 10.1% | 6.9%(+3.21)#83 | 6.2%(+3.83)#3,796 |
| 84. | 38459 | 10.0% | 6.9%(+3.18)#84 | 6.2%(+3.80)#3,834 |
| 85. | 37027 | 10.0% | 6.9%(+3.14)#85 | 6.2%(+3.75)#3,907 |
| 86. | 38581 | 9.9% | 6.9%(+3.08)#86 | 6.2%(+3.70)#3,961 |
| 87. | 38469 | 9.9% | 6.9%(+3.07)#87 | 6.2%(+3.68)#3,973 |
| 88. | 37205 | 9.8% | 6.9%(+2.97)#88 | 6.2%(+3.59)#4,075 |
| 89. | 37879 | 9.8% | 6.9%(+2.93)#89 | 6.2%(+3.54)#4,127 |
| 90. | 37203 | 9.8% | 6.9%(+2.90)#90 | 6.2%(+3.51)#4,167 |
| 91. | 37421 | 9.7% | 6.9%(+2.88)#91 | 6.2%(+3.49)#4,204 |
| 92. | 38370 | 9.7% | 6.9%(+2.84)#92 | 6.2%(+3.46)#4,252 |
| 93. | 37924 | 9.7% | 6.9%(+2.83)#93 | 6.2%(+3.44)#4,268 |
| 94. | 37709 | 9.7% | 6.9%(+2.81)#94 | 6.2%(+3.42)#4,300 |
| 95. | 38549 | 9.7% | 6.9%(+2.80)#95 | 6.2%(+3.42)#4,302 |
| 96. | 37755 | 9.7% | 6.9%(+2.80)#96 | 6.2%(+3.42)#4,304 |
| 97. | 37681 | 9.7% | 6.9%(+2.79)#97 | 6.2%(+3.41)#4,324 |
| 98. | 37135 | 9.7% | 6.9%(+2.79)#98 | 6.2%(+3.41)#4,327 |
| 99. | 38390 | 9.6% | 6.9%(+2.77)#99 | 6.2%(+3.39)#4,353 |
| 100. | 38585 | 9.5% | 6.9%(+2.66)#100 | 6.2%(+3.28)#4,495 |
Common Questions
What are the Top 10 Zip Codes with the Highest Percentage of Population Employed in Health Diagnosing & Treating in Tennessee?
Top 10 Zip Codes with the Highest Percentage of Population Employed in Health Diagnosing & Treating in Tennessee are:
What zip code has the Highest Percentage of Population Employed in Health Diagnosing & Treating in Tennessee?
38475 has the Highest Percentage of Population Employed in Health Diagnosing & Treating in Tennessee with 37.5%.
What is the Percentage of Population Employed in Health Diagnosing & Treating in the State of Tennessee?
Percentage of Population Employed in Health Diagnosing & Treating in Tennessee is 6.9%.
What is the Percentage of Population Employed in Health Diagnosing & Treating in the United States?
Percentage of Population Employed in Health Diagnosing & Treating in the United States is 6.2%.