Zip Codes with the Highest Percentage of Population Employed in Health Diagnosing & Treating in Weatherford, TX
RELATED REPORTS & OPTIONS
Health Diagnosing & Treating
Weatherford
Compare Zip Codes
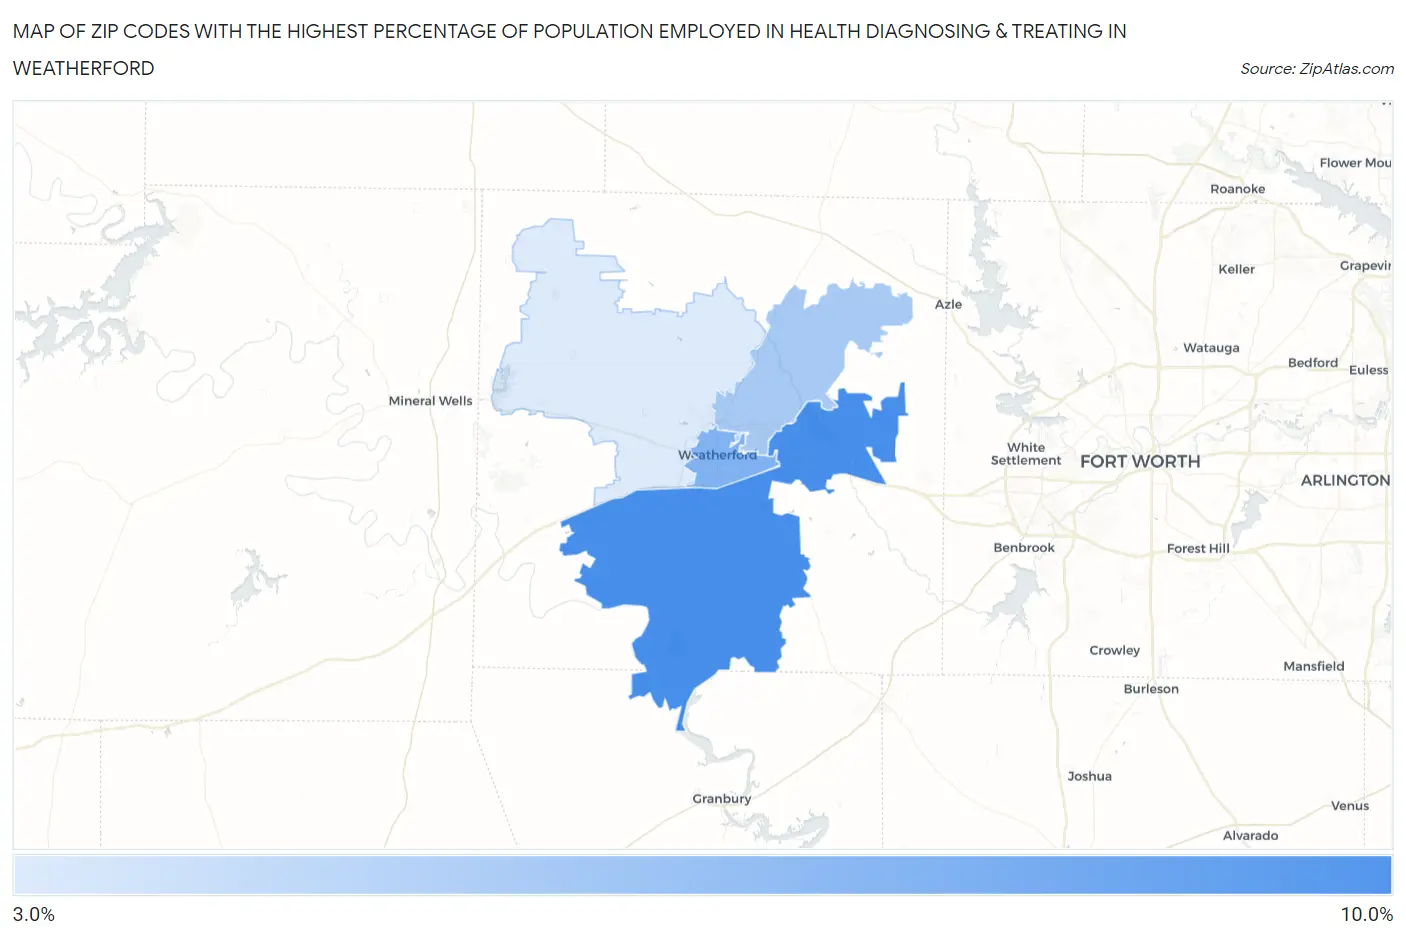
Map of Zip Codes with the Highest Percentage of Population Employed in Health Diagnosing & Treating in Weatherford
0.0%
10.0%
Zip Codes with the Highest Percentage of Population Employed in Health Diagnosing & Treating in Weatherford, TX
| Zip Code | % Employed | vs State | vs National | |
| 1. | 76087 | 9.1% | 5.5%(+3.53)#217 | 6.2%(+2.81)#5,279 |
| 2. | 76086 | 6.7% | 5.5%(+1.14)#489 | 6.2%(+0.417)#11,449 |
| 3. | 76085 | 5.1% | 5.5%(-0.375)#793 | 6.2%(-1.10)#17,149 |
| 4. | 76088 | 3.0% | 5.5%(-2.49)#1,292 | 6.2%(-3.22)#24,248 |
1
Common Questions
What are the Top 3 Zip Codes with the Highest Percentage of Population Employed in Health Diagnosing & Treating in Weatherford, TX?
Top 3 Zip Codes with the Highest Percentage of Population Employed in Health Diagnosing & Treating in Weatherford, TX are:
What zip code has the Highest Percentage of Population Employed in Health Diagnosing & Treating in Weatherford, TX?
76087 has the Highest Percentage of Population Employed in Health Diagnosing & Treating in Weatherford, TX with 9.1%.
What is the Percentage of Population Employed in Health Diagnosing & Treating in Weatherford, TX?
Percentage of Population Employed in Health Diagnosing & Treating in Weatherford is 6.1%.
What is the Percentage of Population Employed in Health Diagnosing & Treating in Texas?
Percentage of Population Employed in Health Diagnosing & Treating in Texas is 5.5%.
What is the Percentage of Population Employed in Health Diagnosing & Treating in the United States?
Percentage of Population Employed in Health Diagnosing & Treating in the United States is 6.2%.