Coopertown, TN
Coopertown Map
Coopertown Overview
4,536
TOTAL POPULATION
2,490
MALE POPULATION
2,046
FEMALE POPULATION
121.70
MALES / 100 FEMALES
82.17
FEMALES / 100 MALES
45.5
MEDIAN AGE
3.1
AVG FAMILY SIZE
2.7
AVG HOUSEHOLD SIZE
$46,093
PER CAPITA INCOME
$113,523
AVG FAMILY INCOME
$106,121
AVG HOUSEHOLD INCOME
5.6%
WAGE / INCOME GAP [ % ]
94.4¢/ $1
WAGE / INCOME GAP [ $ ]
0.43
INEQUALITY / GINI INDEX
2,555
LABOR FORCE [ PEOPLE ]
67.7%
PERCENT IN LABOR FORCE
1.0%
UNEMPLOYMENT RATE
Coopertown Area Codes
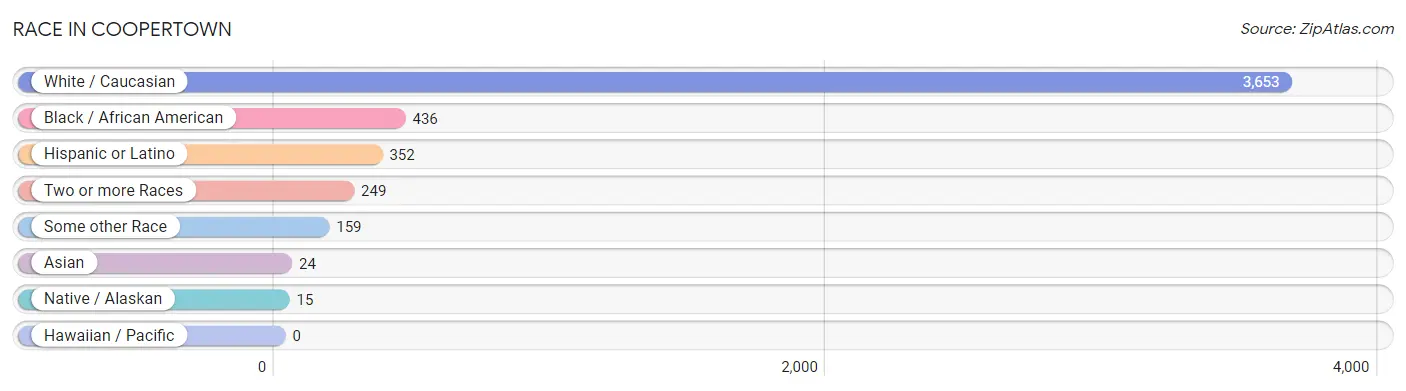
Race in Coopertown
The most populous races in Coopertown are White / Caucasian (3,653 | 80.5%), Black / African American (436 | 9.6%), and Hispanic or Latino (352 | 7.8%).
| Race | # Population | % Population |
| Asian | 24 | 0.5% |
| Black / African American | 436 | 9.6% |
| Hawaiian / Pacific | 0 | 0.0% |
| Hispanic or Latino | 352 | 7.8% |
| Native / Alaskan | 15 | 0.3% |
| White / Caucasian | 3,653 | 80.5% |
| Two or more Races | 249 | 5.5% |
| Some other Race | 159 | 3.5% |
| Total | 4,536 | 100.0% |
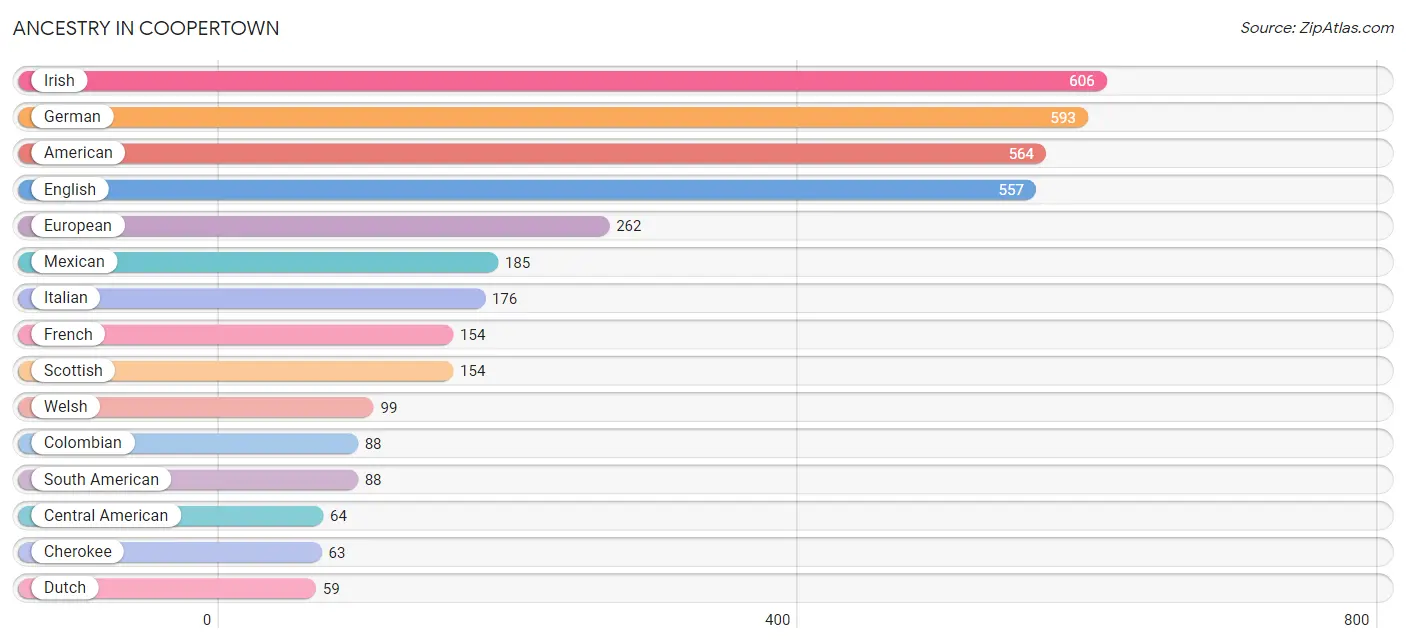
Ancestry in Coopertown
The most populous ancestries reported in Coopertown are Irish (606 | 13.4%), German (593 | 13.1%), American (564 | 12.4%), English (557 | 12.3%), and European (262 | 5.8%), together accounting for 56.9% of all Coopertown residents.
| Ancestry | # Population | % Population |
| American | 564 | 12.4% |
| British | 50 | 1.1% |
| Burmese | 24 | 0.5% |
| Central American | 64 | 1.4% |
| Central American Indian | 15 | 0.3% |
| Cherokee | 63 | 1.4% |
| Colombian | 88 | 1.9% |
| Dutch | 59 | 1.3% |
| English | 557 | 12.3% |
| European | 262 | 5.8% |
| Finnish | 14 | 0.3% |
| French | 154 | 3.4% |
| German | 593 | 13.1% |
| Greek | 11 | 0.2% |
| Honduran | 51 | 1.1% |
| Irish | 606 | 13.4% |
| Italian | 176 | 3.9% |
| Mexican | 185 | 4.1% |
| Norwegian | 43 | 0.9% |
| Polish | 44 | 1.0% |
| Portuguese | 29 | 0.6% |
| Puerto Rican | 15 | 0.3% |
| Salvadoran | 13 | 0.3% |
| Scotch-Irish | 45 | 1.0% |
| Scottish | 154 | 3.4% |
| South American | 88 | 1.9% |
| South American Indian | 22 | 0.5% |
| Swiss | 14 | 0.3% |
| Welsh | 99 | 2.2% | View All 29 Rows |
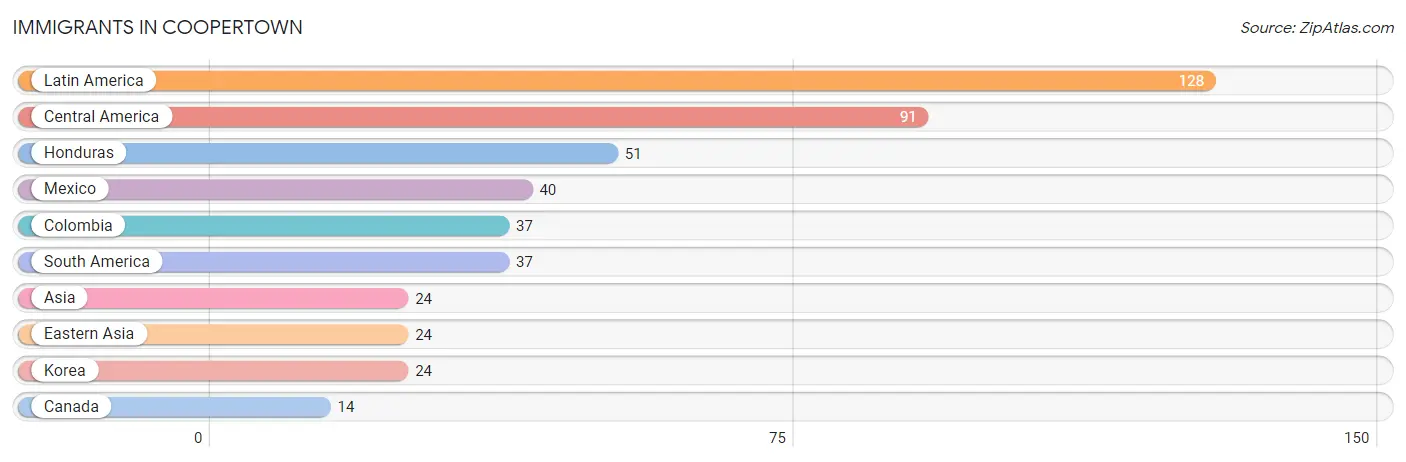
Immigrants in Coopertown
The most numerous immigrant groups reported in Coopertown came from Latin America (128 | 2.8%), Central America (91 | 2.0%), Honduras (51 | 1.1%), Mexico (40 | 0.9%), and Colombia (37 | 0.8%), together accounting for 7.6% of all Coopertown residents.
| Immigration Origin | # Population | % Population |
| Asia | 24 | 0.5% |
| Canada | 14 | 0.3% |
| Central America | 91 | 2.0% |
| Colombia | 37 | 0.8% |
| Eastern Asia | 24 | 0.5% |
| Honduras | 51 | 1.1% |
| Korea | 24 | 0.5% |
| Latin America | 128 | 2.8% |
| Mexico | 40 | 0.9% |
| South America | 37 | 0.8% | View All 10 Rows |
Sex and Age in Coopertown
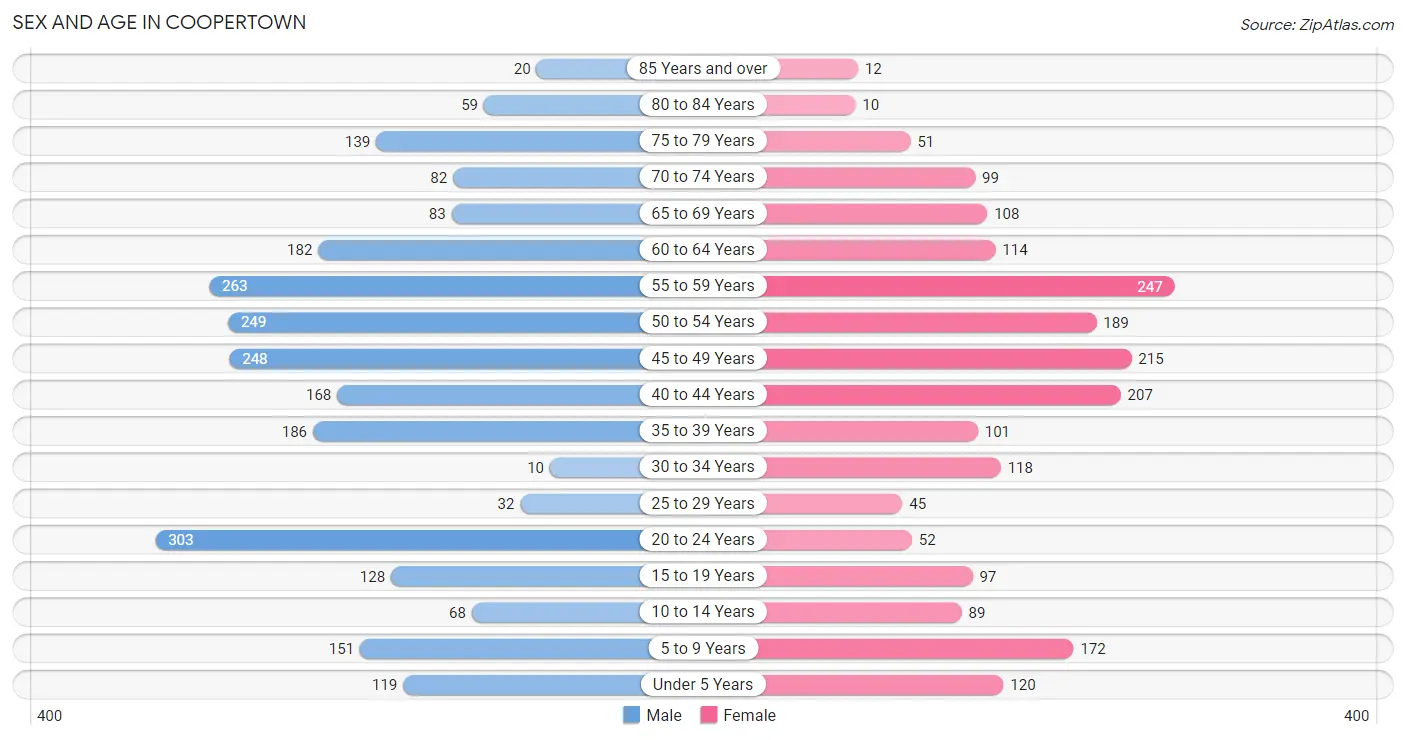
Sex and Age in Coopertown
The most populous age groups in Coopertown are 20 to 24 Years (303 | 12.2%) for men and 55 to 59 Years (247 | 12.1%) for women.
| Age Bracket | Male | Female |
| Under 5 Years | 119 (4.8%) | 120 (5.9%) |
| 5 to 9 Years | 151 (6.1%) | 172 (8.4%) |
| 10 to 14 Years | 68 (2.7%) | 89 (4.3%) |
| 15 to 19 Years | 128 (5.1%) | 97 (4.7%) |
| 20 to 24 Years | 303 (12.2%) | 52 (2.5%) |
| 25 to 29 Years | 32 (1.3%) | 45 (2.2%) |
| 30 to 34 Years | 10 (0.4%) | 118 (5.8%) |
| 35 to 39 Years | 186 (7.5%) | 101 (4.9%) |
| 40 to 44 Years | 168 (6.8%) | 207 (10.1%) |
| 45 to 49 Years | 248 (10.0%) | 215 (10.5%) |
| 50 to 54 Years | 249 (10.0%) | 189 (9.2%) |
| 55 to 59 Years | 263 (10.6%) | 247 (12.1%) |
| 60 to 64 Years | 182 (7.3%) | 114 (5.6%) |
| 65 to 69 Years | 83 (3.3%) | 108 (5.3%) |
| 70 to 74 Years | 82 (3.3%) | 99 (4.8%) |
| 75 to 79 Years | 139 (5.6%) | 51 (2.5%) |
| 80 to 84 Years | 59 (2.4%) | 10 (0.5%) |
| 85 Years and over | 20 (0.8%) | 12 (0.6%) |
| Total | 2,490 (100.0%) | 2,046 (100.0%) |
Families and Households in Coopertown
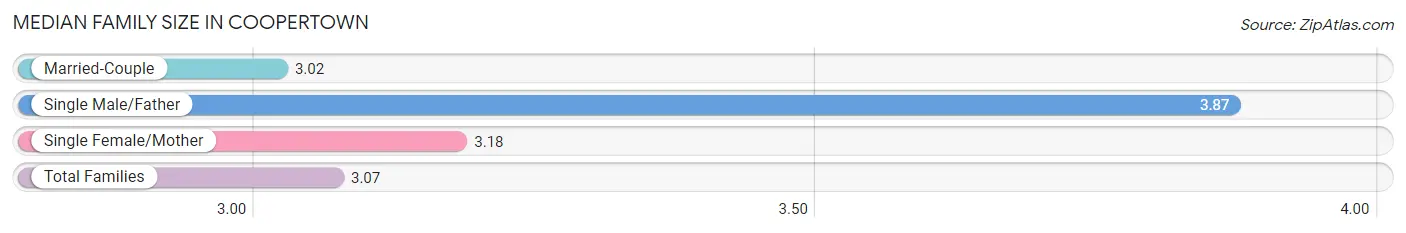
Median Family Size in Coopertown
The median family size in Coopertown is 3.07 persons per family, with single male/father families (38 | 2.9%) accounting for the largest median family size of 3.87 persons per family. On the other hand, married-couple families (1,054 | 80.9%) represent the smallest median family size with 3.02 persons per family.
| Family Type | # Families | Family Size |
| Married-Couple | 1,054 (80.9%) | 3.02 |
| Single Male/Father | 38 (2.9%) | 3.87 |
| Single Female/Mother | 210 (16.1%) | 3.18 |
| Total Families | 1,302 (100.0%) | 3.07 |
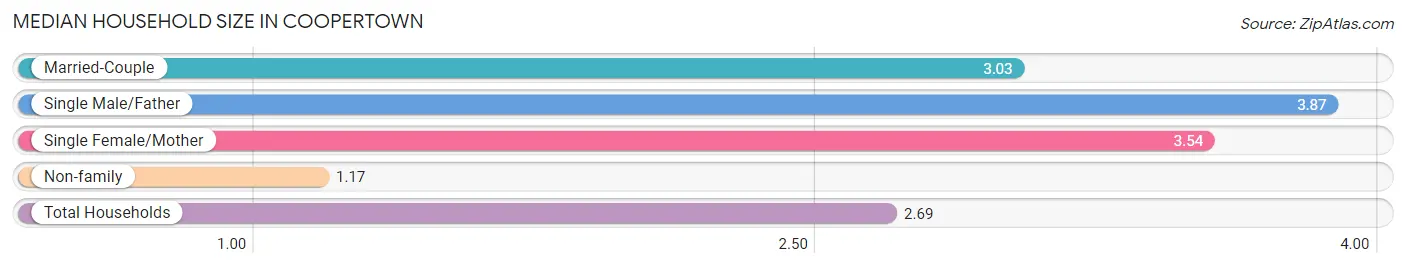
Median Household Size in Coopertown
The median household size in Coopertown is 2.69 persons per household, with single male/father households (38 | 2.3%) accounting for the largest median household size of 3.87 persons per household. non-family households (382 | 22.7%) represent the smallest median household size with 1.17 persons per household.
| Household Type | # Households | Household Size |
| Married-Couple | 1,054 (62.6%) | 3.03 |
| Single Male/Father | 38 (2.3%) | 3.87 |
| Single Female/Mother | 210 (12.5%) | 3.54 |
| Non-family | 382 (22.7%) | 1.17 |
| Total Households | 1,684 (100.0%) | 2.69 |
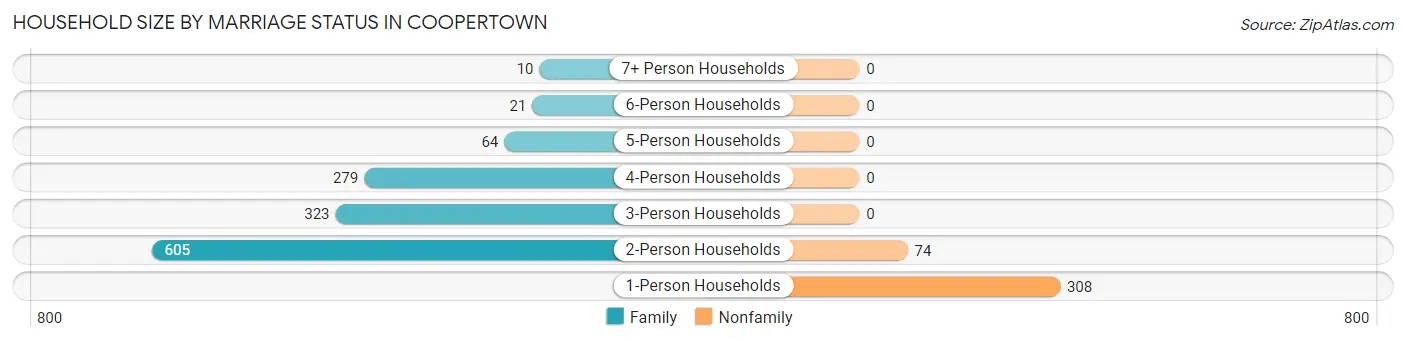
Household Size by Marriage Status in Coopertown
Out of a total of 1,684 households in Coopertown, 1,302 (77.3%) are family households, while 382 (22.7%) are nonfamily households. The most numerous type of family households are 2-person households, comprising 605, and the most common type of nonfamily households are 1-person households, comprising 308.
| Household Size | Family Households | Nonfamily Households |
| 1-Person Households | - | 308 (18.3%) |
| 2-Person Households | 605 (35.9%) | 74 (4.4%) |
| 3-Person Households | 323 (19.2%) | 0 (0.0%) |
| 4-Person Households | 279 (16.6%) | 0 (0.0%) |
| 5-Person Households | 64 (3.8%) | 0 (0.0%) |
| 6-Person Households | 21 (1.3%) | 0 (0.0%) |
| 7+ Person Households | 10 (0.6%) | 0 (0.0%) |
| Total | 1,302 (77.3%) | 382 (22.7%) |
Female Fertility in Coopertown
Fertility by Age in Coopertown
Average fertility rate in Coopertown is 55.0 births per 1,000 women. Women in the age bracket of 35 to 50 years have the highest fertility rate with 85.0 births per 1,000 women. Women in the age bracket of 35 to 50 years acount for 100.0% of all women with births.
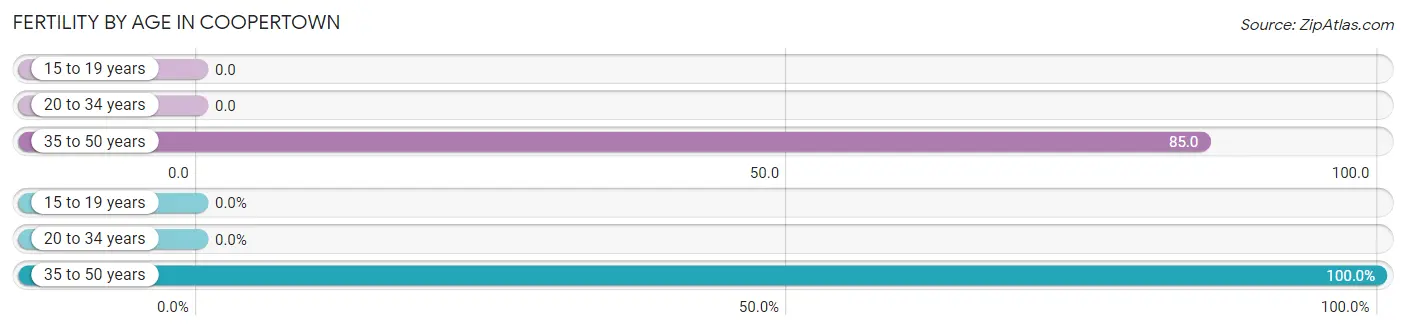
| Age Bracket | Women with Births | Births / 1,000 Women |
| 15 to 19 years | 0 (0.0%) | 0.0 |
| 20 to 34 years | 0 (0.0%) | 0.0 |
| 35 to 50 years | 48 (100.0%) | 85.0 |
| Total | 48 (100.0%) | 55.0 |
Fertility by Age by Marriage Status in Coopertown
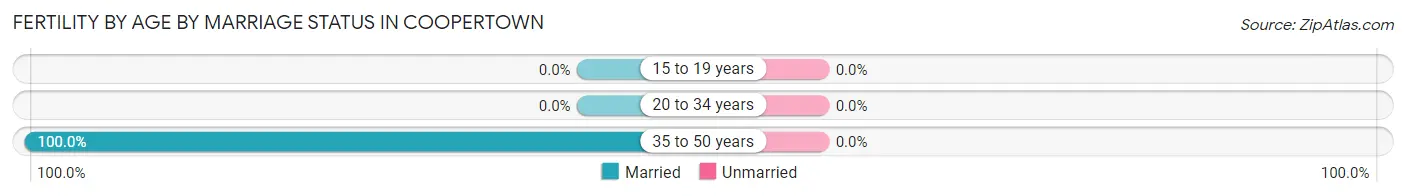
| Age Bracket | Married | Unmarried |
| 15 to 19 years | 0 (0.0%) | 0 (0.0%) |
| 20 to 34 years | 0 (0.0%) | 0 (0.0%) |
| 35 to 50 years | 48 (100.0%) | 0 (0.0%) |
| Total | 48 (100.0%) | 0 (0.0%) |
Fertility by Education in Coopertown
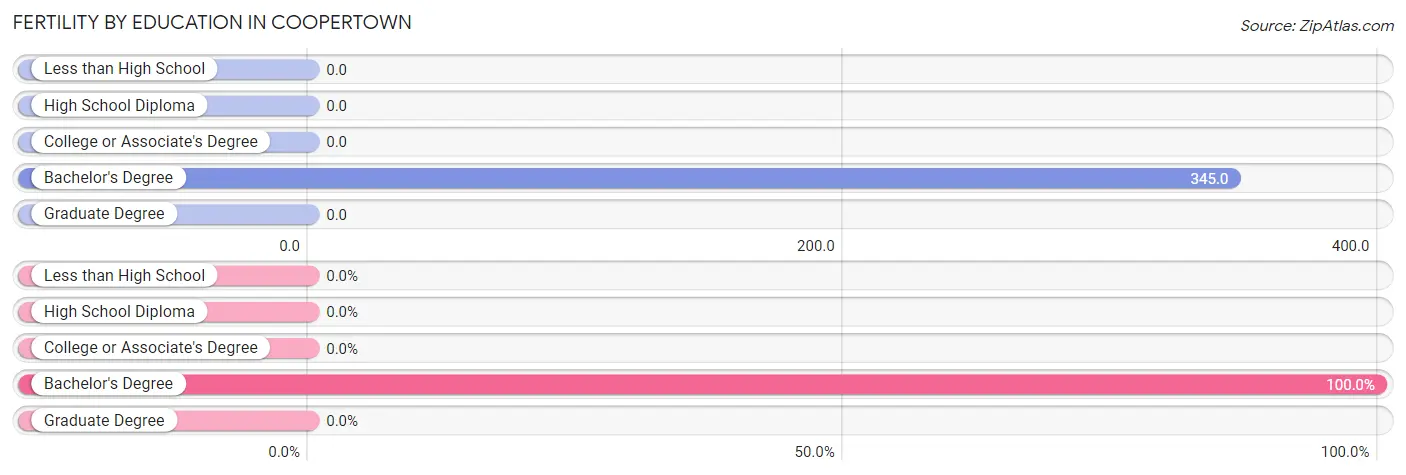
| Educational Attainment | Women with Births | Births / 1,000 Women |
| Less than High School | 0 (0.0%) | 0.0 |
| High School Diploma | 0 (0.0%) | 0.0 |
| College or Associate's Degree | 0 (0.0%) | 0.0 |
| Bachelor's Degree | 48 (100.0%) | 345.0 |
| Graduate Degree | 0 (0.0%) | 0.0 |
| Total | 48 (100.0%) | 55.0 |
Fertility by Education by Marriage Status in Coopertown
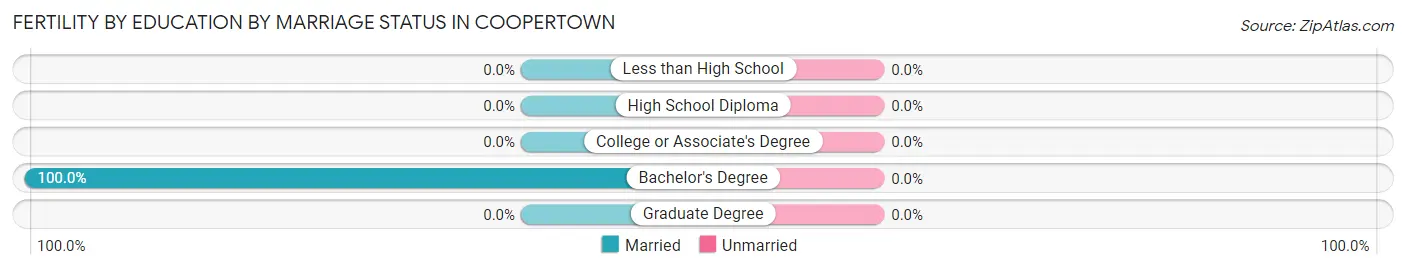
| Educational Attainment | Married | Unmarried |
| Less than High School | 0 (0.0%) | 0 (0.0%) |
| High School Diploma | 0 (0.0%) | 0 (0.0%) |
| College or Associate's Degree | 0 (0.0%) | 0 (0.0%) |
| Bachelor's Degree | 48 (100.0%) | 0 (0.0%) |
| Graduate Degree | 0 (0.0%) | 0 (0.0%) |
| Total | 48 (100.0%) | 0 (0.0%) |
Income in Coopertown
Income Overview in Coopertown
Per Capita Income in Coopertown is $46,093, while median incomes of families and households are $113,523 and $106,121 respectively.
| Characteristic | Number | Measure |
| Per Capita Income | 4,536 | $46,093 |
| Median Family Income | 1,302 | $113,523 |
| Mean Family Income | 1,302 | $134,992 |
| Median Household Income | 1,684 | $106,121 |
| Mean Household Income | 1,684 | $120,127 |
| Income Deficit | 1,302 | $0 |
| Wage / Income Gap (%) | 4,536 | 5.64% |
| Wage / Income Gap ($) | 4,536 | 94.36¢ per $1 |
| Gini / Inequality Index | 4,536 | 0.43 |
Earnings by Sex in Coopertown
Average Earnings in Coopertown are $45,287, $46,250 for men and $43,642 for women, a difference of 5.6%.
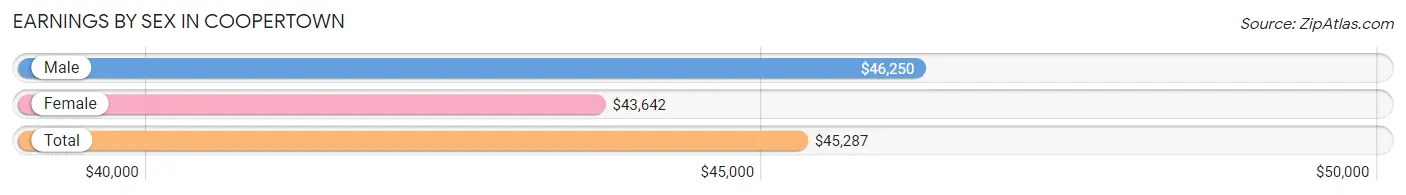
| Sex | Number | Average Earnings |
| Male | 1,639 (60.8%) | $46,250 |
| Female | 1,057 (39.2%) | $43,642 |
| Total | 2,696 (100.0%) | $45,287 |
Earnings by Sex by Income Bracket in Coopertown
The most common earnings brackets in Coopertown are $100,000+ for men (301 | 18.4%) and $55,000 to $64,999 for women (120 | 11.4%).
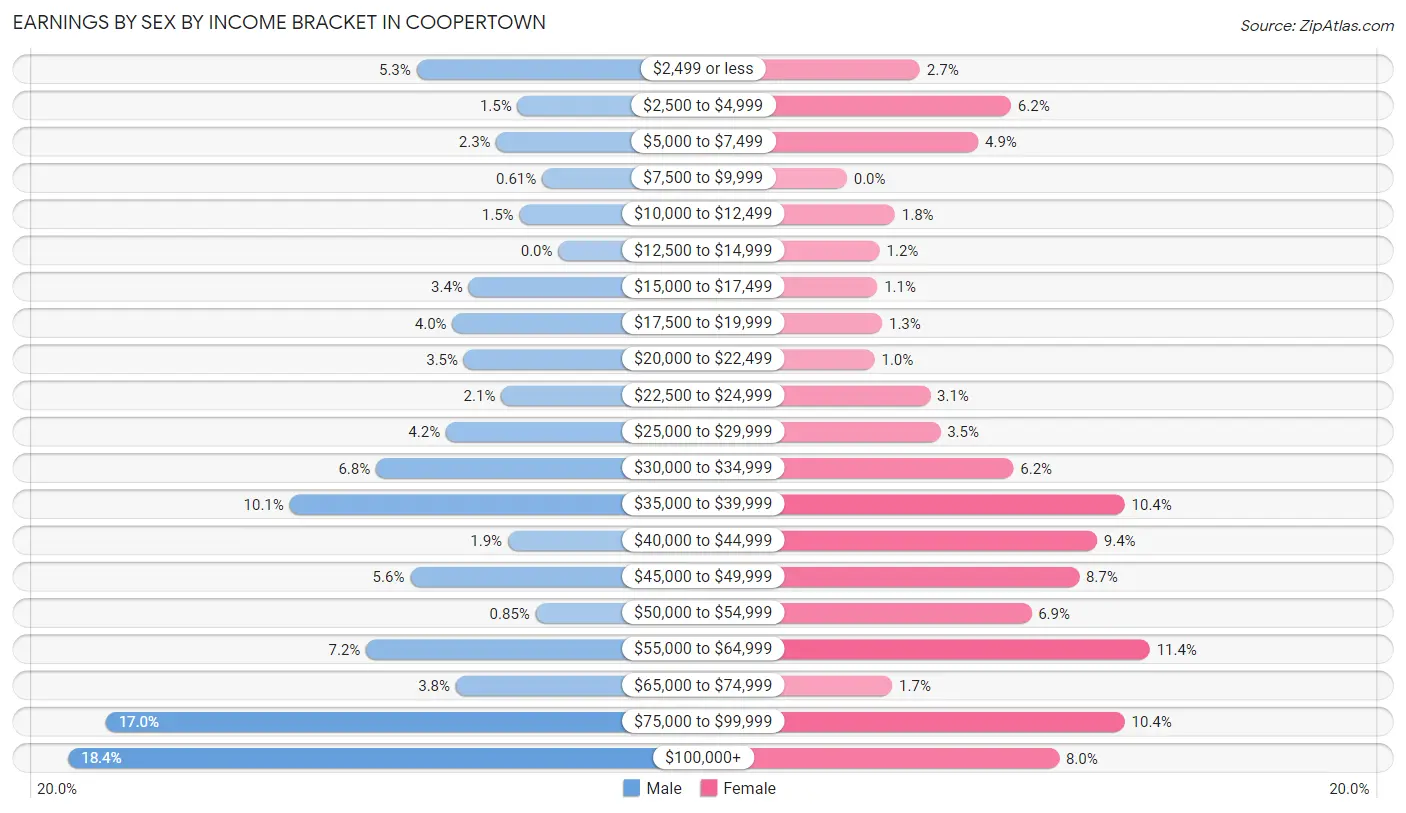
| Income | Male | Female |
| $2,499 or less | 87 (5.3%) | 29 (2.7%) |
| $2,500 to $4,999 | 25 (1.5%) | 65 (6.1%) |
| $5,000 to $7,499 | 38 (2.3%) | 52 (4.9%) |
| $7,500 to $9,999 | 10 (0.6%) | 0 (0.0%) |
| $10,000 to $12,499 | 24 (1.5%) | 19 (1.8%) |
| $12,500 to $14,999 | 0 (0.0%) | 13 (1.2%) |
| $15,000 to $17,499 | 55 (3.4%) | 12 (1.1%) |
| $17,500 to $19,999 | 65 (4.0%) | 14 (1.3%) |
| $20,000 to $22,499 | 58 (3.5%) | 11 (1.0%) |
| $22,500 to $24,999 | 35 (2.1%) | 33 (3.1%) |
| $25,000 to $29,999 | 69 (4.2%) | 37 (3.5%) |
| $30,000 to $34,999 | 112 (6.8%) | 66 (6.2%) |
| $35,000 to $39,999 | 165 (10.1%) | 110 (10.4%) |
| $40,000 to $44,999 | 31 (1.9%) | 99 (9.4%) |
| $45,000 to $49,999 | 91 (5.6%) | 92 (8.7%) |
| $50,000 to $54,999 | 14 (0.9%) | 73 (6.9%) |
| $55,000 to $64,999 | 118 (7.2%) | 120 (11.4%) |
| $65,000 to $74,999 | 63 (3.8%) | 18 (1.7%) |
| $75,000 to $99,999 | 278 (17.0%) | 110 (10.4%) |
| $100,000+ | 301 (18.4%) | 84 (8.0%) |
| Total | 1,639 (100.0%) | 1,057 (100.0%) |
Earnings by Sex by Educational Attainment in Coopertown
Average earnings in Coopertown are $64,929 for men and $44,741 for women, a difference of 31.1%. Men with an educational attainment of graduate degree enjoy the highest average annual earnings of $119,074, while those with high school diploma education earn the least with $38,000. Women with an educational attainment of graduate degree earn the most with the average annual earnings of $67,431, while those with high school diploma education have the smallest earnings of $38,432.
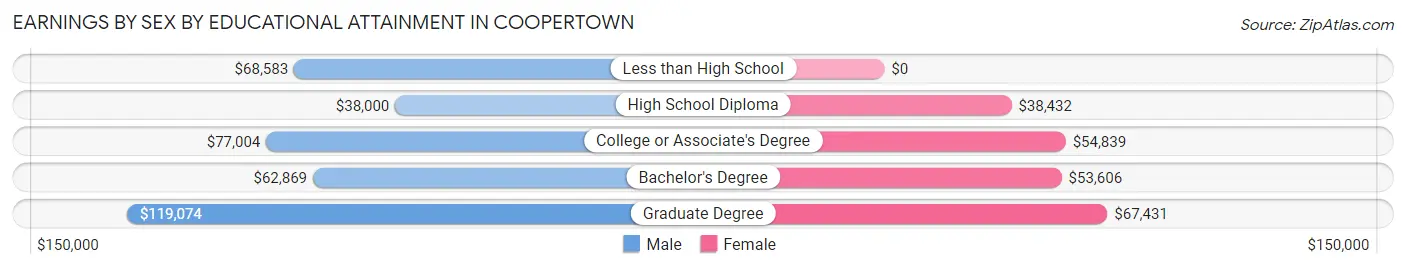
| Educational Attainment | Male Income | Female Income |
| Less than High School | $68,583 | $0 |
| High School Diploma | $38,000 | $38,432 |
| College or Associate's Degree | $77,004 | $54,839 |
| Bachelor's Degree | $62,869 | $53,606 |
| Graduate Degree | $119,074 | $67,431 |
| Total | $64,929 | $44,741 |
Family Income in Coopertown
Family Income Brackets in Coopertown
According to the Coopertown family income data, there are 365 families falling into the $100,000 to $149,999 income range, which is the most common income bracket and makes up 28.0% of all families. Conversely, the less than $10,000 income bracket is the least frequent group with only 16 families (1.2%) belonging to this category.
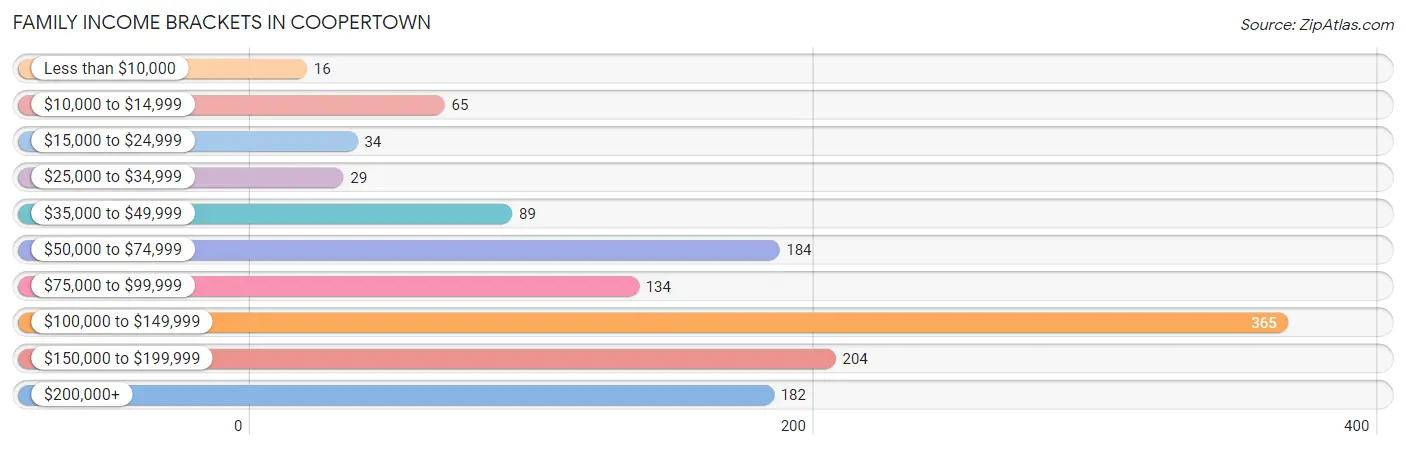
| Income Bracket | # Families | % Families |
| Less than $10,000 | 16 | 1.2% |
| $10,000 to $14,999 | 65 | 5.0% |
| $15,000 to $24,999 | 34 | 2.6% |
| $25,000 to $34,999 | 29 | 2.2% |
| $35,000 to $49,999 | 89 | 6.8% |
| $50,000 to $74,999 | 184 | 14.1% |
| $75,000 to $99,999 | 134 | 10.3% |
| $100,000 to $149,999 | 365 | 28.0% |
| $150,000 to $199,999 | 204 | 15.7% |
| $200,000+ | 182 | 14.0% |
Family Income by Famaliy Size in Coopertown
4-person families (193 | 14.8%) account for the highest median family income in Coopertown with $157,344 per family, while 2-person families (605 | 46.5%) have the highest median income of $59,046 per family member.
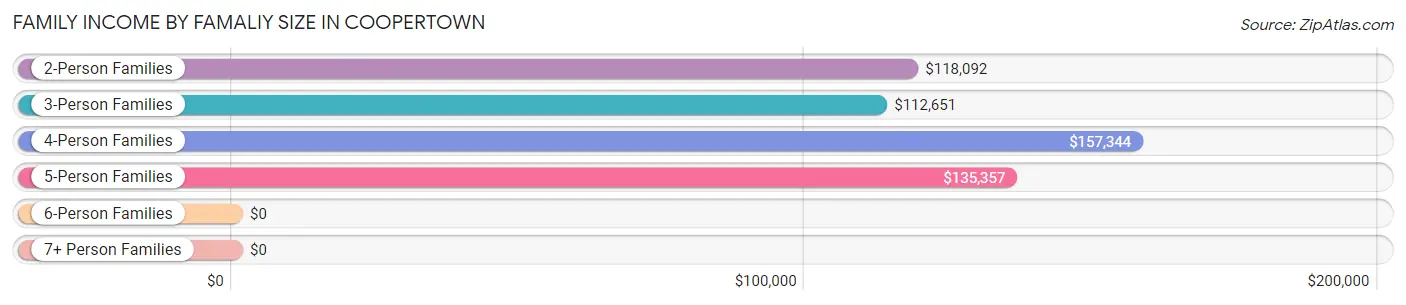
| Income Bracket | # Families | Median Income |
| 2-Person Families | 605 (46.5%) | $118,092 |
| 3-Person Families | 409 (31.4%) | $112,651 |
| 4-Person Families | 193 (14.8%) | $157,344 |
| 5-Person Families | 64 (4.9%) | $135,357 |
| 6-Person Families | 21 (1.6%) | $0 |
| 7+ Person Families | 10 (0.8%) | $0 |
| Total | 1,302 (100.0%) | $113,523 |
Family Income by Number of Earners in Coopertown
The median family income in Coopertown is $113,523, with families comprising 3+ earners (225) having the highest median family income of $135,142, while families with no earners (245) have the lowest median family income of $41,736, accounting for 17.3% and 18.8% of families, respectively.
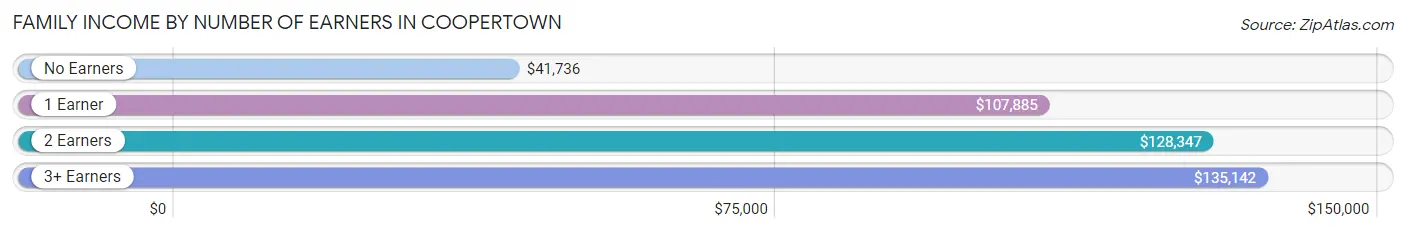
| Number of Earners | # Families | Median Income |
| No Earners | 245 (18.8%) | $41,736 |
| 1 Earner | 250 (19.2%) | $107,885 |
| 2 Earners | 582 (44.7%) | $128,347 |
| 3+ Earners | 225 (17.3%) | $135,142 |
| Total | 1,302 (100.0%) | $113,523 |
Household Income in Coopertown
Household Income Brackets in Coopertown
With 477 households falling in the category, the $100,000 to $149,999 income range is the most frequent in Coopertown, accounting for 28.3% of all households. In contrast, only 17 households (1.0%) fall into the less than $10,000 income bracket, making it the least populous group.
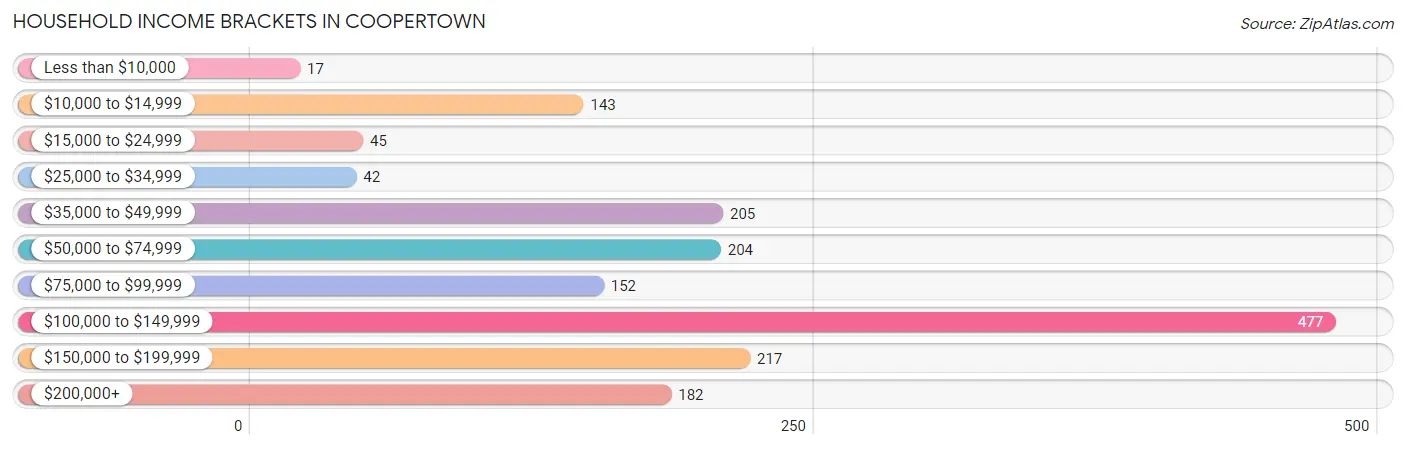
| Income Bracket | # Households | % Households |
| Less than $10,000 | 17 | 1.0% |
| $10,000 to $14,999 | 143 | 8.5% |
| $15,000 to $24,999 | 45 | 2.7% |
| $25,000 to $34,999 | 42 | 2.5% |
| $35,000 to $49,999 | 205 | 12.2% |
| $50,000 to $74,999 | 204 | 12.1% |
| $75,000 to $99,999 | 152 | 9.0% |
| $100,000 to $149,999 | 477 | 28.3% |
| $150,000 to $199,999 | 217 | 12.9% |
| $200,000+ | 182 | 10.8% |
Household Income by Householder Age in Coopertown
The median household income in Coopertown is $106,121, with the highest median household income of $117,452 found in the 25 to 44 years age bracket for the primary householder. A total of 391 households (23.2%) fall into this category.
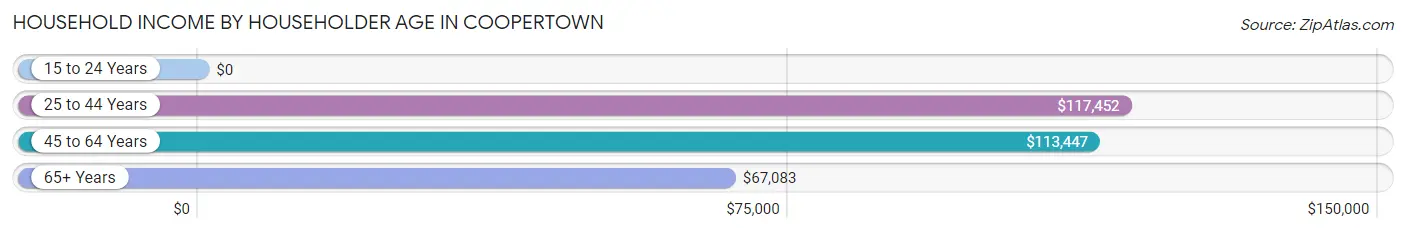
| Income Bracket | # Households | Median Income |
| 15 to 24 Years | 0 (0.0%) | $0 |
| 25 to 44 Years | 391 (23.2%) | $117,452 |
| 45 to 64 Years | 906 (53.8%) | $113,447 |
| 65+ Years | 387 (23.0%) | $67,083 |
| Total | 1,684 (100.0%) | $106,121 |
Poverty in Coopertown
Income Below Poverty by Sex and Age in Coopertown
With 10.2% poverty level for males and 9.8% for females among the residents of Coopertown, under 5 year old males and 25 to 34 year old females are the most vulnerable to poverty, with 68 males (57.1%) and 78 females (47.8%) in their respective age groups living below the poverty level.

| Age Bracket | Male | Female |
| Under 5 Years | 68 (57.1%) | 0 (0.0%) |
| 5 Years | 0 (0.0%) | 0 (0.0%) |
| 6 to 11 Years | 0 (0.0%) | 0 (0.0%) |
| 12 to 14 Years | 0 (0.0%) | 0 (0.0%) |
| 15 Years | 0 (0.0%) | 0 (0.0%) |
| 16 and 17 Years | 0 (0.0%) | 0 (0.0%) |
| 18 to 24 Years | 15 (4.3%) | 24 (27.9%) |
| 25 to 34 Years | 0 (0.0%) | 78 (47.8%) |
| 35 to 44 Years | 63 (17.8%) | 14 (4.5%) |
| 45 to 54 Years | 29 (5.8%) | 18 (4.5%) |
| 55 to 64 Years | 0 (0.0%) | 0 (0.0%) |
| 65 to 74 Years | 0 (0.0%) | 54 (26.1%) |
| 75 Years and over | 78 (35.8%) | 12 (16.4%) |
| Total | 253 (10.2%) | 200 (9.8%) |
Income Above Poverty by Sex and Age in Coopertown
According to the poverty statistics in Coopertown, males aged 5 years and females aged under 5 years are the age groups that are most secure financially, with 100.0% of males and 100.0% of females in these age groups living above the poverty line.
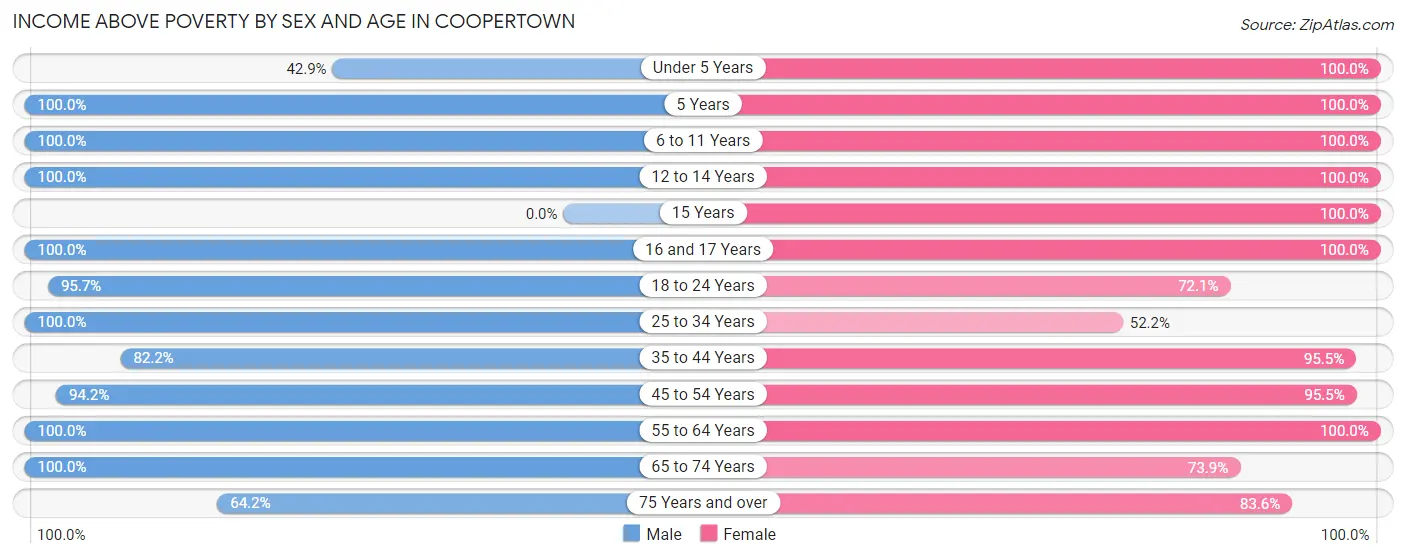
| Age Bracket | Male | Female |
| Under 5 Years | 51 (42.9%) | 120 (100.0%) |
| 5 Years | 22 (100.0%) | 43 (100.0%) |
| 6 to 11 Years | 139 (100.0%) | 143 (100.0%) |
| 12 to 14 Years | 58 (100.0%) | 75 (100.0%) |
| 15 Years | 0 (0.0%) | 43 (100.0%) |
| 16 and 17 Years | 85 (100.0%) | 20 (100.0%) |
| 18 to 24 Years | 331 (95.7%) | 62 (72.1%) |
| 25 to 34 Years | 42 (100.0%) | 85 (52.1%) |
| 35 to 44 Years | 291 (82.2%) | 294 (95.5%) |
| 45 to 54 Years | 468 (94.2%) | 386 (95.5%) |
| 55 to 64 Years | 445 (100.0%) | 361 (100.0%) |
| 65 to 74 Years | 165 (100.0%) | 153 (73.9%) |
| 75 Years and over | 140 (64.2%) | 61 (83.6%) |
| Total | 2,237 (89.8%) | 1,846 (90.2%) |
Income Below Poverty Among Married-Couple Families in Coopertown
The poverty statistics for married-couple families in Coopertown show that 2.8% or 29 of the total 1,054 families live below the poverty line. Families with no children have the highest poverty rate of 4.2%, comprising of 29 families. On the other hand, families with 1 or 2 children have the lowest poverty rate of 0.0%, which includes 0 families.
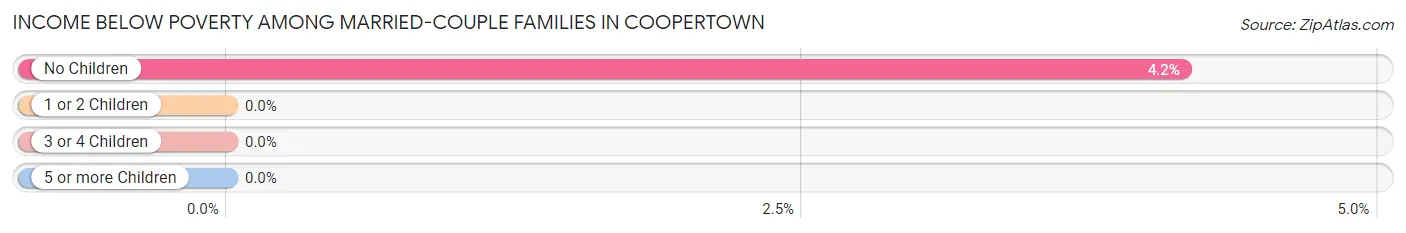
| Children | Above Poverty | Below Poverty |
| No Children | 670 (95.9%) | 29 (4.2%) |
| 1 or 2 Children | 304 (100.0%) | 0 (0.0%) |
| 3 or 4 Children | 51 (100.0%) | 0 (0.0%) |
| 5 or more Children | 0 (0.0%) | 0 (0.0%) |
| Total | 1,025 (97.3%) | 29 (2.8%) |
Income Below Poverty Among Single-Parent Households in Coopertown
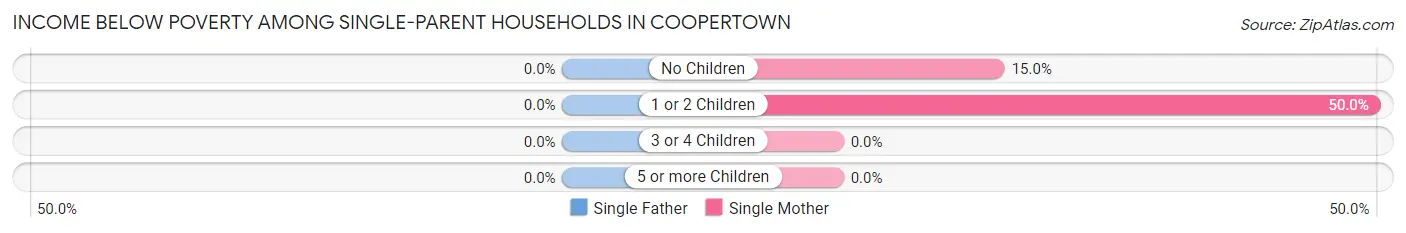
| Children | Single Father | Single Mother |
| No Children | 0 (0.0%) | 12 (15.0%) |
| 1 or 2 Children | 0 (0.0%) | 65 (50.0%) |
| 3 or 4 Children | 0 (0.0%) | 0 (0.0%) |
| 5 or more Children | 0 (0.0%) | 0 (0.0%) |
| Total | 0 (0.0%) | 77 (36.7%) |
Income Below Poverty Among Married-Couple vs Single-Parent Households in Coopertown
The poverty data for Coopertown shows that 29 of the married-couple family households (2.8%) and 77 of the single-parent households (31.0%) are living below the poverty level. Within the married-couple family households, those with no children have the highest poverty rate, with 29 households (4.2%) falling below the poverty line. Among the single-parent households, those with 1 or 2 children have the highest poverty rate, with 65 household (45.1%) living below poverty.
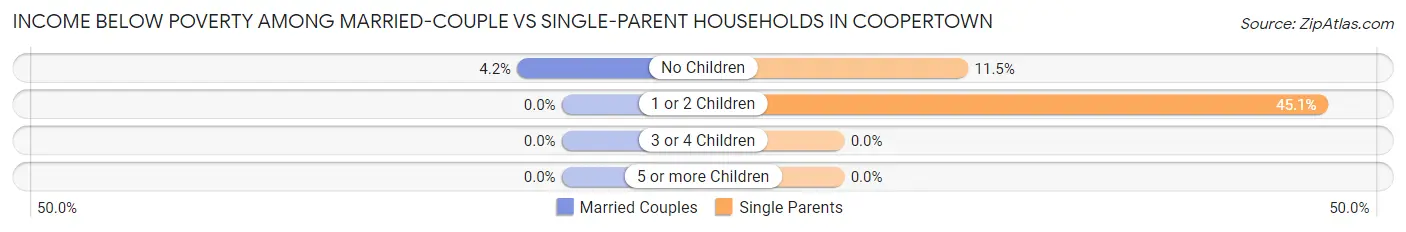
| Children | Married-Couple Families | Single-Parent Households |
| No Children | 29 (4.2%) | 12 (11.5%) |
| 1 or 2 Children | 0 (0.0%) | 65 (45.1%) |
| 3 or 4 Children | 0 (0.0%) | 0 (0.0%) |
| 5 or more Children | 0 (0.0%) | 0 (0.0%) |
| Total | 29 (2.8%) | 77 (31.0%) |
Employment Characteristics in Coopertown
Employment by Class of Employer in Coopertown
Among the 2,519 employed individuals in Coopertown, private company employees (1,918 | 76.1%), local government employees (252 | 10.0%), and self-employed (not incorporated) (171 | 6.8%) make up the most common classes of employment.
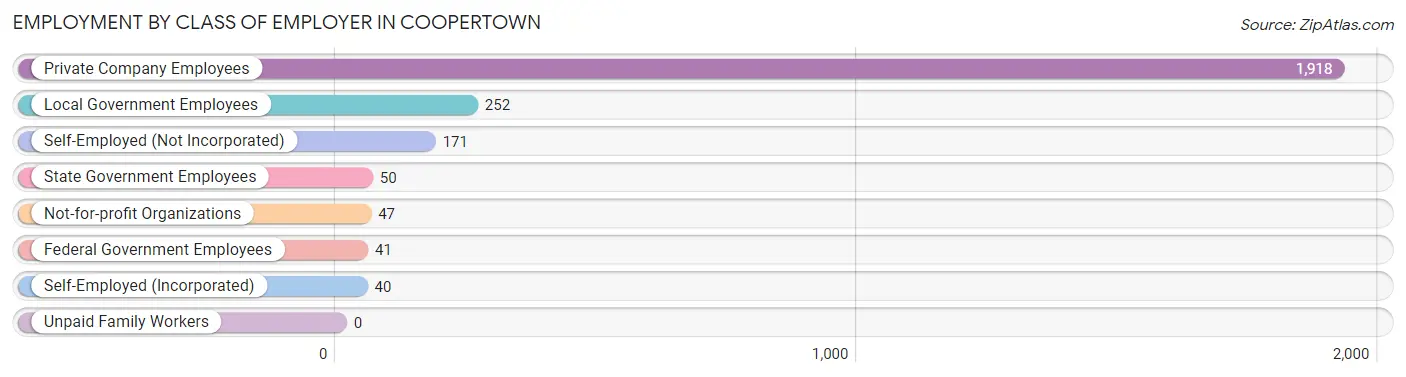
| Employer Class | # Employees | % Employees |
| Private Company Employees | 1,918 | 76.1% |
| Self-Employed (Incorporated) | 40 | 1.6% |
| Self-Employed (Not Incorporated) | 171 | 6.8% |
| Not-for-profit Organizations | 47 | 1.9% |
| Local Government Employees | 252 | 10.0% |
| State Government Employees | 50 | 2.0% |
| Federal Government Employees | 41 | 1.6% |
| Unpaid Family Workers | 0 | 0.0% |
| Total | 2,519 | 100.0% |
Employment Status by Age in Coopertown
According to the labor force statistics for Coopertown, out of the total population over 16 years of age (3,774), 67.7% or 2,555 individuals are in the labor force, with 1.0% or 26 of them unemployed. The age group with the highest labor force participation rate is 55 to 59 years, with 86.7% or 442 individuals in the labor force. Within the labor force, the 16 to 19 years age range has the highest percentage of unemployed individuals, with 9.5% or 10 of them being unemployed.
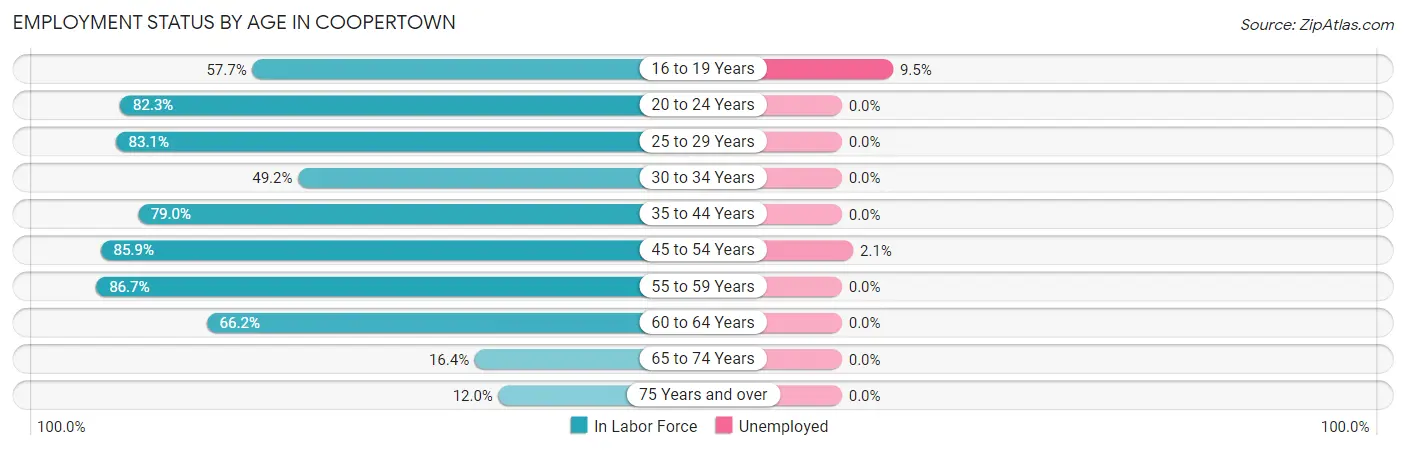
| Age Bracket | In Labor Force | Unemployed |
| 16 to 19 Years | 105 (57.7%) | 10 (9.5%) |
| 20 to 24 Years | 292 (82.3%) | 0 (0.0%) |
| 25 to 29 Years | 64 (83.1%) | 0 (0.0%) |
| 30 to 34 Years | 63 (49.2%) | 0 (0.0%) |
| 35 to 44 Years | 523 (79.0%) | 0 (0.0%) |
| 45 to 54 Years | 774 (85.9%) | 16 (2.1%) |
| 55 to 59 Years | 442 (86.7%) | 0 (0.0%) |
| 60 to 64 Years | 196 (66.2%) | 0 (0.0%) |
| 65 to 74 Years | 61 (16.4%) | 0 (0.0%) |
| 75 Years and over | 35 (12.0%) | 0 (0.0%) |
| Total | 2,555 (67.7%) | 26 (1.0%) |
Employment Status by Educational Attainment in Coopertown
According to labor force statistics for Coopertown, 80.1% of individuals (2,062) out of the total population between 25 and 64 years of age (2,574) are in the labor force, with 0.8% or 16 of them being unemployed. The group with the highest labor force participation rate are those with the educational attainment of college / associate degree, with 91.6% or 567 individuals in the labor force. Within the labor force, individuals with bachelor's degree or higher education have the highest percentage of unemployment, with 2.4% or 16 of them being unemployed.
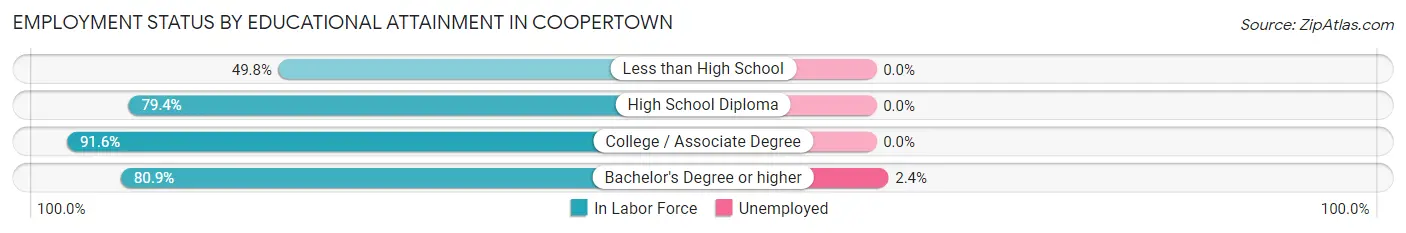
| Educational Attainment | In Labor Force | Unemployed |
| Less than High School | 117 (49.8%) | 0 (0.0%) |
| High School Diploma | 713 (79.4%) | 0 (0.0%) |
| College / Associate Degree | 567 (91.6%) | 0 (0.0%) |
| Bachelor's Degree or higher | 665 (80.9%) | 20 (2.4%) |
| Total | 2,062 (80.1%) | 21 (0.8%) |
Employment Occupations by Sex in Coopertown
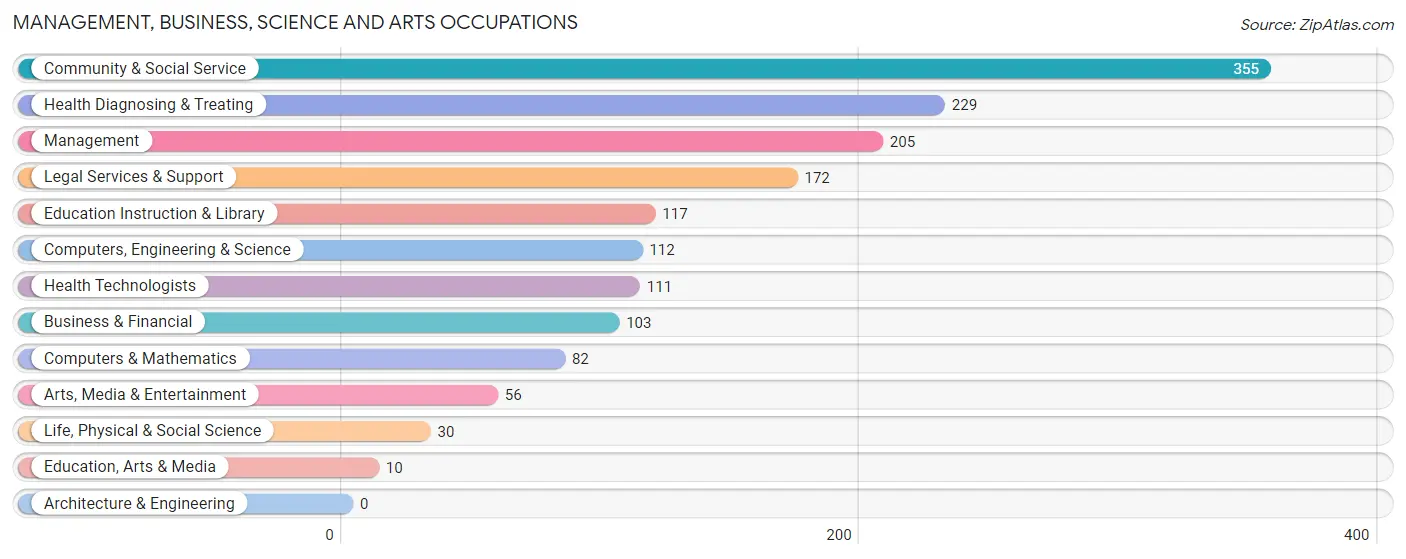
Management, Business, Science and Arts Occupations
The most common Management, Business, Science and Arts occupations in Coopertown are Community & Social Service (355 | 14.0%), Health Diagnosing & Treating (229 | 9.0%), Management (205 | 8.1%), Legal Services & Support (172 | 6.8%), and Education Instruction & Library (117 | 4.6%).
Management, Business, Science and Arts Occupations by Sex
Within the Management, Business, Science and Arts occupations in Coopertown, the most male-oriented occupations are Computers & Mathematics (100.0%), Education, Arts & Media (100.0%), and Management (79.0%), while the most female-oriented occupations are Life, Physical & Social Science (100.0%), Arts, Media & Entertainment (67.9%), and Education Instruction & Library (62.4%).
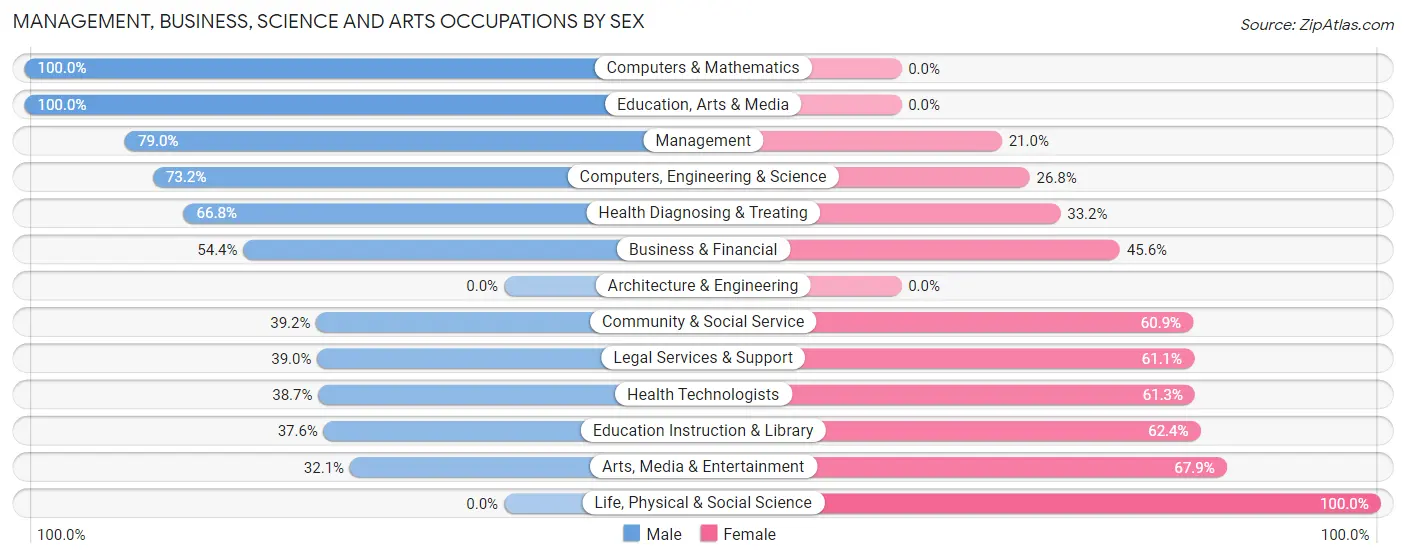
| Occupation | Male | Female |
| Management | 162 (79.0%) | 43 (21.0%) |
| Business & Financial | 56 (54.4%) | 47 (45.6%) |
| Computers, Engineering & Science | 82 (73.2%) | 30 (26.8%) |
| Computers & Mathematics | 82 (100.0%) | 0 (0.0%) |
| Architecture & Engineering | 0 (0.0%) | 0 (0.0%) |
| Life, Physical & Social Science | 0 (0.0%) | 30 (100.0%) |
| Community & Social Service | 139 (39.2%) | 216 (60.9%) |
| Education, Arts & Media | 10 (100.0%) | 0 (0.0%) |
| Legal Services & Support | 67 (39.0%) | 105 (61.1%) |
| Education Instruction & Library | 44 (37.6%) | 73 (62.4%) |
| Arts, Media & Entertainment | 18 (32.1%) | 38 (67.9%) |
| Health Diagnosing & Treating | 153 (66.8%) | 76 (33.2%) |
| Health Technologists | 43 (38.7%) | 68 (61.3%) |
| Total (Category) | 592 (59.0%) | 412 (41.0%) |
| Total (Overall) | 1,545 (61.1%) | 984 (38.9%) |
Services Occupations
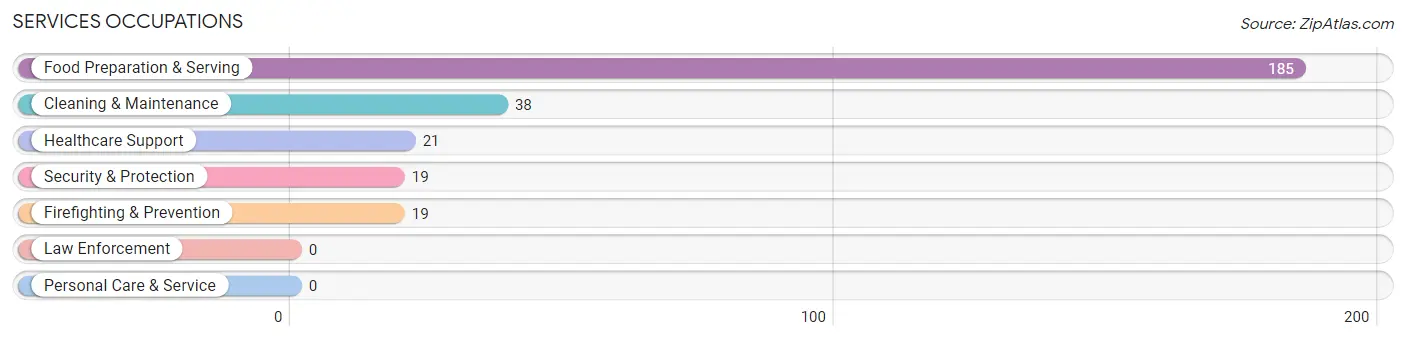
The most common Services occupations in Coopertown are Food Preparation & Serving (185 | 7.3%), Cleaning & Maintenance (38 | 1.5%), Healthcare Support (21 | 0.8%), Security & Protection (19 | 0.7%), and Firefighting & Prevention (19 | 0.7%).
Services Occupations by Sex
Within the Services occupations in Coopertown, the most male-oriented occupations are Security & Protection (100.0%), Firefighting & Prevention (100.0%), and Cleaning & Maintenance (78.9%), while the most female-oriented occupations are Healthcare Support (100.0%), Food Preparation & Serving (35.7%), and Cleaning & Maintenance (21.0%).
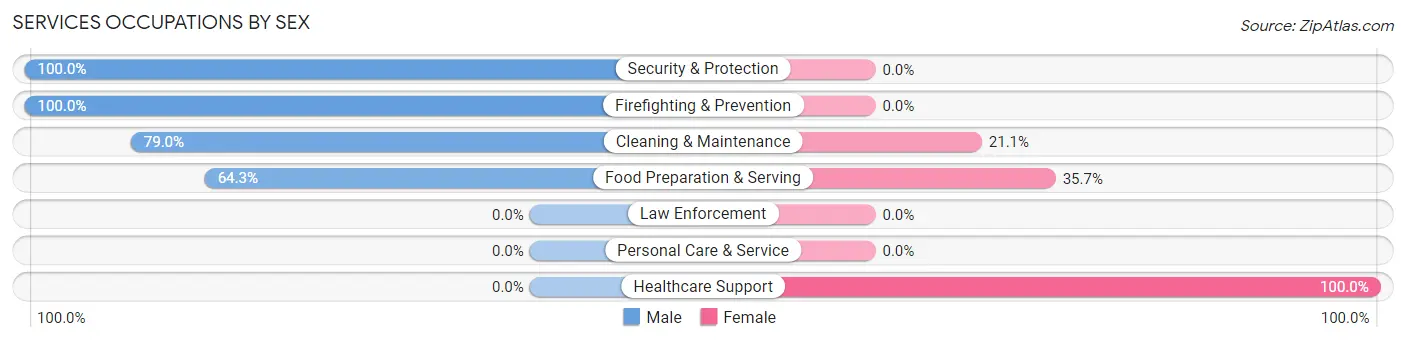
| Occupation | Male | Female |
| Healthcare Support | 0 (0.0%) | 21 (100.0%) |
| Security & Protection | 19 (100.0%) | 0 (0.0%) |
| Firefighting & Prevention | 19 (100.0%) | 0 (0.0%) |
| Law Enforcement | 0 (0.0%) | 0 (0.0%) |
| Food Preparation & Serving | 119 (64.3%) | 66 (35.7%) |
| Cleaning & Maintenance | 30 (78.9%) | 8 (21.0%) |
| Personal Care & Service | 0 (0.0%) | 0 (0.0%) |
| Total (Category) | 168 (63.9%) | 95 (36.1%) |
| Total (Overall) | 1,545 (61.1%) | 984 (38.9%) |
Sales and Office Occupations
The most common Sales and Office occupations in Coopertown are Sales & Related (427 | 16.9%), and Office & Administration (141 | 5.6%).

Sales and Office Occupations by Sex

| Occupation | Male | Female |
| Sales & Related | 187 (43.8%) | 240 (56.2%) |
| Office & Administration | 16 (11.4%) | 125 (88.6%) |
| Total (Category) | 203 (35.7%) | 365 (64.3%) |
| Total (Overall) | 1,545 (61.1%) | 984 (38.9%) |
Natural Resources, Construction and Maintenance Occupations
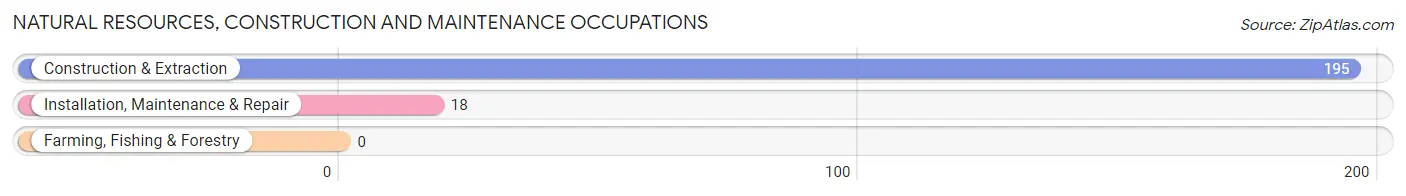
The most common Natural Resources, Construction and Maintenance occupations in Coopertown are Construction & Extraction (195 | 7.7%), and Installation, Maintenance & Repair (18 | 0.7%).
Natural Resources, Construction and Maintenance Occupations by Sex
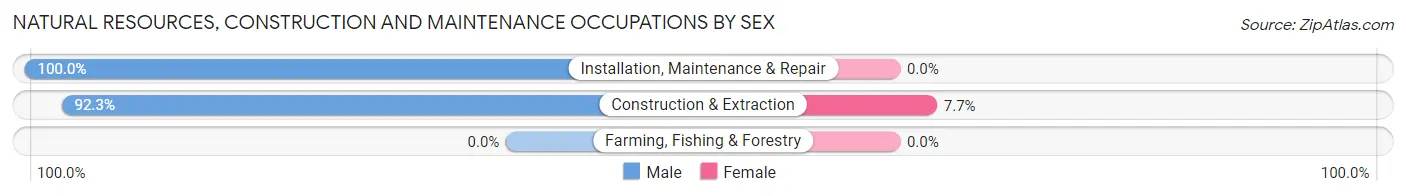
| Occupation | Male | Female |
| Farming, Fishing & Forestry | 0 (0.0%) | 0 (0.0%) |
| Construction & Extraction | 180 (92.3%) | 15 (7.7%) |
| Installation, Maintenance & Repair | 18 (100.0%) | 0 (0.0%) |
| Total (Category) | 198 (93.0%) | 15 (7.0%) |
| Total (Overall) | 1,545 (61.1%) | 984 (38.9%) |
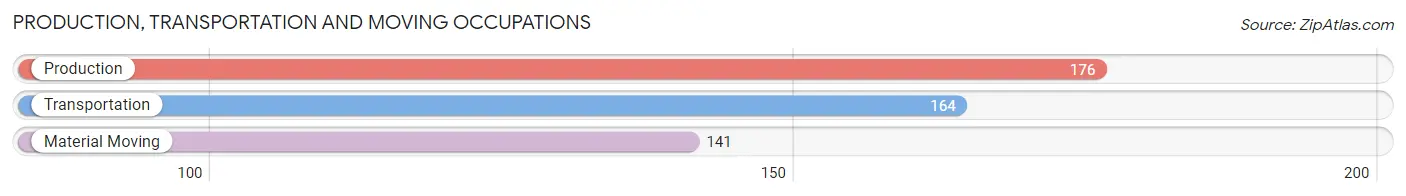
Production, Transportation and Moving Occupations
The most common Production, Transportation and Moving occupations in Coopertown are Production (176 | 7.0%), Transportation (164 | 6.5%), and Material Moving (141 | 5.6%).
Production, Transportation and Moving Occupations by Sex
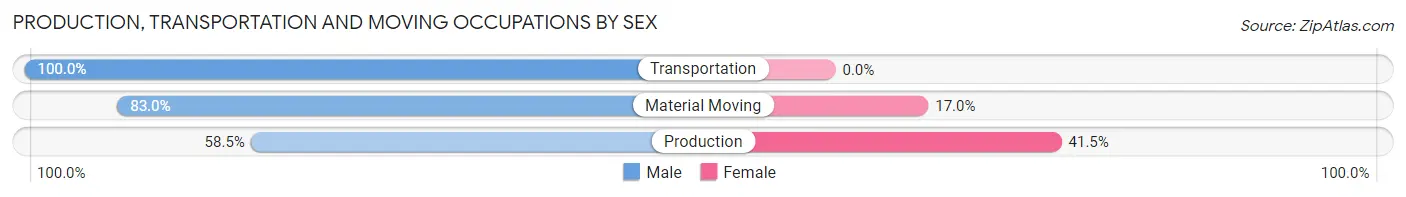
| Occupation | Male | Female |
| Production | 103 (58.5%) | 73 (41.5%) |
| Transportation | 164 (100.0%) | 0 (0.0%) |
| Material Moving | 117 (83.0%) | 24 (17.0%) |
| Total (Category) | 384 (79.8%) | 97 (20.2%) |
| Total (Overall) | 1,545 (61.1%) | 984 (38.9%) |
Employment Industries by Sex in Coopertown
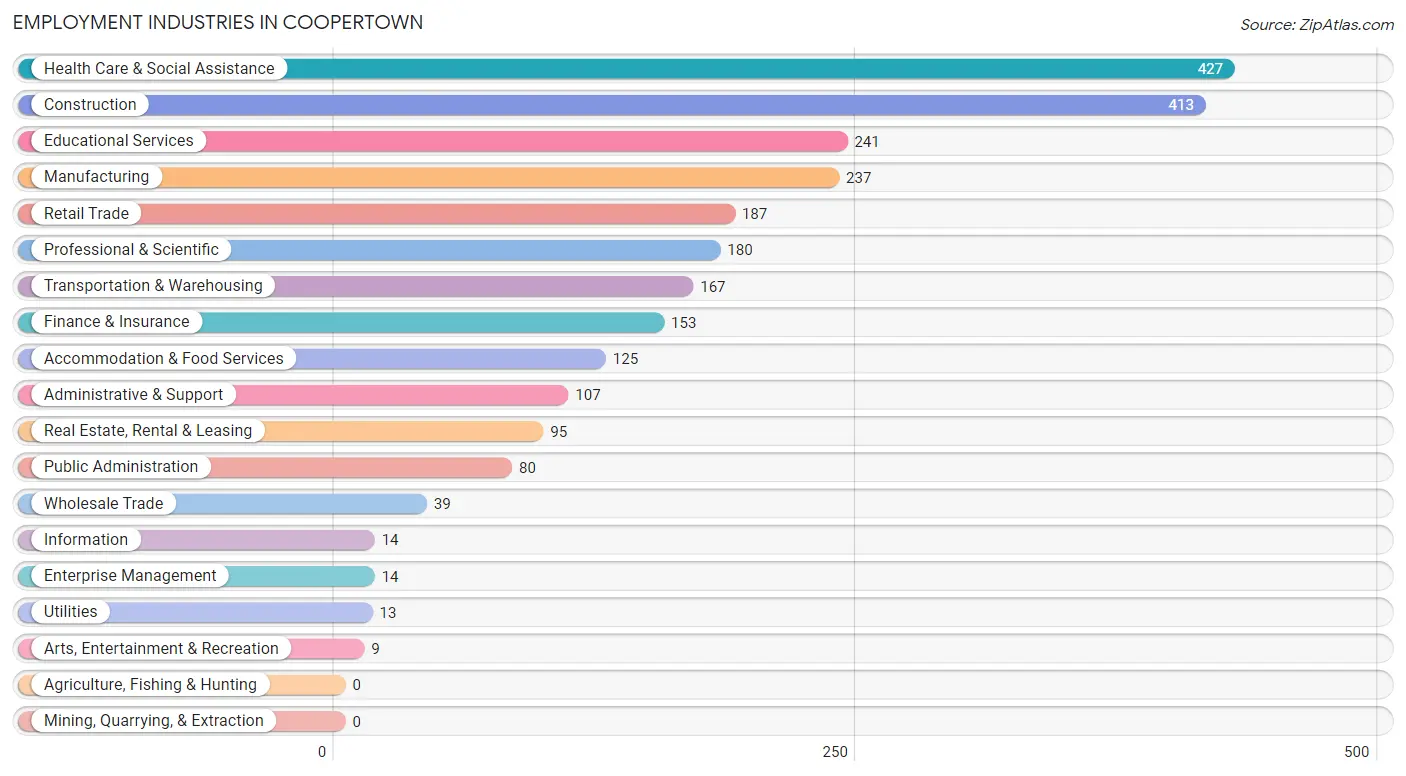
Employment Industries in Coopertown
The major employment industries in Coopertown include Health Care & Social Assistance (427 | 16.9%), Construction (413 | 16.3%), Educational Services (241 | 9.5%), Manufacturing (237 | 9.4%), and Retail Trade (187 | 7.4%).
Employment Industries by Sex in Coopertown
The Coopertown industries that see more men than women are Wholesale Trade (100.0%), Transportation & Warehousing (100.0%), and Utilities (100.0%), whereas the industries that tend to have a higher number of women are Enterprise Management (100.0%), Administrative & Support (76.6%), and Finance & Insurance (71.9%).
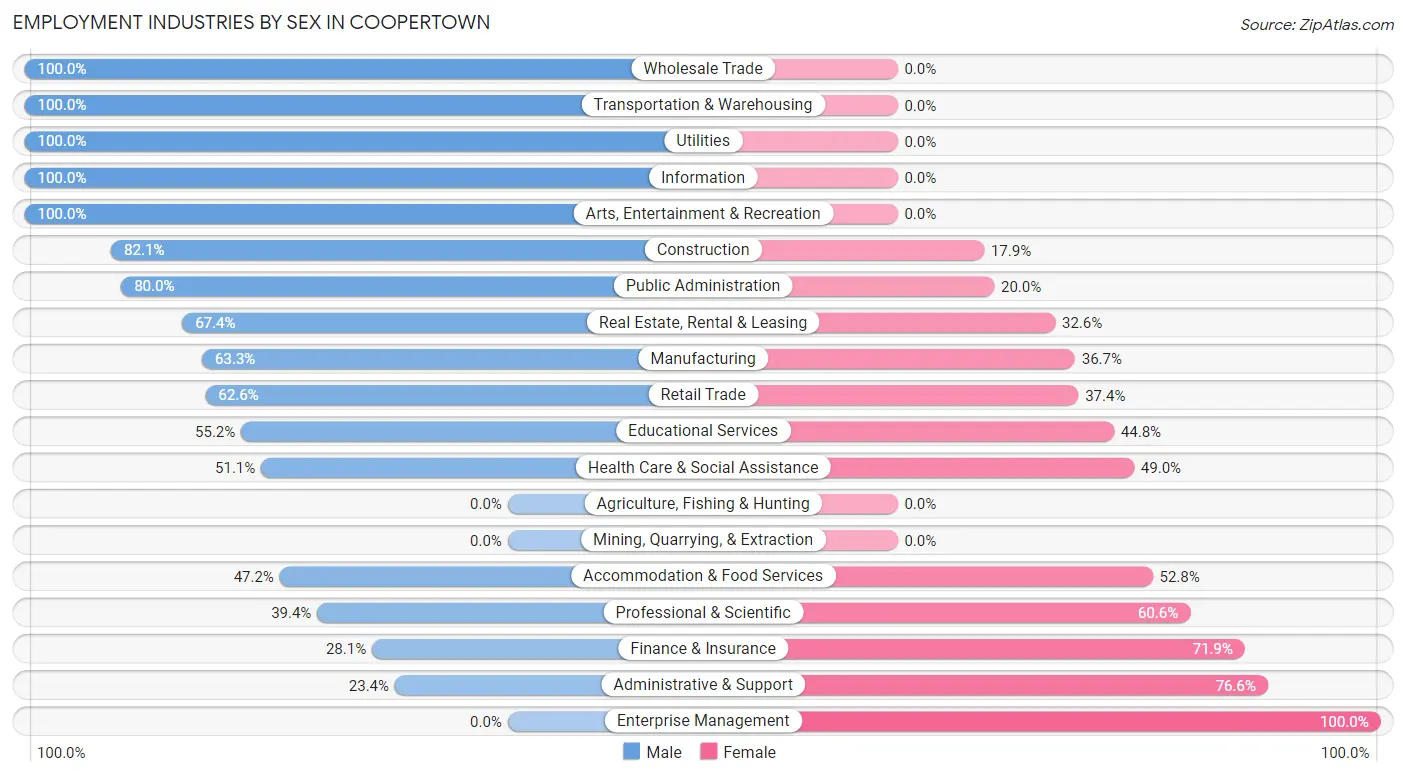
| Industry | Male | Female |
| Agriculture, Fishing & Hunting | 0 (0.0%) | 0 (0.0%) |
| Mining, Quarrying, & Extraction | 0 (0.0%) | 0 (0.0%) |
| Construction | 339 (82.1%) | 74 (17.9%) |
| Manufacturing | 150 (63.3%) | 87 (36.7%) |
| Wholesale Trade | 39 (100.0%) | 0 (0.0%) |
| Retail Trade | 117 (62.6%) | 70 (37.4%) |
| Transportation & Warehousing | 167 (100.0%) | 0 (0.0%) |
| Utilities | 13 (100.0%) | 0 (0.0%) |
| Information | 14 (100.0%) | 0 (0.0%) |
| Finance & Insurance | 43 (28.1%) | 110 (71.9%) |
| Real Estate, Rental & Leasing | 64 (67.4%) | 31 (32.6%) |
| Professional & Scientific | 71 (39.4%) | 109 (60.6%) |
| Enterprise Management | 0 (0.0%) | 14 (100.0%) |
| Administrative & Support | 25 (23.4%) | 82 (76.6%) |
| Educational Services | 133 (55.2%) | 108 (44.8%) |
| Health Care & Social Assistance | 218 (51.0%) | 209 (48.9%) |
| Arts, Entertainment & Recreation | 9 (100.0%) | 0 (0.0%) |
| Accommodation & Food Services | 59 (47.2%) | 66 (52.8%) |
| Public Administration | 64 (80.0%) | 16 (20.0%) |
| Total | 1,545 (61.1%) | 984 (38.9%) |
Education in Coopertown
School Enrollment in Coopertown
The most common levels of schooling among the 788 students in Coopertown are elementary school (243 | 30.8%), college / undergraduate (177 | 22.5%), and high school (162 | 20.6%).
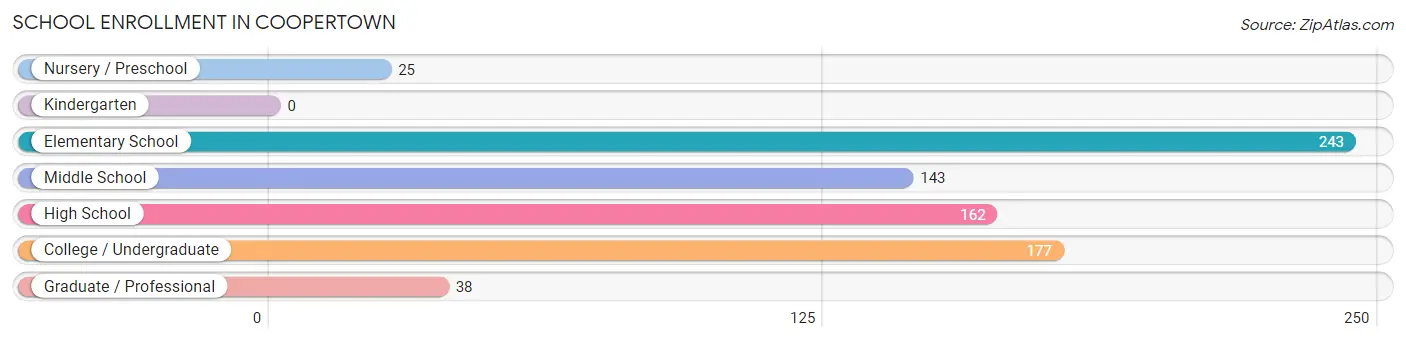
| School Level | # Students | % Students |
| Nursery / Preschool | 25 | 3.2% |
| Kindergarten | 0 | 0.0% |
| Elementary School | 243 | 30.8% |
| Middle School | 143 | 18.1% |
| High School | 162 | 20.6% |
| College / Undergraduate | 177 | 22.5% |
| Graduate / Professional | 38 | 4.8% |
| Total | 788 | 100.0% |
School Enrollment by Age by Funding Source in Coopertown
Out of a total of 788 students who are enrolled in schools in Coopertown, 151 (19.2%) attend a private institution, while the remaining 637 (80.8%) are enrolled in public schools. The age group of 20 to 24 year olds has the highest likelihood of being enrolled in private schools, with 59 (52.7% in the age bracket) enrolled. Conversely, the age group of 10 to 14 year olds has the lowest likelihood of being enrolled in a private school, with 157 (100.0% in the age bracket) attending a public institution.
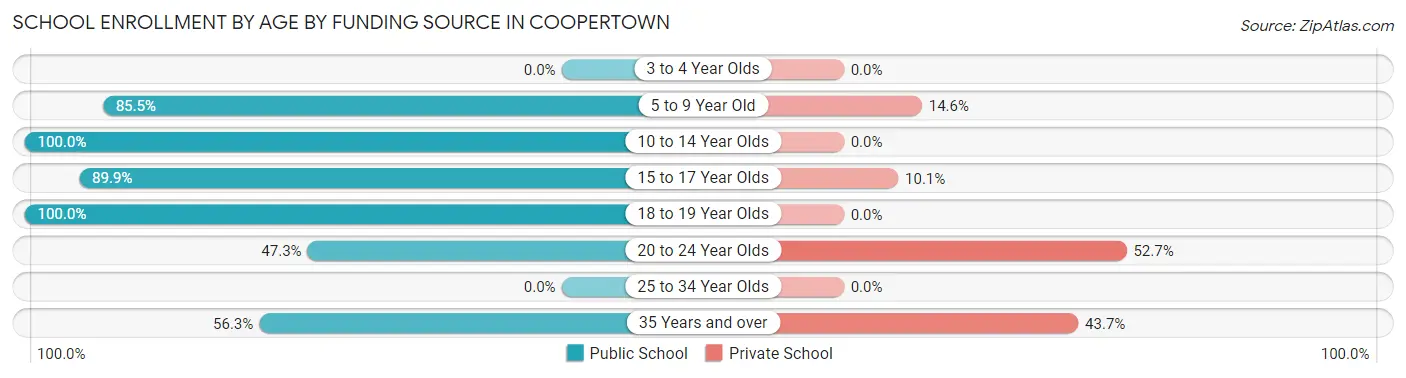
| Age Bracket | Public School | Private School |
| 3 to 4 Year Olds | 0 (0.0%) | 0 (0.0%) |
| 5 to 9 Year Old | 229 (85.5%) | 39 (14.5%) |
| 10 to 14 Year Olds | 157 (100.0%) | 0 (0.0%) |
| 15 to 17 Year Olds | 133 (89.9%) | 15 (10.1%) |
| 18 to 19 Year Olds | 16 (100.0%) | 0 (0.0%) |
| 20 to 24 Year Olds | 53 (47.3%) | 59 (52.7%) |
| 25 to 34 Year Olds | 0 (0.0%) | 0 (0.0%) |
| 35 Years and over | 49 (56.3%) | 38 (43.7%) |
| Total | 637 (80.8%) | 151 (19.2%) |
Educational Attainment by Field of Study in Coopertown
Business (218 | 21.0%), science & technology (150 | 14.5%), education (131 | 12.6%), arts & humanities (119 | 11.5%), and bio, nature & agricultural (97 | 9.3%) are the most common fields of study among 1,037 individuals in Coopertown who have obtained a bachelor's degree or higher.
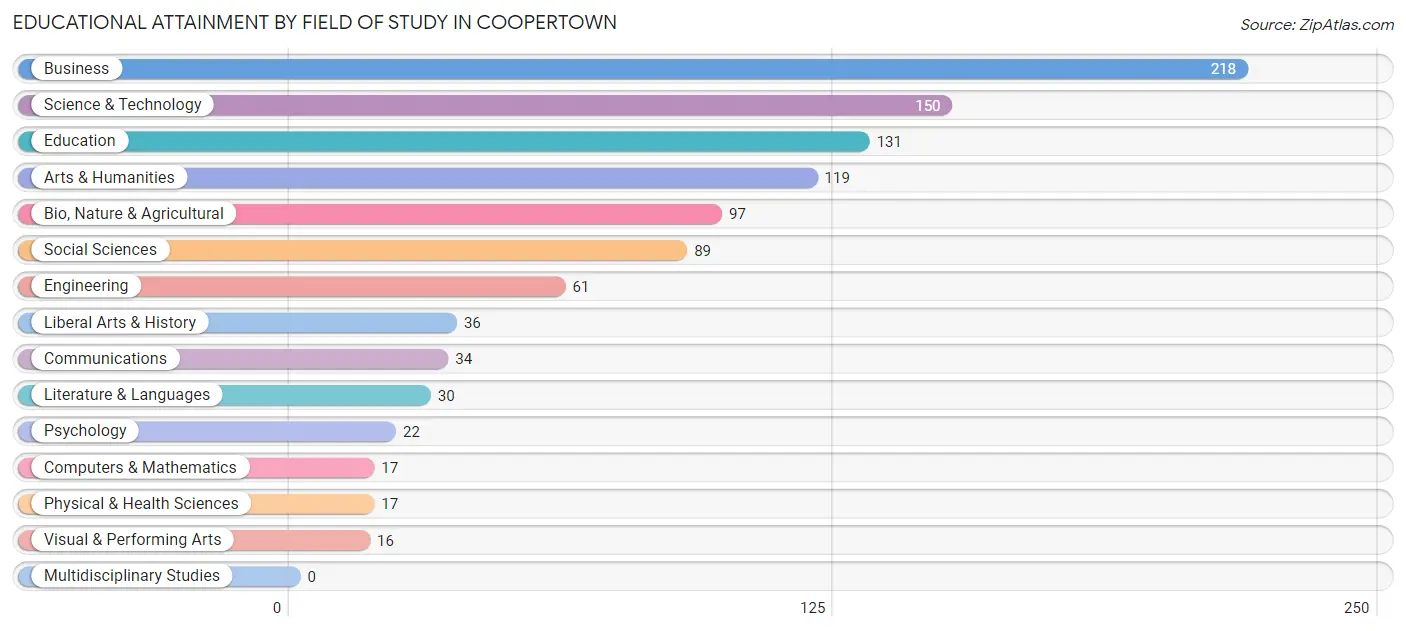
| Field of Study | # Graduates | % Graduates |
| Computers & Mathematics | 17 | 1.6% |
| Bio, Nature & Agricultural | 97 | 9.3% |
| Physical & Health Sciences | 17 | 1.6% |
| Psychology | 22 | 2.1% |
| Social Sciences | 89 | 8.6% |
| Engineering | 61 | 5.9% |
| Multidisciplinary Studies | 0 | 0.0% |
| Science & Technology | 150 | 14.5% |
| Business | 218 | 21.0% |
| Education | 131 | 12.6% |
| Literature & Languages | 30 | 2.9% |
| Liberal Arts & History | 36 | 3.5% |
| Visual & Performing Arts | 16 | 1.5% |
| Communications | 34 | 3.3% |
| Arts & Humanities | 119 | 11.5% |
| Total | 1,037 | 100.0% |
Transportation & Commute in Coopertown
Vehicle Availability by Sex in Coopertown
The most prevalent vehicle ownership categories in Coopertown are males with 3 vehicles (660, accounting for 43.0%) and females with 3 vehicles (320, making up 67.1%).
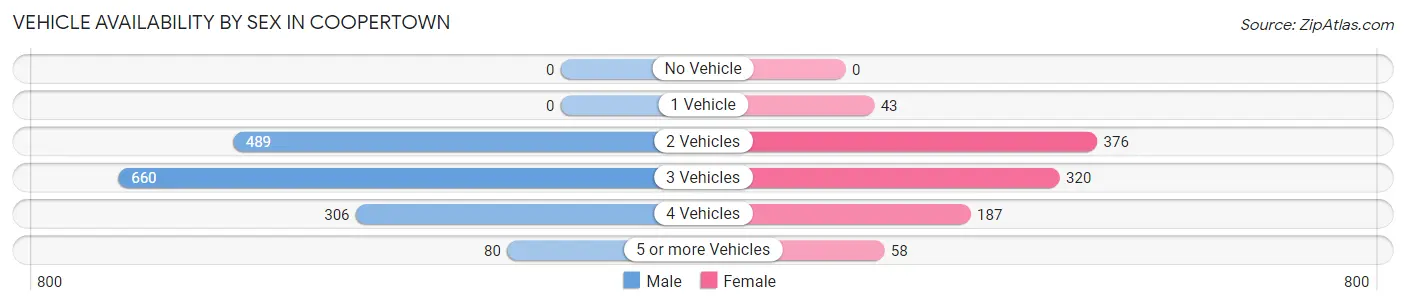
| Vehicles Available | Male | Female |
| No Vehicle | 0 (0.0%) | 0 (0.0%) |
| 1 Vehicle | 0 (0.0%) | 43 (4.4%) |
| 2 Vehicles | 489 (31.9%) | 376 (38.2%) |
| 3 Vehicles | 660 (43.0%) | 320 (32.5%) |
| 4 Vehicles | 306 (19.9%) | 187 (19.0%) |
| 5 or more Vehicles | 80 (5.2%) | 58 (5.9%) |
| Total | 1,535 (100.0%) | 984 (100.0%) |
Commute Time in Coopertown
The most frequently occuring commute durations in Coopertown are 45 to 59 minutes (600 commuters, 26.1%), 30 to 34 minutes (474 commuters, 20.6%), and 15 to 19 minutes (353 commuters, 15.3%).
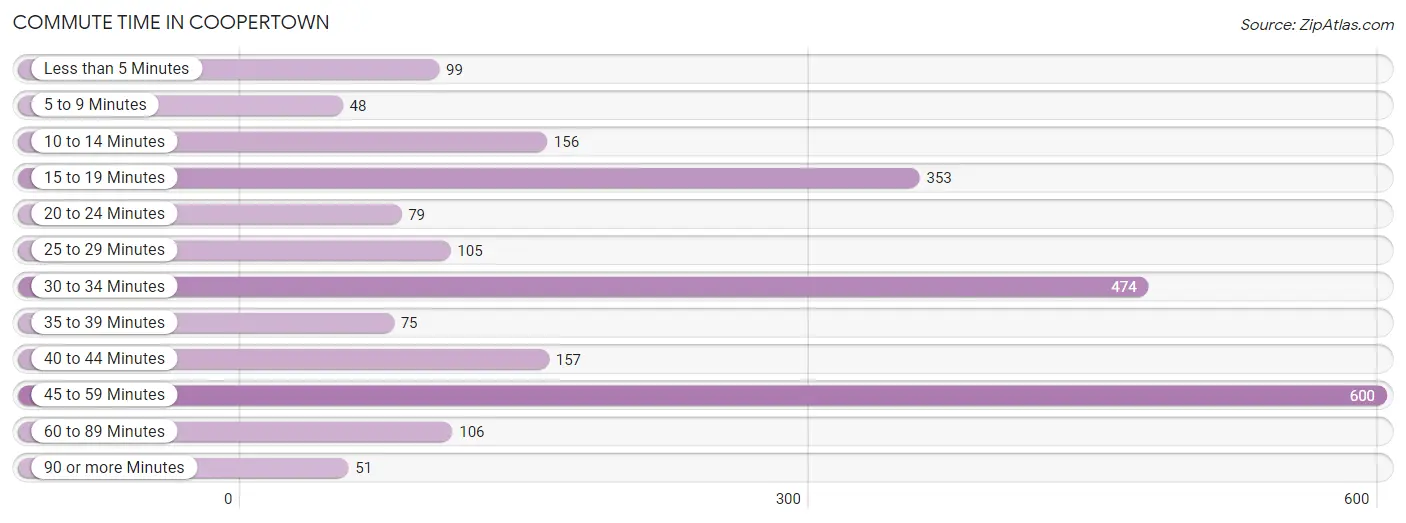
| Commute Time | # Commuters | % Commuters |
| Less than 5 Minutes | 99 | 4.3% |
| 5 to 9 Minutes | 48 | 2.1% |
| 10 to 14 Minutes | 156 | 6.8% |
| 15 to 19 Minutes | 353 | 15.3% |
| 20 to 24 Minutes | 79 | 3.4% |
| 25 to 29 Minutes | 105 | 4.6% |
| 30 to 34 Minutes | 474 | 20.6% |
| 35 to 39 Minutes | 75 | 3.3% |
| 40 to 44 Minutes | 157 | 6.8% |
| 45 to 59 Minutes | 600 | 26.1% |
| 60 to 89 Minutes | 106 | 4.6% |
| 90 or more Minutes | 51 | 2.2% |
Commute Time by Sex in Coopertown
The most common commute times in Coopertown are 45 to 59 minutes (376 commuters, 26.8%) for males and 45 to 59 minutes (224 commuters, 24.9%) for females.
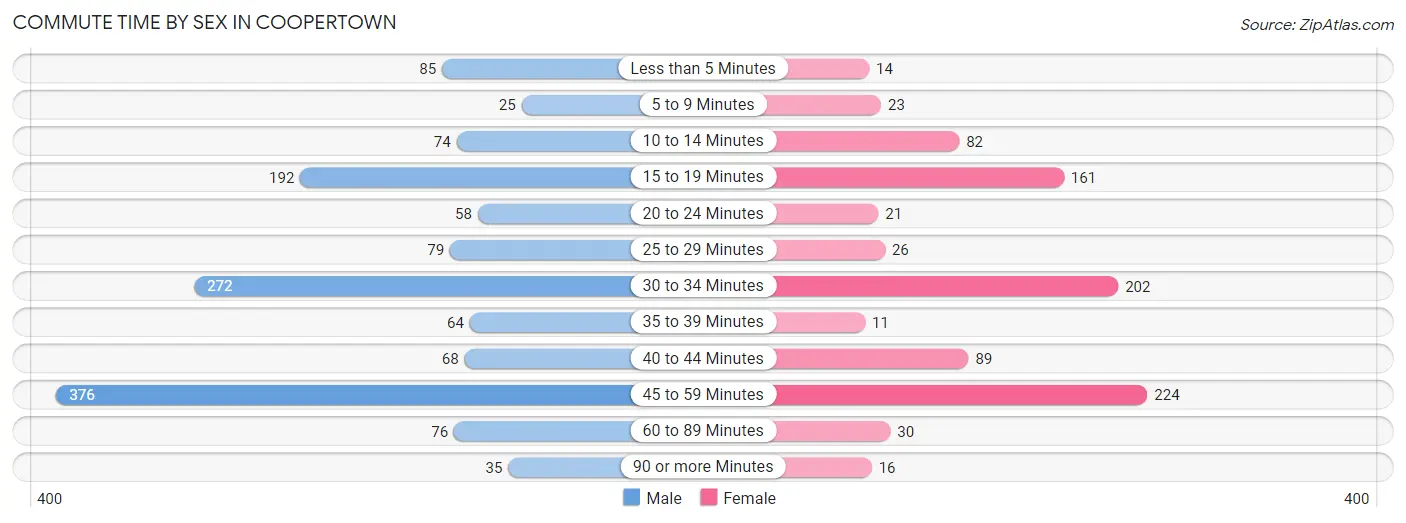
| Commute Time | Male | Female |
| Less than 5 Minutes | 85 (6.0%) | 14 (1.6%) |
| 5 to 9 Minutes | 25 (1.8%) | 23 (2.6%) |
| 10 to 14 Minutes | 74 (5.3%) | 82 (9.1%) |
| 15 to 19 Minutes | 192 (13.7%) | 161 (17.9%) |
| 20 to 24 Minutes | 58 (4.1%) | 21 (2.3%) |
| 25 to 29 Minutes | 79 (5.6%) | 26 (2.9%) |
| 30 to 34 Minutes | 272 (19.4%) | 202 (22.5%) |
| 35 to 39 Minutes | 64 (4.6%) | 11 (1.2%) |
| 40 to 44 Minutes | 68 (4.8%) | 89 (9.9%) |
| 45 to 59 Minutes | 376 (26.8%) | 224 (24.9%) |
| 60 to 89 Minutes | 76 (5.4%) | 30 (3.3%) |
| 90 or more Minutes | 35 (2.5%) | 16 (1.8%) |
Time of Departure to Work by Sex in Coopertown
The most frequent times of departure to work in Coopertown are 8:00 AM to 8:29 AM (286, 20.4%) for males and 6:30 AM to 6:59 AM (243, 27.0%) for females.
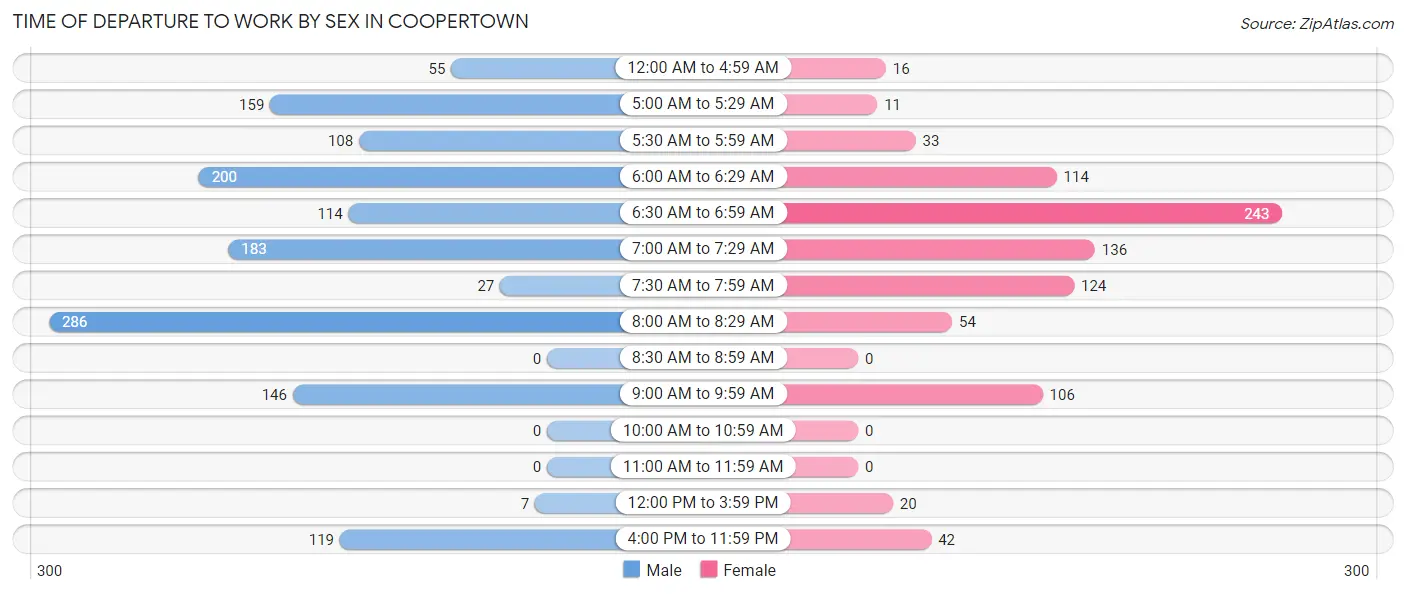
| Time of Departure | Male | Female |
| 12:00 AM to 4:59 AM | 55 (3.9%) | 16 (1.8%) |
| 5:00 AM to 5:29 AM | 159 (11.3%) | 11 (1.2%) |
| 5:30 AM to 5:59 AM | 108 (7.7%) | 33 (3.7%) |
| 6:00 AM to 6:29 AM | 200 (14.2%) | 114 (12.7%) |
| 6:30 AM to 6:59 AM | 114 (8.1%) | 243 (27.0%) |
| 7:00 AM to 7:29 AM | 183 (13.0%) | 136 (15.1%) |
| 7:30 AM to 7:59 AM | 27 (1.9%) | 124 (13.8%) |
| 8:00 AM to 8:29 AM | 286 (20.4%) | 54 (6.0%) |
| 8:30 AM to 8:59 AM | 0 (0.0%) | 0 (0.0%) |
| 9:00 AM to 9:59 AM | 146 (10.4%) | 106 (11.8%) |
| 10:00 AM to 10:59 AM | 0 (0.0%) | 0 (0.0%) |
| 11:00 AM to 11:59 AM | 0 (0.0%) | 0 (0.0%) |
| 12:00 PM to 3:59 PM | 7 (0.5%) | 20 (2.2%) |
| 4:00 PM to 11:59 PM | 119 (8.5%) | 42 (4.7%) |
| Total | 1,404 (100.0%) | 899 (100.0%) |
Housing Occupancy in Coopertown
Occupancy by Ownership in Coopertown
Of the total 1,684 dwellings in Coopertown, owner-occupied units account for 1,523 (90.4%), while renter-occupied units make up 161 (9.6%).
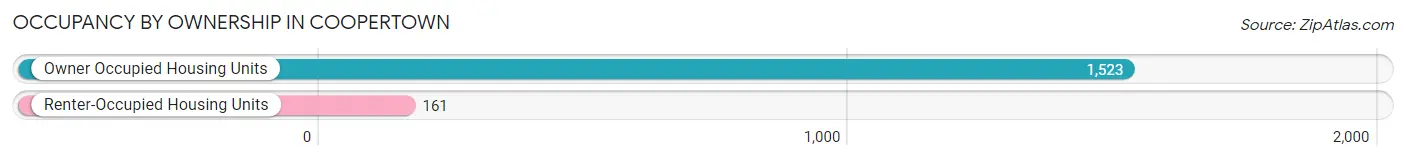
| Occupancy | # Housing Units | % Housing Units |
| Owner Occupied Housing Units | 1,523 | 90.4% |
| Renter-Occupied Housing Units | 161 | 9.6% |
| Total Occupied Housing Units | 1,684 | 100.0% |
Occupancy by Household Size in Coopertown
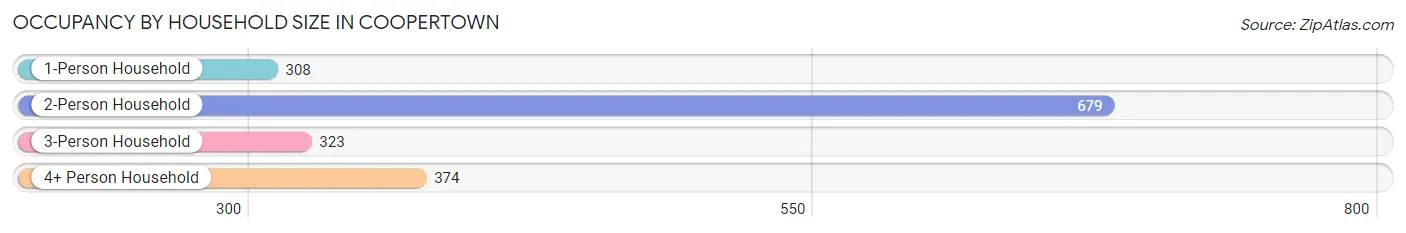
| Household Size | # Housing Units | % Housing Units |
| 1-Person Household | 308 | 18.3% |
| 2-Person Household | 679 | 40.3% |
| 3-Person Household | 323 | 19.2% |
| 4+ Person Household | 374 | 22.2% |
| Total Housing Units | 1,684 | 100.0% |
Occupancy by Ownership by Household Size in Coopertown
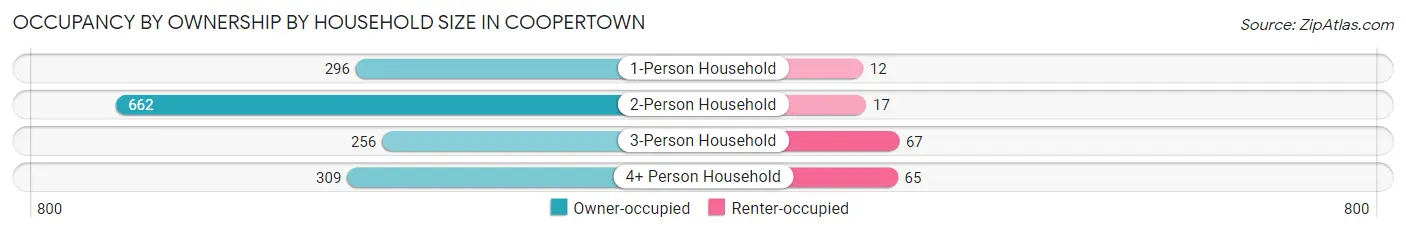
| Household Size | Owner-occupied | Renter-occupied |
| 1-Person Household | 296 (96.1%) | 12 (3.9%) |
| 2-Person Household | 662 (97.5%) | 17 (2.5%) |
| 3-Person Household | 256 (79.3%) | 67 (20.7%) |
| 4+ Person Household | 309 (82.6%) | 65 (17.4%) |
| Total Housing Units | 1,523 (90.4%) | 161 (9.6%) |
Occupancy by Educational Attainment in Coopertown
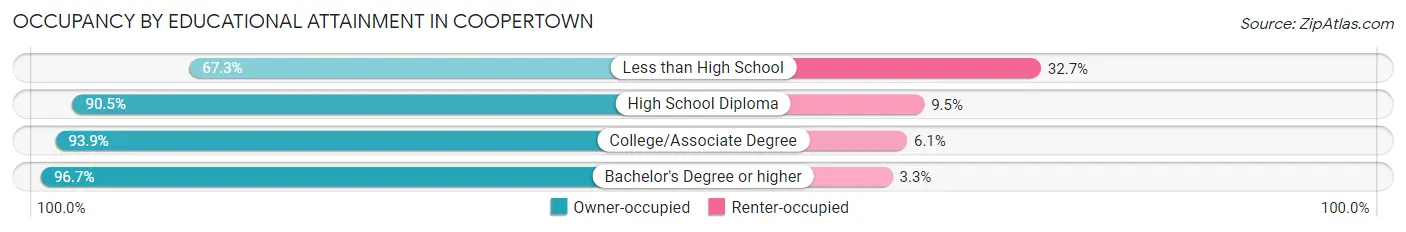
| Household Size | Owner-occupied | Renter-occupied |
| Less than High School | 134 (67.3%) | 65 (32.7%) |
| High School Diploma | 532 (90.5%) | 56 (9.5%) |
| College/Associate Degree | 353 (93.9%) | 23 (6.1%) |
| Bachelor's Degree or higher | 504 (96.7%) | 17 (3.3%) |
Occupancy by Age of Householder in Coopertown
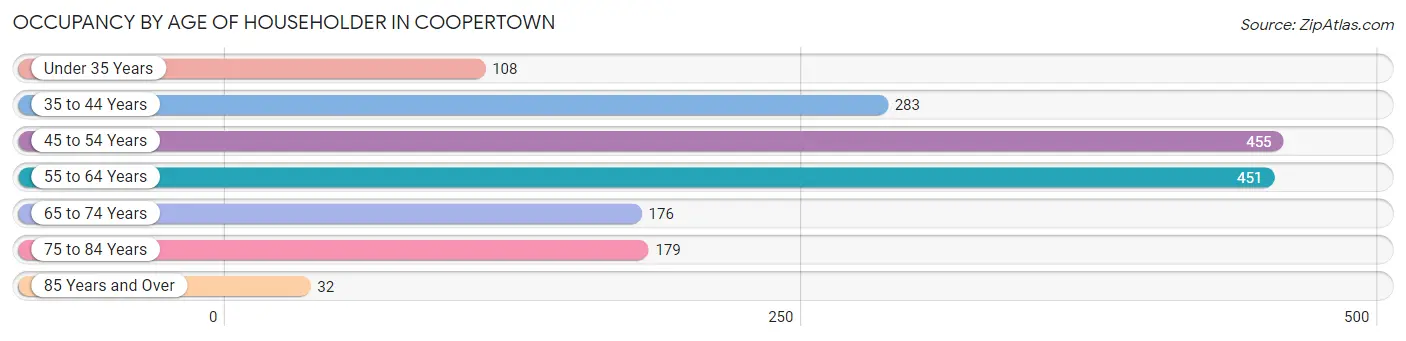
| Age Bracket | # Households | % Households |
| Under 35 Years | 108 | 6.4% |
| 35 to 44 Years | 283 | 16.8% |
| 45 to 54 Years | 455 | 27.0% |
| 55 to 64 Years | 451 | 26.8% |
| 65 to 74 Years | 176 | 10.4% |
| 75 to 84 Years | 179 | 10.6% |
| 85 Years and Over | 32 | 1.9% |
| Total | 1,684 | 100.0% |
Housing Finances in Coopertown
Median Income by Occupancy in Coopertown
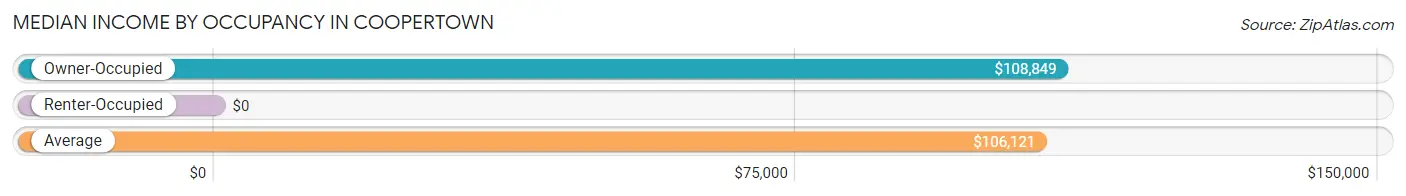
| Occupancy Type | # Households | Median Income |
| Owner-Occupied | 1,523 (90.4%) | $108,849 |
| Renter-Occupied | 161 (9.6%) | $0 |
| Average | 1,684 (100.0%) | $106,121 |
Occupancy by Householder Income Bracket in Coopertown
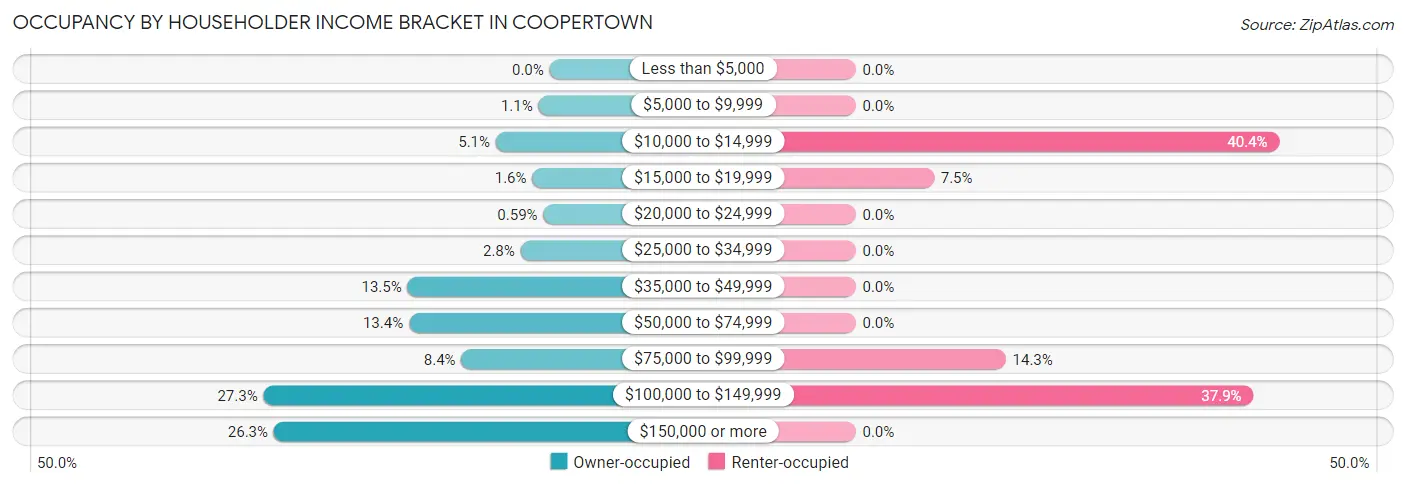
| Income Bracket | Owner-occupied | Renter-occupied |
| Less than $5,000 | 0 (0.0%) | 0 (0.0%) |
| $5,000 to $9,999 | 16 (1.1%) | 0 (0.0%) |
| $10,000 to $14,999 | 78 (5.1%) | 65 (40.4%) |
| $15,000 to $19,999 | 25 (1.6%) | 12 (7.4%) |
| $20,000 to $24,999 | 9 (0.6%) | 0 (0.0%) |
| $25,000 to $34,999 | 42 (2.8%) | 0 (0.0%) |
| $35,000 to $49,999 | 206 (13.5%) | 0 (0.0%) |
| $50,000 to $74,999 | 204 (13.4%) | 0 (0.0%) |
| $75,000 to $99,999 | 128 (8.4%) | 23 (14.3%) |
| $100,000 to $149,999 | 415 (27.3%) | 61 (37.9%) |
| $150,000 or more | 400 (26.3%) | 0 (0.0%) |
| Total | 1,523 (100.0%) | 161 (100.0%) |
Monthly Housing Cost Tiers in Coopertown
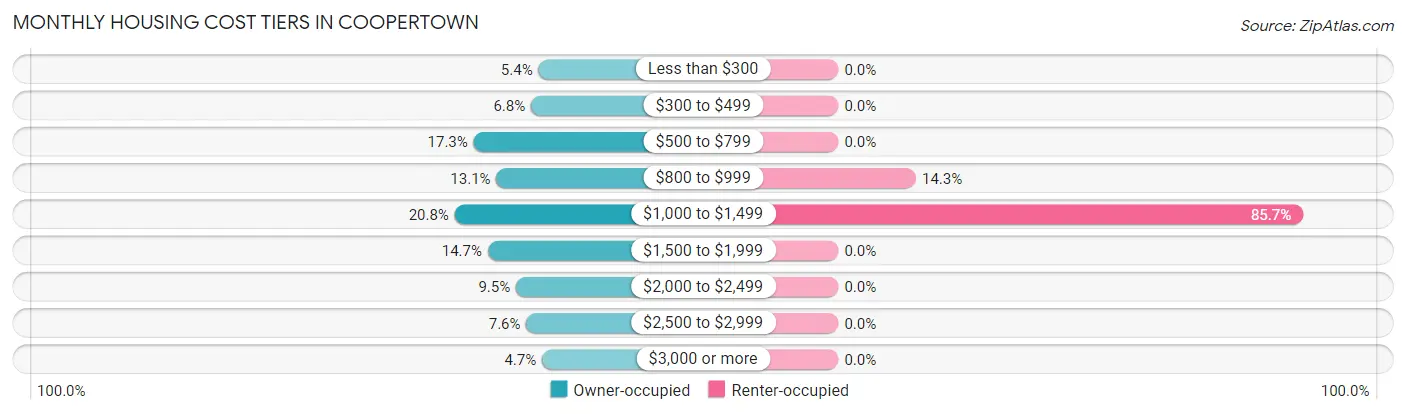
| Monthly Cost | Owner-occupied | Renter-occupied |
| Less than $300 | 82 (5.4%) | 0 (0.0%) |
| $300 to $499 | 103 (6.8%) | 0 (0.0%) |
| $500 to $799 | 264 (17.3%) | 0 (0.0%) |
| $800 to $999 | 200 (13.1%) | 23 (14.3%) |
| $1,000 to $1,499 | 317 (20.8%) | 138 (85.7%) |
| $1,500 to $1,999 | 224 (14.7%) | 0 (0.0%) |
| $2,000 to $2,499 | 145 (9.5%) | 0 (0.0%) |
| $2,500 to $2,999 | 116 (7.6%) | 0 (0.0%) |
| $3,000 or more | 72 (4.7%) | 0 (0.0%) |
| Total | 1,523 (100.0%) | 161 (100.0%) |
Physical Housing Characteristics in Coopertown
Housing Structures in Coopertown
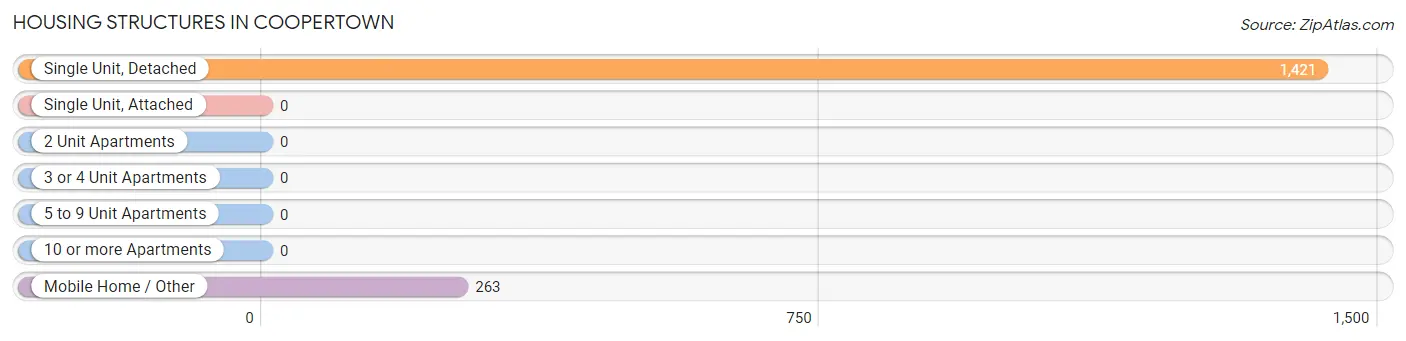
| Structure Type | # Housing Units | % Housing Units |
| Single Unit, Detached | 1,421 | 84.4% |
| Single Unit, Attached | 0 | 0.0% |
| 2 Unit Apartments | 0 | 0.0% |
| 3 or 4 Unit Apartments | 0 | 0.0% |
| 5 to 9 Unit Apartments | 0 | 0.0% |
| 10 or more Apartments | 0 | 0.0% |
| Mobile Home / Other | 263 | 15.6% |
| Total | 1,684 | 100.0% |
Housing Structures by Occupancy in Coopertown
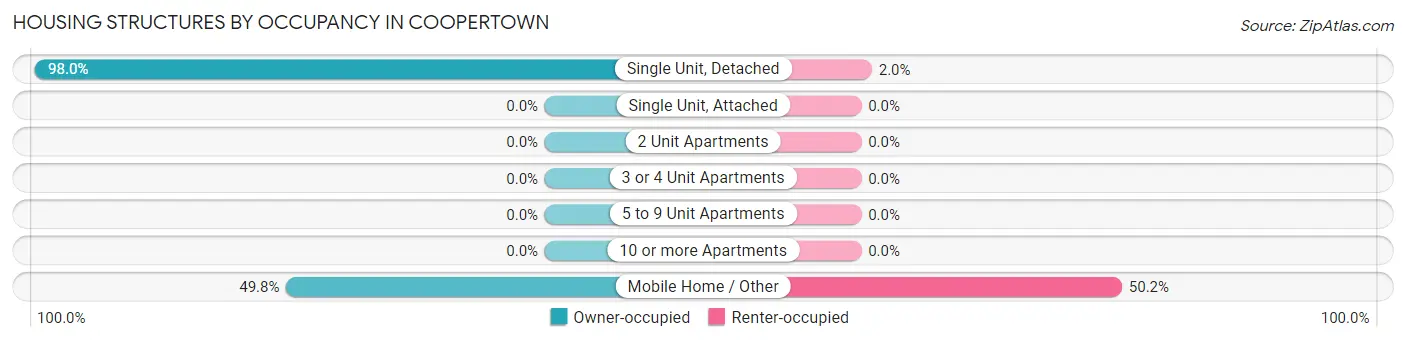
| Structure Type | Owner-occupied | Renter-occupied |
| Single Unit, Detached | 1,392 (98.0%) | 29 (2.0%) |
| Single Unit, Attached | 0 (0.0%) | 0 (0.0%) |
| 2 Unit Apartments | 0 (0.0%) | 0 (0.0%) |
| 3 or 4 Unit Apartments | 0 (0.0%) | 0 (0.0%) |
| 5 to 9 Unit Apartments | 0 (0.0%) | 0 (0.0%) |
| 10 or more Apartments | 0 (0.0%) | 0 (0.0%) |
| Mobile Home / Other | 131 (49.8%) | 132 (50.2%) |
| Total | 1,523 (90.4%) | 161 (9.6%) |
Housing Structures by Number of Rooms in Coopertown
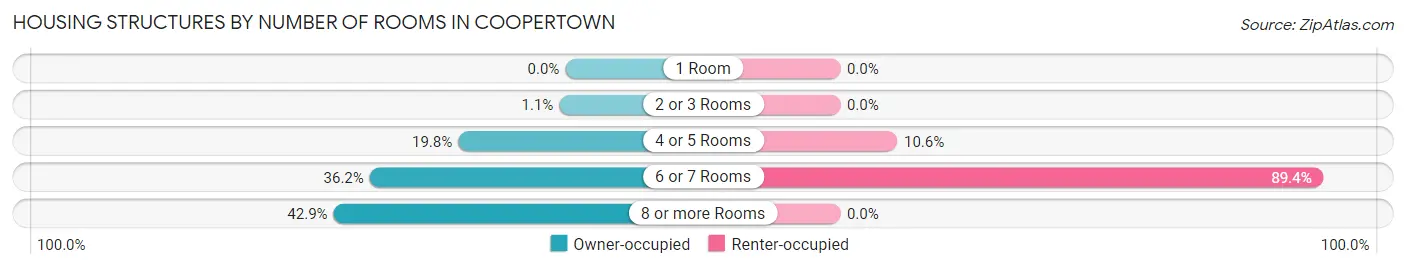
| Number of Rooms | Owner-occupied | Renter-occupied |
| 1 Room | 0 (0.0%) | 0 (0.0%) |
| 2 or 3 Rooms | 17 (1.1%) | 0 (0.0%) |
| 4 or 5 Rooms | 302 (19.8%) | 17 (10.6%) |
| 6 or 7 Rooms | 551 (36.2%) | 144 (89.4%) |
| 8 or more Rooms | 653 (42.9%) | 0 (0.0%) |
| Total | 1,523 (100.0%) | 161 (100.0%) |
Housing Structure by Heating Type in Coopertown
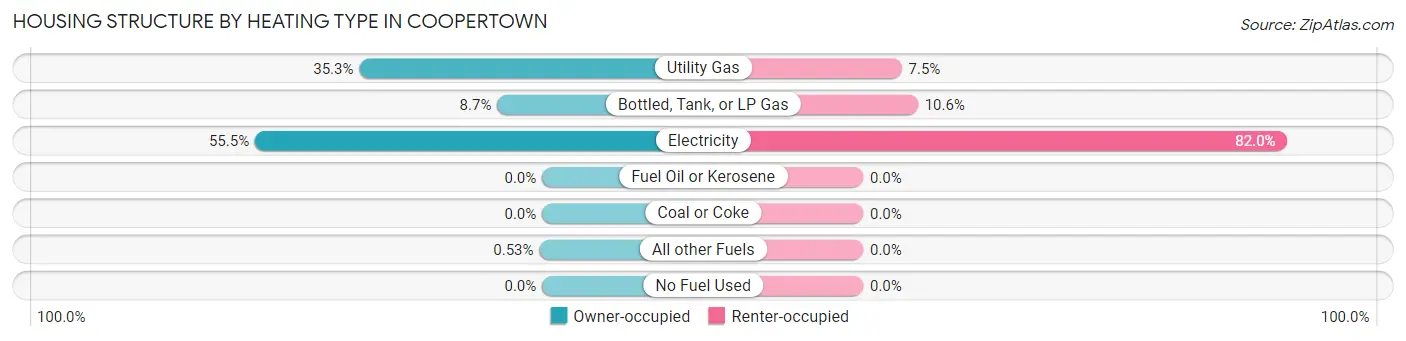
| Heating Type | Owner-occupied | Renter-occupied |
| Utility Gas | 538 (35.3%) | 12 (7.4%) |
| Bottled, Tank, or LP Gas | 132 (8.7%) | 17 (10.6%) |
| Electricity | 845 (55.5%) | 132 (82.0%) |
| Fuel Oil or Kerosene | 0 (0.0%) | 0 (0.0%) |
| Coal or Coke | 0 (0.0%) | 0 (0.0%) |
| All other Fuels | 8 (0.5%) | 0 (0.0%) |
| No Fuel Used | 0 (0.0%) | 0 (0.0%) |
| Total | 1,523 (100.0%) | 161 (100.0%) |
Household Vehicle Usage in Coopertown
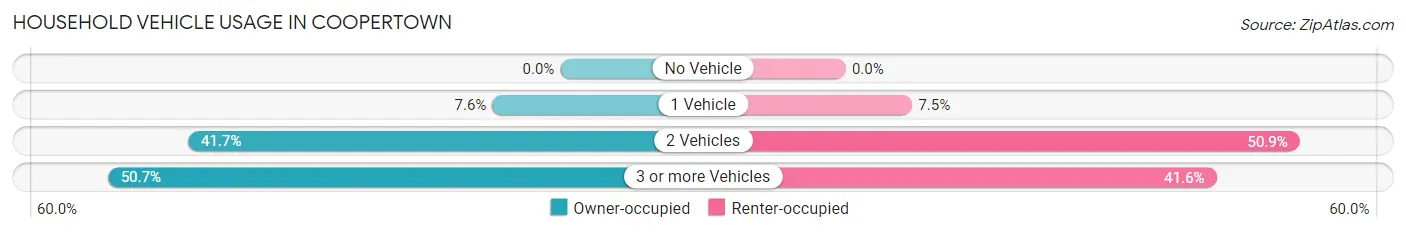
| Vehicles per Household | Owner-occupied | Renter-occupied |
| No Vehicle | 0 (0.0%) | 0 (0.0%) |
| 1 Vehicle | 116 (7.6%) | 12 (7.4%) |
| 2 Vehicles | 635 (41.7%) | 82 (50.9%) |
| 3 or more Vehicles | 772 (50.7%) | 67 (41.6%) |
| Total | 1,523 (100.0%) | 161 (100.0%) |
Real Estate & Mortgages in Coopertown
Real Estate and Mortgage Overview in Coopertown
| Characteristic | Without Mortgage | With Mortgage |
| Housing Units | 490 | 1,033 |
| Median Property Value | $327,100 | $387,000 |
| Median Household Income | $59,355 | $309 |
| Monthly Housing Costs | $588 | $72 |
| Real Estate Taxes | $1,960 | $51 |
Property Value by Mortgage Status in Coopertown
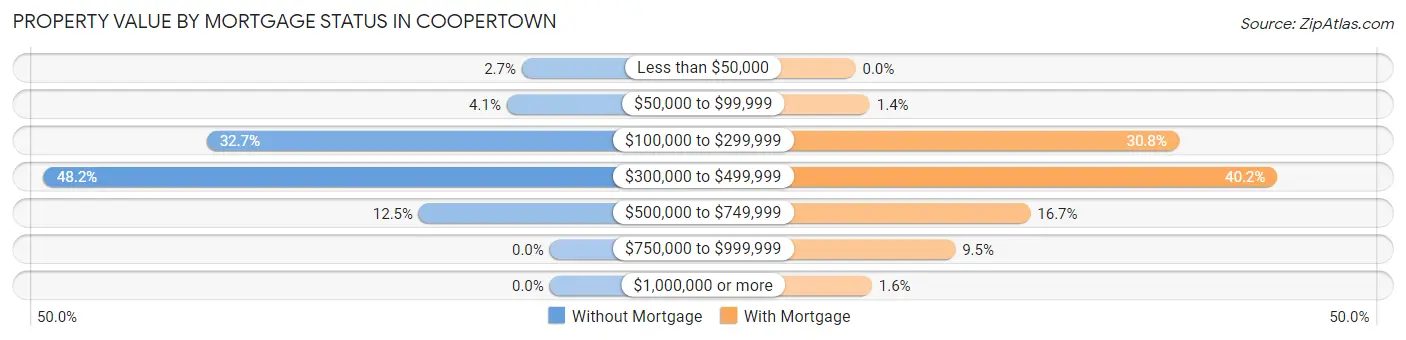
| Property Value | Without Mortgage | With Mortgage |
| Less than $50,000 | 13 (2.6%) | 0 (0.0%) |
| $50,000 to $99,999 | 20 (4.1%) | 14 (1.4%) |
| $100,000 to $299,999 | 160 (32.7%) | 318 (30.8%) |
| $300,000 to $499,999 | 236 (48.2%) | 415 (40.2%) |
| $500,000 to $749,999 | 61 (12.4%) | 172 (16.7%) |
| $750,000 to $999,999 | 0 (0.0%) | 98 (9.5%) |
| $1,000,000 or more | 0 (0.0%) | 16 (1.5%) |
| Total | 490 (100.0%) | 1,033 (100.0%) |
Household Income by Mortgage Status in Coopertown
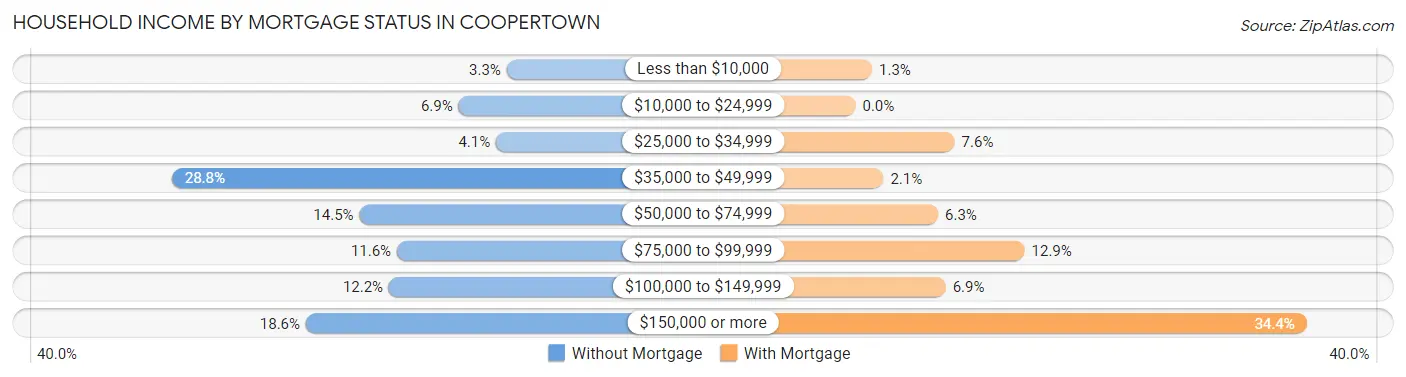
| Household Income | Without Mortgage | With Mortgage |
| Less than $10,000 | 16 (3.3%) | 13 (1.3%) |
| $10,000 to $24,999 | 34 (6.9%) | 0 (0.0%) |
| $25,000 to $34,999 | 20 (4.1%) | 78 (7.5%) |
| $35,000 to $49,999 | 141 (28.8%) | 22 (2.1%) |
| $50,000 to $74,999 | 71 (14.5%) | 65 (6.3%) |
| $75,000 to $99,999 | 57 (11.6%) | 133 (12.9%) |
| $100,000 to $149,999 | 60 (12.2%) | 71 (6.9%) |
| $150,000 or more | 91 (18.6%) | 355 (34.4%) |
| Total | 490 (100.0%) | 1,033 (100.0%) |
Property Value to Household Income Ratio in Coopertown
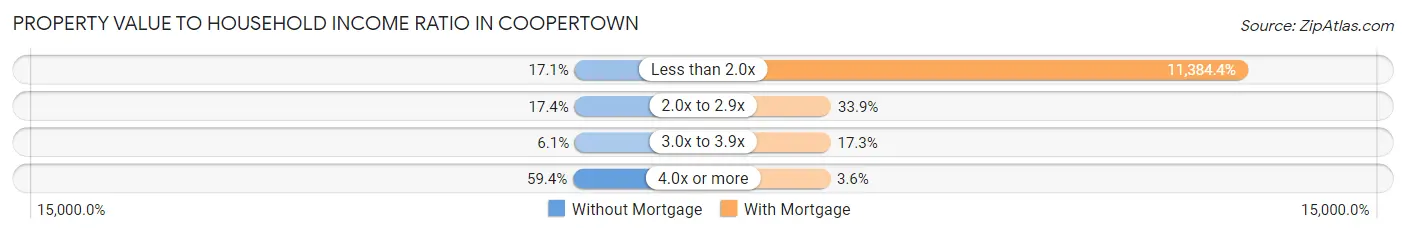
| Value-to-Income Ratio | Without Mortgage | With Mortgage |
| Less than 2.0x | 84 (17.1%) | 117,601 (11,384.4%) |
| 2.0x to 2.9x | 85 (17.3%) | 350 (33.9%) |
| 3.0x to 3.9x | 30 (6.1%) | 179 (17.3%) |
| 4.0x or more | 291 (59.4%) | 37 (3.6%) |
| Total | 490 (100.0%) | 1,033 (100.0%) |
Real Estate Taxes by Mortgage Status in Coopertown
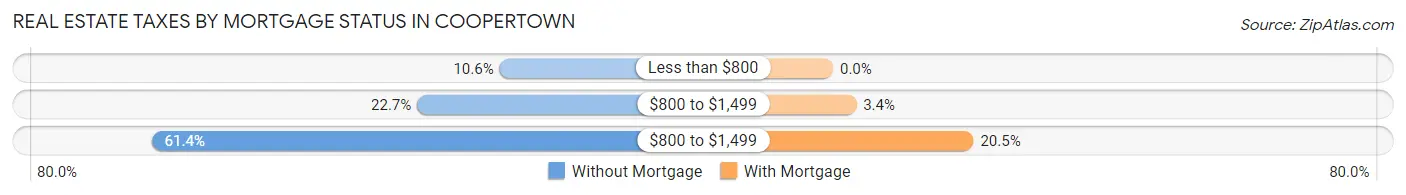
| Property Taxes | Without Mortgage | With Mortgage |
| Less than $800 | 52 (10.6%) | 0 (0.0%) |
| $800 to $1,499 | 111 (22.7%) | 35 (3.4%) |
| $800 to $1,499 | 301 (61.4%) | 212 (20.5%) |
| Total | 490 (100.0%) | 1,033 (100.0%) |
Health & Disability in Coopertown
Health Insurance Coverage by Age in Coopertown
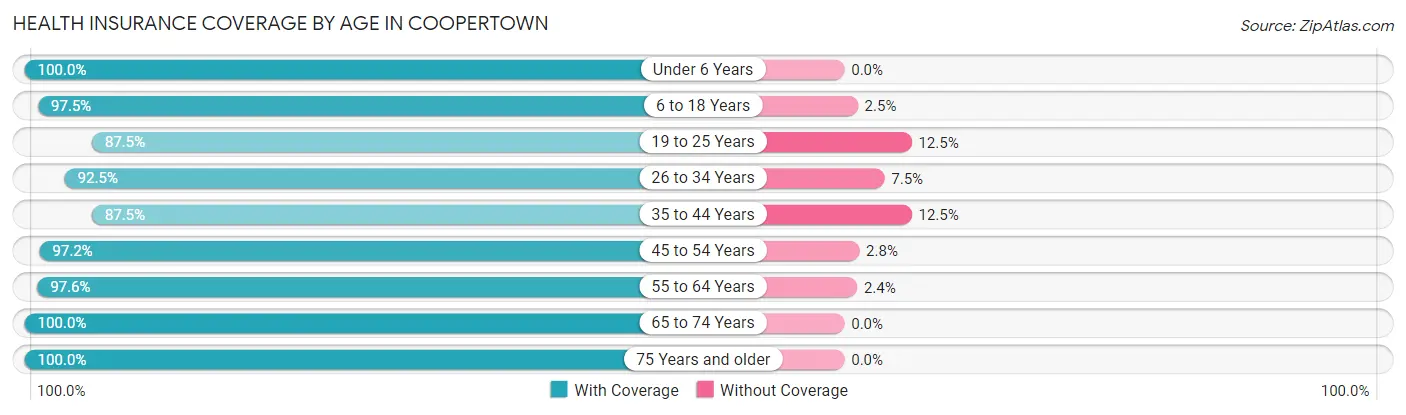
| Age Bracket | With Coverage | Without Coverage |
| Under 6 Years | 304 (100.0%) | 0 (0.0%) |
| 6 to 18 Years | 549 (97.5%) | 14 (2.5%) |
| 19 to 25 Years | 405 (87.5%) | 58 (12.5%) |
| 26 to 34 Years | 161 (92.5%) | 13 (7.5%) |
| 35 to 44 Years | 579 (87.5%) | 83 (12.5%) |
| 45 to 54 Years | 876 (97.2%) | 25 (2.8%) |
| 55 to 64 Years | 787 (97.6%) | 19 (2.4%) |
| 65 to 74 Years | 372 (100.0%) | 0 (0.0%) |
| 75 Years and older | 291 (100.0%) | 0 (0.0%) |
| Total | 4,324 (95.3%) | 212 (4.7%) |
Health Insurance Coverage by Citizenship Status in Coopertown
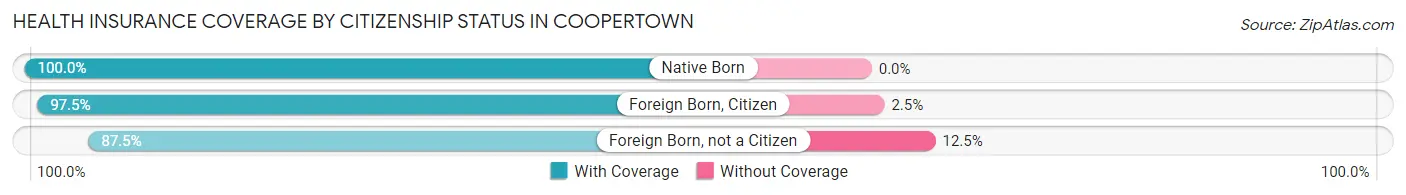
| Citizenship Status | With Coverage | Without Coverage |
| Native Born | 304 (100.0%) | 0 (0.0%) |
| Foreign Born, Citizen | 549 (97.5%) | 14 (2.5%) |
| Foreign Born, not a Citizen | 405 (87.5%) | 58 (12.5%) |
Health Insurance Coverage by Household Income in Coopertown
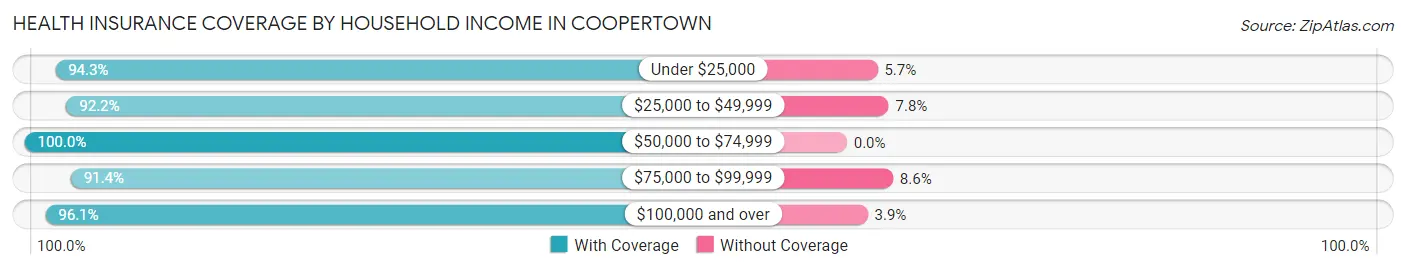
| Household Income | With Coverage | Without Coverage |
| Under $25,000 | 443 (94.3%) | 27 (5.7%) |
| $25,000 to $49,999 | 459 (92.2%) | 39 (7.8%) |
| $50,000 to $74,999 | 454 (100.0%) | 0 (0.0%) |
| $75,000 to $99,999 | 476 (91.4%) | 45 (8.6%) |
| $100,000 and over | 2,492 (96.1%) | 101 (3.9%) |
Public vs Private Health Insurance Coverage by Age in Coopertown
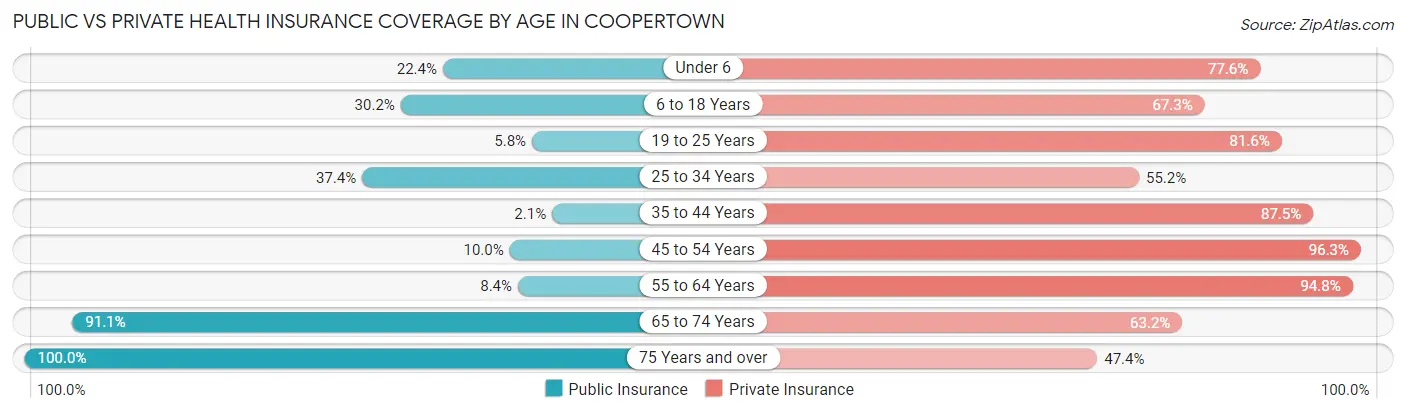
| Age Bracket | Public Insurance | Private Insurance |
| Under 6 | 68 (22.4%) | 236 (77.6%) |
| 6 to 18 Years | 170 (30.2%) | 379 (67.3%) |
| 19 to 25 Years | 27 (5.8%) | 378 (81.6%) |
| 25 to 34 Years | 65 (37.4%) | 96 (55.2%) |
| 35 to 44 Years | 14 (2.1%) | 579 (87.5%) |
| 45 to 54 Years | 90 (10.0%) | 868 (96.3%) |
| 55 to 64 Years | 68 (8.4%) | 764 (94.8%) |
| 65 to 74 Years | 339 (91.1%) | 235 (63.2%) |
| 75 Years and over | 291 (100.0%) | 138 (47.4%) |
| Total | 1,132 (25.0%) | 3,673 (81.0%) |
Disability Status by Sex by Age in Coopertown
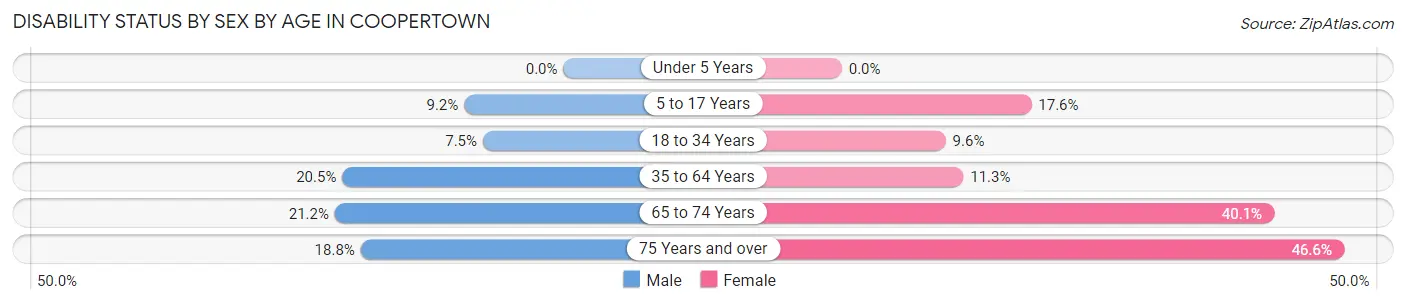
| Age Bracket | Male | Female |
| Under 5 Years | 0 (0.0%) | 0 (0.0%) |
| 5 to 17 Years | 28 (9.2%) | 57 (17.6%) |
| 18 to 34 Years | 29 (7.5%) | 24 (9.6%) |
| 35 to 64 Years | 266 (20.5%) | 121 (11.3%) |
| 65 to 74 Years | 35 (21.2%) | 83 (40.1%) |
| 75 Years and over | 41 (18.8%) | 34 (46.6%) |
Disability Class by Sex by Age in Coopertown
Disability Class: Hearing Difficulty
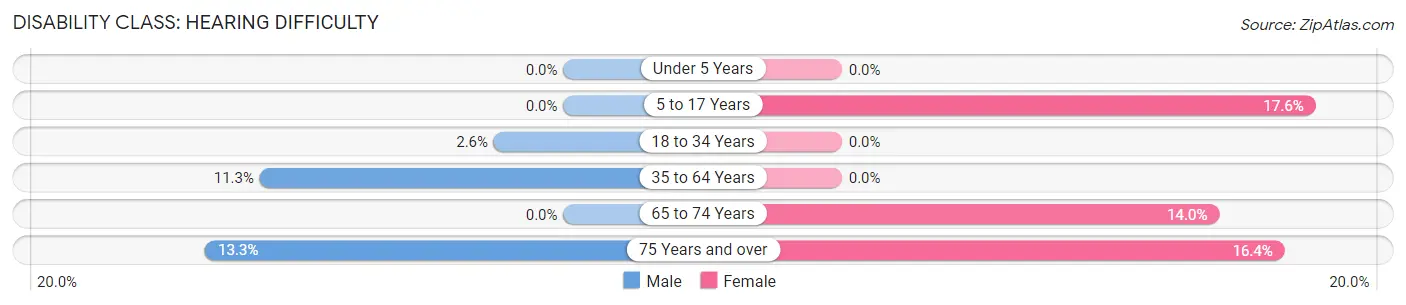
| Age Bracket | Male | Female |
| Under 5 Years | 0 (0.0%) | 0 (0.0%) |
| 5 to 17 Years | 0 (0.0%) | 57 (17.6%) |
| 18 to 34 Years | 10 (2.6%) | 0 (0.0%) |
| 35 to 64 Years | 146 (11.3%) | 0 (0.0%) |
| 65 to 74 Years | 0 (0.0%) | 29 (14.0%) |
| 75 Years and over | 29 (13.3%) | 12 (16.4%) |
Disability Class: Vision Difficulty
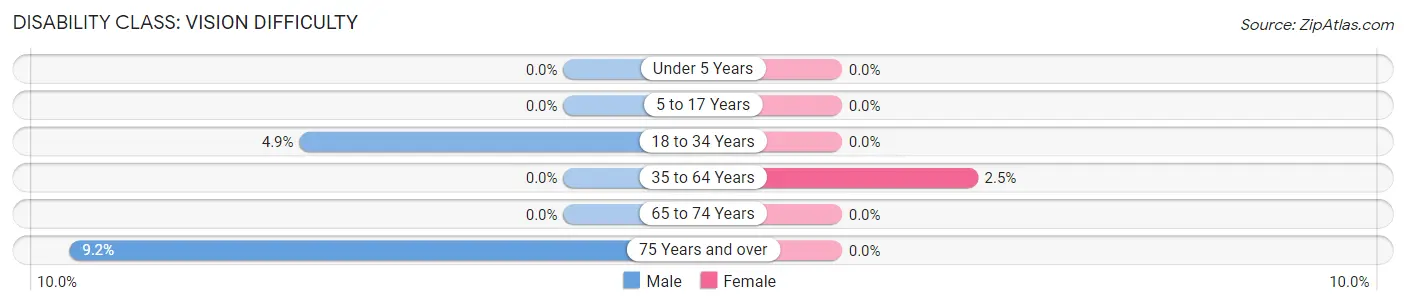
| Age Bracket | Male | Female |
| Under 5 Years | 0 (0.0%) | 0 (0.0%) |
| 5 to 17 Years | 0 (0.0%) | 0 (0.0%) |
| 18 to 34 Years | 19 (4.9%) | 0 (0.0%) |
| 35 to 64 Years | 0 (0.0%) | 27 (2.5%) |
| 65 to 74 Years | 0 (0.0%) | 0 (0.0%) |
| 75 Years and over | 20 (9.2%) | 0 (0.0%) |
Disability Class: Cognitive Difficulty
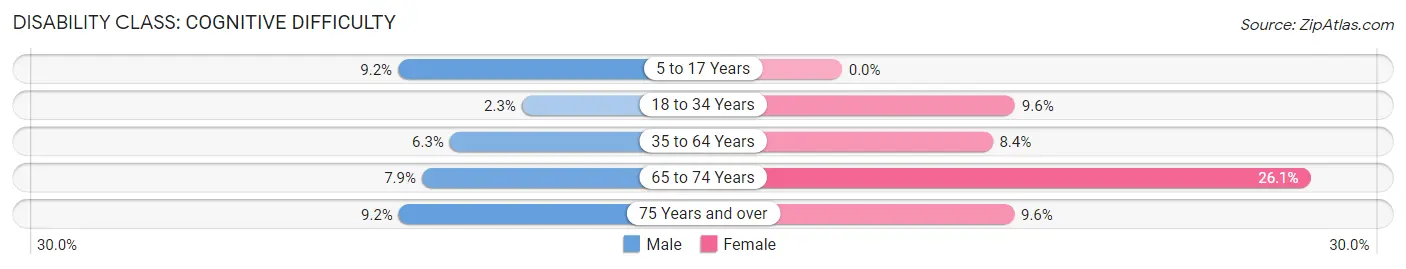
| Age Bracket | Male | Female |
| 5 to 17 Years | 28 (9.2%) | 0 (0.0%) |
| 18 to 34 Years | 9 (2.3%) | 24 (9.6%) |
| 35 to 64 Years | 82 (6.3%) | 90 (8.4%) |
| 65 to 74 Years | 13 (7.9%) | 54 (26.1%) |
| 75 Years and over | 20 (9.2%) | 7 (9.6%) |
Disability Class: Ambulatory Difficulty
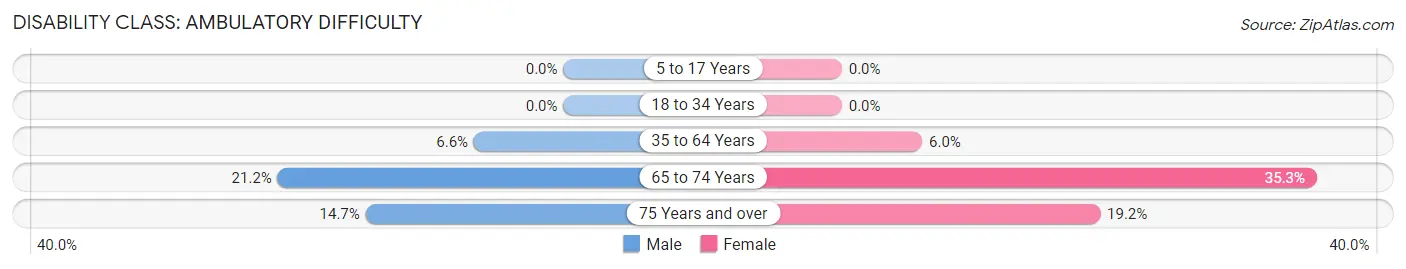
| Age Bracket | Male | Female |
| 5 to 17 Years | 0 (0.0%) | 0 (0.0%) |
| 18 to 34 Years | 0 (0.0%) | 0 (0.0%) |
| 35 to 64 Years | 86 (6.6%) | 64 (6.0%) |
| 65 to 74 Years | 35 (21.2%) | 73 (35.3%) |
| 75 Years and over | 32 (14.7%) | 14 (19.2%) |
Disability Class: Self-Care Difficulty
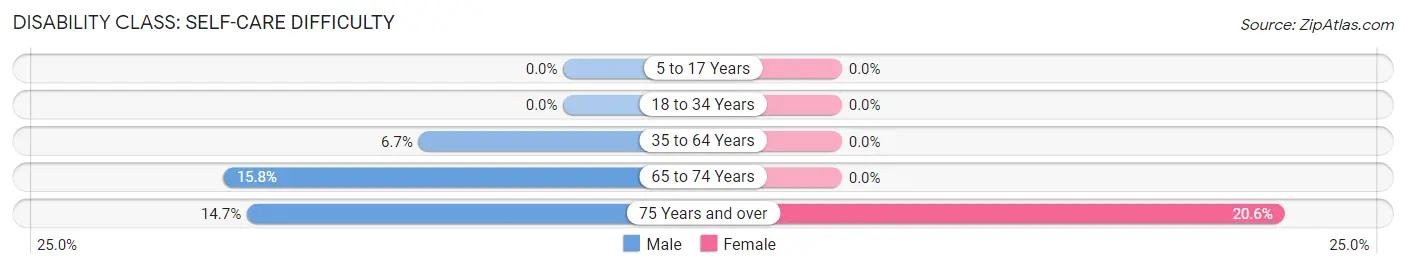
| Age Bracket | Male | Female |
| 5 to 17 Years | 0 (0.0%) | 0 (0.0%) |
| 18 to 34 Years | 0 (0.0%) | 0 (0.0%) |
| 35 to 64 Years | 87 (6.7%) | 0 (0.0%) |
| 65 to 74 Years | 26 (15.8%) | 0 (0.0%) |
| 75 Years and over | 32 (14.7%) | 15 (20.5%) |
Technology Access in Coopertown
Computing Device Access in Coopertown
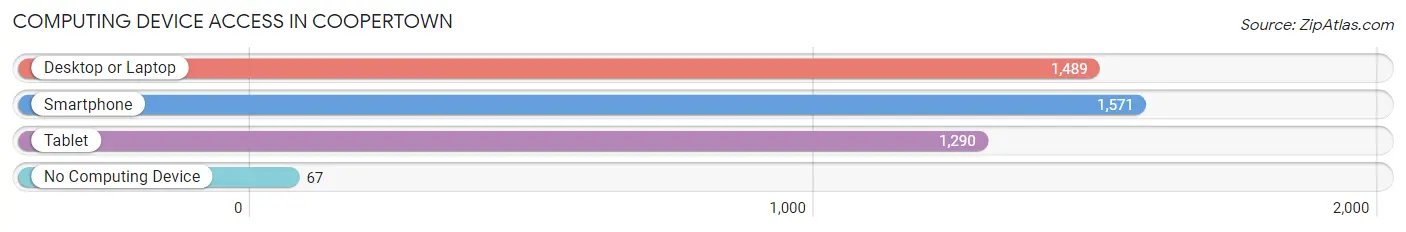
| Device Type | # Households | % Households |
| Desktop or Laptop | 1,489 | 88.4% |
| Smartphone | 1,571 | 93.3% |
| Tablet | 1,290 | 76.6% |
| No Computing Device | 67 | 4.0% |
| Total | 1,684 | 100.0% |
Internet Access in Coopertown
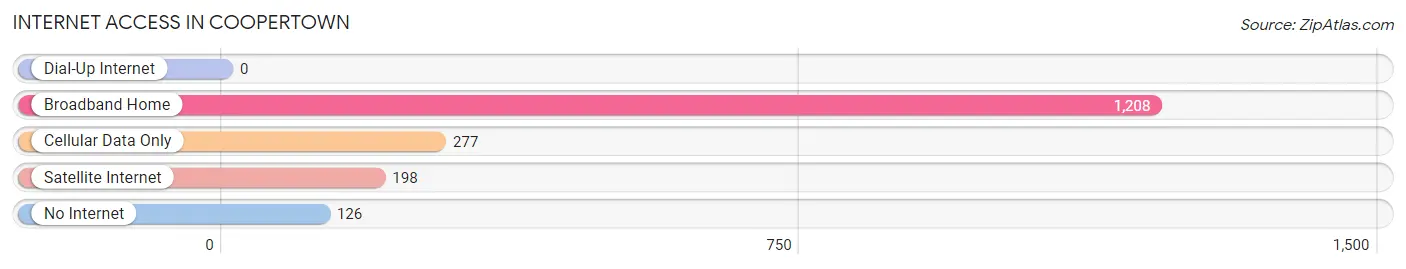
| Internet Type | # Households | % Households |
| Dial-Up Internet | 0 | 0.0% |
| Broadband Home | 1,208 | 71.7% |
| Cellular Data Only | 277 | 16.5% |
| Satellite Internet | 198 | 11.8% |
| No Internet | 126 | 7.5% |
| Total | 1,684 | 100.0% |
Coopertown Summary
Coopertown, Tennessee is a small town located in Robertson County, about 25 miles north of Nashville. It is a rural community with a population of just over 1,000 people. The town was founded in 1820 and named after the Cooper family, who were among the first settlers in the area.
Geography
Coopertown is located in the rolling hills of Middle Tennessee, with an elevation of 590 feet. The town is situated on the banks of the Cumberland River, which provides a source of recreation and fishing for the locals. The town is surrounded by farmland, with the majority of the land being used for cattle and horse grazing. The town is also home to several small lakes, which provide a source of recreation for the locals.
Economy
The economy of Coopertown is largely based on agriculture. The town is home to several farms, which produce a variety of crops, including corn, soybeans, wheat, and hay. The town also has a few small businesses, including a grocery store, a hardware store, and a few restaurants. The town is also home to a few small manufacturing companies, which produce a variety of products, including furniture, clothing, and automotive parts.
Demographics
As of the 2010 census, the population of Coopertown was 1,068. The racial makeup of the town was 97.3% White, 0.9% African American, 0.3% Native American, 0.2% Asian, 0.1% Pacific Islander, and 0.7% from other races. The median household income was $37,917, and the median family income was $45,625. The per capita income was $19,945.
History
Coopertown was founded in 1820 by the Cooper family, who were among the first settlers in the area. The town was originally known as Cooper's Station, and was a stop on the stagecoach line between Nashville and Clarksville. The town was officially incorporated in 1837, and the name was changed to Coopertown.
In the late 19th century, the town was a major center for the production of tobacco. The town was also home to several mills, which produced flour, lumber, and other products. The town was also home to several churches, which provided a source of spiritual guidance for the locals.
In the early 20th century, the town began to decline as the tobacco industry moved away from the area. The town was also affected by the Great Depression, and many of the businesses in the town closed. The town was revitalized in the 1950s, when the town was chosen as the site of a new state park. The park, which is now known as the Coopertown State Park, has become a popular destination for tourists and locals alike.
Today, Coopertown is a small, rural community with a population of just over 1,000 people. The town is home to several small businesses, and the town is also home to the Coopertown State Park. The town is also home to several churches, which provide a source of spiritual guidance for the locals. The town is also home to several small lakes, which provide a source of recreation for the locals.
Common Questions
What is the Total Population of Coopertown?
Total Population of Coopertown is 4,536.
What is the Total Male Population of Coopertown?
Total Male Population of Coopertown is 2,490.
What is the Total Female Population of Coopertown?
Total Female Population of Coopertown is 2,046.
What is the Ratio of Males per 100 Females in Coopertown?
There are 121.70 Males per 100 Females in Coopertown.
What is the Ratio of Females per 100 Males in Coopertown?
There are 82.17 Females per 100 Males in Coopertown.
What is the Median Population Age in Coopertown?
Median Population Age in Coopertown is 45.5 Years.
What is the Average Family Size in Coopertown
Average Family Size in Coopertown is 3.1 People.
What is the Average Household Size in Coopertown
Average Household Size in Coopertown is 2.7 People.
What is Per Capita Income in Coopertown?
Per Capita income in Coopertown is $46,093.
What is the Median Family Income in Coopertown?
Median Family Income in Coopertown is $113,523.
What is the Median Household income in Coopertown?
Median Household Income in Coopertown is $106,121.
What is Income or Wage Gap in Coopertown?
Income or Wage Gap in Coopertown is 5.6%.
Women in Coopertown earn 94.4 cents for every dollar earned by a man.
What is Inequality or Gini Index in Coopertown?
Inequality or Gini Index in Coopertown is 0.43.
How Large is the Labor Force in Coopertown?
There are 2,555 People in the Labor Forcein in Coopertown.
What is the Percentage of People in the Labor Force in Coopertown?
67.7% of People are in the Labor Force in Coopertown.
What is the Unemployment Rate in Coopertown?
Unemployment Rate in Coopertown is 1.0%.