Mowbray Mountain, TN
Mowbray Mountain Map
Mowbray Mountain Overview
1,902
TOTAL POPULATION
929
MALE POPULATION
973
FEMALE POPULATION
95.48
MALES / 100 FEMALES
104.74
FEMALES / 100 MALES
50.6
MEDIAN AGE
2.9
AVG FAMILY SIZE
2.7
AVG HOUSEHOLD SIZE
$39,663
PER CAPITA INCOME
$111,118
AVG FAMILY INCOME
$85,125
AVG HOUSEHOLD INCOME
36.7%
WAGE / INCOME GAP [ % ]
63.3¢/ $1
WAGE / INCOME GAP [ $ ]
0.40
INEQUALITY / GINI INDEX
884
LABOR FORCE [ PEOPLE ]
57.3%
PERCENT IN LABOR FORCE
2.6%
UNEMPLOYMENT RATE
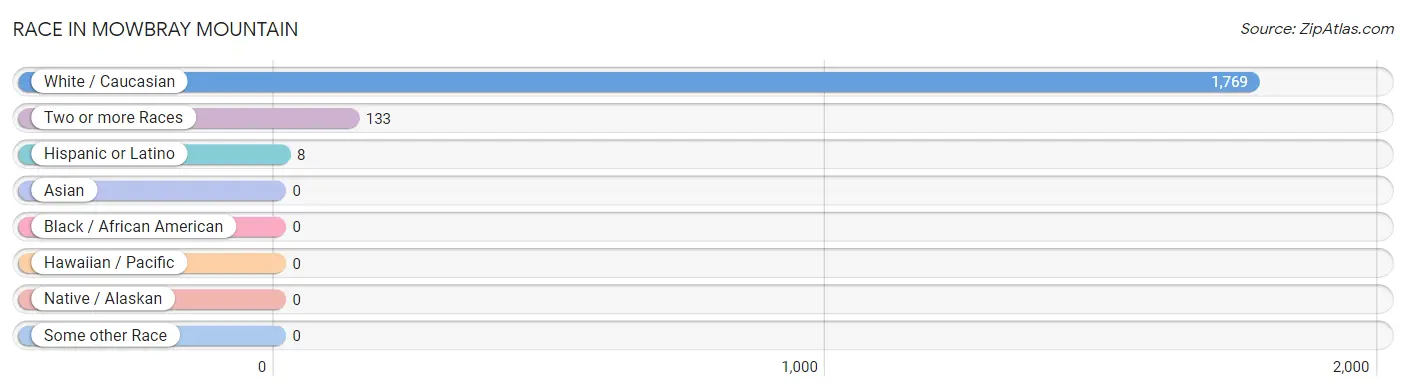
Race in Mowbray Mountain
The most populous races in Mowbray Mountain are White / Caucasian (1,769 | 93.0%), Two or more Races (133 | 7.0%), and Hispanic or Latino (8 | 0.4%).
| Race | # Population | % Population |
| Asian | 0 | 0.0% |
| Black / African American | 0 | 0.0% |
| Hawaiian / Pacific | 0 | 0.0% |
| Hispanic or Latino | 8 | 0.4% |
| Native / Alaskan | 0 | 0.0% |
| White / Caucasian | 1,769 | 93.0% |
| Two or more Races | 133 | 7.0% |
| Some other Race | 0 | 0.0% |
| Total | 1,902 | 100.0% |
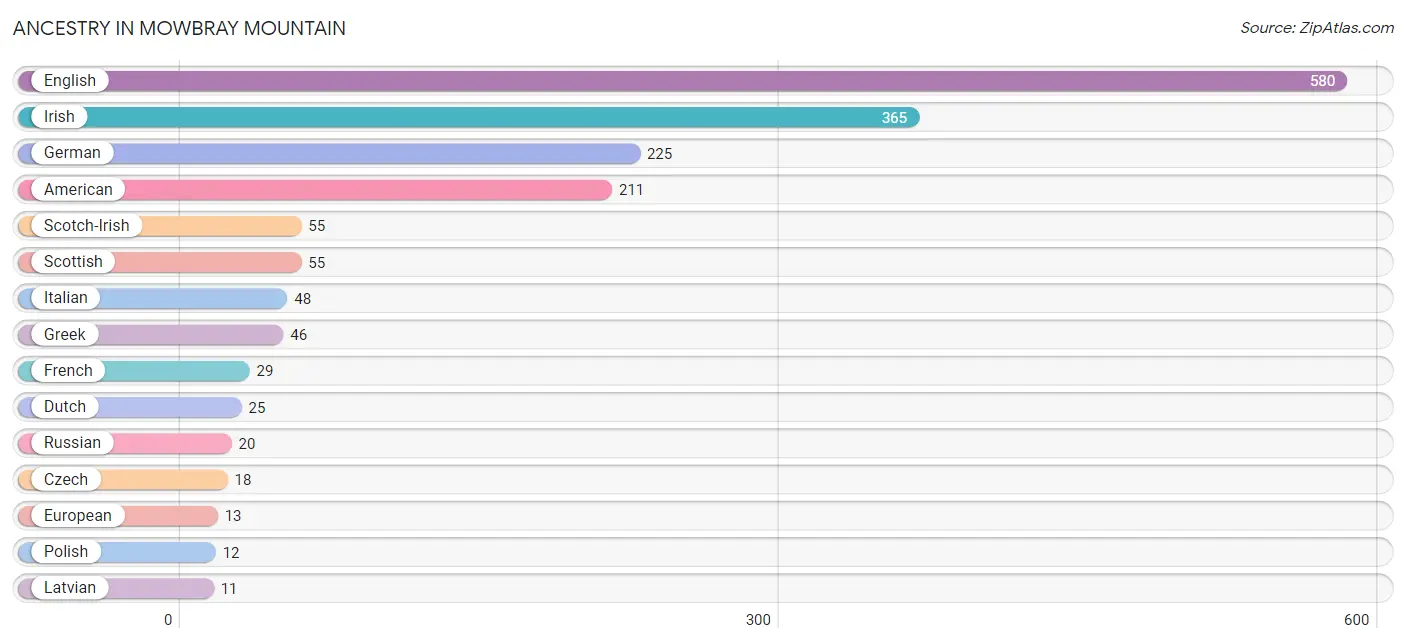
Ancestry in Mowbray Mountain
The most populous ancestries reported in Mowbray Mountain are English (580 | 30.5%), Irish (365 | 19.2%), German (225 | 11.8%), American (211 | 11.1%), and Scotch-Irish (55 | 2.9%), together accounting for 75.5% of all Mowbray Mountain residents.
| Ancestry | # Population | % Population |
| American | 211 | 11.1% |
| British | 6 | 0.3% |
| Cherokee | 5 | 0.3% |
| Czech | 18 | 0.9% |
| Dutch | 25 | 1.3% |
| English | 580 | 30.5% |
| European | 13 | 0.7% |
| French | 29 | 1.5% |
| German | 225 | 11.8% |
| Greek | 46 | 2.4% |
| Irish | 365 | 19.2% |
| Italian | 48 | 2.5% |
| Latvian | 11 | 0.6% |
| Mexican | 8 | 0.4% |
| Northern European | 3 | 0.2% |
| Polish | 12 | 0.6% |
| Russian | 20 | 1.1% |
| Scotch-Irish | 55 | 2.9% |
| Scottish | 55 | 2.9% |
| Swedish | 5 | 0.3% |
| Swiss | 6 | 0.3% |
| Welsh | 5 | 0.3% | View All 22 Rows |
Immigrants in Mowbray Mountain

| Immigration Origin | # Population | % Population | View All 0 Rows |
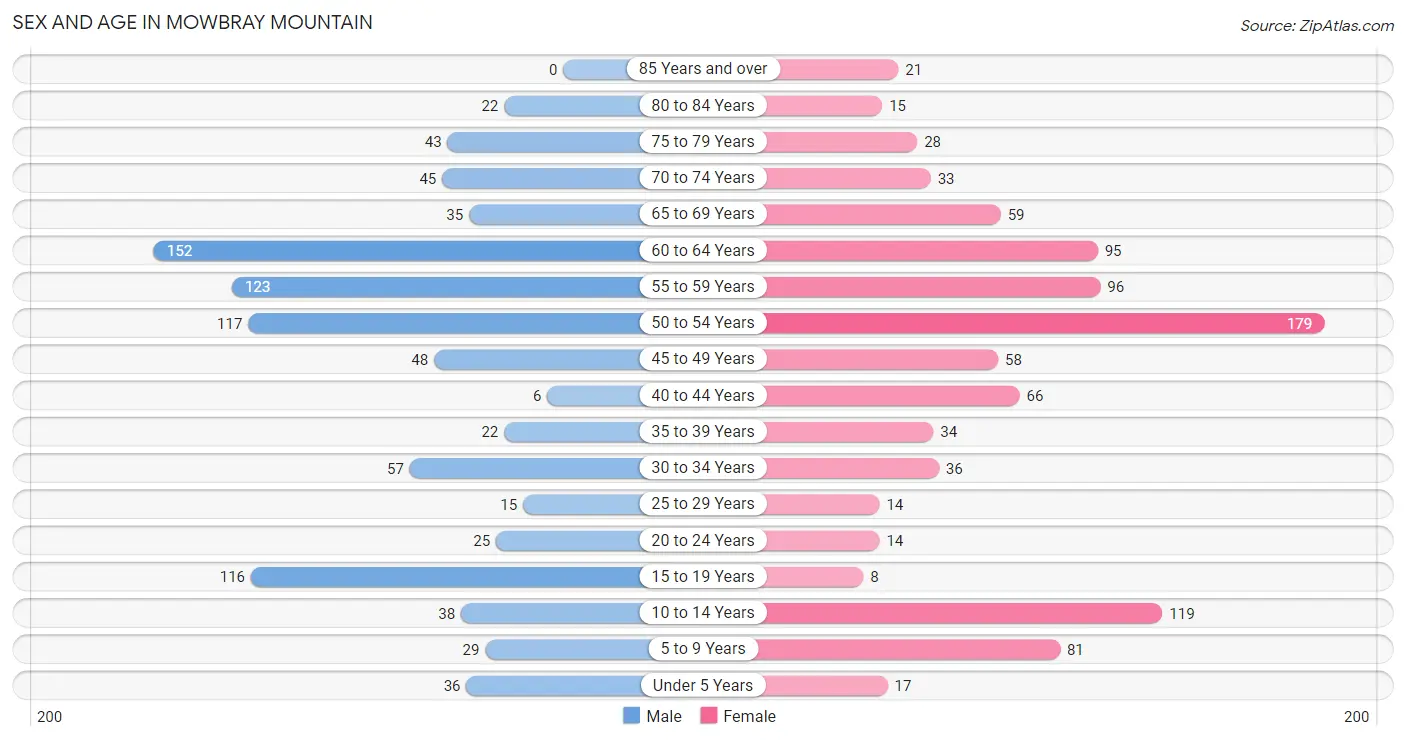
Sex and Age in Mowbray Mountain
Sex and Age in Mowbray Mountain
The most populous age groups in Mowbray Mountain are 60 to 64 Years (152 | 16.4%) for men and 50 to 54 Years (179 | 18.4%) for women.
| Age Bracket | Male | Female |
| Under 5 Years | 36 (3.9%) | 17 (1.8%) |
| 5 to 9 Years | 29 (3.1%) | 81 (8.3%) |
| 10 to 14 Years | 38 (4.1%) | 119 (12.2%) |
| 15 to 19 Years | 116 (12.5%) | 8 (0.8%) |
| 20 to 24 Years | 25 (2.7%) | 14 (1.4%) |
| 25 to 29 Years | 15 (1.6%) | 14 (1.4%) |
| 30 to 34 Years | 57 (6.1%) | 36 (3.7%) |
| 35 to 39 Years | 22 (2.4%) | 34 (3.5%) |
| 40 to 44 Years | 6 (0.6%) | 66 (6.8%) |
| 45 to 49 Years | 48 (5.2%) | 58 (6.0%) |
| 50 to 54 Years | 117 (12.6%) | 179 (18.4%) |
| 55 to 59 Years | 123 (13.2%) | 96 (9.9%) |
| 60 to 64 Years | 152 (16.4%) | 95 (9.8%) |
| 65 to 69 Years | 35 (3.8%) | 59 (6.1%) |
| 70 to 74 Years | 45 (4.8%) | 33 (3.4%) |
| 75 to 79 Years | 43 (4.6%) | 28 (2.9%) |
| 80 to 84 Years | 22 (2.4%) | 15 (1.5%) |
| 85 Years and over | 0 (0.0%) | 21 (2.2%) |
| Total | 929 (100.0%) | 973 (100.0%) |
Families and Households in Mowbray Mountain
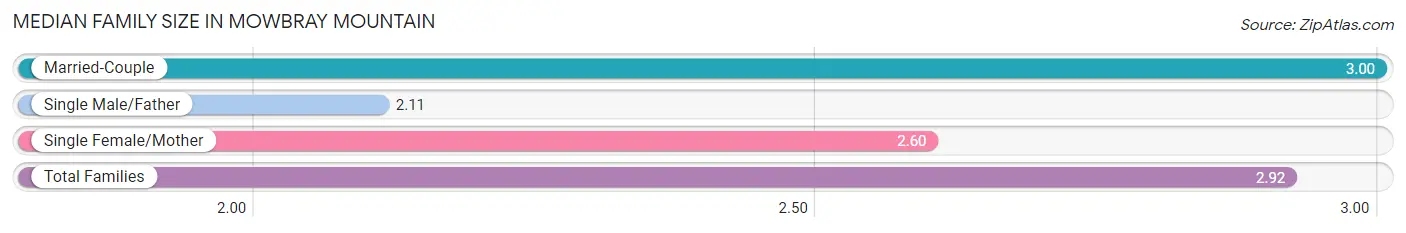
Median Family Size in Mowbray Mountain
The median family size in Mowbray Mountain is 2.92 persons per family, with married-couple families (478 | 86.4%) accounting for the largest median family size of 3 persons per family. On the other hand, single male/father families (27 | 4.9%) represent the smallest median family size with 2.11 persons per family.
| Family Type | # Families | Family Size |
| Married-Couple | 478 (86.4%) | 3.00 |
| Single Male/Father | 27 (4.9%) | 2.11 |
| Single Female/Mother | 48 (8.7%) | 2.60 |
| Total Families | 553 (100.0%) | 2.92 |
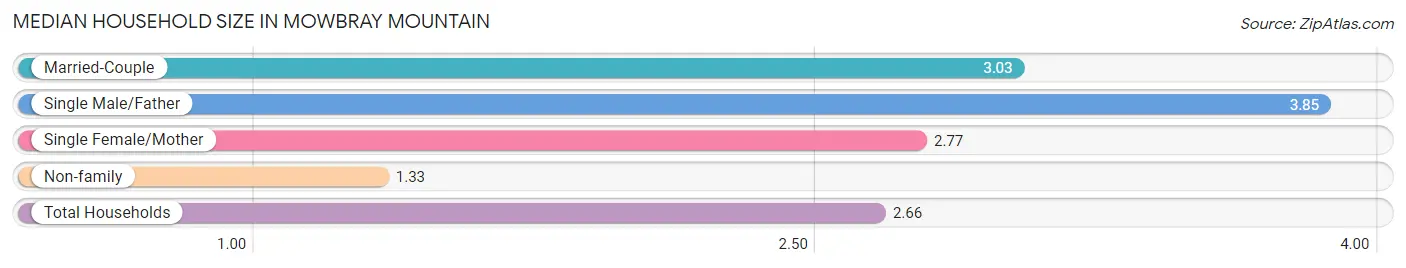
Median Household Size in Mowbray Mountain
The median household size in Mowbray Mountain is 2.66 persons per household, with single male/father households (27 | 3.8%) accounting for the largest median household size of 3.85 persons per household. non-family households (163 | 22.8%) represent the smallest median household size with 1.33 persons per household.
| Household Type | # Households | Household Size |
| Married-Couple | 478 (66.8%) | 3.03 |
| Single Male/Father | 27 (3.8%) | 3.85 |
| Single Female/Mother | 48 (6.7%) | 2.77 |
| Non-family | 163 (22.8%) | 1.33 |
| Total Households | 716 (100.0%) | 2.66 |
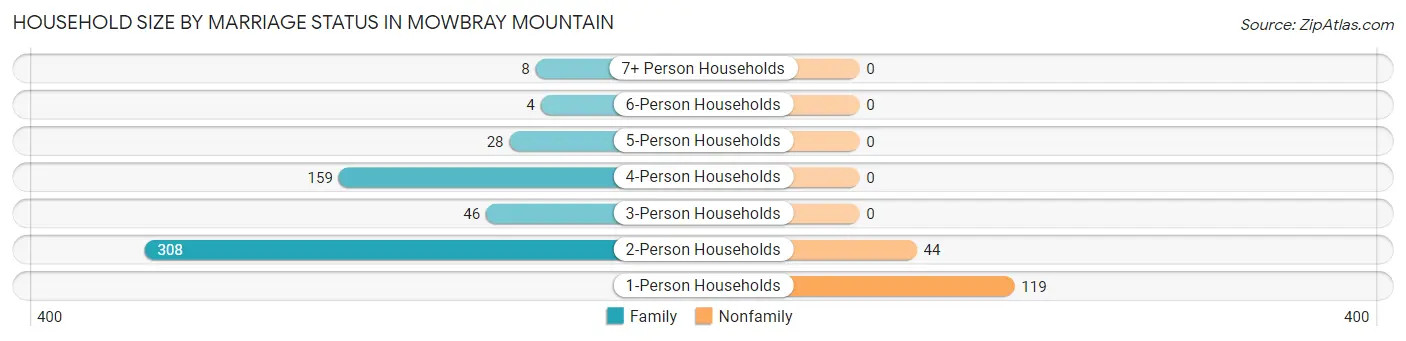
Household Size by Marriage Status in Mowbray Mountain
Out of a total of 716 households in Mowbray Mountain, 553 (77.2%) are family households, while 163 (22.8%) are nonfamily households. The most numerous type of family households are 2-person households, comprising 308, and the most common type of nonfamily households are 1-person households, comprising 119.
| Household Size | Family Households | Nonfamily Households |
| 1-Person Households | - | 119 (16.6%) |
| 2-Person Households | 308 (43.0%) | 44 (6.1%) |
| 3-Person Households | 46 (6.4%) | 0 (0.0%) |
| 4-Person Households | 159 (22.2%) | 0 (0.0%) |
| 5-Person Households | 28 (3.9%) | 0 (0.0%) |
| 6-Person Households | 4 (0.6%) | 0 (0.0%) |
| 7+ Person Households | 8 (1.1%) | 0 (0.0%) |
| Total | 553 (77.2%) | 163 (22.8%) |
Female Fertility in Mowbray Mountain
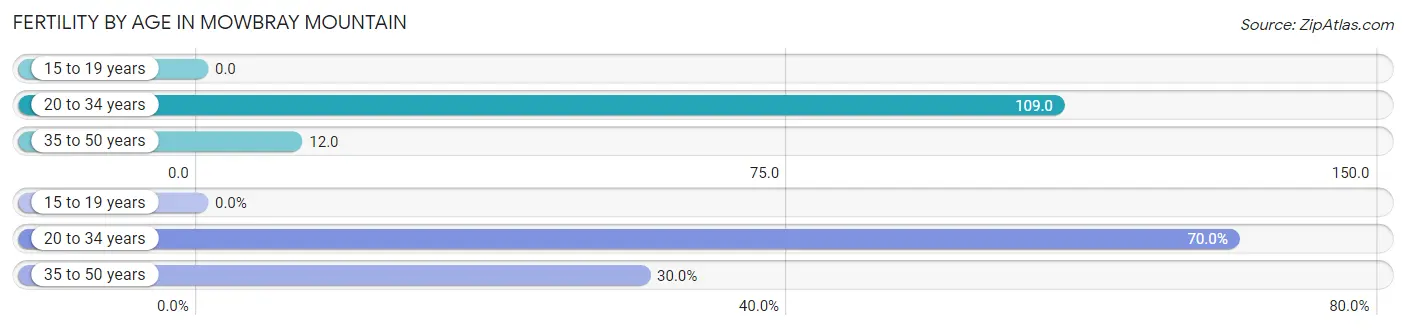
Fertility by Age in Mowbray Mountain
Average fertility rate in Mowbray Mountain is 31.0 births per 1,000 women. Women in the age bracket of 20 to 34 years have the highest fertility rate with 109.0 births per 1,000 women. Women in the age bracket of 20 to 34 years acount for 70.0% of all women with births.
| Age Bracket | Women with Births | Births / 1,000 Women |
| 15 to 19 years | 0 (0.0%) | 0.0 |
| 20 to 34 years | 7 (70.0%) | 109.0 |
| 35 to 50 years | 3 (30.0%) | 12.0 |
| Total | 10 (100.0%) | 31.0 |
Fertility by Age by Marriage Status in Mowbray Mountain
30.0% of women with births (10) in Mowbray Mountain are married. The highest percentage of unmarried women with births falls into 20 to 34 years age bracket with 100.0% of them unmarried at the time of birth, while the lowest percentage of unmarried women with births belong to 35 to 50 years age bracket with 0.0% of them unmarried.
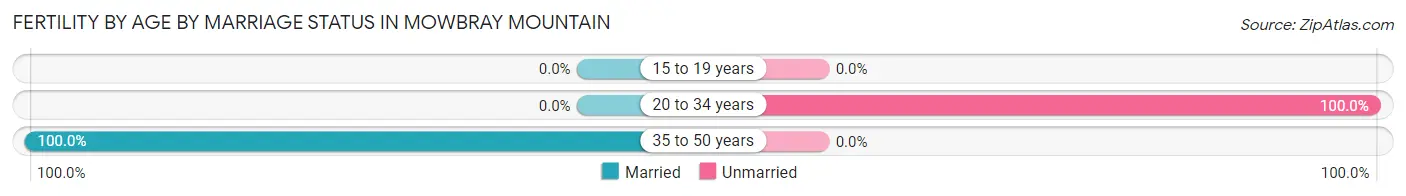
| Age Bracket | Married | Unmarried |
| 15 to 19 years | 0 (0.0%) | 0 (0.0%) |
| 20 to 34 years | 0 (0.0%) | 7 (100.0%) |
| 35 to 50 years | 3 (100.0%) | 0 (0.0%) |
| Total | 3 (30.0%) | 7 (70.0%) |
Fertility by Education in Mowbray Mountain
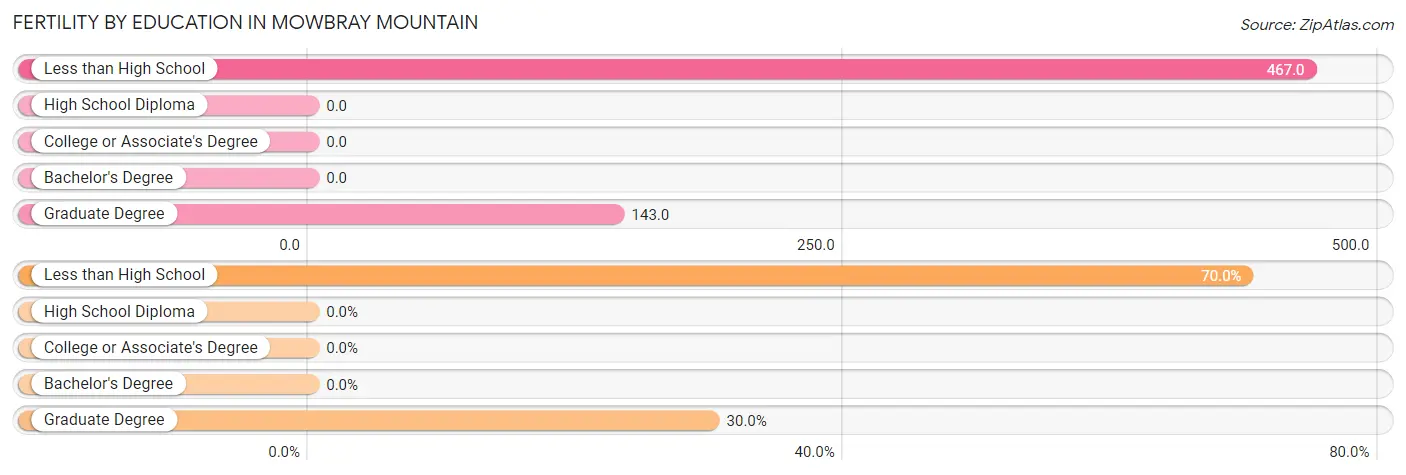
| Educational Attainment | Women with Births | Births / 1,000 Women |
| Less than High School | 7 (70.0%) | 467.0 |
| High School Diploma | 0 (0.0%) | 0.0 |
| College or Associate's Degree | 0 (0.0%) | 0.0 |
| Bachelor's Degree | 0 (0.0%) | 0.0 |
| Graduate Degree | 3 (30.0%) | 143.0 |
| Total | 10 (100.0%) | 31.0 |
Fertility by Education by Marriage Status in Mowbray Mountain
70.0% of women with births in Mowbray Mountain are unmarried. Women with the educational attainment of graduate degree are most likely to be married with 100.0% of them married at childbirth, while women with the educational attainment of less than high school are least likely to be married with 100.0% of them unmarried at childbirth.
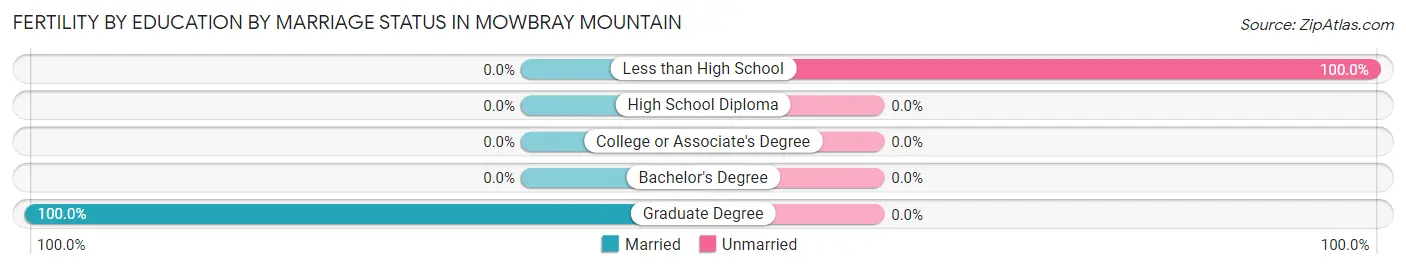
| Educational Attainment | Married | Unmarried |
| Less than High School | 0 (0.0%) | 7 (100.0%) |
| High School Diploma | 0 (0.0%) | 0 (0.0%) |
| College or Associate's Degree | 0 (0.0%) | 0 (0.0%) |
| Bachelor's Degree | 0 (0.0%) | 0 (0.0%) |
| Graduate Degree | 3 (100.0%) | 0 (0.0%) |
| Total | 3 (30.0%) | 7 (70.0%) |
Income in Mowbray Mountain
Income Overview in Mowbray Mountain
Per Capita Income in Mowbray Mountain is $39,663, while median incomes of families and households are $111,118 and $85,125 respectively.
| Characteristic | Number | Measure |
| Per Capita Income | 1,902 | $39,663 |
| Median Family Income | 553 | $111,118 |
| Mean Family Income | 553 | $116,335 |
| Median Household Income | 716 | $85,125 |
| Mean Household Income | 716 | $103,528 |
| Income Deficit | 553 | $0 |
| Wage / Income Gap (%) | 1,902 | 36.66% |
| Wage / Income Gap ($) | 1,902 | 63.34¢ per $1 |
| Gini / Inequality Index | 1,902 | 0.40 |
Earnings by Sex in Mowbray Mountain
Average Earnings in Mowbray Mountain are $52,216, $66,765 for men and $42,292 for women, a difference of 36.7%.
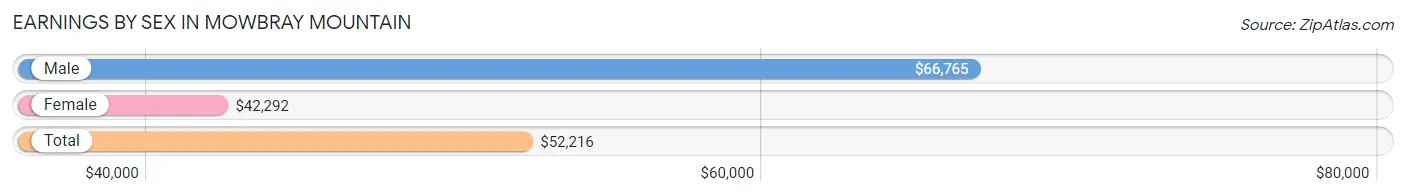
| Sex | Number | Average Earnings |
| Male | 550 (62.4%) | $66,765 |
| Female | 331 (37.6%) | $42,292 |
| Total | 881 (100.0%) | $52,216 |
Earnings by Sex by Income Bracket in Mowbray Mountain
The most common earnings brackets in Mowbray Mountain are $75,000 to $99,999 for men (156 | 28.4%) and $100,000+ for women (88 | 26.6%).
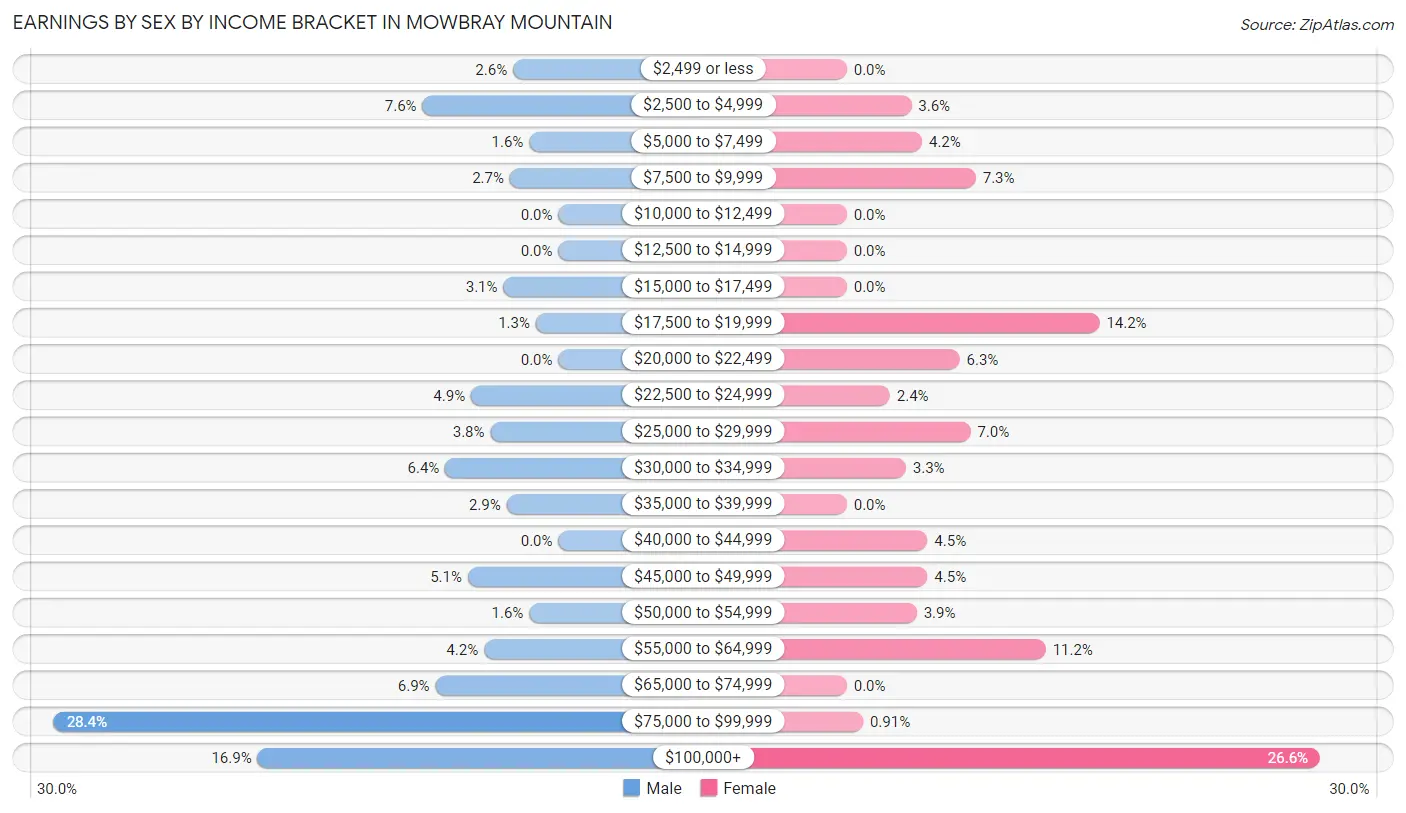
| Income | Male | Female |
| $2,499 or less | 14 (2.5%) | 0 (0.0%) |
| $2,500 to $4,999 | 42 (7.6%) | 12 (3.6%) |
| $5,000 to $7,499 | 9 (1.6%) | 14 (4.2%) |
| $7,500 to $9,999 | 15 (2.7%) | 24 (7.2%) |
| $10,000 to $12,499 | 0 (0.0%) | 0 (0.0%) |
| $12,500 to $14,999 | 0 (0.0%) | 0 (0.0%) |
| $15,000 to $17,499 | 17 (3.1%) | 0 (0.0%) |
| $17,500 to $19,999 | 7 (1.3%) | 47 (14.2%) |
| $20,000 to $22,499 | 0 (0.0%) | 21 (6.3%) |
| $22,500 to $24,999 | 27 (4.9%) | 8 (2.4%) |
| $25,000 to $29,999 | 21 (3.8%) | 23 (7.0%) |
| $30,000 to $34,999 | 35 (6.4%) | 11 (3.3%) |
| $35,000 to $39,999 | 16 (2.9%) | 0 (0.0%) |
| $40,000 to $44,999 | 0 (0.0%) | 15 (4.5%) |
| $45,000 to $49,999 | 28 (5.1%) | 15 (4.5%) |
| $50,000 to $54,999 | 9 (1.6%) | 13 (3.9%) |
| $55,000 to $64,999 | 23 (4.2%) | 37 (11.2%) |
| $65,000 to $74,999 | 38 (6.9%) | 0 (0.0%) |
| $75,000 to $99,999 | 156 (28.4%) | 3 (0.9%) |
| $100,000+ | 93 (16.9%) | 88 (26.6%) |
| Total | 550 (100.0%) | 331 (100.0%) |
Earnings by Sex by Educational Attainment in Mowbray Mountain
Average earnings in Mowbray Mountain are $75,215 for men and $44,306 for women, a difference of 41.1%. Men with an educational attainment of bachelor's degree enjoy the highest average annual earnings of $86,382, while those with less than high school education earn the least with $24,565. Women with an educational attainment of bachelor's degree earn the most with the average annual earnings of $143,117, while those with college or associate's degree education have the smallest earnings of $20,227.
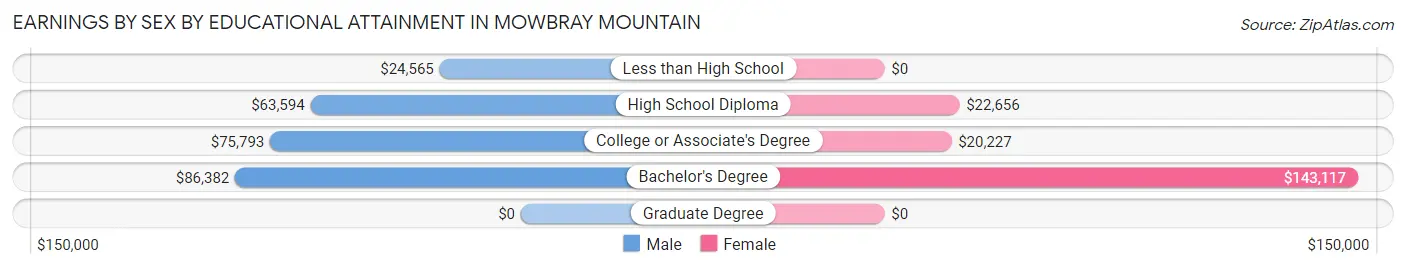
| Educational Attainment | Male Income | Female Income |
| Less than High School | $24,565 | $0 |
| High School Diploma | $63,594 | $22,656 |
| College or Associate's Degree | $75,793 | $20,227 |
| Bachelor's Degree | $86,382 | $143,117 |
| Graduate Degree | - | - |
| Total | $75,215 | $44,306 |
Family Income in Mowbray Mountain
Family Income Brackets in Mowbray Mountain
According to the Mowbray Mountain family income data, there are 104 families falling into the $150,000 to $199,999 income range, which is the most common income bracket and makes up 18.8% of all families.
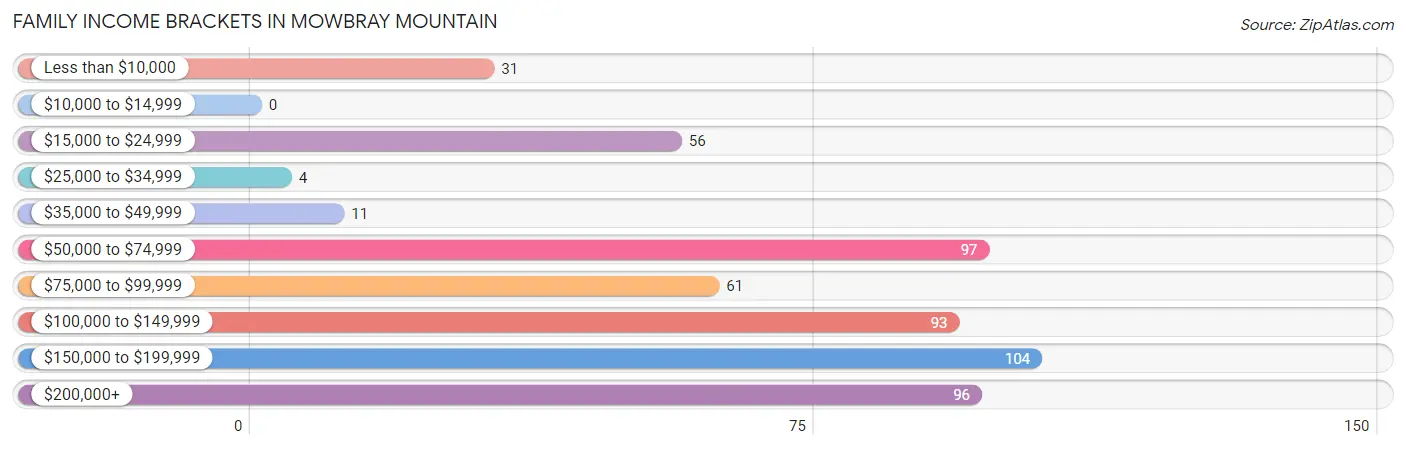
| Income Bracket | # Families | % Families |
| Less than $10,000 | 31 | 5.6% |
| $10,000 to $14,999 | 0 | 0.0% |
| $15,000 to $24,999 | 56 | 10.1% |
| $25,000 to $34,999 | 4 | 0.7% |
| $35,000 to $49,999 | 11 | 2.0% |
| $50,000 to $74,999 | 97 | 17.5% |
| $75,000 to $99,999 | 61 | 11.0% |
| $100,000 to $149,999 | 93 | 16.8% |
| $150,000 to $199,999 | 104 | 18.8% |
| $200,000+ | 96 | 17.4% |
Family Income by Famaliy Size in Mowbray Mountain
4-person families (134 | 24.2%) account for the highest median family income in Mowbray Mountain with $217,957 per family, while 4-person families (134 | 24.2%) have the highest median income of $54,489 per family member.
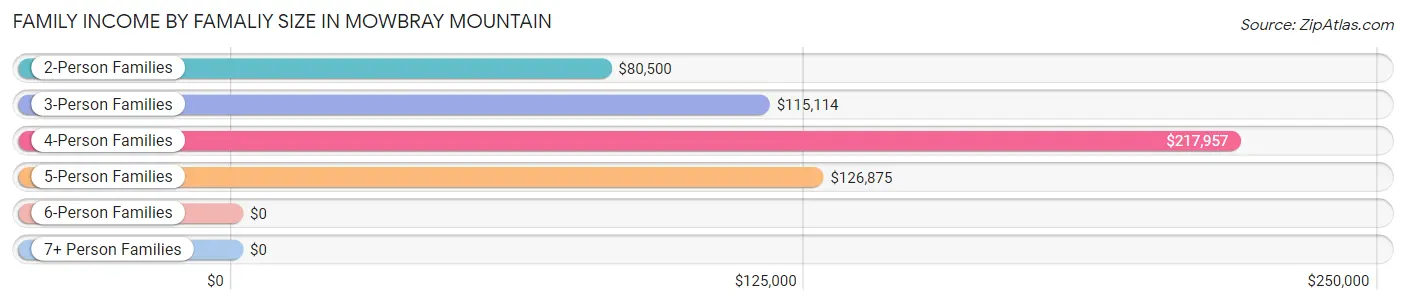
| Income Bracket | # Families | Median Income |
| 2-Person Families | 326 (59.0%) | $80,500 |
| 3-Person Families | 53 (9.6%) | $115,114 |
| 4-Person Families | 134 (24.2%) | $217,957 |
| 5-Person Families | 32 (5.8%) | $126,875 |
| 6-Person Families | 0 (0.0%) | $0 |
| 7+ Person Families | 8 (1.5%) | $0 |
| Total | 553 (100.0%) | $111,118 |
Family Income by Number of Earners in Mowbray Mountain
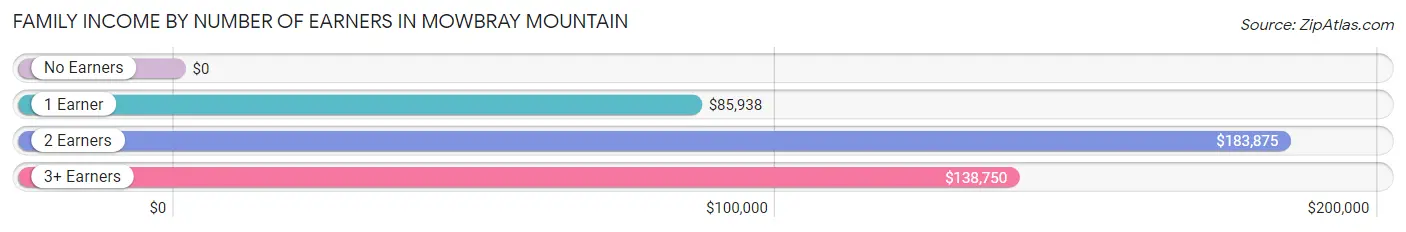
| Number of Earners | # Families | Median Income |
| No Earners | 134 (24.2%) | $0 |
| 1 Earner | 200 (36.2%) | $85,938 |
| 2 Earners | 191 (34.5%) | $183,875 |
| 3+ Earners | 28 (5.1%) | $138,750 |
| Total | 553 (100.0%) | $111,118 |
Household Income in Mowbray Mountain
Household Income Brackets in Mowbray Mountain
With 112 households falling in the category, the $50,000 to $74,999 income range is the most frequent in Mowbray Mountain, accounting for 15.6% of all households. In contrast, only 18 households (2.5%) fall into the less than $10,000 income bracket, making it the least populous group.
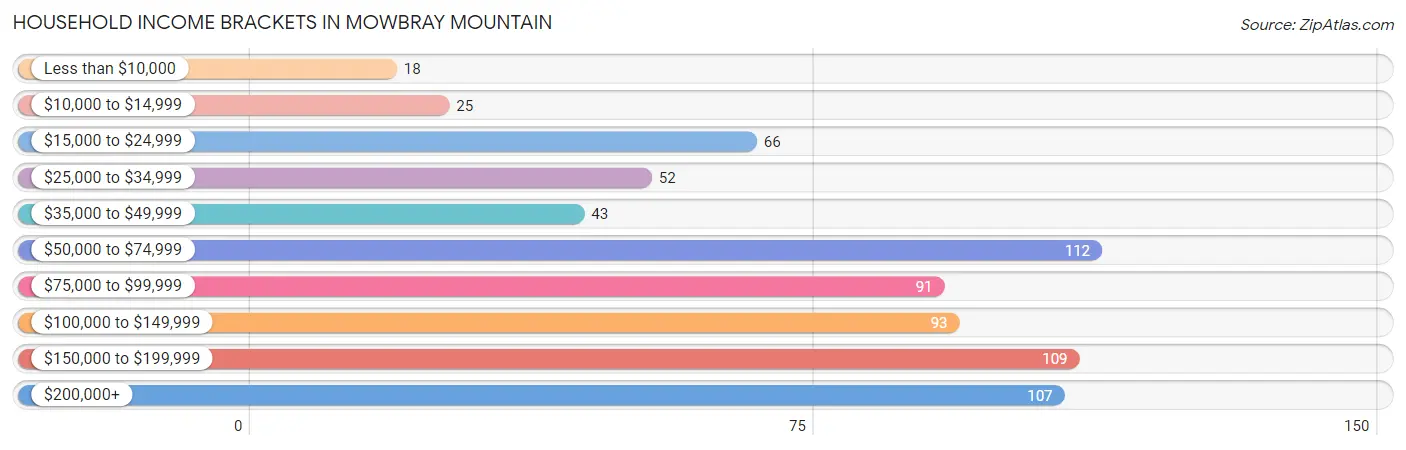
| Income Bracket | # Households | % Households |
| Less than $10,000 | 18 | 2.5% |
| $10,000 to $14,999 | 25 | 3.5% |
| $15,000 to $24,999 | 66 | 9.2% |
| $25,000 to $34,999 | 52 | 7.3% |
| $35,000 to $49,999 | 43 | 6.0% |
| $50,000 to $74,999 | 112 | 15.6% |
| $75,000 to $99,999 | 91 | 12.7% |
| $100,000 to $149,999 | 93 | 13.0% |
| $150,000 to $199,999 | 109 | 15.2% |
| $200,000+ | 107 | 14.9% |
Household Income by Householder Age in Mowbray Mountain
The median household income in Mowbray Mountain is $85,125, with the highest median household income of $95,714 found in the 45 to 64 years age bracket for the primary householder. A total of 464 households (64.8%) fall into this category.
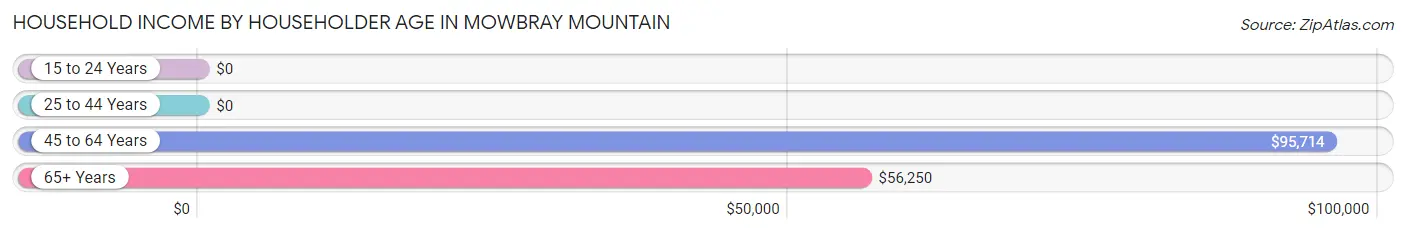
| Income Bracket | # Households | Median Income |
| 15 to 24 Years | 0 (0.0%) | $0 |
| 25 to 44 Years | 78 (10.9%) | $0 |
| 45 to 64 Years | 464 (64.8%) | $95,714 |
| 65+ Years | 174 (24.3%) | $56,250 |
| Total | 716 (100.0%) | $85,125 |
Poverty in Mowbray Mountain
Income Below Poverty by Sex and Age in Mowbray Mountain
With 9.9% poverty level for males and 10.3% for females among the residents of Mowbray Mountain, under 5 year old males and 18 to 24 year old females are the most vulnerable to poverty, with 16 males (44.4%) and 14 females (100.0%) in their respective age groups living below the poverty level.
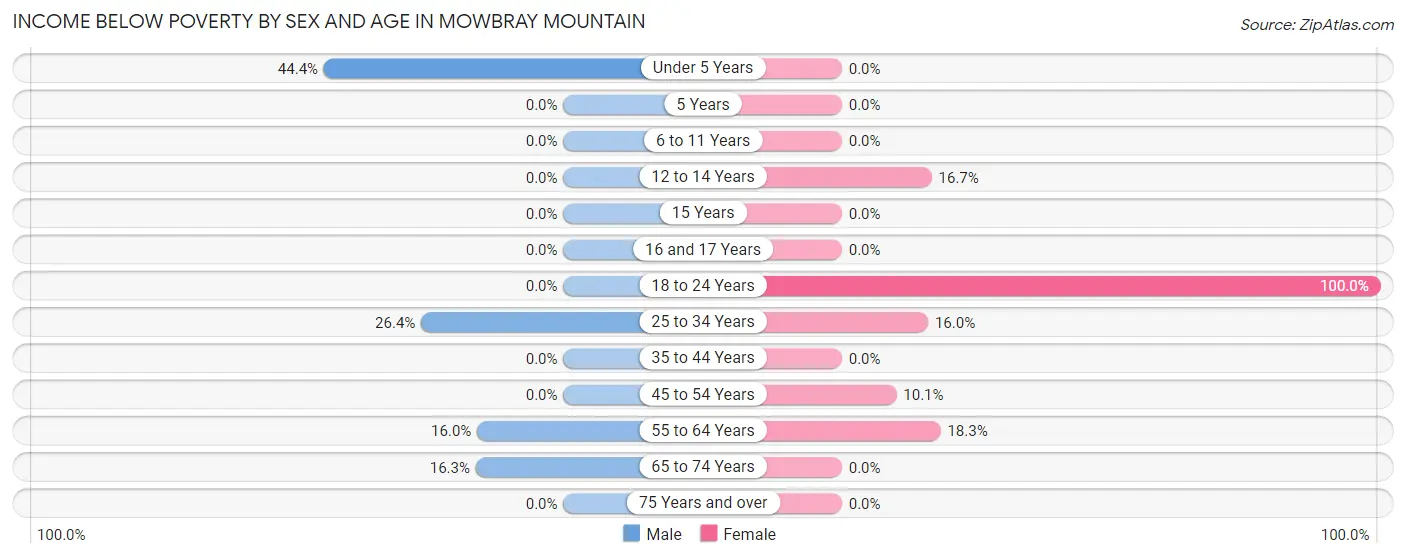
| Age Bracket | Male | Female |
| Under 5 Years | 16 (44.4%) | 0 (0.0%) |
| 5 Years | 0 (0.0%) | 0 (0.0%) |
| 6 to 11 Years | 0 (0.0%) | 0 (0.0%) |
| 12 to 14 Years | 0 (0.0%) | 19 (16.7%) |
| 15 Years | 0 (0.0%) | 0 (0.0%) |
| 16 and 17 Years | 0 (0.0%) | 0 (0.0%) |
| 18 to 24 Years | 0 (0.0%) | 14 (100.0%) |
| 25 to 34 Years | 19 (26.4%) | 8 (16.0%) |
| 35 to 44 Years | 0 (0.0%) | 0 (0.0%) |
| 45 to 54 Years | 0 (0.0%) | 24 (10.1%) |
| 55 to 64 Years | 44 (16.0%) | 35 (18.3%) |
| 65 to 74 Years | 13 (16.3%) | 0 (0.0%) |
| 75 Years and over | 0 (0.0%) | 0 (0.0%) |
| Total | 92 (9.9%) | 100 (10.3%) |
Income Above Poverty by Sex and Age in Mowbray Mountain
According to the poverty statistics in Mowbray Mountain, males aged 6 to 11 years and females aged under 5 years are the age groups that are most secure financially, with 100.0% of males and 100.0% of females in these age groups living above the poverty line.
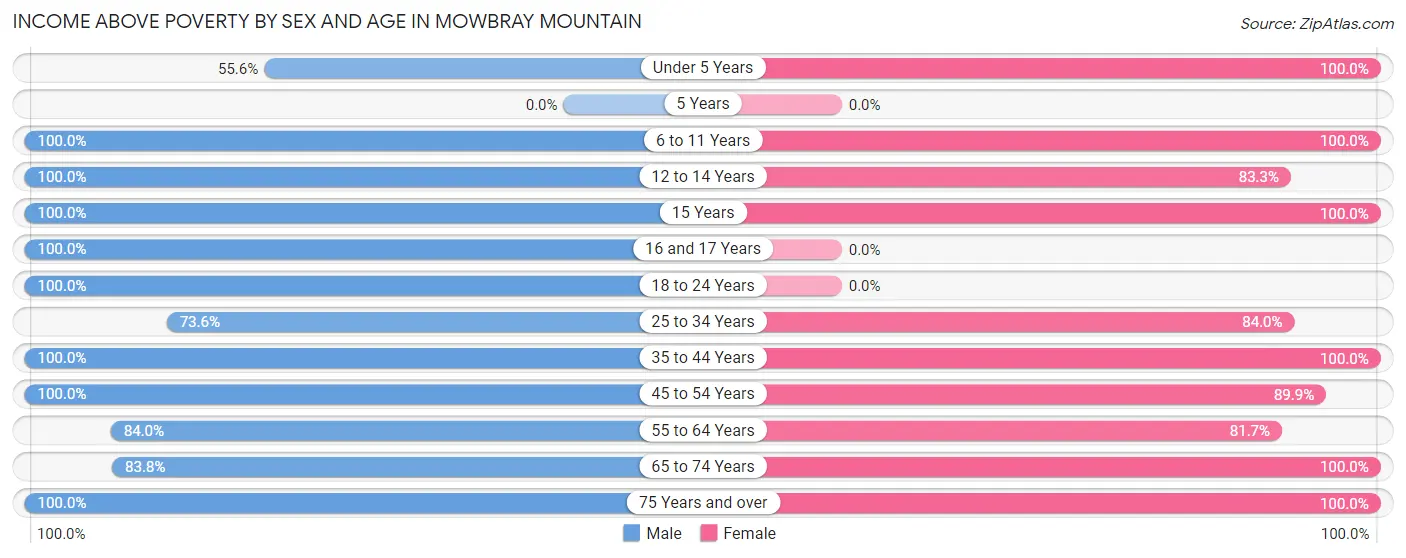
| Age Bracket | Male | Female |
| Under 5 Years | 20 (55.6%) | 17 (100.0%) |
| 5 Years | 0 (0.0%) | 0 (0.0%) |
| 6 to 11 Years | 48 (100.0%) | 86 (100.0%) |
| 12 to 14 Years | 19 (100.0%) | 95 (83.3%) |
| 15 Years | 32 (100.0%) | 8 (100.0%) |
| 16 and 17 Years | 51 (100.0%) | 0 (0.0%) |
| 18 to 24 Years | 58 (100.0%) | 0 (0.0%) |
| 25 to 34 Years | 53 (73.6%) | 42 (84.0%) |
| 35 to 44 Years | 28 (100.0%) | 100 (100.0%) |
| 45 to 54 Years | 165 (100.0%) | 213 (89.9%) |
| 55 to 64 Years | 231 (84.0%) | 156 (81.7%) |
| 65 to 74 Years | 67 (83.8%) | 92 (100.0%) |
| 75 Years and over | 65 (100.0%) | 64 (100.0%) |
| Total | 837 (90.1%) | 873 (89.7%) |
Income Below Poverty Among Married-Couple Families in Mowbray Mountain
The poverty statistics for married-couple families in Mowbray Mountain show that 3.6% or 17 of the total 478 families live below the poverty line. Families with no children have the highest poverty rate of 5.8%, comprising of 17 families. On the other hand, families with 1 or 2 children have the lowest poverty rate of 0.0%, which includes 0 families.
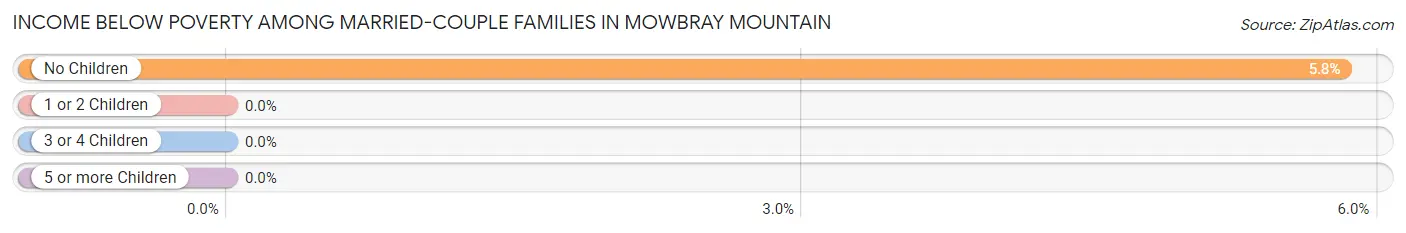
| Children | Above Poverty | Below Poverty |
| No Children | 275 (94.2%) | 17 (5.8%) |
| 1 or 2 Children | 174 (100.0%) | 0 (0.0%) |
| 3 or 4 Children | 7 (100.0%) | 0 (0.0%) |
| 5 or more Children | 5 (100.0%) | 0 (0.0%) |
| Total | 461 (96.4%) | 17 (3.6%) |
Income Below Poverty Among Single-Parent Households in Mowbray Mountain
According to the poverty data in Mowbray Mountain, 66.7% or 18 single-father households and 14.6% or 7 single-mother households are living below the poverty line. Among single-father households, those with 1 or 2 children have the highest poverty rate, with 18 households (66.7%) experiencing poverty. Likewise, among single-mother households, those with 1 or 2 children have the highest poverty rate, with 7 households (38.9%) falling below the poverty line.
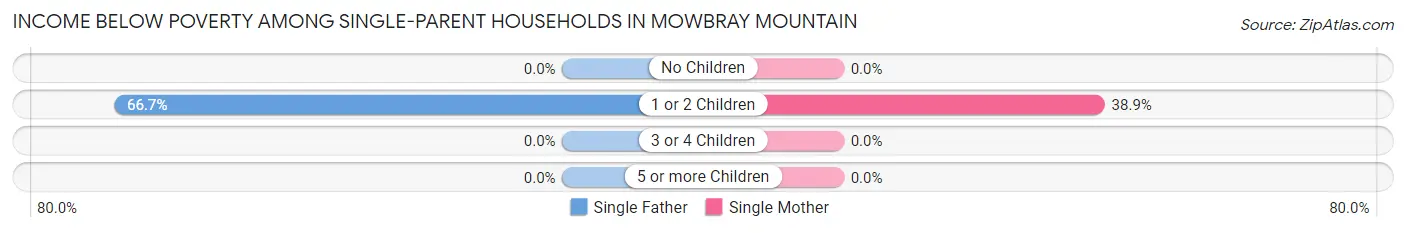
| Children | Single Father | Single Mother |
| No Children | 0 (0.0%) | 0 (0.0%) |
| 1 or 2 Children | 18 (66.7%) | 7 (38.9%) |
| 3 or 4 Children | 0 (0.0%) | 0 (0.0%) |
| 5 or more Children | 0 (0.0%) | 0 (0.0%) |
| Total | 18 (66.7%) | 7 (14.6%) |
Income Below Poverty Among Married-Couple vs Single-Parent Households in Mowbray Mountain
The poverty data for Mowbray Mountain shows that 17 of the married-couple family households (3.6%) and 25 of the single-parent households (33.3%) are living below the poverty level. Within the married-couple family households, those with no children have the highest poverty rate, with 17 households (5.8%) falling below the poverty line. Among the single-parent households, those with 1 or 2 children have the highest poverty rate, with 25 household (55.6%) living below poverty.
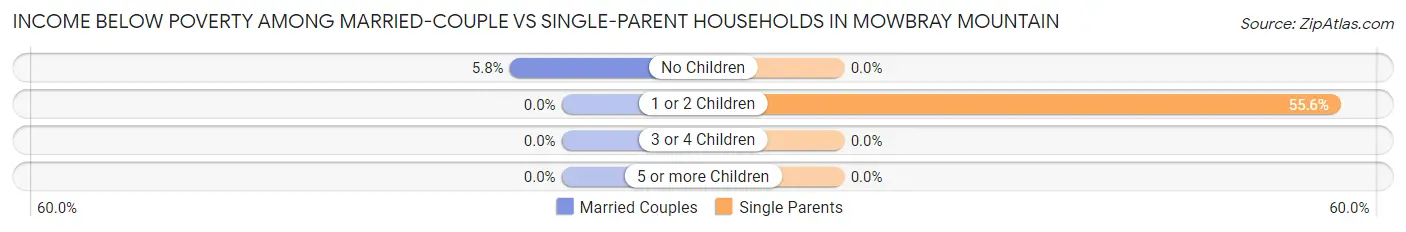
| Children | Married-Couple Families | Single-Parent Households |
| No Children | 17 (5.8%) | 0 (0.0%) |
| 1 or 2 Children | 0 (0.0%) | 25 (55.6%) |
| 3 or 4 Children | 0 (0.0%) | 0 (0.0%) |
| 5 or more Children | 0 (0.0%) | 0 (0.0%) |
| Total | 17 (3.6%) | 25 (33.3%) |
Employment Characteristics in Mowbray Mountain
Employment by Class of Employer in Mowbray Mountain
Among the 812 employed individuals in Mowbray Mountain, private company employees (654 | 80.5%), local government employees (53 | 6.5%), and not-for-profit organizations (44 | 5.4%) make up the most common classes of employment.
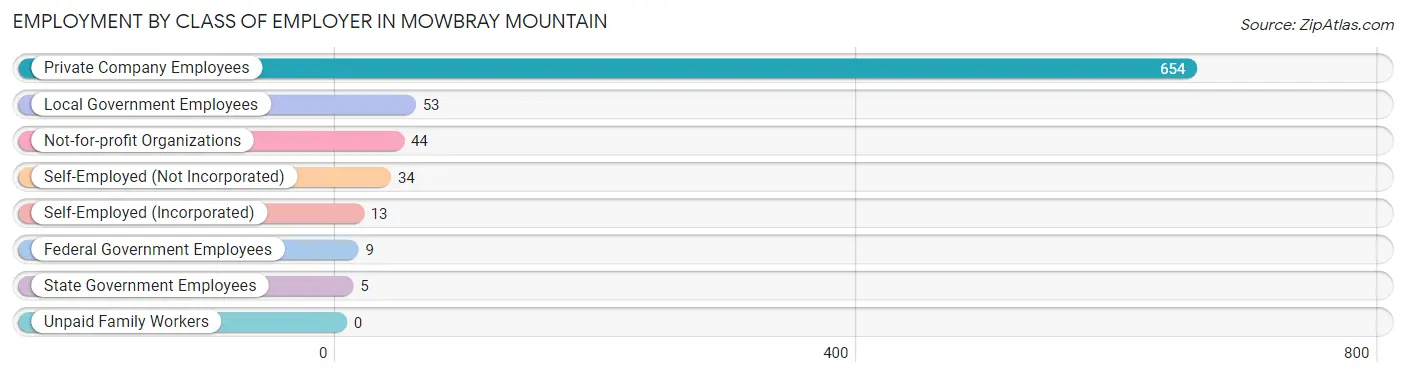
| Employer Class | # Employees | % Employees |
| Private Company Employees | 654 | 80.5% |
| Self-Employed (Incorporated) | 13 | 1.6% |
| Self-Employed (Not Incorporated) | 34 | 4.2% |
| Not-for-profit Organizations | 44 | 5.4% |
| Local Government Employees | 53 | 6.5% |
| State Government Employees | 5 | 0.6% |
| Federal Government Employees | 9 | 1.1% |
| Unpaid Family Workers | 0 | 0.0% |
| Total | 812 | 100.0% |
Employment Status by Age in Mowbray Mountain
According to the labor force statistics for Mowbray Mountain, out of the total population over 16 years of age (1,542), 57.3% or 884 individuals are in the labor force, with 2.6% or 23 of them unemployed. The age group with the highest labor force participation rate is 20 to 24 years, with 100.0% or 39 individuals in the labor force. Within the labor force, the 25 to 29 years age range has the highest percentage of unemployed individuals, with 38.1% or 8 of them being unemployed.
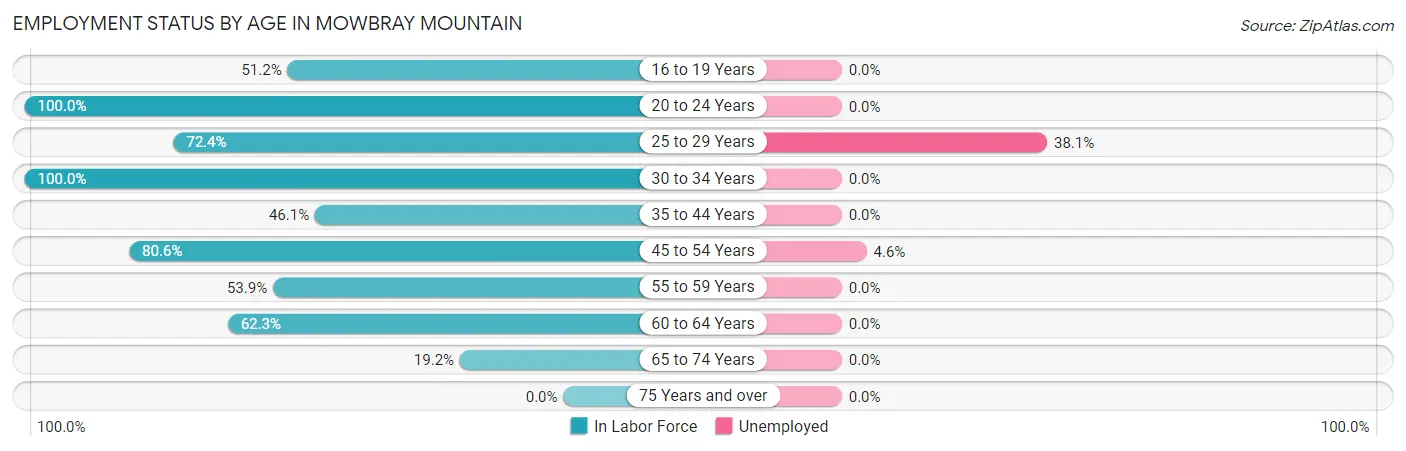
| Age Bracket | In Labor Force | Unemployed |
| 16 to 19 Years | 43 (51.2%) | 0 (0.0%) |
| 20 to 24 Years | 39 (100.0%) | 0 (0.0%) |
| 25 to 29 Years | 21 (72.4%) | 8 (38.1%) |
| 30 to 34 Years | 93 (100.0%) | 0 (0.0%) |
| 35 to 44 Years | 59 (46.1%) | 0 (0.0%) |
| 45 to 54 Years | 324 (80.6%) | 15 (4.6%) |
| 55 to 59 Years | 118 (53.9%) | 0 (0.0%) |
| 60 to 64 Years | 154 (62.3%) | 0 (0.0%) |
| 65 to 74 Years | 33 (19.2%) | 0 (0.0%) |
| 75 Years and over | 0 (0.0%) | 0 (0.0%) |
| Total | 884 (57.3%) | 23 (2.6%) |
Employment Status by Educational Attainment in Mowbray Mountain
According to labor force statistics for Mowbray Mountain, 68.8% of individuals (769) out of the total population between 25 and 64 years of age (1,118) are in the labor force, with 3.0% or 23 of them being unemployed. The group with the highest labor force participation rate are those with the educational attainment of bachelor's degree or higher, with 78.5% or 310 individuals in the labor force. Within the labor force, individuals with less than high school education have the highest percentage of unemployment, with 20.3% or 16 of them being unemployed.
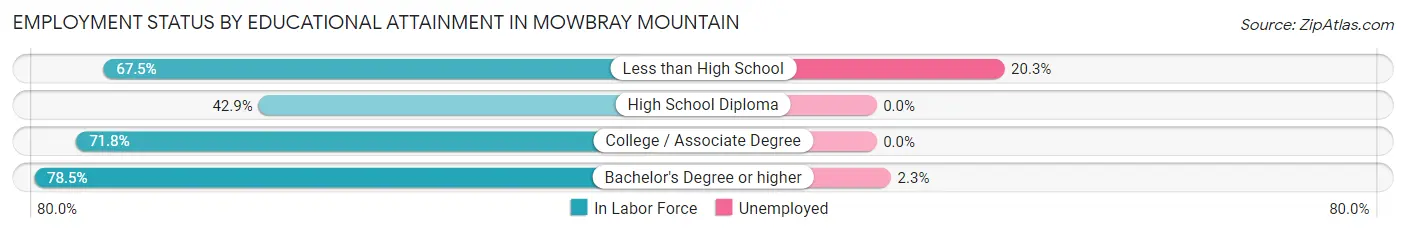
| Educational Attainment | In Labor Force | Unemployed |
| Less than High School | 79 (67.5%) | 24 (20.3%) |
| High School Diploma | 82 (42.9%) | 0 (0.0%) |
| College / Associate Degree | 298 (71.8%) | 0 (0.0%) |
| Bachelor's Degree or higher | 310 (78.5%) | 9 (2.3%) |
| Total | 769 (68.8%) | 34 (3.0%) |
Employment Occupations by Sex in Mowbray Mountain
Management, Business, Science and Arts Occupations
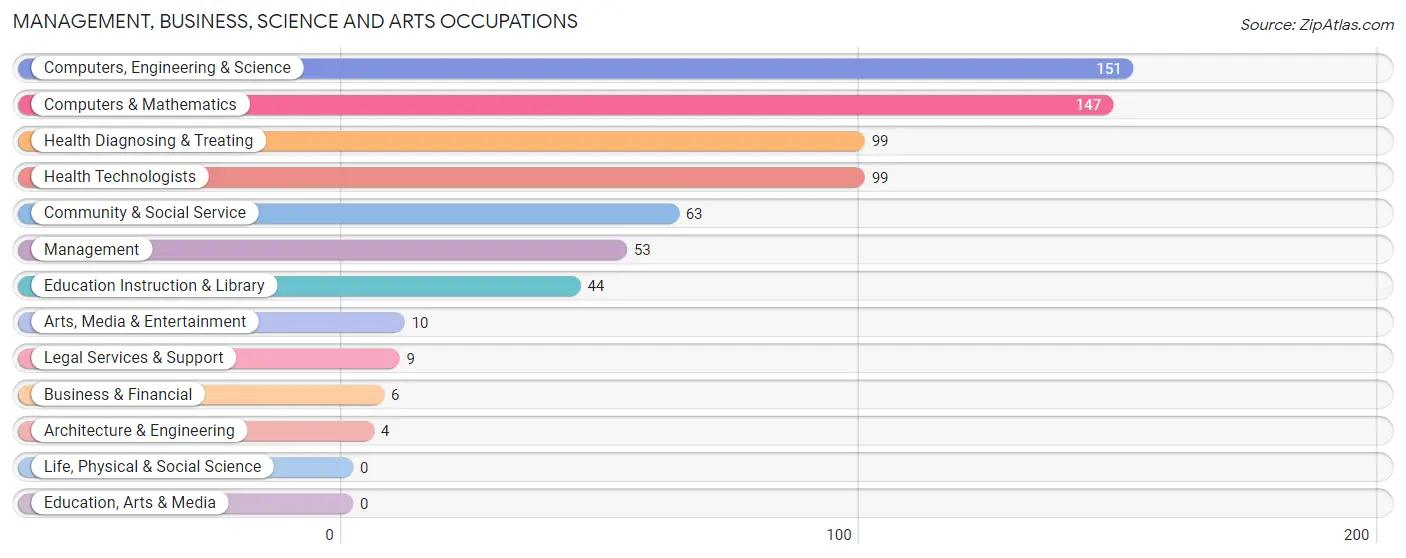
The most common Management, Business, Science and Arts occupations in Mowbray Mountain are Computers, Engineering & Science (151 | 17.5%), Computers & Mathematics (147 | 17.1%), Health Diagnosing & Treating (99 | 11.5%), Health Technologists (99 | 11.5%), and Community & Social Service (63 | 7.3%).
Management, Business, Science and Arts Occupations by Sex
Within the Management, Business, Science and Arts occupations in Mowbray Mountain, the most male-oriented occupations are Business & Financial (100.0%), Architecture & Engineering (100.0%), and Legal Services & Support (100.0%), while the most female-oriented occupations are Health Diagnosing & Treating (100.0%), Health Technologists (100.0%), and Education Instruction & Library (65.9%).
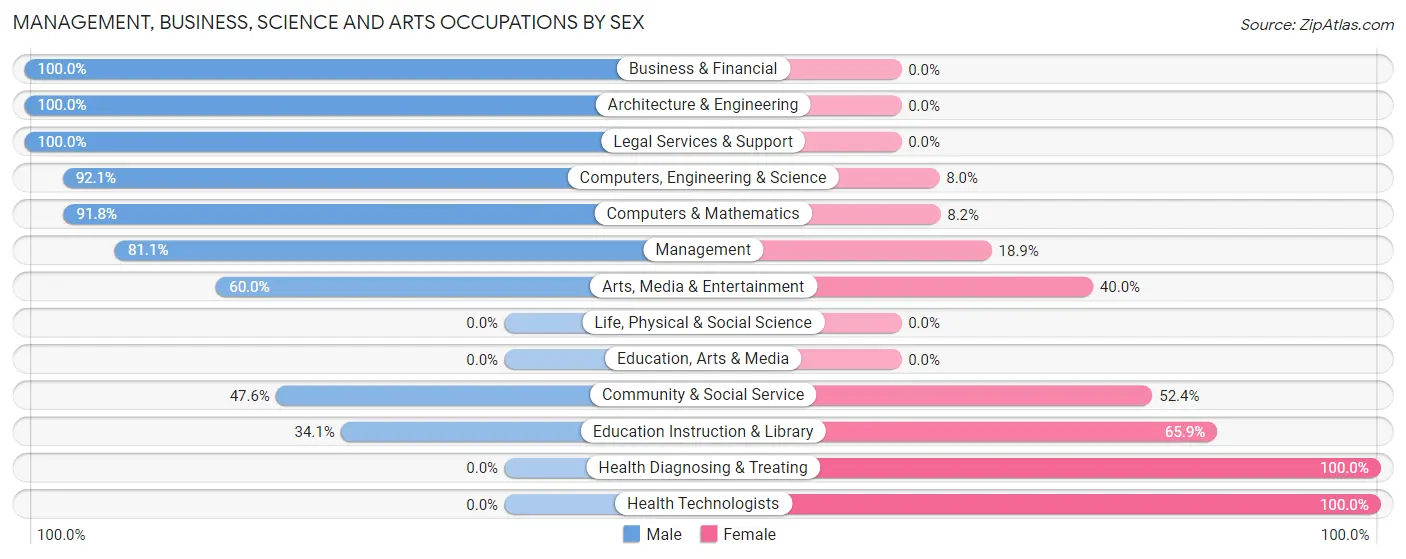
| Occupation | Male | Female |
| Management | 43 (81.1%) | 10 (18.9%) |
| Business & Financial | 6 (100.0%) | 0 (0.0%) |
| Computers, Engineering & Science | 139 (92.0%) | 12 (8.0%) |
| Computers & Mathematics | 135 (91.8%) | 12 (8.2%) |
| Architecture & Engineering | 4 (100.0%) | 0 (0.0%) |
| Life, Physical & Social Science | 0 (0.0%) | 0 (0.0%) |
| Community & Social Service | 30 (47.6%) | 33 (52.4%) |
| Education, Arts & Media | 0 (0.0%) | 0 (0.0%) |
| Legal Services & Support | 9 (100.0%) | 0 (0.0%) |
| Education Instruction & Library | 15 (34.1%) | 29 (65.9%) |
| Arts, Media & Entertainment | 6 (60.0%) | 4 (40.0%) |
| Health Diagnosing & Treating | 0 (0.0%) | 99 (100.0%) |
| Health Technologists | 0 (0.0%) | 99 (100.0%) |
| Total (Category) | 218 (58.6%) | 154 (41.4%) |
| Total (Overall) | 530 (61.6%) | 331 (38.4%) |
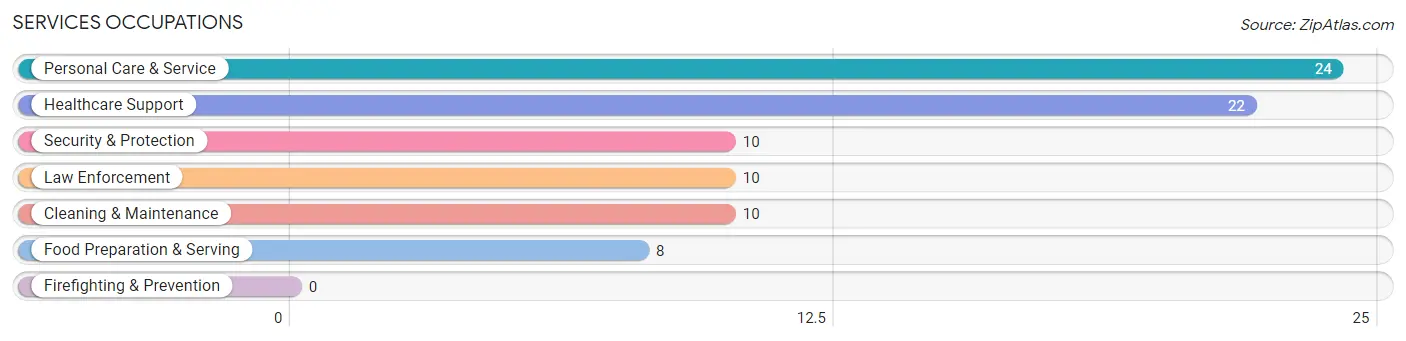
Services Occupations
The most common Services occupations in Mowbray Mountain are Personal Care & Service (24 | 2.8%), Healthcare Support (22 | 2.6%), Security & Protection (10 | 1.2%), Law Enforcement (10 | 1.2%), and Cleaning & Maintenance (10 | 1.2%).
Services Occupations by Sex
Within the Services occupations in Mowbray Mountain, the most male-oriented occupations are Security & Protection (100.0%), Law Enforcement (100.0%), and Food Preparation & Serving (100.0%), while the most female-oriented occupations are Healthcare Support (100.0%), and Cleaning & Maintenance (100.0%).
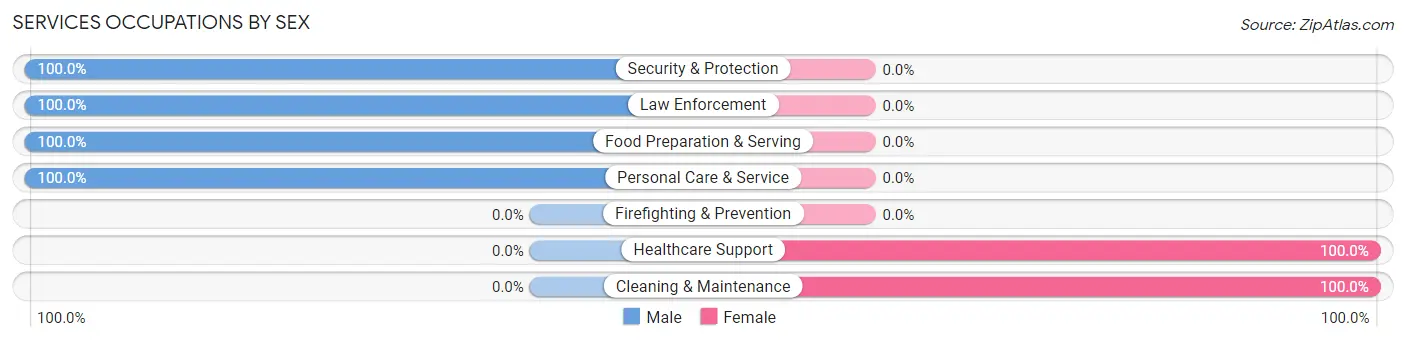
| Occupation | Male | Female |
| Healthcare Support | 0 (0.0%) | 22 (100.0%) |
| Security & Protection | 10 (100.0%) | 0 (0.0%) |
| Firefighting & Prevention | 0 (0.0%) | 0 (0.0%) |
| Law Enforcement | 10 (100.0%) | 0 (0.0%) |
| Food Preparation & Serving | 8 (100.0%) | 0 (0.0%) |
| Cleaning & Maintenance | 0 (0.0%) | 10 (100.0%) |
| Personal Care & Service | 24 (100.0%) | 0 (0.0%) |
| Total (Category) | 42 (56.8%) | 32 (43.2%) |
| Total (Overall) | 530 (61.6%) | 331 (38.4%) |
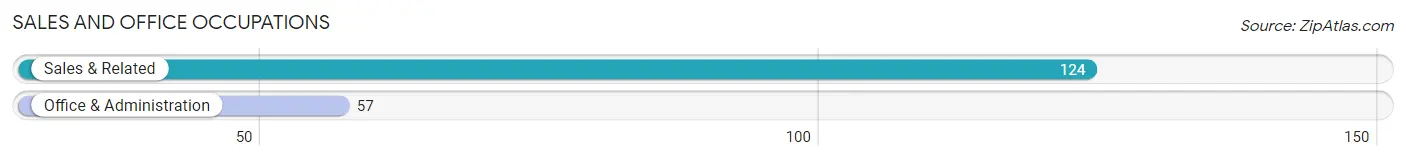
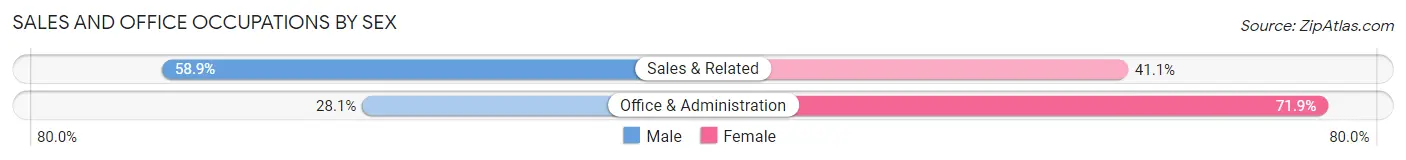
Sales and Office Occupations
The most common Sales and Office occupations in Mowbray Mountain are Sales & Related (124 | 14.4%), and Office & Administration (57 | 6.6%).
Sales and Office Occupations by Sex
| Occupation | Male | Female |
| Sales & Related | 73 (58.9%) | 51 (41.1%) |
| Office & Administration | 16 (28.1%) | 41 (71.9%) |
| Total (Category) | 89 (49.2%) | 92 (50.8%) |
| Total (Overall) | 530 (61.6%) | 331 (38.4%) |
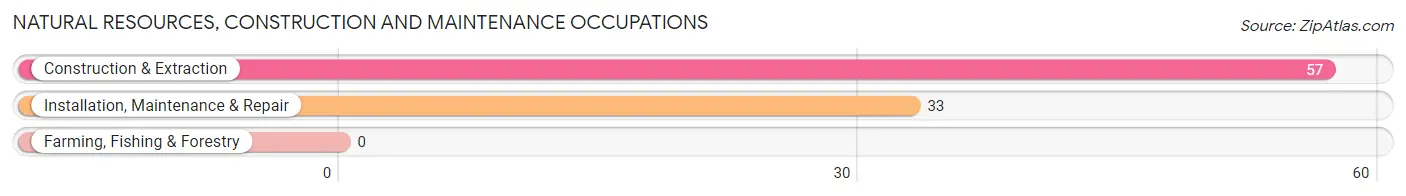
Natural Resources, Construction and Maintenance Occupations
The most common Natural Resources, Construction and Maintenance occupations in Mowbray Mountain are Construction & Extraction (57 | 6.6%), and Installation, Maintenance & Repair (33 | 3.8%).
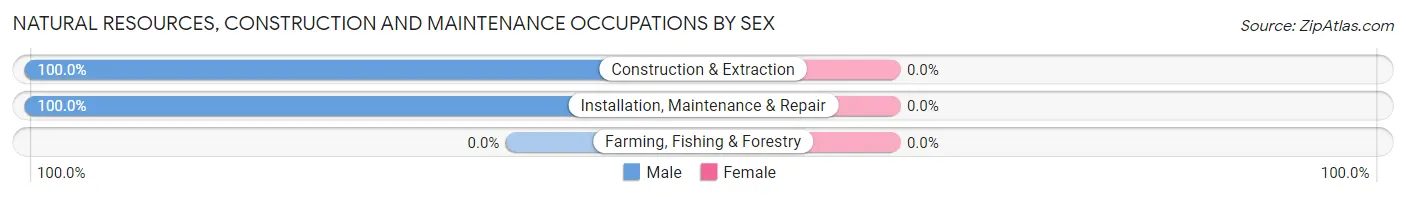
Natural Resources, Construction and Maintenance Occupations by Sex
| Occupation | Male | Female |
| Farming, Fishing & Forestry | 0 (0.0%) | 0 (0.0%) |
| Construction & Extraction | 57 (100.0%) | 0 (0.0%) |
| Installation, Maintenance & Repair | 33 (100.0%) | 0 (0.0%) |
| Total (Category) | 90 (100.0%) | 0 (0.0%) |
| Total (Overall) | 530 (61.6%) | 331 (38.4%) |
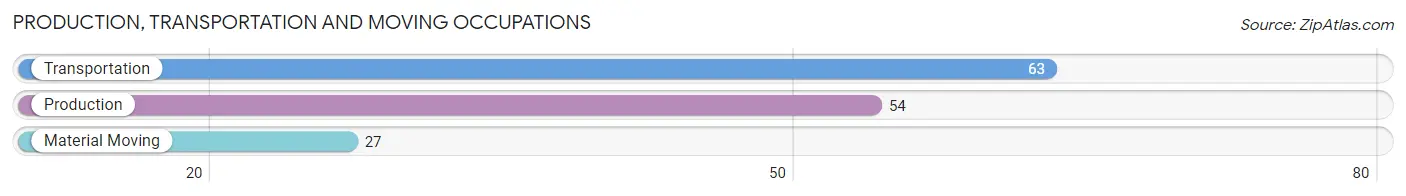
Production, Transportation and Moving Occupations
The most common Production, Transportation and Moving occupations in Mowbray Mountain are Transportation (63 | 7.3%), Production (54 | 6.3%), and Material Moving (27 | 3.1%).
Production, Transportation and Moving Occupations by Sex
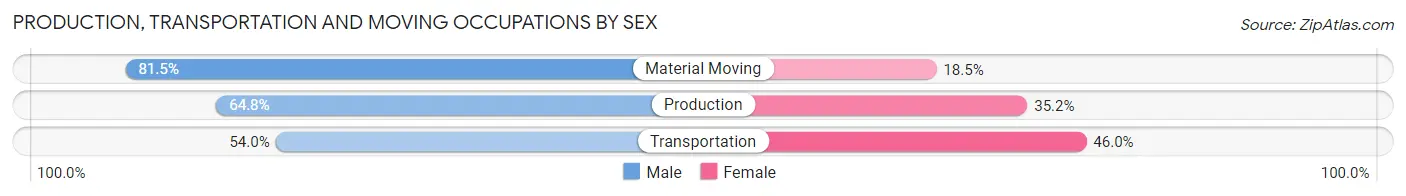
| Occupation | Male | Female |
| Production | 35 (64.8%) | 19 (35.2%) |
| Transportation | 34 (54.0%) | 29 (46.0%) |
| Material Moving | 22 (81.5%) | 5 (18.5%) |
| Total (Category) | 91 (63.2%) | 53 (36.8%) |
| Total (Overall) | 530 (61.6%) | 331 (38.4%) |
Employment Industries by Sex in Mowbray Mountain
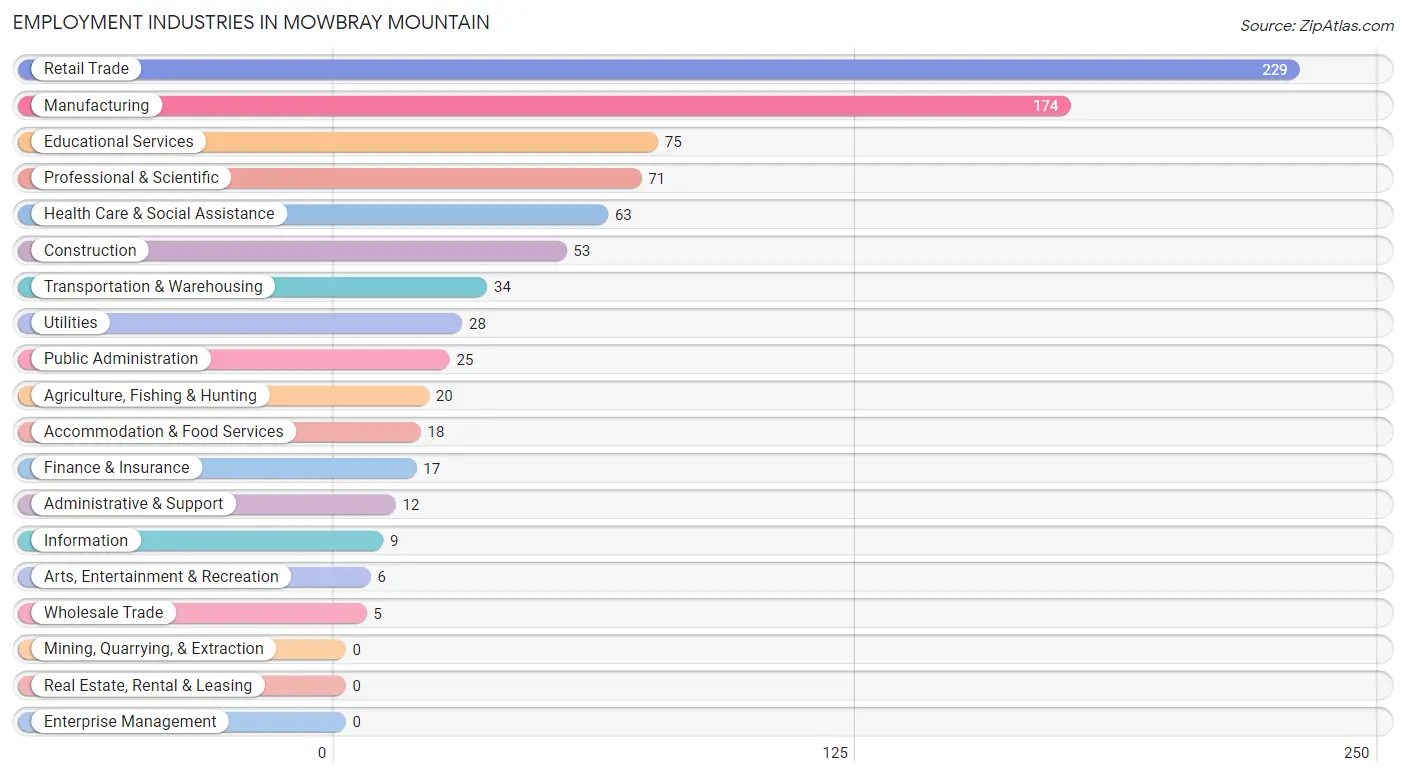
Employment Industries in Mowbray Mountain
The major employment industries in Mowbray Mountain include Retail Trade (229 | 26.6%), Manufacturing (174 | 20.2%), Educational Services (75 | 8.7%), Professional & Scientific (71 | 8.3%), and Health Care & Social Assistance (63 | 7.3%).
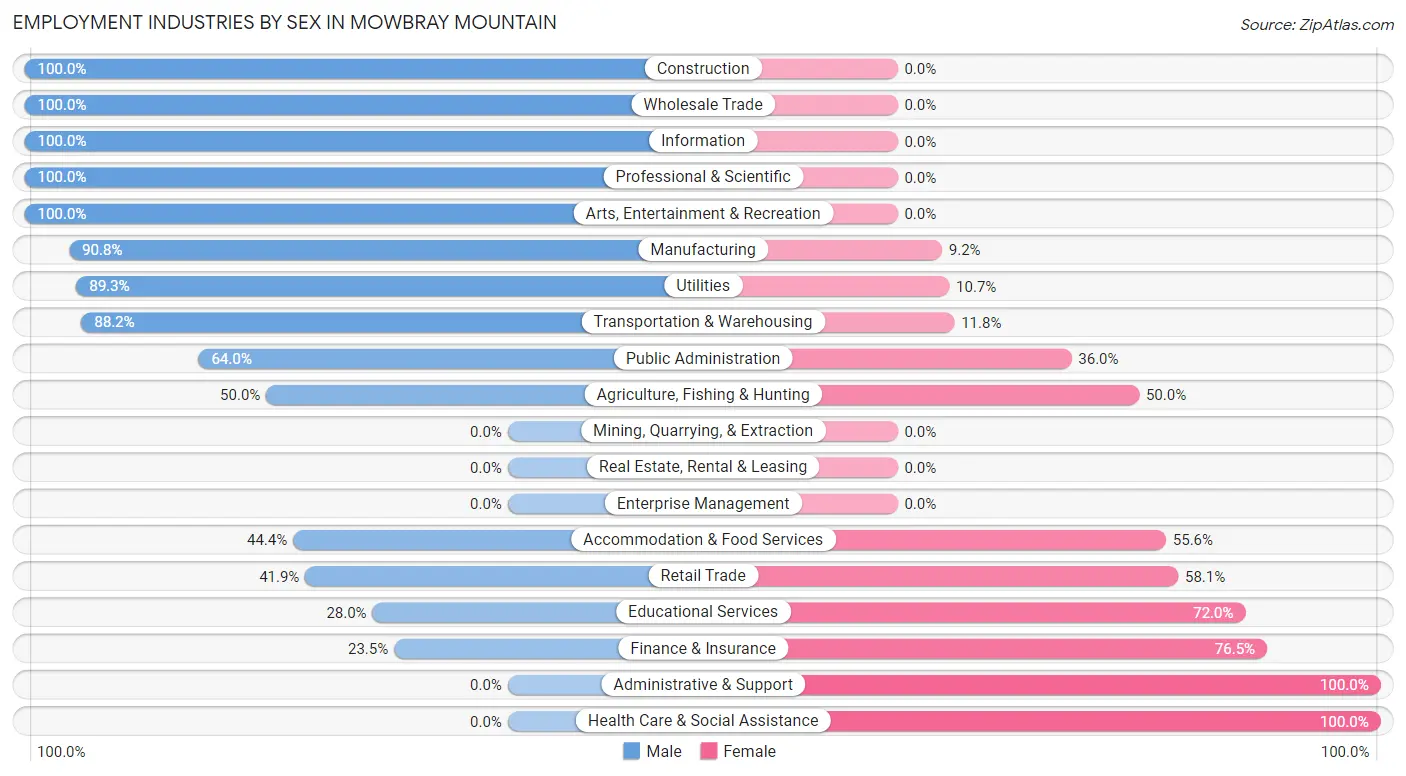
Employment Industries by Sex in Mowbray Mountain
The Mowbray Mountain industries that see more men than women are Construction (100.0%), Wholesale Trade (100.0%), and Information (100.0%), whereas the industries that tend to have a higher number of women are Administrative & Support (100.0%), Health Care & Social Assistance (100.0%), and Finance & Insurance (76.5%).
| Industry | Male | Female |
| Agriculture, Fishing & Hunting | 10 (50.0%) | 10 (50.0%) |
| Mining, Quarrying, & Extraction | 0 (0.0%) | 0 (0.0%) |
| Construction | 53 (100.0%) | 0 (0.0%) |
| Manufacturing | 158 (90.8%) | 16 (9.2%) |
| Wholesale Trade | 5 (100.0%) | 0 (0.0%) |
| Retail Trade | 96 (41.9%) | 133 (58.1%) |
| Transportation & Warehousing | 30 (88.2%) | 4 (11.8%) |
| Utilities | 25 (89.3%) | 3 (10.7%) |
| Information | 9 (100.0%) | 0 (0.0%) |
| Finance & Insurance | 4 (23.5%) | 13 (76.5%) |
| Real Estate, Rental & Leasing | 0 (0.0%) | 0 (0.0%) |
| Professional & Scientific | 71 (100.0%) | 0 (0.0%) |
| Enterprise Management | 0 (0.0%) | 0 (0.0%) |
| Administrative & Support | 0 (0.0%) | 12 (100.0%) |
| Educational Services | 21 (28.0%) | 54 (72.0%) |
| Health Care & Social Assistance | 0 (0.0%) | 63 (100.0%) |
| Arts, Entertainment & Recreation | 6 (100.0%) | 0 (0.0%) |
| Accommodation & Food Services | 8 (44.4%) | 10 (55.6%) |
| Public Administration | 16 (64.0%) | 9 (36.0%) |
| Total | 530 (61.6%) | 331 (38.4%) |
Education in Mowbray Mountain
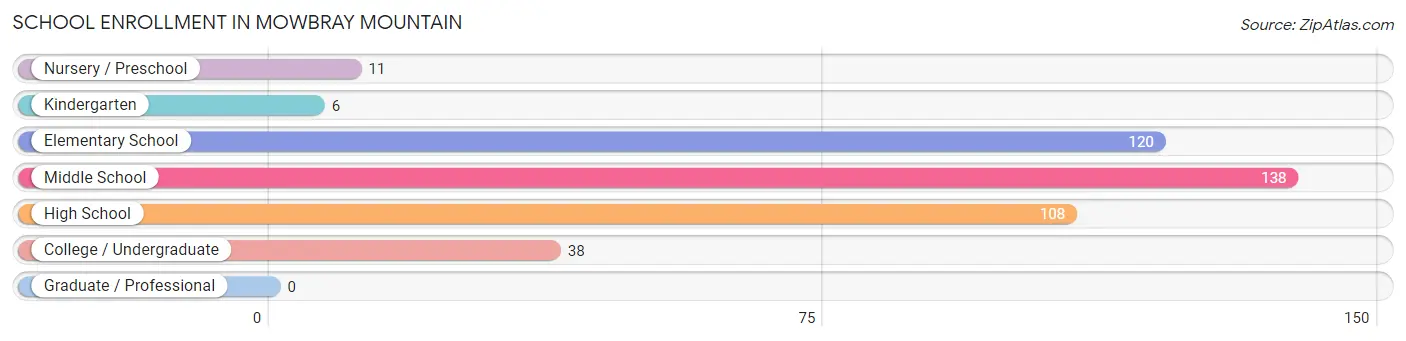
School Enrollment in Mowbray Mountain
The most common levels of schooling among the 421 students in Mowbray Mountain are middle school (138 | 32.8%), elementary school (120 | 28.5%), and high school (108 | 25.7%).
| School Level | # Students | % Students |
| Nursery / Preschool | 11 | 2.6% |
| Kindergarten | 6 | 1.4% |
| Elementary School | 120 | 28.5% |
| Middle School | 138 | 32.8% |
| High School | 108 | 25.7% |
| College / Undergraduate | 38 | 9.0% |
| Graduate / Professional | 0 | 0.0% |
| Total | 421 | 100.0% |
School Enrollment by Age by Funding Source in Mowbray Mountain
Out of a total of 421 students who are enrolled in schools in Mowbray Mountain, 202 (48.0%) attend a private institution, while the remaining 219 (52.0%) are enrolled in public schools. The age group of 5 to 9 year old has the highest likelihood of being enrolled in private schools, with 84 (76.4% in the age bracket) enrolled. Conversely, the age group of 3 to 4 year olds has the lowest likelihood of being enrolled in a private school, with 8 (100.0% in the age bracket) attending a public institution.
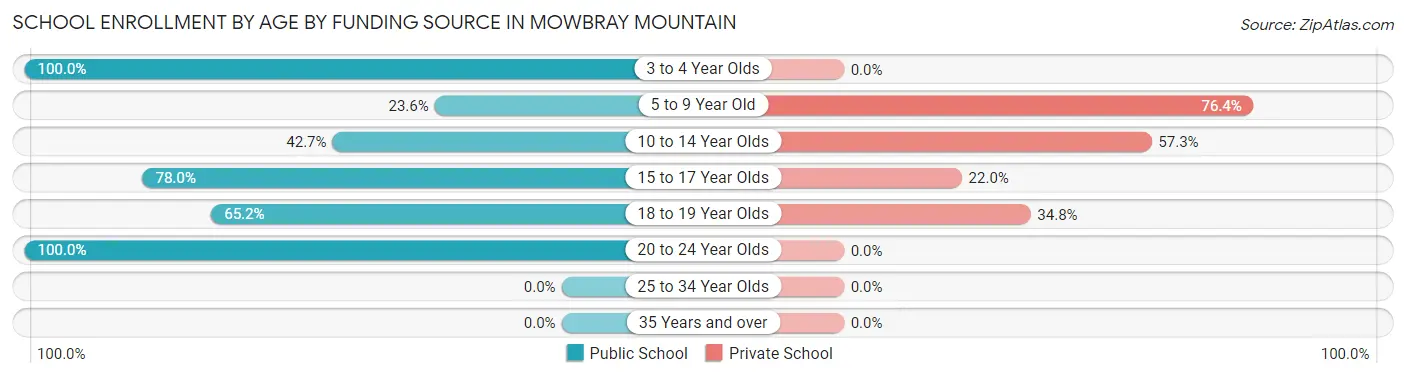
| Age Bracket | Public School | Private School |
| 3 to 4 Year Olds | 8 (100.0%) | 0 (0.0%) |
| 5 to 9 Year Old | 26 (23.6%) | 84 (76.4%) |
| 10 to 14 Year Olds | 67 (42.7%) | 90 (57.3%) |
| 15 to 17 Year Olds | 71 (78.0%) | 20 (22.0%) |
| 18 to 19 Year Olds | 15 (65.2%) | 8 (34.8%) |
| 20 to 24 Year Olds | 32 (100.0%) | 0 (0.0%) |
| 25 to 34 Year Olds | 0 (0.0%) | 0 (0.0%) |
| 35 Years and over | 0 (0.0%) | 0 (0.0%) |
| Total | 219 (52.0%) | 202 (48.0%) |
Educational Attainment by Field of Study in Mowbray Mountain
Business (156 | 29.4%), science & technology (139 | 26.2%), computers & mathematics (60 | 11.3%), education (46 | 8.7%), and engineering (40 | 7.5%) are the most common fields of study among 530 individuals in Mowbray Mountain who have obtained a bachelor's degree or higher.
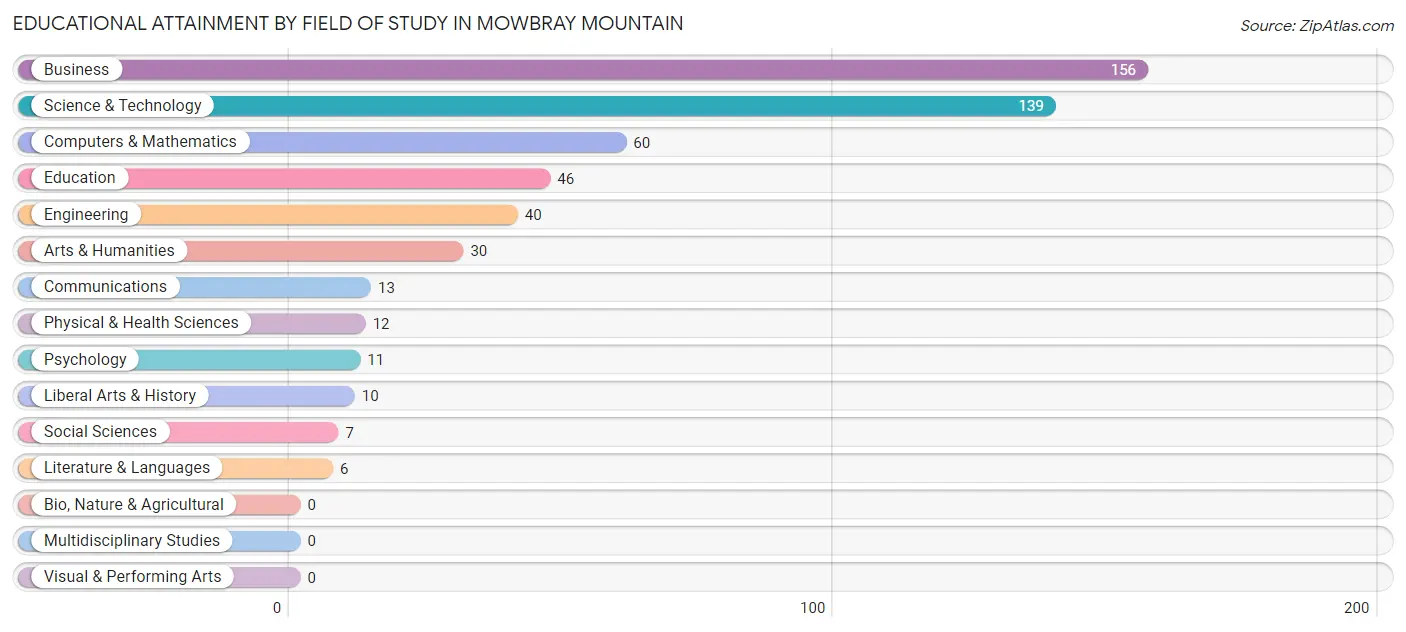
| Field of Study | # Graduates | % Graduates |
| Computers & Mathematics | 60 | 11.3% |
| Bio, Nature & Agricultural | 0 | 0.0% |
| Physical & Health Sciences | 12 | 2.3% |
| Psychology | 11 | 2.1% |
| Social Sciences | 7 | 1.3% |
| Engineering | 40 | 7.5% |
| Multidisciplinary Studies | 0 | 0.0% |
| Science & Technology | 139 | 26.2% |
| Business | 156 | 29.4% |
| Education | 46 | 8.7% |
| Literature & Languages | 6 | 1.1% |
| Liberal Arts & History | 10 | 1.9% |
| Visual & Performing Arts | 0 | 0.0% |
| Communications | 13 | 2.5% |
| Arts & Humanities | 30 | 5.7% |
| Total | 530 | 100.0% |
Transportation & Commute in Mowbray Mountain
Vehicle Availability by Sex in Mowbray Mountain
The most prevalent vehicle ownership categories in Mowbray Mountain are males with 2 vehicles (227, accounting for 46.9%) and females with 2 vehicles (188, making up 69.2%).
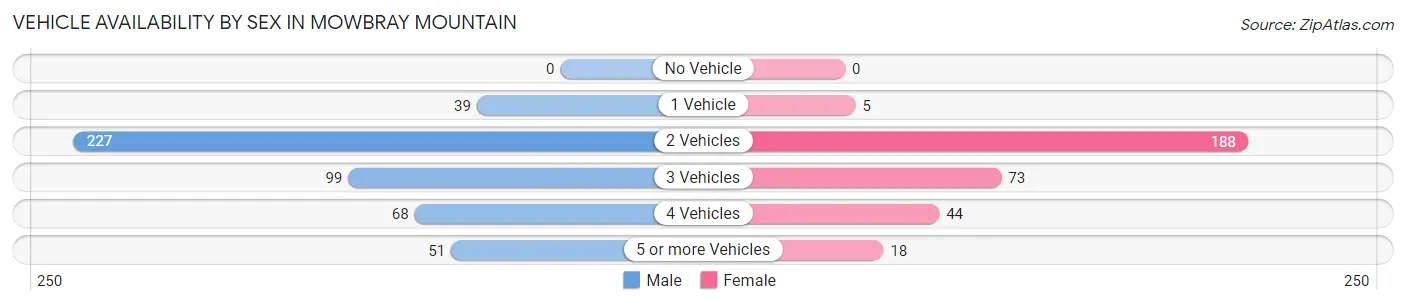
| Vehicles Available | Male | Female |
| No Vehicle | 0 (0.0%) | 0 (0.0%) |
| 1 Vehicle | 39 (8.1%) | 5 (1.5%) |
| 2 Vehicles | 227 (46.9%) | 188 (57.3%) |
| 3 Vehicles | 99 (20.4%) | 73 (22.3%) |
| 4 Vehicles | 68 (14.1%) | 44 (13.4%) |
| 5 or more Vehicles | 51 (10.5%) | 18 (5.5%) |
| Total | 484 (100.0%) | 328 (100.0%) |
Commute Time in Mowbray Mountain
The most frequently occuring commute durations in Mowbray Mountain are 30 to 34 minutes (284 commuters, 39.5%), 40 to 44 minutes (128 commuters, 17.8%), and 45 to 59 minutes (70 commuters, 9.7%).
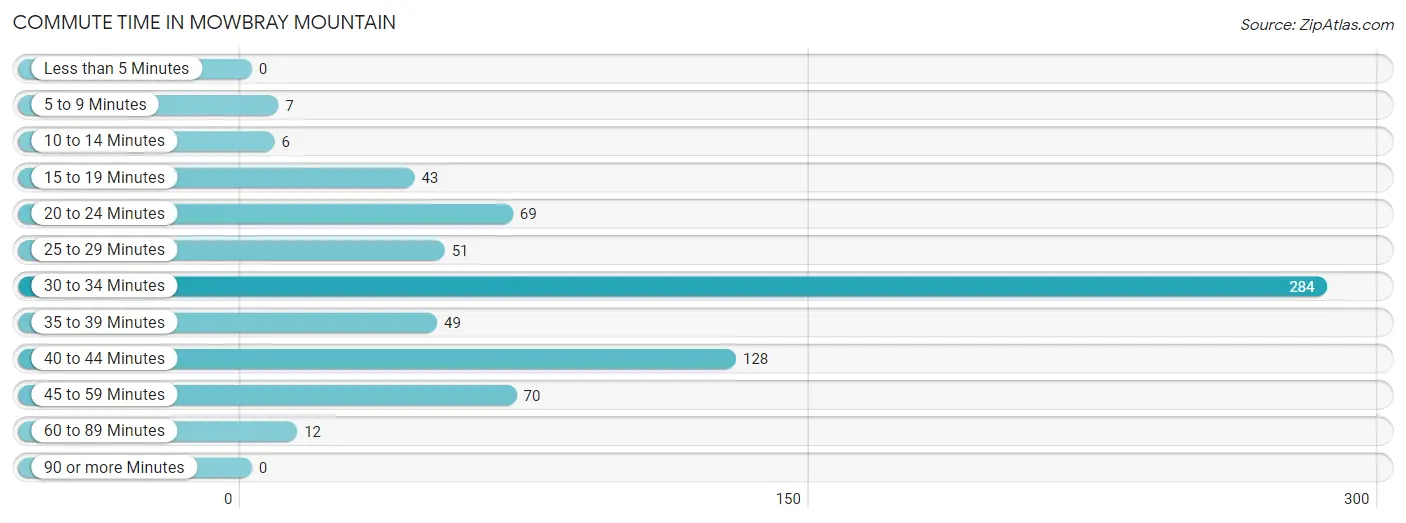
| Commute Time | # Commuters | % Commuters |
| Less than 5 Minutes | 0 | 0.0% |
| 5 to 9 Minutes | 7 | 1.0% |
| 10 to 14 Minutes | 6 | 0.8% |
| 15 to 19 Minutes | 43 | 6.0% |
| 20 to 24 Minutes | 69 | 9.6% |
| 25 to 29 Minutes | 51 | 7.1% |
| 30 to 34 Minutes | 284 | 39.5% |
| 35 to 39 Minutes | 49 | 6.8% |
| 40 to 44 Minutes | 128 | 17.8% |
| 45 to 59 Minutes | 70 | 9.7% |
| 60 to 89 Minutes | 12 | 1.7% |
| 90 or more Minutes | 0 | 0.0% |
Commute Time by Sex in Mowbray Mountain
The most common commute times in Mowbray Mountain are 30 to 34 minutes (148 commuters, 35.6%) for males and 30 to 34 minutes (136 commuters, 44.9%) for females.
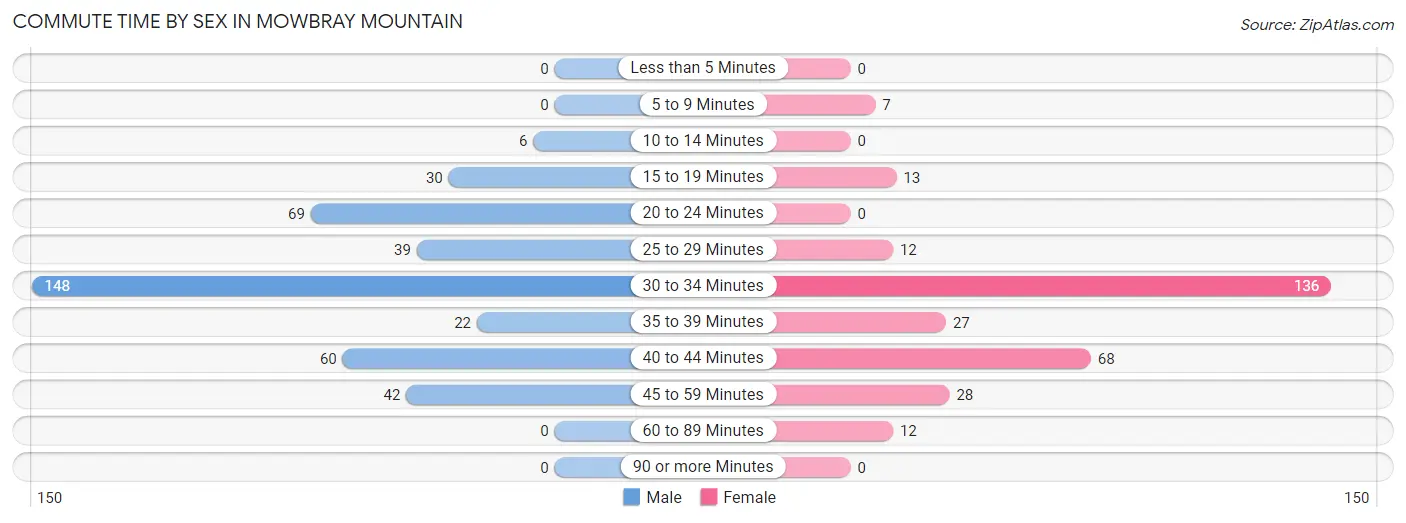
| Commute Time | Male | Female |
| Less than 5 Minutes | 0 (0.0%) | 0 (0.0%) |
| 5 to 9 Minutes | 0 (0.0%) | 7 (2.3%) |
| 10 to 14 Minutes | 6 (1.4%) | 0 (0.0%) |
| 15 to 19 Minutes | 30 (7.2%) | 13 (4.3%) |
| 20 to 24 Minutes | 69 (16.6%) | 0 (0.0%) |
| 25 to 29 Minutes | 39 (9.4%) | 12 (4.0%) |
| 30 to 34 Minutes | 148 (35.6%) | 136 (44.9%) |
| 35 to 39 Minutes | 22 (5.3%) | 27 (8.9%) |
| 40 to 44 Minutes | 60 (14.4%) | 68 (22.4%) |
| 45 to 59 Minutes | 42 (10.1%) | 28 (9.2%) |
| 60 to 89 Minutes | 0 (0.0%) | 12 (4.0%) |
| 90 or more Minutes | 0 (0.0%) | 0 (0.0%) |
Time of Departure to Work by Sex in Mowbray Mountain
The most frequent times of departure to work in Mowbray Mountain are 7:00 AM to 7:29 AM (93, 22.4%) for males and 7:30 AM to 7:59 AM (88, 29.0%) for females.
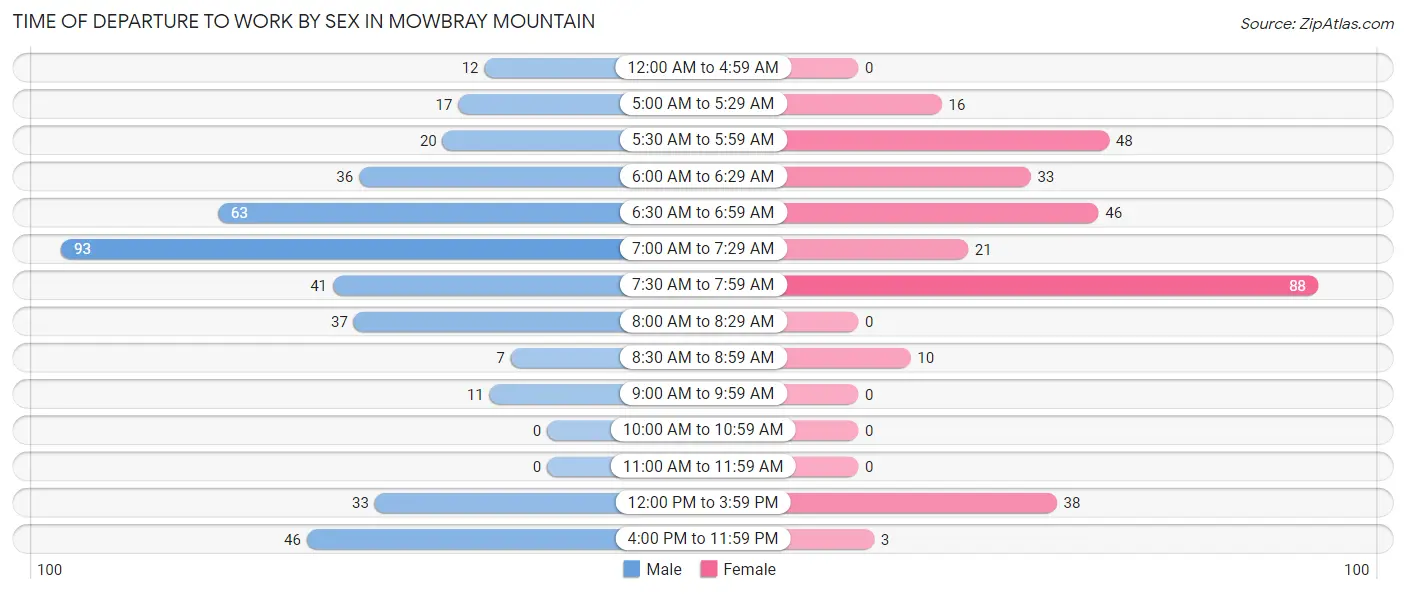
| Time of Departure | Male | Female |
| 12:00 AM to 4:59 AM | 12 (2.9%) | 0 (0.0%) |
| 5:00 AM to 5:29 AM | 17 (4.1%) | 16 (5.3%) |
| 5:30 AM to 5:59 AM | 20 (4.8%) | 48 (15.8%) |
| 6:00 AM to 6:29 AM | 36 (8.6%) | 33 (10.9%) |
| 6:30 AM to 6:59 AM | 63 (15.1%) | 46 (15.2%) |
| 7:00 AM to 7:29 AM | 93 (22.4%) | 21 (6.9%) |
| 7:30 AM to 7:59 AM | 41 (9.9%) | 88 (29.0%) |
| 8:00 AM to 8:29 AM | 37 (8.9%) | 0 (0.0%) |
| 8:30 AM to 8:59 AM | 7 (1.7%) | 10 (3.3%) |
| 9:00 AM to 9:59 AM | 11 (2.6%) | 0 (0.0%) |
| 10:00 AM to 10:59 AM | 0 (0.0%) | 0 (0.0%) |
| 11:00 AM to 11:59 AM | 0 (0.0%) | 0 (0.0%) |
| 12:00 PM to 3:59 PM | 33 (7.9%) | 38 (12.5%) |
| 4:00 PM to 11:59 PM | 46 (11.1%) | 3 (1.0%) |
| Total | 416 (100.0%) | 303 (100.0%) |
Housing Occupancy in Mowbray Mountain
Occupancy by Ownership in Mowbray Mountain
Of the total 716 dwellings in Mowbray Mountain, owner-occupied units account for 646 (90.2%), while renter-occupied units make up 70 (9.8%).
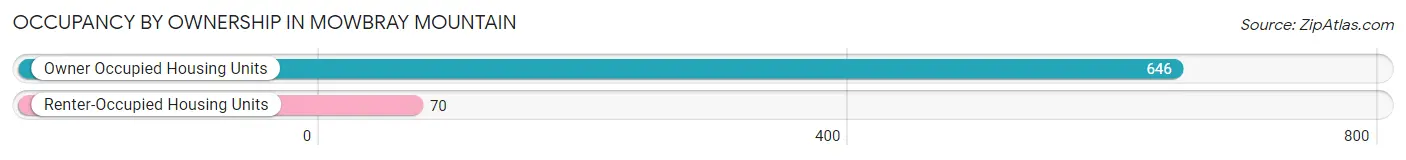
| Occupancy | # Housing Units | % Housing Units |
| Owner Occupied Housing Units | 646 | 90.2% |
| Renter-Occupied Housing Units | 70 | 9.8% |
| Total Occupied Housing Units | 716 | 100.0% |
Occupancy by Household Size in Mowbray Mountain
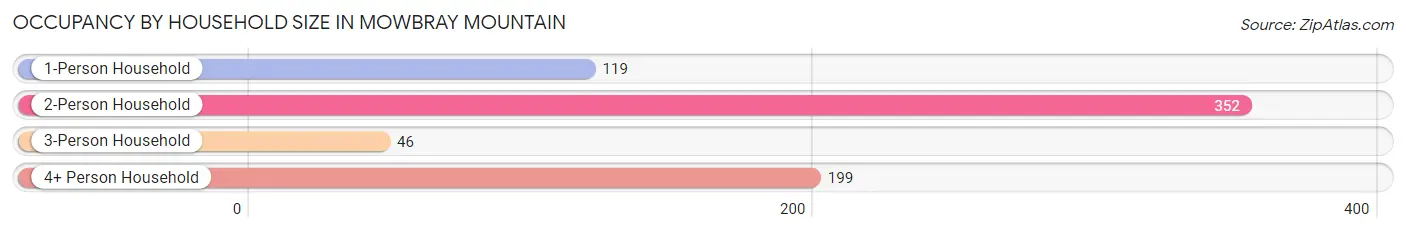
| Household Size | # Housing Units | % Housing Units |
| 1-Person Household | 119 | 16.6% |
| 2-Person Household | 352 | 49.2% |
| 3-Person Household | 46 | 6.4% |
| 4+ Person Household | 199 | 27.8% |
| Total Housing Units | 716 | 100.0% |
Occupancy by Ownership by Household Size in Mowbray Mountain
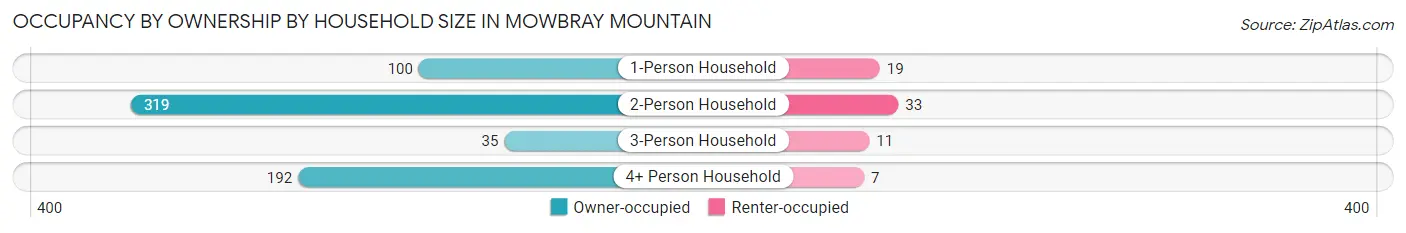
| Household Size | Owner-occupied | Renter-occupied |
| 1-Person Household | 100 (84.0%) | 19 (16.0%) |
| 2-Person Household | 319 (90.6%) | 33 (9.4%) |
| 3-Person Household | 35 (76.1%) | 11 (23.9%) |
| 4+ Person Household | 192 (96.5%) | 7 (3.5%) |
| Total Housing Units | 646 (90.2%) | 70 (9.8%) |
Occupancy by Educational Attainment in Mowbray Mountain
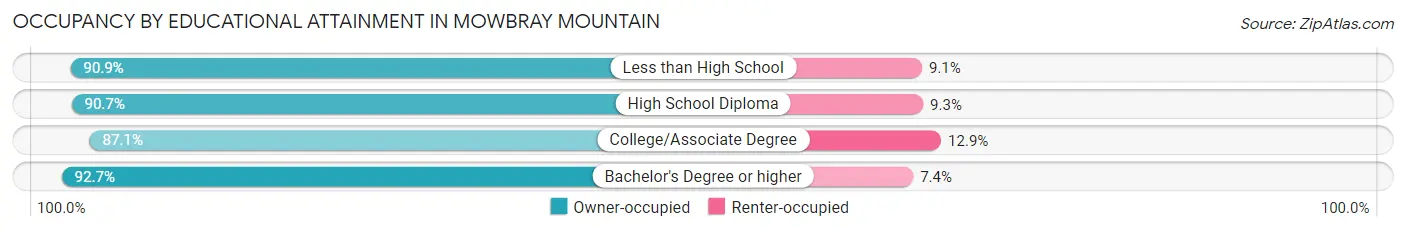
| Household Size | Owner-occupied | Renter-occupied |
| Less than High School | 70 (90.9%) | 7 (9.1%) |
| High School Diploma | 146 (90.7%) | 15 (9.3%) |
| College/Associate Degree | 203 (87.1%) | 30 (12.9%) |
| Bachelor's Degree or higher | 227 (92.6%) | 18 (7.3%) |
Occupancy by Age of Householder in Mowbray Mountain
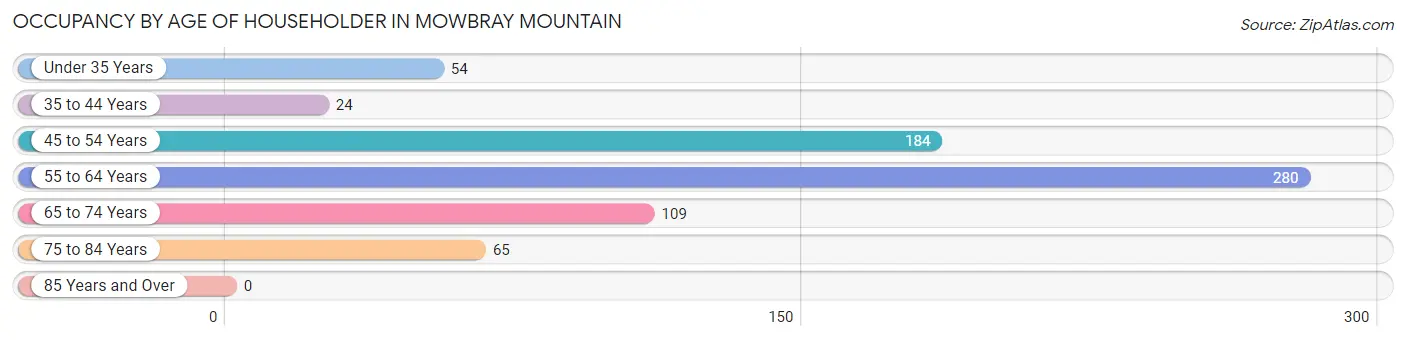
| Age Bracket | # Households | % Households |
| Under 35 Years | 54 | 7.5% |
| 35 to 44 Years | 24 | 3.4% |
| 45 to 54 Years | 184 | 25.7% |
| 55 to 64 Years | 280 | 39.1% |
| 65 to 74 Years | 109 | 15.2% |
| 75 to 84 Years | 65 | 9.1% |
| 85 Years and Over | 0 | 0.0% |
| Total | 716 | 100.0% |
Housing Finances in Mowbray Mountain
Median Income by Occupancy in Mowbray Mountain
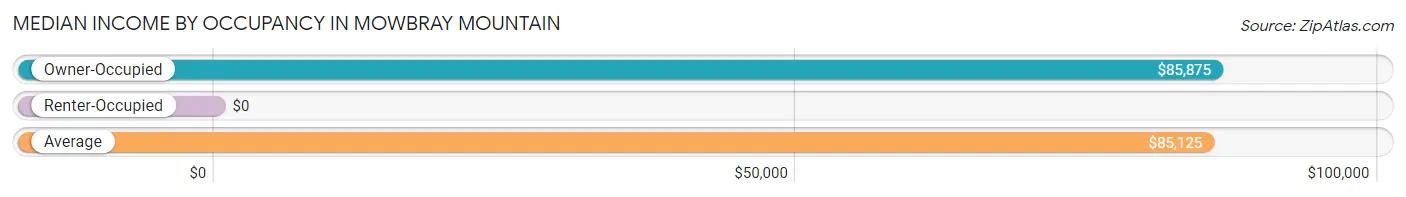
| Occupancy Type | # Households | Median Income |
| Owner-Occupied | 646 (90.2%) | $85,875 |
| Renter-Occupied | 70 (9.8%) | $0 |
| Average | 716 (100.0%) | $85,125 |
Occupancy by Householder Income Bracket in Mowbray Mountain
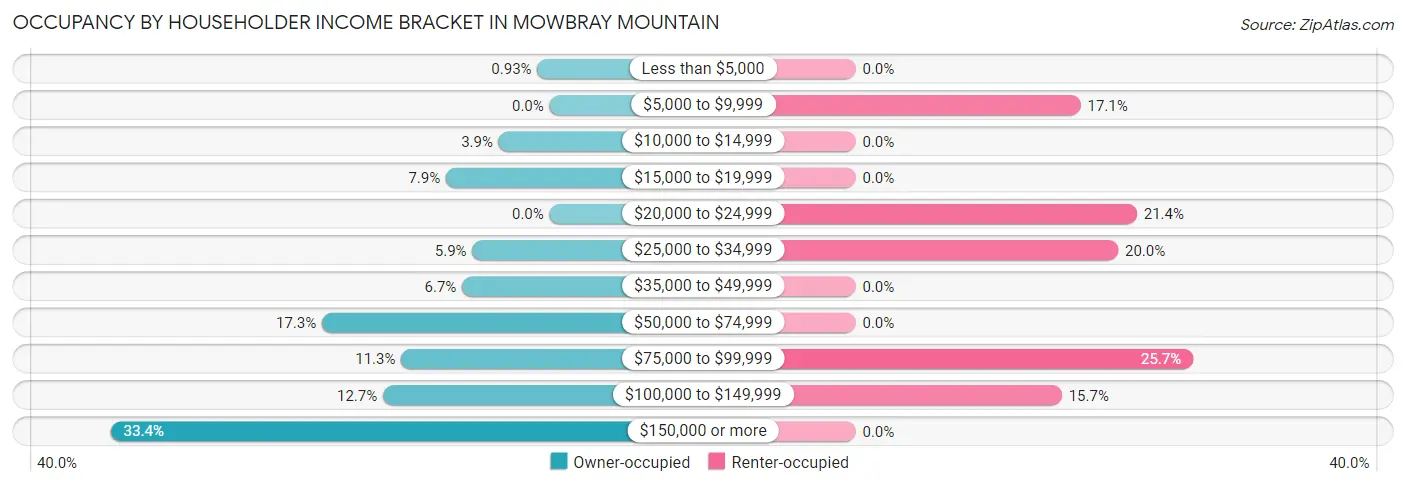
| Income Bracket | Owner-occupied | Renter-occupied |
| Less than $5,000 | 6 (0.9%) | 0 (0.0%) |
| $5,000 to $9,999 | 0 (0.0%) | 12 (17.1%) |
| $10,000 to $14,999 | 25 (3.9%) | 0 (0.0%) |
| $15,000 to $19,999 | 51 (7.9%) | 0 (0.0%) |
| $20,000 to $24,999 | 0 (0.0%) | 15 (21.4%) |
| $25,000 to $34,999 | 38 (5.9%) | 14 (20.0%) |
| $35,000 to $49,999 | 43 (6.7%) | 0 (0.0%) |
| $50,000 to $74,999 | 112 (17.3%) | 0 (0.0%) |
| $75,000 to $99,999 | 73 (11.3%) | 18 (25.7%) |
| $100,000 to $149,999 | 82 (12.7%) | 11 (15.7%) |
| $150,000 or more | 216 (33.4%) | 0 (0.0%) |
| Total | 646 (100.0%) | 70 (100.0%) |
Monthly Housing Cost Tiers in Mowbray Mountain
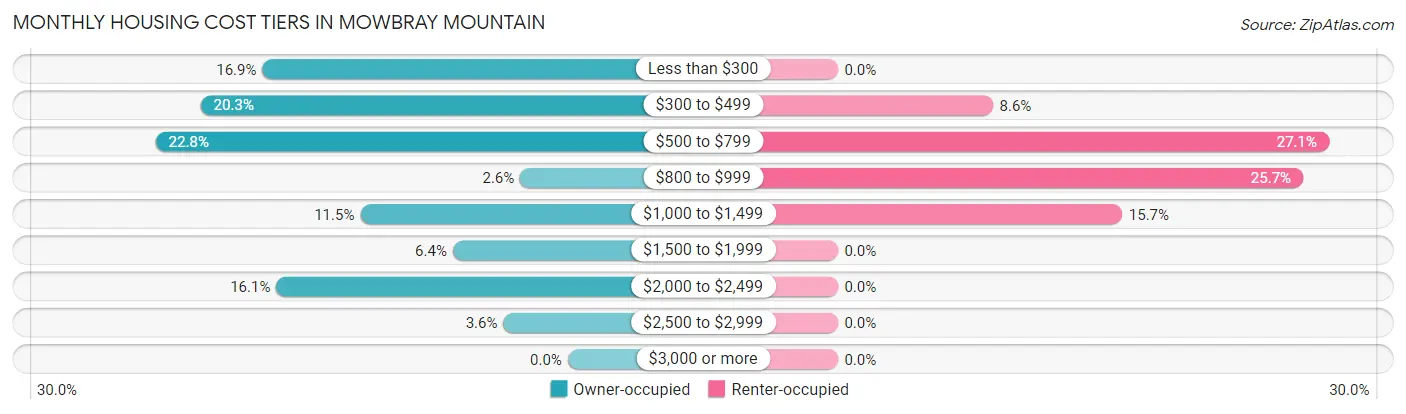
| Monthly Cost | Owner-occupied | Renter-occupied |
| Less than $300 | 109 (16.9%) | 0 (0.0%) |
| $300 to $499 | 131 (20.3%) | 6 (8.6%) |
| $500 to $799 | 147 (22.8%) | 19 (27.1%) |
| $800 to $999 | 17 (2.6%) | 18 (25.7%) |
| $1,000 to $1,499 | 74 (11.5%) | 11 (15.7%) |
| $1,500 to $1,999 | 41 (6.4%) | 0 (0.0%) |
| $2,000 to $2,499 | 104 (16.1%) | 0 (0.0%) |
| $2,500 to $2,999 | 23 (3.6%) | 0 (0.0%) |
| $3,000 or more | 0 (0.0%) | 0 (0.0%) |
| Total | 646 (100.0%) | 70 (100.0%) |
Physical Housing Characteristics in Mowbray Mountain
Housing Structures in Mowbray Mountain
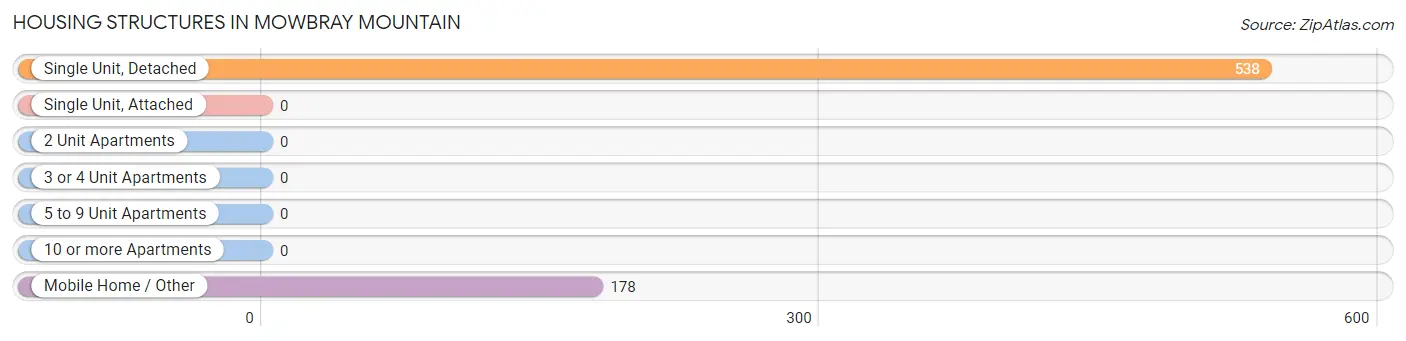
| Structure Type | # Housing Units | % Housing Units |
| Single Unit, Detached | 538 | 75.1% |
| Single Unit, Attached | 0 | 0.0% |
| 2 Unit Apartments | 0 | 0.0% |
| 3 or 4 Unit Apartments | 0 | 0.0% |
| 5 to 9 Unit Apartments | 0 | 0.0% |
| 10 or more Apartments | 0 | 0.0% |
| Mobile Home / Other | 178 | 24.9% |
| Total | 716 | 100.0% |
Housing Structures by Occupancy in Mowbray Mountain
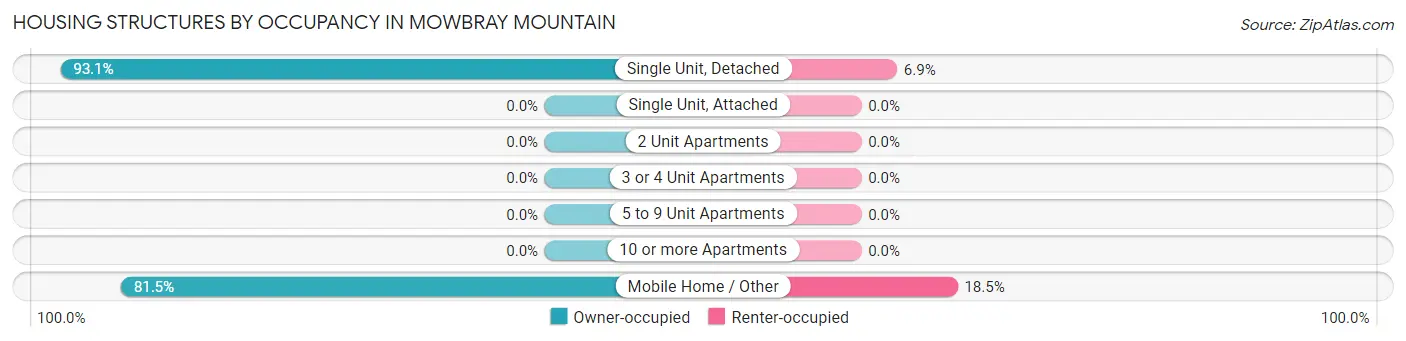
| Structure Type | Owner-occupied | Renter-occupied |
| Single Unit, Detached | 501 (93.1%) | 37 (6.9%) |
| Single Unit, Attached | 0 (0.0%) | 0 (0.0%) |
| 2 Unit Apartments | 0 (0.0%) | 0 (0.0%) |
| 3 or 4 Unit Apartments | 0 (0.0%) | 0 (0.0%) |
| 5 to 9 Unit Apartments | 0 (0.0%) | 0 (0.0%) |
| 10 or more Apartments | 0 (0.0%) | 0 (0.0%) |
| Mobile Home / Other | 145 (81.5%) | 33 (18.5%) |
| Total | 646 (90.2%) | 70 (9.8%) |
Housing Structures by Number of Rooms in Mowbray Mountain
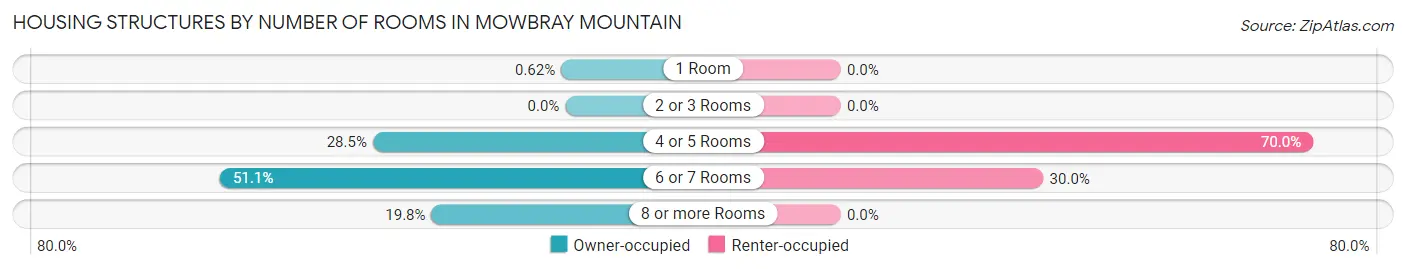
| Number of Rooms | Owner-occupied | Renter-occupied |
| 1 Room | 4 (0.6%) | 0 (0.0%) |
| 2 or 3 Rooms | 0 (0.0%) | 0 (0.0%) |
| 4 or 5 Rooms | 184 (28.5%) | 49 (70.0%) |
| 6 or 7 Rooms | 330 (51.1%) | 21 (30.0%) |
| 8 or more Rooms | 128 (19.8%) | 0 (0.0%) |
| Total | 646 (100.0%) | 70 (100.0%) |
Housing Structure by Heating Type in Mowbray Mountain
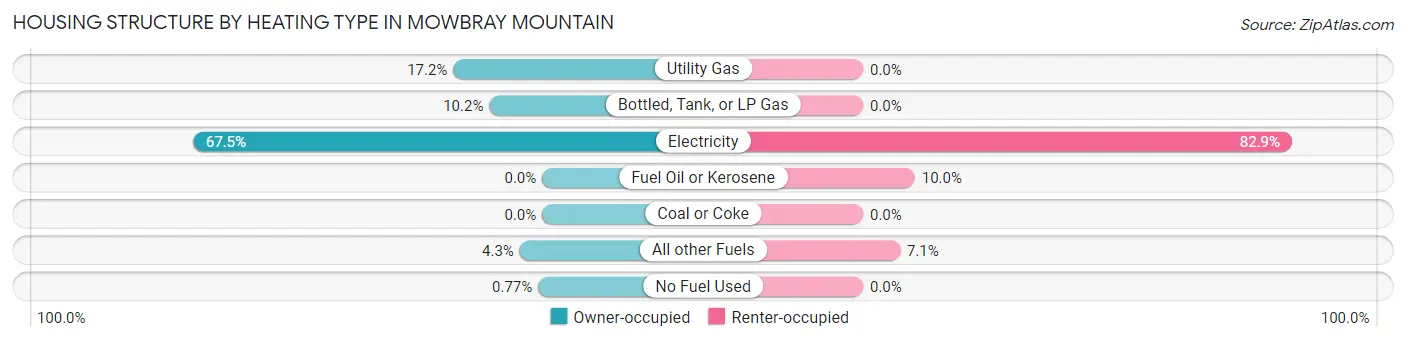
| Heating Type | Owner-occupied | Renter-occupied |
| Utility Gas | 111 (17.2%) | 0 (0.0%) |
| Bottled, Tank, or LP Gas | 66 (10.2%) | 0 (0.0%) |
| Electricity | 436 (67.5%) | 58 (82.9%) |
| Fuel Oil or Kerosene | 0 (0.0%) | 7 (10.0%) |
| Coal or Coke | 0 (0.0%) | 0 (0.0%) |
| All other Fuels | 28 (4.3%) | 5 (7.1%) |
| No Fuel Used | 5 (0.8%) | 0 (0.0%) |
| Total | 646 (100.0%) | 70 (100.0%) |
Household Vehicle Usage in Mowbray Mountain
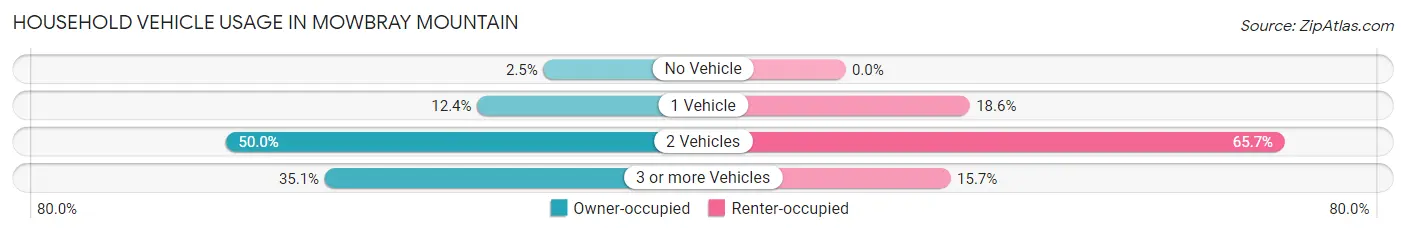
| Vehicles per Household | Owner-occupied | Renter-occupied |
| No Vehicle | 16 (2.5%) | 0 (0.0%) |
| 1 Vehicle | 80 (12.4%) | 13 (18.6%) |
| 2 Vehicles | 323 (50.0%) | 46 (65.7%) |
| 3 or more Vehicles | 227 (35.1%) | 11 (15.7%) |
| Total | 646 (100.0%) | 70 (100.0%) |
Real Estate & Mortgages in Mowbray Mountain
Real Estate and Mortgage Overview in Mowbray Mountain
| Characteristic | Without Mortgage | With Mortgage |
| Housing Units | 407 | 239 |
| Median Property Value | $140,600 | $405,400 |
| Median Household Income | $60,313 | $122 |
| Monthly Housing Costs | $457 | $0 |
| Real Estate Taxes | $746 | $8 |
Property Value by Mortgage Status in Mowbray Mountain
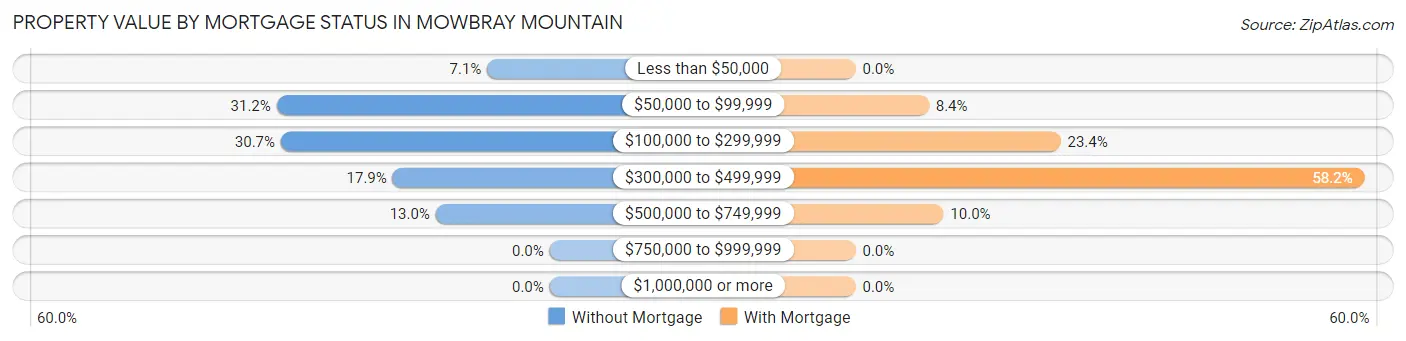
| Property Value | Without Mortgage | With Mortgage |
| Less than $50,000 | 29 (7.1%) | 0 (0.0%) |
| $50,000 to $99,999 | 127 (31.2%) | 20 (8.4%) |
| $100,000 to $299,999 | 125 (30.7%) | 56 (23.4%) |
| $300,000 to $499,999 | 73 (17.9%) | 139 (58.2%) |
| $500,000 to $749,999 | 53 (13.0%) | 24 (10.0%) |
| $750,000 to $999,999 | 0 (0.0%) | 0 (0.0%) |
| $1,000,000 or more | 0 (0.0%) | 0 (0.0%) |
| Total | 407 (100.0%) | 239 (100.0%) |
Household Income by Mortgage Status in Mowbray Mountain
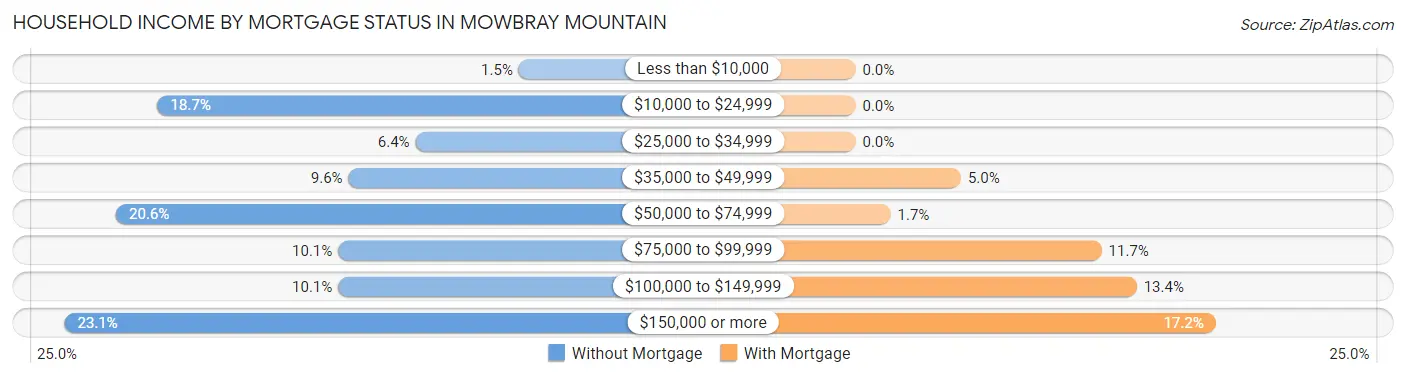
| Household Income | Without Mortgage | With Mortgage |
| Less than $10,000 | 6 (1.5%) | 0 (0.0%) |
| $10,000 to $24,999 | 76 (18.7%) | 0 (0.0%) |
| $25,000 to $34,999 | 26 (6.4%) | 0 (0.0%) |
| $35,000 to $49,999 | 39 (9.6%) | 12 (5.0%) |
| $50,000 to $74,999 | 84 (20.6%) | 4 (1.7%) |
| $75,000 to $99,999 | 41 (10.1%) | 28 (11.7%) |
| $100,000 to $149,999 | 41 (10.1%) | 32 (13.4%) |
| $150,000 or more | 94 (23.1%) | 41 (17.2%) |
| Total | 407 (100.0%) | 239 (100.0%) |
Property Value to Household Income Ratio in Mowbray Mountain
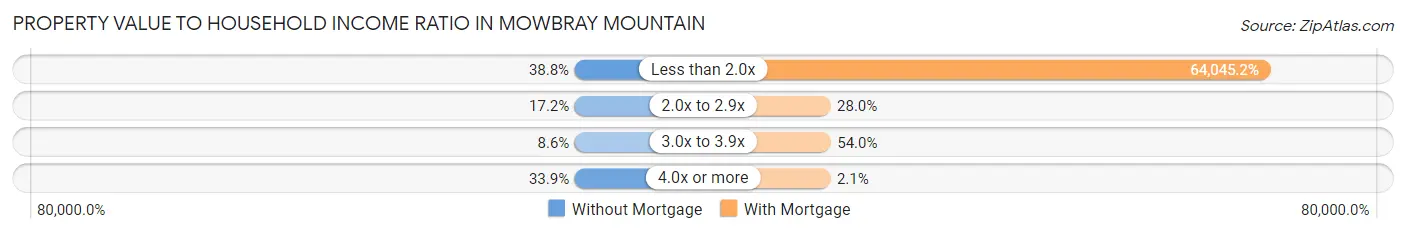
| Value-to-Income Ratio | Without Mortgage | With Mortgage |
| Less than 2.0x | 158 (38.8%) | 153,068 (64,045.2%) |
| 2.0x to 2.9x | 70 (17.2%) | 67 (28.0%) |
| 3.0x to 3.9x | 35 (8.6%) | 129 (54.0%) |
| 4.0x or more | 138 (33.9%) | 5 (2.1%) |
| Total | 407 (100.0%) | 239 (100.0%) |
Real Estate Taxes by Mortgage Status in Mowbray Mountain
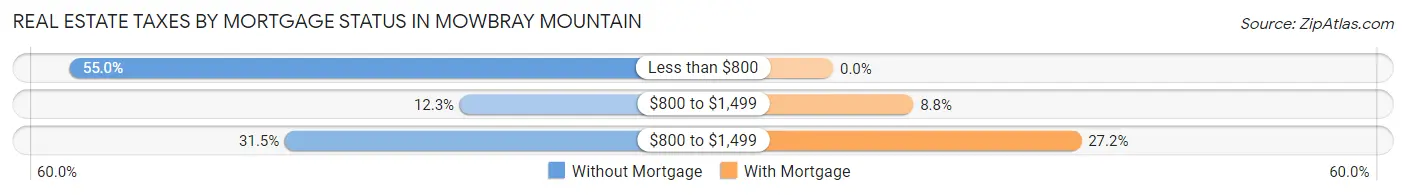
| Property Taxes | Without Mortgage | With Mortgage |
| Less than $800 | 224 (55.0%) | 0 (0.0%) |
| $800 to $1,499 | 50 (12.3%) | 21 (8.8%) |
| $800 to $1,499 | 128 (31.5%) | 65 (27.2%) |
| Total | 407 (100.0%) | 239 (100.0%) |
Health & Disability in Mowbray Mountain
Health Insurance Coverage by Age in Mowbray Mountain
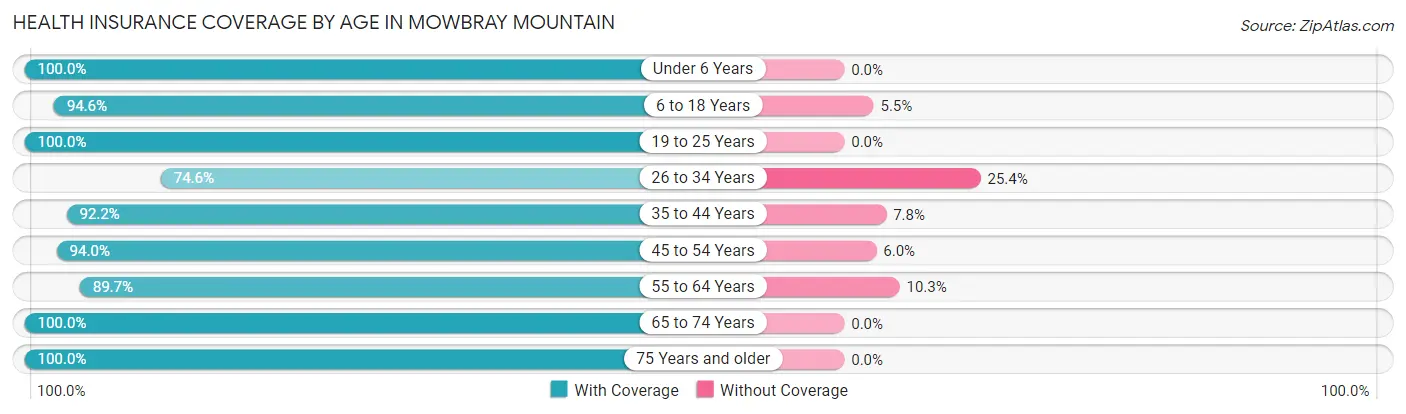
| Age Bracket | With Coverage | Without Coverage |
| Under 6 Years | 53 (100.0%) | 0 (0.0%) |
| 6 to 18 Years | 364 (94.6%) | 21 (5.4%) |
| 19 to 25 Years | 45 (100.0%) | 0 (0.0%) |
| 26 to 34 Years | 91 (74.6%) | 31 (25.4%) |
| 35 to 44 Years | 118 (92.2%) | 10 (7.8%) |
| 45 to 54 Years | 378 (94.0%) | 24 (6.0%) |
| 55 to 64 Years | 418 (89.7%) | 48 (10.3%) |
| 65 to 74 Years | 172 (100.0%) | 0 (0.0%) |
| 75 Years and older | 129 (100.0%) | 0 (0.0%) |
| Total | 1,768 (92.9%) | 134 (7.0%) |
Health Insurance Coverage by Citizenship Status in Mowbray Mountain
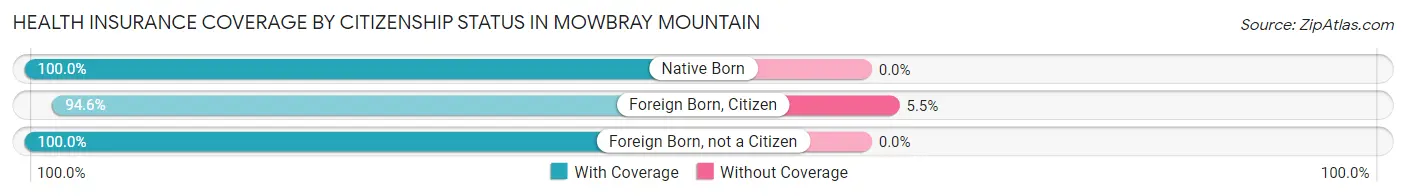
| Citizenship Status | With Coverage | Without Coverage |
| Native Born | 53 (100.0%) | 0 (0.0%) |
| Foreign Born, Citizen | 364 (94.6%) | 21 (5.4%) |
| Foreign Born, not a Citizen | 45 (100.0%) | 0 (0.0%) |
Health Insurance Coverage by Household Income in Mowbray Mountain
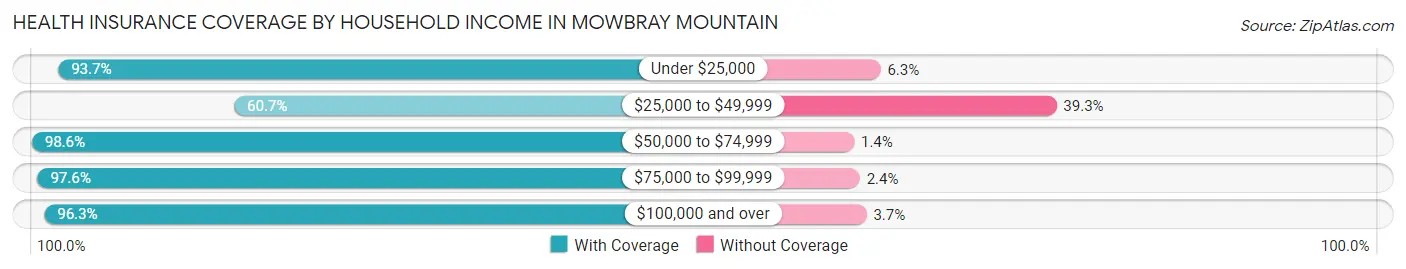
| Household Income | With Coverage | Without Coverage |
| Under $25,000 | 193 (93.7%) | 13 (6.3%) |
| $25,000 to $49,999 | 116 (60.7%) | 75 (39.3%) |
| $50,000 to $74,999 | 291 (98.6%) | 4 (1.4%) |
| $75,000 to $99,999 | 202 (97.6%) | 5 (2.4%) |
| $100,000 and over | 966 (96.3%) | 37 (3.7%) |
Public vs Private Health Insurance Coverage by Age in Mowbray Mountain
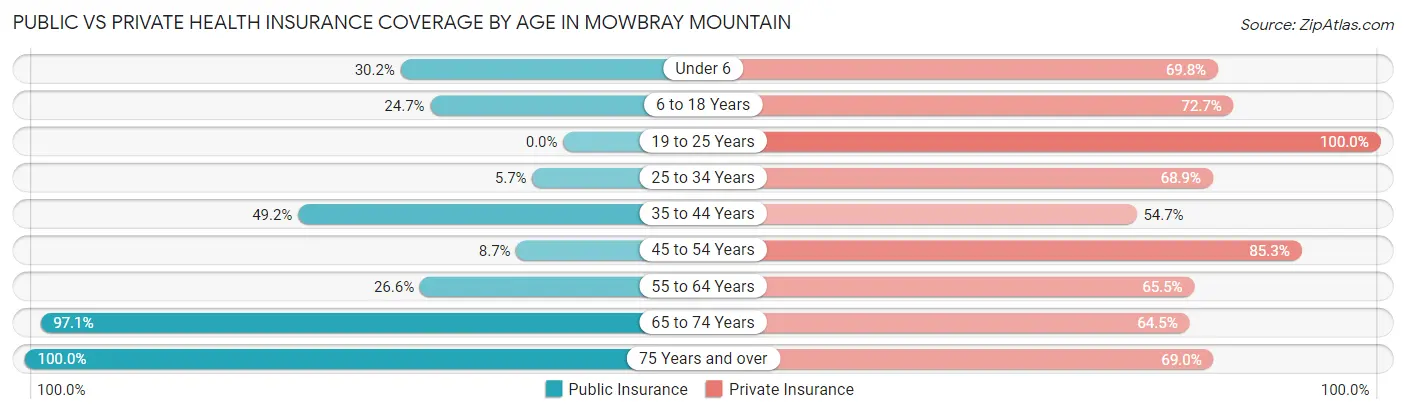
| Age Bracket | Public Insurance | Private Insurance |
| Under 6 | 16 (30.2%) | 37 (69.8%) |
| 6 to 18 Years | 95 (24.7%) | 280 (72.7%) |
| 19 to 25 Years | 0 (0.0%) | 45 (100.0%) |
| 25 to 34 Years | 7 (5.7%) | 84 (68.9%) |
| 35 to 44 Years | 63 (49.2%) | 70 (54.7%) |
| 45 to 54 Years | 35 (8.7%) | 343 (85.3%) |
| 55 to 64 Years | 124 (26.6%) | 305 (65.4%) |
| 65 to 74 Years | 167 (97.1%) | 111 (64.5%) |
| 75 Years and over | 129 (100.0%) | 89 (69.0%) |
| Total | 636 (33.4%) | 1,364 (71.7%) |
Disability Status by Sex by Age in Mowbray Mountain
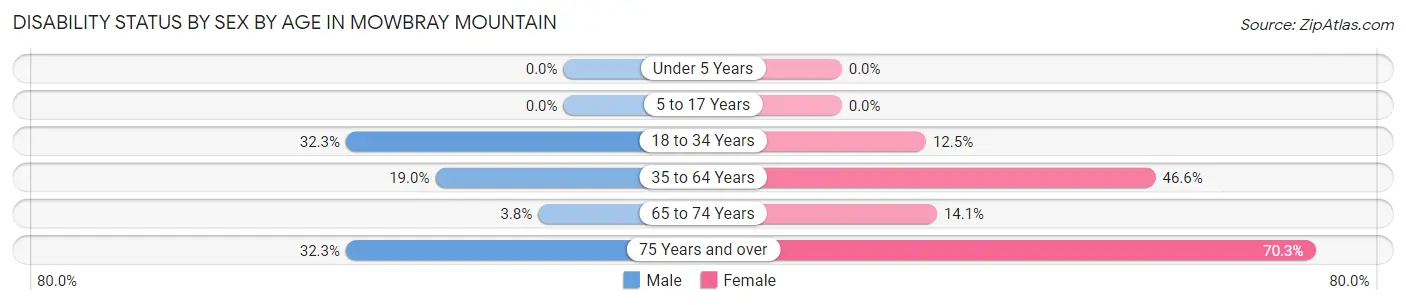
| Age Bracket | Male | Female |
| Under 5 Years | 0 (0.0%) | 0 (0.0%) |
| 5 to 17 Years | 0 (0.0%) | 0 (0.0%) |
| 18 to 34 Years | 42 (32.3%) | 8 (12.5%) |
| 35 to 64 Years | 89 (19.0%) | 246 (46.6%) |
| 65 to 74 Years | 3 (3.7%) | 13 (14.1%) |
| 75 Years and over | 21 (32.3%) | 45 (70.3%) |
Disability Class by Sex by Age in Mowbray Mountain
Disability Class: Hearing Difficulty
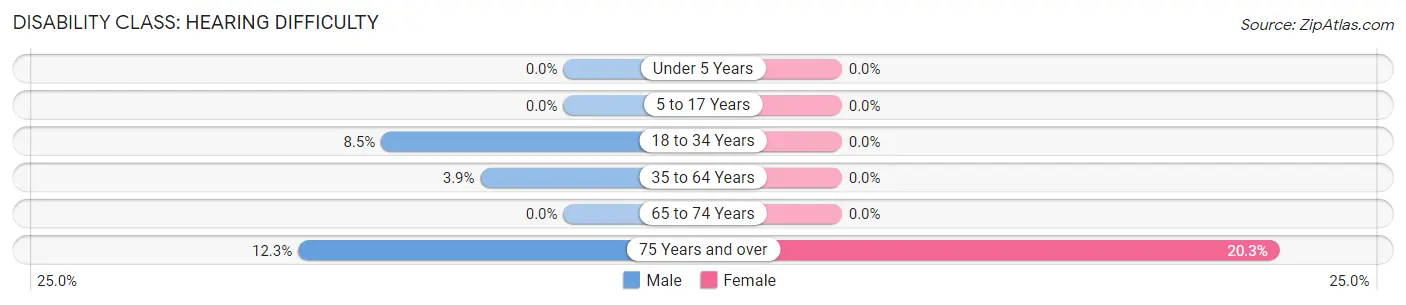
| Age Bracket | Male | Female |
| Under 5 Years | 0 (0.0%) | 0 (0.0%) |
| 5 to 17 Years | 0 (0.0%) | 0 (0.0%) |
| 18 to 34 Years | 11 (8.5%) | 0 (0.0%) |
| 35 to 64 Years | 18 (3.8%) | 0 (0.0%) |
| 65 to 74 Years | 0 (0.0%) | 0 (0.0%) |
| 75 Years and over | 8 (12.3%) | 13 (20.3%) |
Disability Class: Vision Difficulty
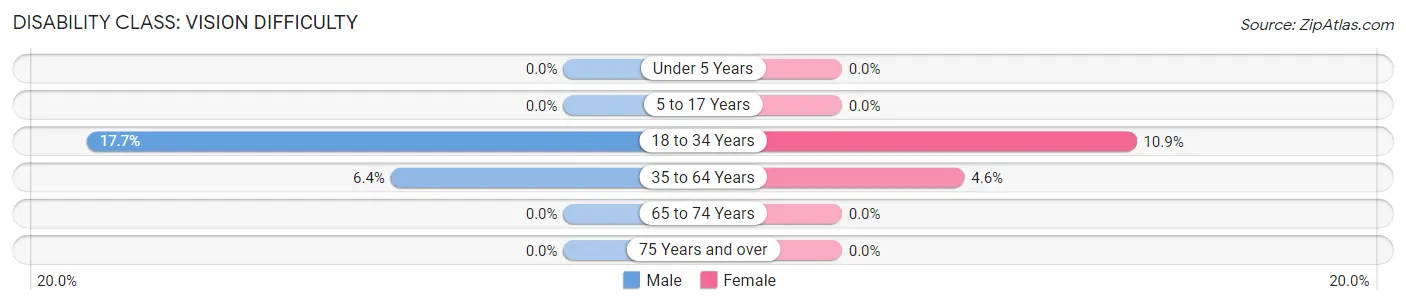
| Age Bracket | Male | Female |
| Under 5 Years | 0 (0.0%) | 0 (0.0%) |
| 5 to 17 Years | 0 (0.0%) | 0 (0.0%) |
| 18 to 34 Years | 23 (17.7%) | 7 (10.9%) |
| 35 to 64 Years | 30 (6.4%) | 24 (4.5%) |
| 65 to 74 Years | 0 (0.0%) | 0 (0.0%) |
| 75 Years and over | 0 (0.0%) | 0 (0.0%) |
Disability Class: Cognitive Difficulty
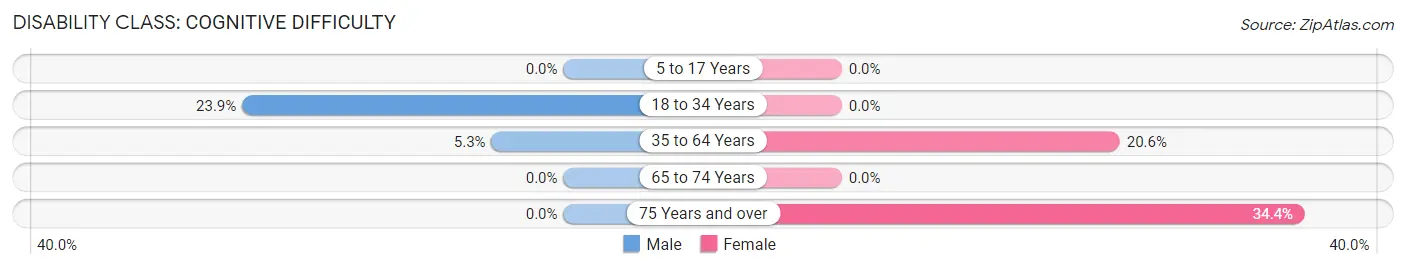
| Age Bracket | Male | Female |
| 5 to 17 Years | 0 (0.0%) | 0 (0.0%) |
| 18 to 34 Years | 31 (23.8%) | 0 (0.0%) |
| 35 to 64 Years | 25 (5.3%) | 109 (20.6%) |
| 65 to 74 Years | 0 (0.0%) | 0 (0.0%) |
| 75 Years and over | 0 (0.0%) | 22 (34.4%) |
Disability Class: Ambulatory Difficulty
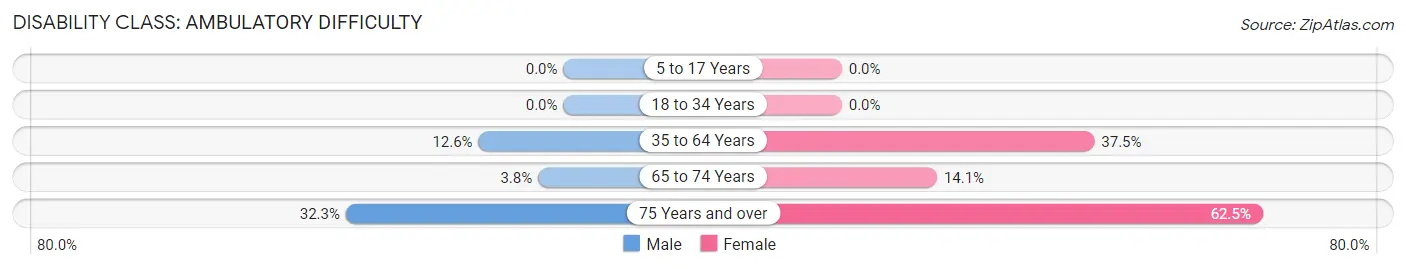
| Age Bracket | Male | Female |
| 5 to 17 Years | 0 (0.0%) | 0 (0.0%) |
| 18 to 34 Years | 0 (0.0%) | 0 (0.0%) |
| 35 to 64 Years | 59 (12.6%) | 198 (37.5%) |
| 65 to 74 Years | 3 (3.7%) | 13 (14.1%) |
| 75 Years and over | 21 (32.3%) | 40 (62.5%) |
Disability Class: Self-Care Difficulty
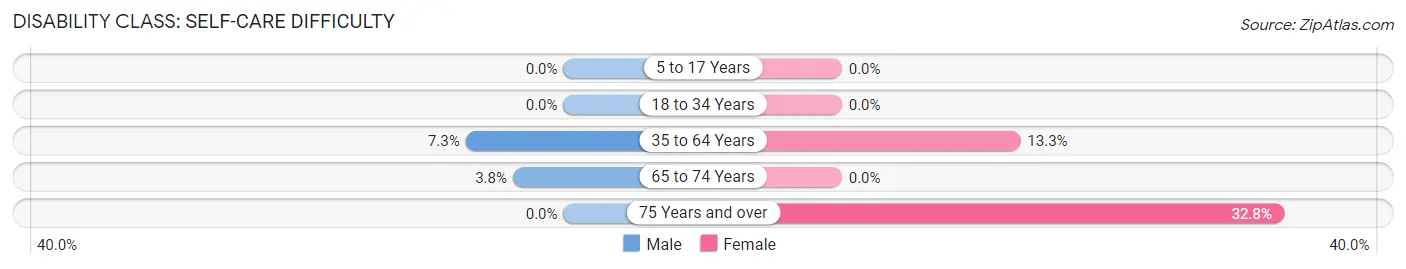
| Age Bracket | Male | Female |
| 5 to 17 Years | 0 (0.0%) | 0 (0.0%) |
| 18 to 34 Years | 0 (0.0%) | 0 (0.0%) |
| 35 to 64 Years | 34 (7.3%) | 70 (13.3%) |
| 65 to 74 Years | 3 (3.7%) | 0 (0.0%) |
| 75 Years and over | 0 (0.0%) | 21 (32.8%) |
Technology Access in Mowbray Mountain
Computing Device Access in Mowbray Mountain
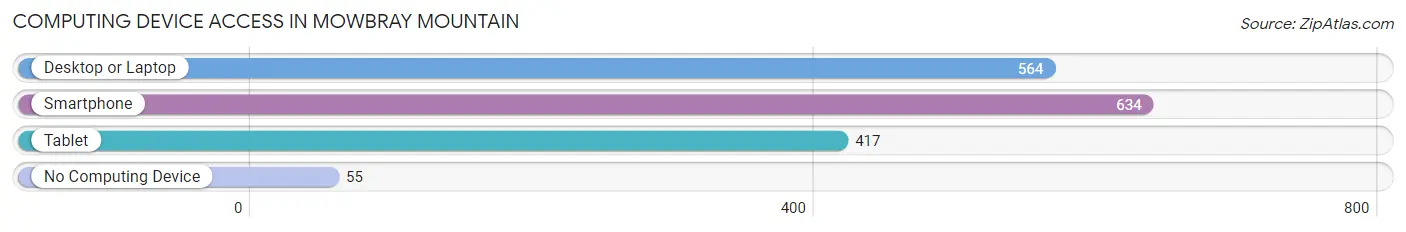
| Device Type | # Households | % Households |
| Desktop or Laptop | 564 | 78.8% |
| Smartphone | 634 | 88.5% |
| Tablet | 417 | 58.2% |
| No Computing Device | 55 | 7.7% |
| Total | 716 | 100.0% |
Internet Access in Mowbray Mountain
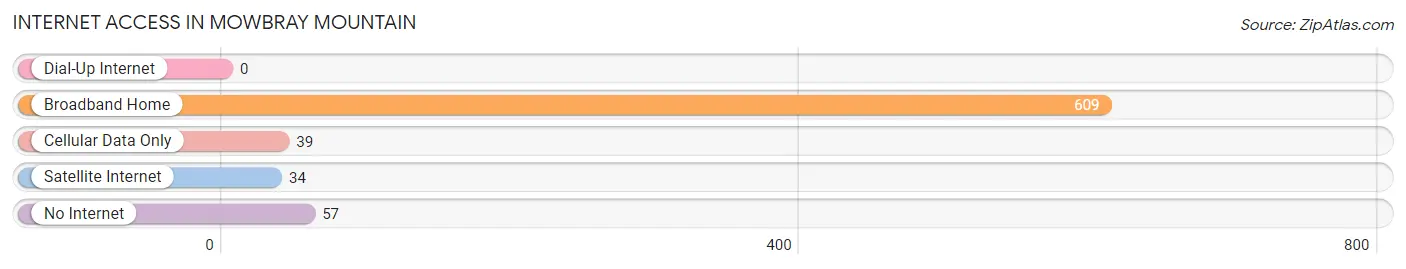
| Internet Type | # Households | % Households |
| Dial-Up Internet | 0 | 0.0% |
| Broadband Home | 609 | 85.1% |
| Cellular Data Only | 39 | 5.4% |
| Satellite Internet | 34 | 4.8% |
| No Internet | 57 | 8.0% |
| Total | 716 | 100.0% |
Mowbray Mountain Summary
Mowbray Mountain is a small mountain located in the Cumberland Plateau of Tennessee. It is located in the Sequatchie Valley, which is part of the Cumberland Plateau. The mountain is approximately 1,000 feet in elevation and is surrounded by the Sequatchie Valley and the Cumberland Plateau.
History
Mowbray Mountain has a long and varied history. The mountain was first settled by Native Americans, who used the area for hunting and gathering. The Cherokee and Chickasaw tribes were the first to inhabit the area. The mountain was also used by the early settlers of the area, who used the mountain for timber and charcoal production.
In the late 1800s, the mountain was used for coal mining. The coal was used to fuel the local economy and to power the railroads that ran through the area. The coal mining industry was the main source of employment in the area until the early 1900s.
In the early 1900s, the mountain was used for timber production. The timber was used to build homes and other structures in the area. The timber industry was the main source of employment in the area until the mid-1900s.
In the mid-1900s, the mountain was used for recreational activities. The mountain was home to a ski resort, which was popular with locals and tourists alike. The ski resort was closed in the late 1970s due to a lack of snowfall.
In the late 1970s, the mountain was used for residential development. The mountain was home to several residential developments, including the Mowbray Mountain Estates. The residential developments were popular with locals and tourists alike.
Geography
Mowbray Mountain is located in the Sequatchie Valley of the Cumberland Plateau. The mountain is approximately 1,000 feet in elevation and is surrounded by the Sequatchie Valley and the Cumberland Plateau. The mountain is located in the Sequatchie Valley, which is part of the Cumberland Plateau. The mountain is located in the Sequatchie Valley, which is part of the Cumberland Plateau.
The mountain is located in the Sequatchie Valley, which is part of the Cumberland Plateau. The mountain is located in the Sequatchie Valley, which is part of the Cumberland Plateau. The mountain is located in the Sequatchie Valley, which is part of the Cumberland Plateau.
The mountain is located in the Sequatchie Valley, which is part of the Cumberland Plateau. The mountain is located in the Sequatchie Valley, which is part of the Cumberland Plateau. The mountain is located in the Sequatchie Valley, which is part of the Cumberland Plateau.
Economy
The economy of Mowbray Mountain is largely based on tourism. The mountain is home to several recreational activities, including skiing, hiking, camping, and fishing. The mountain is also home to several residential developments, which attract tourists and locals alike.
The mountain is also home to several businesses, including restaurants, hotels, and retail stores. The businesses provide employment to locals and attract tourists to the area.
Demographics
The population of Mowbray Mountain is approximately 1,000 people. The population is largely composed of white individuals, with a small percentage of African Americans and Hispanics. The median age of the population is approximately 40 years old. The median household income is approximately $50,000.
Conclusion
Mowbray Mountain is a small mountain located in the Cumberland Plateau of Tennessee. The mountain has a long and varied history, and has been used for coal mining, timber production, and recreational activities. The mountain is now home to several residential developments and businesses, which attract tourists and locals alike. The population of Mowbray Mountain is approximately 1,000 people, and the median household income is approximately $50,000.
Common Questions
What is the Total Population of Mowbray Mountain?
Total Population of Mowbray Mountain is 1,902.
What is the Total Male Population of Mowbray Mountain?
Total Male Population of Mowbray Mountain is 929.
What is the Total Female Population of Mowbray Mountain?
Total Female Population of Mowbray Mountain is 973.
What is the Ratio of Males per 100 Females in Mowbray Mountain?
There are 95.48 Males per 100 Females in Mowbray Mountain.
What is the Ratio of Females per 100 Males in Mowbray Mountain?
There are 104.74 Females per 100 Males in Mowbray Mountain.
What is the Median Population Age in Mowbray Mountain?
Median Population Age in Mowbray Mountain is 50.6 Years.
What is the Average Family Size in Mowbray Mountain
Average Family Size in Mowbray Mountain is 2.9 People.
What is the Average Household Size in Mowbray Mountain
Average Household Size in Mowbray Mountain is 2.7 People.
What is Per Capita Income in Mowbray Mountain?
Per Capita income in Mowbray Mountain is $39,663.
What is the Median Family Income in Mowbray Mountain?
Median Family Income in Mowbray Mountain is $111,118.
What is the Median Household income in Mowbray Mountain?
Median Household Income in Mowbray Mountain is $85,125.
What is Income or Wage Gap in Mowbray Mountain?
Income or Wage Gap in Mowbray Mountain is 36.7%.
Women in Mowbray Mountain earn 63.3 cents for every dollar earned by a man.
What is Inequality or Gini Index in Mowbray Mountain?
Inequality or Gini Index in Mowbray Mountain is 0.40.
How Large is the Labor Force in Mowbray Mountain?
There are 884 People in the Labor Forcein in Mowbray Mountain.
What is the Percentage of People in the Labor Force in Mowbray Mountain?
57.3% of People are in the Labor Force in Mowbray Mountain.
What is the Unemployment Rate in Mowbray Mountain?
Unemployment Rate in Mowbray Mountain is 2.6%.