Pittman Center, TN
Pittman Center Map
Pittman Center Overview
520
TOTAL POPULATION
292
MALE POPULATION
228
FEMALE POPULATION
128.07
MALES / 100 FEMALES
78.08
FEMALES / 100 MALES
37.1
MEDIAN AGE
3.4
AVG FAMILY SIZE
2.8
AVG HOUSEHOLD SIZE
$28,808
PER CAPITA INCOME
$83,281
AVG FAMILY INCOME
$71,250
AVG HOUSEHOLD INCOME
36.9%
WAGE / INCOME GAP [ % ]
63.1¢/ $1
WAGE / INCOME GAP [ $ ]
0.37
INEQUALITY / GINI INDEX
271
LABOR FORCE [ PEOPLE ]
67.2%
PERCENT IN LABOR FORCE
0.7%
UNEMPLOYMENT RATE
Pittman Center Area Codes
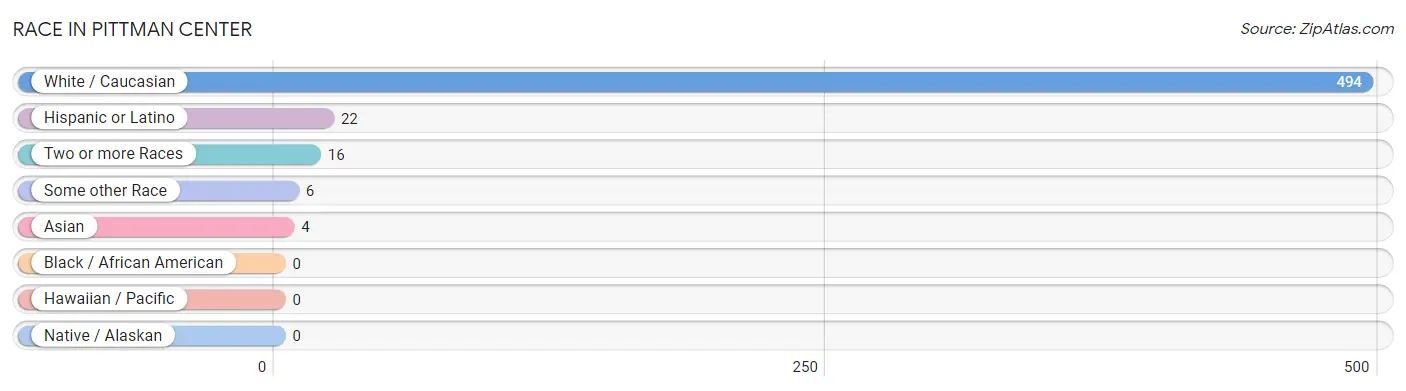
Race in Pittman Center
The most populous races in Pittman Center are White / Caucasian (494 | 95.0%), Hispanic or Latino (22 | 4.2%), and Two or more Races (16 | 3.1%).
| Race | # Population | % Population |
| Asian | 4 | 0.8% |
| Black / African American | 0 | 0.0% |
| Hawaiian / Pacific | 0 | 0.0% |
| Hispanic or Latino | 22 | 4.2% |
| Native / Alaskan | 0 | 0.0% |
| White / Caucasian | 494 | 95.0% |
| Two or more Races | 16 | 3.1% |
| Some other Race | 6 | 1.1% |
| Total | 520 | 100.0% |
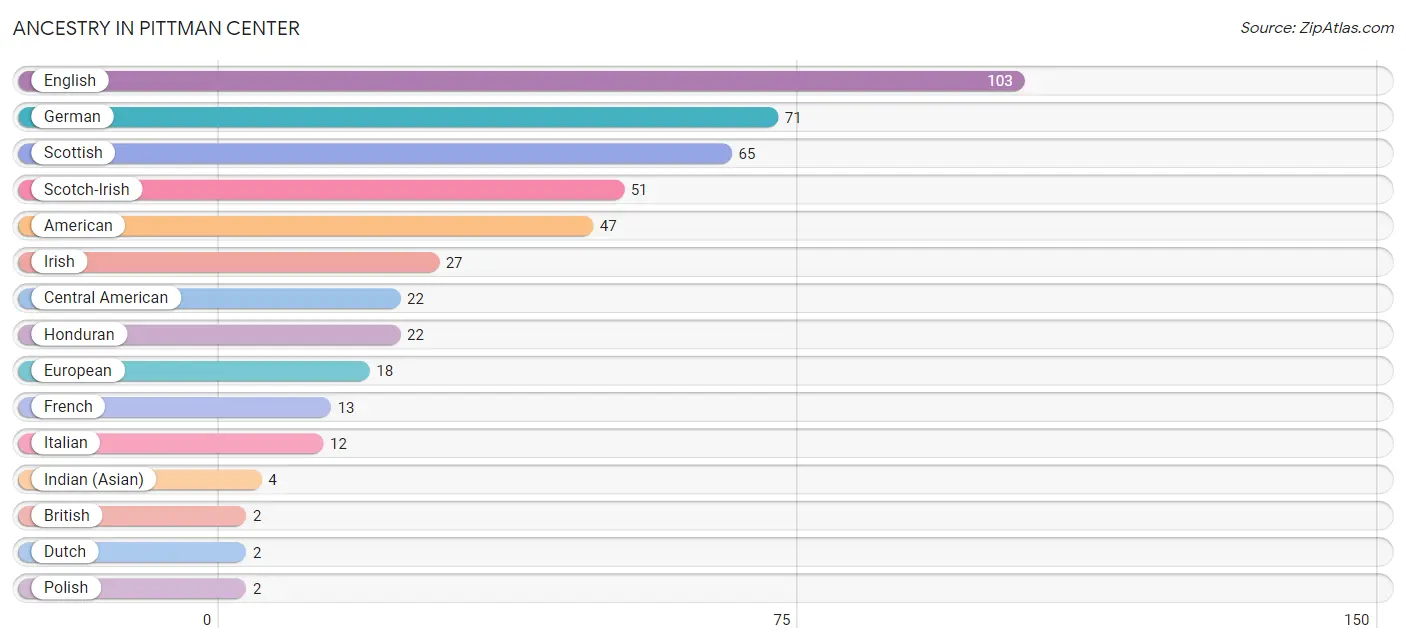
Ancestry in Pittman Center
The most populous ancestries reported in Pittman Center are English (103 | 19.8%), German (71 | 13.7%), Scottish (65 | 12.5%), Scotch-Irish (51 | 9.8%), and American (47 | 9.0%), together accounting for 64.8% of all Pittman Center residents.
| Ancestry | # Population | % Population |
| American | 47 | 9.0% |
| British | 2 | 0.4% |
| Central American | 22 | 4.2% |
| Dutch | 2 | 0.4% |
| English | 103 | 19.8% |
| European | 18 | 3.5% |
| French | 13 | 2.5% |
| German | 71 | 13.7% |
| Honduran | 22 | 4.2% |
| Indian (Asian) | 4 | 0.8% |
| Irish | 27 | 5.2% |
| Italian | 12 | 2.3% |
| Polish | 2 | 0.4% |
| Russian | 2 | 0.4% |
| Scotch-Irish | 51 | 9.8% |
| Scottish | 65 | 12.5% | View All 16 Rows |
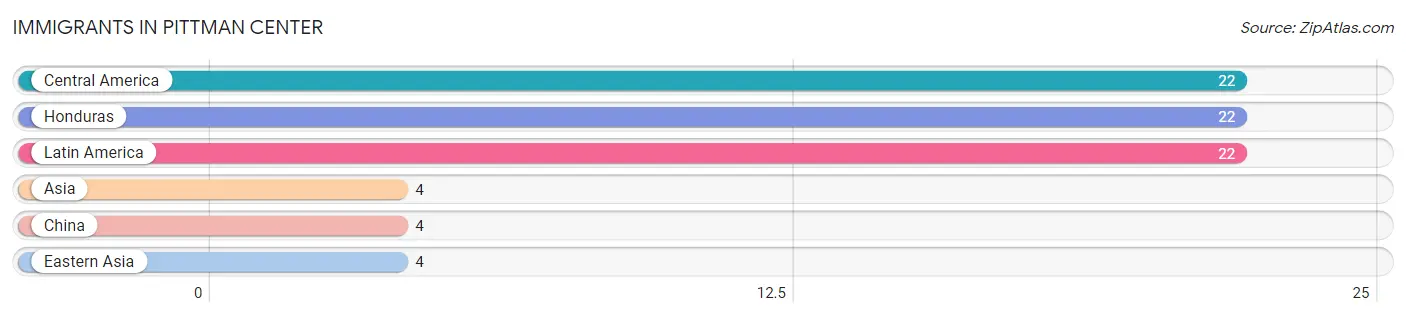
Immigrants in Pittman Center
The most numerous immigrant groups reported in Pittman Center came from Central America (22 | 4.2%), Honduras (22 | 4.2%), Latin America (22 | 4.2%), Asia (4 | 0.8%), and China (4 | 0.8%), together accounting for 14.2% of all Pittman Center residents.
| Immigration Origin | # Population | % Population |
| Asia | 4 | 0.8% |
| Central America | 22 | 4.2% |
| China | 4 | 0.8% |
| Eastern Asia | 4 | 0.8% |
| Honduras | 22 | 4.2% |
| Latin America | 22 | 4.2% | View All 6 Rows |
Sex and Age in Pittman Center
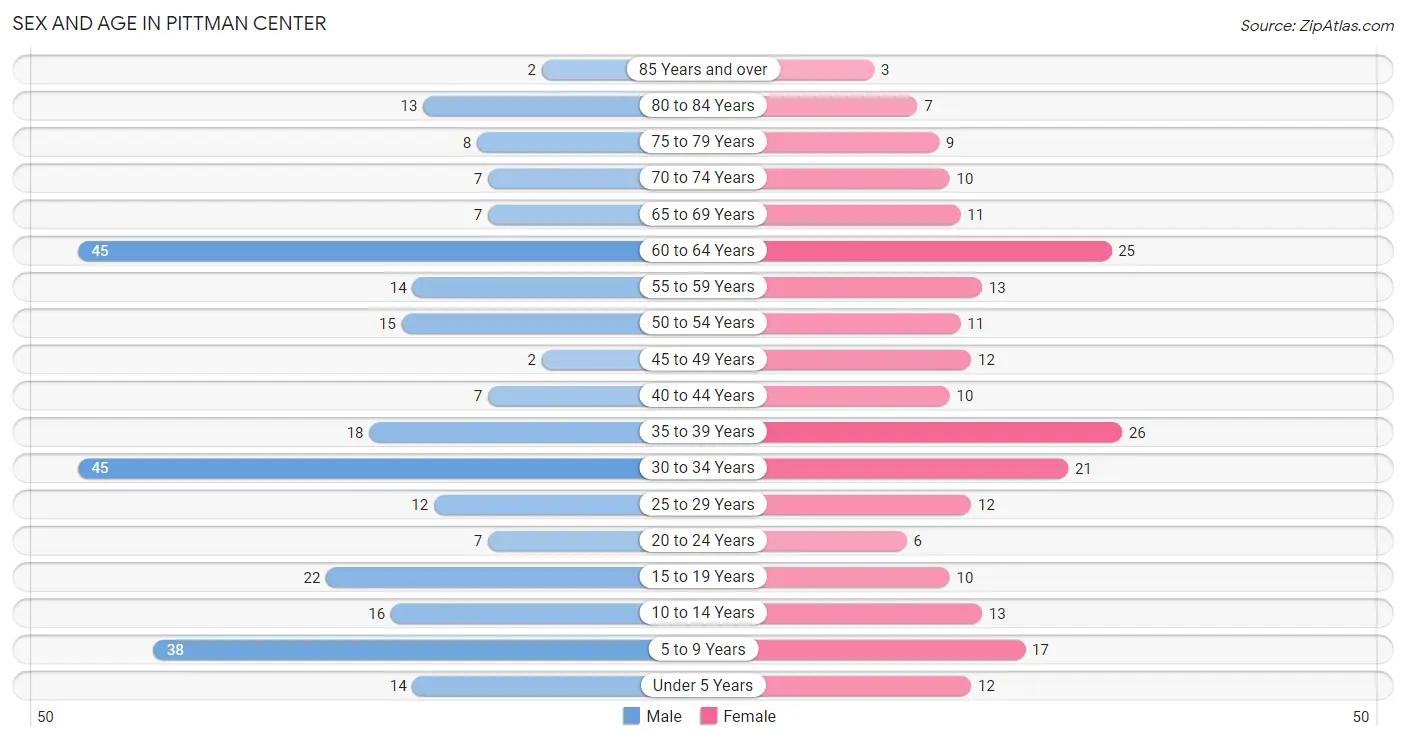
Sex and Age in Pittman Center
The most populous age groups in Pittman Center are 30 to 34 Years (45 | 15.4%) for men and 35 to 39 Years (26 | 11.4%) for women.
| Age Bracket | Male | Female |
| Under 5 Years | 14 (4.8%) | 12 (5.3%) |
| 5 to 9 Years | 38 (13.0%) | 17 (7.5%) |
| 10 to 14 Years | 16 (5.5%) | 13 (5.7%) |
| 15 to 19 Years | 22 (7.5%) | 10 (4.4%) |
| 20 to 24 Years | 7 (2.4%) | 6 (2.6%) |
| 25 to 29 Years | 12 (4.1%) | 12 (5.3%) |
| 30 to 34 Years | 45 (15.4%) | 21 (9.2%) |
| 35 to 39 Years | 18 (6.2%) | 26 (11.4%) |
| 40 to 44 Years | 7 (2.4%) | 10 (4.4%) |
| 45 to 49 Years | 2 (0.7%) | 12 (5.3%) |
| 50 to 54 Years | 15 (5.1%) | 11 (4.8%) |
| 55 to 59 Years | 14 (4.8%) | 13 (5.7%) |
| 60 to 64 Years | 45 (15.4%) | 25 (11.0%) |
| 65 to 69 Years | 7 (2.4%) | 11 (4.8%) |
| 70 to 74 Years | 7 (2.4%) | 10 (4.4%) |
| 75 to 79 Years | 8 (2.7%) | 9 (4.0%) |
| 80 to 84 Years | 13 (4.4%) | 7 (3.1%) |
| 85 Years and over | 2 (0.7%) | 3 (1.3%) |
| Total | 292 (100.0%) | 228 (100.0%) |
Families and Households in Pittman Center
Median Family Size in Pittman Center
The median family size in Pittman Center is 3.40 persons per family, with single male/father families (10 | 7.9%) accounting for the largest median family size of 3.7 persons per family. On the other hand, single female/mother families (20 | 15.8%) represent the smallest median family size with 3.15 persons per family.

| Family Type | # Families | Family Size |
| Married-Couple | 97 (76.4%) | 3.42 |
| Single Male/Father | 10 (7.9%) | 3.70 |
| Single Female/Mother | 20 (15.8%) | 3.15 |
| Total Families | 127 (100.0%) | 3.40 |
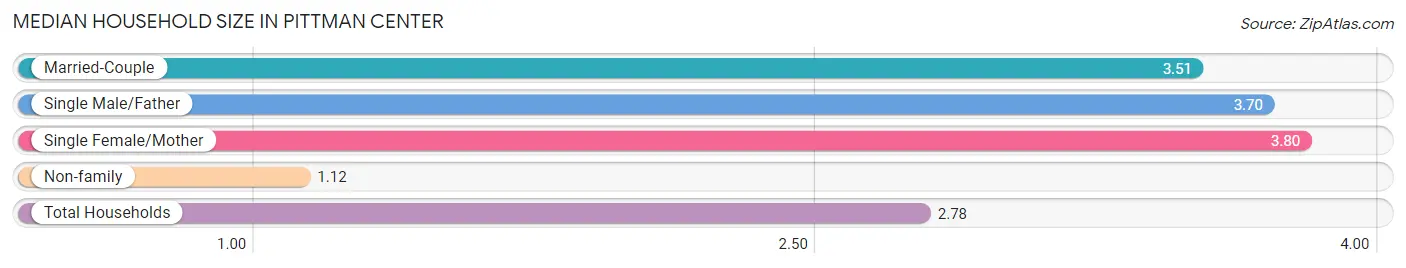
Median Household Size in Pittman Center
The median household size in Pittman Center is 2.78 persons per household, with single female/mother households (20 | 10.7%) accounting for the largest median household size of 3.8 persons per household. non-family households (60 | 32.1%) represent the smallest median household size with 1.12 persons per household.
| Household Type | # Households | Household Size |
| Married-Couple | 97 (51.9%) | 3.51 |
| Single Male/Father | 10 (5.3%) | 3.70 |
| Single Female/Mother | 20 (10.7%) | 3.80 |
| Non-family | 60 (32.1%) | 1.12 |
| Total Households | 187 (100.0%) | 2.78 |
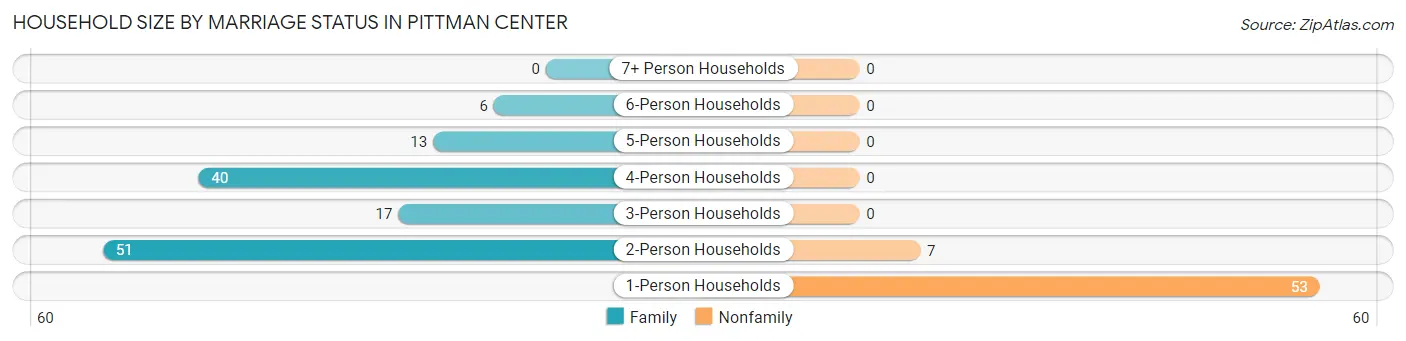
Household Size by Marriage Status in Pittman Center
Out of a total of 187 households in Pittman Center, 127 (67.9%) are family households, while 60 (32.1%) are nonfamily households. The most numerous type of family households are 2-person households, comprising 51, and the most common type of nonfamily households are 1-person households, comprising 53.
| Household Size | Family Households | Nonfamily Households |
| 1-Person Households | - | 53 (28.3%) |
| 2-Person Households | 51 (27.3%) | 7 (3.7%) |
| 3-Person Households | 17 (9.1%) | 0 (0.0%) |
| 4-Person Households | 40 (21.4%) | 0 (0.0%) |
| 5-Person Households | 13 (7.0%) | 0 (0.0%) |
| 6-Person Households | 6 (3.2%) | 0 (0.0%) |
| 7+ Person Households | 0 (0.0%) | 0 (0.0%) |
| Total | 127 (67.9%) | 60 (32.1%) |
Female Fertility in Pittman Center
Fertility by Age in Pittman Center
| Age Bracket | Women with Births | Births / 1,000 Women |
| 15 to 19 years | 0 (0.0%) | 0.0 |
| 20 to 34 years | 0 (0.0%) | 0.0 |
| 35 to 50 years | 0 (0.0%) | 0.0 |
| Total | 0 (0.0%) | 0.0 |
Fertility by Age by Marriage Status in Pittman Center
| Age Bracket | Married | Unmarried |
| 15 to 19 years | 0 (0.0%) | 0 (0.0%) |
| 20 to 34 years | 0 (0.0%) | 0 (0.0%) |
| 35 to 50 years | 0 (0.0%) | 0 (0.0%) |
| Total | 0 (0.0%) | 0 (0.0%) |
Fertility by Education in Pittman Center
| Educational Attainment | Women with Births | Births / 1,000 Women |
| Less than High School | 0 (0.0%) | 0.0 |
| High School Diploma | 0 (0.0%) | 0.0 |
| College or Associate's Degree | 0 (0.0%) | 0.0 |
| Bachelor's Degree | 0 (0.0%) | 0.0 |
| Graduate Degree | 0 (0.0%) | 0.0 |
| Total | 0 (0.0%) | 0.0 |
Fertility by Education by Marriage Status in Pittman Center
| Educational Attainment | Married | Unmarried |
| Less than High School | 0 (0.0%) | 0 (0.0%) |
| High School Diploma | 0 (0.0%) | 0 (0.0%) |
| College or Associate's Degree | 0 (0.0%) | 0 (0.0%) |
| Bachelor's Degree | 0 (0.0%) | 0 (0.0%) |
| Graduate Degree | 0 (0.0%) | 0 (0.0%) |
| Total | 0 (0.0%) | 0 (0.0%) |
Income in Pittman Center
Income Overview in Pittman Center
Per Capita Income in Pittman Center is $28,808, while median incomes of families and households are $83,281 and $71,250 respectively.
| Characteristic | Number | Measure |
| Per Capita Income | 520 | $28,808 |
| Median Family Income | 127 | $83,281 |
| Mean Family Income | 127 | $88,315 |
| Median Household Income | 187 | $71,250 |
| Mean Household Income | 187 | $76,523 |
| Income Deficit | 127 | $0 |
| Wage / Income Gap (%) | 520 | 36.88% |
| Wage / Income Gap ($) | 520 | 63.12¢ per $1 |
| Gini / Inequality Index | 520 | 0.37 |
Earnings by Sex in Pittman Center
Average Earnings in Pittman Center are $29,000, $32,083 for men and $20,250 for women, a difference of 36.9%.
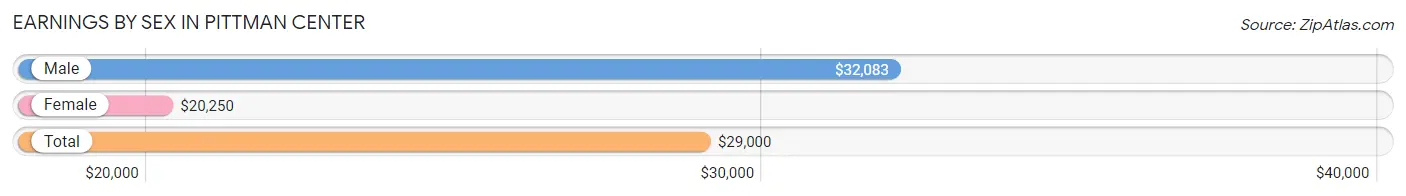
| Sex | Number | Average Earnings |
| Male | 174 (60.0%) | $32,083 |
| Female | 116 (40.0%) | $20,250 |
| Total | 290 (100.0%) | $29,000 |
Earnings by Sex by Income Bracket in Pittman Center
The most common earnings brackets in Pittman Center are $30,000 to $34,999 for men (29 | 16.7%) and $12,500 to $14,999 for women (15 | 12.9%).
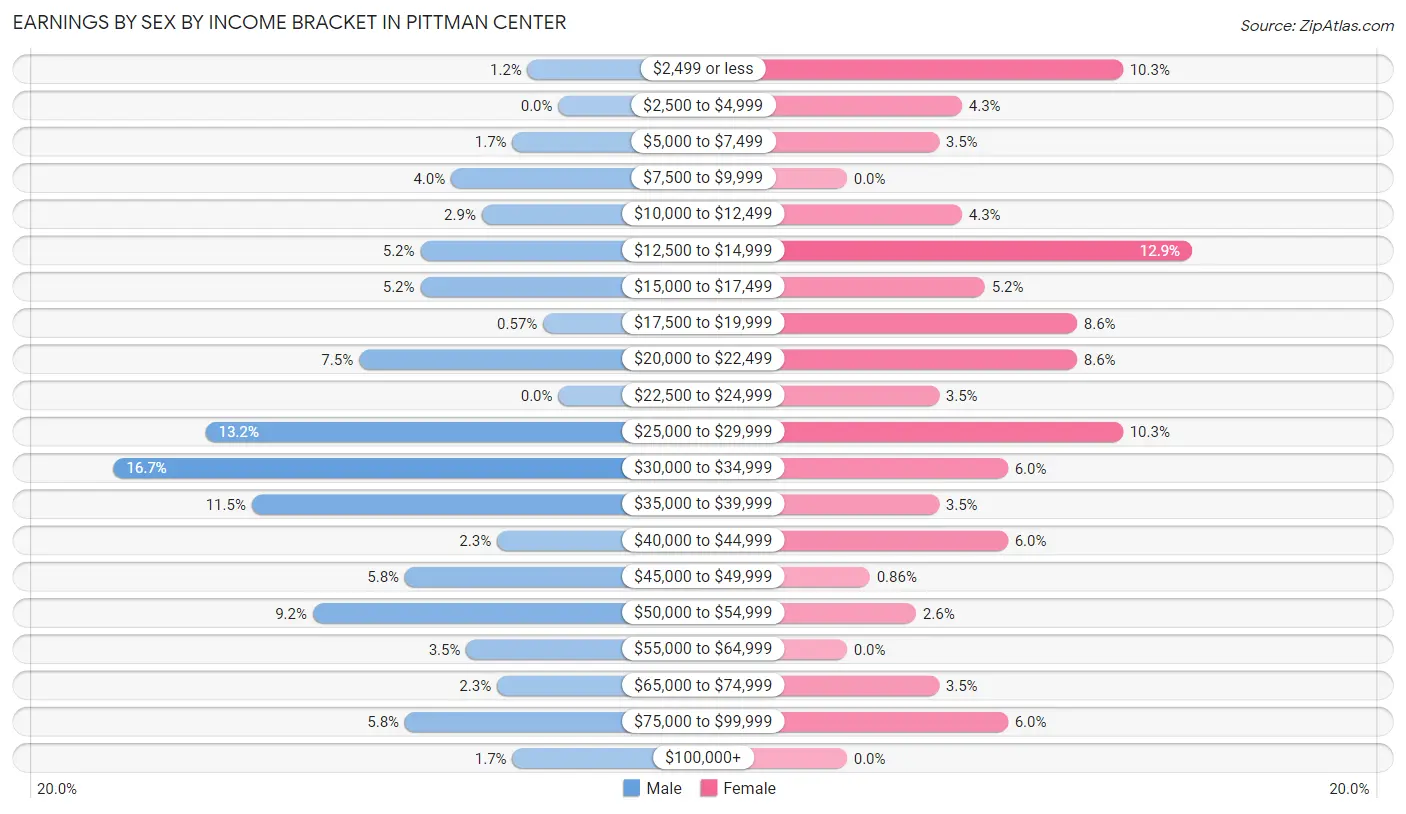
| Income | Male | Female |
| $2,499 or less | 2 (1.1%) | 12 (10.3%) |
| $2,500 to $4,999 | 0 (0.0%) | 5 (4.3%) |
| $5,000 to $7,499 | 3 (1.7%) | 4 (3.5%) |
| $7,500 to $9,999 | 7 (4.0%) | 0 (0.0%) |
| $10,000 to $12,499 | 5 (2.9%) | 5 (4.3%) |
| $12,500 to $14,999 | 9 (5.2%) | 15 (12.9%) |
| $15,000 to $17,499 | 9 (5.2%) | 6 (5.2%) |
| $17,500 to $19,999 | 1 (0.6%) | 10 (8.6%) |
| $20,000 to $22,499 | 13 (7.5%) | 10 (8.6%) |
| $22,500 to $24,999 | 0 (0.0%) | 4 (3.5%) |
| $25,000 to $29,999 | 23 (13.2%) | 12 (10.3%) |
| $30,000 to $34,999 | 29 (16.7%) | 7 (6.0%) |
| $35,000 to $39,999 | 20 (11.5%) | 4 (3.5%) |
| $40,000 to $44,999 | 4 (2.3%) | 7 (6.0%) |
| $45,000 to $49,999 | 10 (5.8%) | 1 (0.9%) |
| $50,000 to $54,999 | 16 (9.2%) | 3 (2.6%) |
| $55,000 to $64,999 | 6 (3.5%) | 0 (0.0%) |
| $65,000 to $74,999 | 4 (2.3%) | 4 (3.5%) |
| $75,000 to $99,999 | 10 (5.8%) | 7 (6.0%) |
| $100,000+ | 3 (1.7%) | 0 (0.0%) |
| Total | 174 (100.0%) | 116 (100.0%) |
Earnings by Sex by Educational Attainment in Pittman Center
Average earnings in Pittman Center are $33,182 for men and $20,875 for women, a difference of 37.1%. Men with an educational attainment of college or associate's degree enjoy the highest average annual earnings of $49,583, while those with high school diploma education earn the least with $33,125. Women with an educational attainment of graduate degree earn the most with the average annual earnings of $75,417, while those with college or associate's degree education have the smallest earnings of $17,500.
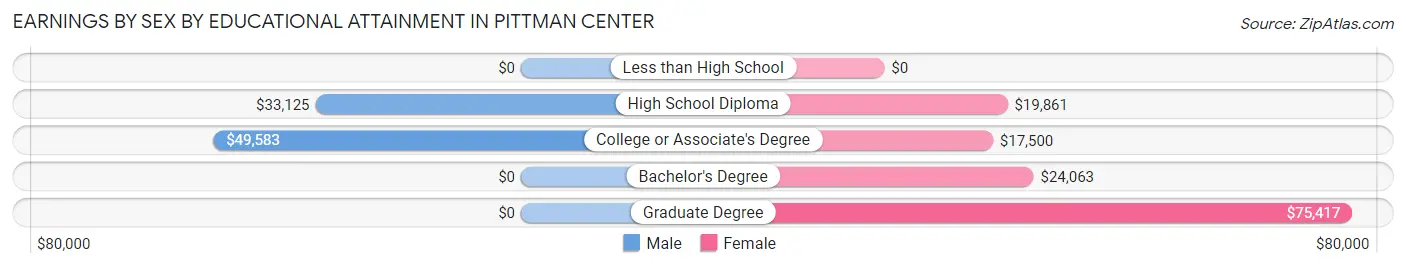
| Educational Attainment | Male Income | Female Income |
| Less than High School | - | - |
| High School Diploma | $33,125 | $19,861 |
| College or Associate's Degree | $49,583 | $17,500 |
| Bachelor's Degree | - | - |
| Graduate Degree | - | - |
| Total | $33,182 | $20,875 |
Family Income in Pittman Center
Family Income Brackets in Pittman Center
According to the Pittman Center family income data, there are 29 families falling into the $50,000 to $74,999 income range, which is the most common income bracket and makes up 22.8% of all families.
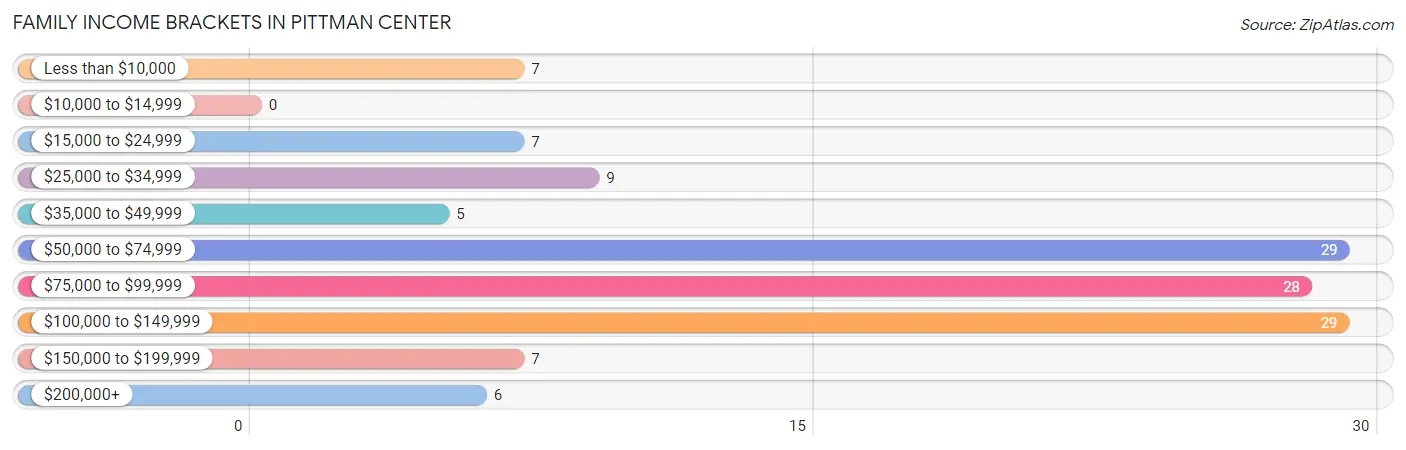
| Income Bracket | # Families | % Families |
| Less than $10,000 | 7 | 5.5% |
| $10,000 to $14,999 | 0 | 0.0% |
| $15,000 to $24,999 | 7 | 5.5% |
| $25,000 to $34,999 | 9 | 7.1% |
| $35,000 to $49,999 | 5 | 3.9% |
| $50,000 to $74,999 | 29 | 22.8% |
| $75,000 to $99,999 | 28 | 22.0% |
| $100,000 to $149,999 | 29 | 22.8% |
| $150,000 to $199,999 | 7 | 5.5% |
| $200,000+ | 6 | 4.7% |
Family Income by Famaliy Size in Pittman Center
3-person families (25 | 19.7%) account for the highest median family income in Pittman Center with $83,906 per family, while 2-person families (51 | 40.2%) have the highest median income of $39,688 per family member.
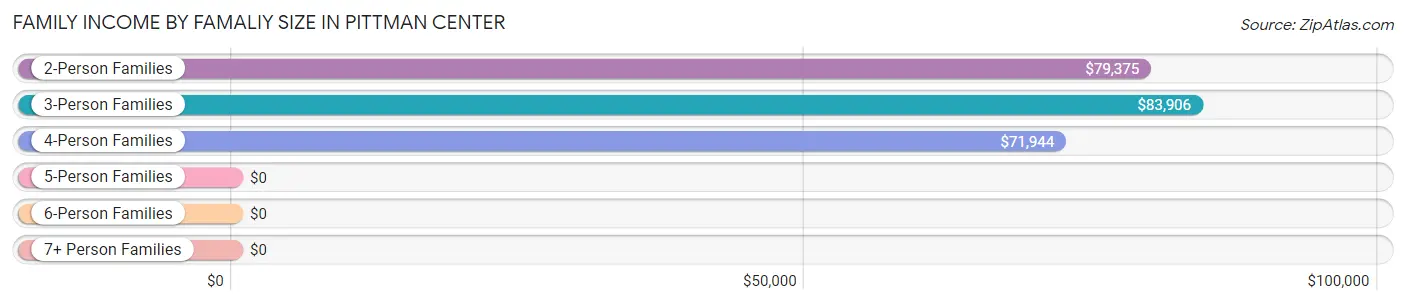
| Income Bracket | # Families | Median Income |
| 2-Person Families | 51 (40.2%) | $79,375 |
| 3-Person Families | 25 (19.7%) | $83,906 |
| 4-Person Families | 32 (25.2%) | $71,944 |
| 5-Person Families | 19 (15.0%) | $0 |
| 6-Person Families | 0 (0.0%) | $0 |
| 7+ Person Families | 0 (0.0%) | $0 |
| Total | 127 (100.0%) | $83,281 |
Family Income by Number of Earners in Pittman Center
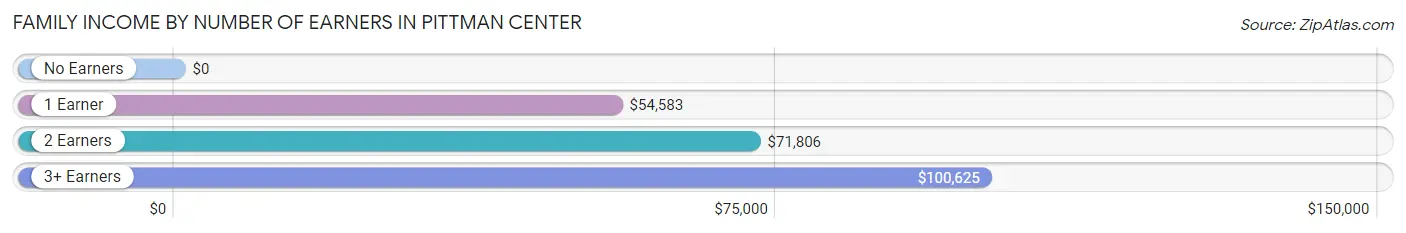
| Number of Earners | # Families | Median Income |
| No Earners | 10 (7.9%) | $0 |
| 1 Earner | 47 (37.0%) | $54,583 |
| 2 Earners | 43 (33.9%) | $71,806 |
| 3+ Earners | 27 (21.3%) | $100,625 |
| Total | 127 (100.0%) | $83,281 |
Household Income in Pittman Center
Household Income Brackets in Pittman Center
With 41 households falling in the category, the $75,000 to $99,999 income range is the most frequent in Pittman Center, accounting for 21.9% of all households. In contrast, only 6 households (3.2%) fall into the $200,000+ income bracket, making it the least populous group.
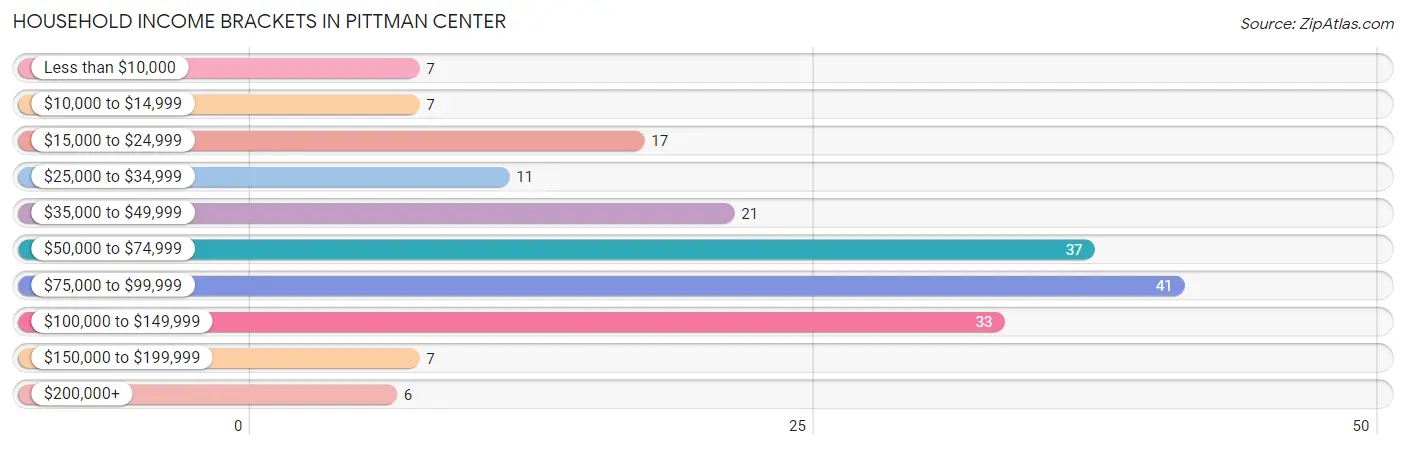
| Income Bracket | # Households | % Households |
| Less than $10,000 | 7 | 3.7% |
| $10,000 to $14,999 | 7 | 3.7% |
| $15,000 to $24,999 | 17 | 9.1% |
| $25,000 to $34,999 | 11 | 5.9% |
| $35,000 to $49,999 | 21 | 11.2% |
| $50,000 to $74,999 | 37 | 19.8% |
| $75,000 to $99,999 | 41 | 21.9% |
| $100,000 to $149,999 | 33 | 17.6% |
| $150,000 to $199,999 | 7 | 3.7% |
| $200,000+ | 6 | 3.2% |
Household Income by Householder Age in Pittman Center
The median household income in Pittman Center is $71,250, with the highest median household income of $80,625 found in the 45 to 64 years age bracket for the primary householder. A total of 79 households (42.2%) fall into this category.
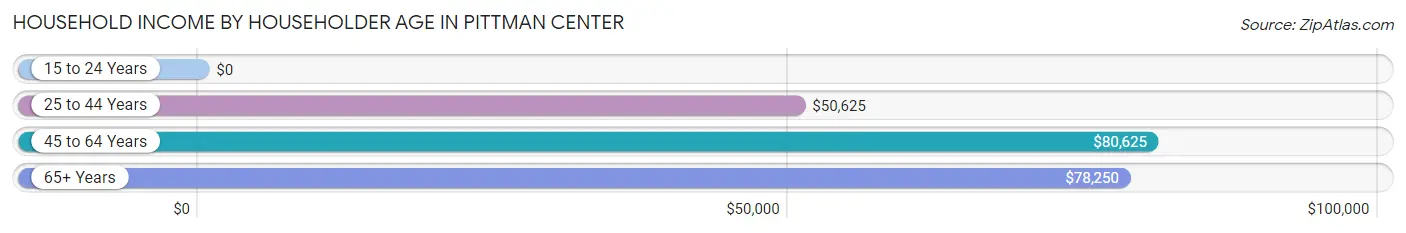
| Income Bracket | # Households | Median Income |
| 15 to 24 Years | 0 (0.0%) | $0 |
| 25 to 44 Years | 57 (30.5%) | $50,625 |
| 45 to 64 Years | 79 (42.2%) | $80,625 |
| 65+ Years | 51 (27.3%) | $78,250 |
| Total | 187 (100.0%) | $71,250 |
Poverty in Pittman Center
Income Below Poverty by Sex and Age in Pittman Center
With 13.3% poverty level for males and 16.7% for females among the residents of Pittman Center, 6 to 11 year old males and under 5 year old females are the most vulnerable to poverty, with 21 males (50.0%) and 10 females (83.3%) in their respective age groups living below the poverty level.
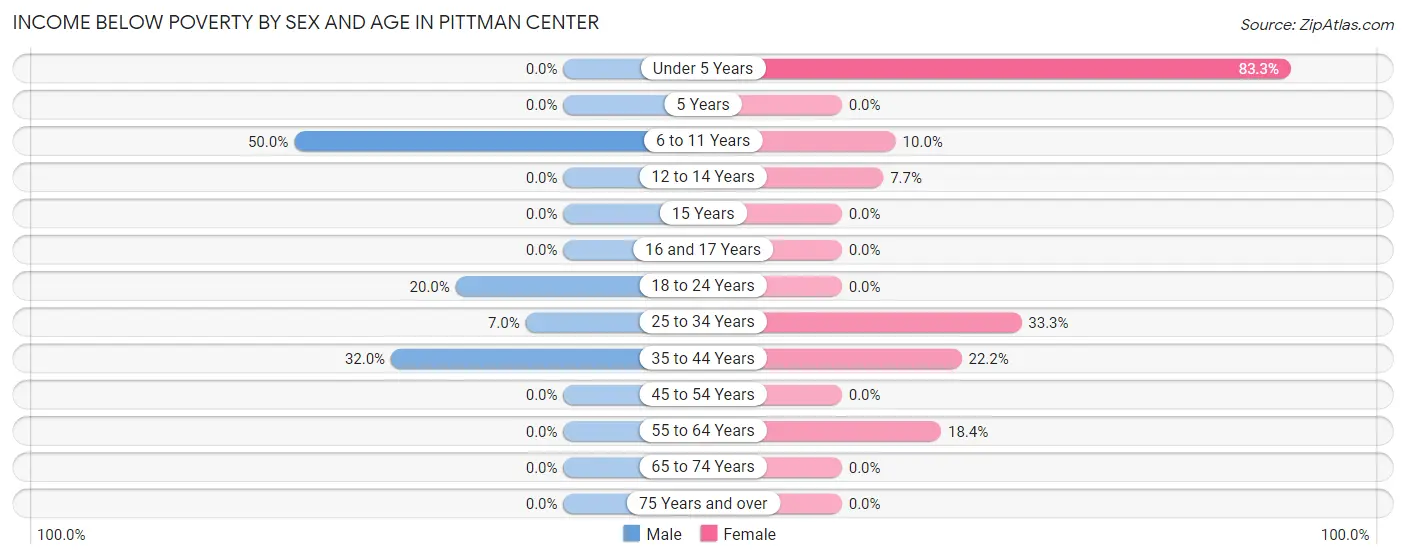
| Age Bracket | Male | Female |
| Under 5 Years | 0 (0.0%) | 10 (83.3%) |
| 5 Years | 0 (0.0%) | 0 (0.0%) |
| 6 to 11 Years | 21 (50.0%) | 1 (10.0%) |
| 12 to 14 Years | 0 (0.0%) | 1 (7.7%) |
| 15 Years | 0 (0.0%) | 0 (0.0%) |
| 16 and 17 Years | 0 (0.0%) | 0 (0.0%) |
| 18 to 24 Years | 5 (20.0%) | 0 (0.0%) |
| 25 to 34 Years | 4 (7.0%) | 11 (33.3%) |
| 35 to 44 Years | 8 (32.0%) | 8 (22.2%) |
| 45 to 54 Years | 0 (0.0%) | 0 (0.0%) |
| 55 to 64 Years | 0 (0.0%) | 7 (18.4%) |
| 65 to 74 Years | 0 (0.0%) | 0 (0.0%) |
| 75 Years and over | 0 (0.0%) | 0 (0.0%) |
| Total | 38 (13.3%) | 38 (16.7%) |
Income Above Poverty by Sex and Age in Pittman Center
According to the poverty statistics in Pittman Center, males aged under 5 years and females aged 5 years are the age groups that are most secure financially, with 100.0% of males and 100.0% of females in these age groups living above the poverty line.
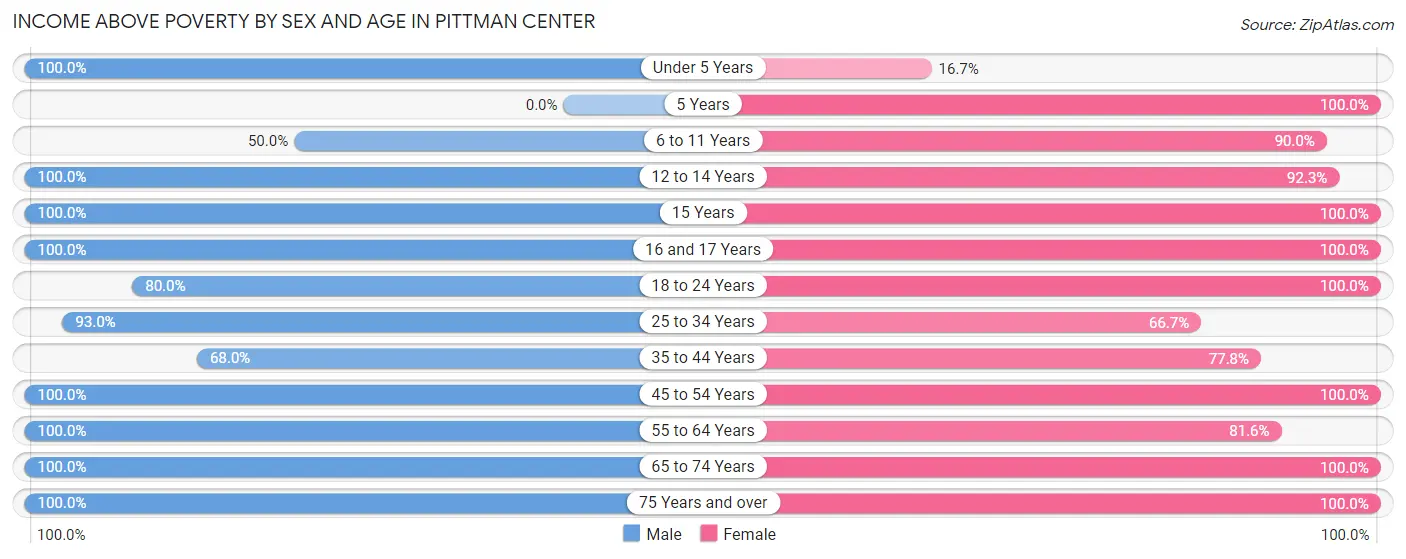
| Age Bracket | Male | Female |
| Under 5 Years | 14 (100.0%) | 2 (16.7%) |
| 5 Years | 0 (0.0%) | 7 (100.0%) |
| 6 to 11 Years | 21 (50.0%) | 9 (90.0%) |
| 12 to 14 Years | 6 (100.0%) | 12 (92.3%) |
| 15 Years | 2 (100.0%) | 5 (100.0%) |
| 16 and 17 Years | 2 (100.0%) | 2 (100.0%) |
| 18 to 24 Years | 20 (80.0%) | 9 (100.0%) |
| 25 to 34 Years | 53 (93.0%) | 22 (66.7%) |
| 35 to 44 Years | 17 (68.0%) | 28 (77.8%) |
| 45 to 54 Years | 17 (100.0%) | 23 (100.0%) |
| 55 to 64 Years | 59 (100.0%) | 31 (81.6%) |
| 65 to 74 Years | 14 (100.0%) | 21 (100.0%) |
| 75 Years and over | 23 (100.0%) | 19 (100.0%) |
| Total | 248 (86.7%) | 190 (83.3%) |
Income Below Poverty Among Married-Couple Families in Pittman Center
The poverty statistics for married-couple families in Pittman Center show that 6.2% or 6 of the total 97 families live below the poverty line. Families with 1 or 2 children have the highest poverty rate of 16.1%, comprising of 5 families. On the other hand, families with no children have the lowest poverty rate of 0.0%, which includes 0 families.
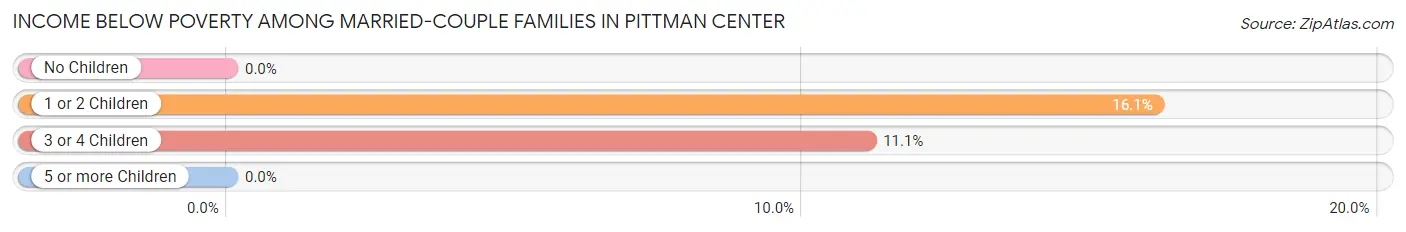
| Children | Above Poverty | Below Poverty |
| No Children | 57 (100.0%) | 0 (0.0%) |
| 1 or 2 Children | 26 (83.9%) | 5 (16.1%) |
| 3 or 4 Children | 8 (88.9%) | 1 (11.1%) |
| 5 or more Children | 0 (0.0%) | 0 (0.0%) |
| Total | 91 (93.8%) | 6 (6.2%) |
Income Below Poverty Among Single-Parent Households in Pittman Center
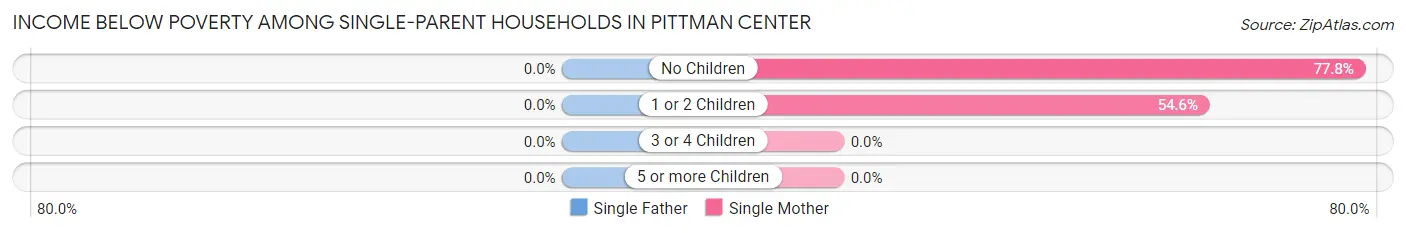
| Children | Single Father | Single Mother |
| No Children | 0 (0.0%) | 7 (77.8%) |
| 1 or 2 Children | 0 (0.0%) | 6 (54.5%) |
| 3 or 4 Children | 0 (0.0%) | 0 (0.0%) |
| 5 or more Children | 0 (0.0%) | 0 (0.0%) |
| Total | 0 (0.0%) | 13 (65.0%) |
Income Below Poverty Among Married-Couple vs Single-Parent Households in Pittman Center
The poverty data for Pittman Center shows that 6 of the married-couple family households (6.2%) and 13 of the single-parent households (43.3%) are living below the poverty level. Within the married-couple family households, those with 1 or 2 children have the highest poverty rate, with 5 households (16.1%) falling below the poverty line. Among the single-parent households, those with no children have the highest poverty rate, with 7 household (46.7%) living below poverty.
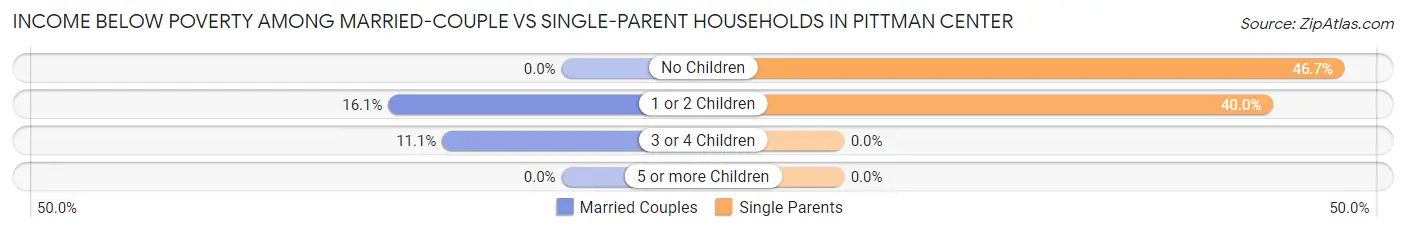
| Children | Married-Couple Families | Single-Parent Households |
| No Children | 0 (0.0%) | 7 (46.7%) |
| 1 or 2 Children | 5 (16.1%) | 6 (40.0%) |
| 3 or 4 Children | 1 (11.1%) | 0 (0.0%) |
| 5 or more Children | 0 (0.0%) | 0 (0.0%) |
| Total | 6 (6.2%) | 13 (43.3%) |
Employment Characteristics in Pittman Center
Employment by Class of Employer in Pittman Center
Among the 252 employed individuals in Pittman Center, private company employees (171 | 67.9%), self-employed (not incorporated) (26 | 10.3%), and local government employees (23 | 9.1%) make up the most common classes of employment.
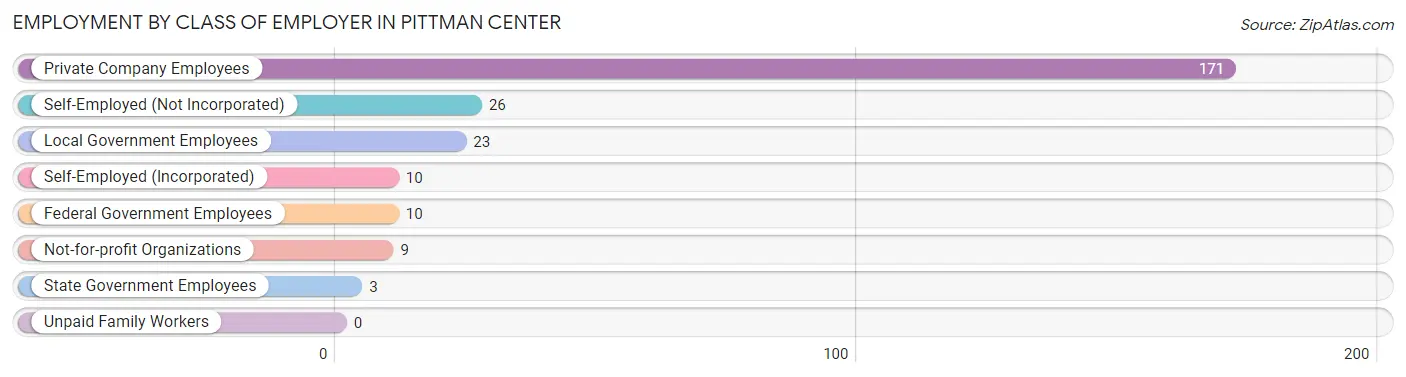
| Employer Class | # Employees | % Employees |
| Private Company Employees | 171 | 67.9% |
| Self-Employed (Incorporated) | 10 | 4.0% |
| Self-Employed (Not Incorporated) | 26 | 10.3% |
| Not-for-profit Organizations | 9 | 3.6% |
| Local Government Employees | 23 | 9.1% |
| State Government Employees | 3 | 1.2% |
| Federal Government Employees | 10 | 4.0% |
| Unpaid Family Workers | 0 | 0.0% |
| Total | 252 | 100.0% |
Employment Status by Age in Pittman Center
According to the labor force statistics for Pittman Center, out of the total population over 16 years of age (403), 67.2% or 271 individuals are in the labor force, with 0.7% or 2 of them unemployed. The age group with the highest labor force participation rate is 20 to 24 years, with 100.0% or 13 individuals in the labor force. Within the labor force, the 60 to 64 years age range has the highest percentage of unemployed individuals, with 3.2% or 2 of them being unemployed.
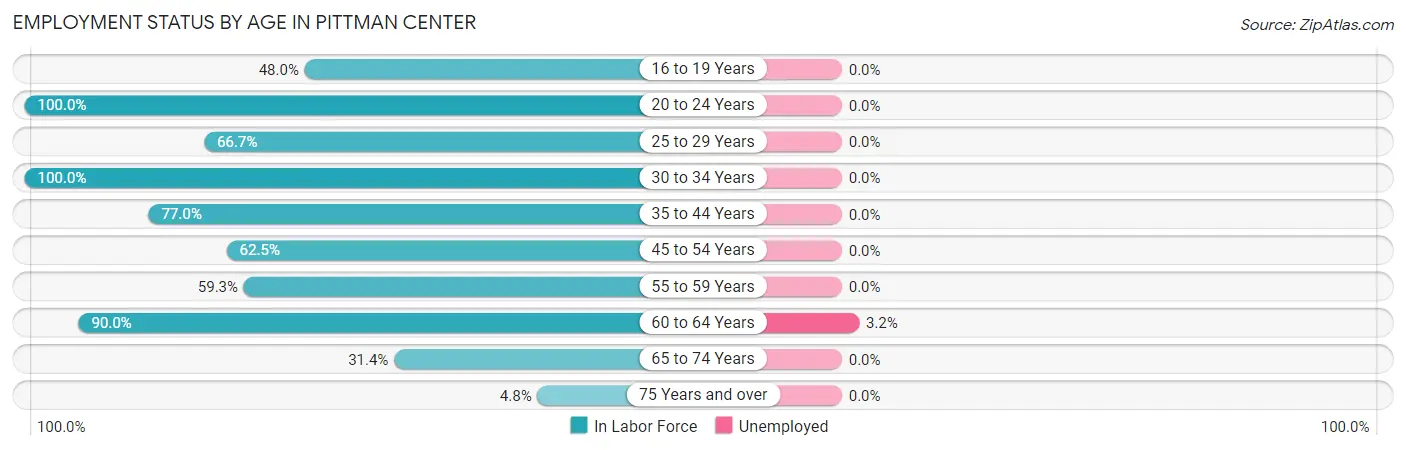
| Age Bracket | In Labor Force | Unemployed |
| 16 to 19 Years | 12 (48.0%) | 0 (0.0%) |
| 20 to 24 Years | 13 (100.0%) | 0 (0.0%) |
| 25 to 29 Years | 16 (66.7%) | 0 (0.0%) |
| 30 to 34 Years | 66 (100.0%) | 0 (0.0%) |
| 35 to 44 Years | 47 (77.0%) | 0 (0.0%) |
| 45 to 54 Years | 25 (62.5%) | 0 (0.0%) |
| 55 to 59 Years | 16 (59.3%) | 0 (0.0%) |
| 60 to 64 Years | 63 (90.0%) | 2 (3.2%) |
| 65 to 74 Years | 11 (31.4%) | 0 (0.0%) |
| 75 Years and over | 2 (4.8%) | 0 (0.0%) |
| Total | 271 (67.2%) | 2 (0.7%) |
Employment Status by Educational Attainment in Pittman Center
According to labor force statistics for Pittman Center, 80.9% of individuals (233) out of the total population between 25 and 64 years of age (288) are in the labor force, with 0.9% or 2 of them being unemployed. The group with the highest labor force participation rate are those with the educational attainment of college / associate degree, with 95.0% or 57 individuals in the labor force. Within the labor force, individuals with college / associate degree education have the highest percentage of unemployment, with 3.5% or 2 of them being unemployed.
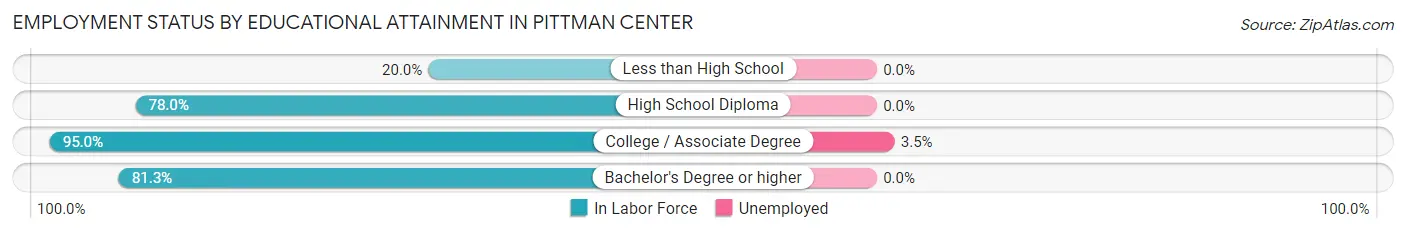
| Educational Attainment | In Labor Force | Unemployed |
| Less than High School | 1 (20.0%) | 0 (0.0%) |
| High School Diploma | 149 (78.0%) | 0 (0.0%) |
| College / Associate Degree | 57 (95.0%) | 2 (3.5%) |
| Bachelor's Degree or higher | 26 (81.3%) | 0 (0.0%) |
| Total | 233 (80.9%) | 3 (0.9%) |
Employment Occupations by Sex in Pittman Center
Management, Business, Science and Arts Occupations
The most common Management, Business, Science and Arts occupations in Pittman Center are Management (31 | 11.5%), Community & Social Service (26 | 9.7%), Education Instruction & Library (13 | 4.8%), Arts, Media & Entertainment (8 | 3.0%), and Health Diagnosing & Treating (8 | 3.0%).

Management, Business, Science and Arts Occupations by Sex
Within the Management, Business, Science and Arts occupations in Pittman Center, the most male-oriented occupations are Computers, Engineering & Science (100.0%), Life, Physical & Social Science (100.0%), and Education, Arts & Media (100.0%), while the most female-oriented occupations are Arts, Media & Entertainment (100.0%), Health Diagnosing & Treating (87.5%), and Business & Financial (75.0%).
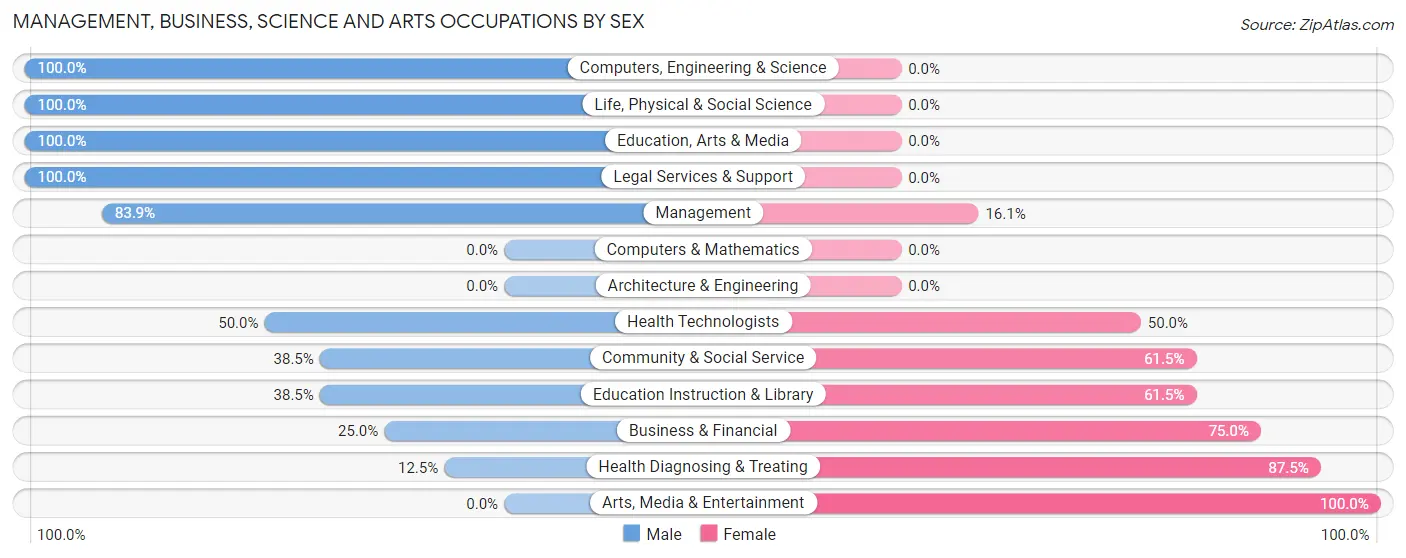
| Occupation | Male | Female |
| Management | 26 (83.9%) | 5 (16.1%) |
| Business & Financial | 1 (25.0%) | 3 (75.0%) |
| Computers, Engineering & Science | 2 (100.0%) | 0 (0.0%) |
| Computers & Mathematics | 0 (0.0%) | 0 (0.0%) |
| Architecture & Engineering | 0 (0.0%) | 0 (0.0%) |
| Life, Physical & Social Science | 2 (100.0%) | 0 (0.0%) |
| Community & Social Service | 10 (38.5%) | 16 (61.5%) |
| Education, Arts & Media | 4 (100.0%) | 0 (0.0%) |
| Legal Services & Support | 1 (100.0%) | 0 (0.0%) |
| Education Instruction & Library | 5 (38.5%) | 8 (61.5%) |
| Arts, Media & Entertainment | 0 (0.0%) | 8 (100.0%) |
| Health Diagnosing & Treating | 1 (12.5%) | 7 (87.5%) |
| Health Technologists | 1 (50.0%) | 1 (50.0%) |
| Total (Category) | 40 (56.3%) | 31 (43.7%) |
| Total (Overall) | 160 (59.5%) | 109 (40.5%) |
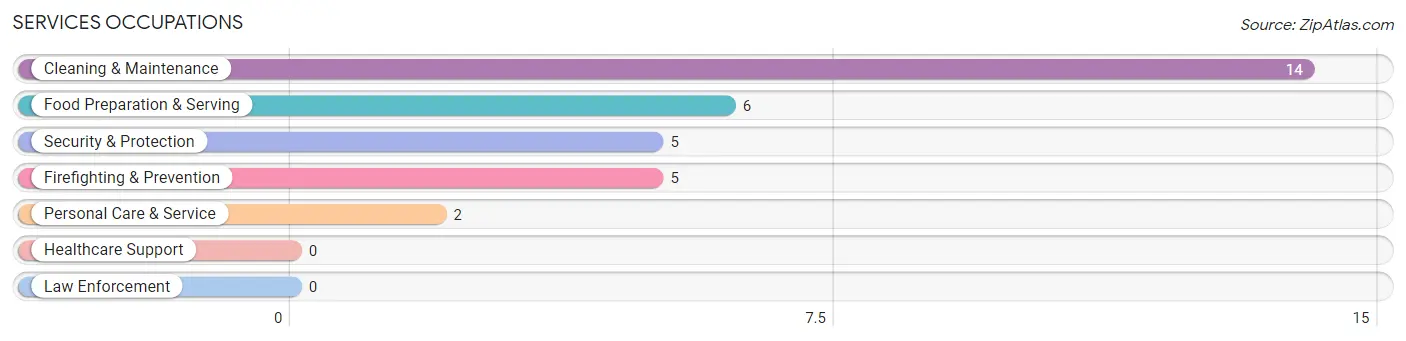
Services Occupations
The most common Services occupations in Pittman Center are Cleaning & Maintenance (14 | 5.2%), Food Preparation & Serving (6 | 2.2%), Security & Protection (5 | 1.9%), Firefighting & Prevention (5 | 1.9%), and Personal Care & Service (2 | 0.7%).
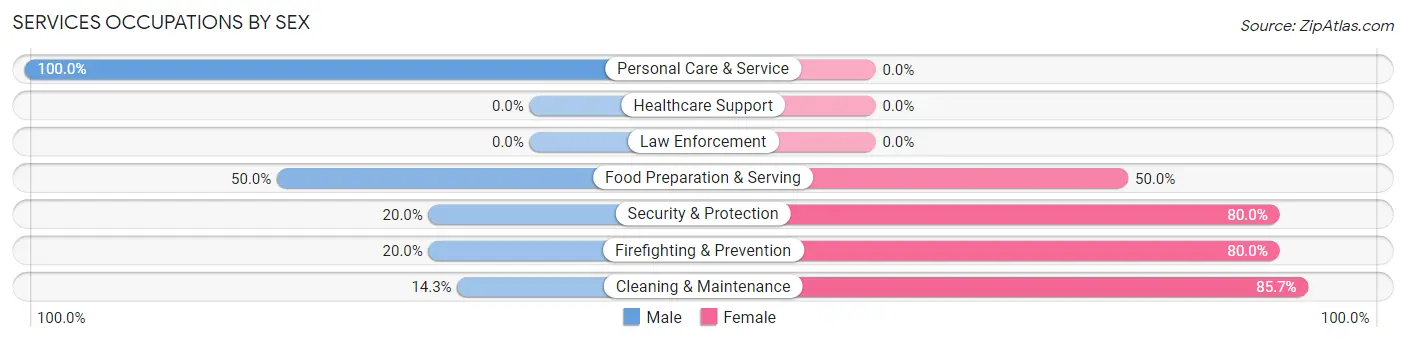
Services Occupations by Sex
Within the Services occupations in Pittman Center, the most male-oriented occupations are Personal Care & Service (100.0%), Food Preparation & Serving (50.0%), and Security & Protection (20.0%), while the most female-oriented occupations are Cleaning & Maintenance (85.7%), Security & Protection (80.0%), and Firefighting & Prevention (80.0%).
| Occupation | Male | Female |
| Healthcare Support | 0 (0.0%) | 0 (0.0%) |
| Security & Protection | 1 (20.0%) | 4 (80.0%) |
| Firefighting & Prevention | 1 (20.0%) | 4 (80.0%) |
| Law Enforcement | 0 (0.0%) | 0 (0.0%) |
| Food Preparation & Serving | 3 (50.0%) | 3 (50.0%) |
| Cleaning & Maintenance | 2 (14.3%) | 12 (85.7%) |
| Personal Care & Service | 2 (100.0%) | 0 (0.0%) |
| Total (Category) | 8 (29.6%) | 19 (70.4%) |
| Total (Overall) | 160 (59.5%) | 109 (40.5%) |
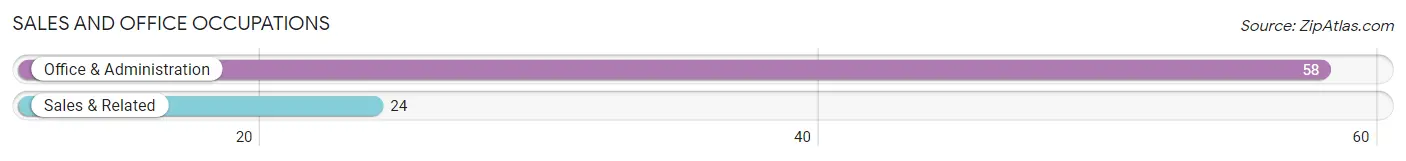
Sales and Office Occupations
The most common Sales and Office occupations in Pittman Center are Office & Administration (58 | 21.6%), and Sales & Related (24 | 8.9%).
Sales and Office Occupations by Sex

| Occupation | Male | Female |
| Sales & Related | 8 (33.3%) | 16 (66.7%) |
| Office & Administration | 38 (65.5%) | 20 (34.5%) |
| Total (Category) | 46 (56.1%) | 36 (43.9%) |
| Total (Overall) | 160 (59.5%) | 109 (40.5%) |
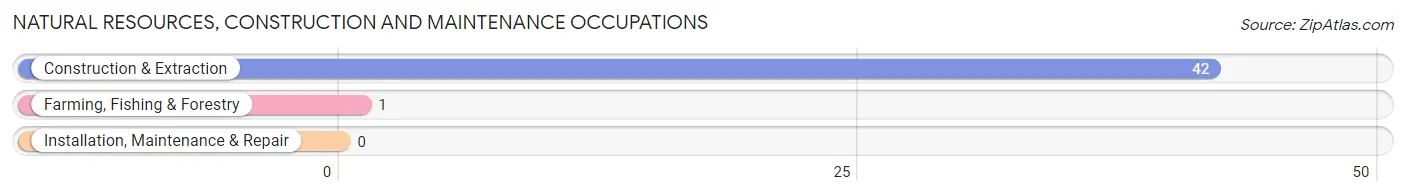
Natural Resources, Construction and Maintenance Occupations
The most common Natural Resources, Construction and Maintenance occupations in Pittman Center are Construction & Extraction (42 | 15.6%), and Farming, Fishing & Forestry (1 | 0.4%).
Natural Resources, Construction and Maintenance Occupations by Sex
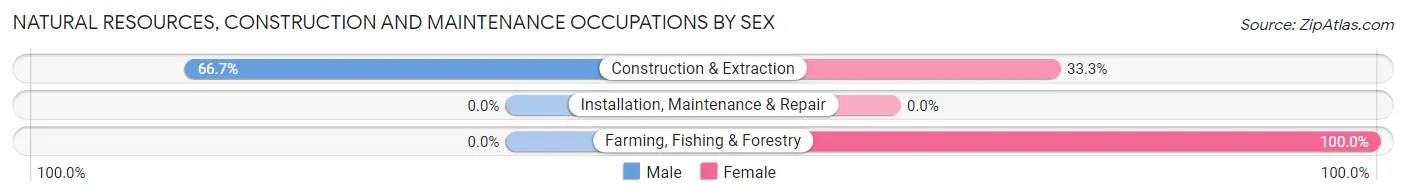
| Occupation | Male | Female |
| Farming, Fishing & Forestry | 0 (0.0%) | 1 (100.0%) |
| Construction & Extraction | 28 (66.7%) | 14 (33.3%) |
| Installation, Maintenance & Repair | 0 (0.0%) | 0 (0.0%) |
| Total (Category) | 28 (65.1%) | 15 (34.9%) |
| Total (Overall) | 160 (59.5%) | 109 (40.5%) |
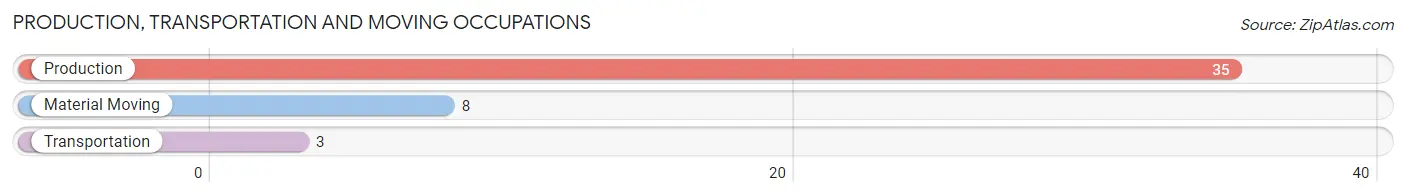
Production, Transportation and Moving Occupations
The most common Production, Transportation and Moving occupations in Pittman Center are Production (35 | 13.0%), Material Moving (8 | 3.0%), and Transportation (3 | 1.1%).
Production, Transportation and Moving Occupations by Sex
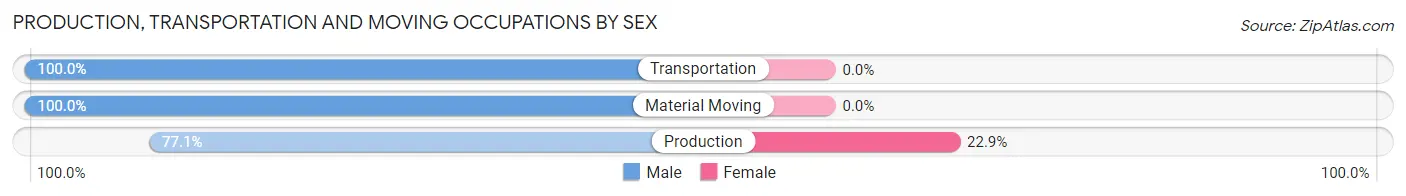
| Occupation | Male | Female |
| Production | 27 (77.1%) | 8 (22.9%) |
| Transportation | 3 (100.0%) | 0 (0.0%) |
| Material Moving | 8 (100.0%) | 0 (0.0%) |
| Total (Category) | 38 (82.6%) | 8 (17.4%) |
| Total (Overall) | 160 (59.5%) | 109 (40.5%) |
Employment Industries by Sex in Pittman Center
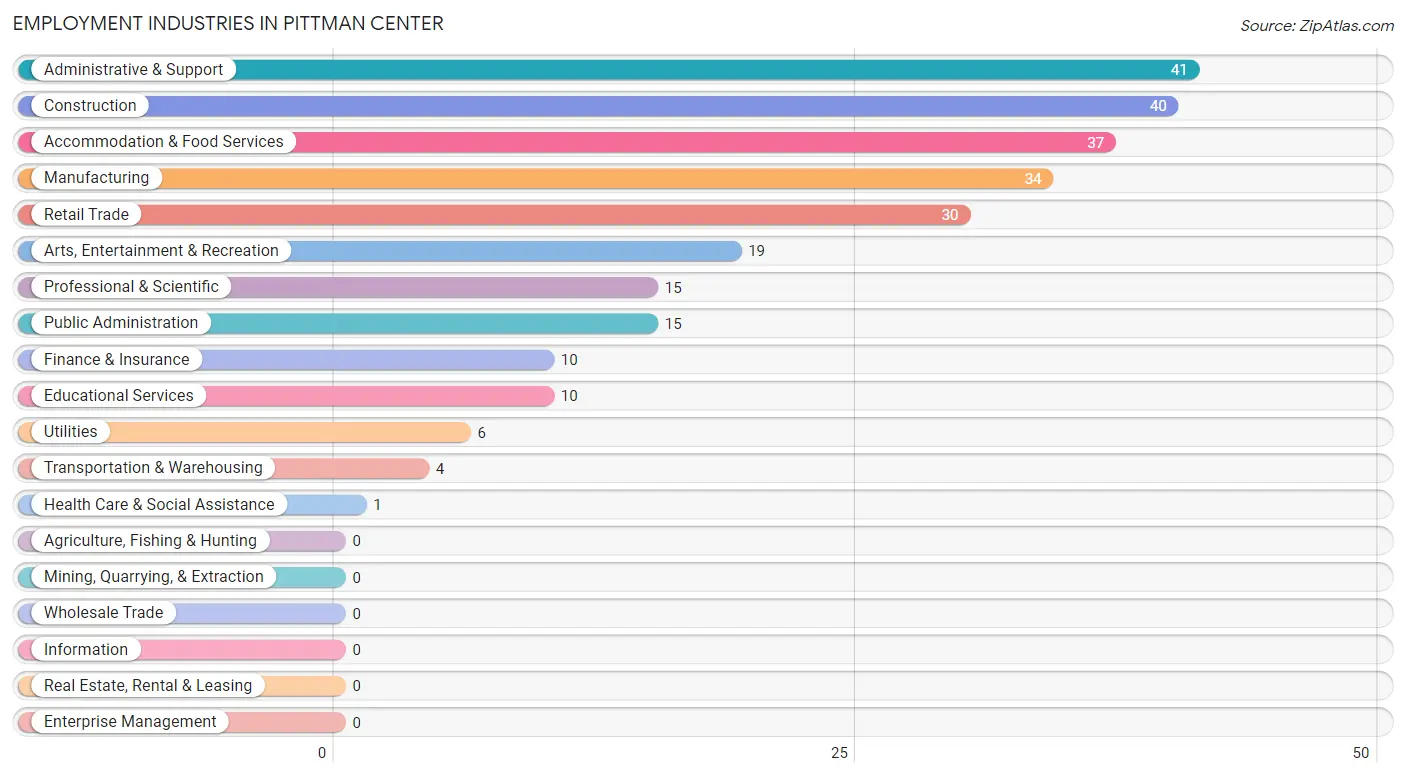
Employment Industries in Pittman Center
The major employment industries in Pittman Center include Administrative & Support (41 | 15.2%), Construction (40 | 14.9%), Accommodation & Food Services (37 | 13.8%), Manufacturing (34 | 12.6%), and Retail Trade (30 | 11.2%).
Employment Industries by Sex in Pittman Center
The Pittman Center industries that see more men than women are Transportation & Warehousing (100.0%), Utilities (100.0%), and Health Care & Social Assistance (100.0%), whereas the industries that tend to have a higher number of women are Public Administration (86.7%), Retail Trade (73.3%), and Finance & Insurance (70.0%).
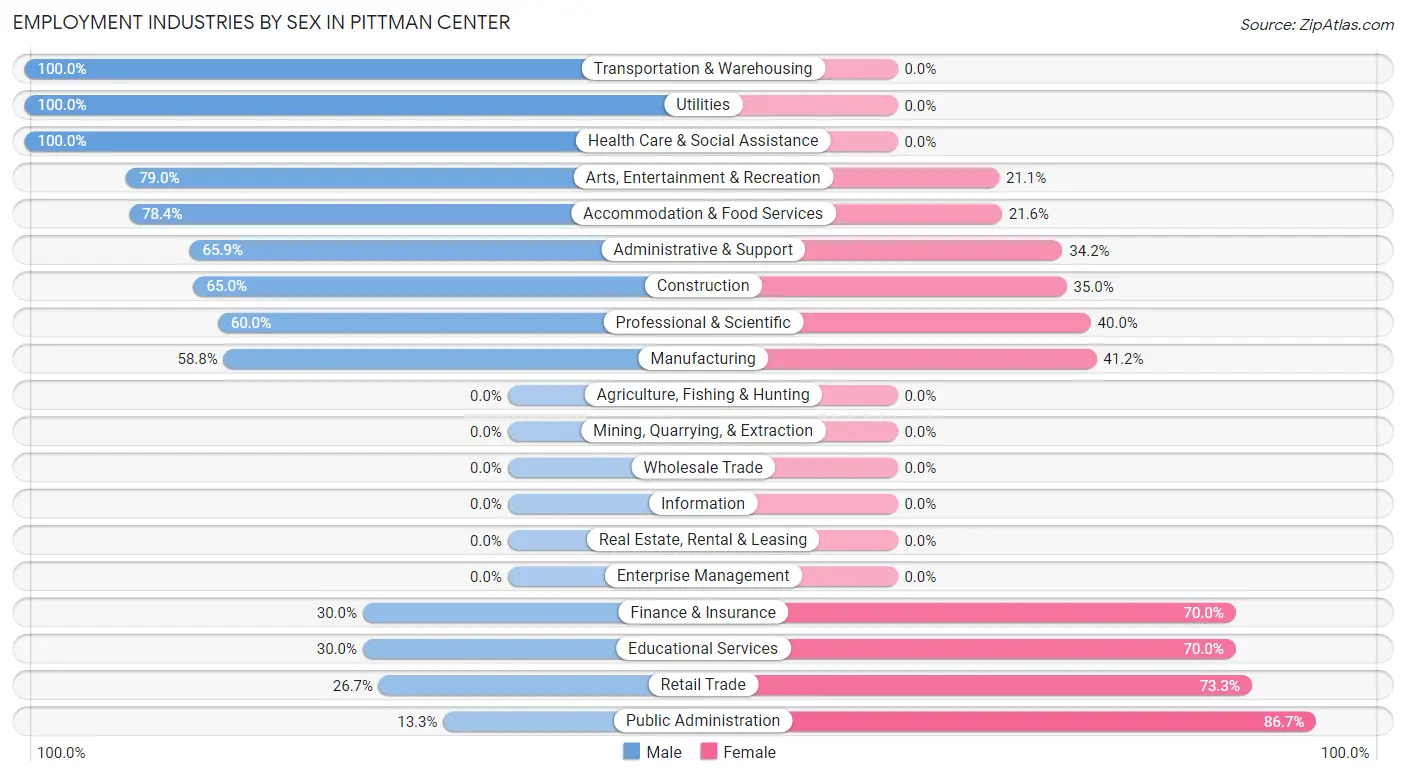
| Industry | Male | Female |
| Agriculture, Fishing & Hunting | 0 (0.0%) | 0 (0.0%) |
| Mining, Quarrying, & Extraction | 0 (0.0%) | 0 (0.0%) |
| Construction | 26 (65.0%) | 14 (35.0%) |
| Manufacturing | 20 (58.8%) | 14 (41.2%) |
| Wholesale Trade | 0 (0.0%) | 0 (0.0%) |
| Retail Trade | 8 (26.7%) | 22 (73.3%) |
| Transportation & Warehousing | 4 (100.0%) | 0 (0.0%) |
| Utilities | 6 (100.0%) | 0 (0.0%) |
| Information | 0 (0.0%) | 0 (0.0%) |
| Finance & Insurance | 3 (30.0%) | 7 (70.0%) |
| Real Estate, Rental & Leasing | 0 (0.0%) | 0 (0.0%) |
| Professional & Scientific | 9 (60.0%) | 6 (40.0%) |
| Enterprise Management | 0 (0.0%) | 0 (0.0%) |
| Administrative & Support | 27 (65.8%) | 14 (34.2%) |
| Educational Services | 3 (30.0%) | 7 (70.0%) |
| Health Care & Social Assistance | 1 (100.0%) | 0 (0.0%) |
| Arts, Entertainment & Recreation | 15 (78.9%) | 4 (21.0%) |
| Accommodation & Food Services | 29 (78.4%) | 8 (21.6%) |
| Public Administration | 2 (13.3%) | 13 (86.7%) |
| Total | 160 (59.5%) | 109 (40.5%) |
Education in Pittman Center
School Enrollment in Pittman Center
The most common levels of schooling among the 103 students in Pittman Center are elementary school (39 | 37.9%), high school (29 | 28.2%), and kindergarten (16 | 15.5%).
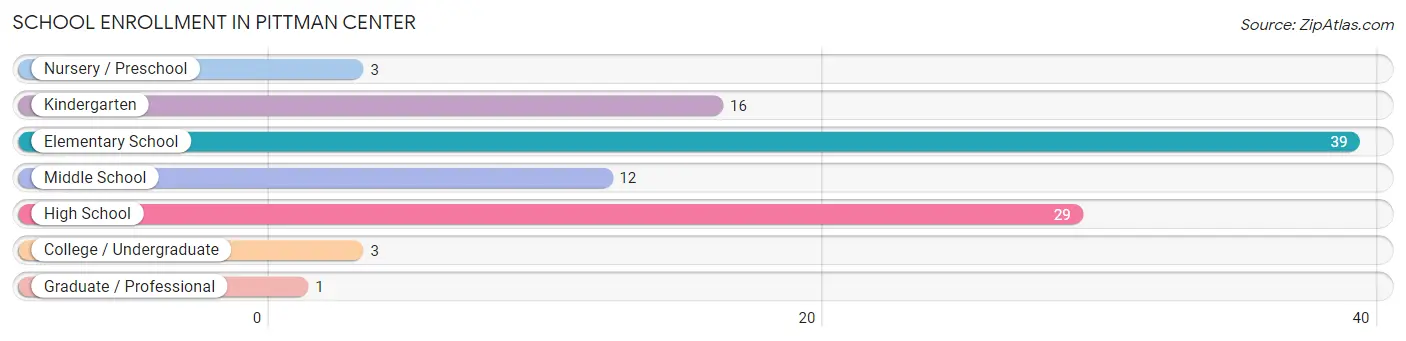
| School Level | # Students | % Students |
| Nursery / Preschool | 3 | 2.9% |
| Kindergarten | 16 | 15.5% |
| Elementary School | 39 | 37.9% |
| Middle School | 12 | 11.7% |
| High School | 29 | 28.2% |
| College / Undergraduate | 3 | 2.9% |
| Graduate / Professional | 1 | 1.0% |
| Total | 103 | 100.0% |
School Enrollment by Age by Funding Source in Pittman Center
Out of a total of 103 students who are enrolled in schools in Pittman Center, 14 (13.6%) attend a private institution, while the remaining 89 (86.4%) are enrolled in public schools. The age group of 3 to 4 year olds has the highest likelihood of being enrolled in private schools, with 2 (100.0% in the age bracket) enrolled. Conversely, the age group of 10 to 14 year olds has the lowest likelihood of being enrolled in a private school, with 29 (100.0% in the age bracket) attending a public institution.
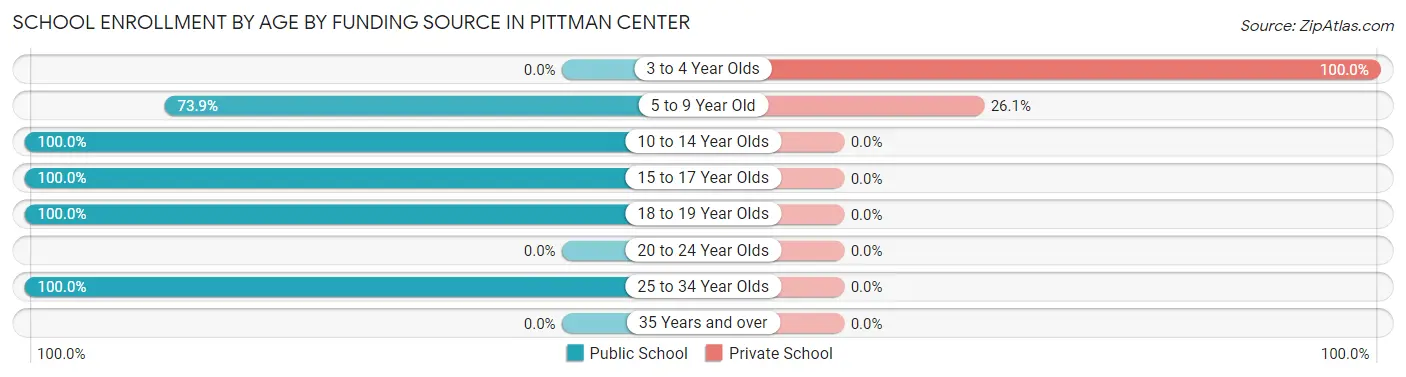
| Age Bracket | Public School | Private School |
| 3 to 4 Year Olds | 0 (0.0%) | 2 (100.0%) |
| 5 to 9 Year Old | 34 (73.9%) | 12 (26.1%) |
| 10 to 14 Year Olds | 29 (100.0%) | 0 (0.0%) |
| 15 to 17 Year Olds | 11 (100.0%) | 0 (0.0%) |
| 18 to 19 Year Olds | 14 (100.0%) | 0 (0.0%) |
| 20 to 24 Year Olds | 0 (0.0%) | 0 (0.0%) |
| 25 to 34 Year Olds | 1 (100.0%) | 0 (0.0%) |
| 35 Years and over | 0 (0.0%) | 0 (0.0%) |
| Total | 89 (86.4%) | 14 (13.6%) |
Educational Attainment by Field of Study in Pittman Center
Education (23 | 42.6%), business (14 | 25.9%), social sciences (5 | 9.3%), bio, nature & agricultural (4 | 7.4%), and arts & humanities (3 | 5.6%) are the most common fields of study among 54 individuals in Pittman Center who have obtained a bachelor's degree or higher.
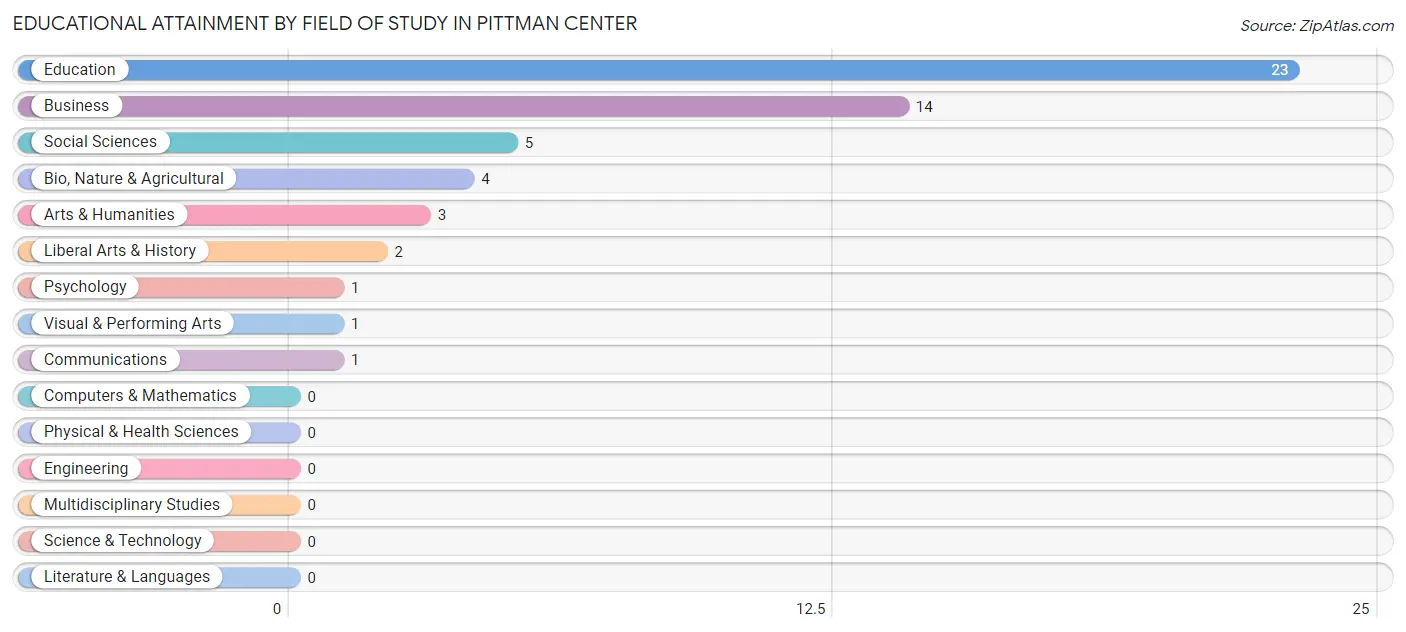
| Field of Study | # Graduates | % Graduates |
| Computers & Mathematics | 0 | 0.0% |
| Bio, Nature & Agricultural | 4 | 7.4% |
| Physical & Health Sciences | 0 | 0.0% |
| Psychology | 1 | 1.8% |
| Social Sciences | 5 | 9.3% |
| Engineering | 0 | 0.0% |
| Multidisciplinary Studies | 0 | 0.0% |
| Science & Technology | 0 | 0.0% |
| Business | 14 | 25.9% |
| Education | 23 | 42.6% |
| Literature & Languages | 0 | 0.0% |
| Liberal Arts & History | 2 | 3.7% |
| Visual & Performing Arts | 1 | 1.8% |
| Communications | 1 | 1.8% |
| Arts & Humanities | 3 | 5.6% |
| Total | 54 | 100.0% |
Transportation & Commute in Pittman Center
Vehicle Availability by Sex in Pittman Center
The most prevalent vehicle ownership categories in Pittman Center are males with 3 vehicles (51, accounting for 35.4%) and females with 3 vehicles (37, making up 47.2%).
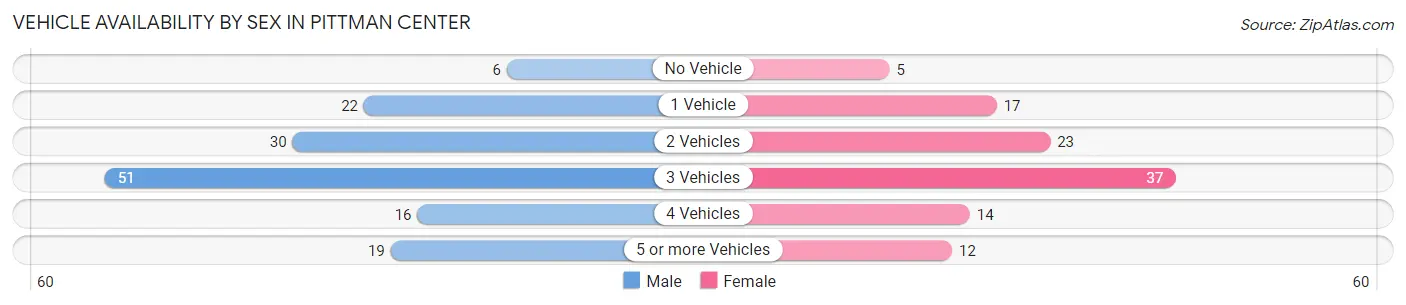
| Vehicles Available | Male | Female |
| No Vehicle | 6 (4.2%) | 5 (4.6%) |
| 1 Vehicle | 22 (15.3%) | 17 (15.7%) |
| 2 Vehicles | 30 (20.8%) | 23 (21.3%) |
| 3 Vehicles | 51 (35.4%) | 37 (34.3%) |
| 4 Vehicles | 16 (11.1%) | 14 (13.0%) |
| 5 or more Vehicles | 19 (13.2%) | 12 (11.1%) |
| Total | 144 (100.0%) | 108 (100.0%) |
Commute Time in Pittman Center
The most frequently occuring commute durations in Pittman Center are 20 to 24 minutes (51 commuters, 21.5%), 25 to 29 minutes (40 commuters, 16.9%), and 30 to 34 minutes (40 commuters, 16.9%).
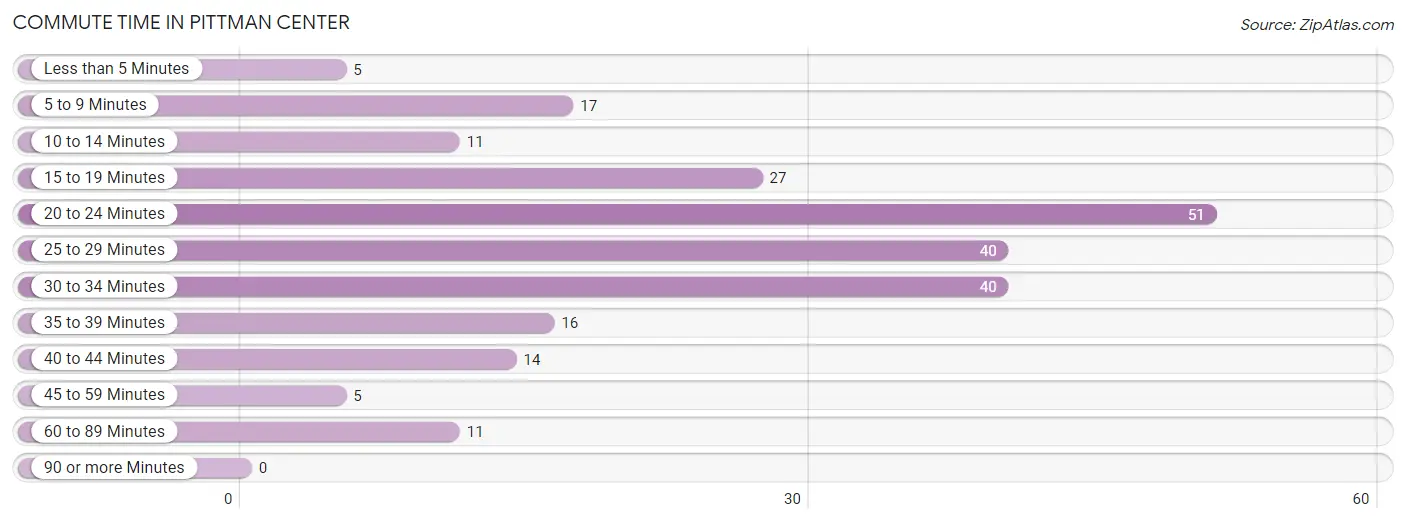
| Commute Time | # Commuters | % Commuters |
| Less than 5 Minutes | 5 | 2.1% |
| 5 to 9 Minutes | 17 | 7.2% |
| 10 to 14 Minutes | 11 | 4.6% |
| 15 to 19 Minutes | 27 | 11.4% |
| 20 to 24 Minutes | 51 | 21.5% |
| 25 to 29 Minutes | 40 | 16.9% |
| 30 to 34 Minutes | 40 | 16.9% |
| 35 to 39 Minutes | 16 | 6.8% |
| 40 to 44 Minutes | 14 | 5.9% |
| 45 to 59 Minutes | 5 | 2.1% |
| 60 to 89 Minutes | 11 | 4.6% |
| 90 or more Minutes | 0 | 0.0% |
Commute Time by Sex in Pittman Center
The most common commute times in Pittman Center are 25 to 29 minutes (29 commuters, 21.5%) for males and 20 to 24 minutes (34 commuters, 33.3%) for females.

| Commute Time | Male | Female |
| Less than 5 Minutes | 2 (1.5%) | 3 (2.9%) |
| 5 to 9 Minutes | 8 (5.9%) | 9 (8.8%) |
| 10 to 14 Minutes | 9 (6.7%) | 2 (2.0%) |
| 15 to 19 Minutes | 18 (13.3%) | 9 (8.8%) |
| 20 to 24 Minutes | 17 (12.6%) | 34 (33.3%) |
| 25 to 29 Minutes | 29 (21.5%) | 11 (10.8%) |
| 30 to 34 Minutes | 29 (21.5%) | 11 (10.8%) |
| 35 to 39 Minutes | 0 (0.0%) | 16 (15.7%) |
| 40 to 44 Minutes | 14 (10.4%) | 0 (0.0%) |
| 45 to 59 Minutes | 0 (0.0%) | 5 (4.9%) |
| 60 to 89 Minutes | 9 (6.7%) | 2 (2.0%) |
| 90 or more Minutes | 0 (0.0%) | 0 (0.0%) |
Time of Departure to Work by Sex in Pittman Center
The most frequent times of departure to work in Pittman Center are 7:00 AM to 7:29 AM (50, 37.0%) for males and 7:30 AM to 7:59 AM (27, 26.5%) for females.
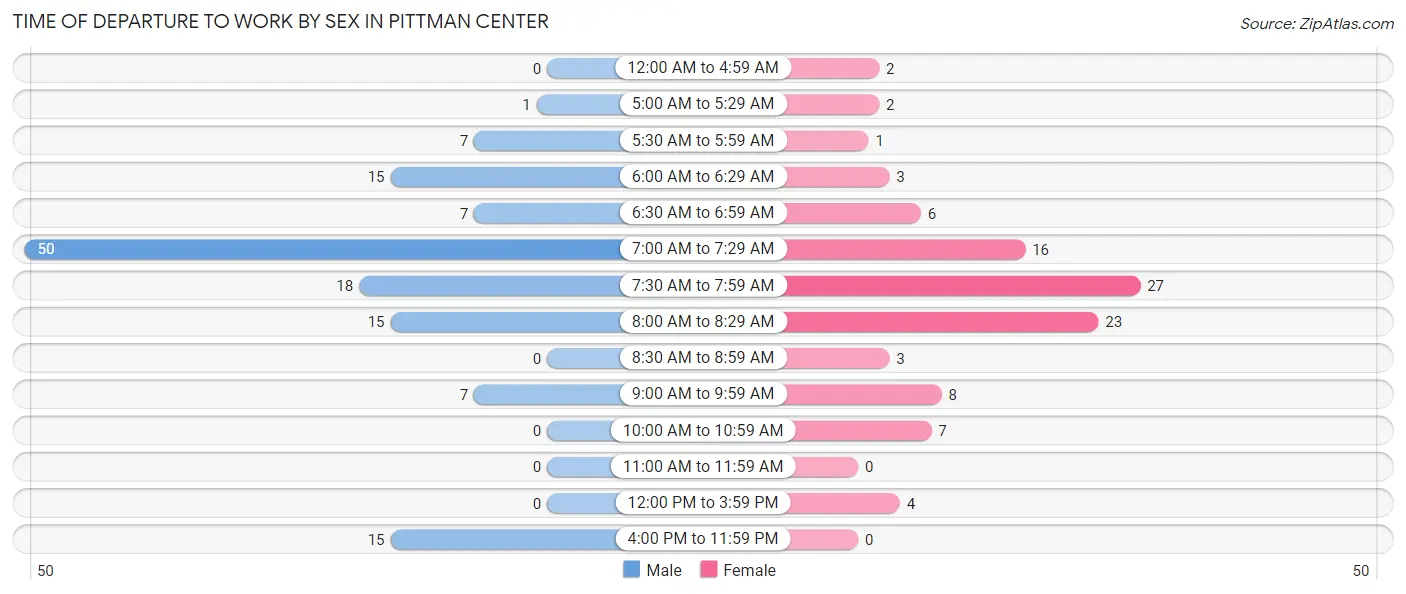
| Time of Departure | Male | Female |
| 12:00 AM to 4:59 AM | 0 (0.0%) | 2 (2.0%) |
| 5:00 AM to 5:29 AM | 1 (0.7%) | 2 (2.0%) |
| 5:30 AM to 5:59 AM | 7 (5.2%) | 1 (1.0%) |
| 6:00 AM to 6:29 AM | 15 (11.1%) | 3 (2.9%) |
| 6:30 AM to 6:59 AM | 7 (5.2%) | 6 (5.9%) |
| 7:00 AM to 7:29 AM | 50 (37.0%) | 16 (15.7%) |
| 7:30 AM to 7:59 AM | 18 (13.3%) | 27 (26.5%) |
| 8:00 AM to 8:29 AM | 15 (11.1%) | 23 (22.6%) |
| 8:30 AM to 8:59 AM | 0 (0.0%) | 3 (2.9%) |
| 9:00 AM to 9:59 AM | 7 (5.2%) | 8 (7.8%) |
| 10:00 AM to 10:59 AM | 0 (0.0%) | 7 (6.9%) |
| 11:00 AM to 11:59 AM | 0 (0.0%) | 0 (0.0%) |
| 12:00 PM to 3:59 PM | 0 (0.0%) | 4 (3.9%) |
| 4:00 PM to 11:59 PM | 15 (11.1%) | 0 (0.0%) |
| Total | 135 (100.0%) | 102 (100.0%) |
Housing Occupancy in Pittman Center
Occupancy by Ownership in Pittman Center
Of the total 187 dwellings in Pittman Center, owner-occupied units account for 139 (74.3%), while renter-occupied units make up 48 (25.7%).
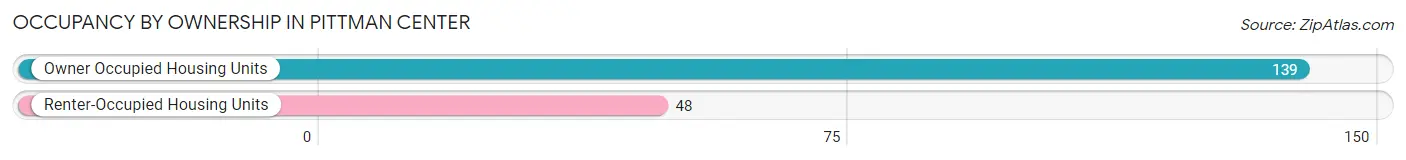
| Occupancy | # Housing Units | % Housing Units |
| Owner Occupied Housing Units | 139 | 74.3% |
| Renter-Occupied Housing Units | 48 | 25.7% |
| Total Occupied Housing Units | 187 | 100.0% |
Occupancy by Household Size in Pittman Center
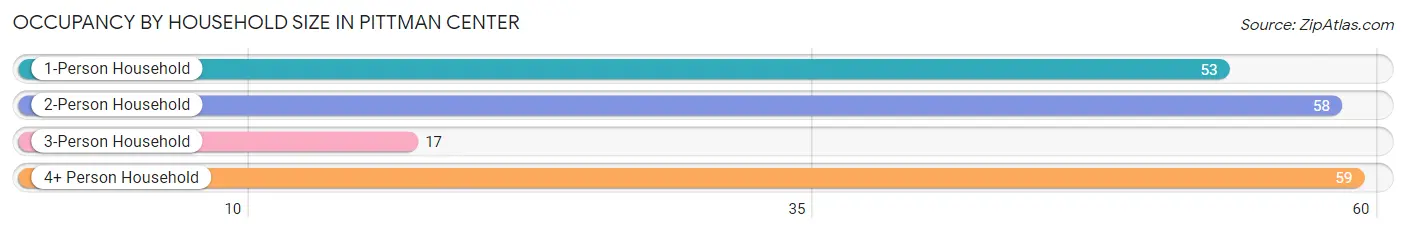
| Household Size | # Housing Units | % Housing Units |
| 1-Person Household | 53 | 28.3% |
| 2-Person Household | 58 | 31.0% |
| 3-Person Household | 17 | 9.1% |
| 4+ Person Household | 59 | 31.6% |
| Total Housing Units | 187 | 100.0% |
Occupancy by Ownership by Household Size in Pittman Center

| Household Size | Owner-occupied | Renter-occupied |
| 1-Person Household | 40 (75.5%) | 13 (24.5%) |
| 2-Person Household | 40 (69.0%) | 18 (31.0%) |
| 3-Person Household | 17 (100.0%) | 0 (0.0%) |
| 4+ Person Household | 42 (71.2%) | 17 (28.8%) |
| Total Housing Units | 139 (74.3%) | 48 (25.7%) |
Occupancy by Educational Attainment in Pittman Center
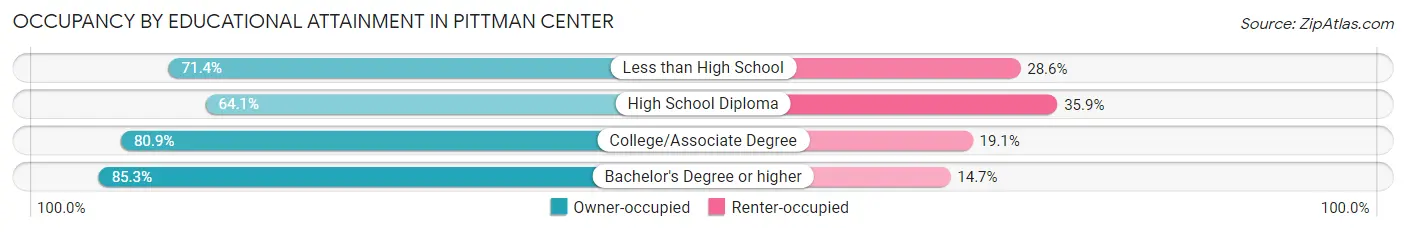
| Household Size | Owner-occupied | Renter-occupied |
| Less than High School | 5 (71.4%) | 2 (28.6%) |
| High School Diploma | 50 (64.1%) | 28 (35.9%) |
| College/Associate Degree | 55 (80.9%) | 13 (19.1%) |
| Bachelor's Degree or higher | 29 (85.3%) | 5 (14.7%) |
Occupancy by Age of Householder in Pittman Center
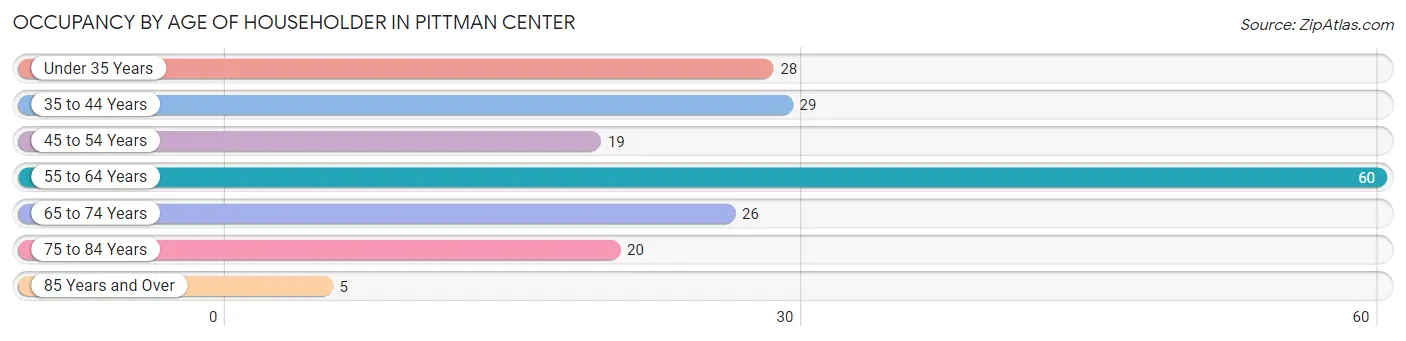
| Age Bracket | # Households | % Households |
| Under 35 Years | 28 | 15.0% |
| 35 to 44 Years | 29 | 15.5% |
| 45 to 54 Years | 19 | 10.2% |
| 55 to 64 Years | 60 | 32.1% |
| 65 to 74 Years | 26 | 13.9% |
| 75 to 84 Years | 20 | 10.7% |
| 85 Years and Over | 5 | 2.7% |
| Total | 187 | 100.0% |
Housing Finances in Pittman Center
Median Income by Occupancy in Pittman Center
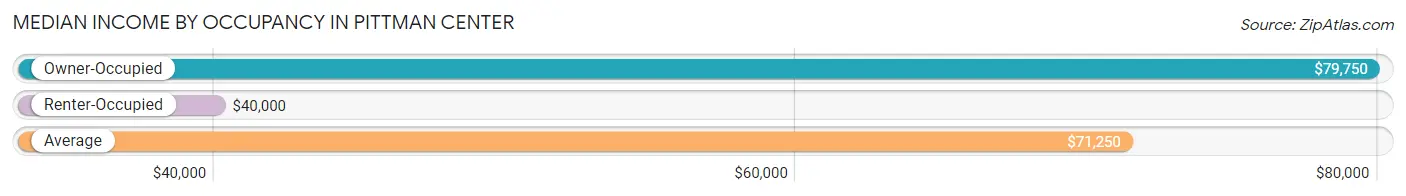
| Occupancy Type | # Households | Median Income |
| Owner-Occupied | 139 (74.3%) | $79,750 |
| Renter-Occupied | 48 (25.7%) | $40,000 |
| Average | 187 (100.0%) | $71,250 |
Occupancy by Householder Income Bracket in Pittman Center
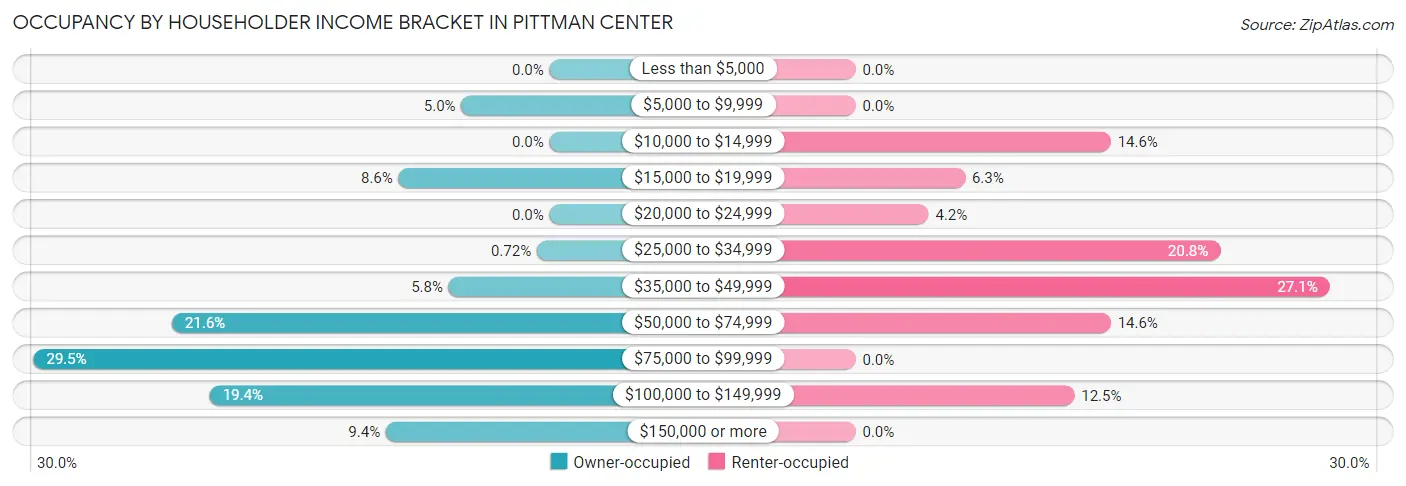
| Income Bracket | Owner-occupied | Renter-occupied |
| Less than $5,000 | 0 (0.0%) | 0 (0.0%) |
| $5,000 to $9,999 | 7 (5.0%) | 0 (0.0%) |
| $10,000 to $14,999 | 0 (0.0%) | 7 (14.6%) |
| $15,000 to $19,999 | 12 (8.6%) | 3 (6.2%) |
| $20,000 to $24,999 | 0 (0.0%) | 2 (4.2%) |
| $25,000 to $34,999 | 1 (0.7%) | 10 (20.8%) |
| $35,000 to $49,999 | 8 (5.8%) | 13 (27.1%) |
| $50,000 to $74,999 | 30 (21.6%) | 7 (14.6%) |
| $75,000 to $99,999 | 41 (29.5%) | 0 (0.0%) |
| $100,000 to $149,999 | 27 (19.4%) | 6 (12.5%) |
| $150,000 or more | 13 (9.3%) | 0 (0.0%) |
| Total | 139 (100.0%) | 48 (100.0%) |
Monthly Housing Cost Tiers in Pittman Center
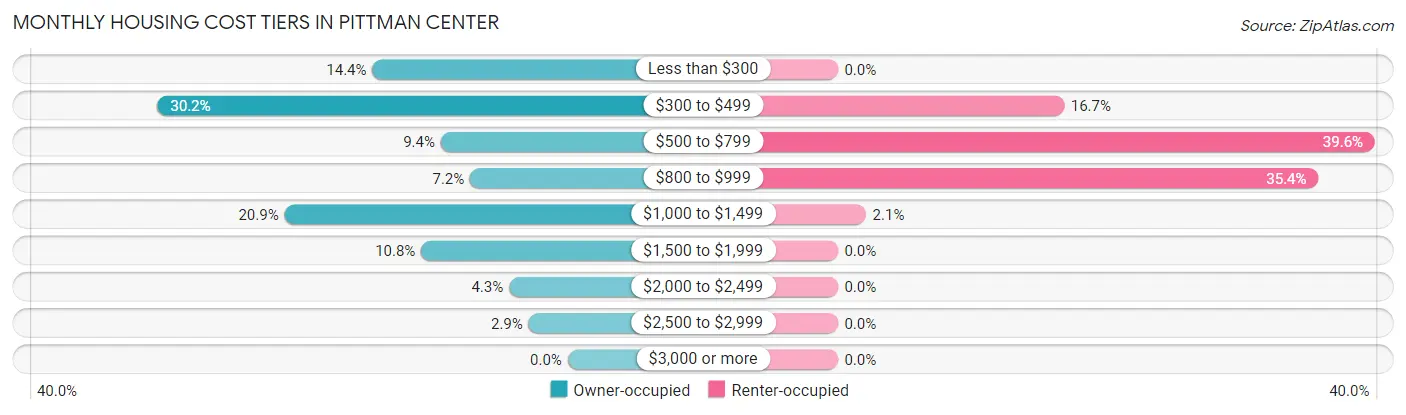
| Monthly Cost | Owner-occupied | Renter-occupied |
| Less than $300 | 20 (14.4%) | 0 (0.0%) |
| $300 to $499 | 42 (30.2%) | 8 (16.7%) |
| $500 to $799 | 13 (9.3%) | 19 (39.6%) |
| $800 to $999 | 10 (7.2%) | 17 (35.4%) |
| $1,000 to $1,499 | 29 (20.9%) | 1 (2.1%) |
| $1,500 to $1,999 | 15 (10.8%) | 0 (0.0%) |
| $2,000 to $2,499 | 6 (4.3%) | 0 (0.0%) |
| $2,500 to $2,999 | 4 (2.9%) | 0 (0.0%) |
| $3,000 or more | 0 (0.0%) | 0 (0.0%) |
| Total | 139 (100.0%) | 48 (100.0%) |
Physical Housing Characteristics in Pittman Center
Housing Structures in Pittman Center
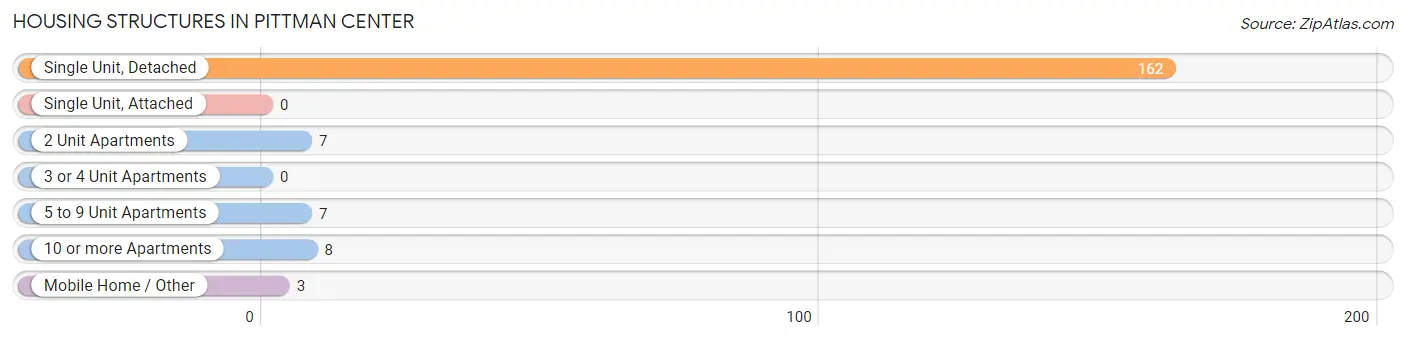
| Structure Type | # Housing Units | % Housing Units |
| Single Unit, Detached | 162 | 86.6% |
| Single Unit, Attached | 0 | 0.0% |
| 2 Unit Apartments | 7 | 3.7% |
| 3 or 4 Unit Apartments | 0 | 0.0% |
| 5 to 9 Unit Apartments | 7 | 3.7% |
| 10 or more Apartments | 8 | 4.3% |
| Mobile Home / Other | 3 | 1.6% |
| Total | 187 | 100.0% |
Housing Structures by Occupancy in Pittman Center
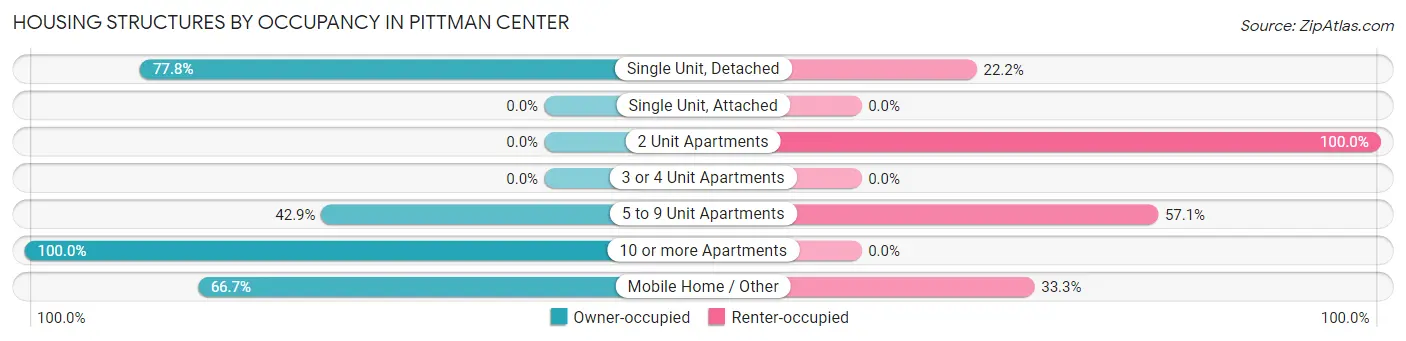
| Structure Type | Owner-occupied | Renter-occupied |
| Single Unit, Detached | 126 (77.8%) | 36 (22.2%) |
| Single Unit, Attached | 0 (0.0%) | 0 (0.0%) |
| 2 Unit Apartments | 0 (0.0%) | 7 (100.0%) |
| 3 or 4 Unit Apartments | 0 (0.0%) | 0 (0.0%) |
| 5 to 9 Unit Apartments | 3 (42.9%) | 4 (57.1%) |
| 10 or more Apartments | 8 (100.0%) | 0 (0.0%) |
| Mobile Home / Other | 2 (66.7%) | 1 (33.3%) |
| Total | 139 (74.3%) | 48 (25.7%) |
Housing Structures by Number of Rooms in Pittman Center
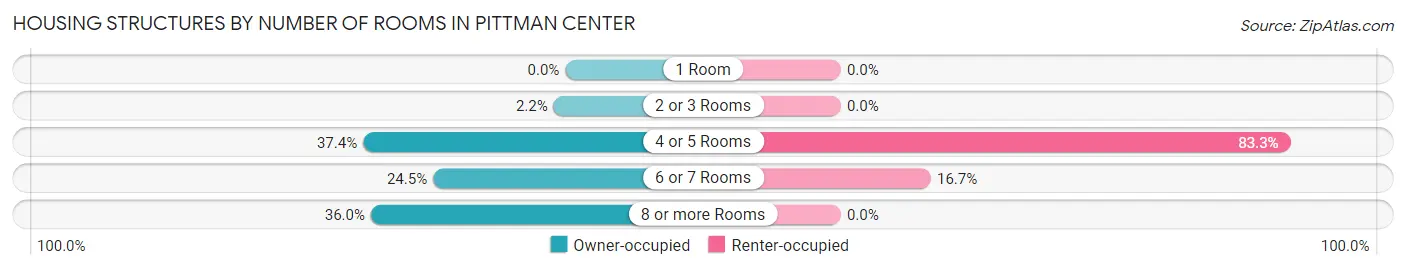
| Number of Rooms | Owner-occupied | Renter-occupied |
| 1 Room | 0 (0.0%) | 0 (0.0%) |
| 2 or 3 Rooms | 3 (2.2%) | 0 (0.0%) |
| 4 or 5 Rooms | 52 (37.4%) | 40 (83.3%) |
| 6 or 7 Rooms | 34 (24.5%) | 8 (16.7%) |
| 8 or more Rooms | 50 (36.0%) | 0 (0.0%) |
| Total | 139 (100.0%) | 48 (100.0%) |
Housing Structure by Heating Type in Pittman Center
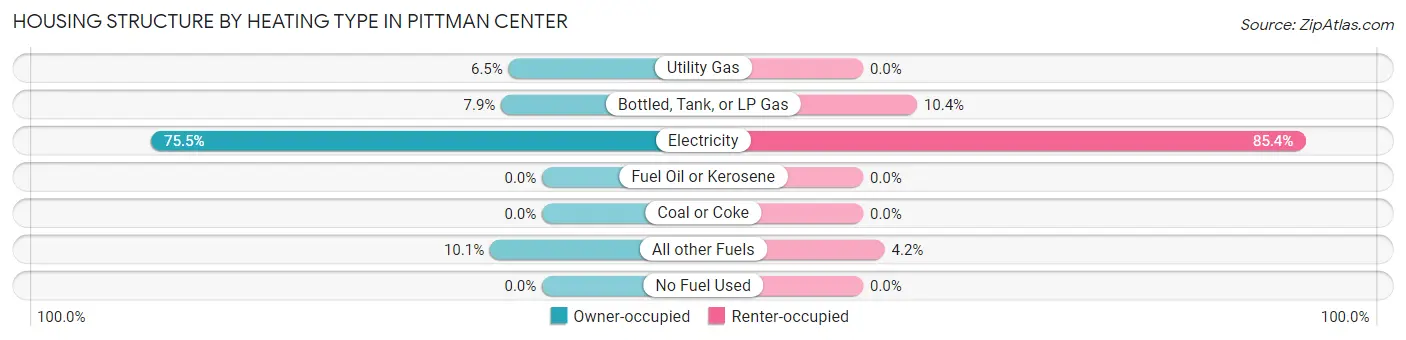
| Heating Type | Owner-occupied | Renter-occupied |
| Utility Gas | 9 (6.5%) | 0 (0.0%) |
| Bottled, Tank, or LP Gas | 11 (7.9%) | 5 (10.4%) |
| Electricity | 105 (75.5%) | 41 (85.4%) |
| Fuel Oil or Kerosene | 0 (0.0%) | 0 (0.0%) |
| Coal or Coke | 0 (0.0%) | 0 (0.0%) |
| All other Fuels | 14 (10.1%) | 2 (4.2%) |
| No Fuel Used | 0 (0.0%) | 0 (0.0%) |
| Total | 139 (100.0%) | 48 (100.0%) |
Household Vehicle Usage in Pittman Center
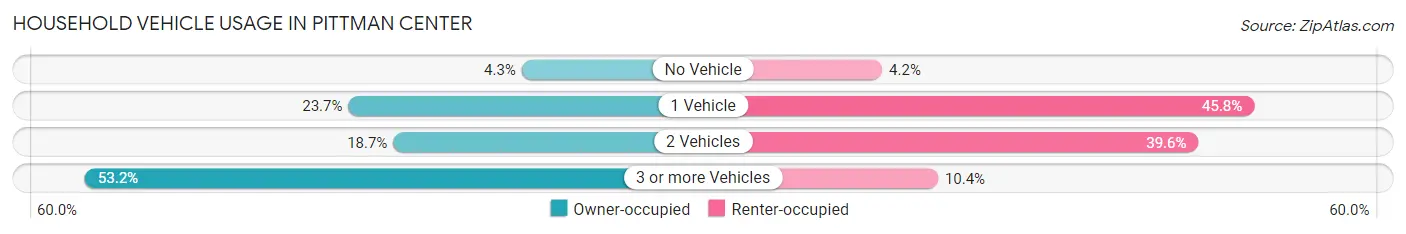
| Vehicles per Household | Owner-occupied | Renter-occupied |
| No Vehicle | 6 (4.3%) | 2 (4.2%) |
| 1 Vehicle | 33 (23.7%) | 22 (45.8%) |
| 2 Vehicles | 26 (18.7%) | 19 (39.6%) |
| 3 or more Vehicles | 74 (53.2%) | 5 (10.4%) |
| Total | 139 (100.0%) | 48 (100.0%) |
Real Estate & Mortgages in Pittman Center
Real Estate and Mortgage Overview in Pittman Center
| Characteristic | Without Mortgage | With Mortgage |
| Housing Units | 76 | 63 |
| Median Property Value | $295,000 | $275,000 |
| Median Household Income | $75,357 | $3 |
| Monthly Housing Costs | $390 | $0 |
| Real Estate Taxes | $1,000 | $3 |
Property Value by Mortgage Status in Pittman Center
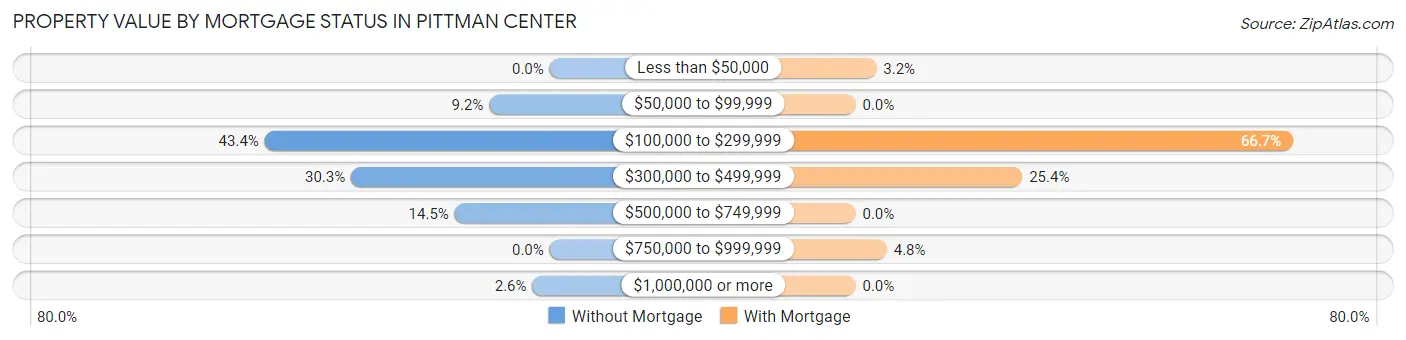
| Property Value | Without Mortgage | With Mortgage |
| Less than $50,000 | 0 (0.0%) | 2 (3.2%) |
| $50,000 to $99,999 | 7 (9.2%) | 0 (0.0%) |
| $100,000 to $299,999 | 33 (43.4%) | 42 (66.7%) |
| $300,000 to $499,999 | 23 (30.3%) | 16 (25.4%) |
| $500,000 to $749,999 | 11 (14.5%) | 0 (0.0%) |
| $750,000 to $999,999 | 0 (0.0%) | 3 (4.8%) |
| $1,000,000 or more | 2 (2.6%) | 0 (0.0%) |
| Total | 76 (100.0%) | 63 (100.0%) |
Household Income by Mortgage Status in Pittman Center
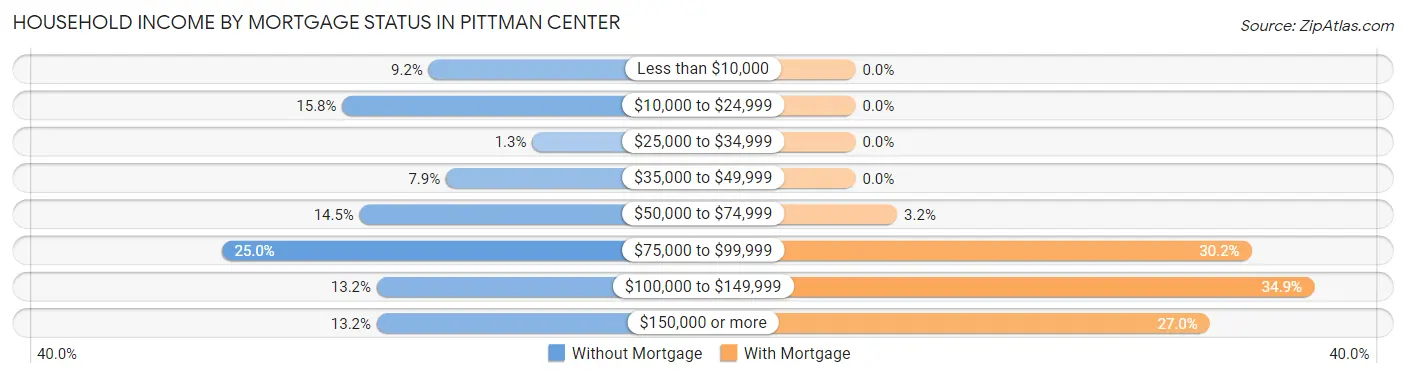
| Household Income | Without Mortgage | With Mortgage |
| Less than $10,000 | 7 (9.2%) | 0 (0.0%) |
| $10,000 to $24,999 | 12 (15.8%) | 0 (0.0%) |
| $25,000 to $34,999 | 1 (1.3%) | 0 (0.0%) |
| $35,000 to $49,999 | 6 (7.9%) | 0 (0.0%) |
| $50,000 to $74,999 | 11 (14.5%) | 2 (3.2%) |
| $75,000 to $99,999 | 19 (25.0%) | 19 (30.2%) |
| $100,000 to $149,999 | 10 (13.2%) | 22 (34.9%) |
| $150,000 or more | 10 (13.2%) | 17 (27.0%) |
| Total | 76 (100.0%) | 63 (100.0%) |
Property Value to Household Income Ratio in Pittman Center
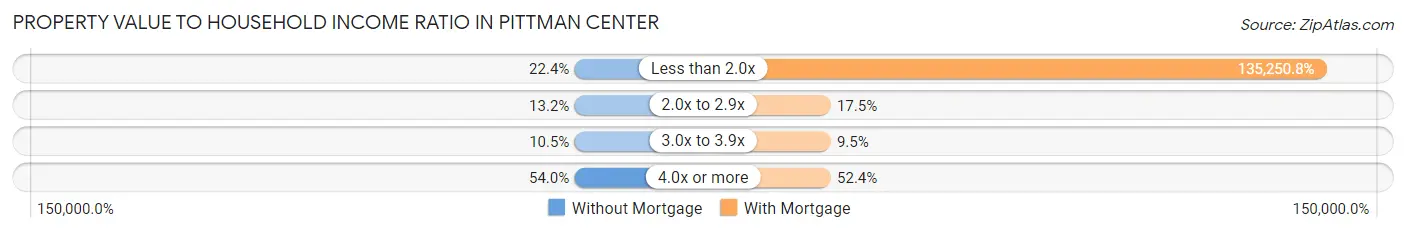
| Value-to-Income Ratio | Without Mortgage | With Mortgage |
| Less than 2.0x | 17 (22.4%) | 85,208 (135,250.8%) |
| 2.0x to 2.9x | 10 (13.2%) | 11 (17.5%) |
| 3.0x to 3.9x | 8 (10.5%) | 6 (9.5%) |
| 4.0x or more | 41 (53.9%) | 33 (52.4%) |
| Total | 76 (100.0%) | 63 (100.0%) |
Real Estate Taxes by Mortgage Status in Pittman Center
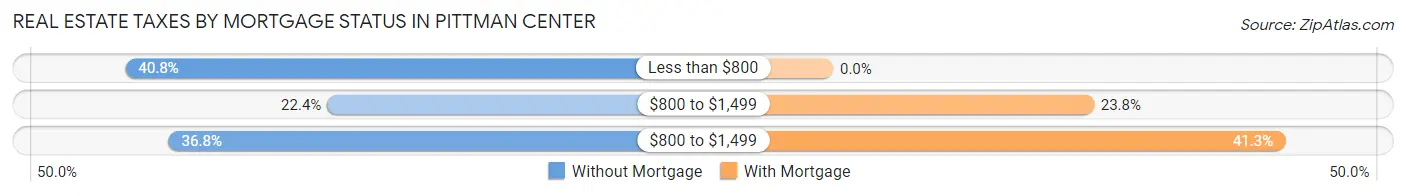
| Property Taxes | Without Mortgage | With Mortgage |
| Less than $800 | 31 (40.8%) | 0 (0.0%) |
| $800 to $1,499 | 17 (22.4%) | 15 (23.8%) |
| $800 to $1,499 | 28 (36.8%) | 26 (41.3%) |
| Total | 76 (100.0%) | 63 (100.0%) |
Health & Disability in Pittman Center
Health Insurance Coverage by Age in Pittman Center
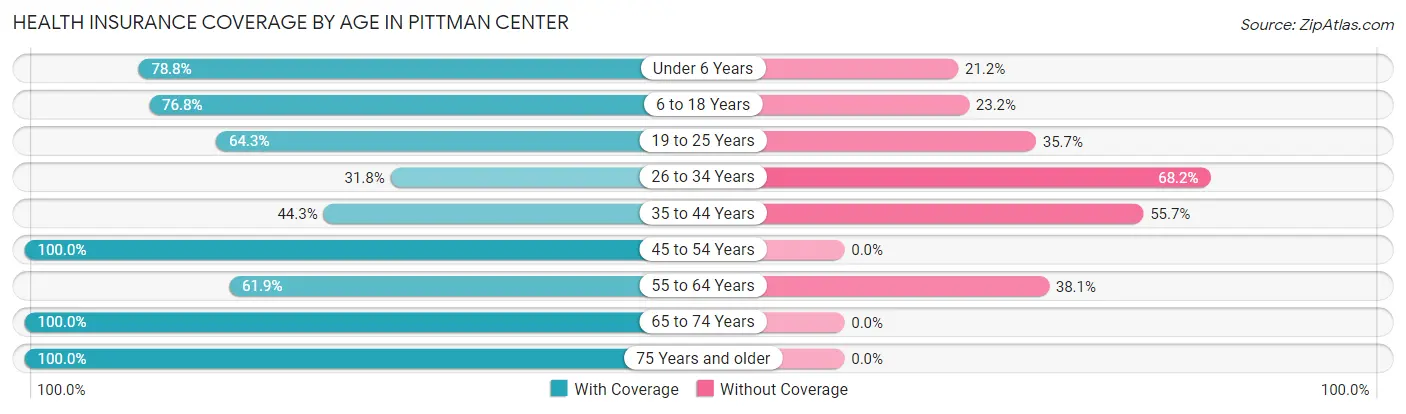
| Age Bracket | With Coverage | Without Coverage |
| Under 6 Years | 26 (78.8%) | 7 (21.2%) |
| 6 to 18 Years | 76 (76.8%) | 23 (23.2%) |
| 19 to 25 Years | 18 (64.3%) | 10 (35.7%) |
| 26 to 34 Years | 27 (31.8%) | 58 (68.2%) |
| 35 to 44 Years | 27 (44.3%) | 34 (55.7%) |
| 45 to 54 Years | 40 (100.0%) | 0 (0.0%) |
| 55 to 64 Years | 60 (61.9%) | 37 (38.1%) |
| 65 to 74 Years | 35 (100.0%) | 0 (0.0%) |
| 75 Years and older | 42 (100.0%) | 0 (0.0%) |
| Total | 351 (67.5%) | 169 (32.5%) |
Health Insurance Coverage by Citizenship Status in Pittman Center
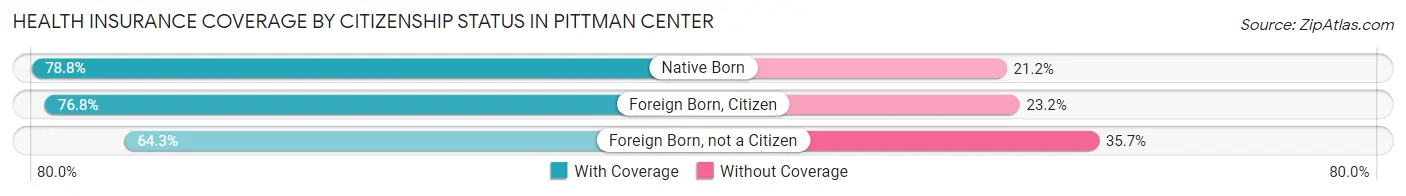
| Citizenship Status | With Coverage | Without Coverage |
| Native Born | 26 (78.8%) | 7 (21.2%) |
| Foreign Born, Citizen | 76 (76.8%) | 23 (23.2%) |
| Foreign Born, not a Citizen | 18 (64.3%) | 10 (35.7%) |
Health Insurance Coverage by Household Income in Pittman Center
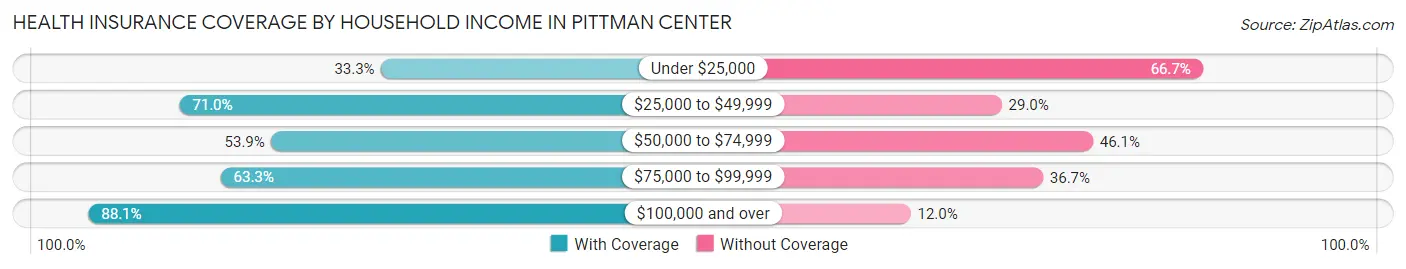
| Household Income | With Coverage | Without Coverage |
| Under $25,000 | 16 (33.3%) | 32 (66.7%) |
| $25,000 to $49,999 | 71 (71.0%) | 29 (29.0%) |
| $50,000 to $74,999 | 62 (53.9%) | 53 (46.1%) |
| $75,000 to $99,999 | 62 (63.3%) | 36 (36.7%) |
| $100,000 and over | 140 (88.0%) | 19 (11.9%) |
Public vs Private Health Insurance Coverage by Age in Pittman Center
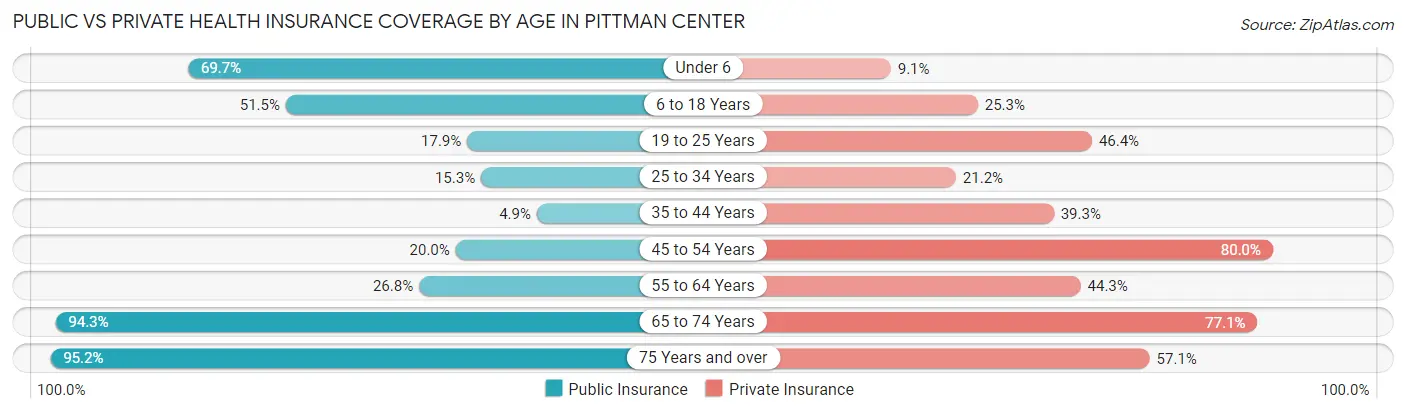
| Age Bracket | Public Insurance | Private Insurance |
| Under 6 | 23 (69.7%) | 3 (9.1%) |
| 6 to 18 Years | 51 (51.5%) | 25 (25.3%) |
| 19 to 25 Years | 5 (17.9%) | 13 (46.4%) |
| 25 to 34 Years | 13 (15.3%) | 18 (21.2%) |
| 35 to 44 Years | 3 (4.9%) | 24 (39.3%) |
| 45 to 54 Years | 8 (20.0%) | 32 (80.0%) |
| 55 to 64 Years | 26 (26.8%) | 43 (44.3%) |
| 65 to 74 Years | 33 (94.3%) | 27 (77.1%) |
| 75 Years and over | 40 (95.2%) | 24 (57.1%) |
| Total | 202 (38.9%) | 209 (40.2%) |
Disability Status by Sex by Age in Pittman Center

| Age Bracket | Male | Female |
| Under 5 Years | 0 (0.0%) | 0 (0.0%) |
| 5 to 17 Years | 10 (17.2%) | 0 (0.0%) |
| 18 to 34 Years | 0 (0.0%) | 0 (0.0%) |
| 35 to 64 Years | 14 (13.9%) | 25 (25.8%) |
| 65 to 74 Years | 3 (21.4%) | 0 (0.0%) |
| 75 Years and over | 14 (60.9%) | 9 (47.4%) |
Disability Class by Sex by Age in Pittman Center
Disability Class: Hearing Difficulty
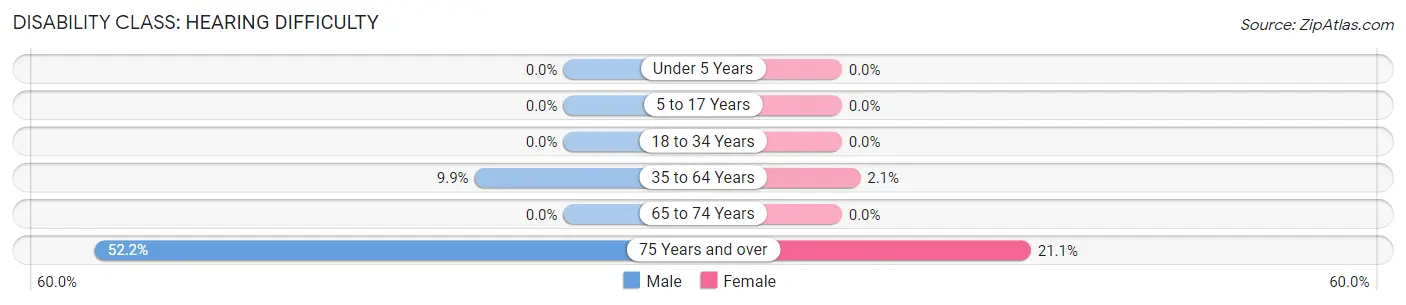
| Age Bracket | Male | Female |
| Under 5 Years | 0 (0.0%) | 0 (0.0%) |
| 5 to 17 Years | 0 (0.0%) | 0 (0.0%) |
| 18 to 34 Years | 0 (0.0%) | 0 (0.0%) |
| 35 to 64 Years | 10 (9.9%) | 2 (2.1%) |
| 65 to 74 Years | 0 (0.0%) | 0 (0.0%) |
| 75 Years and over | 12 (52.2%) | 4 (21.0%) |
Disability Class: Vision Difficulty
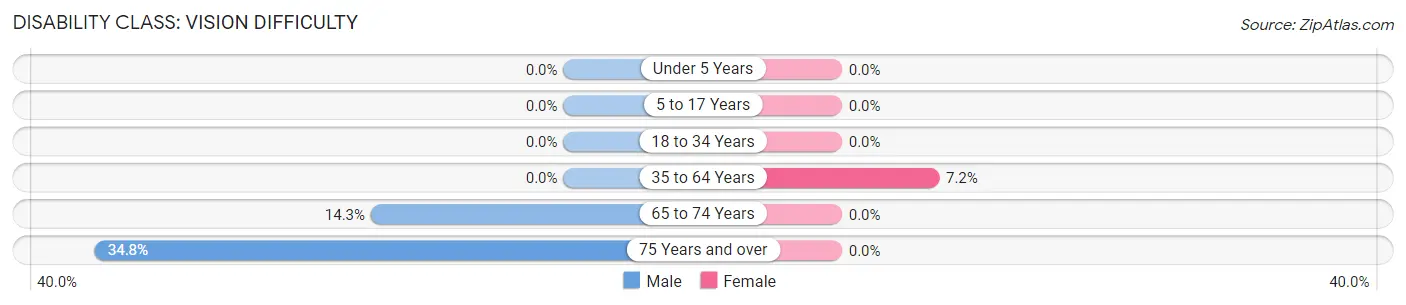
| Age Bracket | Male | Female |
| Under 5 Years | 0 (0.0%) | 0 (0.0%) |
| 5 to 17 Years | 0 (0.0%) | 0 (0.0%) |
| 18 to 34 Years | 0 (0.0%) | 0 (0.0%) |
| 35 to 64 Years | 0 (0.0%) | 7 (7.2%) |
| 65 to 74 Years | 2 (14.3%) | 0 (0.0%) |
| 75 Years and over | 8 (34.8%) | 0 (0.0%) |
Disability Class: Cognitive Difficulty

| Age Bracket | Male | Female |
| 5 to 17 Years | 10 (17.2%) | 0 (0.0%) |
| 18 to 34 Years | 0 (0.0%) | 0 (0.0%) |
| 35 to 64 Years | 0 (0.0%) | 9 (9.3%) |
| 65 to 74 Years | 1 (7.1%) | 0 (0.0%) |
| 75 Years and over | 6 (26.1%) | 2 (10.5%) |
Disability Class: Ambulatory Difficulty
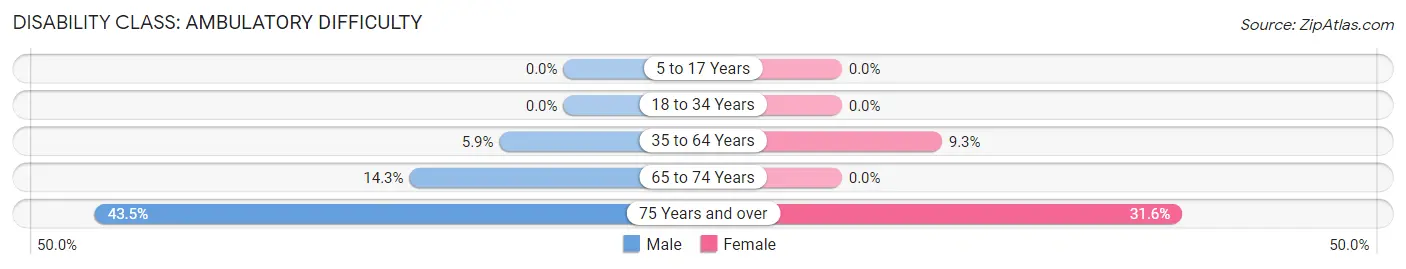
| Age Bracket | Male | Female |
| 5 to 17 Years | 0 (0.0%) | 0 (0.0%) |
| 18 to 34 Years | 0 (0.0%) | 0 (0.0%) |
| 35 to 64 Years | 6 (5.9%) | 9 (9.3%) |
| 65 to 74 Years | 2 (14.3%) | 0 (0.0%) |
| 75 Years and over | 10 (43.5%) | 6 (31.6%) |
Disability Class: Self-Care Difficulty
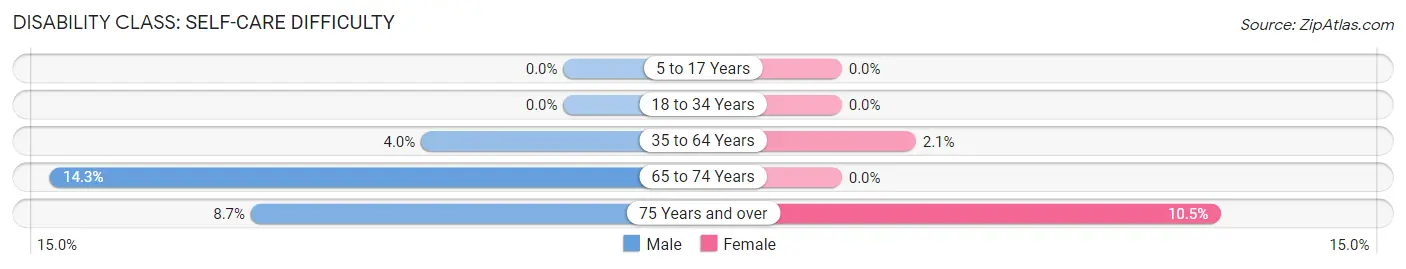
| Age Bracket | Male | Female |
| 5 to 17 Years | 0 (0.0%) | 0 (0.0%) |
| 18 to 34 Years | 0 (0.0%) | 0 (0.0%) |
| 35 to 64 Years | 4 (4.0%) | 2 (2.1%) |
| 65 to 74 Years | 2 (14.3%) | 0 (0.0%) |
| 75 Years and over | 2 (8.7%) | 2 (10.5%) |
Technology Access in Pittman Center
Computing Device Access in Pittman Center
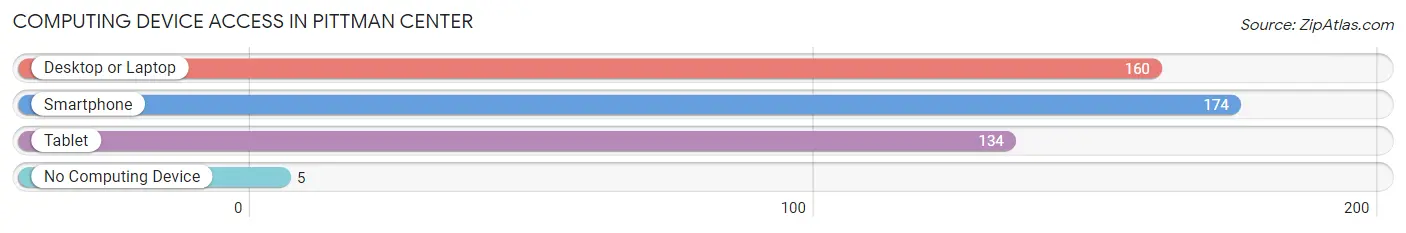
| Device Type | # Households | % Households |
| Desktop or Laptop | 160 | 85.6% |
| Smartphone | 174 | 93.0% |
| Tablet | 134 | 71.7% |
| No Computing Device | 5 | 2.7% |
| Total | 187 | 100.0% |
Internet Access in Pittman Center
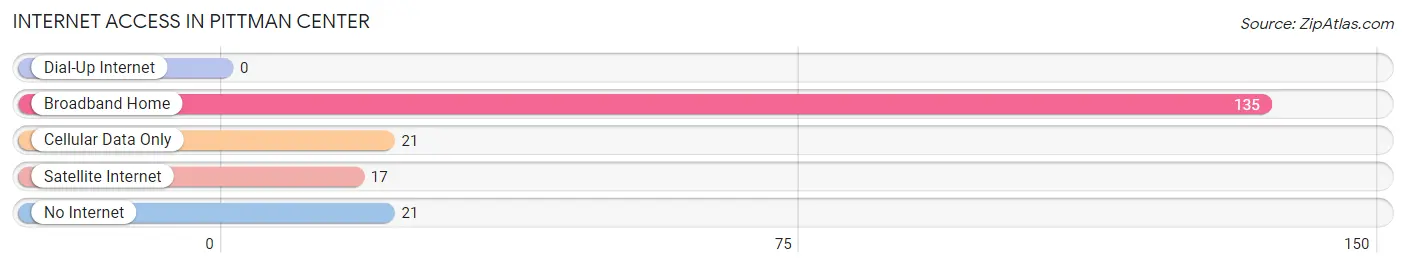
| Internet Type | # Households | % Households |
| Dial-Up Internet | 0 | 0.0% |
| Broadband Home | 135 | 72.2% |
| Cellular Data Only | 21 | 11.2% |
| Satellite Internet | 17 | 9.1% |
| No Internet | 21 | 11.2% |
| Total | 187 | 100.0% |
Pittman Center Summary
Pittman Center is a small unincorporated community located in Sevier County, Tennessee. It is situated in the foothills of the Great Smoky Mountains, approximately 8 miles northeast of Gatlinburg and 8 miles southwest of Pigeon Forge. The community is named after the Pittman family, who were among the first settlers in the area.
History
The Pittman family first settled in the area in the late 1700s. The family was originally from North Carolina and had migrated to the area in search of better land and opportunities. The family established a homestead and began farming the land. The area was known as Pittman’s Crossroads, as it was located at the intersection of two major roads.
In the early 1900s, the area began to develop as a tourist destination. The Great Smoky Mountains National Park was established in 1934, and the area around Pittman Center began to attract visitors from all over the country. The Pittman family opened a general store and a post office in the area, and the community began to grow.
In the 1950s, the area began to develop as a resort destination. Several resorts were built in the area, and the population of Pittman Center began to grow. The community was officially incorporated in 1959.
Geography
Pittman Center is located in the foothills of the Great Smoky Mountains, approximately 8 miles northeast of Gatlinburg and 8 miles southwest of Pigeon Forge. The community is situated at an elevation of 1,890 feet above sea level. The area is characterized by rolling hills and lush forests. The Little Pigeon River runs through the area, and there are several small creeks and streams in the vicinity.
Economy
The economy of Pittman Center is largely based on tourism. The area is a popular destination for visitors to the Great Smoky Mountains National Park, and there are several resorts and hotels in the area. The community also has several restaurants, shops, and other businesses that cater to tourists.
In addition to tourism, the area is also home to several small businesses. These include a lumber mill, a sawmill, and a furniture factory. The area is also home to several farms, which produce a variety of crops, including corn, soybeans, and hay.
Demographics
As of the 2010 census, the population of Pittman Center was 1,093. The population is predominantly white (97.3%), with a small percentage of African Americans (1.2%) and Native Americans (0.7%). The median household income in the area is $37,917, and the median age is 44.7 years.
Conclusion
Pittman Center is a small unincorporated community located in Sevier County, Tennessee. It is situated in the foothills of the Great Smoky Mountains, approximately 8 miles northeast of Gatlinburg and 8 miles southwest of Pigeon Forge. The community is named after the Pittman family, who were among the first settlers in the area. The economy of Pittman Center is largely based on tourism, and the area is a popular destination for visitors to the Great Smoky Mountains National Park. The population of Pittman Center is predominantly white, with a median household income of $37,917 and a median age of 44.7 years.
Common Questions
What is the Total Population of Pittman Center?
Total Population of Pittman Center is 520.
What is the Total Male Population of Pittman Center?
Total Male Population of Pittman Center is 292.
What is the Total Female Population of Pittman Center?
Total Female Population of Pittman Center is 228.
What is the Ratio of Males per 100 Females in Pittman Center?
There are 128.07 Males per 100 Females in Pittman Center.
What is the Ratio of Females per 100 Males in Pittman Center?
There are 78.08 Females per 100 Males in Pittman Center.
What is the Median Population Age in Pittman Center?
Median Population Age in Pittman Center is 37.1 Years.
What is the Average Family Size in Pittman Center
Average Family Size in Pittman Center is 3.4 People.
What is the Average Household Size in Pittman Center
Average Household Size in Pittman Center is 2.8 People.
What is Per Capita Income in Pittman Center?
Per Capita income in Pittman Center is $28,808.
What is the Median Family Income in Pittman Center?
Median Family Income in Pittman Center is $83,281.
What is the Median Household income in Pittman Center?
Median Household Income in Pittman Center is $71,250.
What is Income or Wage Gap in Pittman Center?
Income or Wage Gap in Pittman Center is 36.9%.
Women in Pittman Center earn 63.1 cents for every dollar earned by a man.
What is Inequality or Gini Index in Pittman Center?
Inequality or Gini Index in Pittman Center is 0.37.
How Large is the Labor Force in Pittman Center?
There are 271 People in the Labor Forcein in Pittman Center.
What is the Percentage of People in the Labor Force in Pittman Center?
67.2% of People are in the Labor Force in Pittman Center.
What is the Unemployment Rate in Pittman Center?
Unemployment Rate in Pittman Center is 0.7%.