Park City, TN
Park City Map
Park City Overview
3,471
TOTAL POPULATION
1,699
MALE POPULATION
1,772
FEMALE POPULATION
95.88
MALES / 100 FEMALES
104.30
FEMALES / 100 MALES
41.4
MEDIAN AGE
3.1
AVG FAMILY SIZE
2.7
AVG HOUSEHOLD SIZE
$32,650
PER CAPITA INCOME
$95,359
AVG FAMILY INCOME
$82,736
AVG HOUSEHOLD INCOME
32.8%
WAGE / INCOME GAP [ % ]
67.2¢/ $1
WAGE / INCOME GAP [ $ ]
0.32
INEQUALITY / GINI INDEX
2,027
LABOR FORCE [ PEOPLE ]
73.7%
PERCENT IN LABOR FORCE
3.7%
UNEMPLOYMENT RATE
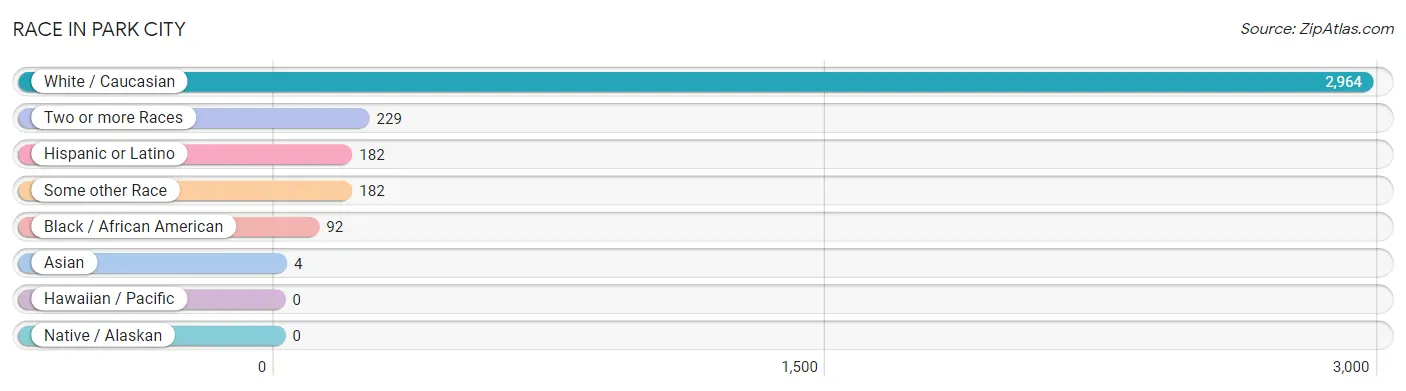
Race in Park City
The most populous races in Park City are White / Caucasian (2,964 | 85.4%), Two or more Races (229 | 6.6%), and Hispanic or Latino (182 | 5.2%).
| Race | # Population | % Population |
| Asian | 4 | 0.1% |
| Black / African American | 92 | 2.6% |
| Hawaiian / Pacific | 0 | 0.0% |
| Hispanic or Latino | 182 | 5.2% |
| Native / Alaskan | 0 | 0.0% |
| White / Caucasian | 2,964 | 85.4% |
| Two or more Races | 229 | 6.6% |
| Some other Race | 182 | 5.2% |
| Total | 3,471 | 100.0% |
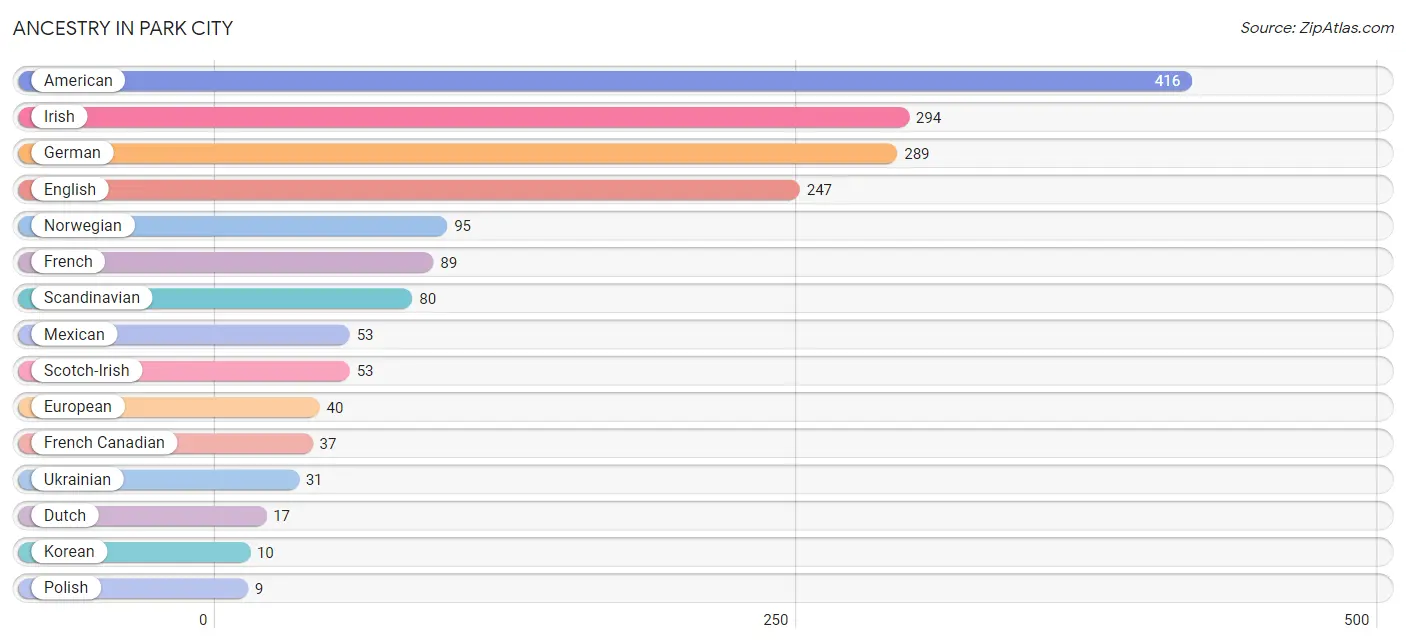
Ancestry in Park City
The most populous ancestries reported in Park City are American (416 | 12.0%), Irish (294 | 8.5%), German (289 | 8.3%), English (247 | 7.1%), and Norwegian (95 | 2.7%), together accounting for 38.6% of all Park City residents.
| Ancestry | # Population | % Population |
| American | 416 | 12.0% |
| Dutch | 17 | 0.5% |
| English | 247 | 7.1% |
| European | 40 | 1.1% |
| French | 89 | 2.6% |
| French Canadian | 37 | 1.1% |
| German | 289 | 8.3% |
| Irish | 294 | 8.5% |
| Korean | 10 | 0.3% |
| Mexican | 53 | 1.5% |
| Norwegian | 95 | 2.7% |
| Polish | 9 | 0.3% |
| Scandinavian | 80 | 2.3% |
| Scotch-Irish | 53 | 1.5% |
| Scottish | 5 | 0.1% |
| Ukrainian | 31 | 0.9% | View All 16 Rows |
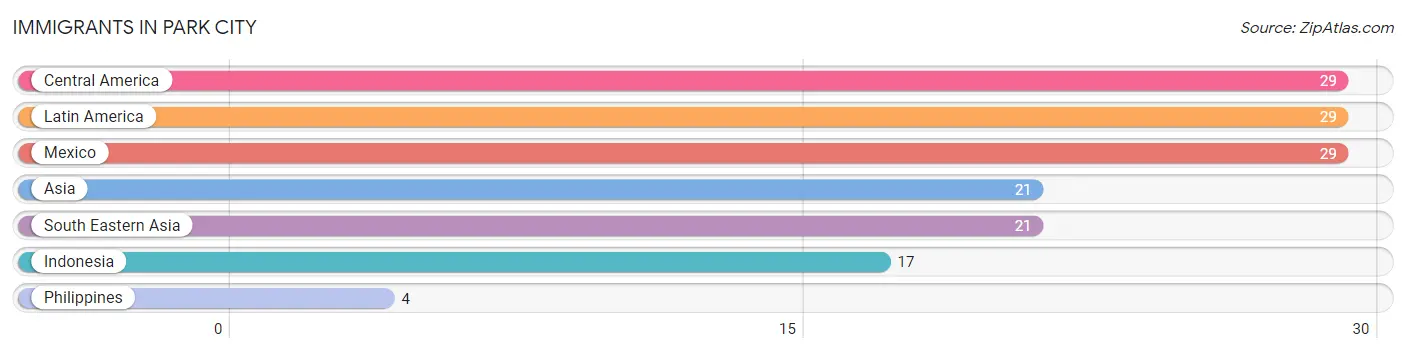
Immigrants in Park City
The most numerous immigrant groups reported in Park City came from Central America (29 | 0.8%), Latin America (29 | 0.8%), Mexico (29 | 0.8%), Asia (21 | 0.6%), and South Eastern Asia (21 | 0.6%), together accounting for 3.7% of all Park City residents.
| Immigration Origin | # Population | % Population |
| Asia | 21 | 0.6% |
| Central America | 29 | 0.8% |
| Indonesia | 17 | 0.5% |
| Latin America | 29 | 0.8% |
| Mexico | 29 | 0.8% |
| Philippines | 4 | 0.1% |
| South Eastern Asia | 21 | 0.6% | View All 7 Rows |
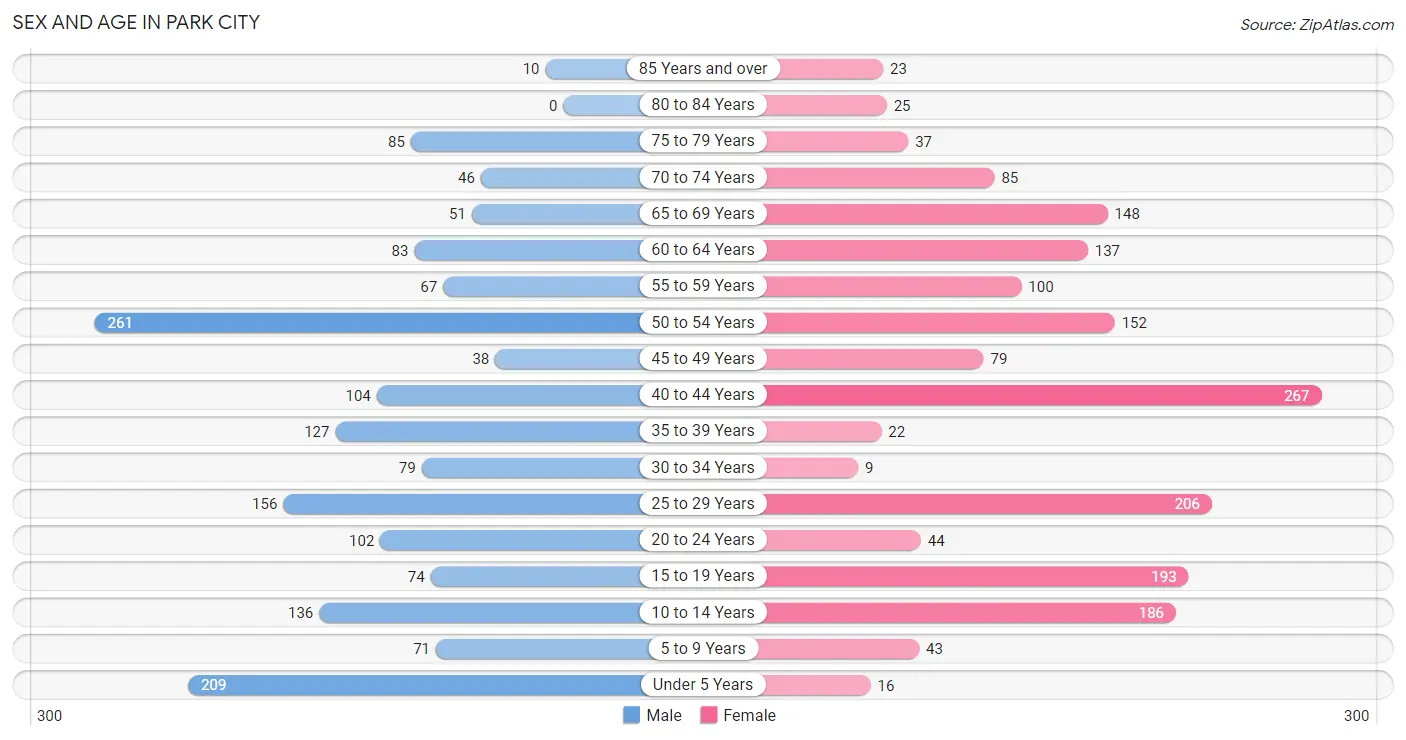
Sex and Age in Park City
Sex and Age in Park City
The most populous age groups in Park City are 50 to 54 Years (261 | 15.4%) for men and 40 to 44 Years (267 | 15.1%) for women.
| Age Bracket | Male | Female |
| Under 5 Years | 209 (12.3%) | 16 (0.9%) |
| 5 to 9 Years | 71 (4.2%) | 43 (2.4%) |
| 10 to 14 Years | 136 (8.0%) | 186 (10.5%) |
| 15 to 19 Years | 74 (4.4%) | 193 (10.9%) |
| 20 to 24 Years | 102 (6.0%) | 44 (2.5%) |
| 25 to 29 Years | 156 (9.2%) | 206 (11.6%) |
| 30 to 34 Years | 79 (4.6%) | 9 (0.5%) |
| 35 to 39 Years | 127 (7.5%) | 22 (1.2%) |
| 40 to 44 Years | 104 (6.1%) | 267 (15.1%) |
| 45 to 49 Years | 38 (2.2%) | 79 (4.5%) |
| 50 to 54 Years | 261 (15.4%) | 152 (8.6%) |
| 55 to 59 Years | 67 (3.9%) | 100 (5.6%) |
| 60 to 64 Years | 83 (4.9%) | 137 (7.7%) |
| 65 to 69 Years | 51 (3.0%) | 148 (8.4%) |
| 70 to 74 Years | 46 (2.7%) | 85 (4.8%) |
| 75 to 79 Years | 85 (5.0%) | 37 (2.1%) |
| 80 to 84 Years | 0 (0.0%) | 25 (1.4%) |
| 85 Years and over | 10 (0.6%) | 23 (1.3%) |
| Total | 1,699 (100.0%) | 1,772 (100.0%) |
Families and Households in Park City
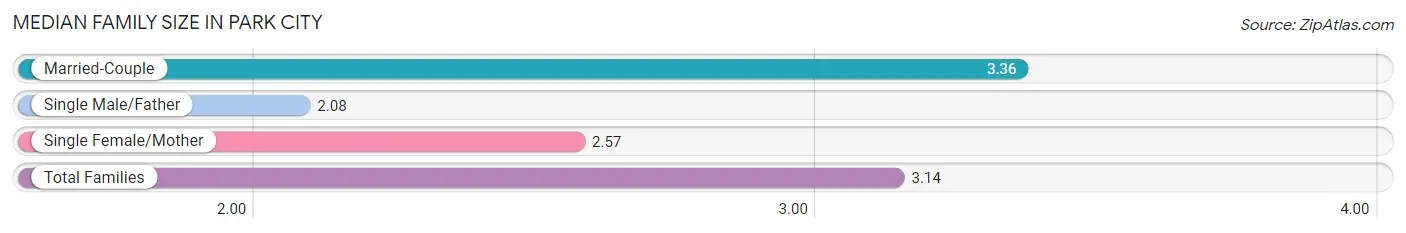
Median Family Size in Park City
The median family size in Park City is 3.14 persons per family, with married-couple families (745 | 76.4%) accounting for the largest median family size of 3.36 persons per family. On the other hand, single male/father families (74 | 7.6%) represent the smallest median family size with 2.08 persons per family.
| Family Type | # Families | Family Size |
| Married-Couple | 745 (76.4%) | 3.36 |
| Single Male/Father | 74 (7.6%) | 2.08 |
| Single Female/Mother | 156 (16.0%) | 2.57 |
| Total Families | 975 (100.0%) | 3.14 |
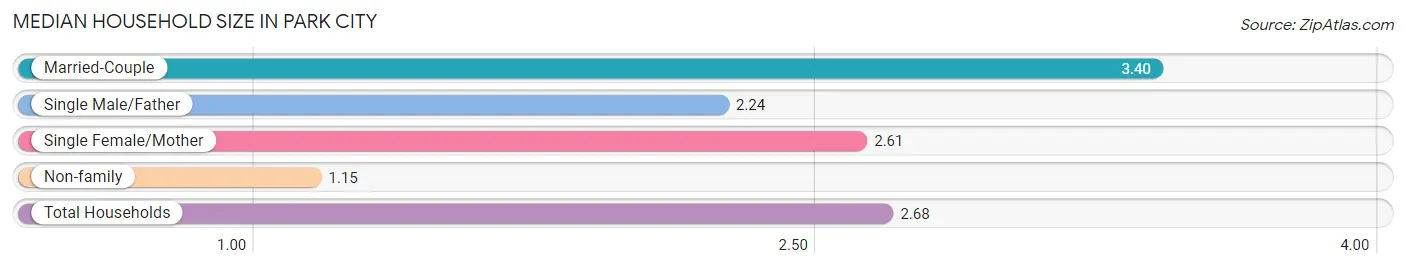
Median Household Size in Park City
The median household size in Park City is 2.68 persons per household, with married-couple households (745 | 57.6%) accounting for the largest median household size of 3.4 persons per household. non-family households (318 | 24.6%) represent the smallest median household size with 1.15 persons per household.
| Household Type | # Households | Household Size |
| Married-Couple | 745 (57.6%) | 3.40 |
| Single Male/Father | 74 (5.7%) | 2.24 |
| Single Female/Mother | 156 (12.1%) | 2.61 |
| Non-family | 318 (24.6%) | 1.15 |
| Total Households | 1,293 (100.0%) | 2.68 |
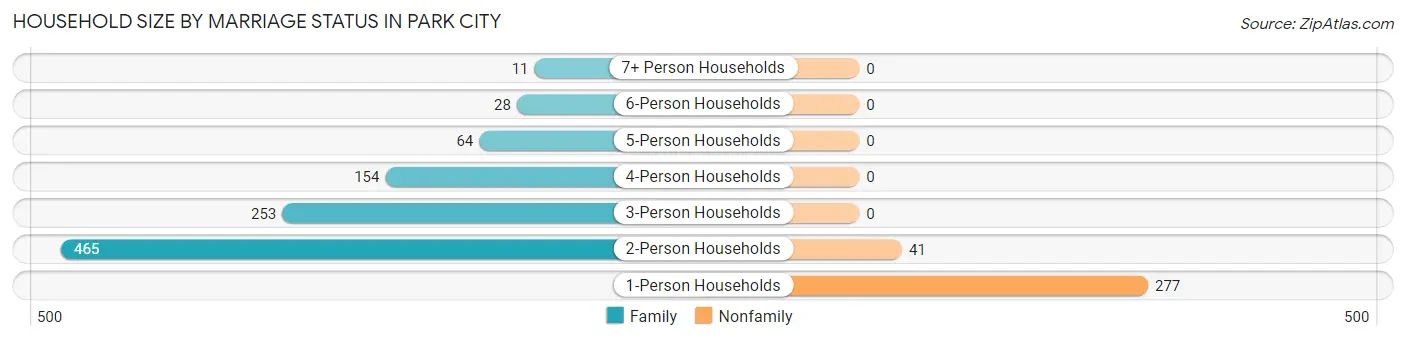
Household Size by Marriage Status in Park City
Out of a total of 1,293 households in Park City, 975 (75.4%) are family households, while 318 (24.6%) are nonfamily households. The most numerous type of family households are 2-person households, comprising 465, and the most common type of nonfamily households are 1-person households, comprising 277.
| Household Size | Family Households | Nonfamily Households |
| 1-Person Households | - | 277 (21.4%) |
| 2-Person Households | 465 (36.0%) | 41 (3.2%) |
| 3-Person Households | 253 (19.6%) | 0 (0.0%) |
| 4-Person Households | 154 (11.9%) | 0 (0.0%) |
| 5-Person Households | 64 (5.0%) | 0 (0.0%) |
| 6-Person Households | 28 (2.2%) | 0 (0.0%) |
| 7+ Person Households | 11 (0.9%) | 0 (0.0%) |
| Total | 975 (75.4%) | 318 (24.6%) |
Female Fertility in Park City
Fertility by Age in Park City
Average fertility rate in Park City is 21.0 births per 1,000 women. Women in the age bracket of 20 to 34 years have the highest fertility rate with 69.0 births per 1,000 women. Women in the age bracket of 20 to 34 years acount for 100.0% of all women with births.
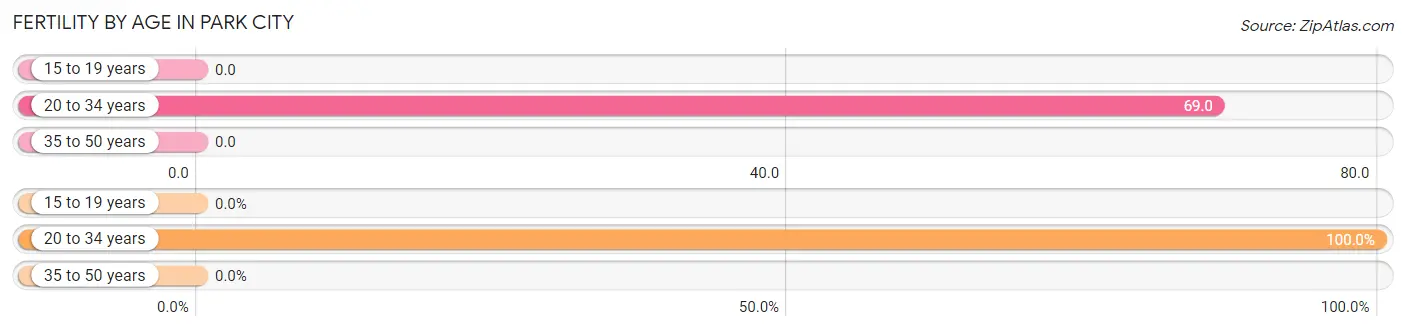
| Age Bracket | Women with Births | Births / 1,000 Women |
| 15 to 19 years | 0 (0.0%) | 0.0 |
| 20 to 34 years | 18 (100.0%) | 69.0 |
| 35 to 50 years | 0 (0.0%) | 0.0 |
| Total | 18 (100.0%) | 21.0 |
Fertility by Age by Marriage Status in Park City
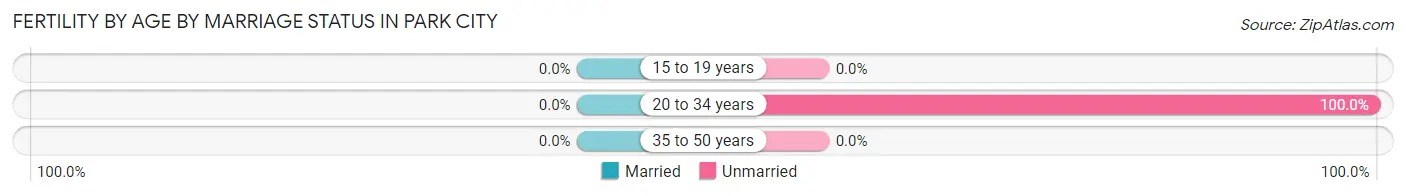
| Age Bracket | Married | Unmarried |
| 15 to 19 years | 0 (0.0%) | 0 (0.0%) |
| 20 to 34 years | 0 (0.0%) | 18 (100.0%) |
| 35 to 50 years | 0 (0.0%) | 0 (0.0%) |
| Total | 0 (0.0%) | 18 (100.0%) |
Fertility by Education in Park City
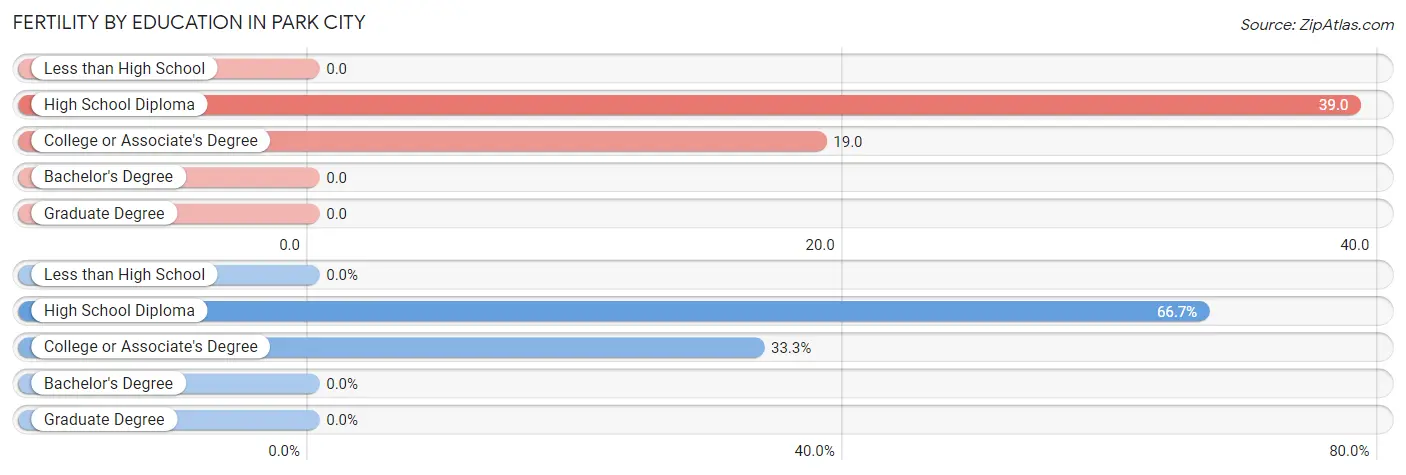
| Educational Attainment | Women with Births | Births / 1,000 Women |
| Less than High School | 0 (0.0%) | 0.0 |
| High School Diploma | 12 (66.7%) | 39.0 |
| College or Associate's Degree | 6 (33.3%) | 19.0 |
| Bachelor's Degree | 0 (0.0%) | 0.0 |
| Graduate Degree | 0 (0.0%) | 0.0 |
| Total | 18 (100.0%) | 21.0 |
Fertility by Education by Marriage Status in Park City
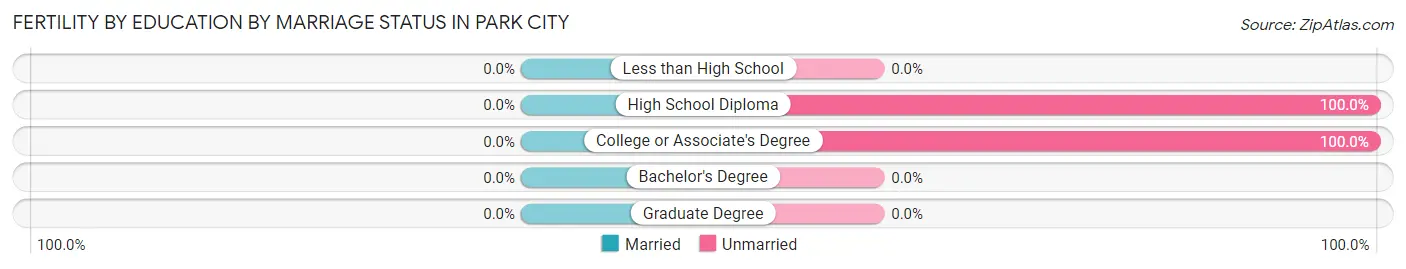
| Educational Attainment | Married | Unmarried |
| Less than High School | 0 (0.0%) | 0 (0.0%) |
| High School Diploma | 0 (0.0%) | 12 (100.0%) |
| College or Associate's Degree | 0 (0.0%) | 6 (100.0%) |
| Bachelor's Degree | 0 (0.0%) | 0 (0.0%) |
| Graduate Degree | 0 (0.0%) | 0 (0.0%) |
| Total | 0 (0.0%) | 18 (100.0%) |
Income in Park City
Income Overview in Park City
Per Capita Income in Park City is $32,650, while median incomes of families and households are $95,359 and $82,736 respectively.
| Characteristic | Number | Measure |
| Per Capita Income | 3,471 | $32,650 |
| Median Family Income | 975 | $95,359 |
| Mean Family Income | 975 | $90,968 |
| Median Household Income | 1,293 | $82,736 |
| Mean Household Income | 1,293 | $81,663 |
| Income Deficit | 975 | $0 |
| Wage / Income Gap (%) | 3,471 | 32.75% |
| Wage / Income Gap ($) | 3,471 | 67.25¢ per $1 |
| Gini / Inequality Index | 3,471 | 0.32 |
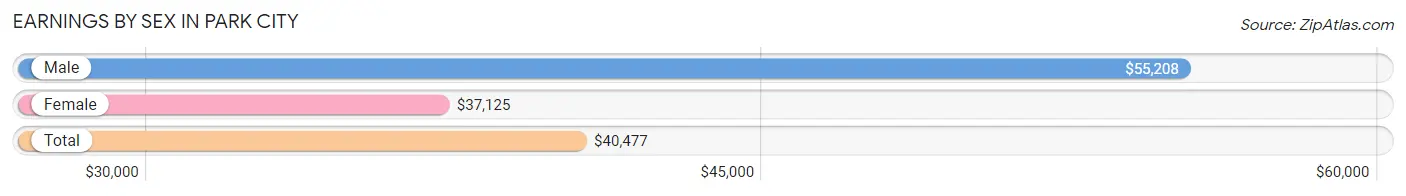
Earnings by Sex in Park City
Average Earnings in Park City are $40,477, $55,208 for men and $37,125 for women, a difference of 32.8%.
| Sex | Number | Average Earnings |
| Male | 1,044 (50.7%) | $55,208 |
| Female | 1,017 (49.3%) | $37,125 |
| Total | 2,061 (100.0%) | $40,477 |
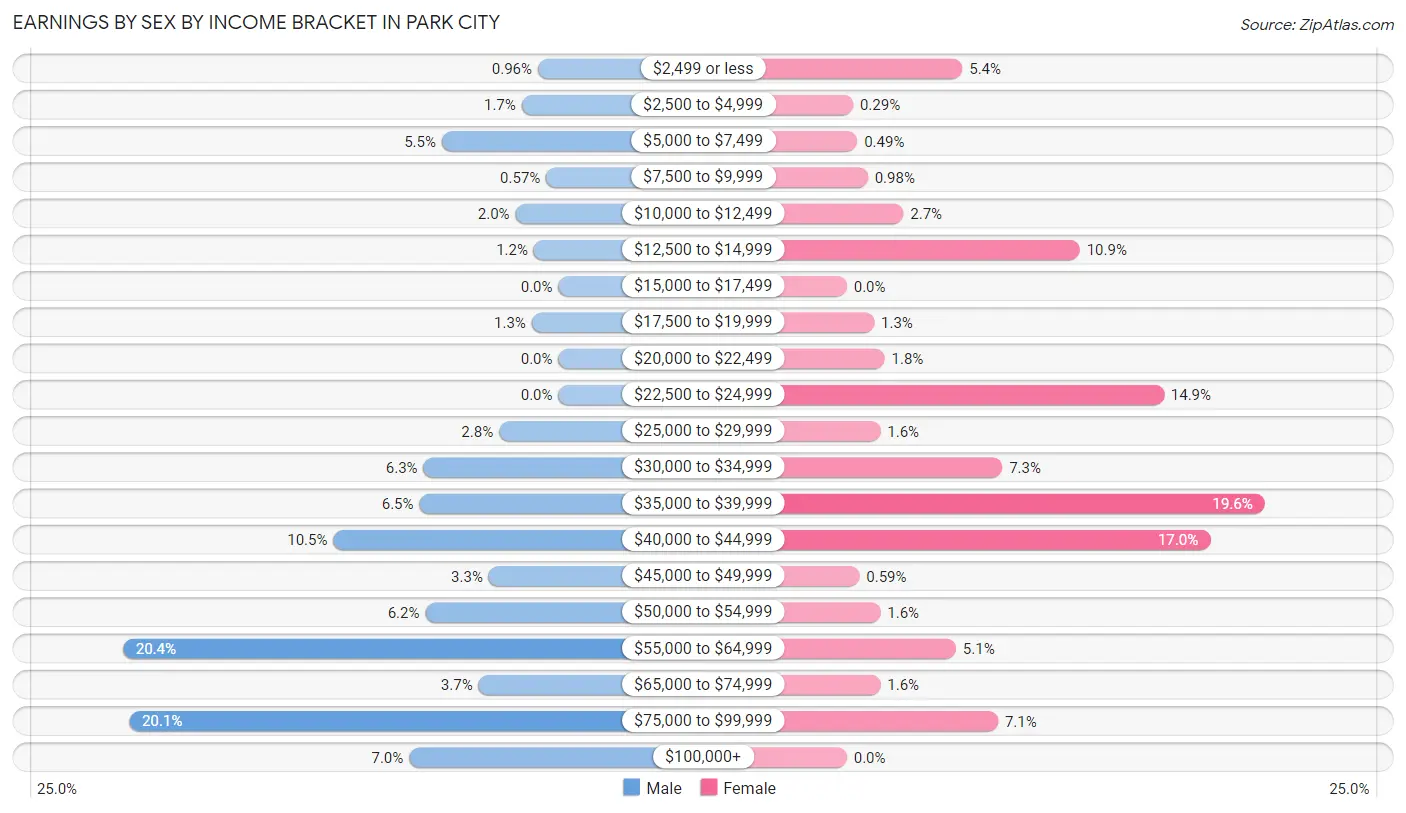
Earnings by Sex by Income Bracket in Park City
The most common earnings brackets in Park City are $55,000 to $64,999 for men (213 | 20.4%) and $35,000 to $39,999 for women (199 | 19.6%).
| Income | Male | Female |
| $2,499 or less | 10 (1.0%) | 55 (5.4%) |
| $2,500 to $4,999 | 18 (1.7%) | 3 (0.3%) |
| $5,000 to $7,499 | 57 (5.5%) | 5 (0.5%) |
| $7,500 to $9,999 | 6 (0.6%) | 10 (1.0%) |
| $10,000 to $12,499 | 21 (2.0%) | 27 (2.6%) |
| $12,500 to $14,999 | 12 (1.1%) | 111 (10.9%) |
| $15,000 to $17,499 | 0 (0.0%) | 0 (0.0%) |
| $17,500 to $19,999 | 13 (1.3%) | 13 (1.3%) |
| $20,000 to $22,499 | 0 (0.0%) | 18 (1.8%) |
| $22,500 to $24,999 | 0 (0.0%) | 151 (14.8%) |
| $25,000 to $29,999 | 29 (2.8%) | 16 (1.6%) |
| $30,000 to $34,999 | 66 (6.3%) | 74 (7.3%) |
| $35,000 to $39,999 | 68 (6.5%) | 199 (19.6%) |
| $40,000 to $44,999 | 110 (10.5%) | 173 (17.0%) |
| $45,000 to $49,999 | 34 (3.3%) | 6 (0.6%) |
| $50,000 to $54,999 | 65 (6.2%) | 16 (1.6%) |
| $55,000 to $64,999 | 213 (20.4%) | 52 (5.1%) |
| $65,000 to $74,999 | 39 (3.7%) | 16 (1.6%) |
| $75,000 to $99,999 | 210 (20.1%) | 72 (7.1%) |
| $100,000+ | 73 (7.0%) | 0 (0.0%) |
| Total | 1,044 (100.0%) | 1,017 (100.0%) |
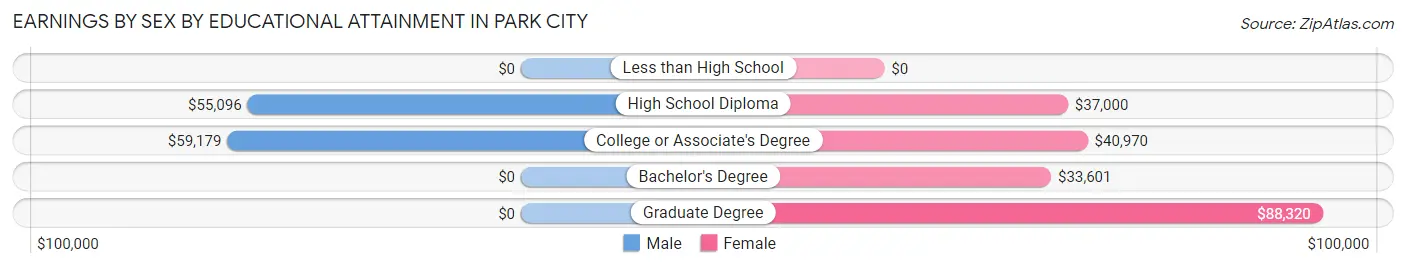
Earnings by Sex by Educational Attainment in Park City
Average earnings in Park City are $56,330 for men and $38,462 for women, a difference of 31.7%. Men with an educational attainment of college or associate's degree enjoy the highest average annual earnings of $59,179, while those with high school diploma education earn the least with $55,096. Women with an educational attainment of graduate degree earn the most with the average annual earnings of $88,320, while those with bachelor's degree education have the smallest earnings of $33,601.
| Educational Attainment | Male Income | Female Income |
| Less than High School | - | - |
| High School Diploma | $55,096 | $37,000 |
| College or Associate's Degree | $59,179 | $40,970 |
| Bachelor's Degree | - | - |
| Graduate Degree | - | - |
| Total | $56,330 | $38,462 |
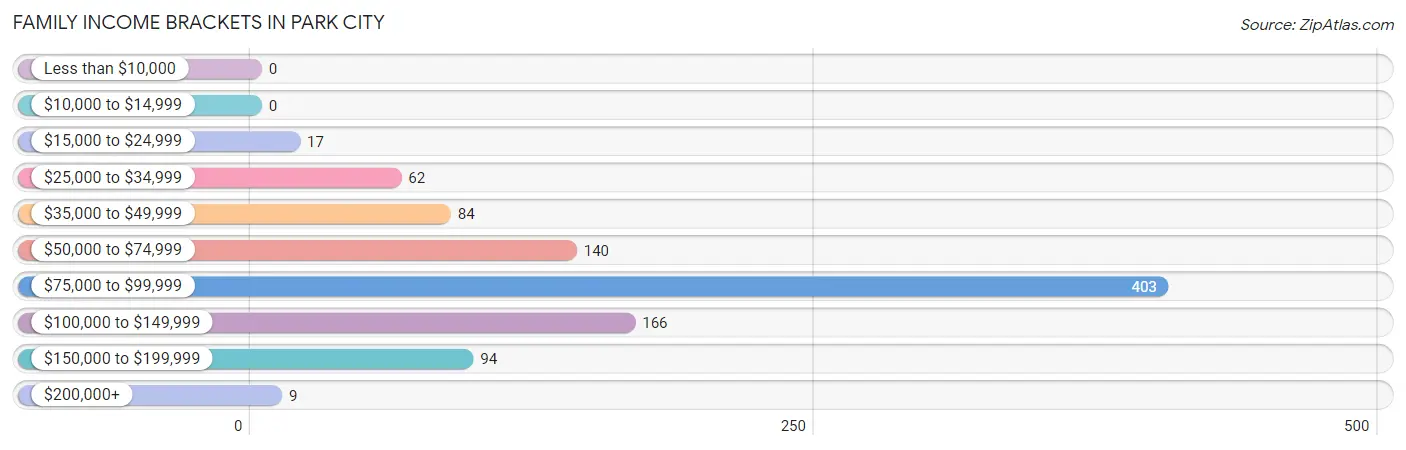
Family Income in Park City
Family Income Brackets in Park City
According to the Park City family income data, there are 403 families falling into the $75,000 to $99,999 income range, which is the most common income bracket and makes up 41.3% of all families.
| Income Bracket | # Families | % Families |
| Less than $10,000 | 0 | 0.0% |
| $10,000 to $14,999 | 0 | 0.0% |
| $15,000 to $24,999 | 17 | 1.7% |
| $25,000 to $34,999 | 62 | 6.4% |
| $35,000 to $49,999 | 84 | 8.6% |
| $50,000 to $74,999 | 140 | 14.4% |
| $75,000 to $99,999 | 403 | 41.3% |
| $100,000 to $149,999 | 166 | 17.0% |
| $150,000 to $199,999 | 94 | 9.6% |
| $200,000+ | 9 | 0.9% |
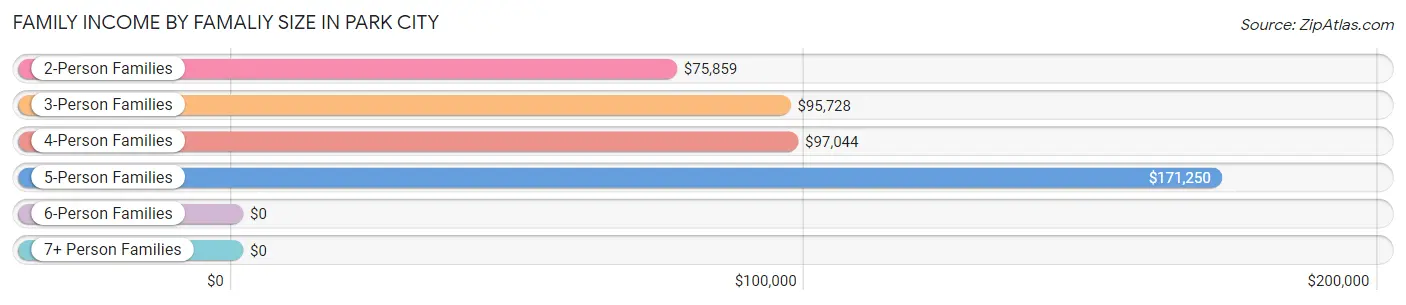
Family Income by Famaliy Size in Park City
5-person families (66 | 6.8%) account for the highest median family income in Park City with $171,250 per family, while 2-person families (496 | 50.9%) have the highest median income of $37,930 per family member.
| Income Bracket | # Families | Median Income |
| 2-Person Families | 496 (50.9%) | $75,859 |
| 3-Person Families | 226 (23.2%) | $95,728 |
| 4-Person Families | 157 (16.1%) | $97,044 |
| 5-Person Families | 66 (6.8%) | $171,250 |
| 6-Person Families | 19 (1.9%) | $0 |
| 7+ Person Families | 11 (1.1%) | $0 |
| Total | 975 (100.0%) | $95,359 |
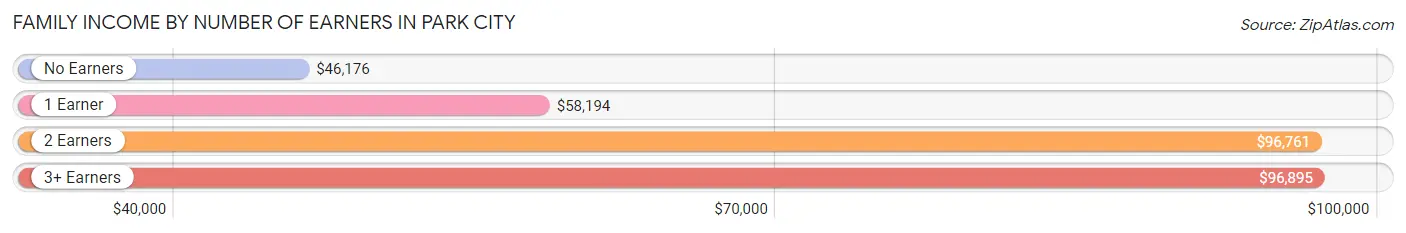
Family Income by Number of Earners in Park City
The median family income in Park City is $95,359, with families comprising 3+ earners (223) having the highest median family income of $96,895, while families with no earners (92) have the lowest median family income of $46,176, accounting for 22.9% and 9.4% of families, respectively.
| Number of Earners | # Families | Median Income |
| No Earners | 92 (9.4%) | $46,176 |
| 1 Earner | 273 (28.0%) | $58,194 |
| 2 Earners | 387 (39.7%) | $96,761 |
| 3+ Earners | 223 (22.9%) | $96,895 |
| Total | 975 (100.0%) | $95,359 |
Household Income in Park City
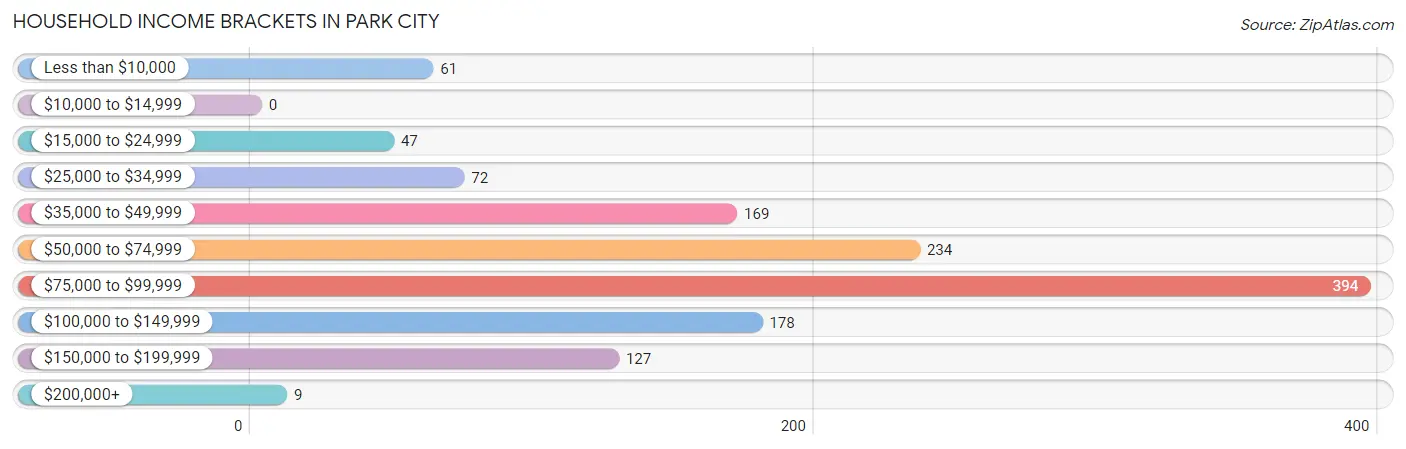
Household Income Brackets in Park City
With 394 households falling in the category, the $75,000 to $99,999 income range is the most frequent in Park City, accounting for 30.5% of all households.
| Income Bracket | # Households | % Households |
| Less than $10,000 | 61 | 4.7% |
| $10,000 to $14,999 | 0 | 0.0% |
| $15,000 to $24,999 | 47 | 3.6% |
| $25,000 to $34,999 | 72 | 5.6% |
| $35,000 to $49,999 | 169 | 13.1% |
| $50,000 to $74,999 | 234 | 18.1% |
| $75,000 to $99,999 | 394 | 30.5% |
| $100,000 to $149,999 | 178 | 13.8% |
| $150,000 to $199,999 | 127 | 9.8% |
| $200,000+ | 9 | 0.7% |
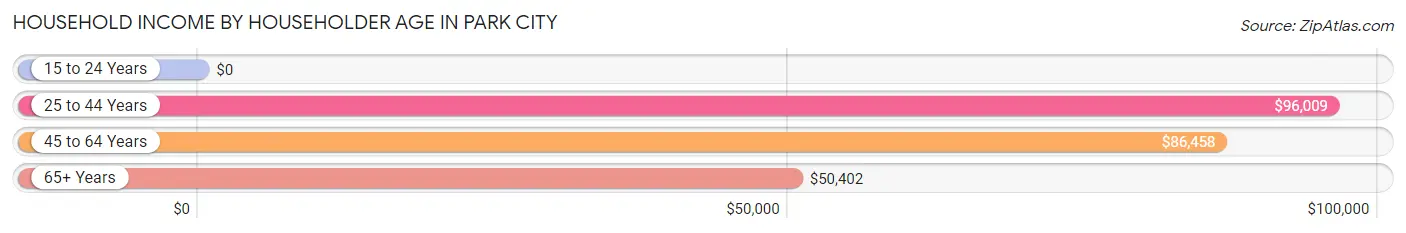
Household Income by Householder Age in Park City
The median household income in Park City is $82,736, with the highest median household income of $96,009 found in the 25 to 44 years age bracket for the primary householder. A total of 466 households (36.0%) fall into this category. Meanwhile, the 15 to 24 years age bracket for the primary householder has the lowest median household income of $0, with 52 households (4.0%) in this group.
| Income Bracket | # Households | Median Income |
| 15 to 24 Years | 52 (4.0%) | $0 |
| 25 to 44 Years | 466 (36.0%) | $96,009 |
| 45 to 64 Years | 492 (38.1%) | $86,458 |
| 65+ Years | 283 (21.9%) | $50,402 |
| Total | 1,293 (100.0%) | $82,736 |
Poverty in Park City
Income Below Poverty by Sex and Age in Park City
With 2.5% poverty level for males and 8.1% for females among the residents of Park City, 55 to 64 year old males and 45 to 54 year old females are the most vulnerable to poverty, with 43 males (28.7%) and 48 females (20.8%) in their respective age groups living below the poverty level.
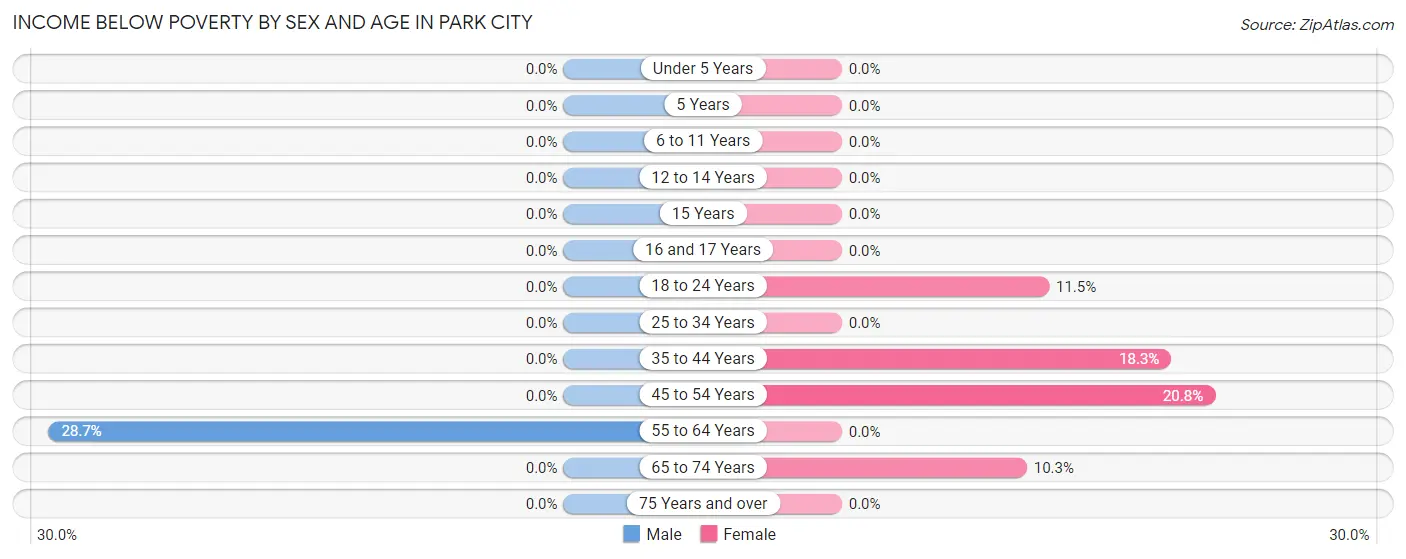
| Age Bracket | Male | Female |
| Under 5 Years | 0 (0.0%) | 0 (0.0%) |
| 5 Years | 0 (0.0%) | 0 (0.0%) |
| 6 to 11 Years | 0 (0.0%) | 0 (0.0%) |
| 12 to 14 Years | 0 (0.0%) | 0 (0.0%) |
| 15 Years | 0 (0.0%) | 0 (0.0%) |
| 16 and 17 Years | 0 (0.0%) | 0 (0.0%) |
| 18 to 24 Years | 0 (0.0%) | 18 (11.5%) |
| 25 to 34 Years | 0 (0.0%) | 0 (0.0%) |
| 35 to 44 Years | 0 (0.0%) | 53 (18.3%) |
| 45 to 54 Years | 0 (0.0%) | 48 (20.8%) |
| 55 to 64 Years | 43 (28.7%) | 0 (0.0%) |
| 65 to 74 Years | 0 (0.0%) | 24 (10.3%) |
| 75 Years and over | 0 (0.0%) | 0 (0.0%) |
| Total | 43 (2.5%) | 143 (8.1%) |
Income Above Poverty by Sex and Age in Park City
According to the poverty statistics in Park City, males aged under 5 years and females aged under 5 years are the age groups that are most secure financially, with 100.0% of males and 100.0% of females in these age groups living above the poverty line.
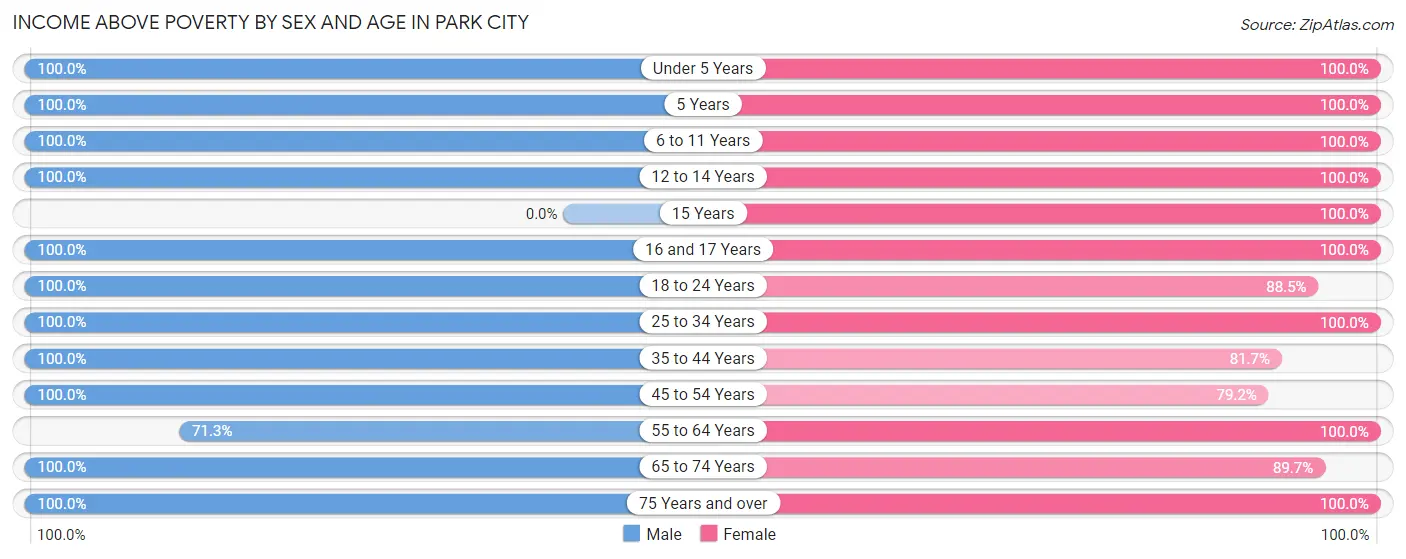
| Age Bracket | Male | Female |
| Under 5 Years | 209 (100.0%) | 16 (100.0%) |
| 5 Years | 28 (100.0%) | 43 (100.0%) |
| 6 to 11 Years | 75 (100.0%) | 19 (100.0%) |
| 12 to 14 Years | 100 (100.0%) | 167 (100.0%) |
| 15 Years | 0 (0.0%) | 59 (100.0%) |
| 16 and 17 Years | 41 (100.0%) | 22 (100.0%) |
| 18 to 24 Years | 135 (100.0%) | 138 (88.5%) |
| 25 to 34 Years | 235 (100.0%) | 215 (100.0%) |
| 35 to 44 Years | 231 (100.0%) | 236 (81.7%) |
| 45 to 54 Years | 299 (100.0%) | 183 (79.2%) |
| 55 to 64 Years | 107 (71.3%) | 237 (100.0%) |
| 65 to 74 Years | 97 (100.0%) | 209 (89.7%) |
| 75 Years and over | 95 (100.0%) | 85 (100.0%) |
| Total | 1,652 (97.5%) | 1,629 (91.9%) |
Income Below Poverty Among Married-Couple Families in Park City
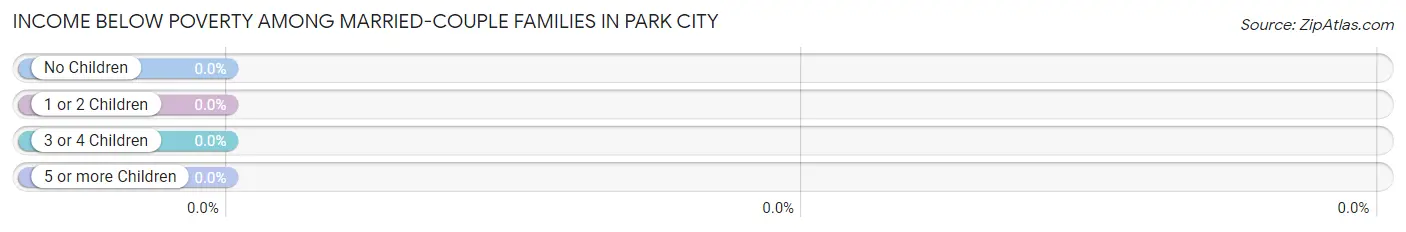
| Children | Above Poverty | Below Poverty |
| No Children | 358 (100.0%) | 0 (0.0%) |
| 1 or 2 Children | 376 (100.0%) | 0 (0.0%) |
| 3 or 4 Children | 11 (100.0%) | 0 (0.0%) |
| 5 or more Children | 0 (0.0%) | 0 (0.0%) |
| Total | 745 (100.0%) | 0 (0.0%) |
Income Below Poverty Among Single-Parent Households in Park City
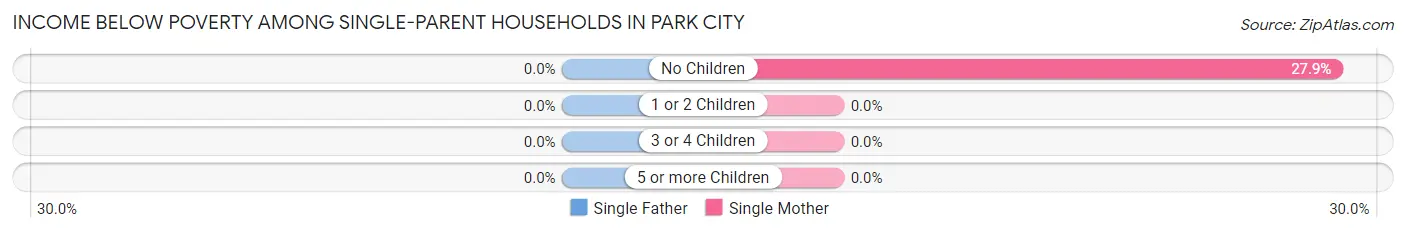
| Children | Single Father | Single Mother |
| No Children | 0 (0.0%) | 12 (27.9%) |
| 1 or 2 Children | 0 (0.0%) | 0 (0.0%) |
| 3 or 4 Children | 0 (0.0%) | 0 (0.0%) |
| 5 or more Children | 0 (0.0%) | 0 (0.0%) |
| Total | 0 (0.0%) | 12 (7.7%) |
Income Below Poverty Among Married-Couple vs Single-Parent Households in Park City
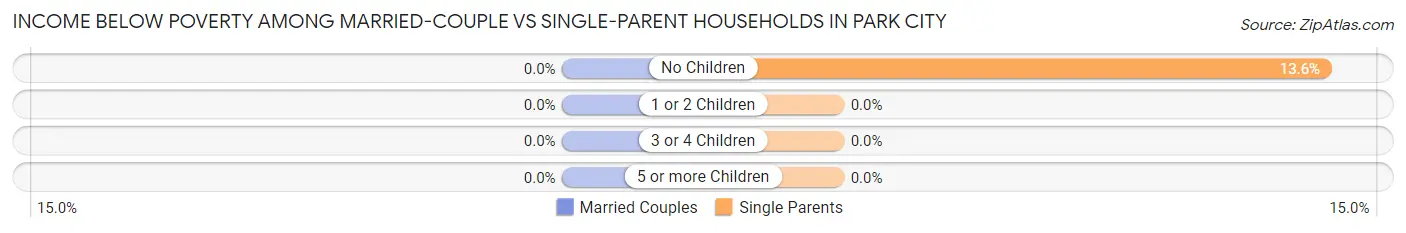
| Children | Married-Couple Families | Single-Parent Households |
| No Children | 0 (0.0%) | 12 (13.6%) |
| 1 or 2 Children | 0 (0.0%) | 0 (0.0%) |
| 3 or 4 Children | 0 (0.0%) | 0 (0.0%) |
| 5 or more Children | 0 (0.0%) | 0 (0.0%) |
| Total | 0 (0.0%) | 12 (5.2%) |
Employment Characteristics in Park City
Employment by Class of Employer in Park City
Among the 1,911 employed individuals in Park City, private company employees (1,560 | 81.6%), local government employees (151 | 7.9%), and self-employed (not incorporated) (95 | 5.0%) make up the most common classes of employment.
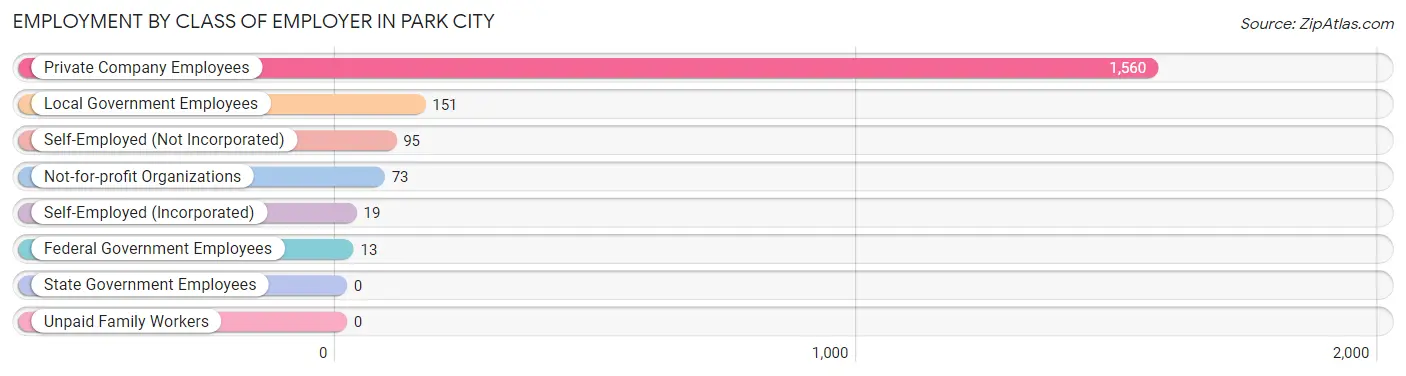
| Employer Class | # Employees | % Employees |
| Private Company Employees | 1,560 | 81.6% |
| Self-Employed (Incorporated) | 19 | 1.0% |
| Self-Employed (Not Incorporated) | 95 | 5.0% |
| Not-for-profit Organizations | 73 | 3.8% |
| Local Government Employees | 151 | 7.9% |
| State Government Employees | 0 | 0.0% |
| Federal Government Employees | 13 | 0.7% |
| Unpaid Family Workers | 0 | 0.0% |
| Total | 1,911 | 100.0% |
Employment Status by Age in Park City
According to the labor force statistics for Park City, out of the total population over 16 years of age (2,751), 73.7% or 2,027 individuals are in the labor force, with 3.7% or 75 of them unemployed. The age group with the highest labor force participation rate is 25 to 29 years, with 100.0% or 362 individuals in the labor force. Within the labor force, the 20 to 24 years age range has the highest percentage of unemployed individuals, with 28.7% or 29 of them being unemployed.
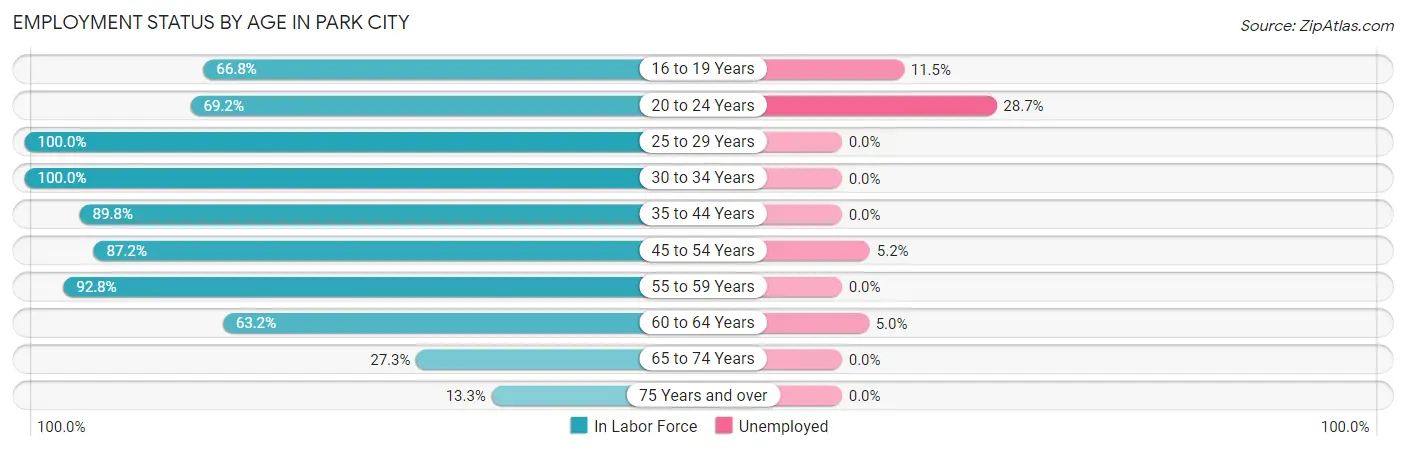
| Age Bracket | In Labor Force | Unemployed |
| 16 to 19 Years | 139 (66.8%) | 16 (11.5%) |
| 20 to 24 Years | 101 (69.2%) | 29 (28.7%) |
| 25 to 29 Years | 362 (100.0%) | 0 (0.0%) |
| 30 to 34 Years | 88 (100.0%) | 0 (0.0%) |
| 35 to 44 Years | 467 (89.8%) | 0 (0.0%) |
| 45 to 54 Years | 462 (87.2%) | 24 (5.2%) |
| 55 to 59 Years | 155 (92.8%) | 0 (0.0%) |
| 60 to 64 Years | 139 (63.2%) | 7 (5.0%) |
| 65 to 74 Years | 90 (27.3%) | 0 (0.0%) |
| 75 Years and over | 24 (13.3%) | 0 (0.0%) |
| Total | 2,027 (73.7%) | 75 (3.7%) |
Employment Status by Educational Attainment in Park City
According to labor force statistics for Park City, 88.7% of individuals (1,674) out of the total population between 25 and 64 years of age (1,887) are in the labor force, with 1.9% or 32 of them being unemployed. The group with the highest labor force participation rate are those with the educational attainment of less than high school, with 100.0% or 11 individuals in the labor force. Within the labor force, individuals with high school diploma education have the highest percentage of unemployment, with 2.8% or 24 of them being unemployed.
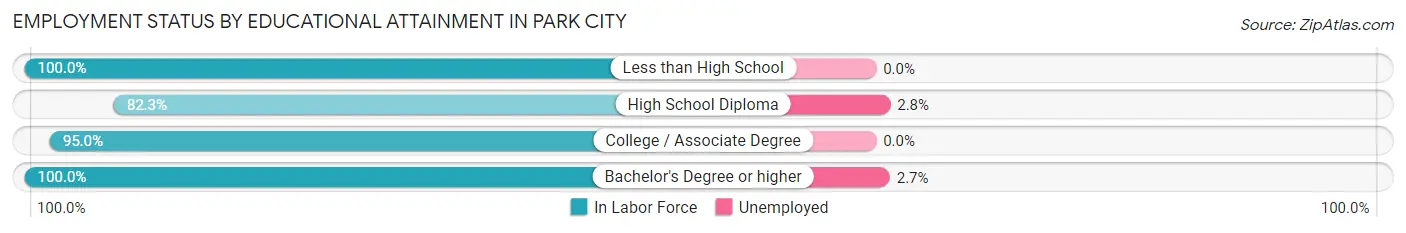
| Educational Attainment | In Labor Force | Unemployed |
| Less than High School | 11 (100.0%) | 0 (0.0%) |
| High School Diploma | 865 (82.3%) | 29 (2.8%) |
| College / Associate Degree | 537 (95.0%) | 0 (0.0%) |
| Bachelor's Degree or higher | 260 (100.0%) | 7 (2.7%) |
| Total | 1,674 (88.7%) | 36 (1.9%) |
Employment Occupations by Sex in Park City
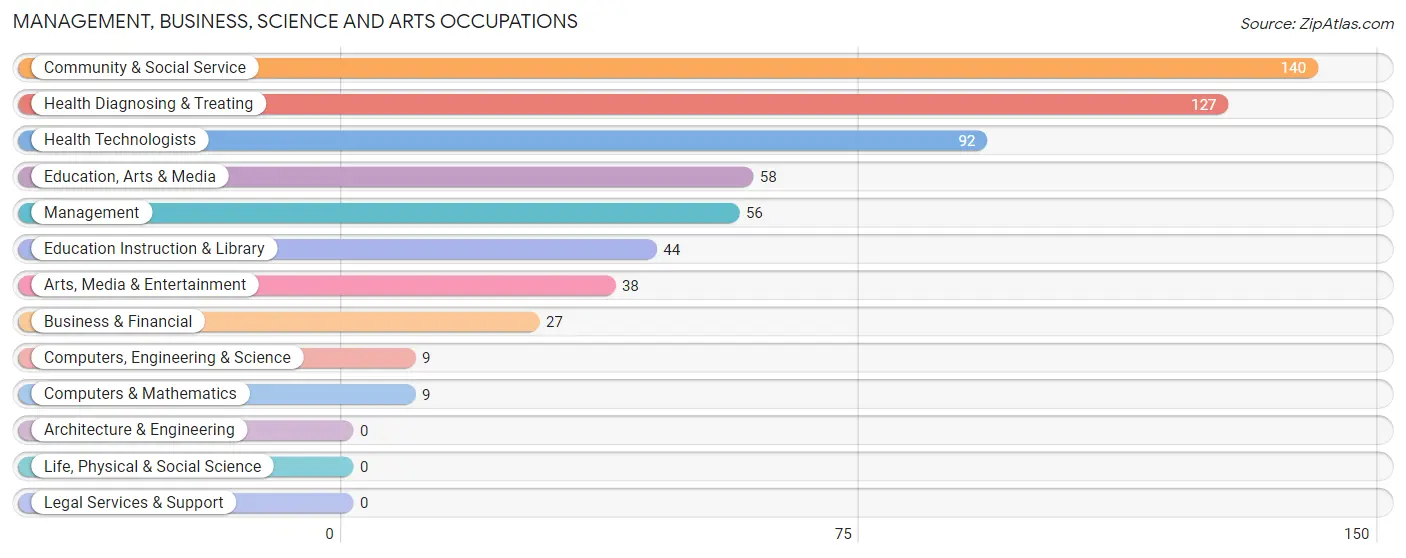
Management, Business, Science and Arts Occupations
The most common Management, Business, Science and Arts occupations in Park City are Community & Social Service (140 | 7.2%), Health Diagnosing & Treating (127 | 6.5%), Health Technologists (92 | 4.7%), Education, Arts & Media (58 | 3.0%), and Management (56 | 2.9%).
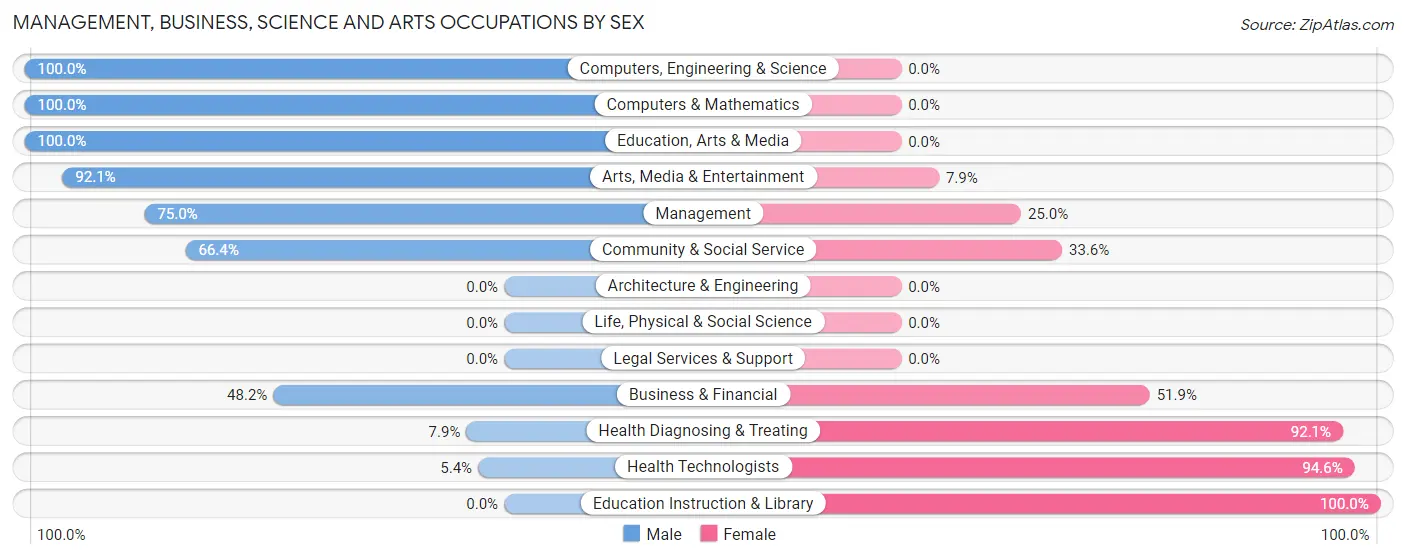
Management, Business, Science and Arts Occupations by Sex
Within the Management, Business, Science and Arts occupations in Park City, the most male-oriented occupations are Computers, Engineering & Science (100.0%), Computers & Mathematics (100.0%), and Education, Arts & Media (100.0%), while the most female-oriented occupations are Education Instruction & Library (100.0%), Health Technologists (94.6%), and Health Diagnosing & Treating (92.1%).
| Occupation | Male | Female |
| Management | 42 (75.0%) | 14 (25.0%) |
| Business & Financial | 13 (48.1%) | 14 (51.8%) |
| Computers, Engineering & Science | 9 (100.0%) | 0 (0.0%) |
| Computers & Mathematics | 9 (100.0%) | 0 (0.0%) |
| Architecture & Engineering | 0 (0.0%) | 0 (0.0%) |
| Life, Physical & Social Science | 0 (0.0%) | 0 (0.0%) |
| Community & Social Service | 93 (66.4%) | 47 (33.6%) |
| Education, Arts & Media | 58 (100.0%) | 0 (0.0%) |
| Legal Services & Support | 0 (0.0%) | 0 (0.0%) |
| Education Instruction & Library | 0 (0.0%) | 44 (100.0%) |
| Arts, Media & Entertainment | 35 (92.1%) | 3 (7.9%) |
| Health Diagnosing & Treating | 10 (7.9%) | 117 (92.1%) |
| Health Technologists | 5 (5.4%) | 87 (94.6%) |
| Total (Category) | 167 (46.5%) | 192 (53.5%) |
| Total (Overall) | 960 (49.2%) | 991 (50.8%) |
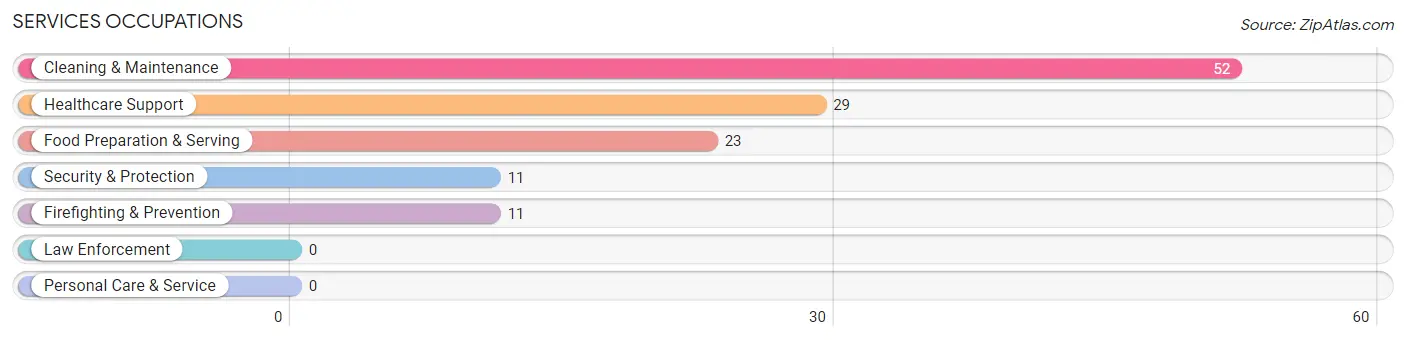
Services Occupations
The most common Services occupations in Park City are Cleaning & Maintenance (52 | 2.7%), Healthcare Support (29 | 1.5%), Food Preparation & Serving (23 | 1.2%), Security & Protection (11 | 0.6%), and Firefighting & Prevention (11 | 0.6%).
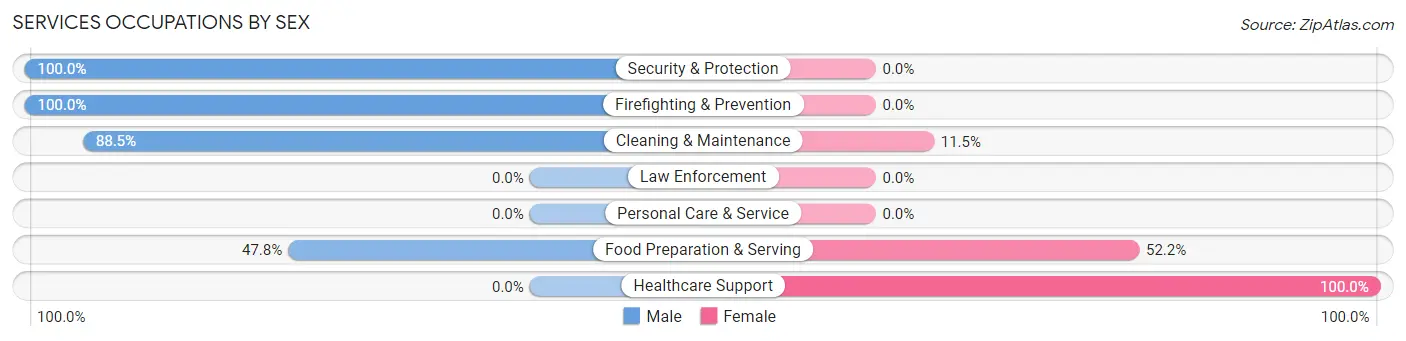
Services Occupations by Sex
Within the Services occupations in Park City, the most male-oriented occupations are Security & Protection (100.0%), Firefighting & Prevention (100.0%), and Cleaning & Maintenance (88.5%), while the most female-oriented occupations are Healthcare Support (100.0%), Food Preparation & Serving (52.2%), and Cleaning & Maintenance (11.5%).
| Occupation | Male | Female |
| Healthcare Support | 0 (0.0%) | 29 (100.0%) |
| Security & Protection | 11 (100.0%) | 0 (0.0%) |
| Firefighting & Prevention | 11 (100.0%) | 0 (0.0%) |
| Law Enforcement | 0 (0.0%) | 0 (0.0%) |
| Food Preparation & Serving | 11 (47.8%) | 12 (52.2%) |
| Cleaning & Maintenance | 46 (88.5%) | 6 (11.5%) |
| Personal Care & Service | 0 (0.0%) | 0 (0.0%) |
| Total (Category) | 68 (59.1%) | 47 (40.9%) |
| Total (Overall) | 960 (49.2%) | 991 (50.8%) |
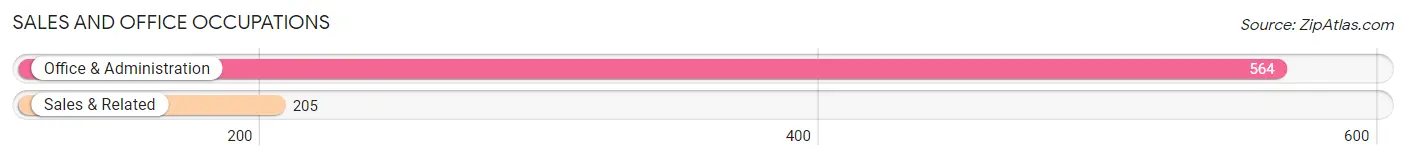
Sales and Office Occupations
The most common Sales and Office occupations in Park City are Office & Administration (564 | 28.9%), and Sales & Related (205 | 10.5%).
Sales and Office Occupations by Sex
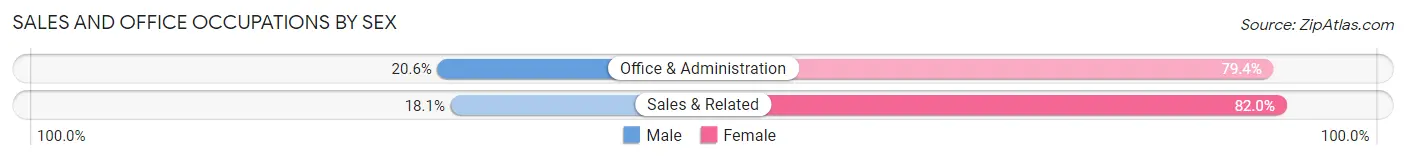
| Occupation | Male | Female |
| Sales & Related | 37 (18.0%) | 168 (82.0%) |
| Office & Administration | 116 (20.6%) | 448 (79.4%) |
| Total (Category) | 153 (19.9%) | 616 (80.1%) |
| Total (Overall) | 960 (49.2%) | 991 (50.8%) |
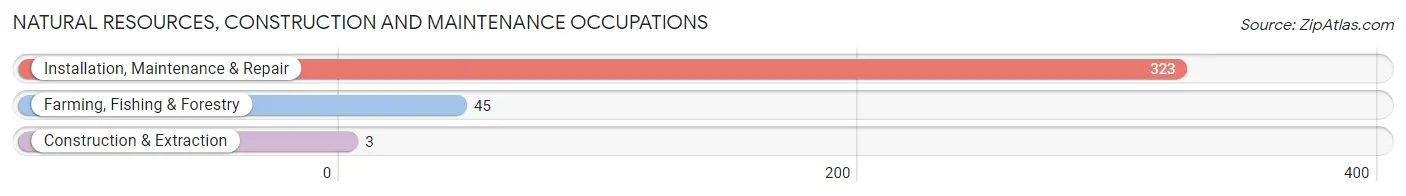
Natural Resources, Construction and Maintenance Occupations
The most common Natural Resources, Construction and Maintenance occupations in Park City are Installation, Maintenance & Repair (323 | 16.6%), Farming, Fishing & Forestry (45 | 2.3%), and Construction & Extraction (3 | 0.2%).
Natural Resources, Construction and Maintenance Occupations by Sex
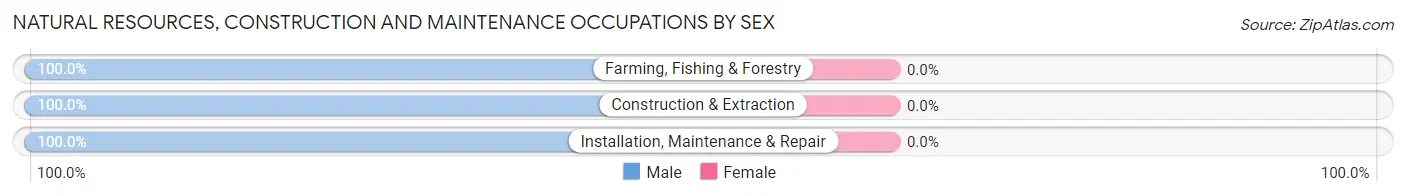
| Occupation | Male | Female |
| Farming, Fishing & Forestry | 45 (100.0%) | 0 (0.0%) |
| Construction & Extraction | 3 (100.0%) | 0 (0.0%) |
| Installation, Maintenance & Repair | 323 (100.0%) | 0 (0.0%) |
| Total (Category) | 371 (100.0%) | 0 (0.0%) |
| Total (Overall) | 960 (49.2%) | 991 (50.8%) |
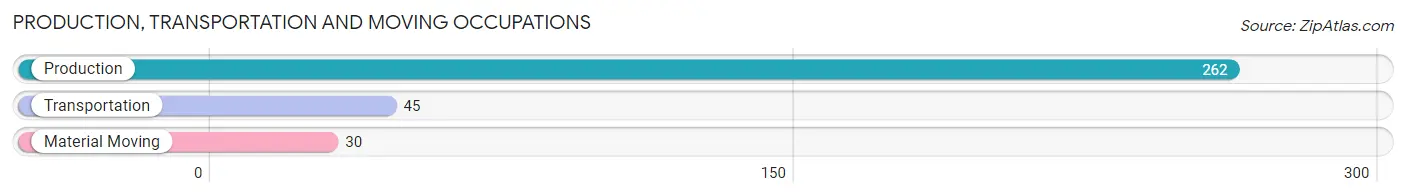
Production, Transportation and Moving Occupations
The most common Production, Transportation and Moving occupations in Park City are Production (262 | 13.4%), Transportation (45 | 2.3%), and Material Moving (30 | 1.5%).
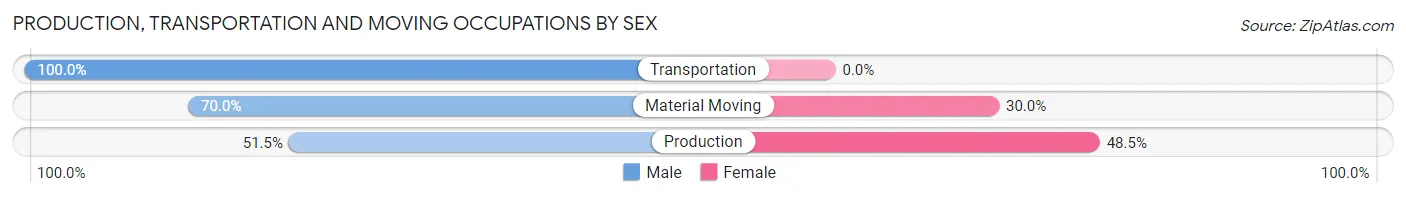
Production, Transportation and Moving Occupations by Sex
| Occupation | Male | Female |
| Production | 135 (51.5%) | 127 (48.5%) |
| Transportation | 45 (100.0%) | 0 (0.0%) |
| Material Moving | 21 (70.0%) | 9 (30.0%) |
| Total (Category) | 201 (59.6%) | 136 (40.4%) |
| Total (Overall) | 960 (49.2%) | 991 (50.8%) |
Employment Industries by Sex in Park City
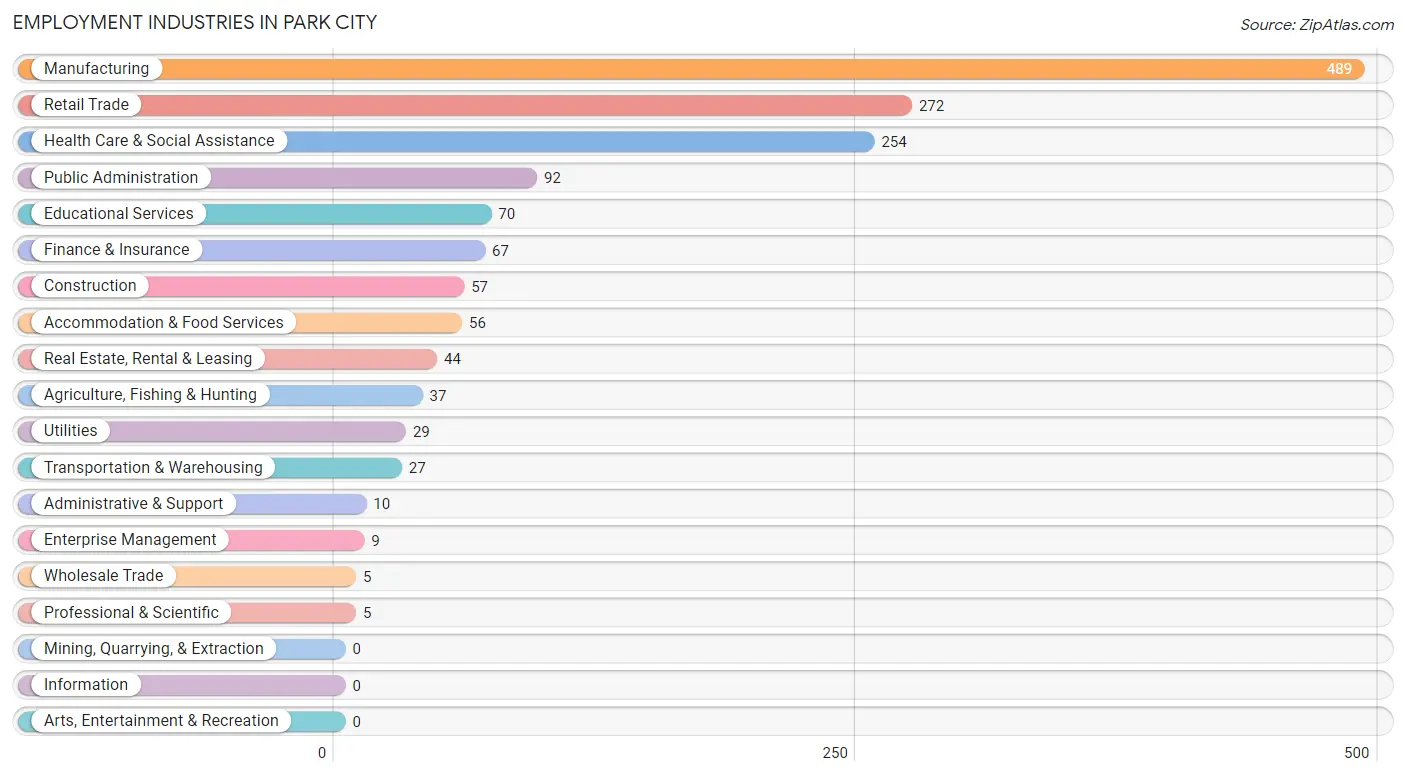
Employment Industries in Park City
The major employment industries in Park City include Manufacturing (489 | 25.1%), Retail Trade (272 | 13.9%), Health Care & Social Assistance (254 | 13.0%), Public Administration (92 | 4.7%), and Educational Services (70 | 3.6%).
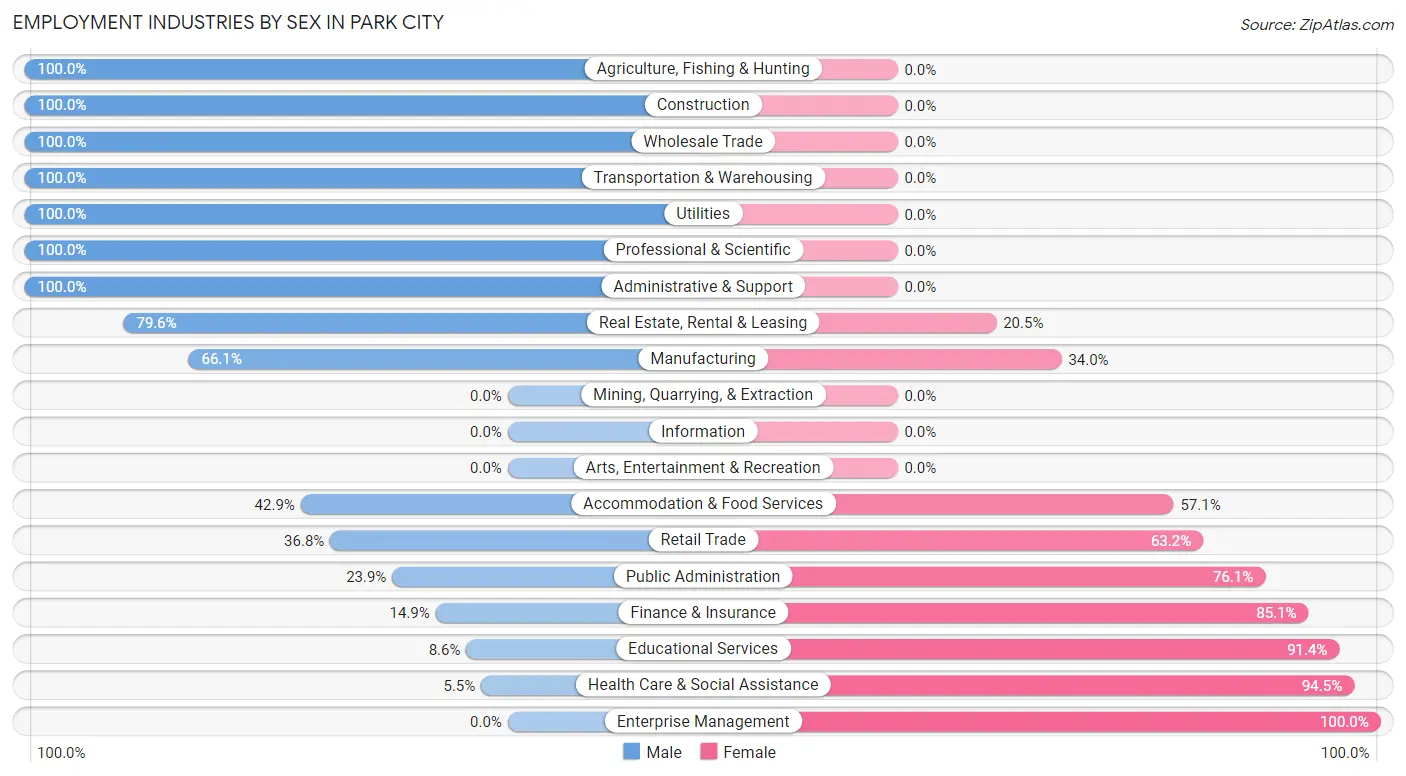
Employment Industries by Sex in Park City
The Park City industries that see more men than women are Agriculture, Fishing & Hunting (100.0%), Construction (100.0%), and Wholesale Trade (100.0%), whereas the industries that tend to have a higher number of women are Enterprise Management (100.0%), Health Care & Social Assistance (94.5%), and Educational Services (91.4%).
| Industry | Male | Female |
| Agriculture, Fishing & Hunting | 37 (100.0%) | 0 (0.0%) |
| Mining, Quarrying, & Extraction | 0 (0.0%) | 0 (0.0%) |
| Construction | 57 (100.0%) | 0 (0.0%) |
| Manufacturing | 323 (66.0%) | 166 (34.0%) |
| Wholesale Trade | 5 (100.0%) | 0 (0.0%) |
| Retail Trade | 100 (36.8%) | 172 (63.2%) |
| Transportation & Warehousing | 27 (100.0%) | 0 (0.0%) |
| Utilities | 29 (100.0%) | 0 (0.0%) |
| Information | 0 (0.0%) | 0 (0.0%) |
| Finance & Insurance | 10 (14.9%) | 57 (85.1%) |
| Real Estate, Rental & Leasing | 35 (79.5%) | 9 (20.4%) |
| Professional & Scientific | 5 (100.0%) | 0 (0.0%) |
| Enterprise Management | 0 (0.0%) | 9 (100.0%) |
| Administrative & Support | 10 (100.0%) | 0 (0.0%) |
| Educational Services | 6 (8.6%) | 64 (91.4%) |
| Health Care & Social Assistance | 14 (5.5%) | 240 (94.5%) |
| Arts, Entertainment & Recreation | 0 (0.0%) | 0 (0.0%) |
| Accommodation & Food Services | 24 (42.9%) | 32 (57.1%) |
| Public Administration | 22 (23.9%) | 70 (76.1%) |
| Total | 960 (49.2%) | 991 (50.8%) |
Education in Park City
School Enrollment in Park City
The most common levels of schooling among the 664 students in Park City are middle school (307 | 46.2%), college / undergraduate (140 | 21.1%), and high school (122 | 18.4%).
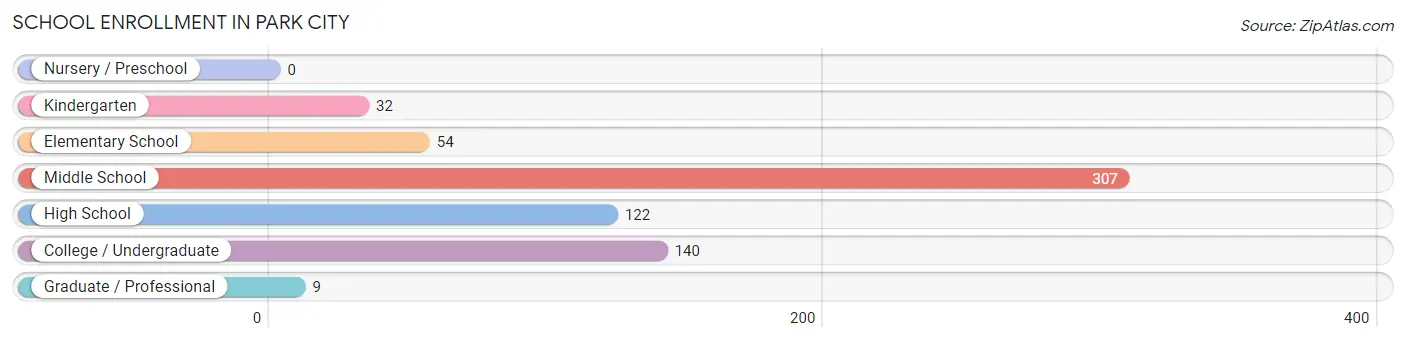
| School Level | # Students | % Students |
| Nursery / Preschool | 0 | 0.0% |
| Kindergarten | 32 | 4.8% |
| Elementary School | 54 | 8.1% |
| Middle School | 307 | 46.2% |
| High School | 122 | 18.4% |
| College / Undergraduate | 140 | 21.1% |
| Graduate / Professional | 9 | 1.4% |
| Total | 664 | 100.0% |
School Enrollment by Age by Funding Source in Park City
Out of a total of 664 students who are enrolled in schools in Park City, 40 (6.0%) attend a private institution, while the remaining 624 (94.0%) are enrolled in public schools. The age group of 35 years and over has the highest likelihood of being enrolled in private schools, with 9 (64.3% in the age bracket) enrolled. Conversely, the age group of 5 to 9 year old has the lowest likelihood of being enrolled in a private school, with 71 (100.0% in the age bracket) attending a public institution.
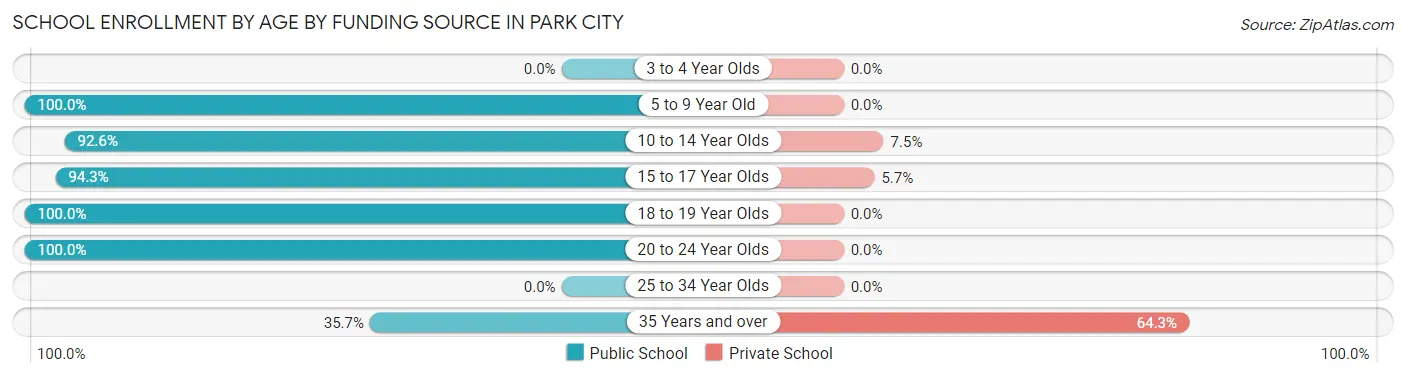
| Age Bracket | Public School | Private School |
| 3 to 4 Year Olds | 0 (0.0%) | 0 (0.0%) |
| 5 to 9 Year Old | 71 (100.0%) | 0 (0.0%) |
| 10 to 14 Year Olds | 298 (92.5%) | 24 (7.4%) |
| 15 to 17 Year Olds | 115 (94.3%) | 7 (5.7%) |
| 18 to 19 Year Olds | 108 (100.0%) | 0 (0.0%) |
| 20 to 24 Year Olds | 27 (100.0%) | 0 (0.0%) |
| 25 to 34 Year Olds | 0 (0.0%) | 0 (0.0%) |
| 35 Years and over | 5 (35.7%) | 9 (64.3%) |
| Total | 624 (94.0%) | 40 (6.0%) |
Educational Attainment by Field of Study in Park City
Science & technology (130 | 42.5%), education (63 | 20.6%), engineering (38 | 12.4%), business (37 | 12.1%), and liberal arts & history (16 | 5.2%) are the most common fields of study among 306 individuals in Park City who have obtained a bachelor's degree or higher.
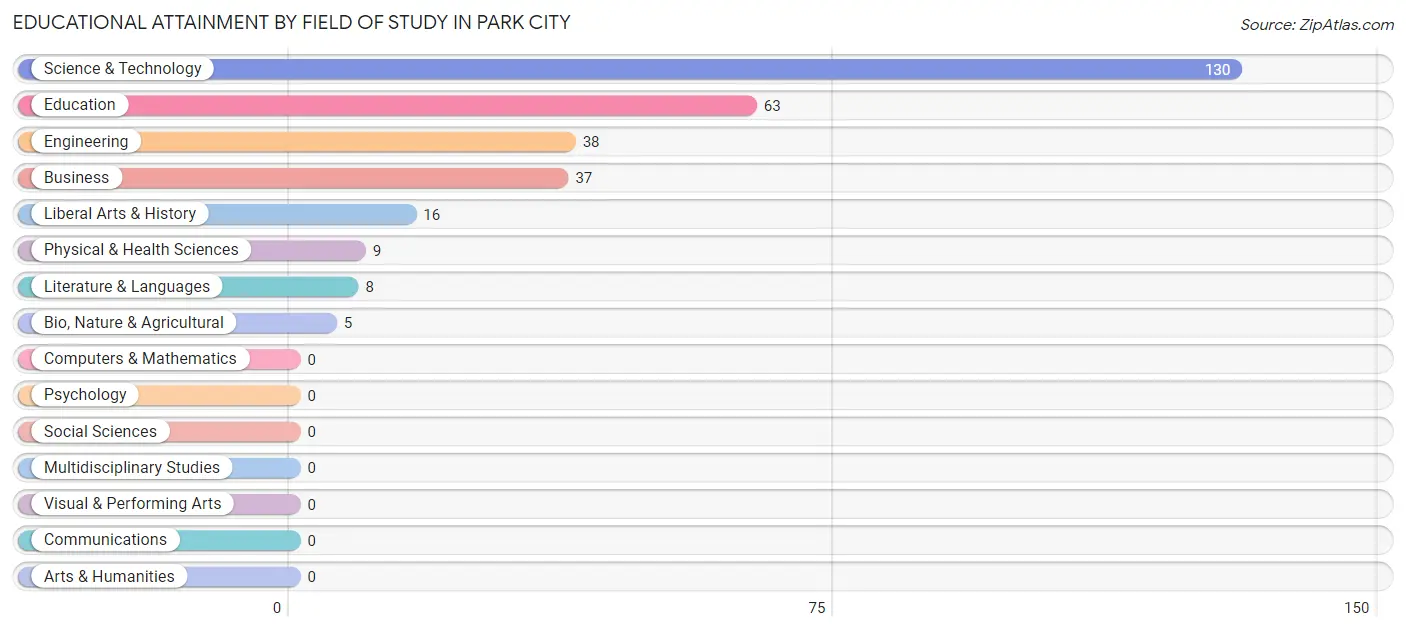
| Field of Study | # Graduates | % Graduates |
| Computers & Mathematics | 0 | 0.0% |
| Bio, Nature & Agricultural | 5 | 1.6% |
| Physical & Health Sciences | 9 | 2.9% |
| Psychology | 0 | 0.0% |
| Social Sciences | 0 | 0.0% |
| Engineering | 38 | 12.4% |
| Multidisciplinary Studies | 0 | 0.0% |
| Science & Technology | 130 | 42.5% |
| Business | 37 | 12.1% |
| Education | 63 | 20.6% |
| Literature & Languages | 8 | 2.6% |
| Liberal Arts & History | 16 | 5.2% |
| Visual & Performing Arts | 0 | 0.0% |
| Communications | 0 | 0.0% |
| Arts & Humanities | 0 | 0.0% |
| Total | 306 | 100.0% |
Transportation & Commute in Park City
Vehicle Availability by Sex in Park City
The most prevalent vehicle ownership categories in Park City are males with 2 vehicles (430, accounting for 46.7%) and females with 2 vehicles (358, making up 43.4%).
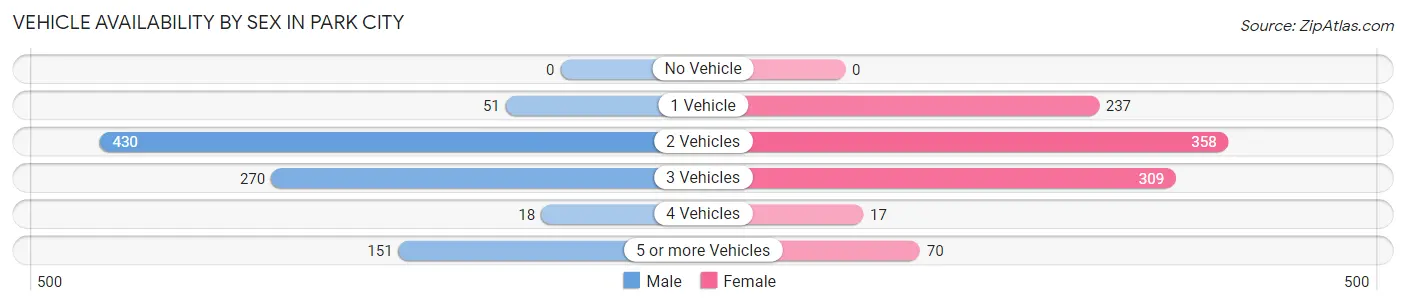
| Vehicles Available | Male | Female |
| No Vehicle | 0 (0.0%) | 0 (0.0%) |
| 1 Vehicle | 51 (5.5%) | 237 (23.9%) |
| 2 Vehicles | 430 (46.7%) | 358 (36.1%) |
| 3 Vehicles | 270 (29.3%) | 309 (31.2%) |
| 4 Vehicles | 18 (2.0%) | 17 (1.7%) |
| 5 or more Vehicles | 151 (16.4%) | 70 (7.1%) |
| Total | 920 (100.0%) | 991 (100.0%) |
Commute Time in Park City
The most frequently occuring commute durations in Park City are 10 to 14 minutes (395 commuters, 21.8%), 15 to 19 minutes (389 commuters, 21.4%), and 45 to 59 minutes (298 commuters, 16.4%).
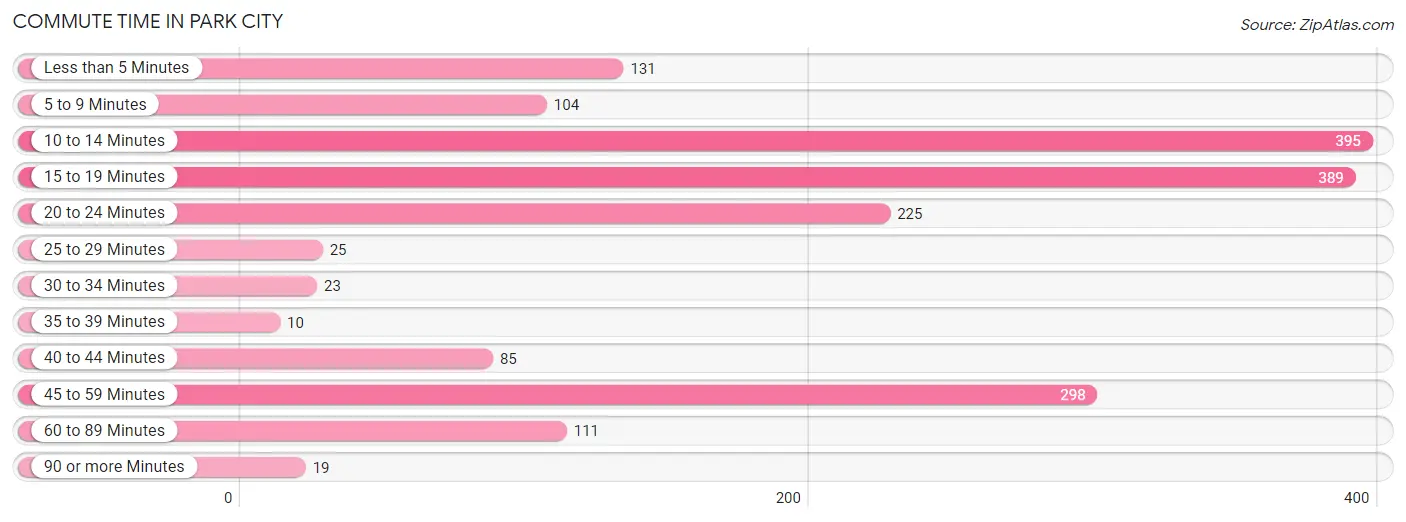
| Commute Time | # Commuters | % Commuters |
| Less than 5 Minutes | 131 | 7.2% |
| 5 to 9 Minutes | 104 | 5.7% |
| 10 to 14 Minutes | 395 | 21.8% |
| 15 to 19 Minutes | 389 | 21.4% |
| 20 to 24 Minutes | 225 | 12.4% |
| 25 to 29 Minutes | 25 | 1.4% |
| 30 to 34 Minutes | 23 | 1.3% |
| 35 to 39 Minutes | 10 | 0.5% |
| 40 to 44 Minutes | 85 | 4.7% |
| 45 to 59 Minutes | 298 | 16.4% |
| 60 to 89 Minutes | 111 | 6.1% |
| 90 or more Minutes | 19 | 1.1% |
Commute Time by Sex in Park City
The most common commute times in Park City are 45 to 59 minutes (229 commuters, 25.9%) for males and 15 to 19 minutes (230 commuters, 24.7%) for females.
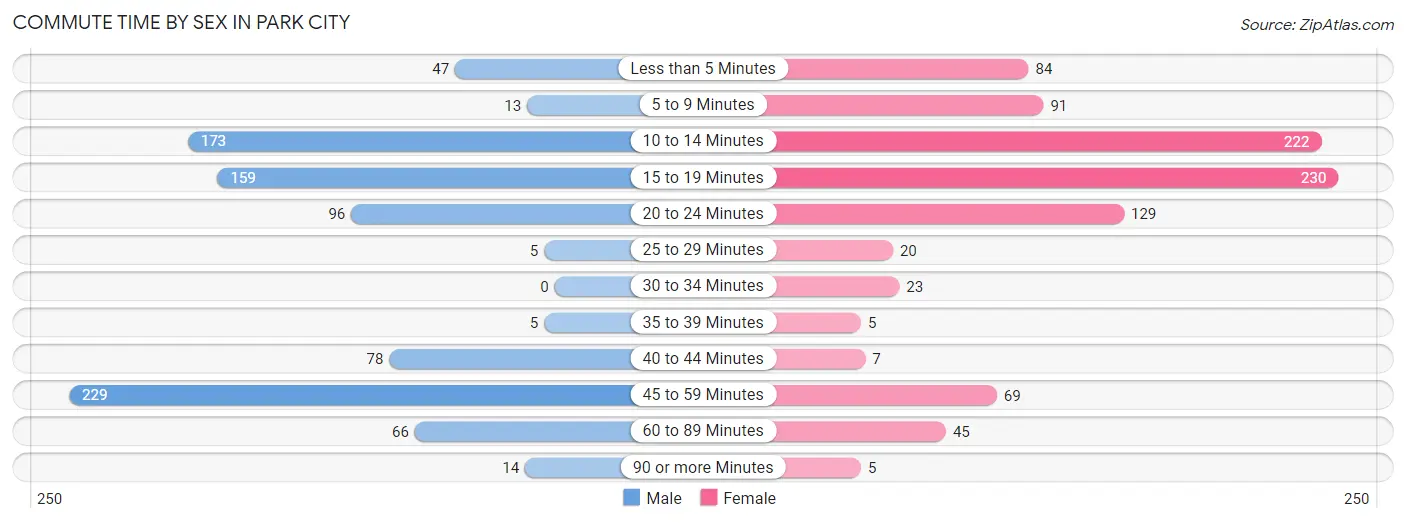
| Commute Time | Male | Female |
| Less than 5 Minutes | 47 (5.3%) | 84 (9.0%) |
| 5 to 9 Minutes | 13 (1.5%) | 91 (9.8%) |
| 10 to 14 Minutes | 173 (19.6%) | 222 (23.9%) |
| 15 to 19 Minutes | 159 (18.0%) | 230 (24.7%) |
| 20 to 24 Minutes | 96 (10.8%) | 129 (13.9%) |
| 25 to 29 Minutes | 5 (0.6%) | 20 (2.1%) |
| 30 to 34 Minutes | 0 (0.0%) | 23 (2.5%) |
| 35 to 39 Minutes | 5 (0.6%) | 5 (0.5%) |
| 40 to 44 Minutes | 78 (8.8%) | 7 (0.7%) |
| 45 to 59 Minutes | 229 (25.9%) | 69 (7.4%) |
| 60 to 89 Minutes | 66 (7.5%) | 45 (4.8%) |
| 90 or more Minutes | 14 (1.6%) | 5 (0.5%) |
Time of Departure to Work by Sex in Park City
The most frequent times of departure to work in Park City are 12:00 AM to 4:59 AM (229, 25.9%) for males and 7:30 AM to 7:59 AM (273, 29.3%) for females.
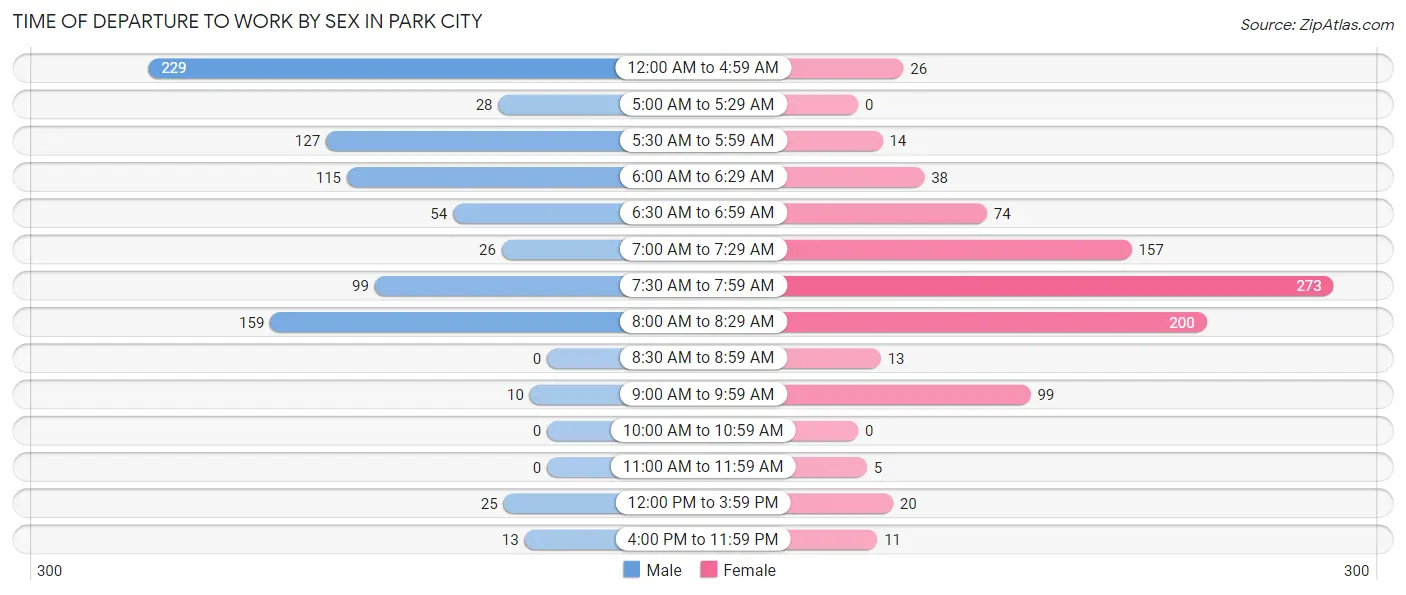
| Time of Departure | Male | Female |
| 12:00 AM to 4:59 AM | 229 (25.9%) | 26 (2.8%) |
| 5:00 AM to 5:29 AM | 28 (3.2%) | 0 (0.0%) |
| 5:30 AM to 5:59 AM | 127 (14.3%) | 14 (1.5%) |
| 6:00 AM to 6:29 AM | 115 (13.0%) | 38 (4.1%) |
| 6:30 AM to 6:59 AM | 54 (6.1%) | 74 (8.0%) |
| 7:00 AM to 7:29 AM | 26 (2.9%) | 157 (16.9%) |
| 7:30 AM to 7:59 AM | 99 (11.2%) | 273 (29.3%) |
| 8:00 AM to 8:29 AM | 159 (18.0%) | 200 (21.5%) |
| 8:30 AM to 8:59 AM | 0 (0.0%) | 13 (1.4%) |
| 9:00 AM to 9:59 AM | 10 (1.1%) | 99 (10.6%) |
| 10:00 AM to 10:59 AM | 0 (0.0%) | 0 (0.0%) |
| 11:00 AM to 11:59 AM | 0 (0.0%) | 5 (0.5%) |
| 12:00 PM to 3:59 PM | 25 (2.8%) | 20 (2.1%) |
| 4:00 PM to 11:59 PM | 13 (1.5%) | 11 (1.2%) |
| Total | 885 (100.0%) | 930 (100.0%) |
Housing Occupancy in Park City
Occupancy by Ownership in Park City
Of the total 1,293 dwellings in Park City, owner-occupied units account for 1,129 (87.3%), while renter-occupied units make up 164 (12.7%).
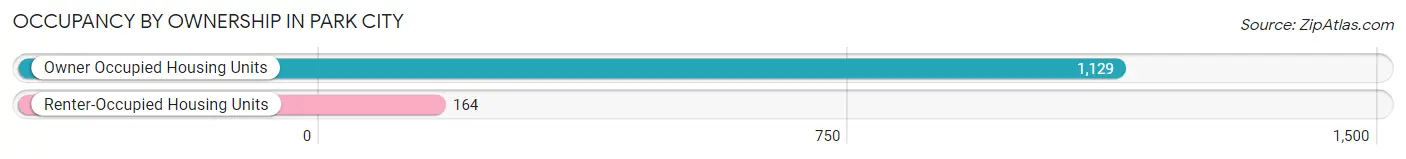
| Occupancy | # Housing Units | % Housing Units |
| Owner Occupied Housing Units | 1,129 | 87.3% |
| Renter-Occupied Housing Units | 164 | 12.7% |
| Total Occupied Housing Units | 1,293 | 100.0% |
Occupancy by Household Size in Park City
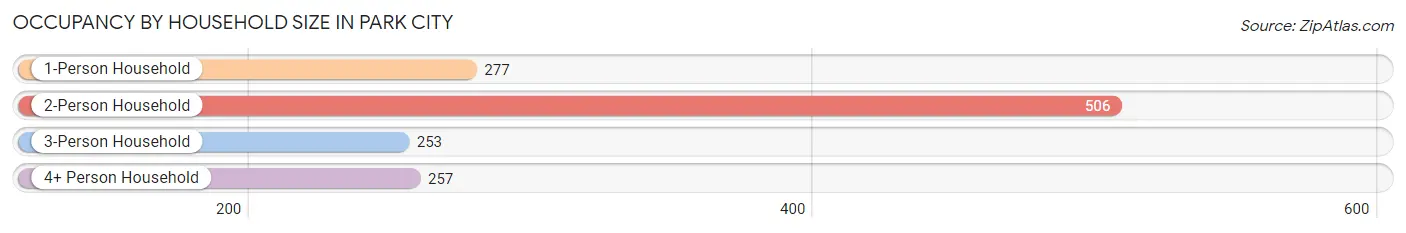
| Household Size | # Housing Units | % Housing Units |
| 1-Person Household | 277 | 21.4% |
| 2-Person Household | 506 | 39.1% |
| 3-Person Household | 253 | 19.6% |
| 4+ Person Household | 257 | 19.9% |
| Total Housing Units | 1,293 | 100.0% |
Occupancy by Ownership by Household Size in Park City
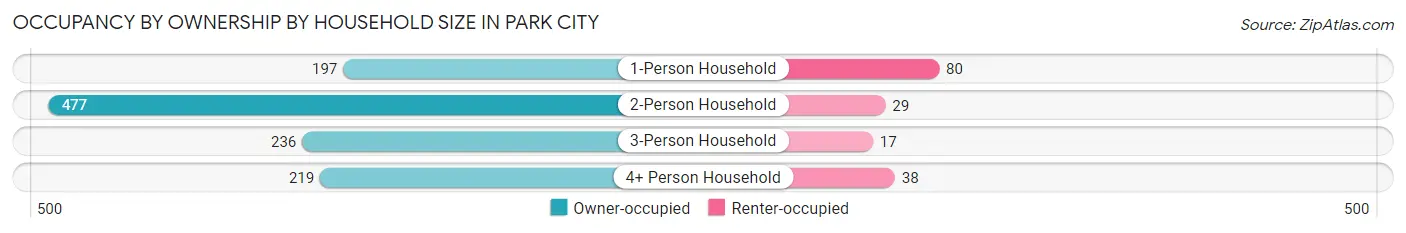
| Household Size | Owner-occupied | Renter-occupied |
| 1-Person Household | 197 (71.1%) | 80 (28.9%) |
| 2-Person Household | 477 (94.3%) | 29 (5.7%) |
| 3-Person Household | 236 (93.3%) | 17 (6.7%) |
| 4+ Person Household | 219 (85.2%) | 38 (14.8%) |
| Total Housing Units | 1,129 (87.3%) | 164 (12.7%) |
Occupancy by Educational Attainment in Park City
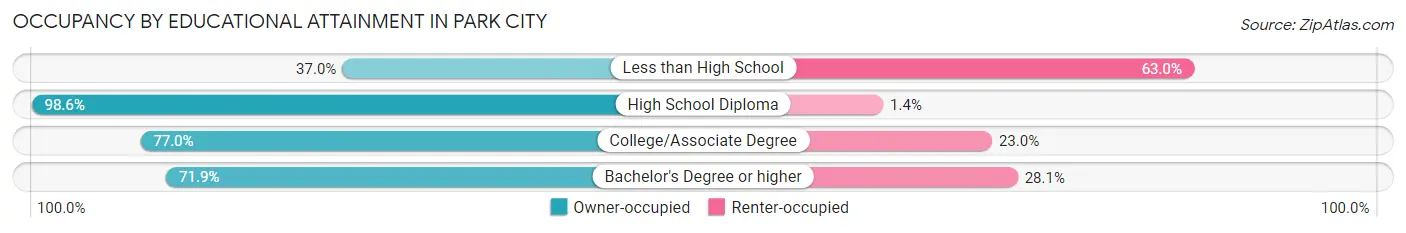
| Household Size | Owner-occupied | Renter-occupied |
| Less than High School | 10 (37.0%) | 17 (63.0%) |
| High School Diploma | 710 (98.6%) | 10 (1.4%) |
| College/Associate Degree | 245 (77.0%) | 73 (23.0%) |
| Bachelor's Degree or higher | 164 (71.9%) | 64 (28.1%) |
Occupancy by Age of Householder in Park City
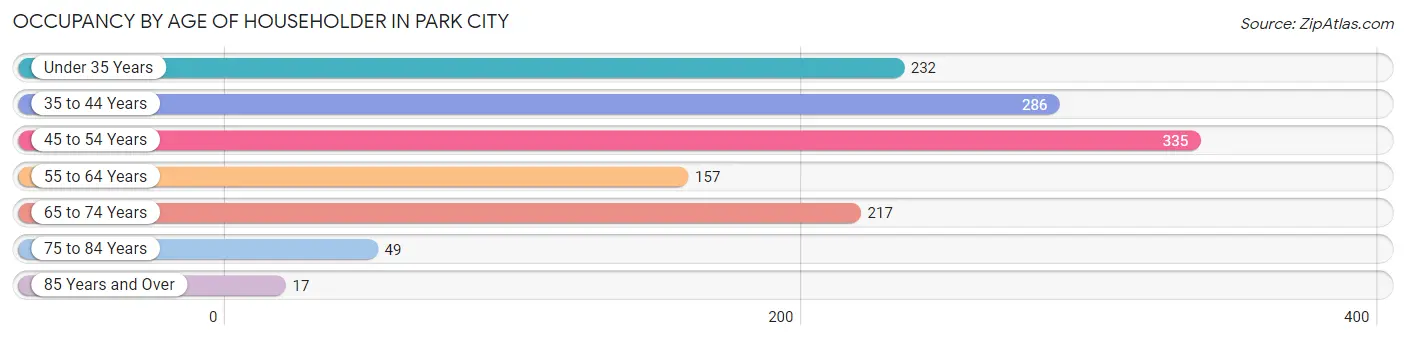
| Age Bracket | # Households | % Households |
| Under 35 Years | 232 | 17.9% |
| 35 to 44 Years | 286 | 22.1% |
| 45 to 54 Years | 335 | 25.9% |
| 55 to 64 Years | 157 | 12.1% |
| 65 to 74 Years | 217 | 16.8% |
| 75 to 84 Years | 49 | 3.8% |
| 85 Years and Over | 17 | 1.3% |
| Total | 1,293 | 100.0% |
Housing Finances in Park City
Median Income by Occupancy in Park City
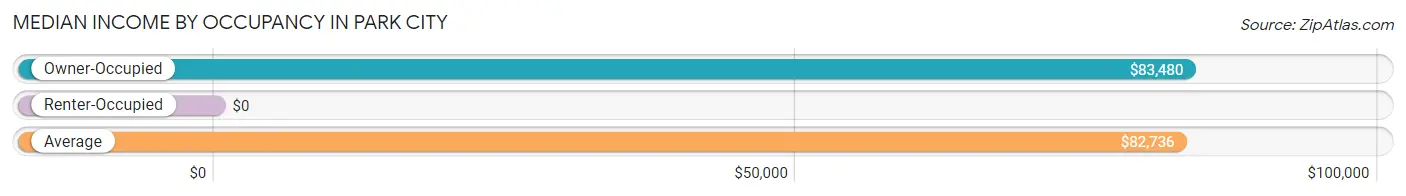
| Occupancy Type | # Households | Median Income |
| Owner-Occupied | 1,129 (87.3%) | $83,480 |
| Renter-Occupied | 164 (12.7%) | $0 |
| Average | 1,293 (100.0%) | $82,736 |
Occupancy by Householder Income Bracket in Park City
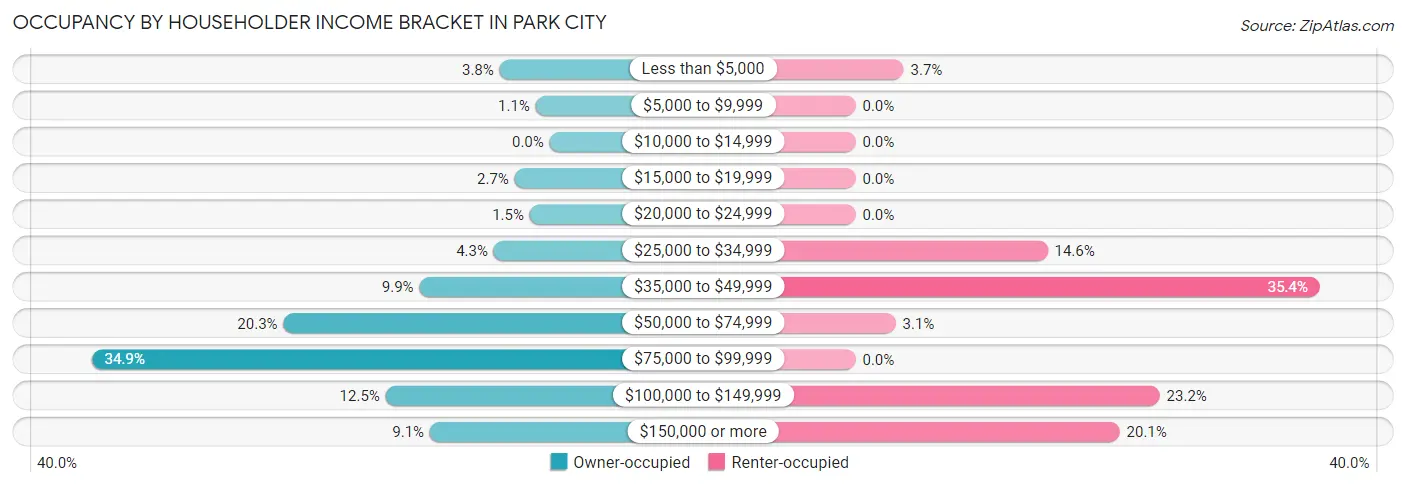
| Income Bracket | Owner-occupied | Renter-occupied |
| Less than $5,000 | 43 (3.8%) | 6 (3.7%) |
| $5,000 to $9,999 | 12 (1.1%) | 0 (0.0%) |
| $10,000 to $14,999 | 0 (0.0%) | 0 (0.0%) |
| $15,000 to $19,999 | 30 (2.7%) | 0 (0.0%) |
| $20,000 to $24,999 | 17 (1.5%) | 0 (0.0%) |
| $25,000 to $34,999 | 48 (4.3%) | 24 (14.6%) |
| $35,000 to $49,999 | 112 (9.9%) | 58 (35.4%) |
| $50,000 to $74,999 | 229 (20.3%) | 5 (3.0%) |
| $75,000 to $99,999 | 394 (34.9%) | 0 (0.0%) |
| $100,000 to $149,999 | 141 (12.5%) | 38 (23.2%) |
| $150,000 or more | 103 (9.1%) | 33 (20.1%) |
| Total | 1,129 (100.0%) | 164 (100.0%) |
Monthly Housing Cost Tiers in Park City
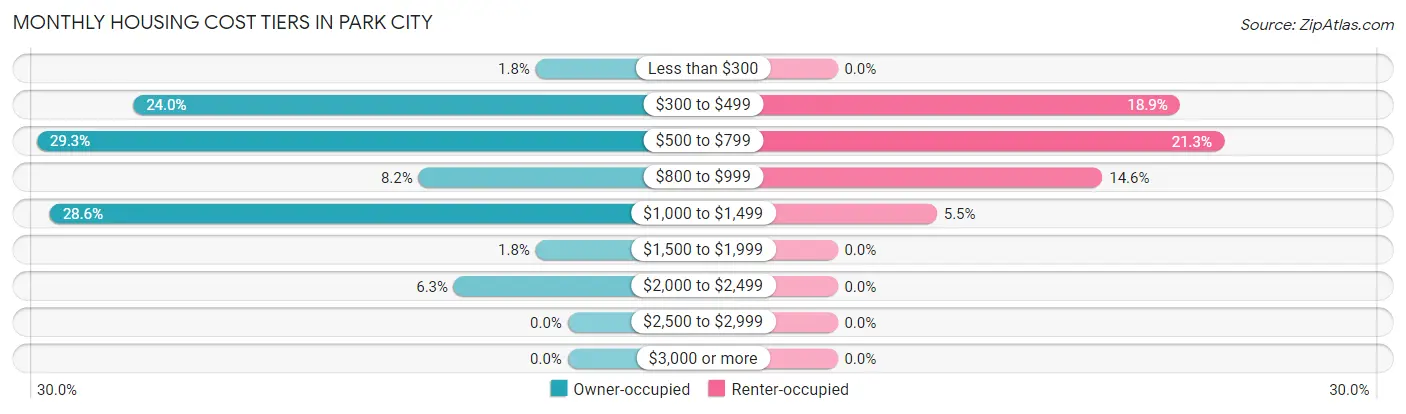
| Monthly Cost | Owner-occupied | Renter-occupied |
| Less than $300 | 20 (1.8%) | 0 (0.0%) |
| $300 to $499 | 271 (24.0%) | 31 (18.9%) |
| $500 to $799 | 331 (29.3%) | 35 (21.3%) |
| $800 to $999 | 93 (8.2%) | 24 (14.6%) |
| $1,000 to $1,499 | 323 (28.6%) | 9 (5.5%) |
| $1,500 to $1,999 | 20 (1.8%) | 0 (0.0%) |
| $2,000 to $2,499 | 71 (6.3%) | 0 (0.0%) |
| $2,500 to $2,999 | 0 (0.0%) | 0 (0.0%) |
| $3,000 or more | 0 (0.0%) | 0 (0.0%) |
| Total | 1,129 (100.0%) | 164 (100.0%) |
Physical Housing Characteristics in Park City
Housing Structures in Park City
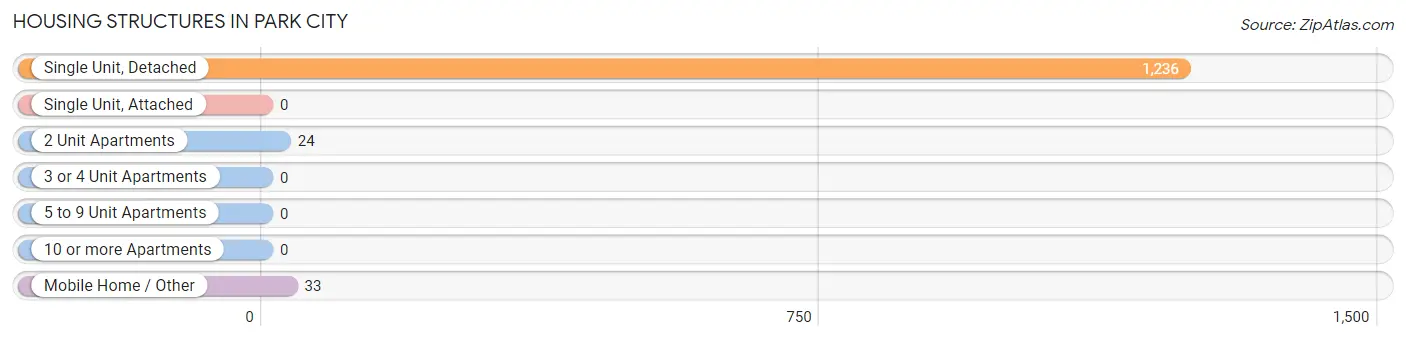
| Structure Type | # Housing Units | % Housing Units |
| Single Unit, Detached | 1,236 | 95.6% |
| Single Unit, Attached | 0 | 0.0% |
| 2 Unit Apartments | 24 | 1.9% |
| 3 or 4 Unit Apartments | 0 | 0.0% |
| 5 to 9 Unit Apartments | 0 | 0.0% |
| 10 or more Apartments | 0 | 0.0% |
| Mobile Home / Other | 33 | 2.5% |
| Total | 1,293 | 100.0% |
Housing Structures by Occupancy in Park City
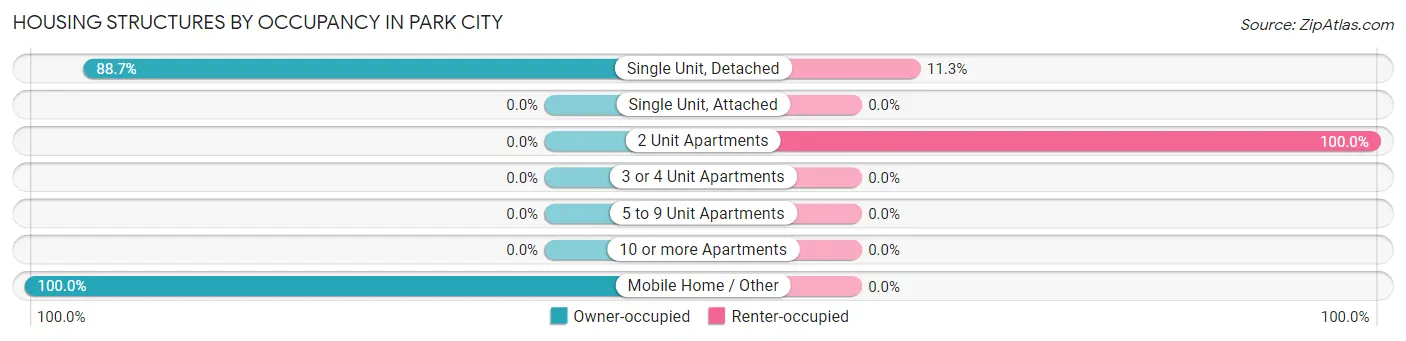
| Structure Type | Owner-occupied | Renter-occupied |
| Single Unit, Detached | 1,096 (88.7%) | 140 (11.3%) |
| Single Unit, Attached | 0 (0.0%) | 0 (0.0%) |
| 2 Unit Apartments | 0 (0.0%) | 24 (100.0%) |
| 3 or 4 Unit Apartments | 0 (0.0%) | 0 (0.0%) |
| 5 to 9 Unit Apartments | 0 (0.0%) | 0 (0.0%) |
| 10 or more Apartments | 0 (0.0%) | 0 (0.0%) |
| Mobile Home / Other | 33 (100.0%) | 0 (0.0%) |
| Total | 1,129 (87.3%) | 164 (12.7%) |
Housing Structures by Number of Rooms in Park City
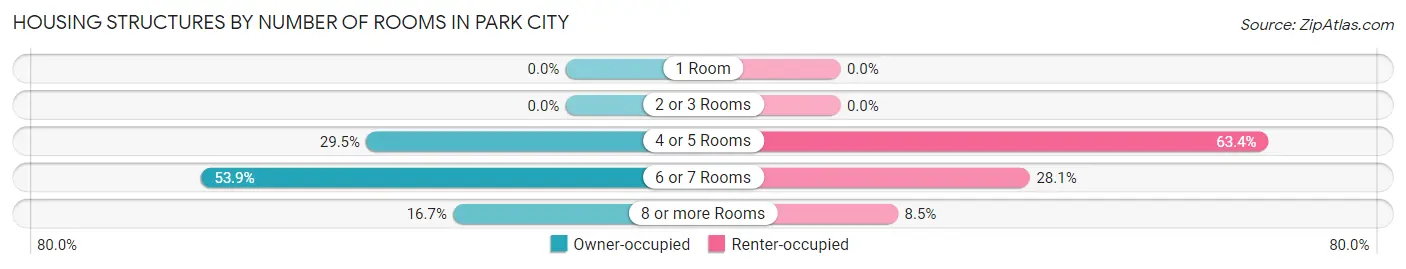
| Number of Rooms | Owner-occupied | Renter-occupied |
| 1 Room | 0 (0.0%) | 0 (0.0%) |
| 2 or 3 Rooms | 0 (0.0%) | 0 (0.0%) |
| 4 or 5 Rooms | 333 (29.5%) | 104 (63.4%) |
| 6 or 7 Rooms | 608 (53.8%) | 46 (28.1%) |
| 8 or more Rooms | 188 (16.7%) | 14 (8.5%) |
| Total | 1,129 (100.0%) | 164 (100.0%) |
Housing Structure by Heating Type in Park City
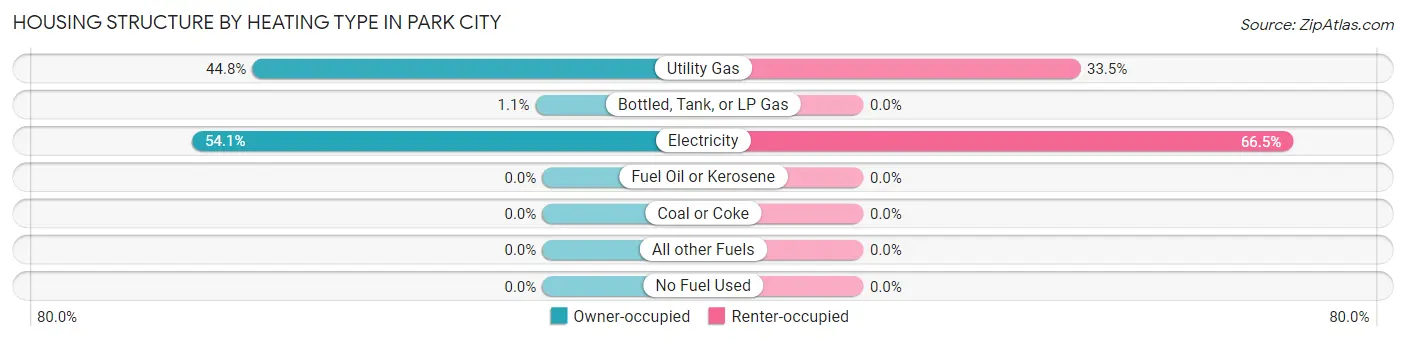
| Heating Type | Owner-occupied | Renter-occupied |
| Utility Gas | 506 (44.8%) | 55 (33.5%) |
| Bottled, Tank, or LP Gas | 12 (1.1%) | 0 (0.0%) |
| Electricity | 611 (54.1%) | 109 (66.5%) |
| Fuel Oil or Kerosene | 0 (0.0%) | 0 (0.0%) |
| Coal or Coke | 0 (0.0%) | 0 (0.0%) |
| All other Fuels | 0 (0.0%) | 0 (0.0%) |
| No Fuel Used | 0 (0.0%) | 0 (0.0%) |
| Total | 1,129 (100.0%) | 164 (100.0%) |
Household Vehicle Usage in Park City
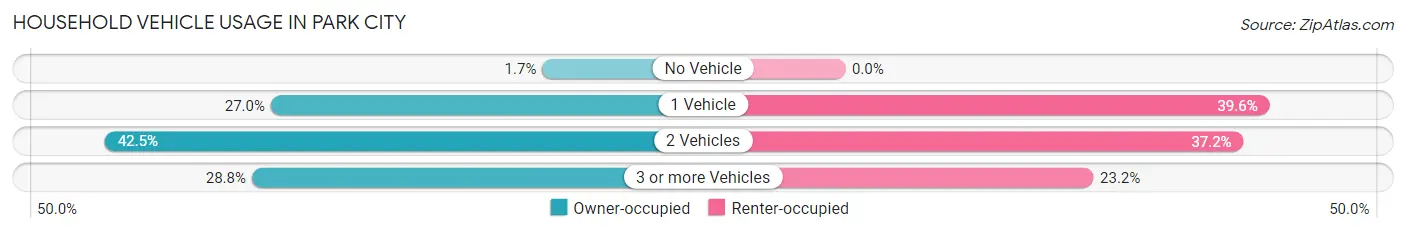
| Vehicles per Household | Owner-occupied | Renter-occupied |
| No Vehicle | 19 (1.7%) | 0 (0.0%) |
| 1 Vehicle | 305 (27.0%) | 65 (39.6%) |
| 2 Vehicles | 480 (42.5%) | 61 (37.2%) |
| 3 or more Vehicles | 325 (28.8%) | 38 (23.2%) |
| Total | 1,129 (100.0%) | 164 (100.0%) |
Real Estate & Mortgages in Park City
Real Estate and Mortgage Overview in Park City
| Characteristic | Without Mortgage | With Mortgage |
| Housing Units | 432 | 697 |
| Median Property Value | $179,300 | $161,900 |
| Median Household Income | $65,255 | $103 |
| Monthly Housing Costs | $438 | $0 |
| Real Estate Taxes | $672 | $10 |
Property Value by Mortgage Status in Park City
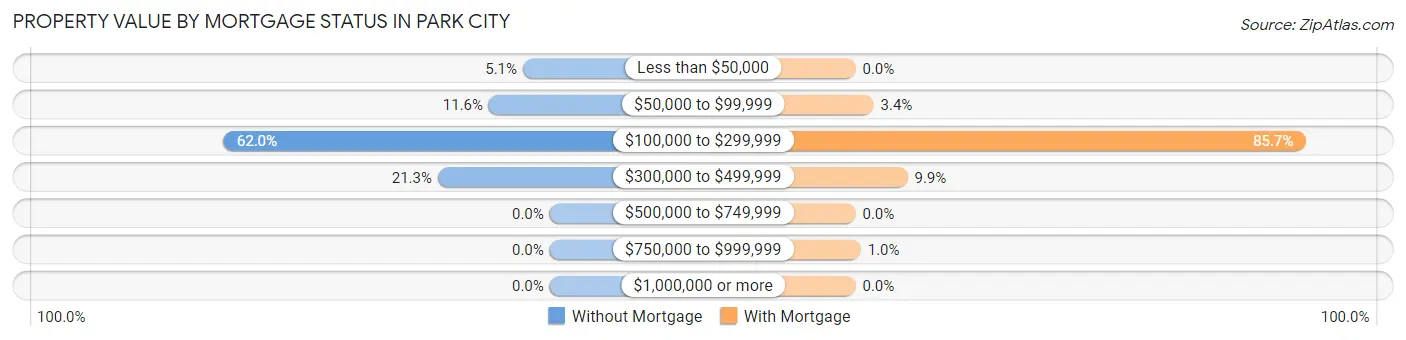
| Property Value | Without Mortgage | With Mortgage |
| Less than $50,000 | 22 (5.1%) | 0 (0.0%) |
| $50,000 to $99,999 | 50 (11.6%) | 24 (3.4%) |
| $100,000 to $299,999 | 268 (62.0%) | 597 (85.7%) |
| $300,000 to $499,999 | 92 (21.3%) | 69 (9.9%) |
| $500,000 to $749,999 | 0 (0.0%) | 0 (0.0%) |
| $750,000 to $999,999 | 0 (0.0%) | 7 (1.0%) |
| $1,000,000 or more | 0 (0.0%) | 0 (0.0%) |
| Total | 432 (100.0%) | 697 (100.0%) |
Household Income by Mortgage Status in Park City
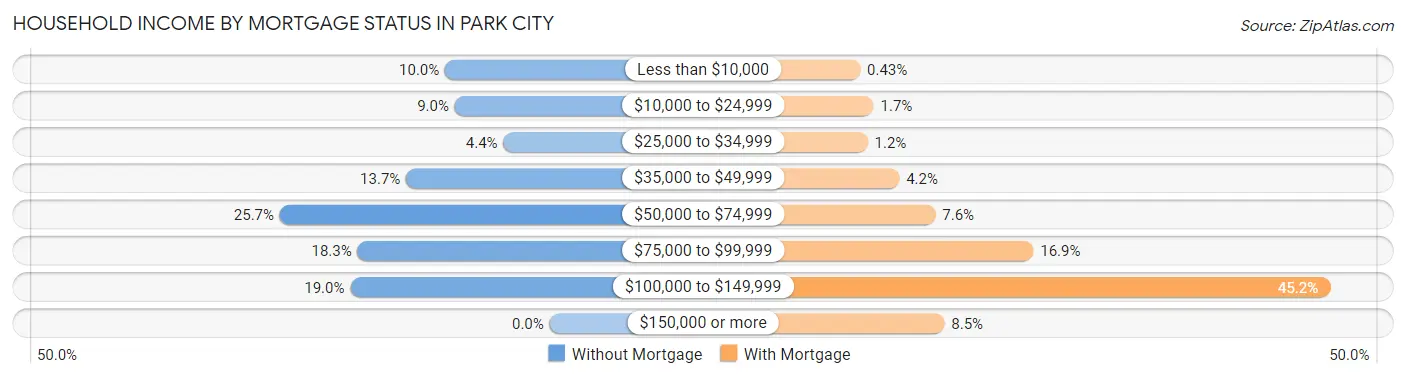
| Household Income | Without Mortgage | With Mortgage |
| Less than $10,000 | 43 (10.0%) | 3 (0.4%) |
| $10,000 to $24,999 | 39 (9.0%) | 12 (1.7%) |
| $25,000 to $34,999 | 19 (4.4%) | 8 (1.1%) |
| $35,000 to $49,999 | 59 (13.7%) | 29 (4.2%) |
| $50,000 to $74,999 | 111 (25.7%) | 53 (7.6%) |
| $75,000 to $99,999 | 79 (18.3%) | 118 (16.9%) |
| $100,000 to $149,999 | 82 (19.0%) | 315 (45.2%) |
| $150,000 or more | 0 (0.0%) | 59 (8.5%) |
| Total | 432 (100.0%) | 697 (100.0%) |
Property Value to Household Income Ratio in Park City
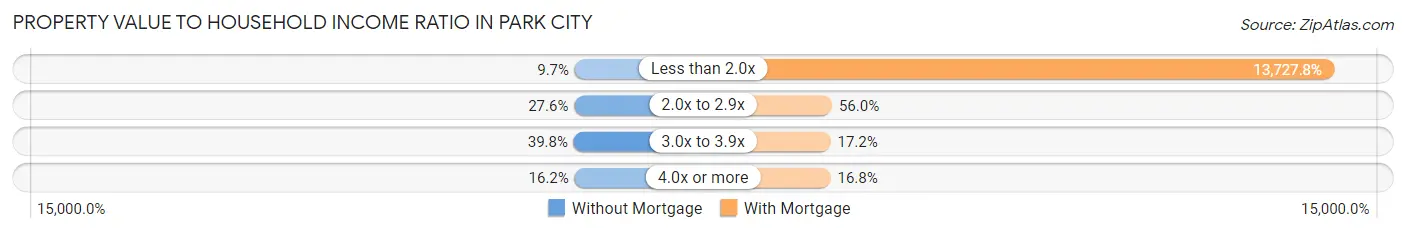
| Value-to-Income Ratio | Without Mortgage | With Mortgage |
| Less than 2.0x | 42 (9.7%) | 95,683 (13,727.8%) |
| 2.0x to 2.9x | 119 (27.6%) | 390 (55.9%) |
| 3.0x to 3.9x | 172 (39.8%) | 120 (17.2%) |
| 4.0x or more | 70 (16.2%) | 117 (16.8%) |
| Total | 432 (100.0%) | 697 (100.0%) |
Real Estate Taxes by Mortgage Status in Park City
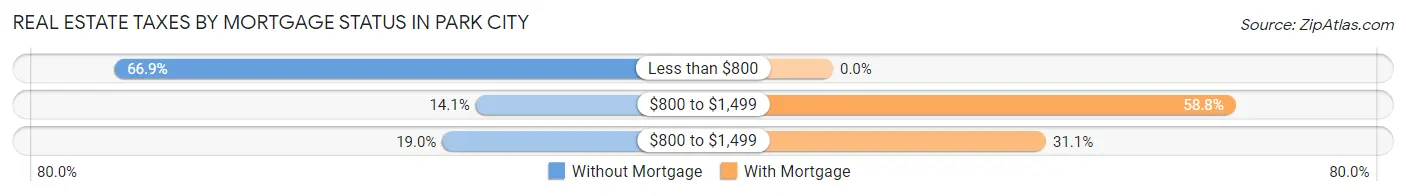
| Property Taxes | Without Mortgage | With Mortgage |
| Less than $800 | 289 (66.9%) | 0 (0.0%) |
| $800 to $1,499 | 61 (14.1%) | 410 (58.8%) |
| $800 to $1,499 | 82 (19.0%) | 217 (31.1%) |
| Total | 432 (100.0%) | 697 (100.0%) |
Health & Disability in Park City
Health Insurance Coverage by Age in Park City
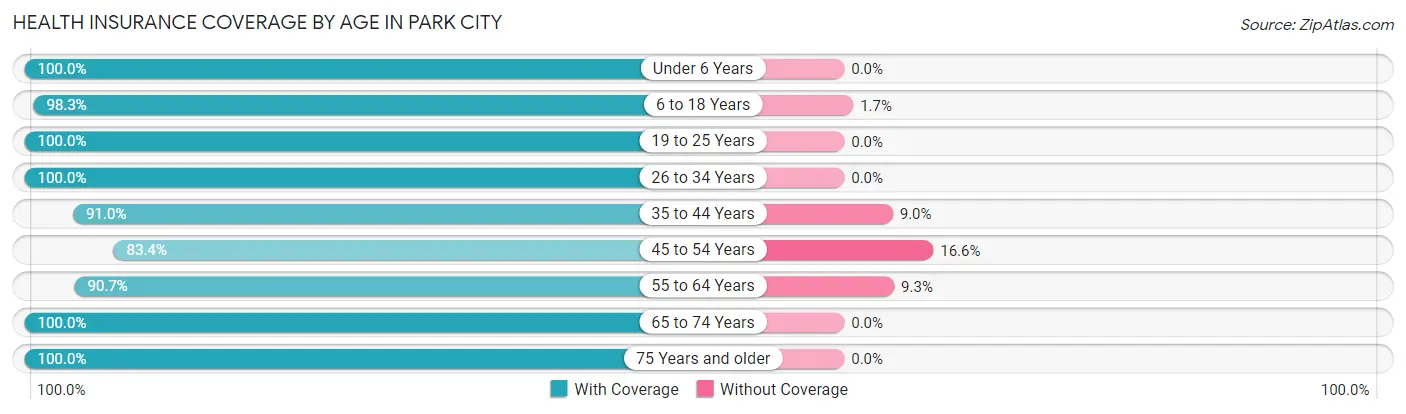
| Age Bracket | With Coverage | Without Coverage |
| Under 6 Years | 300 (100.0%) | 0 (0.0%) |
| 6 to 18 Years | 592 (98.3%) | 10 (1.7%) |
| 19 to 25 Years | 211 (100.0%) | 0 (0.0%) |
| 26 to 34 Years | 411 (100.0%) | 0 (0.0%) |
| 35 to 44 Years | 473 (91.0%) | 47 (9.0%) |
| 45 to 54 Years | 442 (83.4%) | 88 (16.6%) |
| 55 to 64 Years | 351 (90.7%) | 36 (9.3%) |
| 65 to 74 Years | 330 (100.0%) | 0 (0.0%) |
| 75 Years and older | 180 (100.0%) | 0 (0.0%) |
| Total | 3,290 (94.8%) | 181 (5.2%) |
Health Insurance Coverage by Citizenship Status in Park City
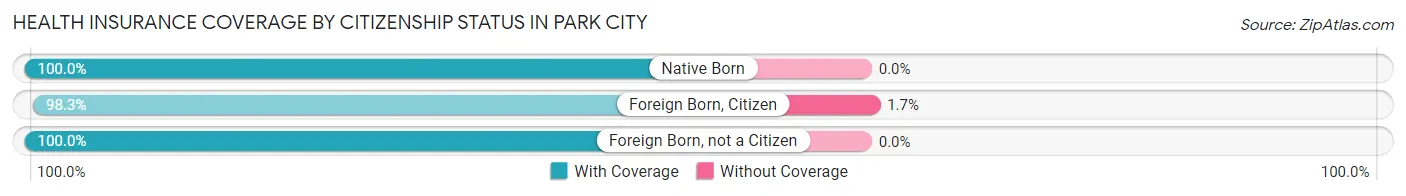
| Citizenship Status | With Coverage | Without Coverage |
| Native Born | 300 (100.0%) | 0 (0.0%) |
| Foreign Born, Citizen | 592 (98.3%) | 10 (1.7%) |
| Foreign Born, not a Citizen | 211 (100.0%) | 0 (0.0%) |
Health Insurance Coverage by Household Income in Park City
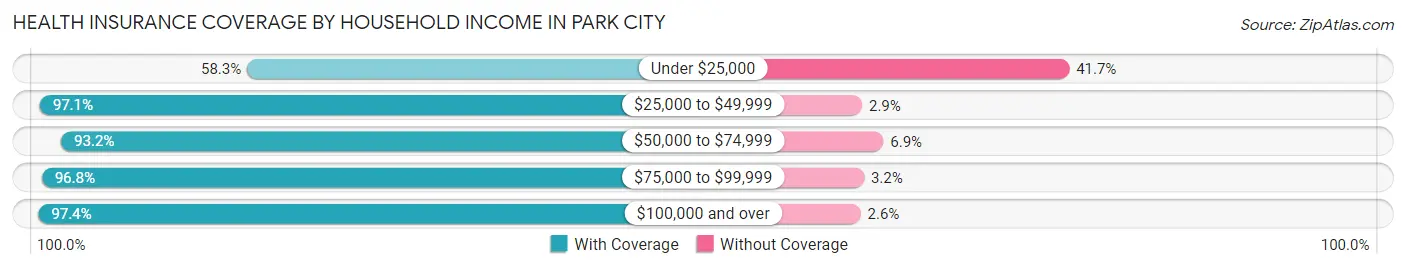
| Household Income | With Coverage | Without Coverage |
| Under $25,000 | 91 (58.3%) | 65 (41.7%) |
| $25,000 to $49,999 | 408 (97.1%) | 12 (2.9%) |
| $50,000 to $74,999 | 476 (93.1%) | 35 (6.9%) |
| $75,000 to $99,999 | 1,111 (96.8%) | 37 (3.2%) |
| $100,000 and over | 1,204 (97.4%) | 32 (2.6%) |
Public vs Private Health Insurance Coverage by Age in Park City
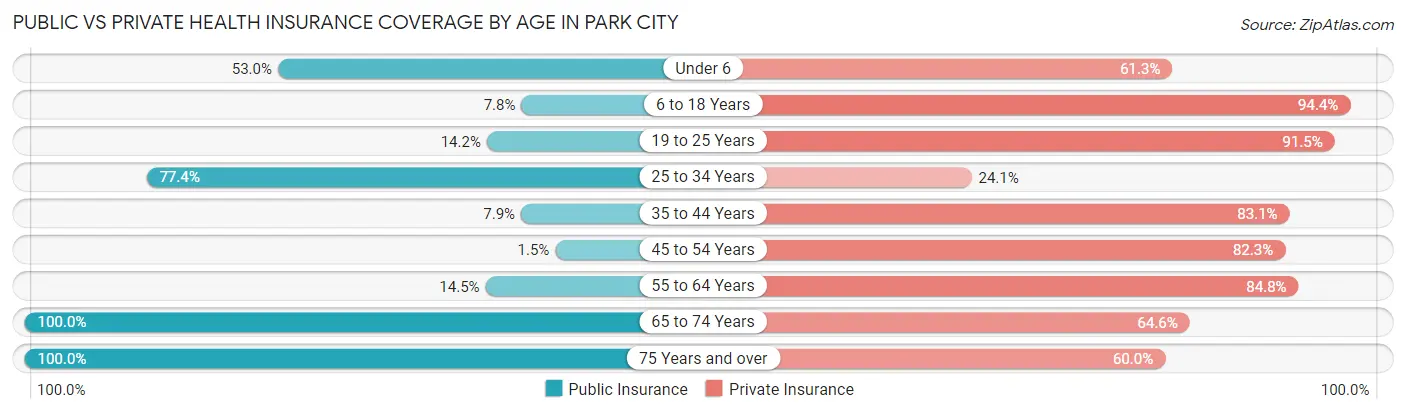
| Age Bracket | Public Insurance | Private Insurance |
| Under 6 | 159 (53.0%) | 184 (61.3%) |
| 6 to 18 Years | 47 (7.8%) | 568 (94.4%) |
| 19 to 25 Years | 30 (14.2%) | 193 (91.5%) |
| 25 to 34 Years | 318 (77.4%) | 99 (24.1%) |
| 35 to 44 Years | 41 (7.9%) | 432 (83.1%) |
| 45 to 54 Years | 8 (1.5%) | 436 (82.3%) |
| 55 to 64 Years | 56 (14.5%) | 328 (84.8%) |
| 65 to 74 Years | 330 (100.0%) | 213 (64.5%) |
| 75 Years and over | 180 (100.0%) | 108 (60.0%) |
| Total | 1,169 (33.7%) | 2,561 (73.8%) |
Disability Status by Sex by Age in Park City
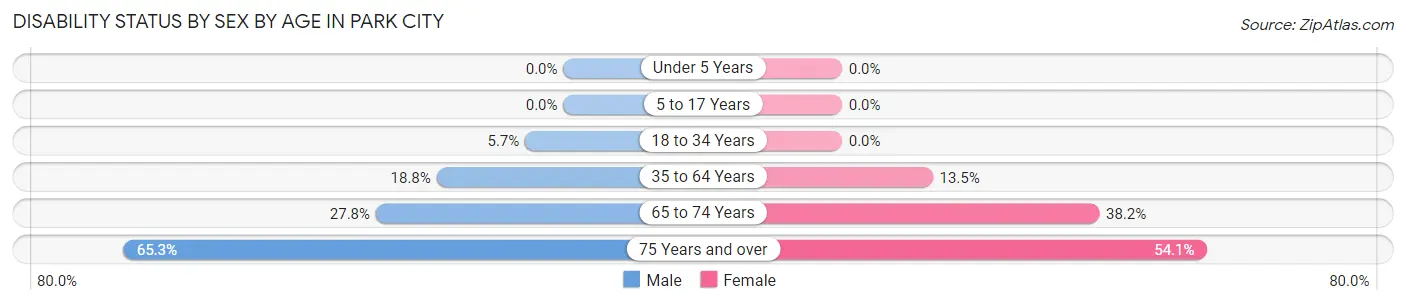
| Age Bracket | Male | Female |
| Under 5 Years | 0 (0.0%) | 0 (0.0%) |
| 5 to 17 Years | 0 (0.0%) | 0 (0.0%) |
| 18 to 34 Years | 21 (5.7%) | 0 (0.0%) |
| 35 to 64 Years | 128 (18.8%) | 102 (13.5%) |
| 65 to 74 Years | 27 (27.8%) | 89 (38.2%) |
| 75 Years and over | 62 (65.3%) | 46 (54.1%) |
Disability Class by Sex by Age in Park City
Disability Class: Hearing Difficulty
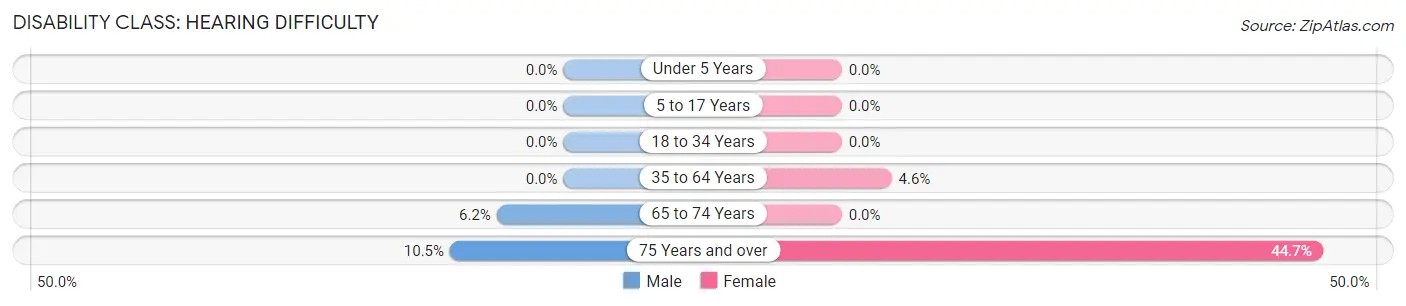
| Age Bracket | Male | Female |
| Under 5 Years | 0 (0.0%) | 0 (0.0%) |
| 5 to 17 Years | 0 (0.0%) | 0 (0.0%) |
| 18 to 34 Years | 0 (0.0%) | 0 (0.0%) |
| 35 to 64 Years | 0 (0.0%) | 35 (4.6%) |
| 65 to 74 Years | 6 (6.2%) | 0 (0.0%) |
| 75 Years and over | 10 (10.5%) | 38 (44.7%) |
Disability Class: Vision Difficulty
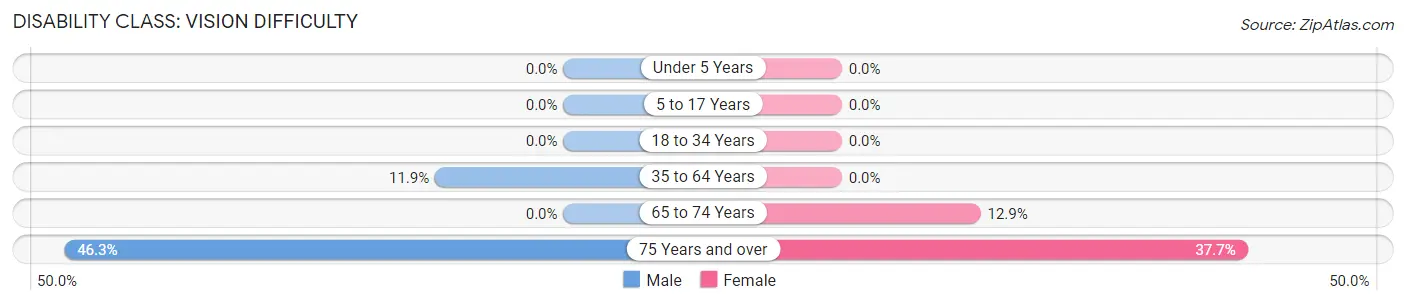
| Age Bracket | Male | Female |
| Under 5 Years | 0 (0.0%) | 0 (0.0%) |
| 5 to 17 Years | 0 (0.0%) | 0 (0.0%) |
| 18 to 34 Years | 0 (0.0%) | 0 (0.0%) |
| 35 to 64 Years | 81 (11.9%) | 0 (0.0%) |
| 65 to 74 Years | 0 (0.0%) | 30 (12.9%) |
| 75 Years and over | 44 (46.3%) | 32 (37.7%) |
Disability Class: Cognitive Difficulty
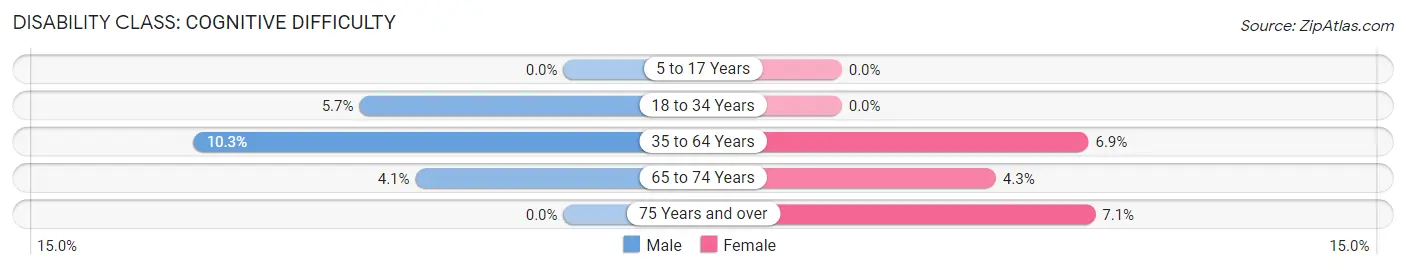
| Age Bracket | Male | Female |
| 5 to 17 Years | 0 (0.0%) | 0 (0.0%) |
| 18 to 34 Years | 21 (5.7%) | 0 (0.0%) |
| 35 to 64 Years | 70 (10.3%) | 52 (6.9%) |
| 65 to 74 Years | 4 (4.1%) | 10 (4.3%) |
| 75 Years and over | 0 (0.0%) | 6 (7.1%) |
Disability Class: Ambulatory Difficulty
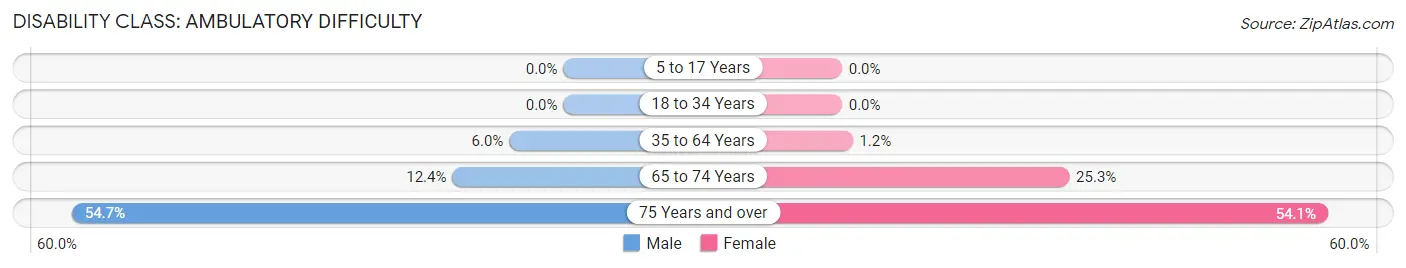
| Age Bracket | Male | Female |
| 5 to 17 Years | 0 (0.0%) | 0 (0.0%) |
| 18 to 34 Years | 0 (0.0%) | 0 (0.0%) |
| 35 to 64 Years | 41 (6.0%) | 9 (1.2%) |
| 65 to 74 Years | 12 (12.4%) | 59 (25.3%) |
| 75 Years and over | 52 (54.7%) | 46 (54.1%) |
Disability Class: Self-Care Difficulty
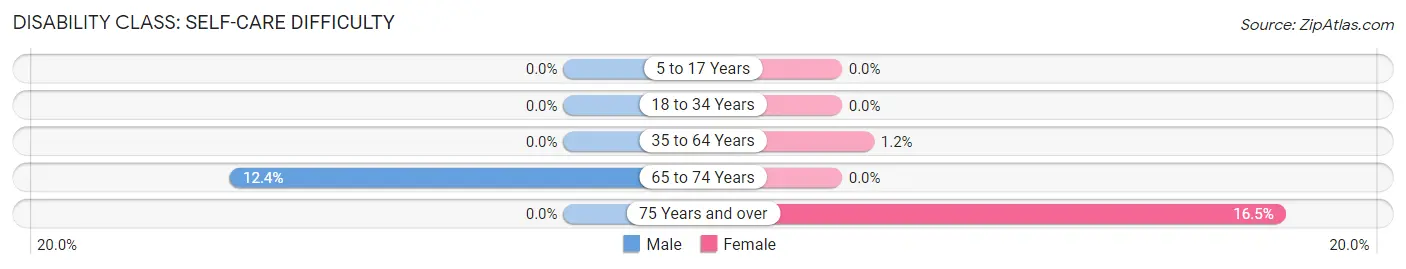
| Age Bracket | Male | Female |
| 5 to 17 Years | 0 (0.0%) | 0 (0.0%) |
| 18 to 34 Years | 0 (0.0%) | 0 (0.0%) |
| 35 to 64 Years | 0 (0.0%) | 9 (1.2%) |
| 65 to 74 Years | 12 (12.4%) | 0 (0.0%) |
| 75 Years and over | 0 (0.0%) | 14 (16.5%) |
Technology Access in Park City
Computing Device Access in Park City
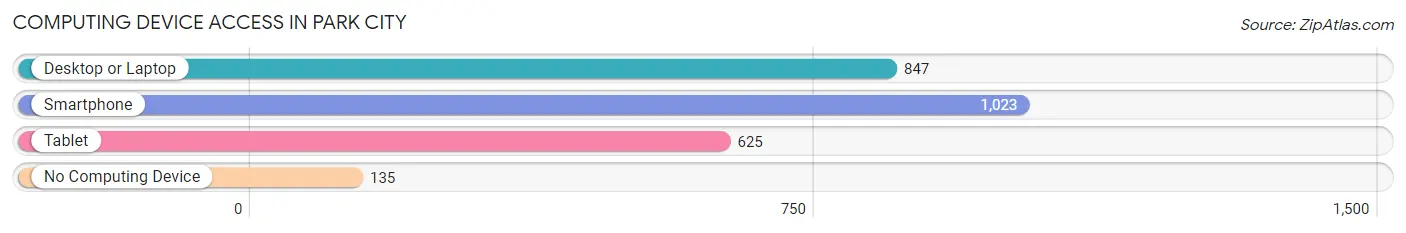
| Device Type | # Households | % Households |
| Desktop or Laptop | 847 | 65.5% |
| Smartphone | 1,023 | 79.1% |
| Tablet | 625 | 48.3% |
| No Computing Device | 135 | 10.4% |
| Total | 1,293 | 100.0% |
Internet Access in Park City
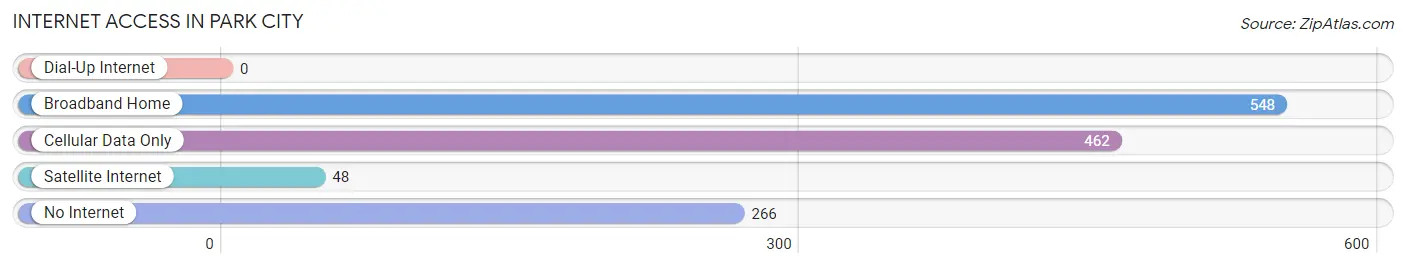
| Internet Type | # Households | % Households |
| Dial-Up Internet | 0 | 0.0% |
| Broadband Home | 548 | 42.4% |
| Cellular Data Only | 462 | 35.7% |
| Satellite Internet | 48 | 3.7% |
| No Internet | 266 | 20.6% |
| Total | 1,293 | 100.0% |
Park City Summary
City of Park City Tennessee
History
The city of Park City, Tennessee is located in the eastern part of the state, in the foothills of the Appalachian Mountains. It is situated in the Sequatchie Valley, which is part of the Cumberland Plateau. The city was founded in 1887 by a group of settlers from the nearby town of Dunlap. The settlers were looking for a place to build a new town and chose the area because of its natural beauty and abundant resources.
The city was originally named Park City because of its proximity to the nearby Cumberland Mountains. The name was later changed to Park City in honor of the city's first mayor, William Park. The city was incorporated in 1891 and has since grown to become a thriving community.
Geography
Park City is located in the Sequatchie Valley, which is part of the Cumberland Plateau. The city is situated at the intersection of two major highways, US-127 and US-41. The city is surrounded by the Sequatchie River to the north and the Cumberland Mountains to the south. The city is located at an elevation of 1,000 feet above sea level.
The climate in Park City is mild and humid, with temperatures ranging from the low 30s in the winter to the mid-80s in the summer. The city receives an average of 45 inches of rain per year.
Economy
The economy of Park City is largely based on agriculture and tourism. The city is home to several large farms, which produce a variety of crops, including corn, soybeans, wheat, and hay. The city is also home to several tourist attractions, including the Sequatchie Valley Railroad Museum, the Sequatchie Valley Winery, and the Sequatchie Valley Golf Course.
The city is also home to several manufacturing companies, including a paper mill, a furniture factory, and a plastics factory. The city is also home to several retail stores, restaurants, and other businesses.
Demographics
As of the 2010 census, the population of Park City was 2,845. The racial makeup of the city was 95.3% White, 0.7% African American, 0.3% Native American, 0.2% Asian, 0.1% Pacific Islander, and 3.4% from other races. The median household income was $35,938, and the median family income was $41,938.
The city is served by the Sequatchie County School System, which includes three elementary schools, one middle school, and one high school. The city is also home to several churches, including the First United Methodist Church, the Park City Baptist Church, and the Park City Presbyterian Church.
Conclusion
Park City, Tennessee is a small city located in the eastern part of the state, in the foothills of the Appalachian Mountains. The city was founded in 1887 and has since grown to become a thriving community. The economy of Park City is largely based on agriculture and tourism, and the city is home to several large farms, tourist attractions, and manufacturing companies. The population of Park City was 2,845 as of the 2010 census, and the city is served by the Sequatchie County School System. Park City is a beautiful city with a rich history and a bright future.
Common Questions
What is the Total Population of Park City?
Total Population of Park City is 3,471.
What is the Total Male Population of Park City?
Total Male Population of Park City is 1,699.
What is the Total Female Population of Park City?
Total Female Population of Park City is 1,772.
What is the Ratio of Males per 100 Females in Park City?
There are 95.88 Males per 100 Females in Park City.
What is the Ratio of Females per 100 Males in Park City?
There are 104.30 Females per 100 Males in Park City.
What is the Median Population Age in Park City?
Median Population Age in Park City is 41.4 Years.
What is the Average Family Size in Park City
Average Family Size in Park City is 3.1 People.
What is the Average Household Size in Park City
Average Household Size in Park City is 2.7 People.
What is Per Capita Income in Park City?
Per Capita income in Park City is $32,650.
What is the Median Family Income in Park City?
Median Family Income in Park City is $95,359.
What is the Median Household income in Park City?
Median Household Income in Park City is $82,736.
What is Income or Wage Gap in Park City?
Income or Wage Gap in Park City is 32.8%.
Women in Park City earn 67.2 cents for every dollar earned by a man.
What is Inequality or Gini Index in Park City?
Inequality or Gini Index in Park City is 0.32.
How Large is the Labor Force in Park City?
There are 2,027 People in the Labor Forcein in Park City.
What is the Percentage of People in the Labor Force in Park City?
73.7% of People are in the Labor Force in Park City.
What is the Unemployment Rate in Park City?
Unemployment Rate in Park City is 3.7%.