Viola, TN
Viola Map
Viola Overview
105
TOTAL POPULATION
47
MALE POPULATION
58
FEMALE POPULATION
81.03
MALES / 100 FEMALES
123.40
FEMALES / 100 MALES
70.1
MEDIAN AGE
2.5
AVG FAMILY SIZE
2.2
AVG HOUSEHOLD SIZE
$21,153
PER CAPITA INCOME
$45,875
AVG FAMILY INCOME
$44,688
AVG HOUSEHOLD INCOME
10.1%
WAGE / INCOME GAP [ % ]
89.9¢/ $1
WAGE / INCOME GAP [ $ ]
0.31
INEQUALITY / GINI INDEX
29
LABOR FORCE [ PEOPLE ]
33.7%
PERCENT IN LABOR FORCE
6.9%
UNEMPLOYMENT RATE
Viola Zip Codes
Viola Area Codes
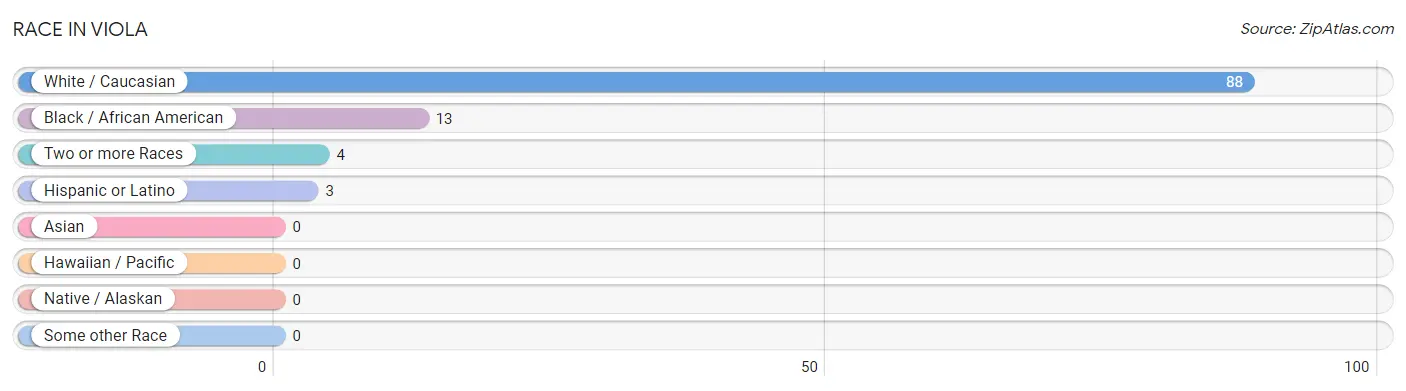
Race in Viola
The most populous races in Viola are White / Caucasian (88 | 83.8%), Black / African American (13 | 12.4%), and Two or more Races (4 | 3.8%).
| Race | # Population | % Population |
| Asian | 0 | 0.0% |
| Black / African American | 13 | 12.4% |
| Hawaiian / Pacific | 0 | 0.0% |
| Hispanic or Latino | 3 | 2.9% |
| Native / Alaskan | 0 | 0.0% |
| White / Caucasian | 88 | 83.8% |
| Two or more Races | 4 | 3.8% |
| Some other Race | 0 | 0.0% |
| Total | 105 | 100.0% |
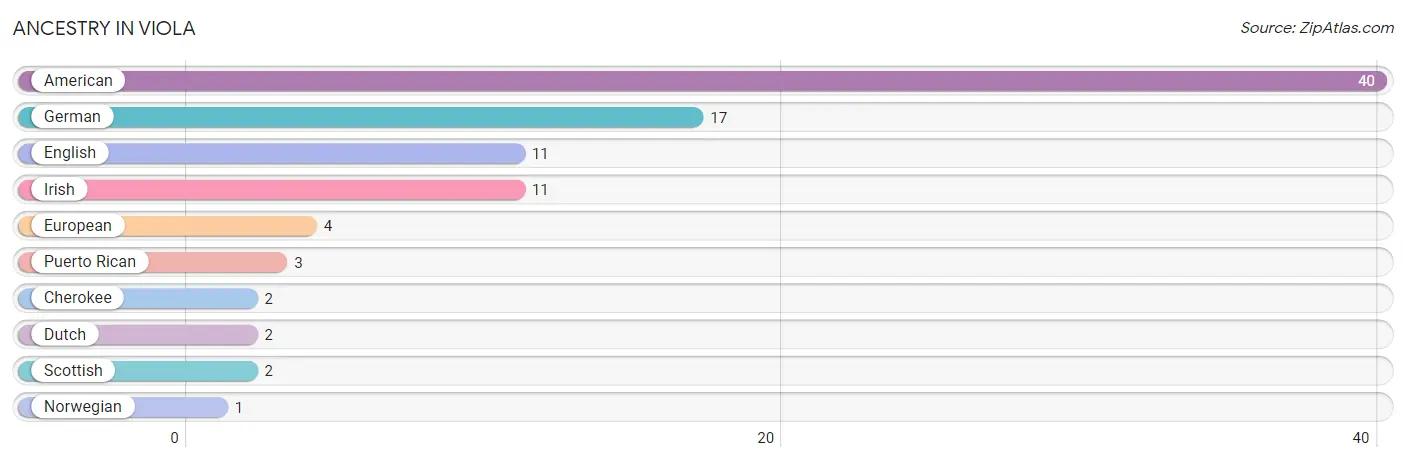
Ancestry in Viola
The most populous ancestries reported in Viola are American (40 | 38.1%), German (17 | 16.2%), English (11 | 10.5%), Irish (11 | 10.5%), and European (4 | 3.8%), together accounting for 79.1% of all Viola residents.
| Ancestry | # Population | % Population |
| American | 40 | 38.1% |
| Cherokee | 2 | 1.9% |
| Dutch | 2 | 1.9% |
| English | 11 | 10.5% |
| European | 4 | 3.8% |
| German | 17 | 16.2% |
| Irish | 11 | 10.5% |
| Norwegian | 1 | 0.9% |
| Puerto Rican | 3 | 2.9% |
| Scottish | 2 | 1.9% | View All 10 Rows |
Immigrants in Viola

| Immigration Origin | # Population | % Population | View All 0 Rows |
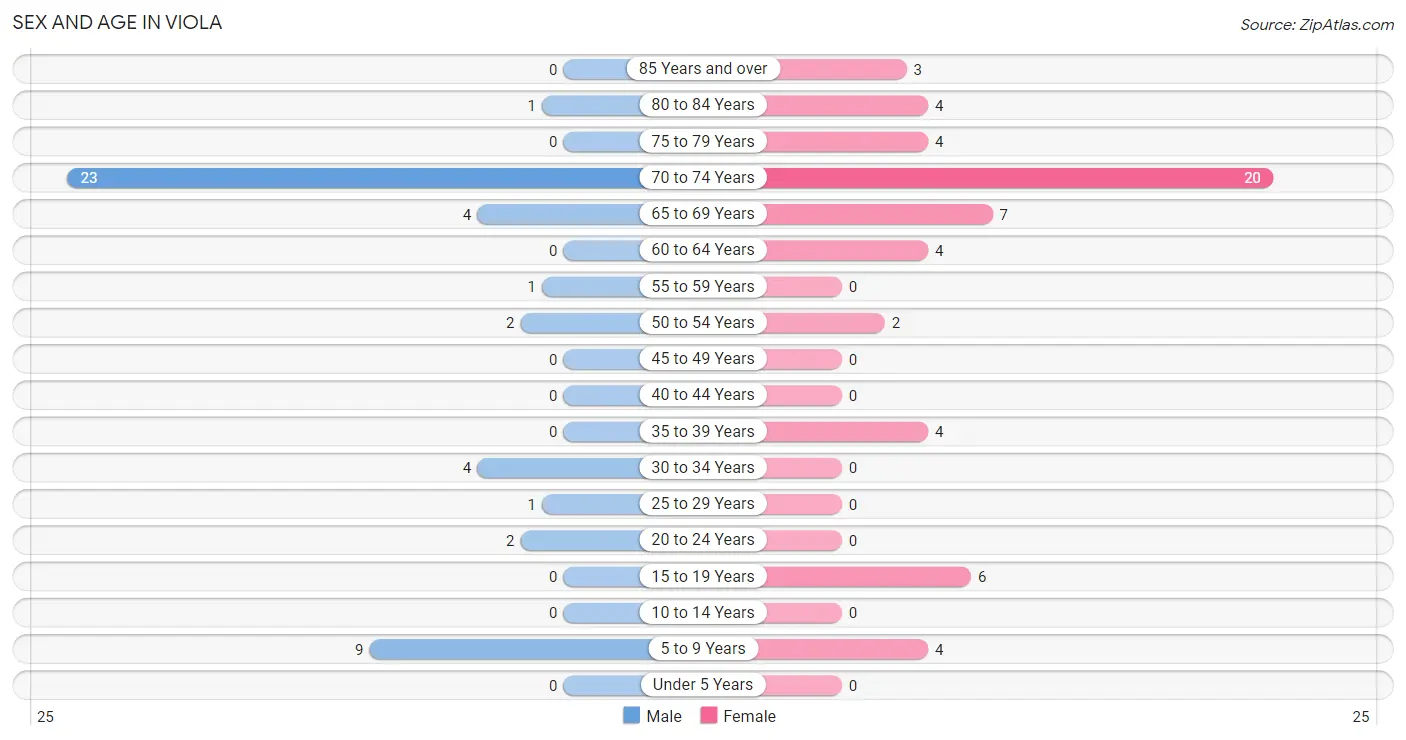
Sex and Age in Viola
Sex and Age in Viola
The most populous age groups in Viola are 70 to 74 Years (23 | 48.9%) for men and 70 to 74 Years (20 | 34.5%) for women.
| Age Bracket | Male | Female |
| Under 5 Years | 0 (0.0%) | 0 (0.0%) |
| 5 to 9 Years | 9 (19.2%) | 4 (6.9%) |
| 10 to 14 Years | 0 (0.0%) | 0 (0.0%) |
| 15 to 19 Years | 0 (0.0%) | 6 (10.3%) |
| 20 to 24 Years | 2 (4.3%) | 0 (0.0%) |
| 25 to 29 Years | 1 (2.1%) | 0 (0.0%) |
| 30 to 34 Years | 4 (8.5%) | 0 (0.0%) |
| 35 to 39 Years | 0 (0.0%) | 4 (6.9%) |
| 40 to 44 Years | 0 (0.0%) | 0 (0.0%) |
| 45 to 49 Years | 0 (0.0%) | 0 (0.0%) |
| 50 to 54 Years | 2 (4.3%) | 2 (3.5%) |
| 55 to 59 Years | 1 (2.1%) | 0 (0.0%) |
| 60 to 64 Years | 0 (0.0%) | 4 (6.9%) |
| 65 to 69 Years | 4 (8.5%) | 7 (12.1%) |
| 70 to 74 Years | 23 (48.9%) | 20 (34.5%) |
| 75 to 79 Years | 0 (0.0%) | 4 (6.9%) |
| 80 to 84 Years | 1 (2.1%) | 4 (6.9%) |
| 85 Years and over | 0 (0.0%) | 3 (5.2%) |
| Total | 47 (100.0%) | 58 (100.0%) |
Families and Households in Viola
Median Family Size in Viola
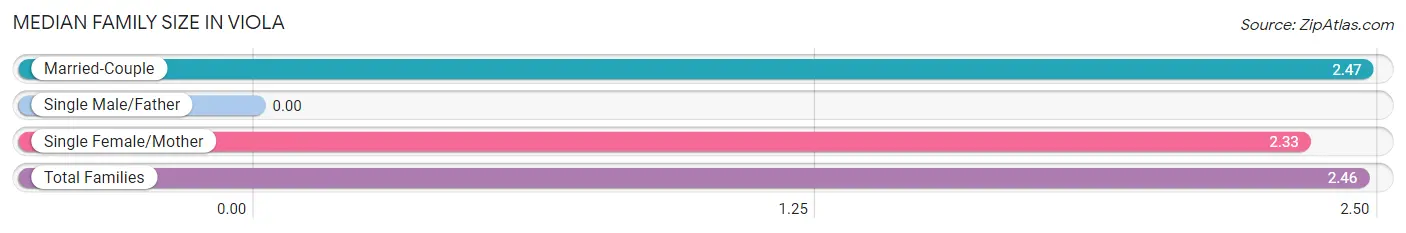
| Family Type | # Families | Family Size |
| Married-Couple | 36 (92.3%) | 2.47 |
| Single Male/Father | 0 (0.0%) | - |
| Single Female/Mother | 3 (7.7%) | 2.33 |
| Total Families | 39 (100.0%) | 2.46 |
Median Household Size in Viola
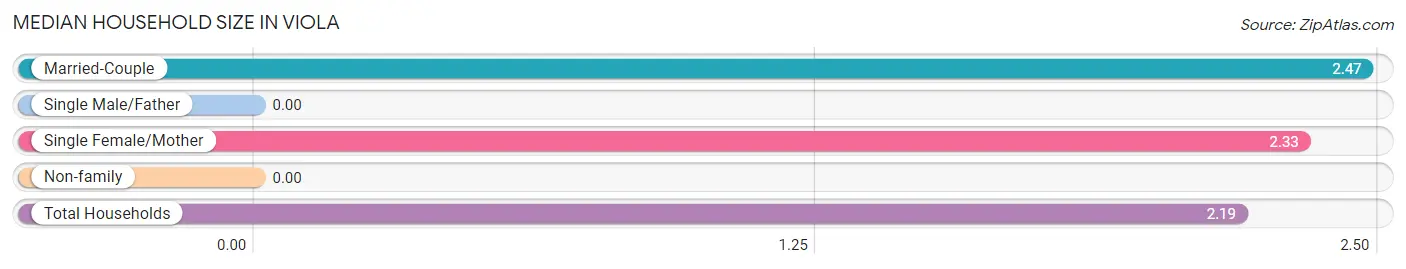
| Household Type | # Households | Household Size |
| Married-Couple | 36 (75.0%) | 2.47 |
| Single Male/Father | 0 (0.0%) | - |
| Single Female/Mother | 3 (6.2%) | 2.33 |
| Non-family | 9 (18.8%) | - |
| Total Households | 48 (100.0%) | 2.19 |
Household Size by Marriage Status in Viola
Out of a total of 48 households in Viola, 39 (81.2%) are family households, while 9 (18.8%) are nonfamily households. The most numerous type of family households are 2-person households, comprising 32, and the most common type of nonfamily households are 1-person households, comprising 9.
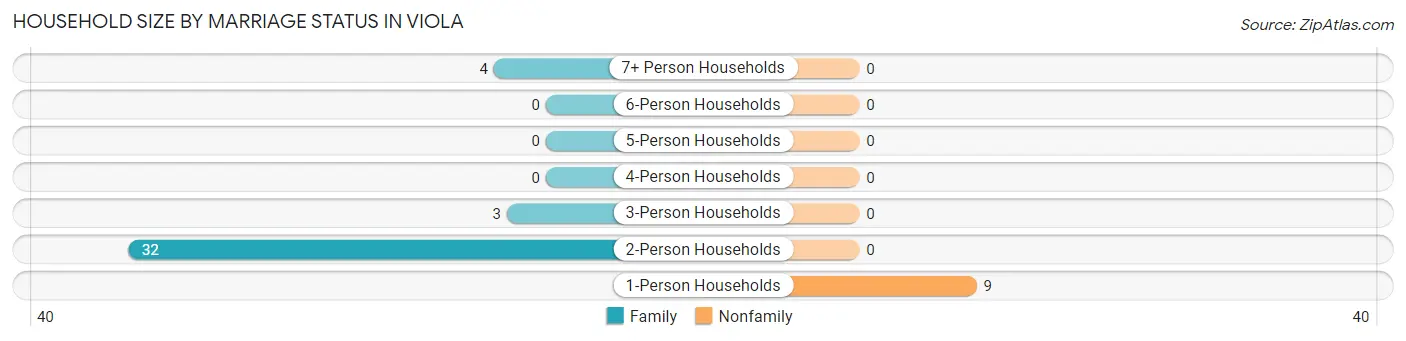
| Household Size | Family Households | Nonfamily Households |
| 1-Person Households | - | 9 (18.8%) |
| 2-Person Households | 32 (66.7%) | 0 (0.0%) |
| 3-Person Households | 3 (6.2%) | 0 (0.0%) |
| 4-Person Households | 0 (0.0%) | 0 (0.0%) |
| 5-Person Households | 0 (0.0%) | 0 (0.0%) |
| 6-Person Households | 0 (0.0%) | 0 (0.0%) |
| 7+ Person Households | 4 (8.3%) | 0 (0.0%) |
| Total | 39 (81.2%) | 9 (18.8%) |
Female Fertility in Viola
Fertility by Age in Viola
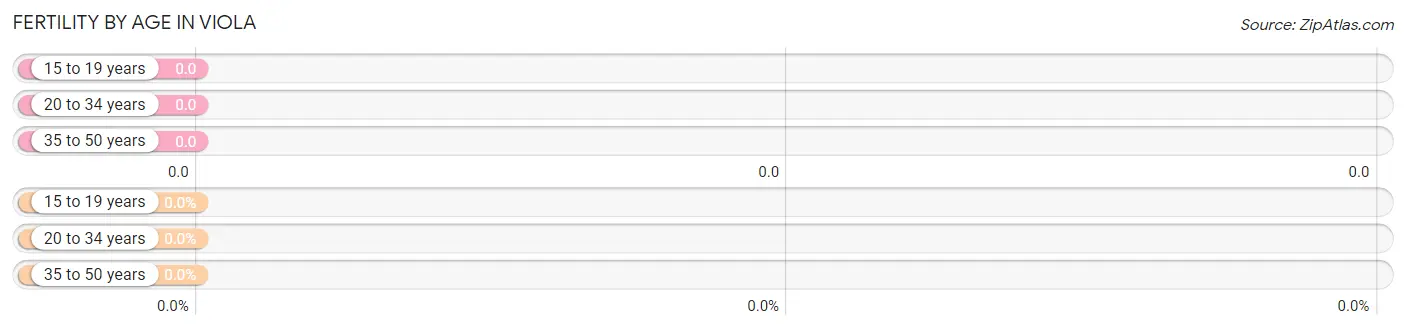
| Age Bracket | Women with Births | Births / 1,000 Women |
| 15 to 19 years | 0 (0.0%) | 0.0 |
| 20 to 34 years | 0 (0.0%) | 0.0 |
| 35 to 50 years | 0 (0.0%) | 0.0 |
| Total | 0 (0.0%) | 0.0 |
Fertility by Age by Marriage Status in Viola
| Age Bracket | Married | Unmarried |
| 15 to 19 years | 0 (0.0%) | 0 (0.0%) |
| 20 to 34 years | 0 (0.0%) | 0 (0.0%) |
| 35 to 50 years | 0 (0.0%) | 0 (0.0%) |
| Total | 0 (0.0%) | 0 (0.0%) |
Fertility by Education in Viola
| Educational Attainment | Women with Births | Births / 1,000 Women |
| Less than High School | 0 (0.0%) | 0.0 |
| High School Diploma | 0 (0.0%) | 0.0 |
| College or Associate's Degree | 0 (0.0%) | 0.0 |
| Bachelor's Degree | 0 (0.0%) | 0.0 |
| Graduate Degree | 0 (0.0%) | 0.0 |
| Total | 0 (0.0%) | 0.0 |
Fertility by Education by Marriage Status in Viola
| Educational Attainment | Married | Unmarried |
| Less than High School | 0 (0.0%) | 0 (0.0%) |
| High School Diploma | 0 (0.0%) | 0 (0.0%) |
| College or Associate's Degree | 0 (0.0%) | 0 (0.0%) |
| Bachelor's Degree | 0 (0.0%) | 0 (0.0%) |
| Graduate Degree | 0 (0.0%) | 0 (0.0%) |
| Total | 0 (0.0%) | 0 (0.0%) |
Income in Viola
Income Overview in Viola
Per Capita Income in Viola is $21,153, while median incomes of families and households are $45,875 and $44,688 respectively.
| Characteristic | Number | Measure |
| Per Capita Income | 105 | $21,153 |
| Median Family Income | 39 | $45,875 |
| Mean Family Income | 39 | $52,956 |
| Median Household Income | 48 | $44,688 |
| Mean Household Income | 48 | $46,385 |
| Income Deficit | 39 | $0 |
| Wage / Income Gap (%) | 105 | 10.05% |
| Wage / Income Gap ($) | 105 | 89.95¢ per $1 |
| Gini / Inequality Index | 105 | 0.31 |
Earnings by Sex in Viola
Average Earnings in Viola are $23,625, $21,250 for men and $23,625 for women, a difference of 10.1%.
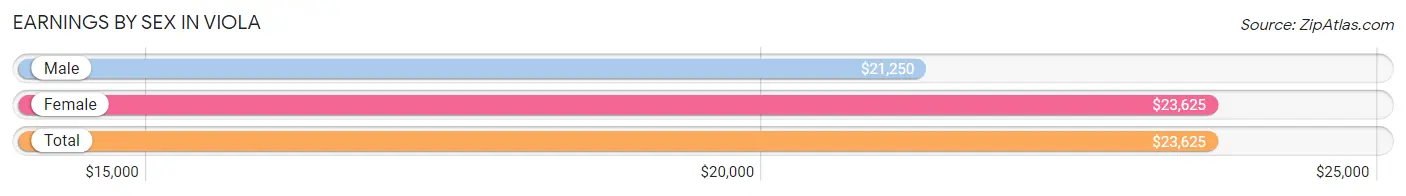
| Sex | Number | Average Earnings |
| Male | 12 (44.4%) | $21,250 |
| Female | 15 (55.6%) | $23,625 |
| Total | 27 (100.0%) | $23,625 |
Earnings by Sex by Income Bracket in Viola
The most common earnings brackets in Viola are $15,000 to $17,499 for men (4 | 33.3%) and $22,500 to $24,999 for women (10 | 66.7%).
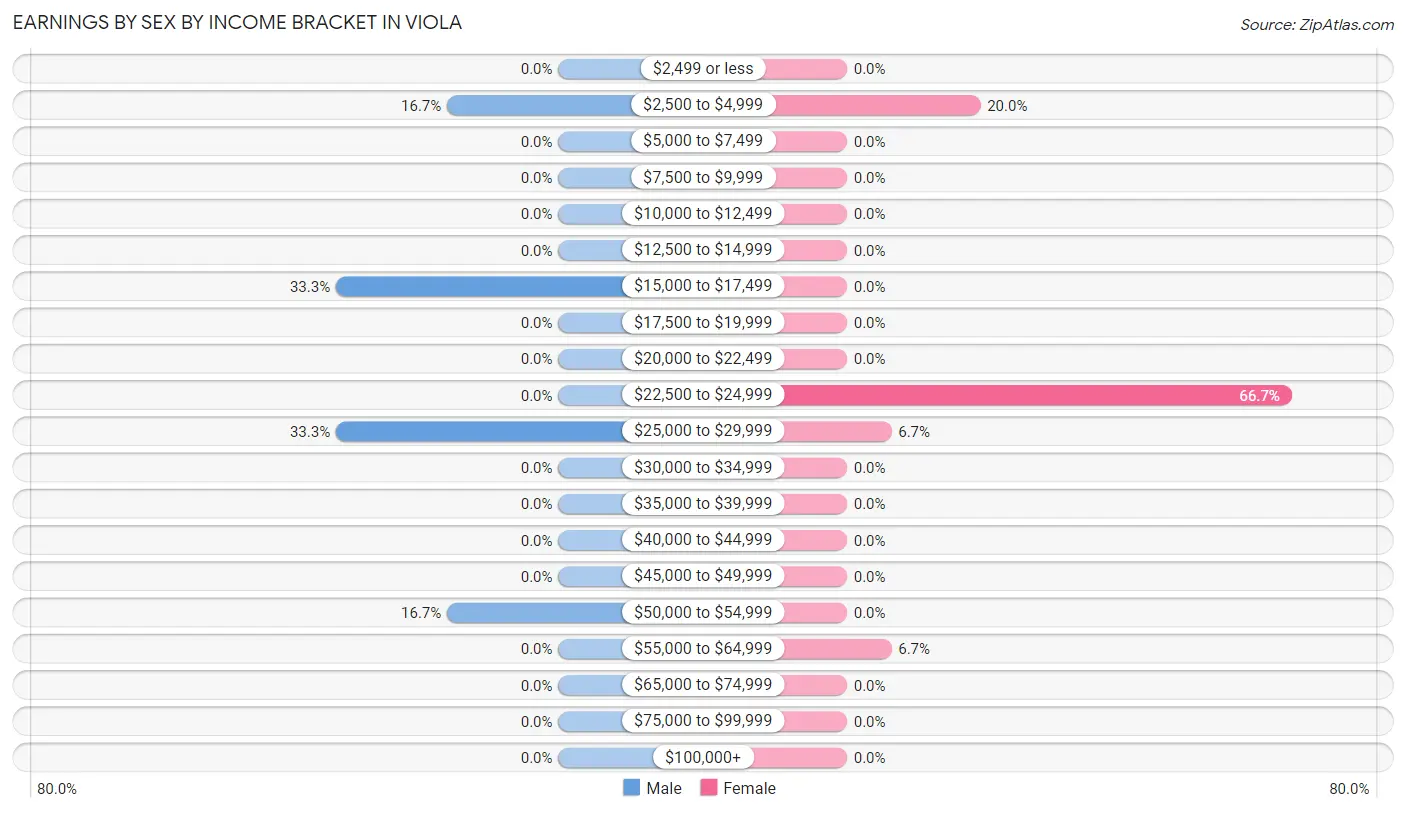
| Income | Male | Female |
| $2,499 or less | 0 (0.0%) | 0 (0.0%) |
| $2,500 to $4,999 | 2 (16.7%) | 3 (20.0%) |
| $5,000 to $7,499 | 0 (0.0%) | 0 (0.0%) |
| $7,500 to $9,999 | 0 (0.0%) | 0 (0.0%) |
| $10,000 to $12,499 | 0 (0.0%) | 0 (0.0%) |
| $12,500 to $14,999 | 0 (0.0%) | 0 (0.0%) |
| $15,000 to $17,499 | 4 (33.3%) | 0 (0.0%) |
| $17,500 to $19,999 | 0 (0.0%) | 0 (0.0%) |
| $20,000 to $22,499 | 0 (0.0%) | 0 (0.0%) |
| $22,500 to $24,999 | 0 (0.0%) | 10 (66.7%) |
| $25,000 to $29,999 | 4 (33.3%) | 1 (6.7%) |
| $30,000 to $34,999 | 0 (0.0%) | 0 (0.0%) |
| $35,000 to $39,999 | 0 (0.0%) | 0 (0.0%) |
| $40,000 to $44,999 | 0 (0.0%) | 0 (0.0%) |
| $45,000 to $49,999 | 0 (0.0%) | 0 (0.0%) |
| $50,000 to $54,999 | 2 (16.7%) | 0 (0.0%) |
| $55,000 to $64,999 | 0 (0.0%) | 1 (6.7%) |
| $65,000 to $74,999 | 0 (0.0%) | 0 (0.0%) |
| $75,000 to $99,999 | 0 (0.0%) | 0 (0.0%) |
| $100,000+ | 0 (0.0%) | 0 (0.0%) |
| Total | 12 (100.0%) | 15 (100.0%) |
Earnings by Sex by Educational Attainment in Viola
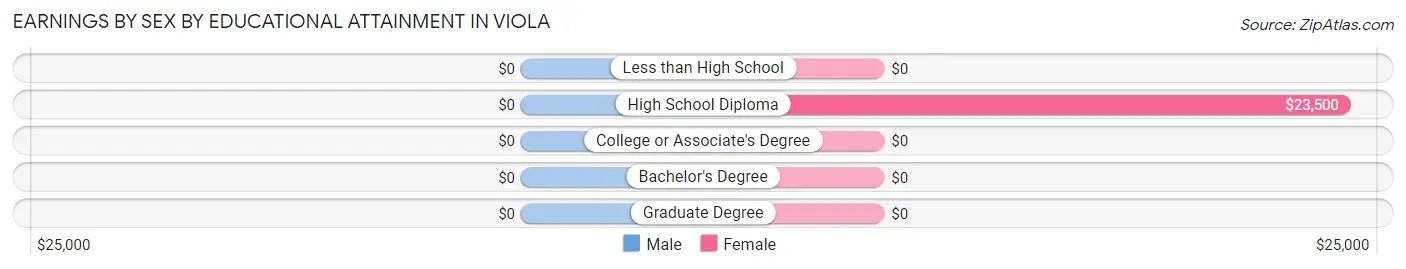
| Educational Attainment | Male Income | Female Income |
| Less than High School | - | - |
| High School Diploma | - | - |
| College or Associate's Degree | - | - |
| Bachelor's Degree | - | - |
| Graduate Degree | - | - |
| Total | $25,625 | $23,625 |
Family Income in Viola
Family Income Brackets in Viola
According to the Viola family income data, there are 22 families falling into the $35,000 to $49,999 income range, which is the most common income bracket and makes up 56.4% of all families.
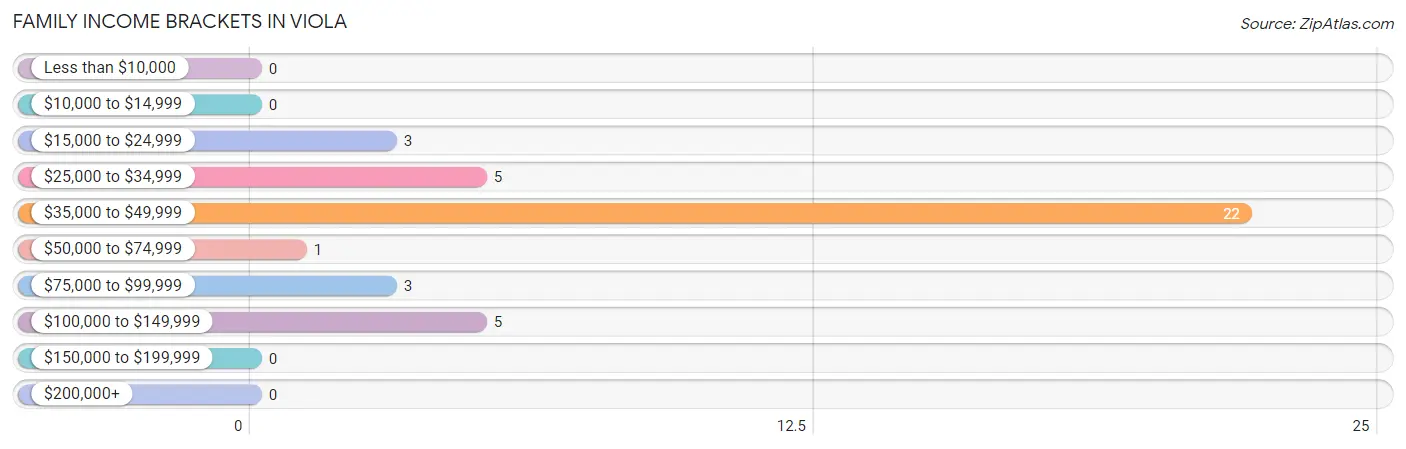
| Income Bracket | # Families | % Families |
| Less than $10,000 | 0 | 0.0% |
| $10,000 to $14,999 | 0 | 0.0% |
| $15,000 to $24,999 | 3 | 7.7% |
| $25,000 to $34,999 | 5 | 12.8% |
| $35,000 to $49,999 | 22 | 56.4% |
| $50,000 to $74,999 | 1 | 2.6% |
| $75,000 to $99,999 | 3 | 7.7% |
| $100,000 to $149,999 | 5 | 12.8% |
| $150,000 to $199,999 | 0 | 0.0% |
| $200,000+ | 0 | 0.0% |
Family Income by Famaliy Size in Viola
2-person families (32 | 82.1%) account for the highest median family income in Viola with $46,250 per family, while 2-person families (32 | 82.1%) have the highest median income of $23,125 per family member.
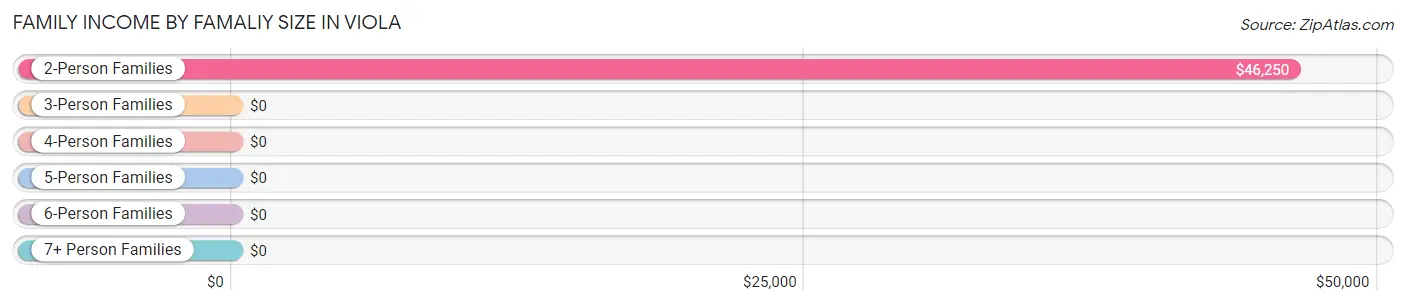
| Income Bracket | # Families | Median Income |
| 2-Person Families | 32 (82.1%) | $46,250 |
| 3-Person Families | 3 (7.7%) | $0 |
| 4-Person Families | 0 (0.0%) | $0 |
| 5-Person Families | 0 (0.0%) | $0 |
| 6-Person Families | 0 (0.0%) | $0 |
| 7+ Person Families | 4 (10.3%) | $0 |
| Total | 39 (100.0%) | $45,875 |
Family Income by Number of Earners in Viola
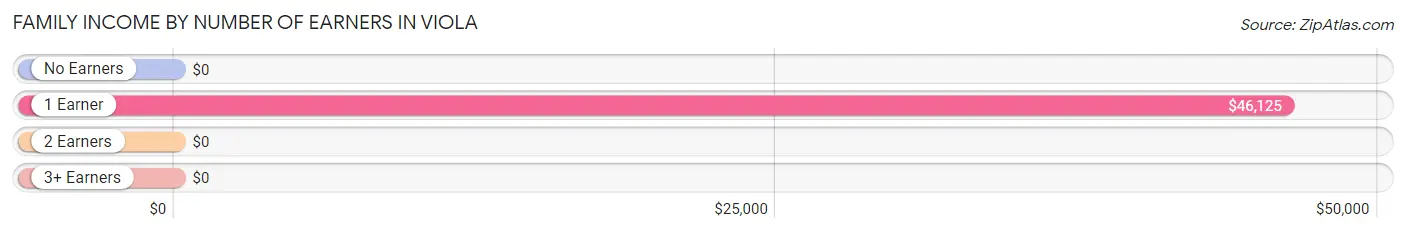
| Number of Earners | # Families | Median Income |
| No Earners | 19 (48.7%) | $0 |
| 1 Earner | 19 (48.7%) | $46,125 |
| 2 Earners | 1 (2.6%) | $0 |
| 3+ Earners | 0 (0.0%) | $0 |
| Total | 39 (100.0%) | $45,875 |
Household Income in Viola
Household Income Brackets in Viola
With 22 households falling in the category, the $35,000 to $49,999 income range is the most frequent in Viola, accounting for 45.8% of all households.
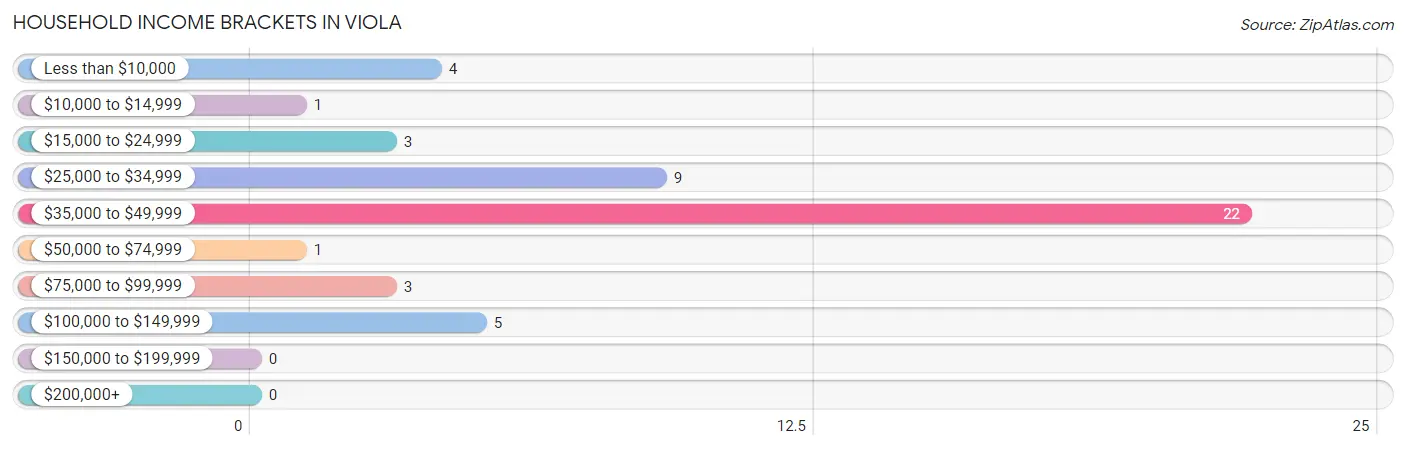
| Income Bracket | # Households | % Households |
| Less than $10,000 | 4 | 8.3% |
| $10,000 to $14,999 | 1 | 2.1% |
| $15,000 to $24,999 | 3 | 6.3% |
| $25,000 to $34,999 | 9 | 18.8% |
| $35,000 to $49,999 | 22 | 45.8% |
| $50,000 to $74,999 | 1 | 2.1% |
| $75,000 to $99,999 | 3 | 6.3% |
| $100,000 to $149,999 | 5 | 10.4% |
| $150,000 to $199,999 | 0 | 0.0% |
| $200,000+ | 0 | 0.0% |
Household Income by Householder Age in Viola
The median household income in Viola is $44,688, with the highest median household income of $45,500 found in the 65+ years age bracket for the primary householder. A total of 38 households (79.2%) fall into this category.
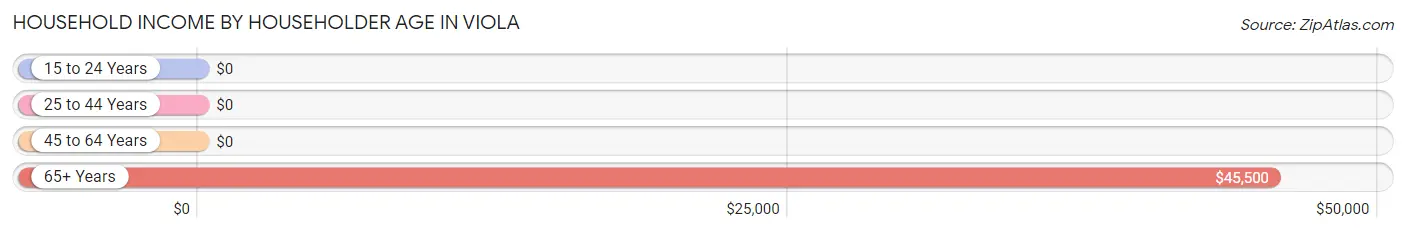
| Income Bracket | # Households | Median Income |
| 15 to 24 Years | 0 (0.0%) | $0 |
| 25 to 44 Years | 4 (8.3%) | $0 |
| 45 to 64 Years | 6 (12.5%) | $0 |
| 65+ Years | 38 (79.2%) | $45,500 |
| Total | 48 (100.0%) | $44,688 |
Poverty in Viola
Income Below Poverty by Sex and Age in Viola
With 25.5% poverty level for males and 32.8% for females among the residents of Viola, 5 year old males and 6 to 11 year old females are the most vulnerable to poverty, with 4 males (100.0%) and 4 females (100.0%) in their respective age groups living below the poverty level.
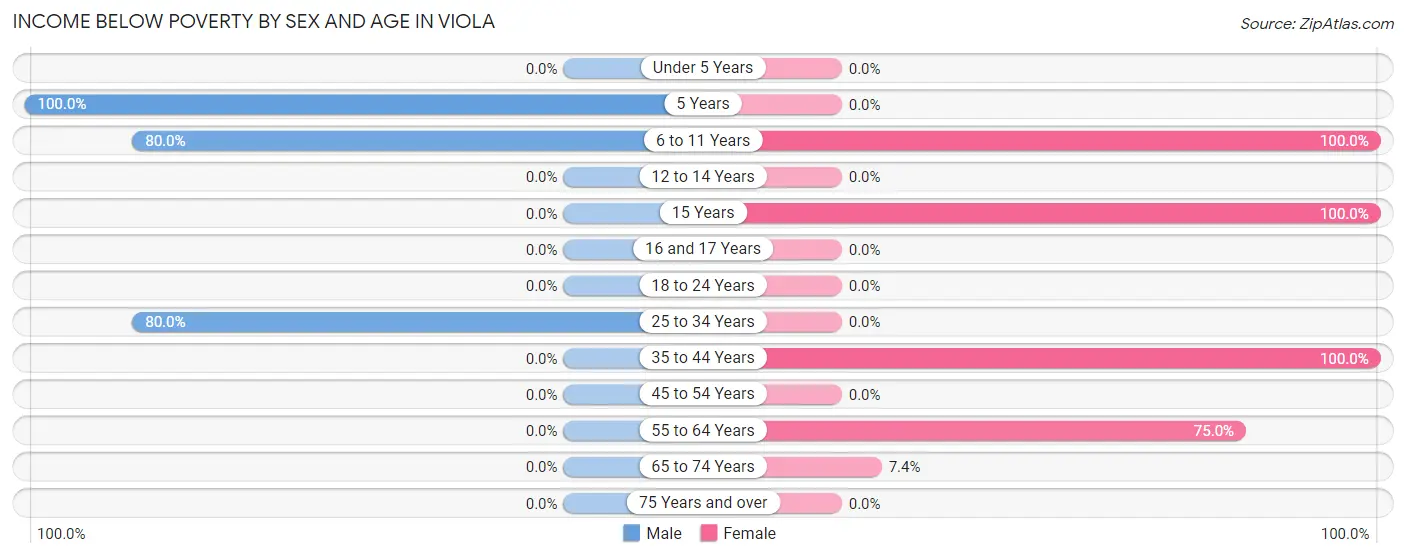
| Age Bracket | Male | Female |
| Under 5 Years | 0 (0.0%) | 0 (0.0%) |
| 5 Years | 4 (100.0%) | 0 (0.0%) |
| 6 to 11 Years | 4 (80.0%) | 4 (100.0%) |
| 12 to 14 Years | 0 (0.0%) | 0 (0.0%) |
| 15 Years | 0 (0.0%) | 6 (100.0%) |
| 16 and 17 Years | 0 (0.0%) | 0 (0.0%) |
| 18 to 24 Years | 0 (0.0%) | 0 (0.0%) |
| 25 to 34 Years | 4 (80.0%) | 0 (0.0%) |
| 35 to 44 Years | 0 (0.0%) | 4 (100.0%) |
| 45 to 54 Years | 0 (0.0%) | 0 (0.0%) |
| 55 to 64 Years | 0 (0.0%) | 3 (75.0%) |
| 65 to 74 Years | 0 (0.0%) | 2 (7.4%) |
| 75 Years and over | 0 (0.0%) | 0 (0.0%) |
| Total | 12 (25.5%) | 19 (32.8%) |
Income Above Poverty by Sex and Age in Viola
According to the poverty statistics in Viola, males aged 18 to 24 years and females aged 45 to 54 years are the age groups that are most secure financially, with 100.0% of males and 100.0% of females in these age groups living above the poverty line.
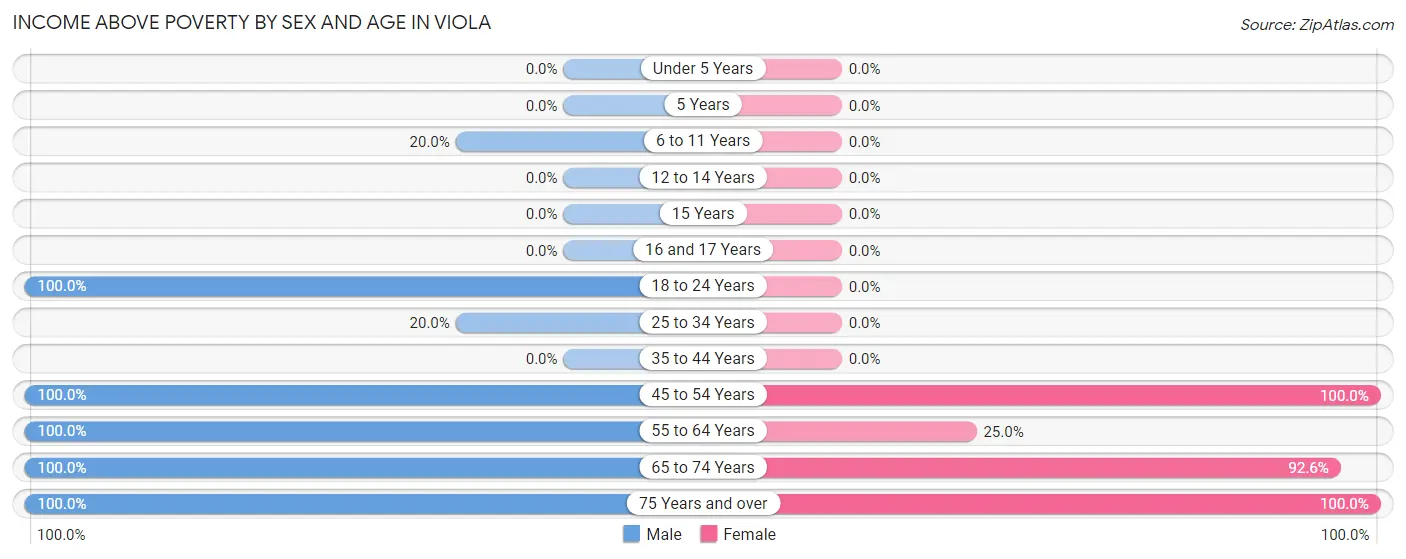
| Age Bracket | Male | Female |
| Under 5 Years | 0 (0.0%) | 0 (0.0%) |
| 5 Years | 0 (0.0%) | 0 (0.0%) |
| 6 to 11 Years | 1 (20.0%) | 0 (0.0%) |
| 12 to 14 Years | 0 (0.0%) | 0 (0.0%) |
| 15 Years | 0 (0.0%) | 0 (0.0%) |
| 16 and 17 Years | 0 (0.0%) | 0 (0.0%) |
| 18 to 24 Years | 2 (100.0%) | 0 (0.0%) |
| 25 to 34 Years | 1 (20.0%) | 0 (0.0%) |
| 35 to 44 Years | 0 (0.0%) | 0 (0.0%) |
| 45 to 54 Years | 2 (100.0%) | 2 (100.0%) |
| 55 to 64 Years | 1 (100.0%) | 1 (25.0%) |
| 65 to 74 Years | 27 (100.0%) | 25 (92.6%) |
| 75 Years and over | 1 (100.0%) | 11 (100.0%) |
| Total | 35 (74.5%) | 39 (67.2%) |
Income Below Poverty Among Married-Couple Families in Viola
The poverty statistics for married-couple families in Viola show that 11.1% or 4 of the total 36 families live below the poverty line. Families with 5 or more children have the highest poverty rate of 100.0%, comprising of 4 families. On the other hand, families with no children have the lowest poverty rate of 0.0%, which includes 0 families.
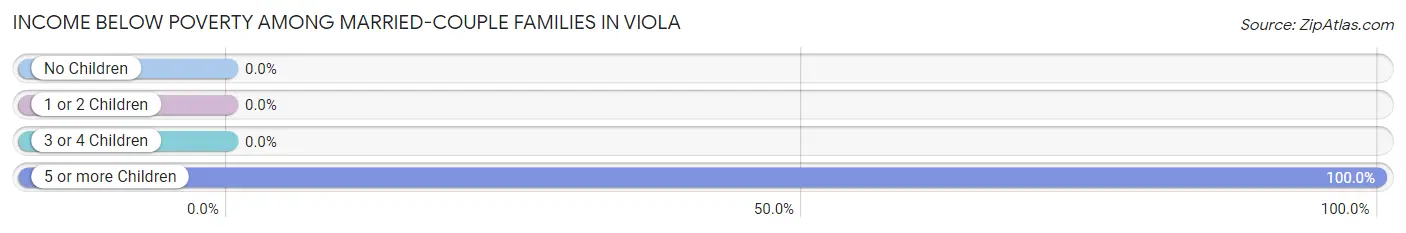
| Children | Above Poverty | Below Poverty |
| No Children | 31 (100.0%) | 0 (0.0%) |
| 1 or 2 Children | 1 (100.0%) | 0 (0.0%) |
| 3 or 4 Children | 0 (0.0%) | 0 (0.0%) |
| 5 or more Children | 0 (0.0%) | 4 (100.0%) |
| Total | 32 (88.9%) | 4 (11.1%) |
Income Below Poverty Among Single-Parent Households in Viola
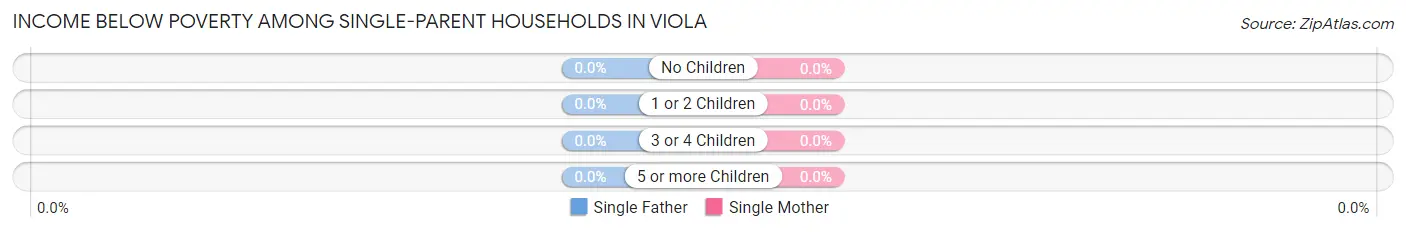
| Children | Single Father | Single Mother |
| No Children | 0 (0.0%) | 0 (0.0%) |
| 1 or 2 Children | 0 (0.0%) | 0 (0.0%) |
| 3 or 4 Children | 0 (0.0%) | 0 (0.0%) |
| 5 or more Children | 0 (0.0%) | 0 (0.0%) |
| Total | 0 (0.0%) | 0 (0.0%) |
Income Below Poverty Among Married-Couple vs Single-Parent Households in Viola
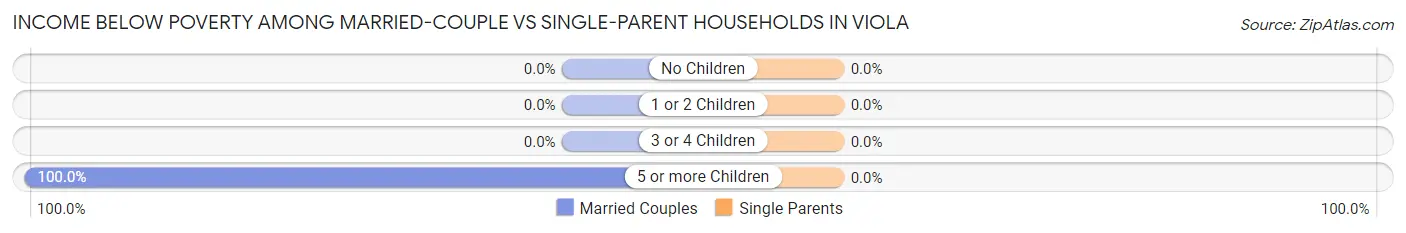
| Children | Married-Couple Families | Single-Parent Households |
| No Children | 0 (0.0%) | 0 (0.0%) |
| 1 or 2 Children | 0 (0.0%) | 0 (0.0%) |
| 3 or 4 Children | 0 (0.0%) | 0 (0.0%) |
| 5 or more Children | 4 (100.0%) | 0 (0.0%) |
| Total | 4 (11.1%) | 0 (0.0%) |
Employment Characteristics in Viola
Employment by Class of Employer in Viola
Among the 27 employed individuals in Viola, private company employees (19 | 70.4%), self-employed (not incorporated) (4 | 14.8%), and local government employees (3 | 11.1%) make up the most common classes of employment.
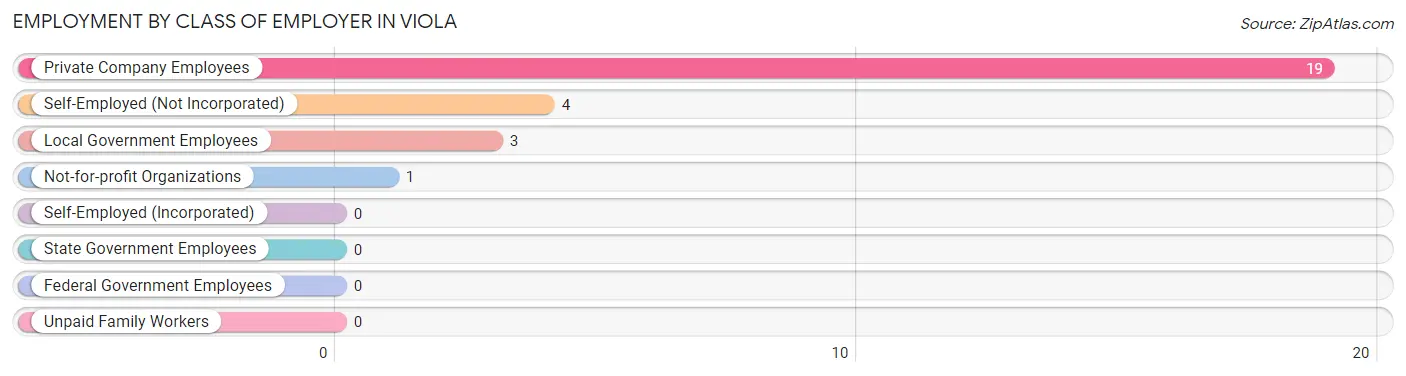
| Employer Class | # Employees | % Employees |
| Private Company Employees | 19 | 70.4% |
| Self-Employed (Incorporated) | 0 | 0.0% |
| Self-Employed (Not Incorporated) | 4 | 14.8% |
| Not-for-profit Organizations | 1 | 3.7% |
| Local Government Employees | 3 | 11.1% |
| State Government Employees | 0 | 0.0% |
| Federal Government Employees | 0 | 0.0% |
| Unpaid Family Workers | 0 | 0.0% |
| Total | 27 | 100.0% |
Employment Status by Age in Viola
According to the labor force statistics for Viola, out of the total population over 16 years of age (86), 33.7% or 29 individuals are in the labor force, with 6.9% or 2 of them unemployed. The age group with the highest labor force participation rate is 20 to 24 years, with 100.0% or 2 individuals in the labor force. Within the labor force, the 65 to 74 years age range has the highest percentage of unemployed individuals, with 11.8% or 2 of them being unemployed.
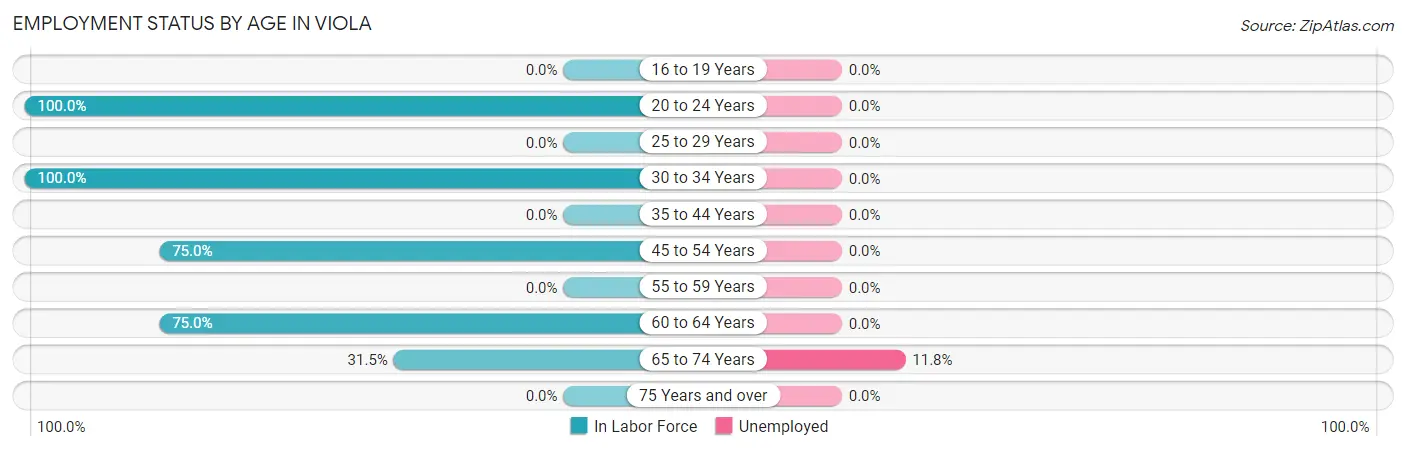
| Age Bracket | In Labor Force | Unemployed |
| 16 to 19 Years | 0 (0.0%) | 0 (0.0%) |
| 20 to 24 Years | 2 (100.0%) | 0 (0.0%) |
| 25 to 29 Years | 0 (0.0%) | 0 (0.0%) |
| 30 to 34 Years | 4 (100.0%) | 0 (0.0%) |
| 35 to 44 Years | 0 (0.0%) | 0 (0.0%) |
| 45 to 54 Years | 3 (75.0%) | 0 (0.0%) |
| 55 to 59 Years | 0 (0.0%) | 0 (0.0%) |
| 60 to 64 Years | 3 (75.0%) | 0 (0.0%) |
| 65 to 74 Years | 17 (31.5%) | 2 (11.8%) |
| 75 Years and over | 0 (0.0%) | 0 (0.0%) |
| Total | 29 (33.7%) | 2 (6.9%) |
Employment Status by Educational Attainment in Viola
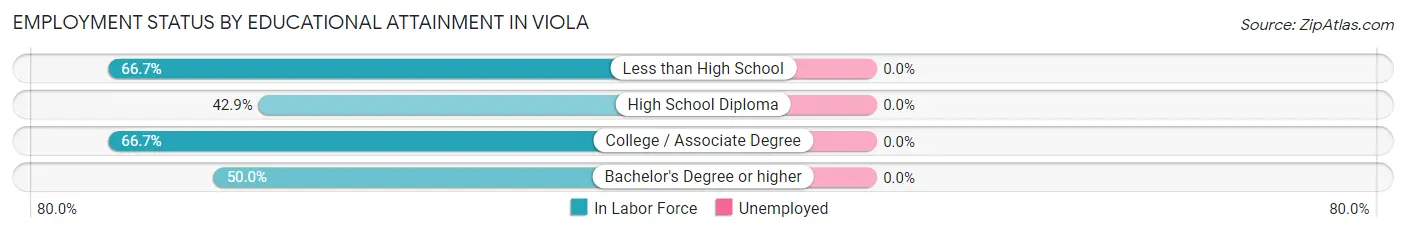
| Educational Attainment | In Labor Force | Unemployed |
| Less than High School | 4 (66.7%) | 0 (0.0%) |
| High School Diploma | 3 (42.9%) | 0 (0.0%) |
| College / Associate Degree | 2 (66.7%) | 0 (0.0%) |
| Bachelor's Degree or higher | 1 (50.0%) | 0 (0.0%) |
| Total | 10 (55.6%) | 0 (0.0%) |
Employment Occupations by Sex in Viola
Management, Business, Science and Arts Occupations
The most common Management, Business, Science and Arts occupations in Viola are Management (10 | 37.0%), Community & Social Service (1 | 3.7%), and Education Instruction & Library (1 | 3.7%).
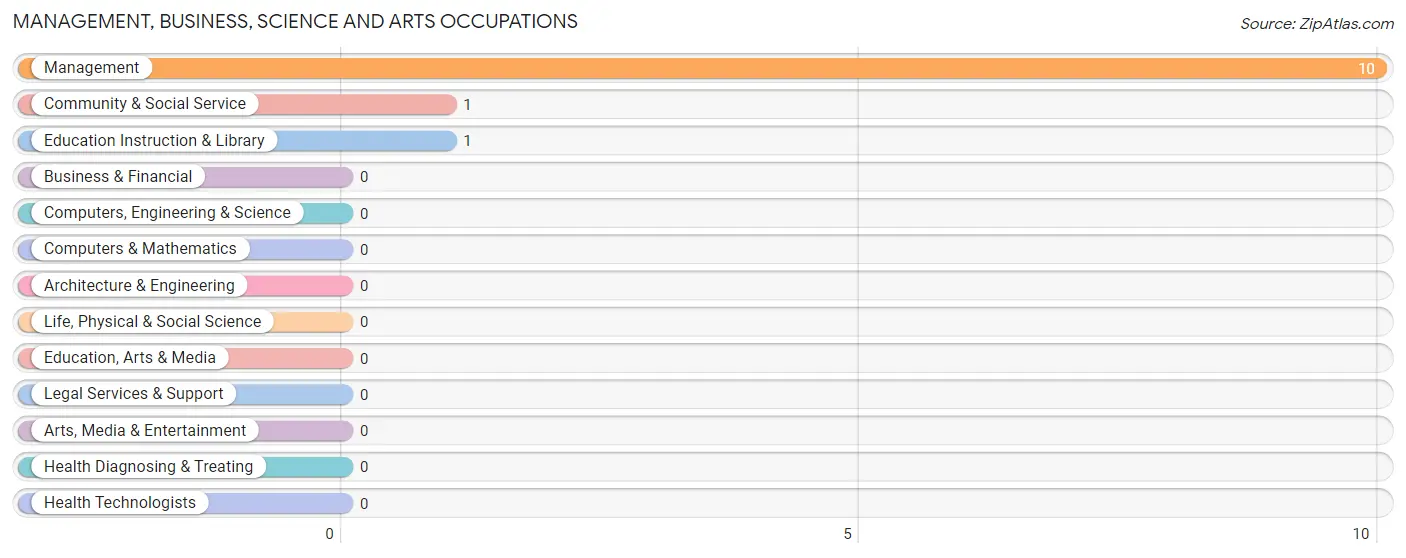
Management, Business, Science and Arts Occupations by Sex
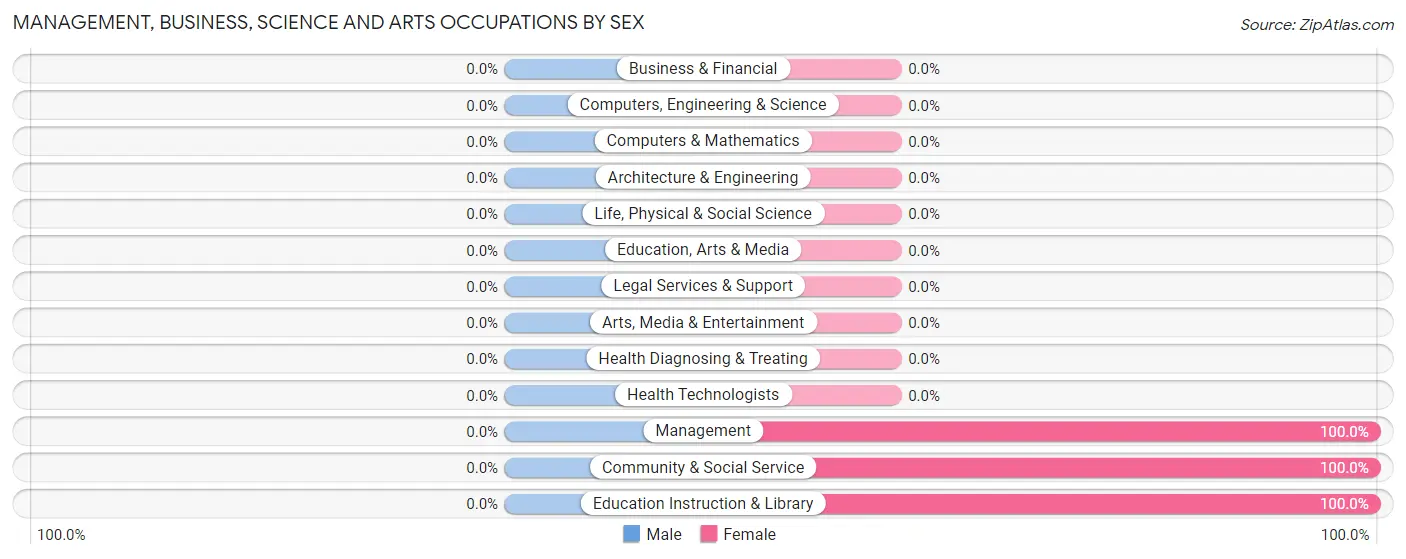
| Occupation | Male | Female |
| Management | 0 (0.0%) | 10 (100.0%) |
| Business & Financial | 0 (0.0%) | 0 (0.0%) |
| Computers, Engineering & Science | 0 (0.0%) | 0 (0.0%) |
| Computers & Mathematics | 0 (0.0%) | 0 (0.0%) |
| Architecture & Engineering | 0 (0.0%) | 0 (0.0%) |
| Life, Physical & Social Science | 0 (0.0%) | 0 (0.0%) |
| Community & Social Service | 0 (0.0%) | 1 (100.0%) |
| Education, Arts & Media | 0 (0.0%) | 0 (0.0%) |
| Legal Services & Support | 0 (0.0%) | 0 (0.0%) |
| Education Instruction & Library | 0 (0.0%) | 1 (100.0%) |
| Arts, Media & Entertainment | 0 (0.0%) | 0 (0.0%) |
| Health Diagnosing & Treating | 0 (0.0%) | 0 (0.0%) |
| Health Technologists | 0 (0.0%) | 0 (0.0%) |
| Total (Category) | 0 (0.0%) | 11 (100.0%) |
| Total (Overall) | 12 (44.4%) | 15 (55.6%) |
Services Occupations
The most common Services occupations in Viola are Security & Protection (2 | 7.4%), Firefighting & Prevention (2 | 7.4%), and Cleaning & Maintenance (1 | 3.7%).
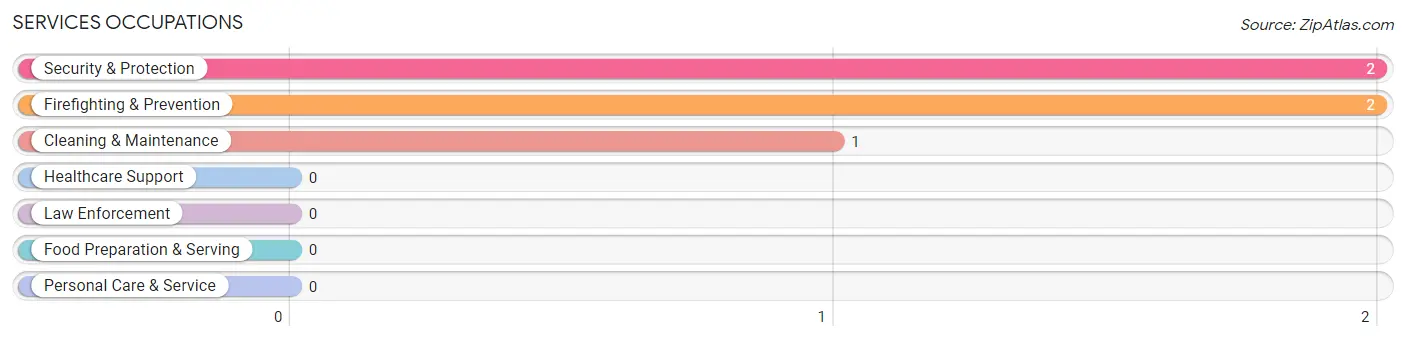
Services Occupations by Sex
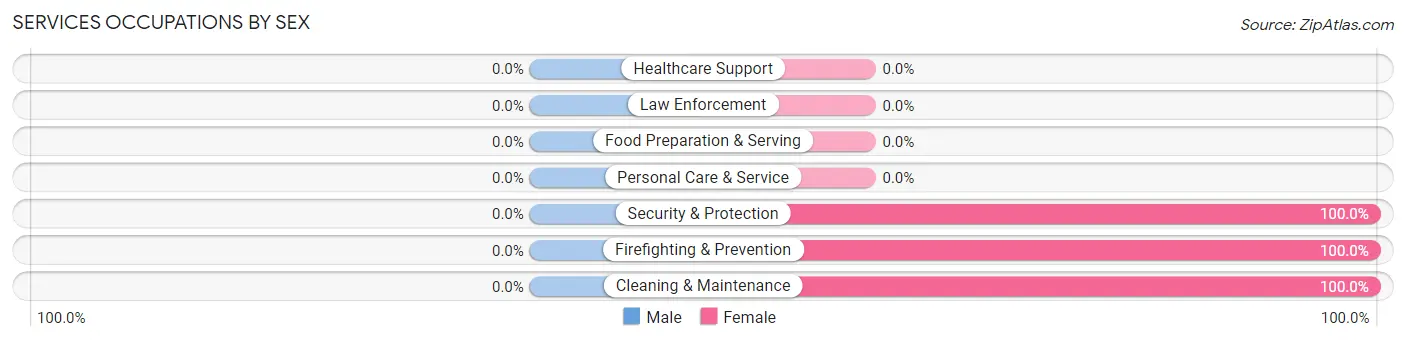
| Occupation | Male | Female |
| Healthcare Support | 0 (0.0%) | 0 (0.0%) |
| Security & Protection | 0 (0.0%) | 2 (100.0%) |
| Firefighting & Prevention | 0 (0.0%) | 2 (100.0%) |
| Law Enforcement | 0 (0.0%) | 0 (0.0%) |
| Food Preparation & Serving | 0 (0.0%) | 0 (0.0%) |
| Cleaning & Maintenance | 0 (0.0%) | 1 (100.0%) |
| Personal Care & Service | 0 (0.0%) | 0 (0.0%) |
| Total (Category) | 0 (0.0%) | 3 (100.0%) |
| Total (Overall) | 12 (44.4%) | 15 (55.6%) |
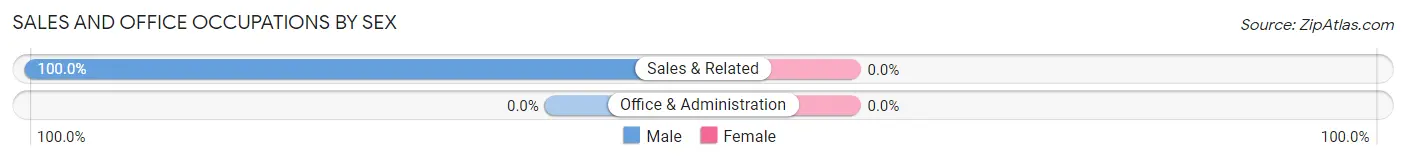
Sales and Office Occupations
The most common Sales and Office occupations in Viola are , and Sales & Related (2 | 7.4%).
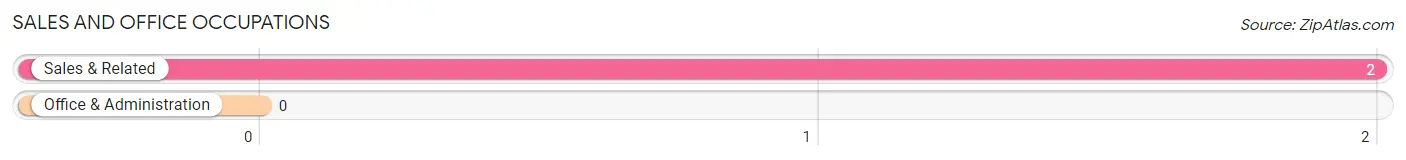
Sales and Office Occupations by Sex
| Occupation | Male | Female |
| Sales & Related | 2 (100.0%) | 0 (0.0%) |
| Office & Administration | 0 (0.0%) | 0 (0.0%) |
| Total (Category) | 2 (100.0%) | 0 (0.0%) |
| Total (Overall) | 12 (44.4%) | 15 (55.6%) |
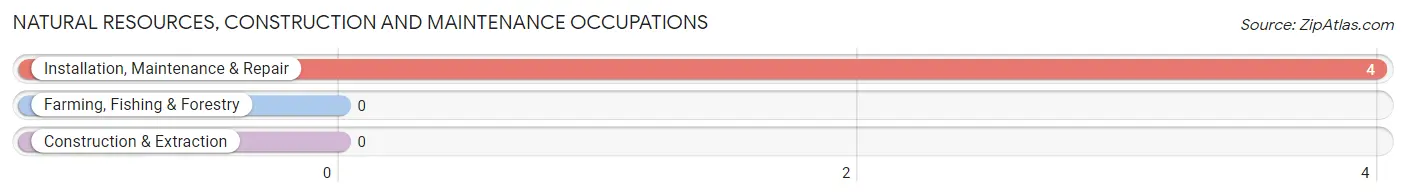
Natural Resources, Construction and Maintenance Occupations
The most common Natural Resources, Construction and Maintenance occupations in Viola are , and Installation, Maintenance & Repair (4 | 14.8%).
Natural Resources, Construction and Maintenance Occupations by Sex
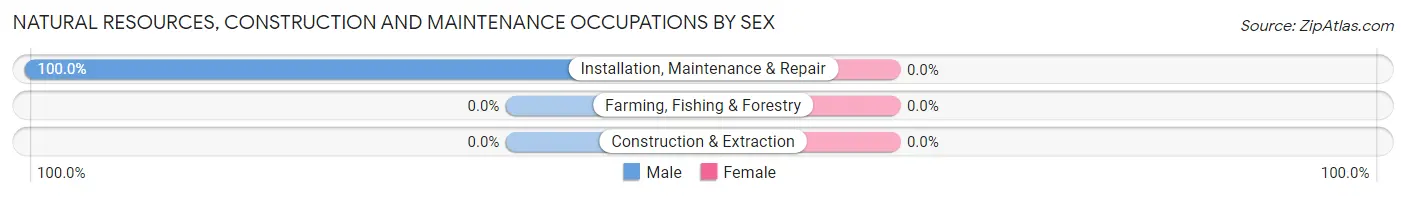
| Occupation | Male | Female |
| Farming, Fishing & Forestry | 0 (0.0%) | 0 (0.0%) |
| Construction & Extraction | 0 (0.0%) | 0 (0.0%) |
| Installation, Maintenance & Repair | 4 (100.0%) | 0 (0.0%) |
| Total (Category) | 4 (100.0%) | 0 (0.0%) |
| Total (Overall) | 12 (44.4%) | 15 (55.6%) |
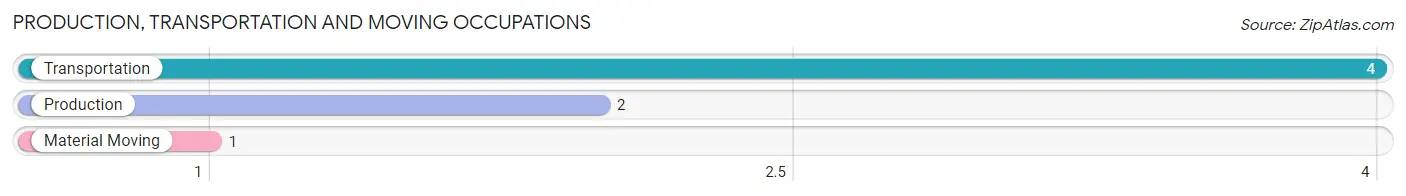
Production, Transportation and Moving Occupations
The most common Production, Transportation and Moving occupations in Viola are Transportation (4 | 14.8%), Production (2 | 7.4%), and Material Moving (1 | 3.7%).
Production, Transportation and Moving Occupations by Sex
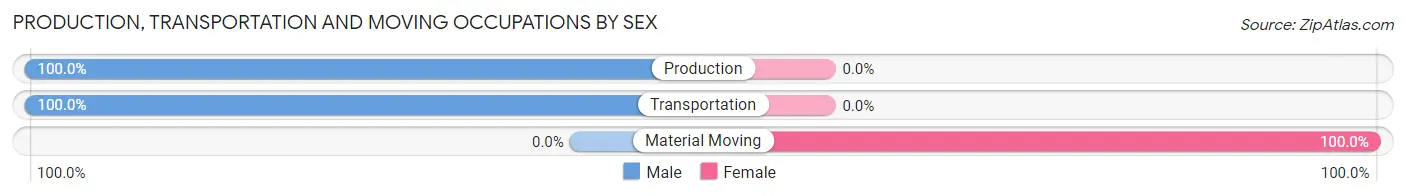
| Occupation | Male | Female |
| Production | 2 (100.0%) | 0 (0.0%) |
| Transportation | 4 (100.0%) | 0 (0.0%) |
| Material Moving | 0 (0.0%) | 1 (100.0%) |
| Total (Category) | 6 (85.7%) | 1 (14.3%) |
| Total (Overall) | 12 (44.4%) | 15 (55.6%) |
Employment Industries by Sex in Viola
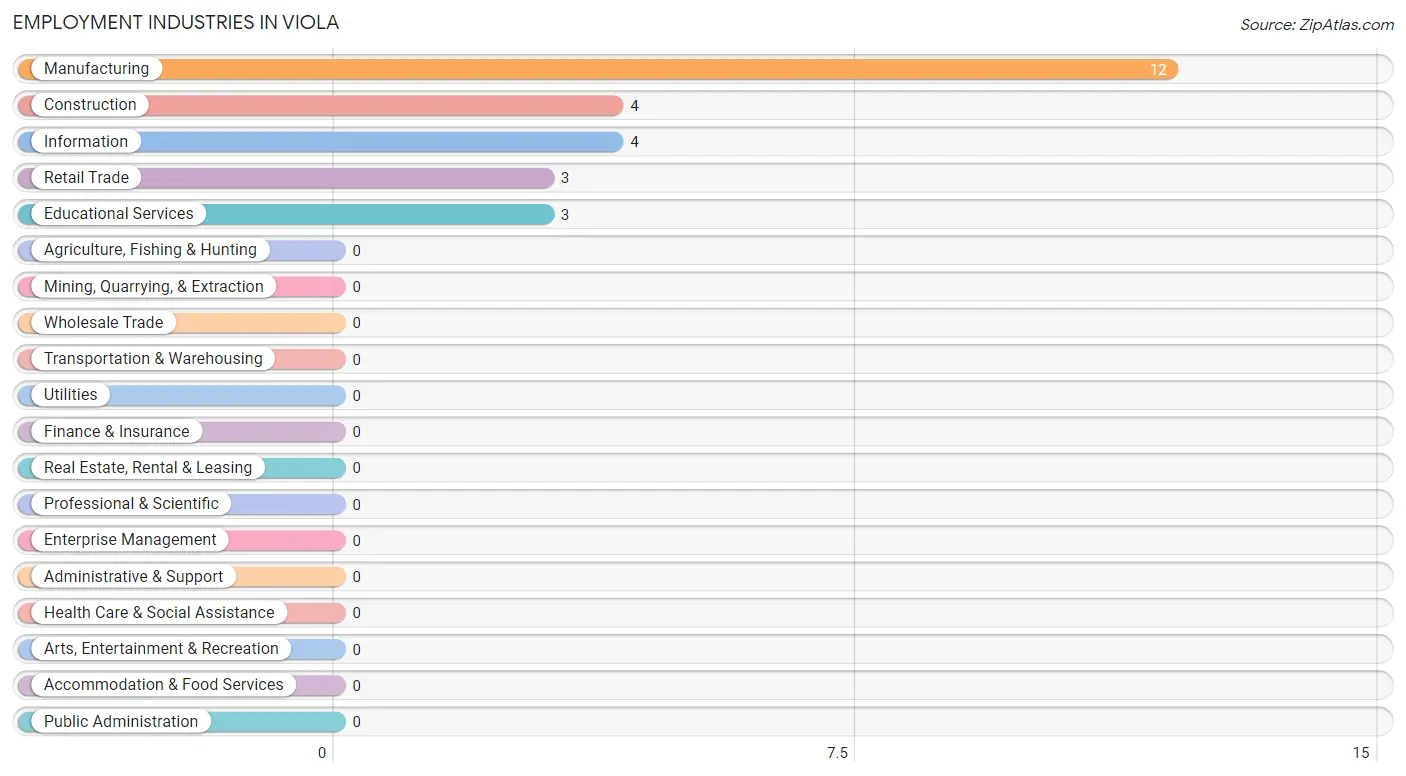
Employment Industries in Viola
The major employment industries in Viola include Manufacturing (12 | 44.4%), Construction (4 | 14.8%), Information (4 | 14.8%), Retail Trade (3 | 11.1%), and Educational Services (3 | 11.1%).
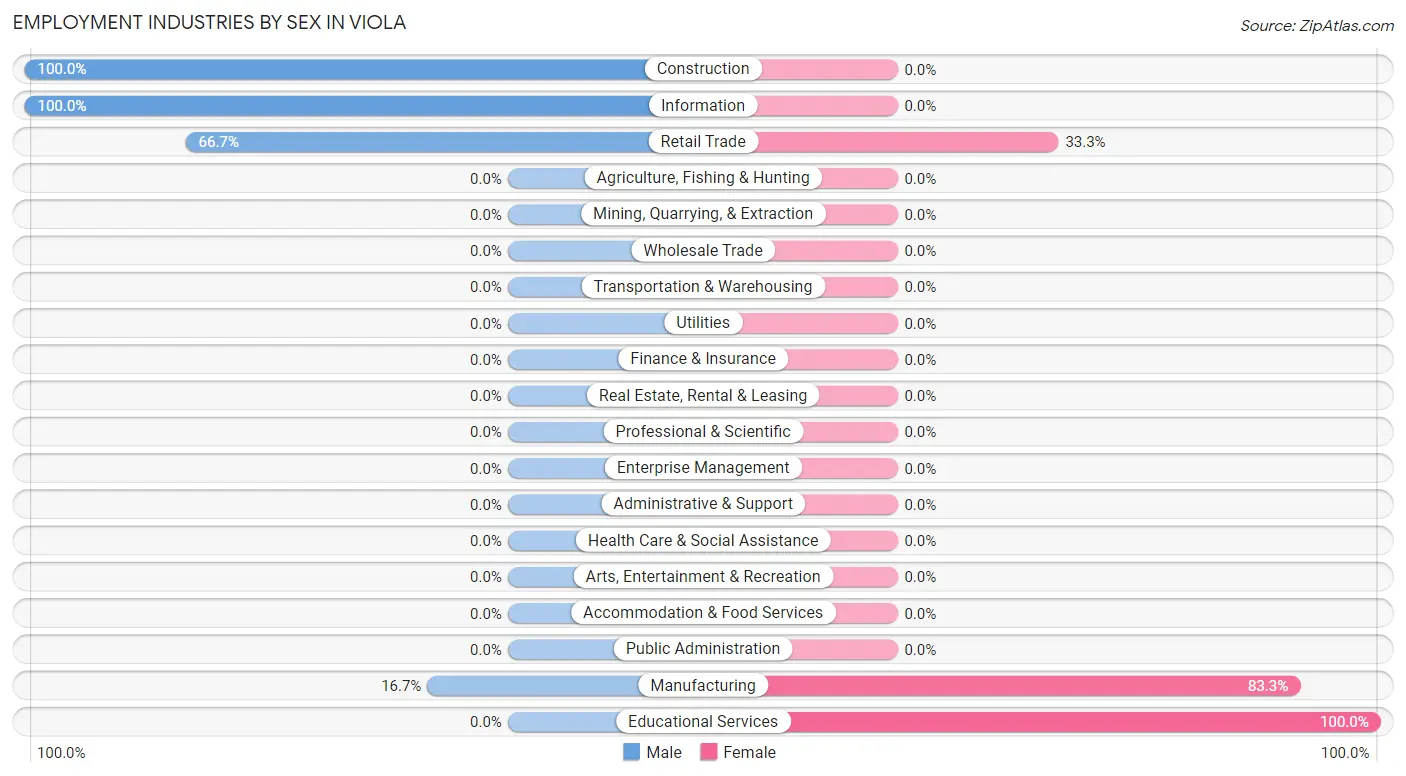
Employment Industries by Sex in Viola
The Viola industries that see more men than women are Construction (100.0%), Information (100.0%), and Retail Trade (66.7%), whereas the industries that tend to have a higher number of women are Educational Services (100.0%), Manufacturing (83.3%), and Retail Trade (33.3%).
| Industry | Male | Female |
| Agriculture, Fishing & Hunting | 0 (0.0%) | 0 (0.0%) |
| Mining, Quarrying, & Extraction | 0 (0.0%) | 0 (0.0%) |
| Construction | 4 (100.0%) | 0 (0.0%) |
| Manufacturing | 2 (16.7%) | 10 (83.3%) |
| Wholesale Trade | 0 (0.0%) | 0 (0.0%) |
| Retail Trade | 2 (66.7%) | 1 (33.3%) |
| Transportation & Warehousing | 0 (0.0%) | 0 (0.0%) |
| Utilities | 0 (0.0%) | 0 (0.0%) |
| Information | 4 (100.0%) | 0 (0.0%) |
| Finance & Insurance | 0 (0.0%) | 0 (0.0%) |
| Real Estate, Rental & Leasing | 0 (0.0%) | 0 (0.0%) |
| Professional & Scientific | 0 (0.0%) | 0 (0.0%) |
| Enterprise Management | 0 (0.0%) | 0 (0.0%) |
| Administrative & Support | 0 (0.0%) | 0 (0.0%) |
| Educational Services | 0 (0.0%) | 3 (100.0%) |
| Health Care & Social Assistance | 0 (0.0%) | 0 (0.0%) |
| Arts, Entertainment & Recreation | 0 (0.0%) | 0 (0.0%) |
| Accommodation & Food Services | 0 (0.0%) | 0 (0.0%) |
| Public Administration | 0 (0.0%) | 0 (0.0%) |
| Total | 12 (44.4%) | 15 (55.6%) |
Education in Viola
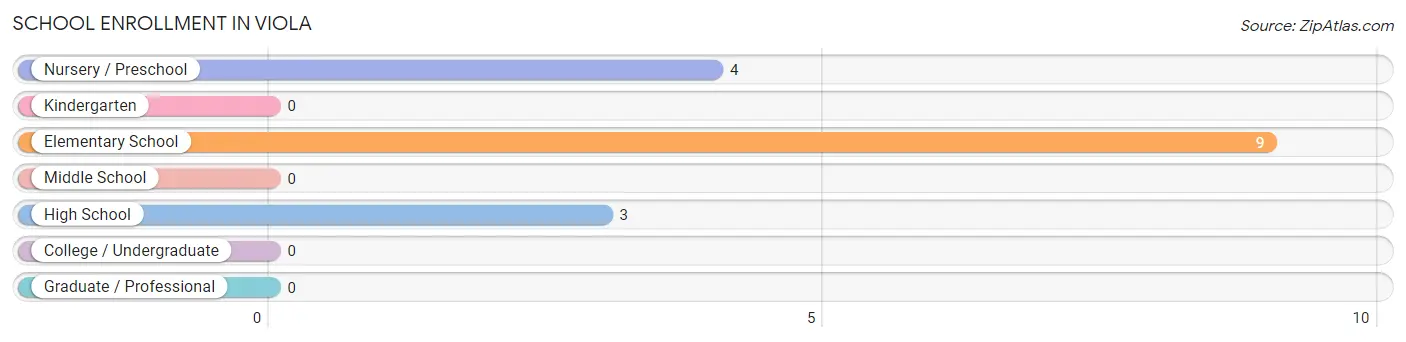
School Enrollment in Viola
The most common levels of schooling among the 16 students in Viola are elementary school (9 | 56.2%), nursery / preschool (4 | 25.0%), and high school (3 | 18.8%).
| School Level | # Students | % Students |
| Nursery / Preschool | 4 | 25.0% |
| Kindergarten | 0 | 0.0% |
| Elementary School | 9 | 56.2% |
| Middle School | 0 | 0.0% |
| High School | 3 | 18.8% |
| College / Undergraduate | 0 | 0.0% |
| Graduate / Professional | 0 | 0.0% |
| Total | 16 | 100.0% |
School Enrollment by Age by Funding Source in Viola
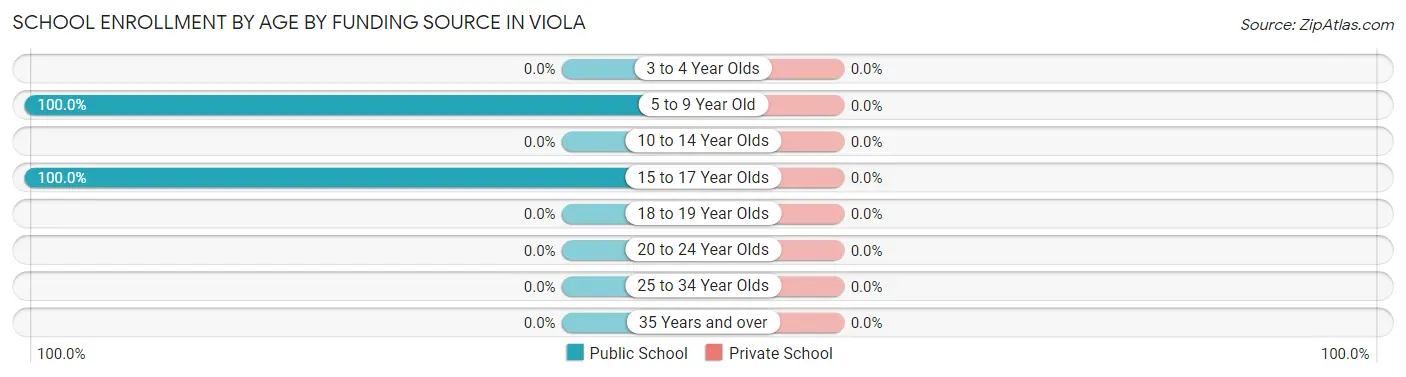
| Age Bracket | Public School | Private School |
| 3 to 4 Year Olds | 0 (0.0%) | 0 (0.0%) |
| 5 to 9 Year Old | 13 (100.0%) | 0 (0.0%) |
| 10 to 14 Year Olds | 0 (0.0%) | 0 (0.0%) |
| 15 to 17 Year Olds | 3 (100.0%) | 0 (0.0%) |
| 18 to 19 Year Olds | 0 (0.0%) | 0 (0.0%) |
| 20 to 24 Year Olds | 0 (0.0%) | 0 (0.0%) |
| 25 to 34 Year Olds | 0 (0.0%) | 0 (0.0%) |
| 35 Years and over | 0 (0.0%) | 0 (0.0%) |
| Total | 16 (100.0%) | 0 (0.0%) |
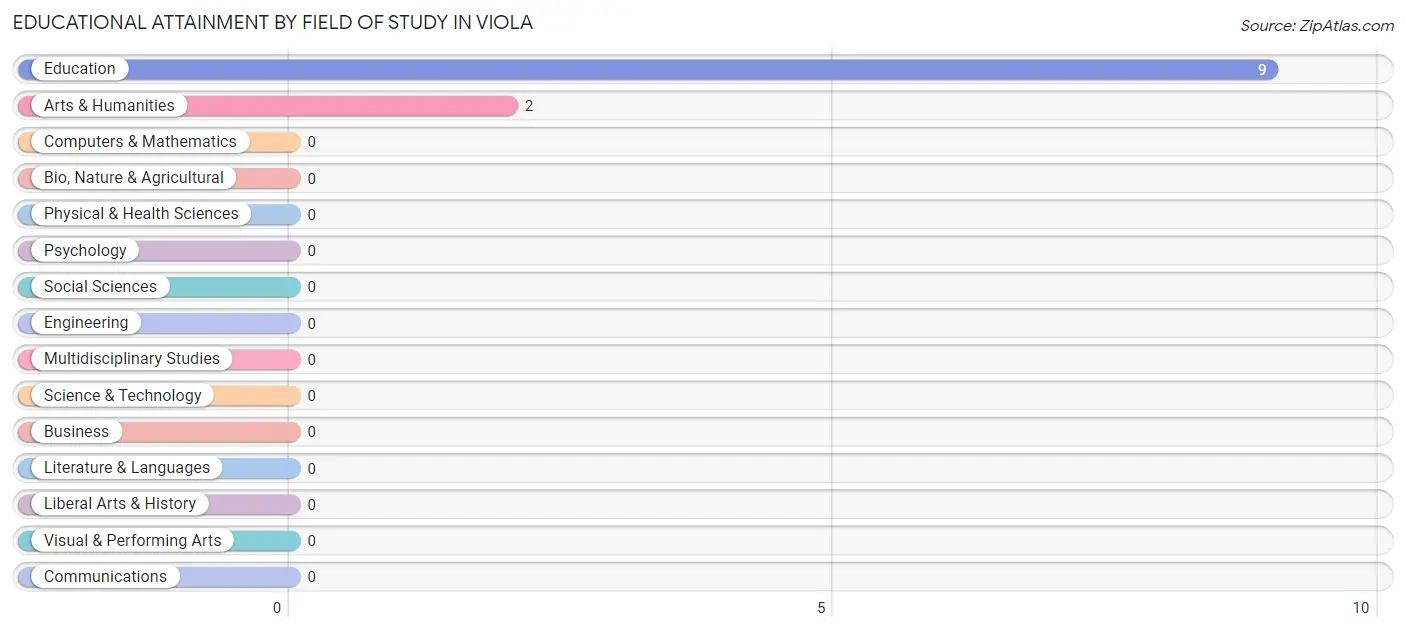
Educational Attainment by Field of Study in Viola
Education (9 | 81.8%), and arts & humanities (2 | 18.2%) are the most common fields of study among 11 individuals in Viola who have obtained a bachelor's degree or higher.
| Field of Study | # Graduates | % Graduates |
| Computers & Mathematics | 0 | 0.0% |
| Bio, Nature & Agricultural | 0 | 0.0% |
| Physical & Health Sciences | 0 | 0.0% |
| Psychology | 0 | 0.0% |
| Social Sciences | 0 | 0.0% |
| Engineering | 0 | 0.0% |
| Multidisciplinary Studies | 0 | 0.0% |
| Science & Technology | 0 | 0.0% |
| Business | 0 | 0.0% |
| Education | 9 | 81.8% |
| Literature & Languages | 0 | 0.0% |
| Liberal Arts & History | 0 | 0.0% |
| Visual & Performing Arts | 0 | 0.0% |
| Communications | 0 | 0.0% |
| Arts & Humanities | 2 | 18.2% |
| Total | 11 | 100.0% |
Transportation & Commute in Viola
Vehicle Availability by Sex in Viola
The most prevalent vehicle ownership categories in Viola are males with 3 vehicles (8, accounting for 66.7%) and females with 3 vehicles (0, making up 53.3%).
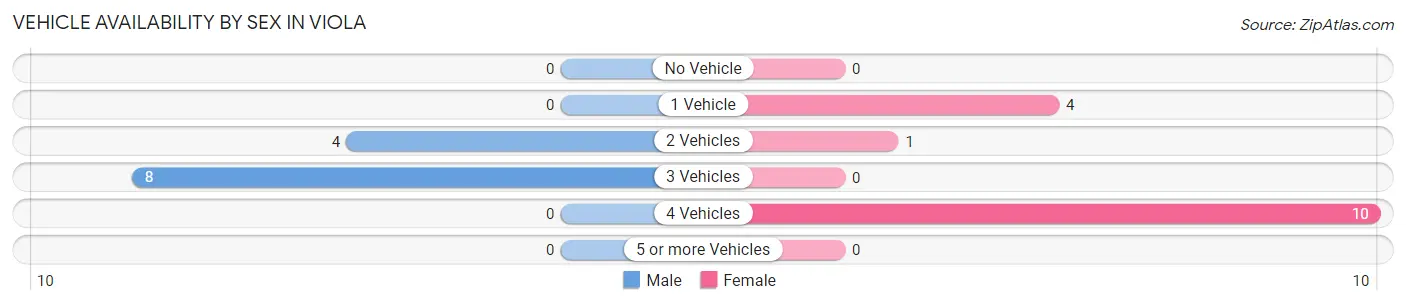
| Vehicles Available | Male | Female |
| No Vehicle | 0 (0.0%) | 0 (0.0%) |
| 1 Vehicle | 0 (0.0%) | 4 (26.7%) |
| 2 Vehicles | 4 (33.3%) | 1 (6.7%) |
| 3 Vehicles | 8 (66.7%) | 0 (0.0%) |
| 4 Vehicles | 0 (0.0%) | 10 (66.7%) |
| 5 or more Vehicles | 0 (0.0%) | 0 (0.0%) |
| Total | 12 (100.0%) | 15 (100.0%) |
Commute Time in Viola
The most frequently occuring commute durations in Viola are 25 to 29 minutes (14 commuters, 51.8%), 15 to 19 minutes (4 commuters, 14.8%), and 20 to 24 minutes (4 commuters, 14.8%).
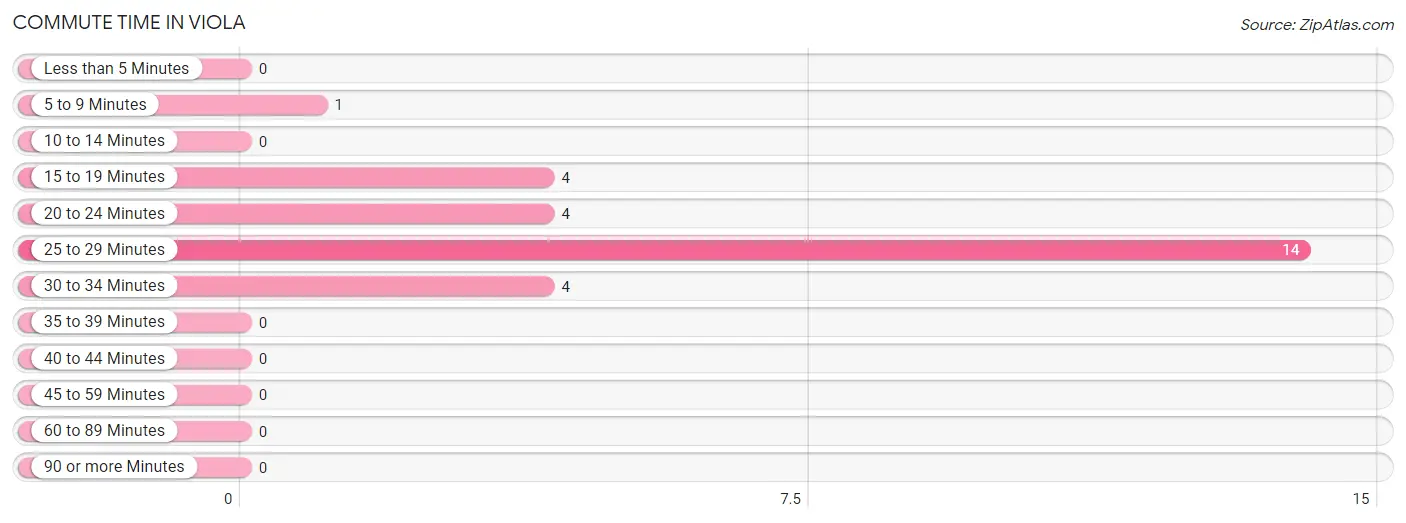
| Commute Time | # Commuters | % Commuters |
| Less than 5 Minutes | 0 | 0.0% |
| 5 to 9 Minutes | 1 | 3.7% |
| 10 to 14 Minutes | 0 | 0.0% |
| 15 to 19 Minutes | 4 | 14.8% |
| 20 to 24 Minutes | 4 | 14.8% |
| 25 to 29 Minutes | 14 | 51.8% |
| 30 to 34 Minutes | 4 | 14.8% |
| 35 to 39 Minutes | 0 | 0.0% |
| 40 to 44 Minutes | 0 | 0.0% |
| 45 to 59 Minutes | 0 | 0.0% |
| 60 to 89 Minutes | 0 | 0.0% |
| 90 or more Minutes | 0 | 0.0% |
Commute Time by Sex in Viola
The most common commute times in Viola are 15 to 19 minutes (4 commuters, 33.3%) for males and 25 to 29 minutes (12 commuters, 80.0%) for females.
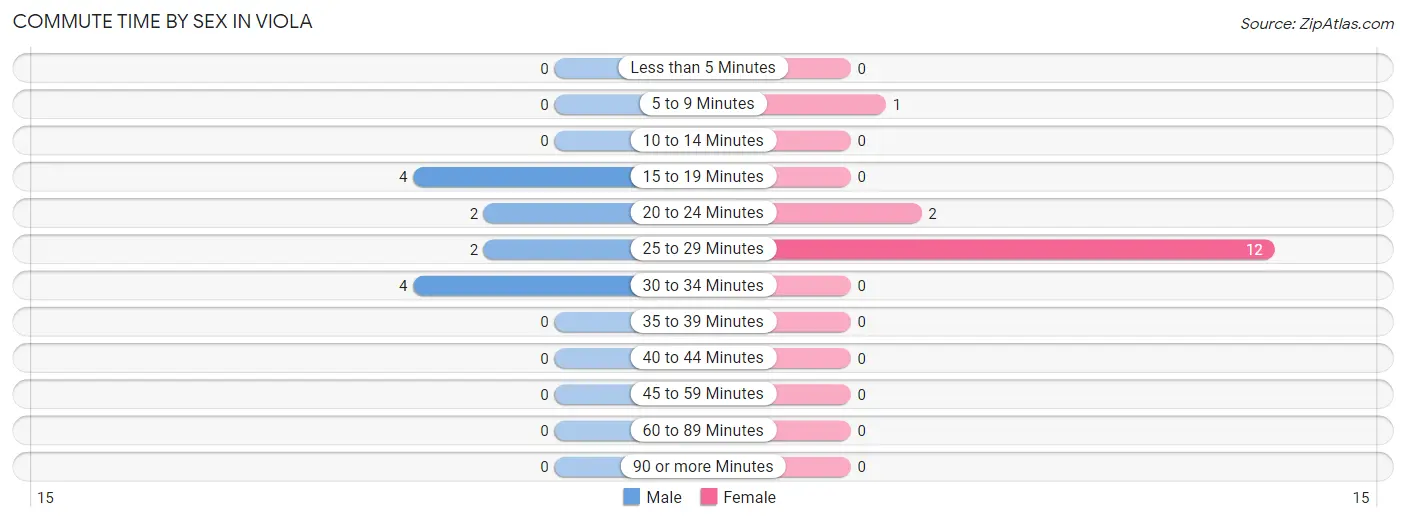
| Commute Time | Male | Female |
| Less than 5 Minutes | 0 (0.0%) | 0 (0.0%) |
| 5 to 9 Minutes | 0 (0.0%) | 1 (6.7%) |
| 10 to 14 Minutes | 0 (0.0%) | 0 (0.0%) |
| 15 to 19 Minutes | 4 (33.3%) | 0 (0.0%) |
| 20 to 24 Minutes | 2 (16.7%) | 2 (13.3%) |
| 25 to 29 Minutes | 2 (16.7%) | 12 (80.0%) |
| 30 to 34 Minutes | 4 (33.3%) | 0 (0.0%) |
| 35 to 39 Minutes | 0 (0.0%) | 0 (0.0%) |
| 40 to 44 Minutes | 0 (0.0%) | 0 (0.0%) |
| 45 to 59 Minutes | 0 (0.0%) | 0 (0.0%) |
| 60 to 89 Minutes | 0 (0.0%) | 0 (0.0%) |
| 90 or more Minutes | 0 (0.0%) | 0 (0.0%) |
Time of Departure to Work by Sex in Viola
The most frequent times of departure to work in Viola are 6:30 AM to 6:59 AM (4, 33.3%) for males and 7:00 AM to 7:29 AM (10, 66.7%) for females.
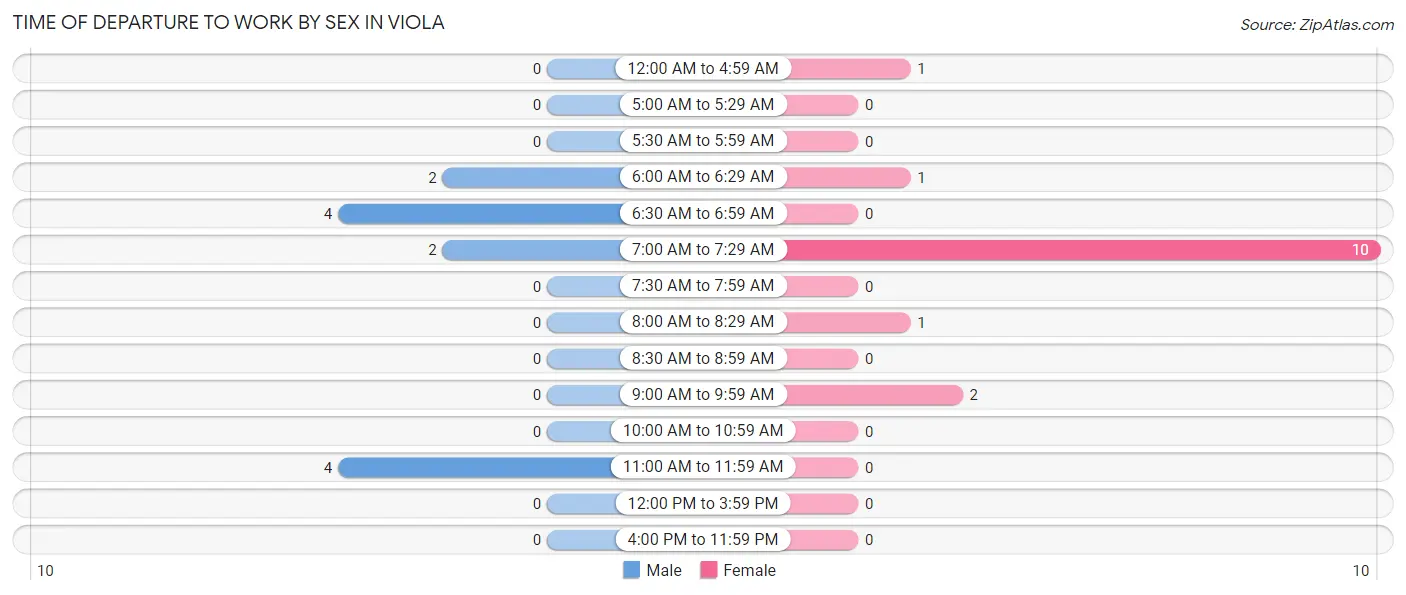
| Time of Departure | Male | Female |
| 12:00 AM to 4:59 AM | 0 (0.0%) | 1 (6.7%) |
| 5:00 AM to 5:29 AM | 0 (0.0%) | 0 (0.0%) |
| 5:30 AM to 5:59 AM | 0 (0.0%) | 0 (0.0%) |
| 6:00 AM to 6:29 AM | 2 (16.7%) | 1 (6.7%) |
| 6:30 AM to 6:59 AM | 4 (33.3%) | 0 (0.0%) |
| 7:00 AM to 7:29 AM | 2 (16.7%) | 10 (66.7%) |
| 7:30 AM to 7:59 AM | 0 (0.0%) | 0 (0.0%) |
| 8:00 AM to 8:29 AM | 0 (0.0%) | 1 (6.7%) |
| 8:30 AM to 8:59 AM | 0 (0.0%) | 0 (0.0%) |
| 9:00 AM to 9:59 AM | 0 (0.0%) | 2 (13.3%) |
| 10:00 AM to 10:59 AM | 0 (0.0%) | 0 (0.0%) |
| 11:00 AM to 11:59 AM | 4 (33.3%) | 0 (0.0%) |
| 12:00 PM to 3:59 PM | 0 (0.0%) | 0 (0.0%) |
| 4:00 PM to 11:59 PM | 0 (0.0%) | 0 (0.0%) |
| Total | 12 (100.0%) | 15 (100.0%) |
Housing Occupancy in Viola
Occupancy by Ownership in Viola
Of the total 48 dwellings in Viola, owner-occupied units account for 48 (100.0%), while renter-occupied units make up 0 (0.0%).
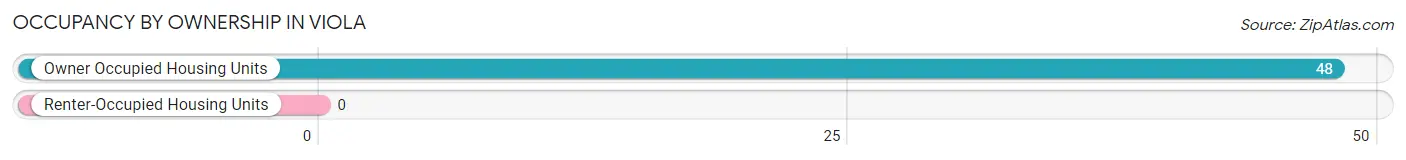
| Occupancy | # Housing Units | % Housing Units |
| Owner Occupied Housing Units | 48 | 100.0% |
| Renter-Occupied Housing Units | 0 | 0.0% |
| Total Occupied Housing Units | 48 | 100.0% |
Occupancy by Household Size in Viola
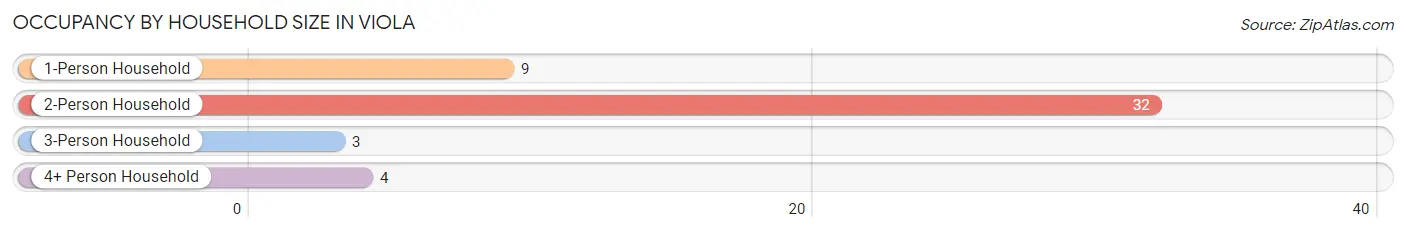
| Household Size | # Housing Units | % Housing Units |
| 1-Person Household | 9 | 18.8% |
| 2-Person Household | 32 | 66.7% |
| 3-Person Household | 3 | 6.2% |
| 4+ Person Household | 4 | 8.3% |
| Total Housing Units | 48 | 100.0% |
Occupancy by Ownership by Household Size in Viola
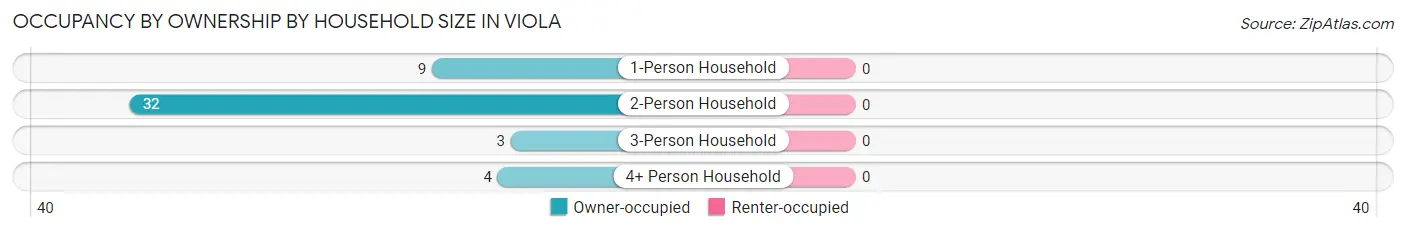
| Household Size | Owner-occupied | Renter-occupied |
| 1-Person Household | 9 (100.0%) | 0 (0.0%) |
| 2-Person Household | 32 (100.0%) | 0 (0.0%) |
| 3-Person Household | 3 (100.0%) | 0 (0.0%) |
| 4+ Person Household | 4 (100.0%) | 0 (0.0%) |
| Total Housing Units | 48 (100.0%) | 0 (0.0%) |
Occupancy by Educational Attainment in Viola
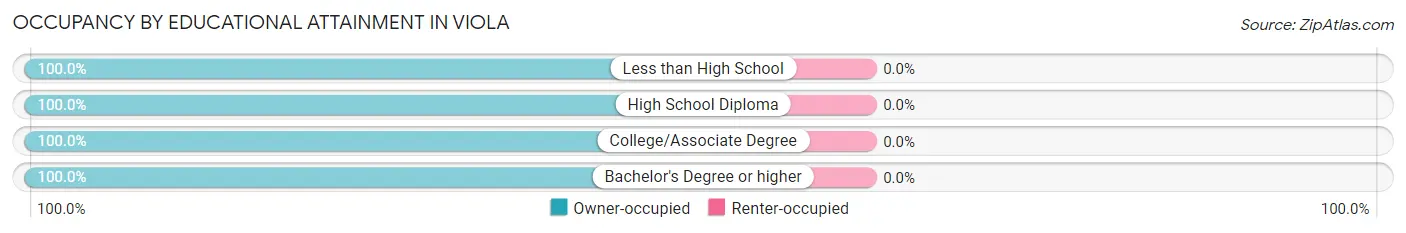
| Household Size | Owner-occupied | Renter-occupied |
| Less than High School | 16 (100.0%) | 0 (0.0%) |
| High School Diploma | 16 (100.0%) | 0 (0.0%) |
| College/Associate Degree | 6 (100.0%) | 0 (0.0%) |
| Bachelor's Degree or higher | 10 (100.0%) | 0 (0.0%) |
Occupancy by Age of Householder in Viola
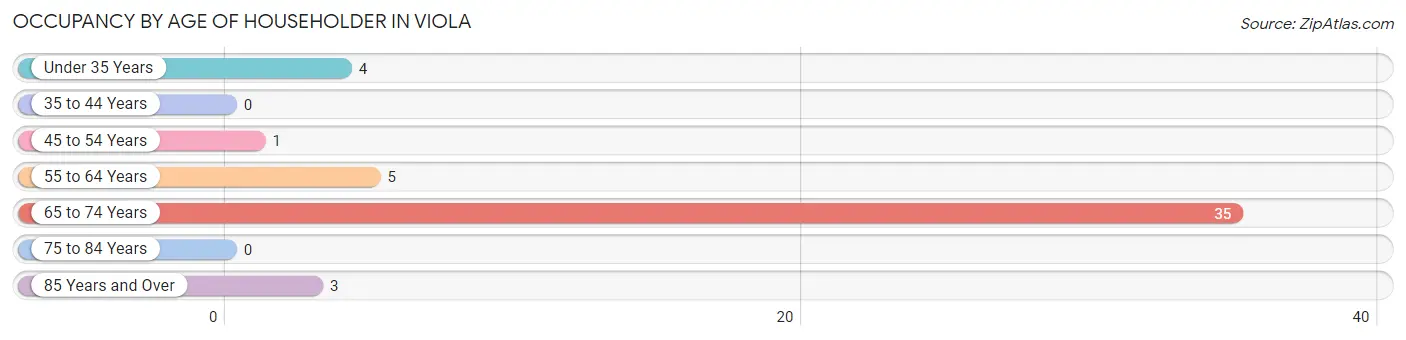
| Age Bracket | # Households | % Households |
| Under 35 Years | 4 | 8.3% |
| 35 to 44 Years | 0 | 0.0% |
| 45 to 54 Years | 1 | 2.1% |
| 55 to 64 Years | 5 | 10.4% |
| 65 to 74 Years | 35 | 72.9% |
| 75 to 84 Years | 0 | 0.0% |
| 85 Years and Over | 3 | 6.2% |
| Total | 48 | 100.0% |
Housing Finances in Viola
Median Income by Occupancy in Viola
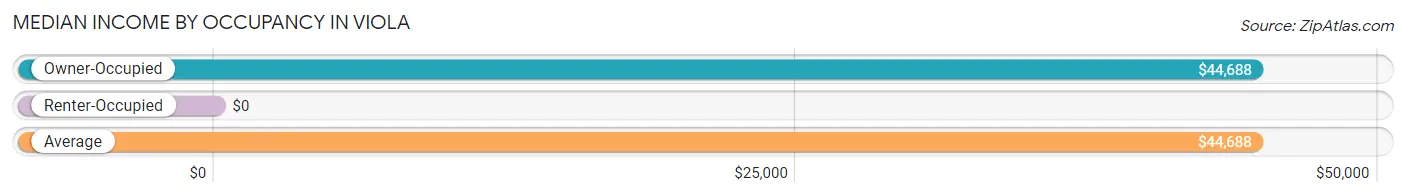
| Occupancy Type | # Households | Median Income |
| Owner-Occupied | 48 (100.0%) | $44,688 |
| Renter-Occupied | 0 (0.0%) | $0 |
| Average | 48 (100.0%) | $44,688 |
Occupancy by Householder Income Bracket in Viola
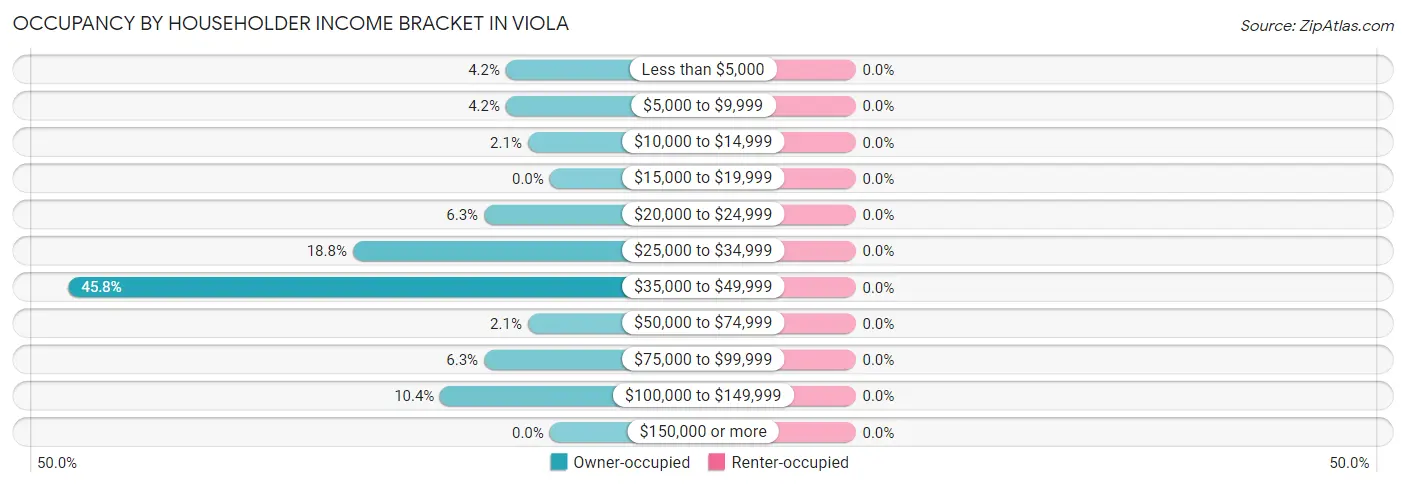
| Income Bracket | Owner-occupied | Renter-occupied |
| Less than $5,000 | 2 (4.2%) | 0 (0.0%) |
| $5,000 to $9,999 | 2 (4.2%) | 0 (0.0%) |
| $10,000 to $14,999 | 1 (2.1%) | 0 (0.0%) |
| $15,000 to $19,999 | 0 (0.0%) | 0 (0.0%) |
| $20,000 to $24,999 | 3 (6.2%) | 0 (0.0%) |
| $25,000 to $34,999 | 9 (18.8%) | 0 (0.0%) |
| $35,000 to $49,999 | 22 (45.8%) | 0 (0.0%) |
| $50,000 to $74,999 | 1 (2.1%) | 0 (0.0%) |
| $75,000 to $99,999 | 3 (6.2%) | 0 (0.0%) |
| $100,000 to $149,999 | 5 (10.4%) | 0 (0.0%) |
| $150,000 or more | 0 (0.0%) | 0 (0.0%) |
| Total | 48 (100.0%) | 0 (0.0%) |
Monthly Housing Cost Tiers in Viola
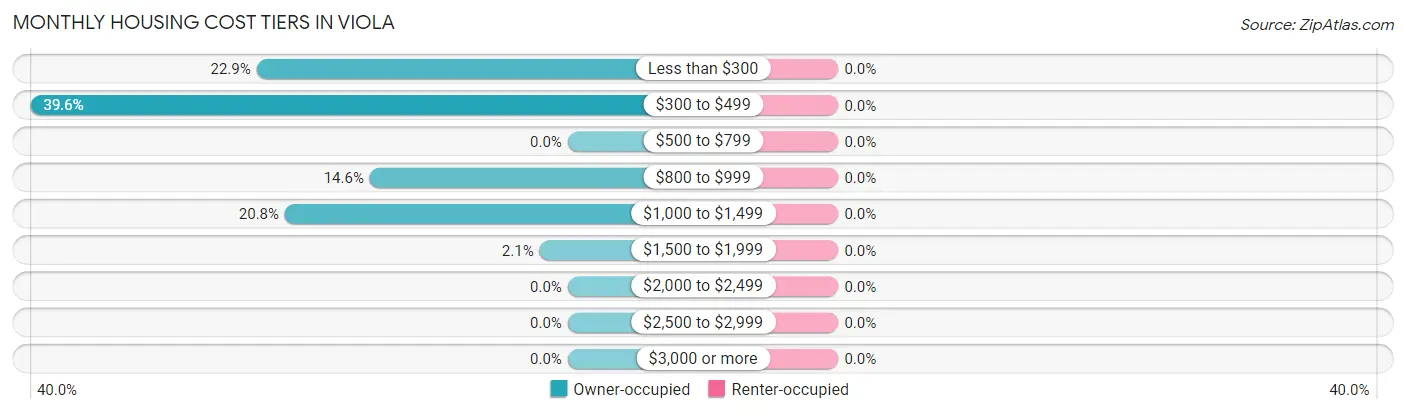
| Monthly Cost | Owner-occupied | Renter-occupied |
| Less than $300 | 11 (22.9%) | 0 (0.0%) |
| $300 to $499 | 19 (39.6%) | 0 (0.0%) |
| $500 to $799 | 0 (0.0%) | 0 (0.0%) |
| $800 to $999 | 7 (14.6%) | 0 (0.0%) |
| $1,000 to $1,499 | 10 (20.8%) | 0 (0.0%) |
| $1,500 to $1,999 | 1 (2.1%) | 0 (0.0%) |
| $2,000 to $2,499 | 0 (0.0%) | 0 (0.0%) |
| $2,500 to $2,999 | 0 (0.0%) | 0 (0.0%) |
| $3,000 or more | 0 (0.0%) | 0 (0.0%) |
| Total | 48 (100.0%) | 0 (0.0%) |
Physical Housing Characteristics in Viola
Housing Structures in Viola
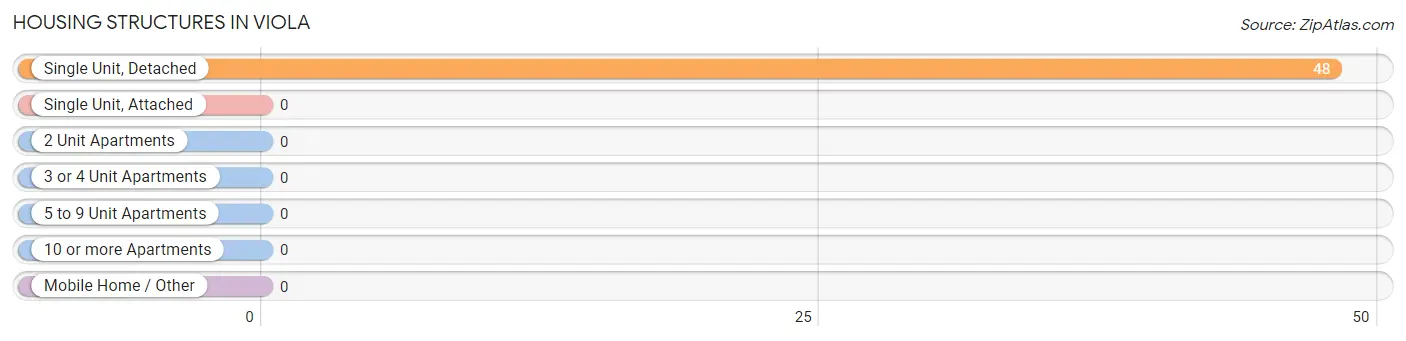
| Structure Type | # Housing Units | % Housing Units |
| Single Unit, Detached | 48 | 100.0% |
| Single Unit, Attached | 0 | 0.0% |
| 2 Unit Apartments | 0 | 0.0% |
| 3 or 4 Unit Apartments | 0 | 0.0% |
| 5 to 9 Unit Apartments | 0 | 0.0% |
| 10 or more Apartments | 0 | 0.0% |
| Mobile Home / Other | 0 | 0.0% |
| Total | 48 | 100.0% |
Housing Structures by Occupancy in Viola
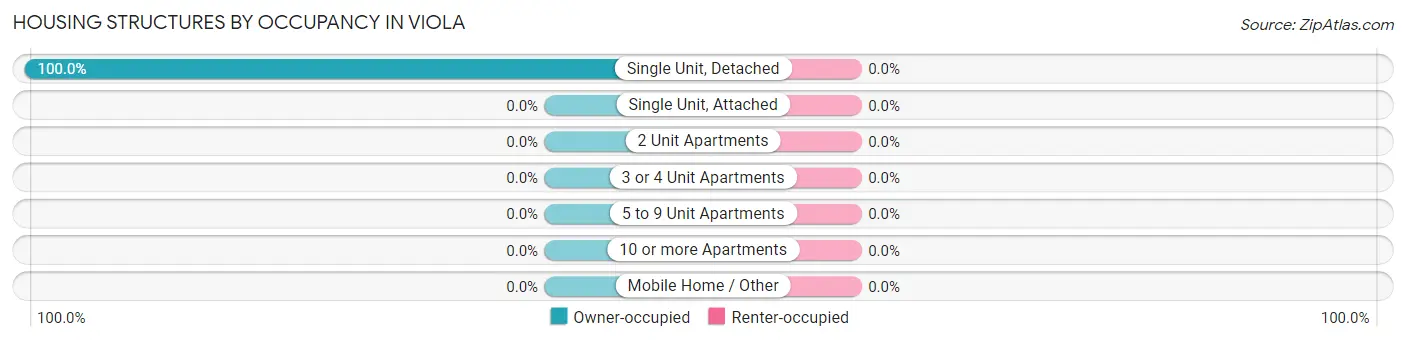
| Structure Type | Owner-occupied | Renter-occupied |
| Single Unit, Detached | 48 (100.0%) | 0 (0.0%) |
| Single Unit, Attached | 0 (0.0%) | 0 (0.0%) |
| 2 Unit Apartments | 0 (0.0%) | 0 (0.0%) |
| 3 or 4 Unit Apartments | 0 (0.0%) | 0 (0.0%) |
| 5 to 9 Unit Apartments | 0 (0.0%) | 0 (0.0%) |
| 10 or more Apartments | 0 (0.0%) | 0 (0.0%) |
| Mobile Home / Other | 0 (0.0%) | 0 (0.0%) |
| Total | 48 (100.0%) | 0 (0.0%) |
Housing Structures by Number of Rooms in Viola
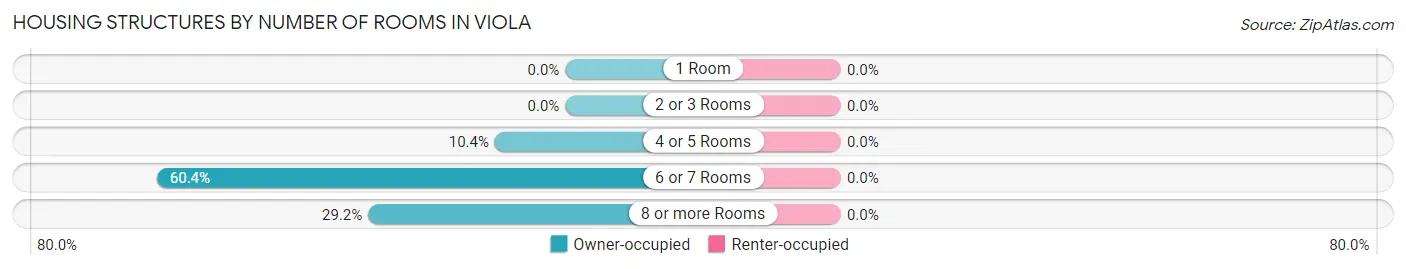
| Number of Rooms | Owner-occupied | Renter-occupied |
| 1 Room | 0 (0.0%) | 0 (0.0%) |
| 2 or 3 Rooms | 0 (0.0%) | 0 (0.0%) |
| 4 or 5 Rooms | 5 (10.4%) | 0 (0.0%) |
| 6 or 7 Rooms | 29 (60.4%) | 0 (0.0%) |
| 8 or more Rooms | 14 (29.2%) | 0 (0.0%) |
| Total | 48 (100.0%) | 0 (0.0%) |
Housing Structure by Heating Type in Viola
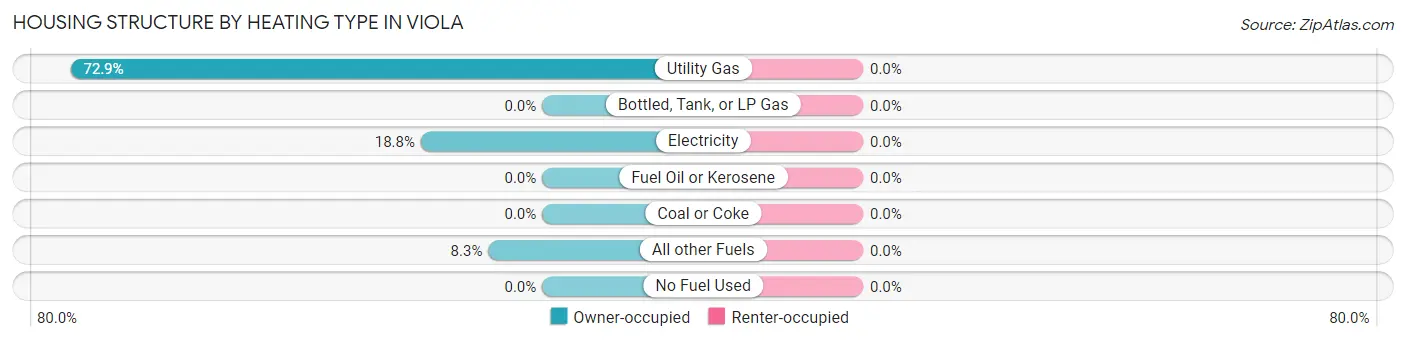
| Heating Type | Owner-occupied | Renter-occupied |
| Utility Gas | 35 (72.9%) | 0 (0.0%) |
| Bottled, Tank, or LP Gas | 0 (0.0%) | 0 (0.0%) |
| Electricity | 9 (18.8%) | 0 (0.0%) |
| Fuel Oil or Kerosene | 0 (0.0%) | 0 (0.0%) |
| Coal or Coke | 0 (0.0%) | 0 (0.0%) |
| All other Fuels | 4 (8.3%) | 0 (0.0%) |
| No Fuel Used | 0 (0.0%) | 0 (0.0%) |
| Total | 48 (100.0%) | 0 (0.0%) |
Household Vehicle Usage in Viola
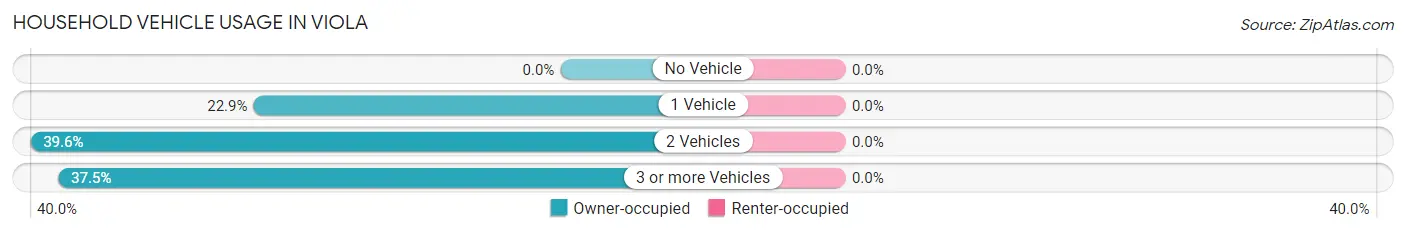
| Vehicles per Household | Owner-occupied | Renter-occupied |
| No Vehicle | 0 (0.0%) | 0 (0.0%) |
| 1 Vehicle | 11 (22.9%) | 0 (0.0%) |
| 2 Vehicles | 19 (39.6%) | 0 (0.0%) |
| 3 or more Vehicles | 18 (37.5%) | 0 (0.0%) |
| Total | 48 (100.0%) | 0 (0.0%) |
Real Estate & Mortgages in Viola
Real Estate and Mortgage Overview in Viola
| Characteristic | Without Mortgage | With Mortgage |
| Housing Units | 31 | 17 |
| Median Property Value | - | - |
| Median Household Income | $42,656 | $0 |
| Monthly Housing Costs | $345 | $0 |
| Real Estate Taxes | $495 | $0 |
Property Value by Mortgage Status in Viola
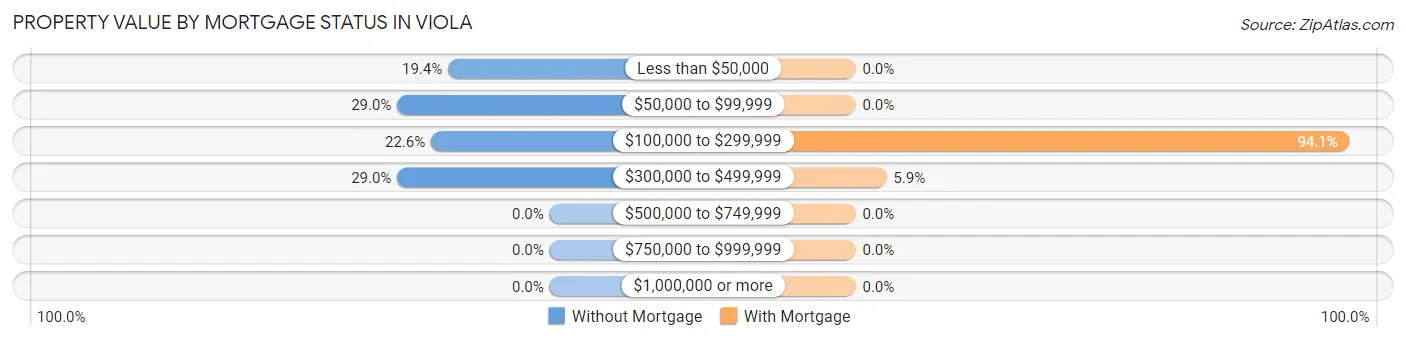
| Property Value | Without Mortgage | With Mortgage |
| Less than $50,000 | 6 (19.4%) | 0 (0.0%) |
| $50,000 to $99,999 | 9 (29.0%) | 0 (0.0%) |
| $100,000 to $299,999 | 7 (22.6%) | 16 (94.1%) |
| $300,000 to $499,999 | 9 (29.0%) | 1 (5.9%) |
| $500,000 to $749,999 | 0 (0.0%) | 0 (0.0%) |
| $750,000 to $999,999 | 0 (0.0%) | 0 (0.0%) |
| $1,000,000 or more | 0 (0.0%) | 0 (0.0%) |
| Total | 31 (100.0%) | 17 (100.0%) |
Household Income by Mortgage Status in Viola
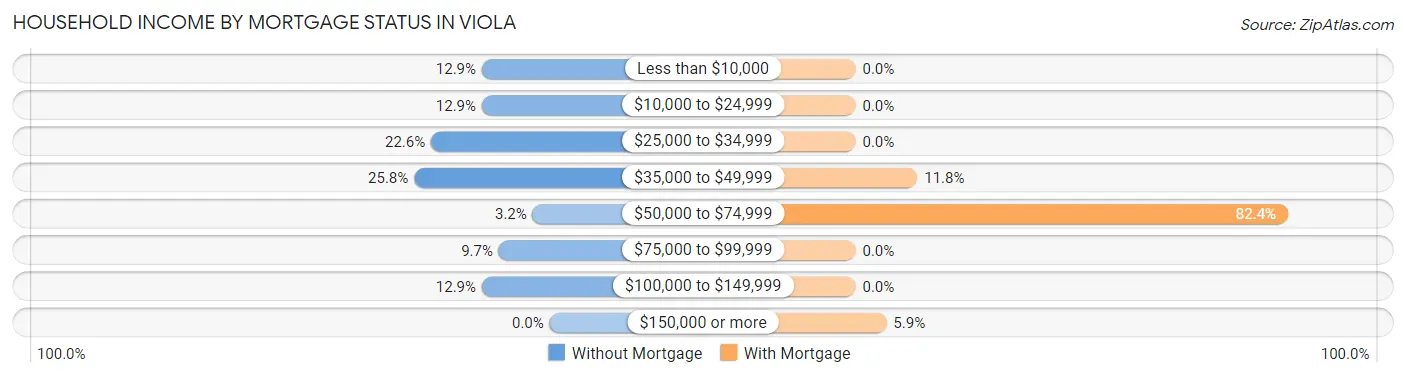
| Household Income | Without Mortgage | With Mortgage |
| Less than $10,000 | 4 (12.9%) | 0 (0.0%) |
| $10,000 to $24,999 | 4 (12.9%) | 0 (0.0%) |
| $25,000 to $34,999 | 7 (22.6%) | 0 (0.0%) |
| $35,000 to $49,999 | 8 (25.8%) | 2 (11.8%) |
| $50,000 to $74,999 | 1 (3.2%) | 14 (82.4%) |
| $75,000 to $99,999 | 3 (9.7%) | 0 (0.0%) |
| $100,000 to $149,999 | 4 (12.9%) | 0 (0.0%) |
| $150,000 or more | 0 (0.0%) | 1 (5.9%) |
| Total | 31 (100.0%) | 17 (100.0%) |
Property Value to Household Income Ratio in Viola
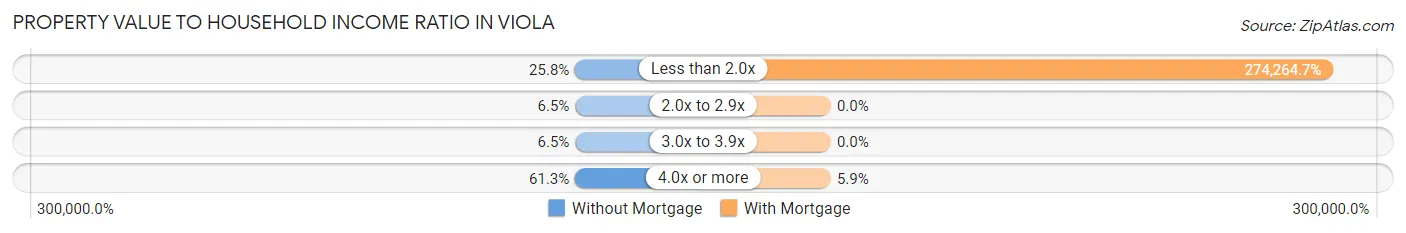
| Value-to-Income Ratio | Without Mortgage | With Mortgage |
| Less than 2.0x | 8 (25.8%) | 46,625 (274,264.7%) |
| 2.0x to 2.9x | 2 (6.5%) | 0 (0.0%) |
| 3.0x to 3.9x | 2 (6.5%) | 0 (0.0%) |
| 4.0x or more | 19 (61.3%) | 1 (5.9%) |
| Total | 31 (100.0%) | 17 (100.0%) |
Real Estate Taxes by Mortgage Status in Viola
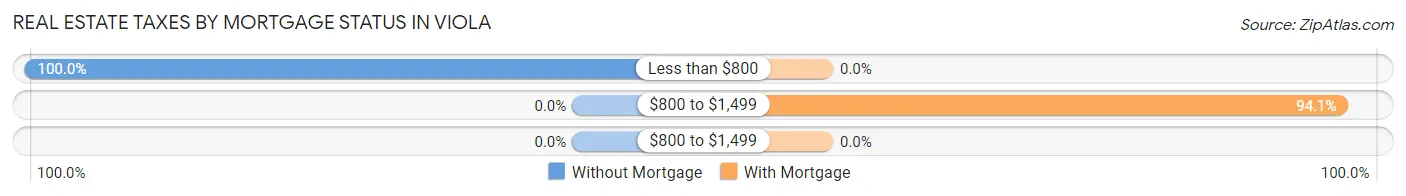
| Property Taxes | Without Mortgage | With Mortgage |
| Less than $800 | 31 (100.0%) | 0 (0.0%) |
| $800 to $1,499 | 0 (0.0%) | 16 (94.1%) |
| $800 to $1,499 | 0 (0.0%) | 0 (0.0%) |
| Total | 31 (100.0%) | 17 (100.0%) |
Health & Disability in Viola
Health Insurance Coverage by Age in Viola
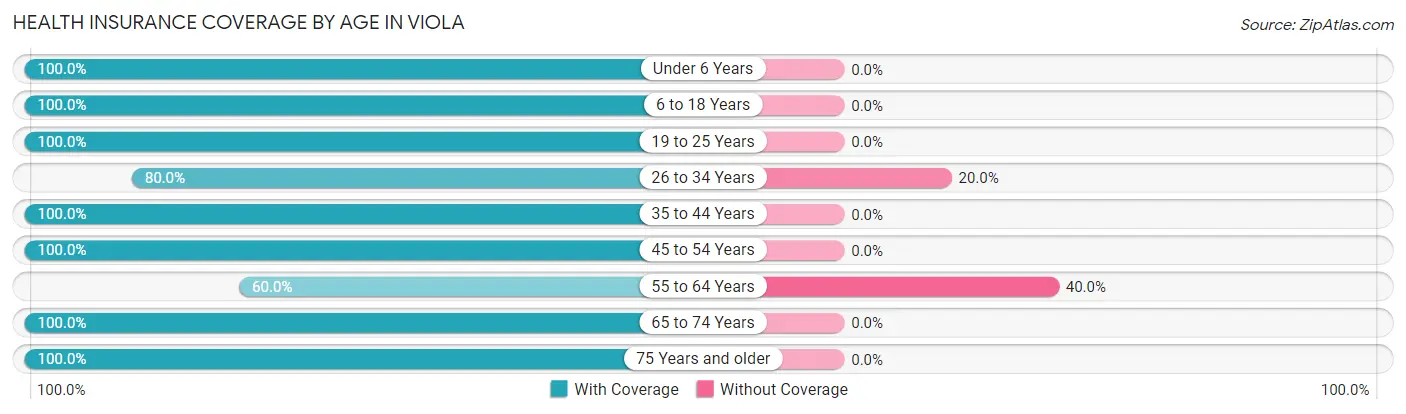
| Age Bracket | With Coverage | Without Coverage |
| Under 6 Years | 4 (100.0%) | 0 (0.0%) |
| 6 to 18 Years | 15 (100.0%) | 0 (0.0%) |
| 19 to 25 Years | 2 (100.0%) | 0 (0.0%) |
| 26 to 34 Years | 4 (80.0%) | 1 (20.0%) |
| 35 to 44 Years | 4 (100.0%) | 0 (0.0%) |
| 45 to 54 Years | 4 (100.0%) | 0 (0.0%) |
| 55 to 64 Years | 3 (60.0%) | 2 (40.0%) |
| 65 to 74 Years | 54 (100.0%) | 0 (0.0%) |
| 75 Years and older | 12 (100.0%) | 0 (0.0%) |
| Total | 102 (97.1%) | 3 (2.9%) |
Health Insurance Coverage by Citizenship Status in Viola
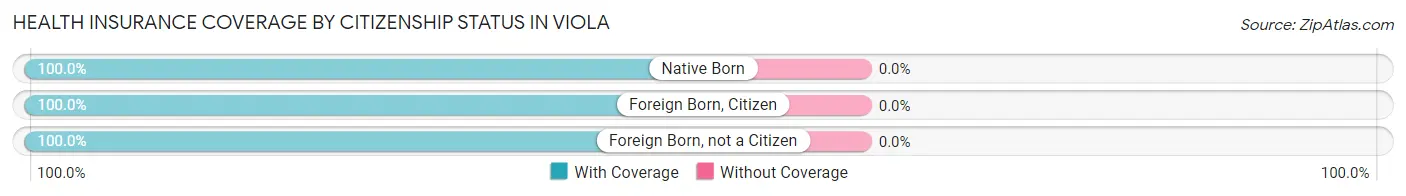
| Citizenship Status | With Coverage | Without Coverage |
| Native Born | 4 (100.0%) | 0 (0.0%) |
| Foreign Born, Citizen | 15 (100.0%) | 0 (0.0%) |
| Foreign Born, not a Citizen | 2 (100.0%) | 0 (0.0%) |
Health Insurance Coverage by Household Income in Viola
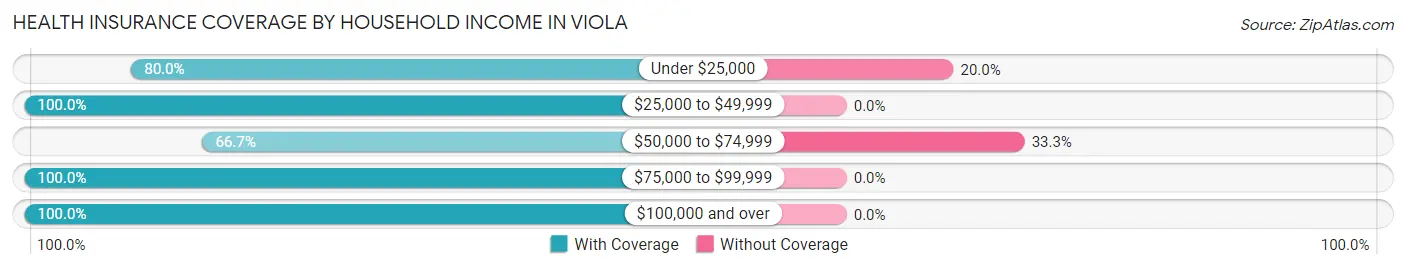
| Household Income | With Coverage | Without Coverage |
| Under $25,000 | 8 (80.0%) | 2 (20.0%) |
| $25,000 to $49,999 | 73 (100.0%) | 0 (0.0%) |
| $50,000 to $74,999 | 2 (66.7%) | 1 (33.3%) |
| $75,000 to $99,999 | 7 (100.0%) | 0 (0.0%) |
| $100,000 and over | 12 (100.0%) | 0 (0.0%) |
Public vs Private Health Insurance Coverage by Age in Viola
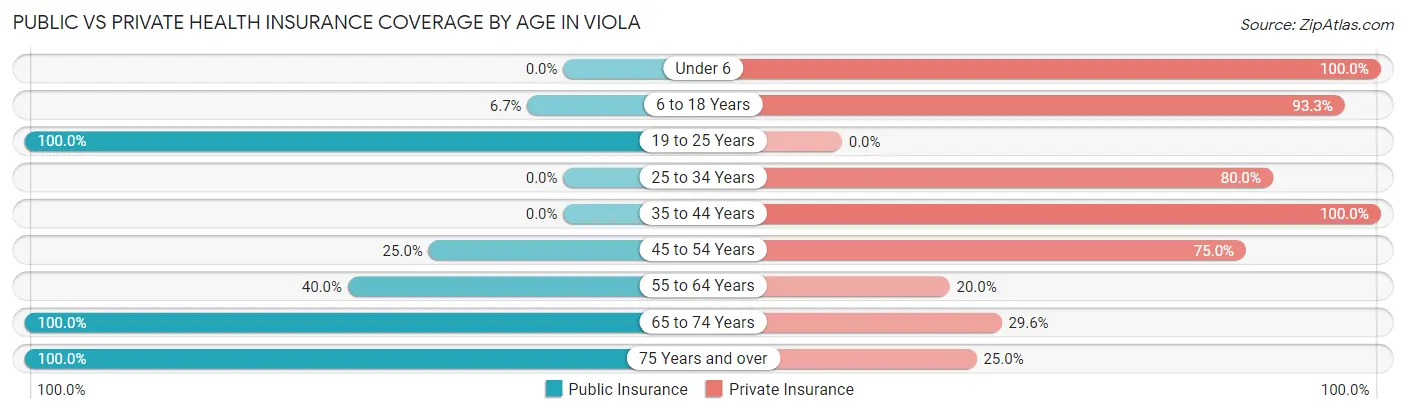
| Age Bracket | Public Insurance | Private Insurance |
| Under 6 | 0 (0.0%) | 4 (100.0%) |
| 6 to 18 Years | 1 (6.7%) | 14 (93.3%) |
| 19 to 25 Years | 2 (100.0%) | 0 (0.0%) |
| 25 to 34 Years | 0 (0.0%) | 4 (80.0%) |
| 35 to 44 Years | 0 (0.0%) | 4 (100.0%) |
| 45 to 54 Years | 1 (25.0%) | 3 (75.0%) |
| 55 to 64 Years | 2 (40.0%) | 1 (20.0%) |
| 65 to 74 Years | 54 (100.0%) | 16 (29.6%) |
| 75 Years and over | 12 (100.0%) | 3 (25.0%) |
| Total | 72 (68.6%) | 49 (46.7%) |
Disability Status by Sex by Age in Viola
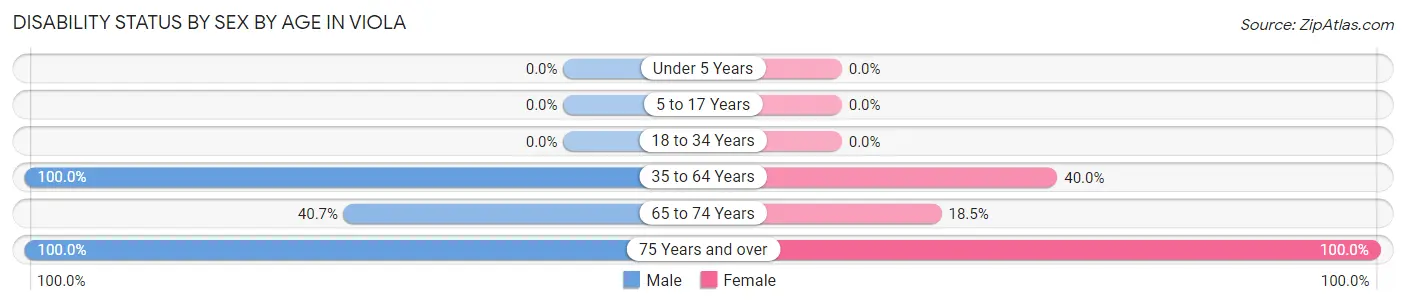
| Age Bracket | Male | Female |
| Under 5 Years | 0 (0.0%) | 0 (0.0%) |
| 5 to 17 Years | 0 (0.0%) | 0 (0.0%) |
| 18 to 34 Years | 0 (0.0%) | 0 (0.0%) |
| 35 to 64 Years | 3 (100.0%) | 4 (40.0%) |
| 65 to 74 Years | 11 (40.7%) | 5 (18.5%) |
| 75 Years and over | 1 (100.0%) | 11 (100.0%) |
Disability Class by Sex by Age in Viola
Disability Class: Hearing Difficulty
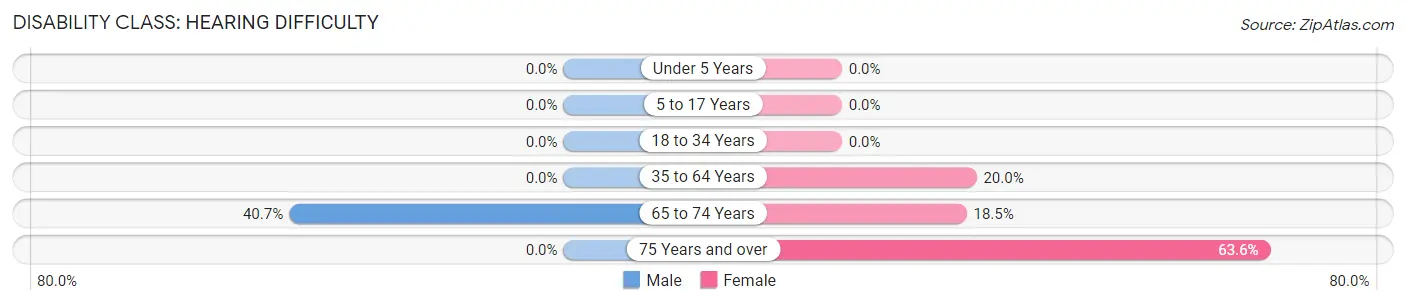
| Age Bracket | Male | Female |
| Under 5 Years | 0 (0.0%) | 0 (0.0%) |
| 5 to 17 Years | 0 (0.0%) | 0 (0.0%) |
| 18 to 34 Years | 0 (0.0%) | 0 (0.0%) |
| 35 to 64 Years | 0 (0.0%) | 2 (20.0%) |
| 65 to 74 Years | 11 (40.7%) | 5 (18.5%) |
| 75 Years and over | 0 (0.0%) | 7 (63.6%) |
Disability Class: Vision Difficulty
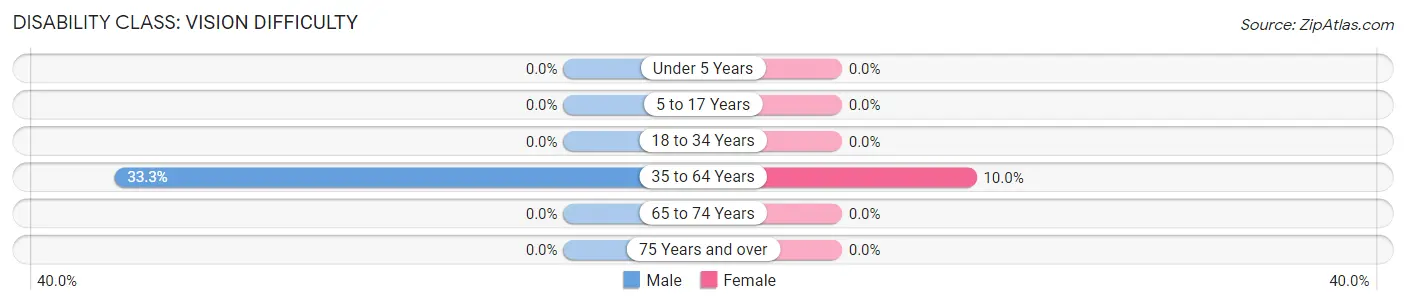
| Age Bracket | Male | Female |
| Under 5 Years | 0 (0.0%) | 0 (0.0%) |
| 5 to 17 Years | 0 (0.0%) | 0 (0.0%) |
| 18 to 34 Years | 0 (0.0%) | 0 (0.0%) |
| 35 to 64 Years | 1 (33.3%) | 1 (10.0%) |
| 65 to 74 Years | 0 (0.0%) | 0 (0.0%) |
| 75 Years and over | 0 (0.0%) | 0 (0.0%) |
Disability Class: Cognitive Difficulty
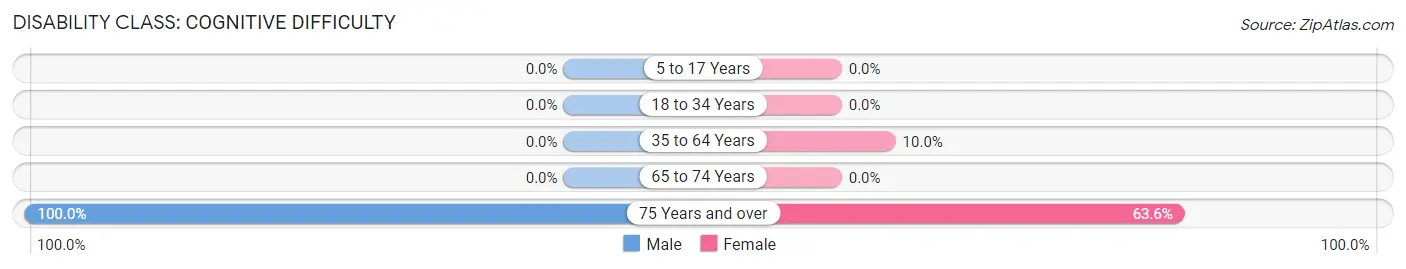
| Age Bracket | Male | Female |
| 5 to 17 Years | 0 (0.0%) | 0 (0.0%) |
| 18 to 34 Years | 0 (0.0%) | 0 (0.0%) |
| 35 to 64 Years | 0 (0.0%) | 1 (10.0%) |
| 65 to 74 Years | 0 (0.0%) | 0 (0.0%) |
| 75 Years and over | 1 (100.0%) | 7 (63.6%) |
Disability Class: Ambulatory Difficulty
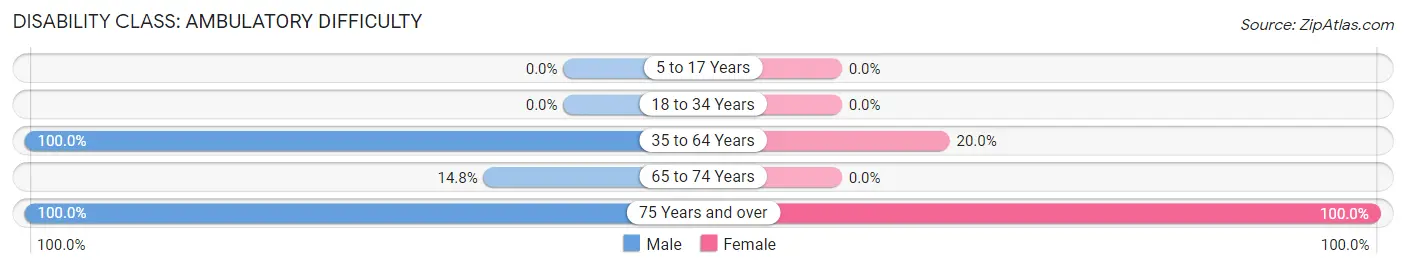
| Age Bracket | Male | Female |
| 5 to 17 Years | 0 (0.0%) | 0 (0.0%) |
| 18 to 34 Years | 0 (0.0%) | 0 (0.0%) |
| 35 to 64 Years | 3 (100.0%) | 2 (20.0%) |
| 65 to 74 Years | 4 (14.8%) | 0 (0.0%) |
| 75 Years and over | 1 (100.0%) | 11 (100.0%) |
Disability Class: Self-Care Difficulty
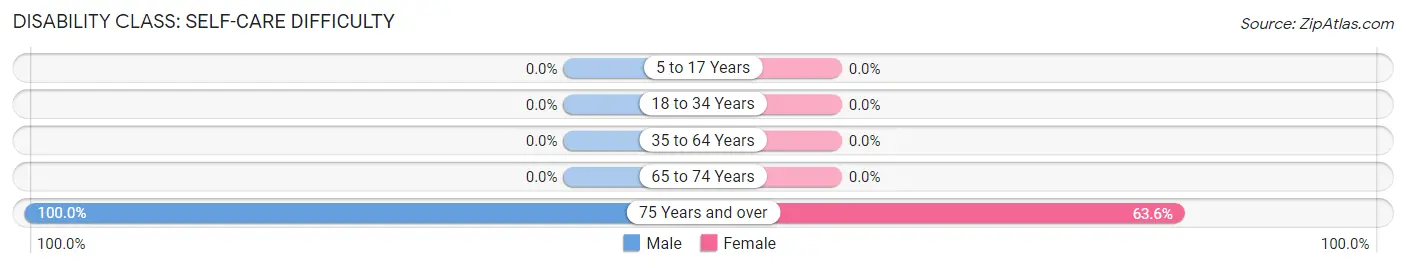
| Age Bracket | Male | Female |
| 5 to 17 Years | 0 (0.0%) | 0 (0.0%) |
| 18 to 34 Years | 0 (0.0%) | 0 (0.0%) |
| 35 to 64 Years | 0 (0.0%) | 0 (0.0%) |
| 65 to 74 Years | 0 (0.0%) | 0 (0.0%) |
| 75 Years and over | 1 (100.0%) | 7 (63.6%) |
Technology Access in Viola
Computing Device Access in Viola
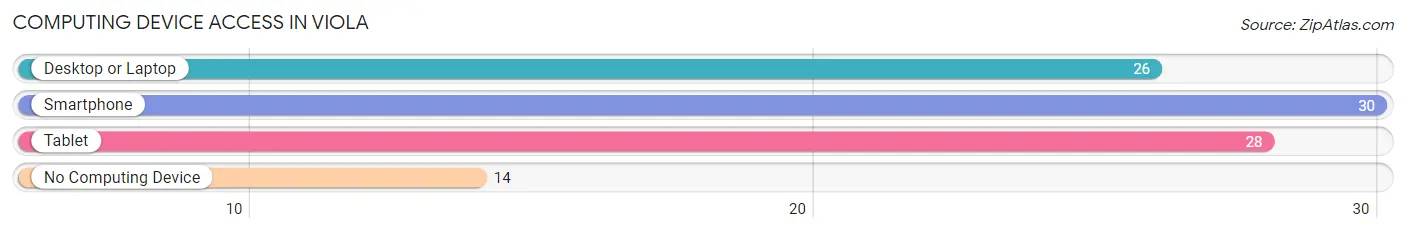
| Device Type | # Households | % Households |
| Desktop or Laptop | 26 | 54.2% |
| Smartphone | 30 | 62.5% |
| Tablet | 28 | 58.3% |
| No Computing Device | 14 | 29.2% |
| Total | 48 | 100.0% |
Internet Access in Viola
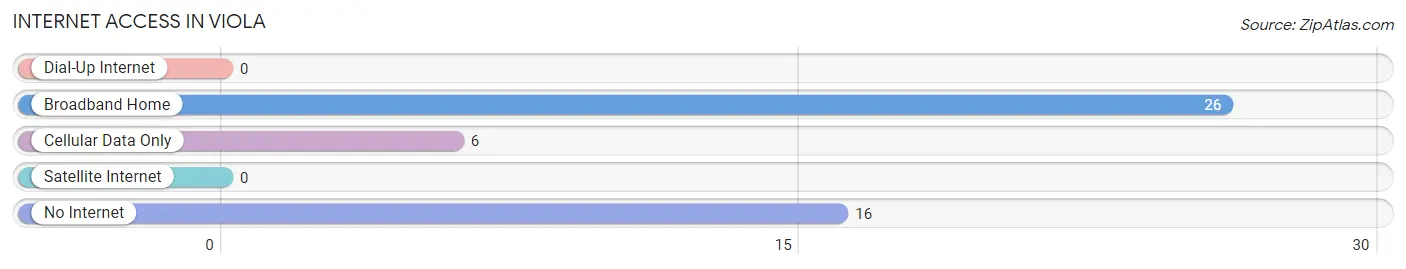
| Internet Type | # Households | % Households |
| Dial-Up Internet | 0 | 0.0% |
| Broadband Home | 26 | 54.2% |
| Cellular Data Only | 6 | 12.5% |
| Satellite Internet | 0 | 0.0% |
| No Internet | 16 | 33.3% |
| Total | 48 | 100.0% |
Viola Summary
Viola is a small town located in Franklin County, Tennessee. It is situated in the foothills of the Appalachian Mountains and is part of the Chattanooga metropolitan area. The town has a population of approximately 1,000 people and is known for its rural charm and friendly atmosphere.
History
Viola was founded in 1820 by a group of settlers from North Carolina. The town was named after the daughter of one of the settlers, who was named Viola. The town was originally a farming community, and the main crops grown were corn, wheat, and cotton. The town also had a few small businesses, such as a general store and a blacksmith shop.
In the late 19th century, the town began to grow and develop. The railroad came to Viola in 1887, and this allowed the town to become more connected to the outside world. The railroad also allowed for the development of a small manufacturing industry in the town.
Geography
Viola is located in the foothills of the Appalachian Mountains in Franklin County, Tennessee. The town is situated at an elevation of 1,000 feet above sea level. The town is surrounded by rolling hills and lush forests. The town is located near the Tennessee River, which provides a source of recreation for the town’s residents.
The climate in Viola is humid subtropical, with hot summers and mild winters. The average annual temperature is around 60 degrees Fahrenheit. The town receives an average of 45 inches of precipitation per year.
Economy
The economy of Viola is largely based on agriculture and manufacturing. The town is home to several small farms, which produce corn, wheat, and cotton. The town also has a few small manufacturing businesses, which produce a variety of products, such as furniture and clothing.
The town also has a few small retail businesses, such as convenience stores and restaurants. The town also has a few small service businesses, such as auto repair shops and hair salons.
Demographics
As of the 2010 census, the population of Viola was 1,000 people. The racial makeup of the town was 97.2% White, 0.7% African American, 0.3% Native American, 0.2% Asian, and 1.6% from other races. The median household income in Viola was $31,250, and the median family income was $37,500.
The town is served by the Franklin County School District, which includes two elementary schools, one middle school, and one high school. The town also has a few churches, including the First Baptist Church of Viola and the Viola United Methodist Church.
Viola is a small town with a rich history and a friendly atmosphere. The town is known for its rural charm and its close-knit community. The town is a great place to live and work, and it offers a variety of activities and amenities for its residents.
Common Questions
What is the Total Population of Viola?
Total Population of Viola is 105.
What is the Total Male Population of Viola?
Total Male Population of Viola is 47.
What is the Total Female Population of Viola?
Total Female Population of Viola is 58.
What is the Ratio of Males per 100 Females in Viola?
There are 81.03 Males per 100 Females in Viola.
What is the Ratio of Females per 100 Males in Viola?
There are 123.40 Females per 100 Males in Viola.
What is the Median Population Age in Viola?
Median Population Age in Viola is 70.1 Years.
What is the Average Family Size in Viola
Average Family Size in Viola is 2.5 People.
What is the Average Household Size in Viola
Average Household Size in Viola is 2.2 People.
What is Per Capita Income in Viola?
Per Capita income in Viola is $21,153.
What is the Median Family Income in Viola?
Median Family Income in Viola is $45,875.
What is the Median Household income in Viola?
Median Household Income in Viola is $44,688.
What is Income or Wage Gap in Viola?
Income or Wage Gap in Viola is 10.1%.
Women in Viola earn 89.9 cents for every dollar earned by a man.
What is Inequality or Gini Index in Viola?
Inequality or Gini Index in Viola is 0.31.
How Large is the Labor Force in Viola?
There are 29 People in the Labor Forcein in Viola.
What is the Percentage of People in the Labor Force in Viola?
33.7% of People are in the Labor Force in Viola.
What is the Unemployment Rate in Viola?
Unemployment Rate in Viola is 6.9%.