Bloomingdale, TN
Bloomingdale Map
Bloomingdale Overview
8,946
TOTAL POPULATION
4,538
MALE POPULATION
4,408
FEMALE POPULATION
102.95
MALES / 100 FEMALES
97.14
FEMALES / 100 MALES
41.0
MEDIAN AGE
3.2
AVG FAMILY SIZE
2.4
AVG HOUSEHOLD SIZE
$28,424
PER CAPITA INCOME
$59,460
AVG FAMILY INCOME
$48,981
AVG HOUSEHOLD INCOME
31.1%
WAGE / INCOME GAP [ % ]
68.9¢/ $1
WAGE / INCOME GAP [ $ ]
$14,700
FAMILY INCOME DEFICIT
0.47
INEQUALITY / GINI INDEX
4,050
LABOR FORCE [ PEOPLE ]
55.5%
PERCENT IN LABOR FORCE
4.6%
UNEMPLOYMENT RATE
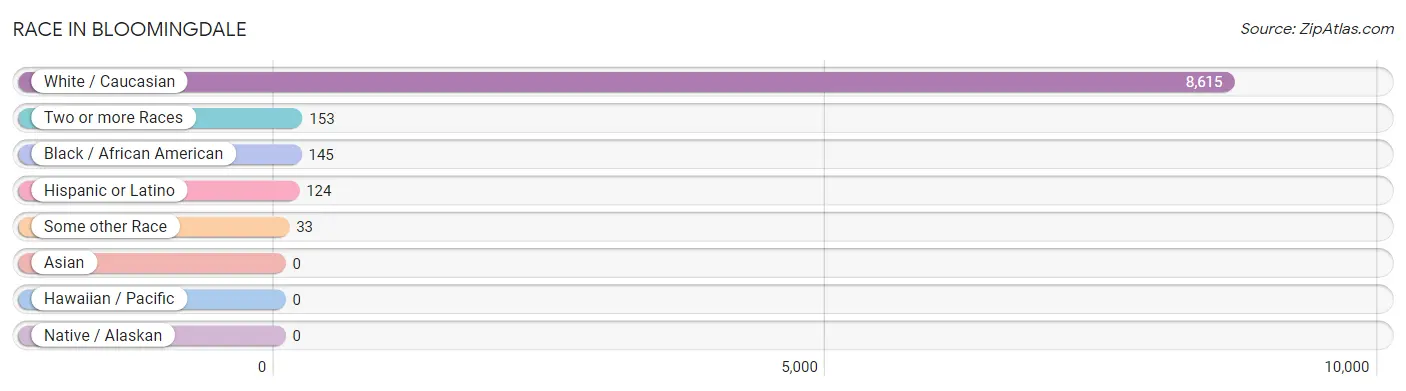
Race in Bloomingdale
The most populous races in Bloomingdale are White / Caucasian (8,615 | 96.3%), Two or more Races (153 | 1.7%), and Black / African American (145 | 1.6%).
| Race | # Population | % Population |
| Asian | 0 | 0.0% |
| Black / African American | 145 | 1.6% |
| Hawaiian / Pacific | 0 | 0.0% |
| Hispanic or Latino | 124 | 1.4% |
| Native / Alaskan | 0 | 0.0% |
| White / Caucasian | 8,615 | 96.3% |
| Two or more Races | 153 | 1.7% |
| Some other Race | 33 | 0.4% |
| Total | 8,946 | 100.0% |
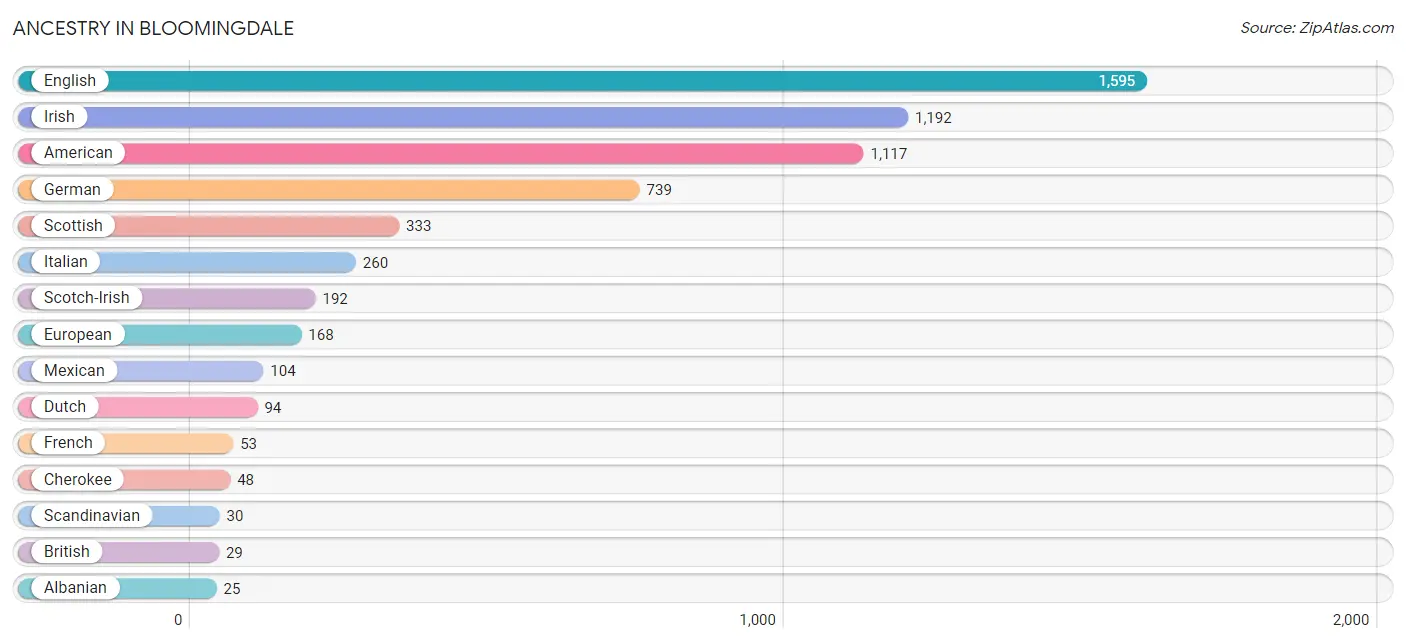
Ancestry in Bloomingdale
The most populous ancestries reported in Bloomingdale are English (1,595 | 17.8%), Irish (1,192 | 13.3%), American (1,117 | 12.5%), German (739 | 8.3%), and Scottish (333 | 3.7%), together accounting for 55.6% of all Bloomingdale residents.
| Ancestry | # Population | % Population |
| Albanian | 25 | 0.3% |
| American | 1,117 | 12.5% |
| Arab | 16 | 0.2% |
| Bhutanese | 16 | 0.2% |
| Blackfeet | 18 | 0.2% |
| British | 29 | 0.3% |
| Bulgarian | 3 | 0.0% |
| Cherokee | 48 | 0.5% |
| Croatian | 18 | 0.2% |
| Dutch | 94 | 1.1% |
| English | 1,595 | 17.8% |
| European | 168 | 1.9% |
| French | 53 | 0.6% |
| German | 739 | 8.3% |
| Inupiat | 4 | 0.0% |
| Irish | 1,192 | 13.3% |
| Italian | 260 | 2.9% |
| Lebanese | 16 | 0.2% |
| Mexican | 104 | 1.2% |
| Native Hawaiian | 13 | 0.2% |
| Norwegian | 23 | 0.3% |
| Polish | 7 | 0.1% |
| Puerto Rican | 16 | 0.2% |
| Scandinavian | 30 | 0.3% |
| Scotch-Irish | 192 | 2.1% |
| Scottish | 333 | 3.7% |
| Spaniard | 4 | 0.0% |
| Swedish | 6 | 0.1% |
| Welsh | 15 | 0.2% | View All 29 Rows |
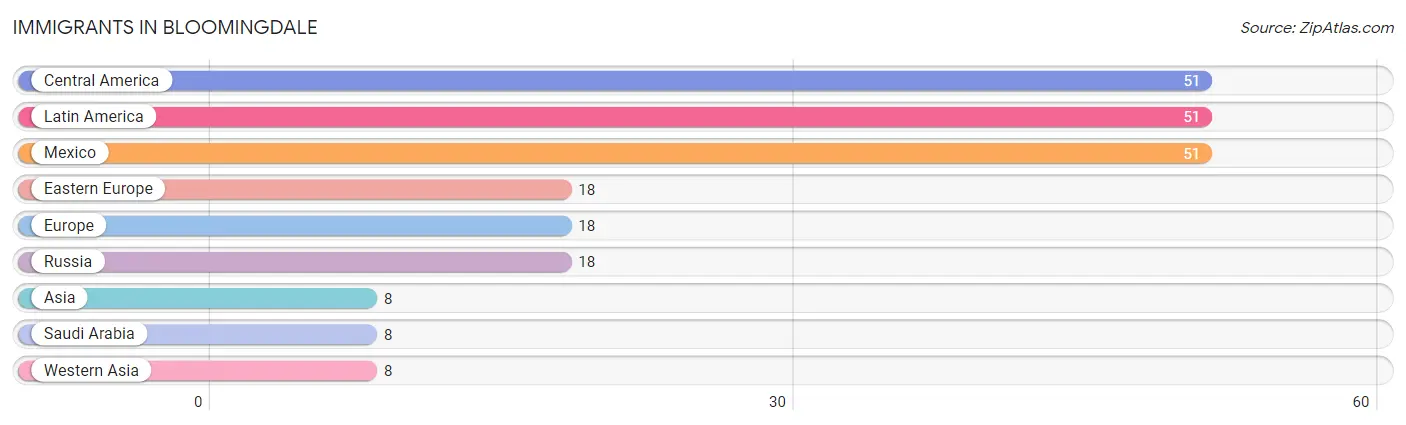
Immigrants in Bloomingdale
The most numerous immigrant groups reported in Bloomingdale came from Central America (51 | 0.6%), Latin America (51 | 0.6%), Mexico (51 | 0.6%), Eastern Europe (18 | 0.2%), and Europe (18 | 0.2%), together accounting for 2.1% of all Bloomingdale residents.
| Immigration Origin | # Population | % Population |
| Asia | 8 | 0.1% |
| Central America | 51 | 0.6% |
| Eastern Europe | 18 | 0.2% |
| Europe | 18 | 0.2% |
| Latin America | 51 | 0.6% |
| Mexico | 51 | 0.6% |
| Russia | 18 | 0.2% |
| Saudi Arabia | 8 | 0.1% |
| Western Asia | 8 | 0.1% | View All 9 Rows |
Sex and Age in Bloomingdale
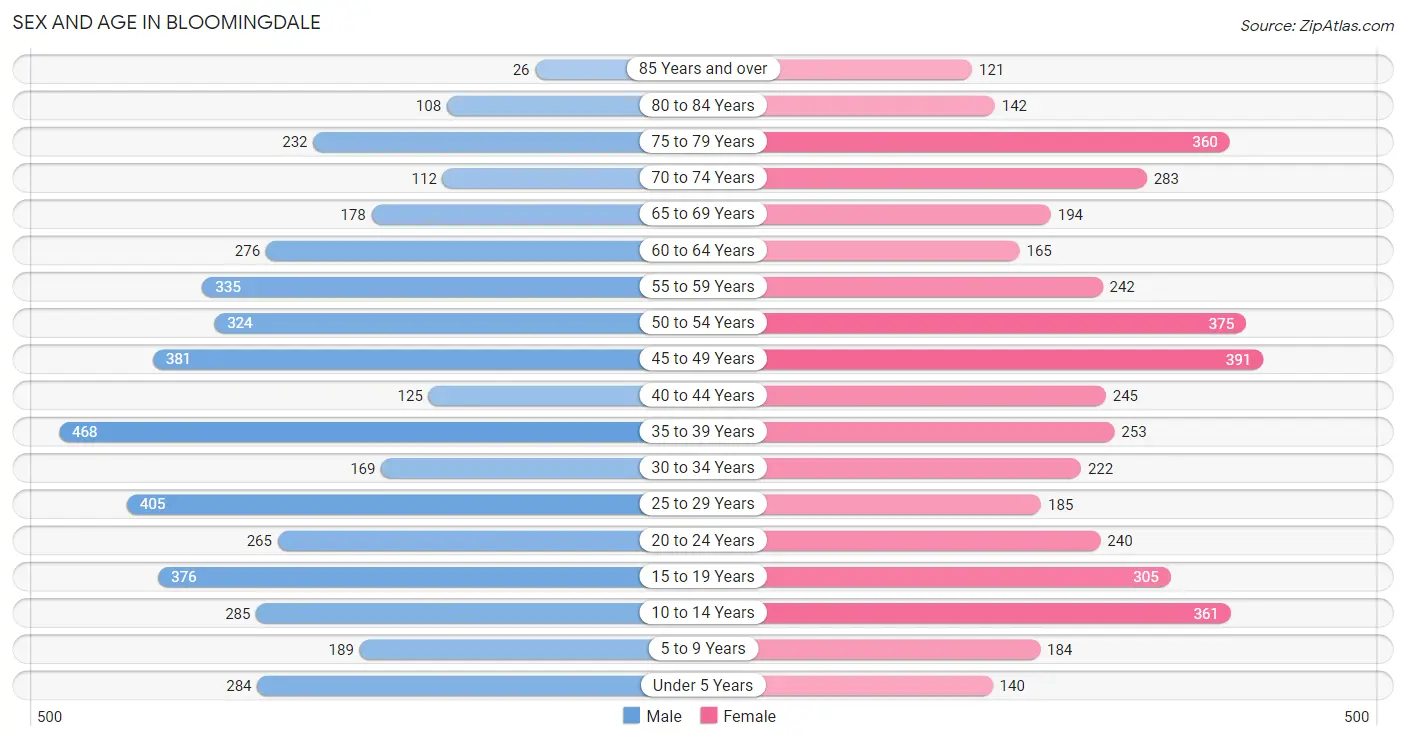
Sex and Age in Bloomingdale
The most populous age groups in Bloomingdale are 35 to 39 Years (468 | 10.3%) for men and 45 to 49 Years (391 | 8.9%) for women.
| Age Bracket | Male | Female |
| Under 5 Years | 284 (6.3%) | 140 (3.2%) |
| 5 to 9 Years | 189 (4.2%) | 184 (4.2%) |
| 10 to 14 Years | 285 (6.3%) | 361 (8.2%) |
| 15 to 19 Years | 376 (8.3%) | 305 (6.9%) |
| 20 to 24 Years | 265 (5.8%) | 240 (5.4%) |
| 25 to 29 Years | 405 (8.9%) | 185 (4.2%) |
| 30 to 34 Years | 169 (3.7%) | 222 (5.0%) |
| 35 to 39 Years | 468 (10.3%) | 253 (5.7%) |
| 40 to 44 Years | 125 (2.8%) | 245 (5.6%) |
| 45 to 49 Years | 381 (8.4%) | 391 (8.9%) |
| 50 to 54 Years | 324 (7.1%) | 375 (8.5%) |
| 55 to 59 Years | 335 (7.4%) | 242 (5.5%) |
| 60 to 64 Years | 276 (6.1%) | 165 (3.7%) |
| 65 to 69 Years | 178 (3.9%) | 194 (4.4%) |
| 70 to 74 Years | 112 (2.5%) | 283 (6.4%) |
| 75 to 79 Years | 232 (5.1%) | 360 (8.2%) |
| 80 to 84 Years | 108 (2.4%) | 142 (3.2%) |
| 85 Years and over | 26 (0.6%) | 121 (2.8%) |
| Total | 4,538 (100.0%) | 4,408 (100.0%) |
Families and Households in Bloomingdale
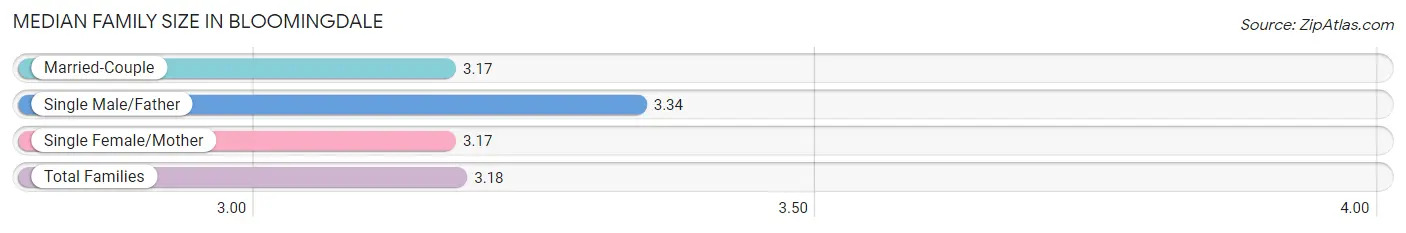
Median Family Size in Bloomingdale
The median family size in Bloomingdale is 3.18 persons per family, with single male/father families (161 | 7.5%) accounting for the largest median family size of 3.34 persons per family. On the other hand, married-couple families (1,422 | 66.1%) represent the smallest median family size with 3.17 persons per family.
| Family Type | # Families | Family Size |
| Married-Couple | 1,422 (66.1%) | 3.17 |
| Single Male/Father | 161 (7.5%) | 3.34 |
| Single Female/Mother | 568 (26.4%) | 3.17 |
| Total Families | 2,151 (100.0%) | 3.18 |
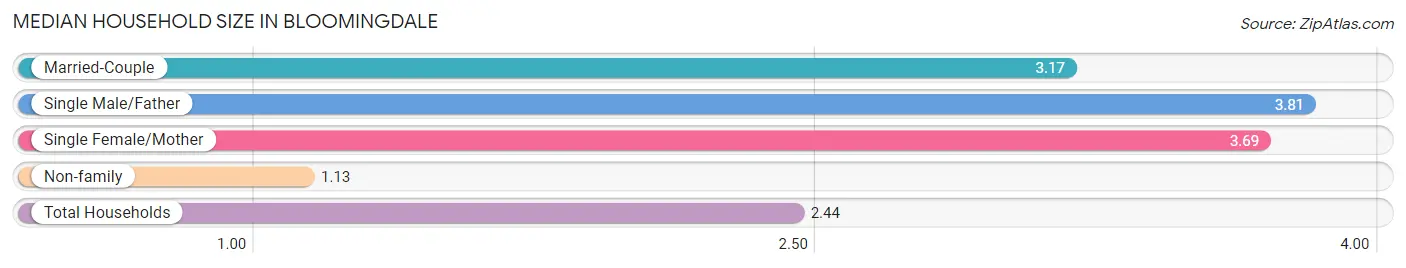
Median Household Size in Bloomingdale
The median household size in Bloomingdale is 2.44 persons per household, with single male/father households (161 | 4.4%) accounting for the largest median household size of 3.81 persons per household. non-family households (1,502 | 41.1%) represent the smallest median household size with 1.13 persons per household.
| Household Type | # Households | Household Size |
| Married-Couple | 1,422 (38.9%) | 3.17 |
| Single Male/Father | 161 (4.4%) | 3.81 |
| Single Female/Mother | 568 (15.5%) | 3.69 |
| Non-family | 1,502 (41.1%) | 1.13 |
| Total Households | 3,653 (100.0%) | 2.44 |
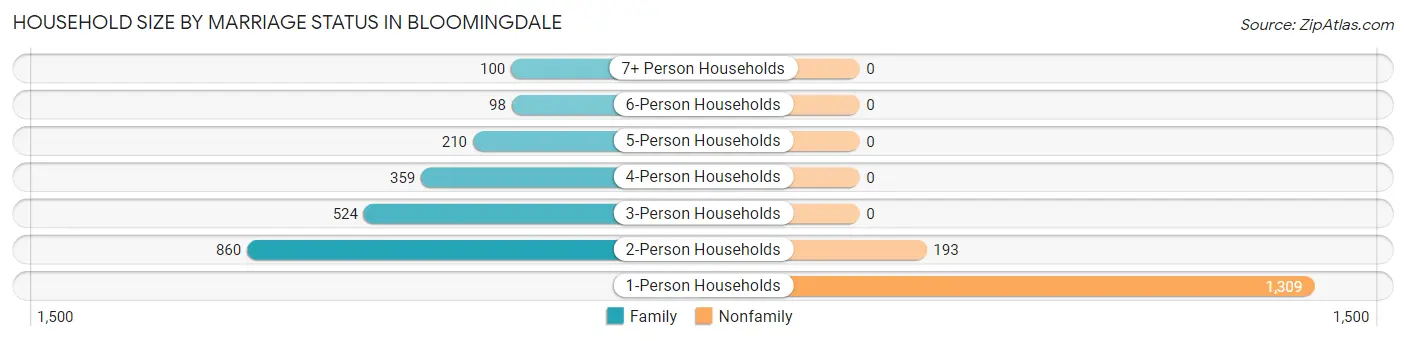
Household Size by Marriage Status in Bloomingdale
Out of a total of 3,653 households in Bloomingdale, 2,151 (58.9%) are family households, while 1,502 (41.1%) are nonfamily households. The most numerous type of family households are 2-person households, comprising 860, and the most common type of nonfamily households are 1-person households, comprising 1,309.
| Household Size | Family Households | Nonfamily Households |
| 1-Person Households | - | 1,309 (35.8%) |
| 2-Person Households | 860 (23.5%) | 193 (5.3%) |
| 3-Person Households | 524 (14.3%) | 0 (0.0%) |
| 4-Person Households | 359 (9.8%) | 0 (0.0%) |
| 5-Person Households | 210 (5.8%) | 0 (0.0%) |
| 6-Person Households | 98 (2.7%) | 0 (0.0%) |
| 7+ Person Households | 100 (2.7%) | 0 (0.0%) |
| Total | 2,151 (58.9%) | 1,502 (41.1%) |
Female Fertility in Bloomingdale
Fertility by Age in Bloomingdale
Average fertility rate in Bloomingdale is 59.0 births per 1,000 women. Women in the age bracket of 20 to 34 years have the highest fertility rate with 124.0 births per 1,000 women. Women in the age bracket of 20 to 34 years acount for 72.1% of all women with births.
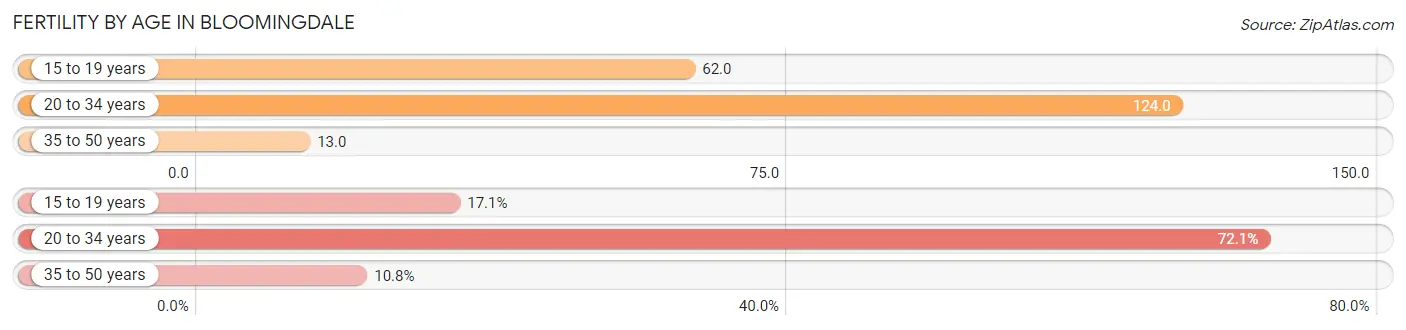
| Age Bracket | Women with Births | Births / 1,000 Women |
| 15 to 19 years | 19 (17.1%) | 62.0 |
| 20 to 34 years | 80 (72.1%) | 124.0 |
| 35 to 50 years | 12 (10.8%) | 13.0 |
| Total | 111 (100.0%) | 59.0 |
Fertility by Age by Marriage Status in Bloomingdale
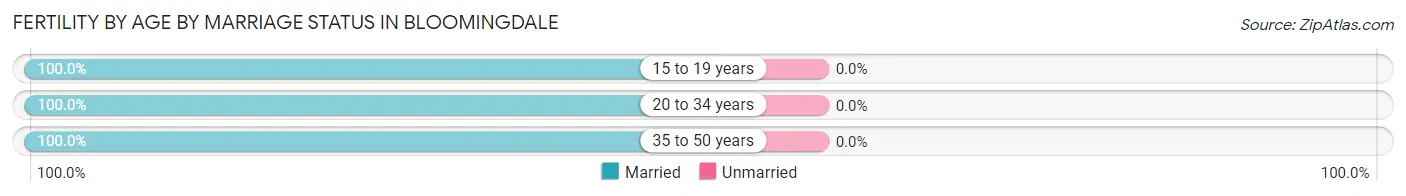
| Age Bracket | Married | Unmarried |
| 15 to 19 years | 19 (100.0%) | 0 (0.0%) |
| 20 to 34 years | 80 (100.0%) | 0 (0.0%) |
| 35 to 50 years | 12 (100.0%) | 0 (0.0%) |
| Total | 111 (100.0%) | 0 (0.0%) |
Fertility by Education in Bloomingdale
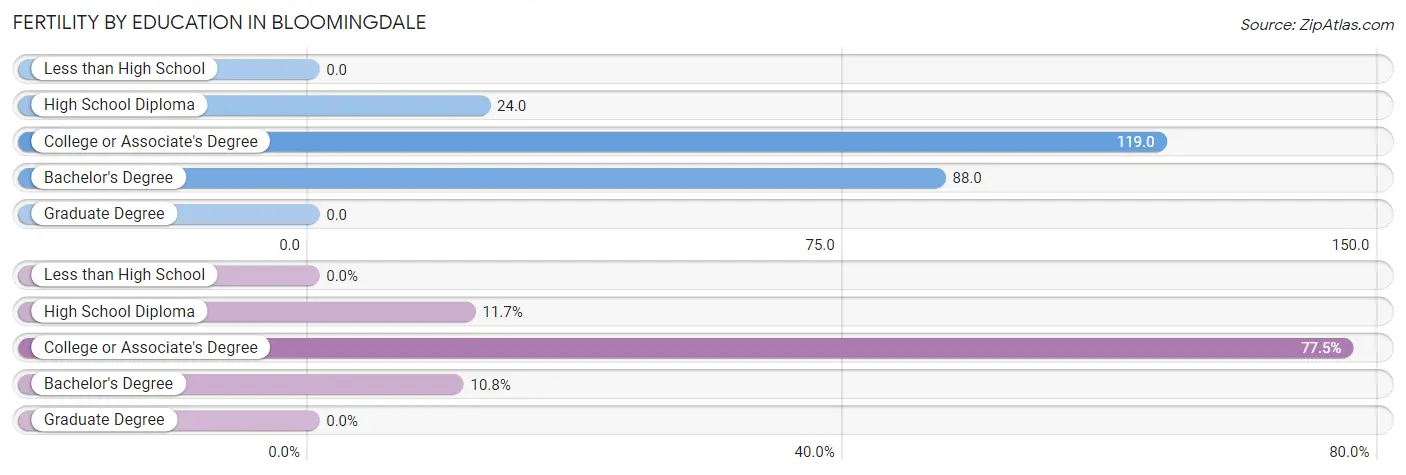
| Educational Attainment | Women with Births | Births / 1,000 Women |
| Less than High School | 0 (0.0%) | 0.0 |
| High School Diploma | 13 (11.7%) | 24.0 |
| College or Associate's Degree | 86 (77.5%) | 119.0 |
| Bachelor's Degree | 12 (10.8%) | 88.0 |
| Graduate Degree | 0 (0.0%) | 0.0 |
| Total | 111 (100.0%) | 59.0 |
Fertility by Education by Marriage Status in Bloomingdale
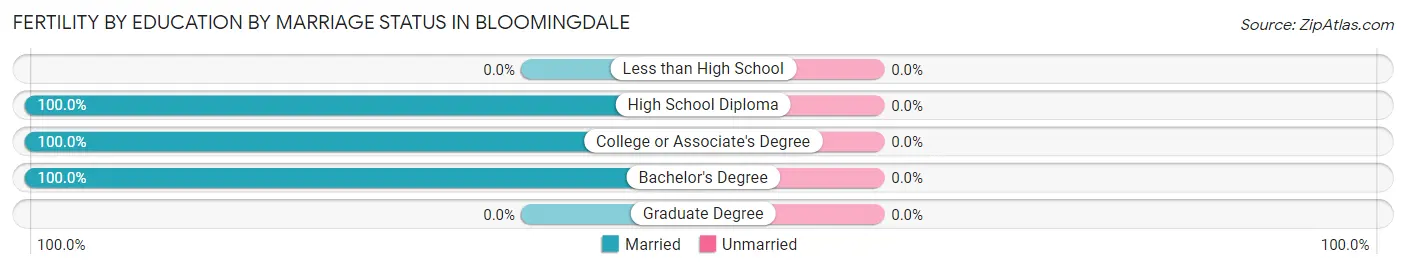
| Educational Attainment | Married | Unmarried |
| Less than High School | 0 (0.0%) | 0 (0.0%) |
| High School Diploma | 13 (100.0%) | 0 (0.0%) |
| College or Associate's Degree | 86 (100.0%) | 0 (0.0%) |
| Bachelor's Degree | 12 (100.0%) | 0 (0.0%) |
| Graduate Degree | 0 (0.0%) | 0 (0.0%) |
| Total | 111 (100.0%) | 0 (0.0%) |
Income in Bloomingdale
Income Overview in Bloomingdale
Per Capita Income in Bloomingdale is $28,424, while median incomes of families and households are $59,460 and $48,981 respectively.
| Characteristic | Number | Measure |
| Per Capita Income | 8,946 | $28,424 |
| Median Family Income | 2,151 | $59,460 |
| Mean Family Income | 2,151 | $70,937 |
| Median Household Income | 3,653 | $48,981 |
| Mean Household Income | 3,653 | $67,133 |
| Income Deficit | 2,151 | $14,700 |
| Wage / Income Gap (%) | 8,946 | 31.13% |
| Wage / Income Gap ($) | 8,946 | 68.87¢ per $1 |
| Gini / Inequality Index | 8,946 | 0.47 |
Earnings by Sex in Bloomingdale
Average Earnings in Bloomingdale are $33,179, $40,037 for men and $27,573 for women, a difference of 31.1%.
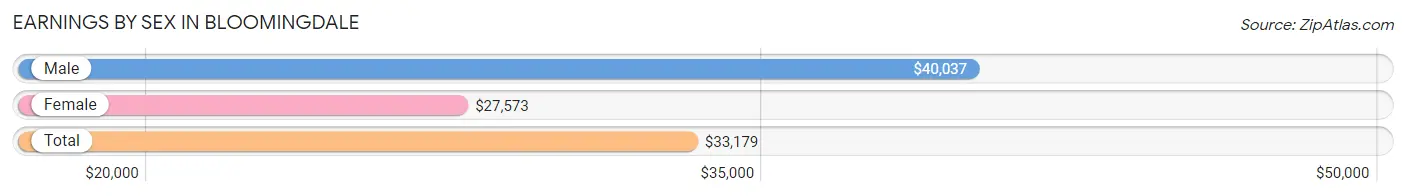
| Sex | Number | Average Earnings |
| Male | 2,443 (57.4%) | $40,037 |
| Female | 1,816 (42.6%) | $27,573 |
| Total | 4,259 (100.0%) | $33,179 |
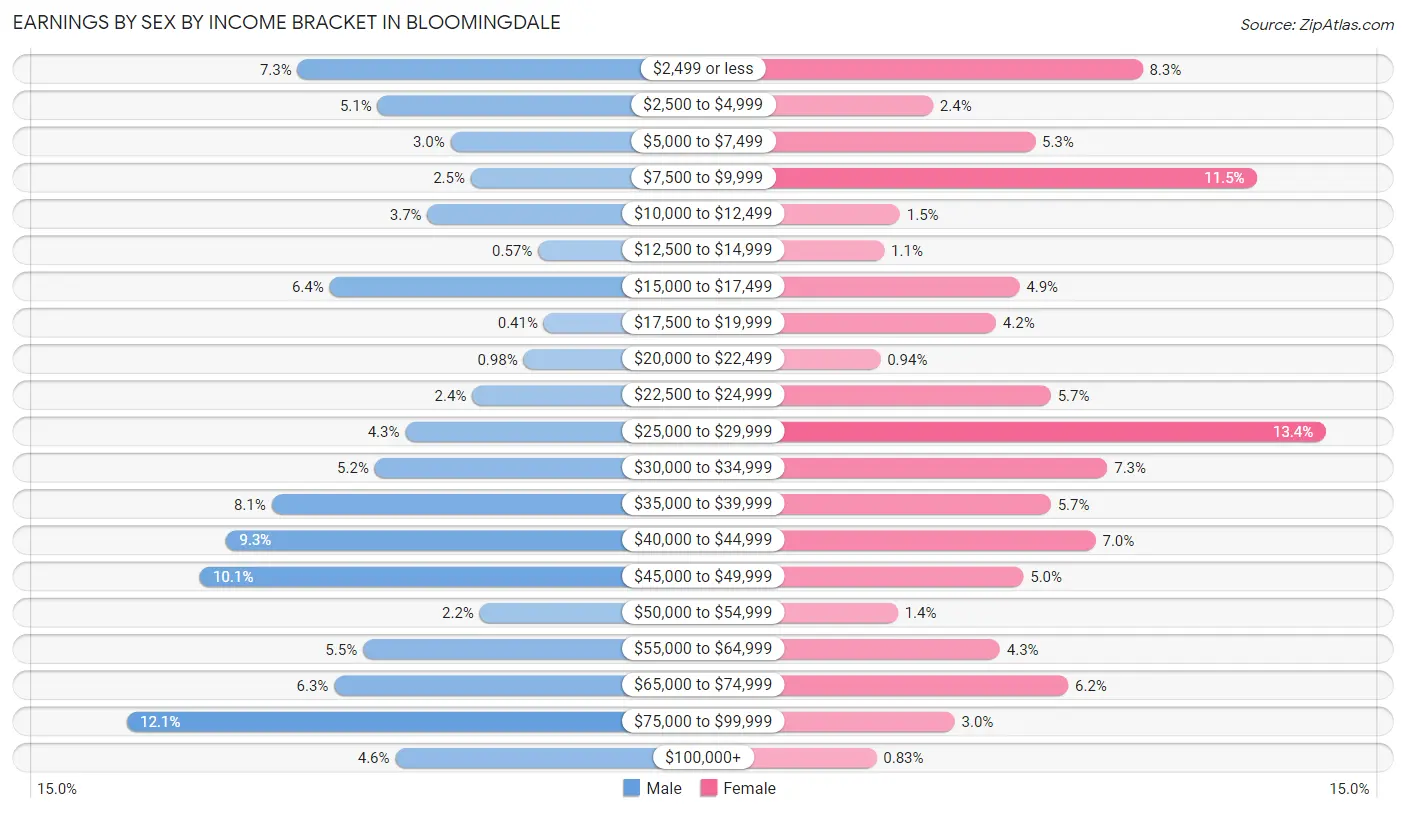
Earnings by Sex by Income Bracket in Bloomingdale
The most common earnings brackets in Bloomingdale are $75,000 to $99,999 for men (296 | 12.1%) and $25,000 to $29,999 for women (244 | 13.4%).
| Income | Male | Female |
| $2,499 or less | 179 (7.3%) | 151 (8.3%) |
| $2,500 to $4,999 | 124 (5.1%) | 44 (2.4%) |
| $5,000 to $7,499 | 74 (3.0%) | 96 (5.3%) |
| $7,500 to $9,999 | 60 (2.5%) | 209 (11.5%) |
| $10,000 to $12,499 | 90 (3.7%) | 27 (1.5%) |
| $12,500 to $14,999 | 14 (0.6%) | 19 (1.1%) |
| $15,000 to $17,499 | 157 (6.4%) | 88 (4.9%) |
| $17,500 to $19,999 | 10 (0.4%) | 76 (4.2%) |
| $20,000 to $22,499 | 24 (1.0%) | 17 (0.9%) |
| $22,500 to $24,999 | 59 (2.4%) | 104 (5.7%) |
| $25,000 to $29,999 | 105 (4.3%) | 244 (13.4%) |
| $30,000 to $34,999 | 126 (5.2%) | 133 (7.3%) |
| $35,000 to $39,999 | 197 (8.1%) | 104 (5.7%) |
| $40,000 to $44,999 | 228 (9.3%) | 127 (7.0%) |
| $45,000 to $49,999 | 246 (10.1%) | 90 (5.0%) |
| $50,000 to $54,999 | 54 (2.2%) | 26 (1.4%) |
| $55,000 to $64,999 | 134 (5.5%) | 78 (4.3%) |
| $65,000 to $74,999 | 154 (6.3%) | 113 (6.2%) |
| $75,000 to $99,999 | 296 (12.1%) | 55 (3.0%) |
| $100,000+ | 112 (4.6%) | 15 (0.8%) |
| Total | 2,443 (100.0%) | 1,816 (100.0%) |
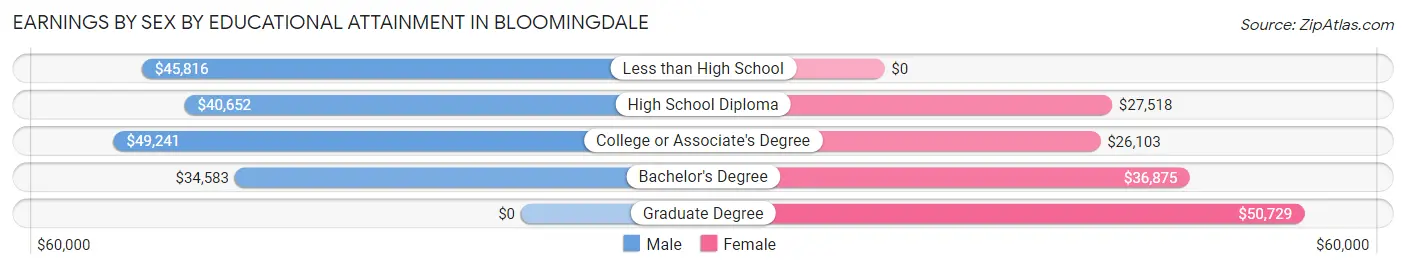
Earnings by Sex by Educational Attainment in Bloomingdale
Average earnings in Bloomingdale are $42,492 for men and $28,299 for women, a difference of 33.4%. Men with an educational attainment of college or associate's degree enjoy the highest average annual earnings of $49,241, while those with bachelor's degree education earn the least with $34,583. Women with an educational attainment of graduate degree earn the most with the average annual earnings of $50,729, while those with college or associate's degree education have the smallest earnings of $26,103.
| Educational Attainment | Male Income | Female Income |
| Less than High School | $45,816 | $0 |
| High School Diploma | $40,652 | $27,518 |
| College or Associate's Degree | $49,241 | $26,103 |
| Bachelor's Degree | $34,583 | $36,875 |
| Graduate Degree | - | - |
| Total | $42,492 | $28,299 |
Family Income in Bloomingdale
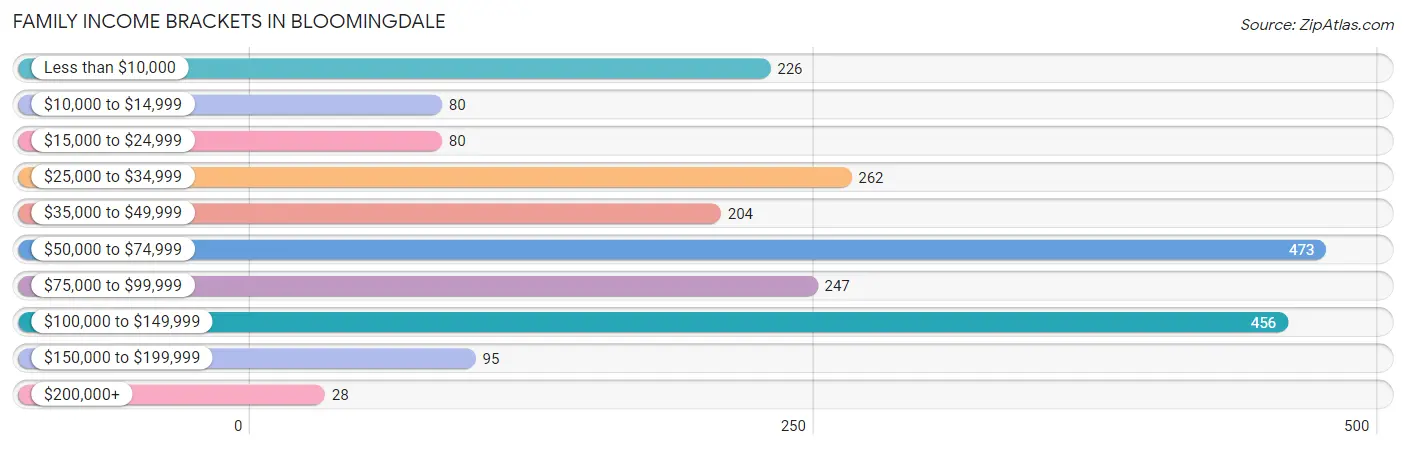
Family Income Brackets in Bloomingdale
According to the Bloomingdale family income data, there are 473 families falling into the $50,000 to $74,999 income range, which is the most common income bracket and makes up 22.0% of all families. Conversely, the $200,000+ income bracket is the least frequent group with only 28 families (1.3%) belonging to this category.
| Income Bracket | # Families | % Families |
| Less than $10,000 | 226 | 10.5% |
| $10,000 to $14,999 | 80 | 3.7% |
| $15,000 to $24,999 | 80 | 3.7% |
| $25,000 to $34,999 | 262 | 12.2% |
| $35,000 to $49,999 | 204 | 9.5% |
| $50,000 to $74,999 | 473 | 22.0% |
| $75,000 to $99,999 | 247 | 11.5% |
| $100,000 to $149,999 | 456 | 21.2% |
| $150,000 to $199,999 | 95 | 4.4% |
| $200,000+ | 28 | 1.3% |
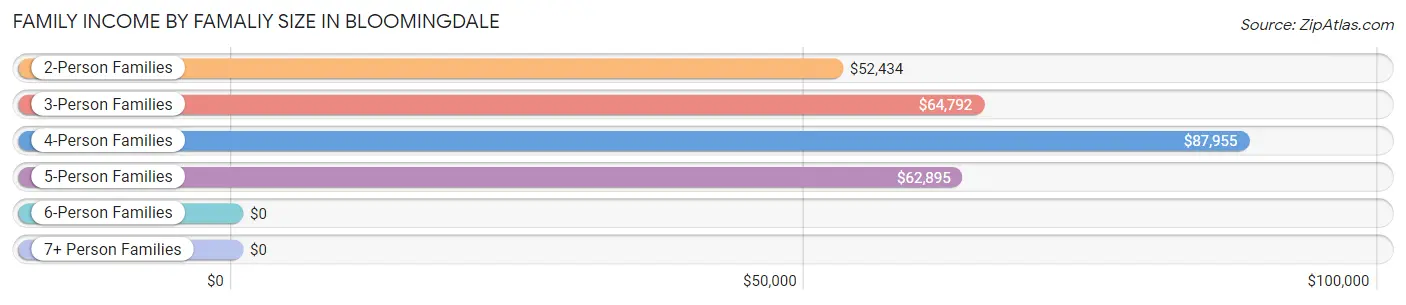
Family Income by Famaliy Size in Bloomingdale
4-person families (326 | 15.2%) account for the highest median family income in Bloomingdale with $87,955 per family, while 2-person families (970 | 45.1%) have the highest median income of $26,217 per family member.
| Income Bracket | # Families | Median Income |
| 2-Person Families | 970 (45.1%) | $52,434 |
| 3-Person Families | 467 (21.7%) | $64,792 |
| 4-Person Families | 326 (15.2%) | $87,955 |
| 5-Person Families | 254 (11.8%) | $62,895 |
| 6-Person Families | 121 (5.6%) | $0 |
| 7+ Person Families | 13 (0.6%) | $0 |
| Total | 2,151 (100.0%) | $59,460 |
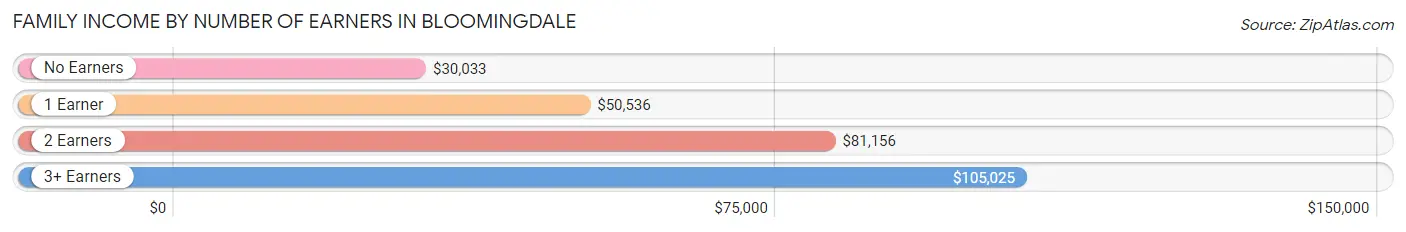
Family Income by Number of Earners in Bloomingdale
The median family income in Bloomingdale is $59,460, with families comprising 3+ earners (215) having the highest median family income of $105,025, while families with no earners (373) have the lowest median family income of $30,033, accounting for 10.0% and 17.3% of families, respectively.
| Number of Earners | # Families | Median Income |
| No Earners | 373 (17.3%) | $30,033 |
| 1 Earner | 836 (38.9%) | $50,536 |
| 2 Earners | 727 (33.8%) | $81,156 |
| 3+ Earners | 215 (10.0%) | $105,025 |
| Total | 2,151 (100.0%) | $59,460 |
Household Income in Bloomingdale
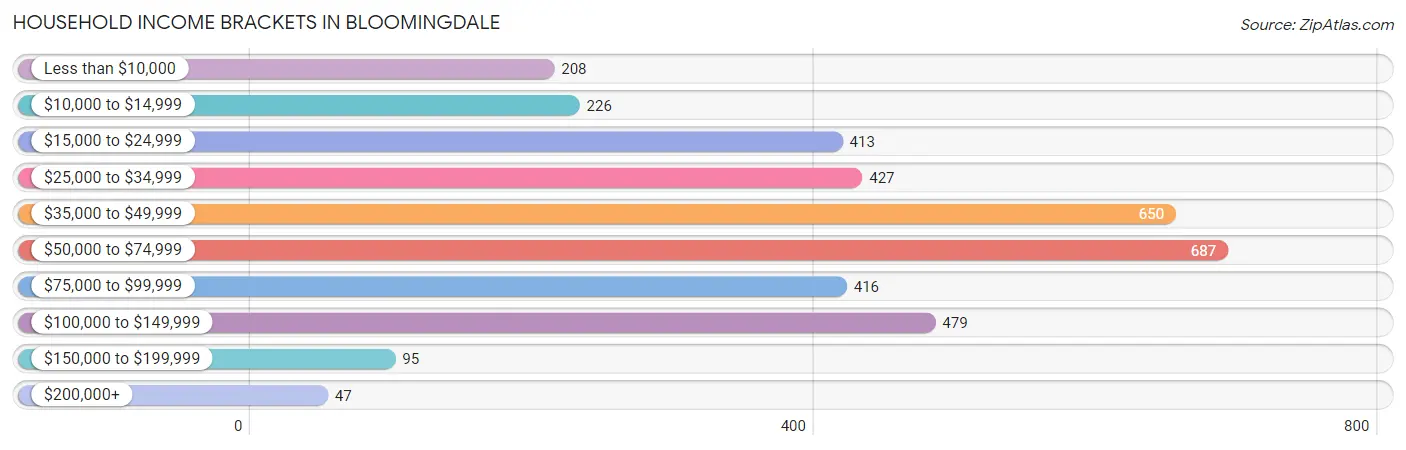
Household Income Brackets in Bloomingdale
With 687 households falling in the category, the $50,000 to $74,999 income range is the most frequent in Bloomingdale, accounting for 18.8% of all households. In contrast, only 47 households (1.3%) fall into the $200,000+ income bracket, making it the least populous group.
| Income Bracket | # Households | % Households |
| Less than $10,000 | 208 | 5.7% |
| $10,000 to $14,999 | 226 | 6.2% |
| $15,000 to $24,999 | 413 | 11.3% |
| $25,000 to $34,999 | 427 | 11.7% |
| $35,000 to $49,999 | 650 | 17.8% |
| $50,000 to $74,999 | 687 | 18.8% |
| $75,000 to $99,999 | 416 | 11.4% |
| $100,000 to $149,999 | 479 | 13.1% |
| $150,000 to $199,999 | 95 | 2.6% |
| $200,000+ | 47 | 1.3% |
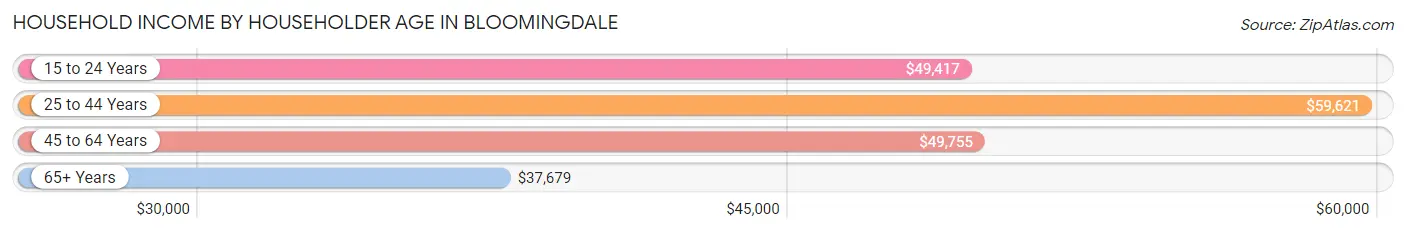
Household Income by Householder Age in Bloomingdale
The median household income in Bloomingdale is $48,981, with the highest median household income of $59,621 found in the 25 to 44 years age bracket for the primary householder. A total of 965 households (26.4%) fall into this category. Meanwhile, the 65+ years age bracket for the primary householder has the lowest median household income of $37,679, with 1,204 households (33.0%) in this group.
| Income Bracket | # Households | Median Income |
| 15 to 24 Years | 72 (2.0%) | $49,417 |
| 25 to 44 Years | 965 (26.4%) | $59,621 |
| 45 to 64 Years | 1,412 (38.7%) | $49,755 |
| 65+ Years | 1,204 (33.0%) | $37,679 |
| Total | 3,653 (100.0%) | $48,981 |
Poverty in Bloomingdale
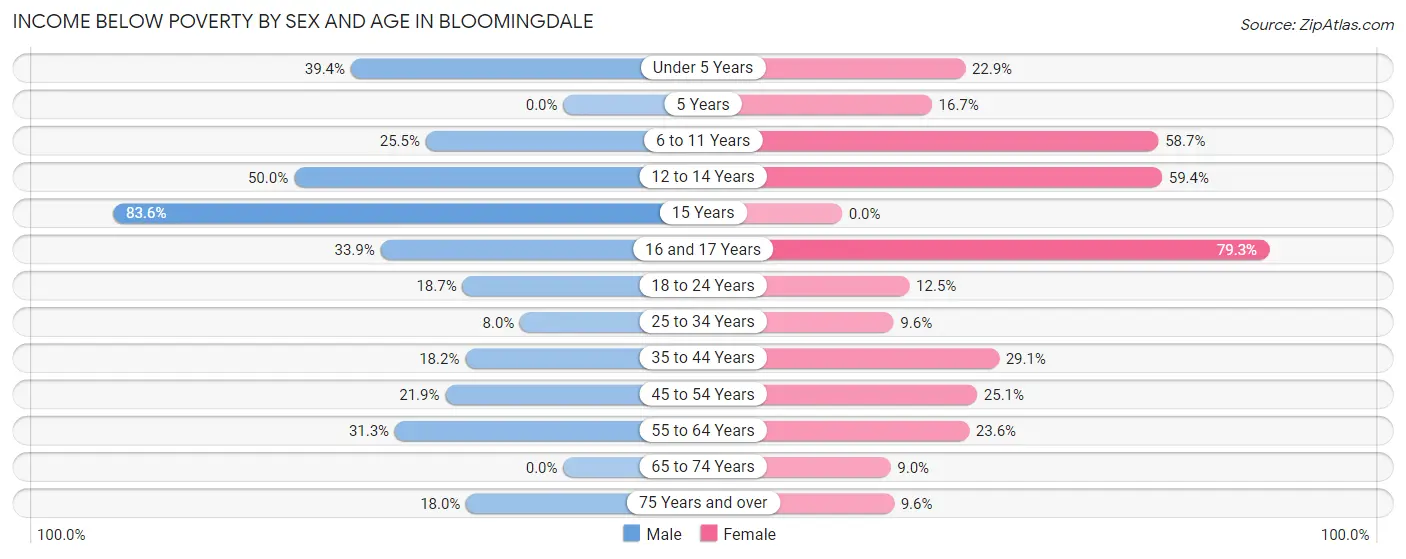
Income Below Poverty by Sex and Age in Bloomingdale
With 22.3% poverty level for males and 23.7% for females among the residents of Bloomingdale, 15 year old males and 16 and 17 year old females are the most vulnerable to poverty, with 56 males (83.6%) and 88 females (79.3%) in their respective age groups living below the poverty level.
| Age Bracket | Male | Female |
| Under 5 Years | 112 (39.4%) | 32 (22.9%) |
| 5 Years | 0 (0.0%) | 1 (16.7%) |
| 6 to 11 Years | 97 (25.5%) | 131 (58.7%) |
| 12 to 14 Years | 47 (50.0%) | 177 (59.4%) |
| 15 Years | 56 (83.6%) | 0 (0.0%) |
| 16 and 17 Years | 57 (33.9%) | 88 (79.3%) |
| 18 to 24 Years | 76 (18.7%) | 37 (12.5%) |
| 25 to 34 Years | 46 (8.0%) | 39 (9.6%) |
| 35 to 44 Years | 108 (18.2%) | 145 (29.1%) |
| 45 to 54 Years | 147 (21.9%) | 192 (25.1%) |
| 55 to 64 Years | 191 (31.3%) | 96 (23.6%) |
| 65 to 74 Years | 0 (0.0%) | 43 (9.0%) |
| 75 Years and over | 66 (18.0%) | 60 (9.6%) |
| Total | 1,003 (22.3%) | 1,041 (23.7%) |
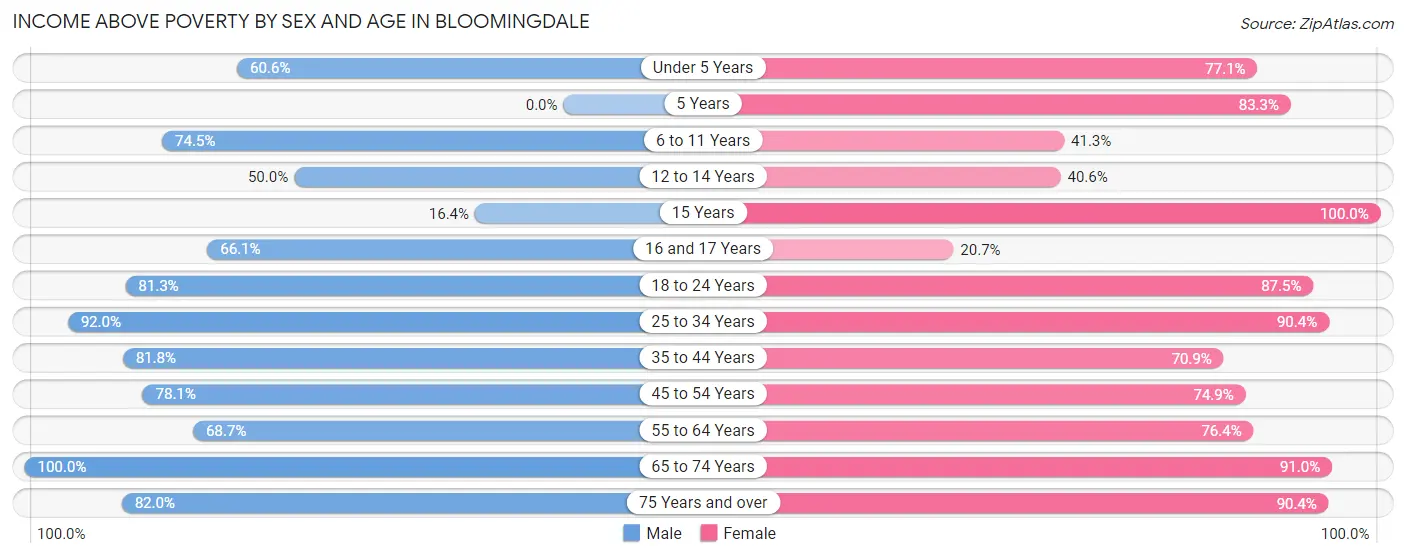
Income Above Poverty by Sex and Age in Bloomingdale
According to the poverty statistics in Bloomingdale, males aged 65 to 74 years and females aged 15 years are the age groups that are most secure financially, with 100.0% of males and 100.0% of females in these age groups living above the poverty line.
| Age Bracket | Male | Female |
| Under 5 Years | 172 (60.6%) | 108 (77.1%) |
| 5 Years | 0 (0.0%) | 5 (83.3%) |
| 6 to 11 Years | 283 (74.5%) | 92 (41.3%) |
| 12 to 14 Years | 47 (50.0%) | 121 (40.6%) |
| 15 Years | 11 (16.4%) | 138 (100.0%) |
| 16 and 17 Years | 111 (66.1%) | 23 (20.7%) |
| 18 to 24 Years | 330 (81.3%) | 259 (87.5%) |
| 25 to 34 Years | 528 (92.0%) | 368 (90.4%) |
| 35 to 44 Years | 485 (81.8%) | 353 (70.9%) |
| 45 to 54 Years | 524 (78.1%) | 574 (74.9%) |
| 55 to 64 Years | 420 (68.7%) | 311 (76.4%) |
| 65 to 74 Years | 290 (100.0%) | 434 (91.0%) |
| 75 Years and over | 300 (82.0%) | 563 (90.4%) |
| Total | 3,501 (77.7%) | 3,349 (76.3%) |
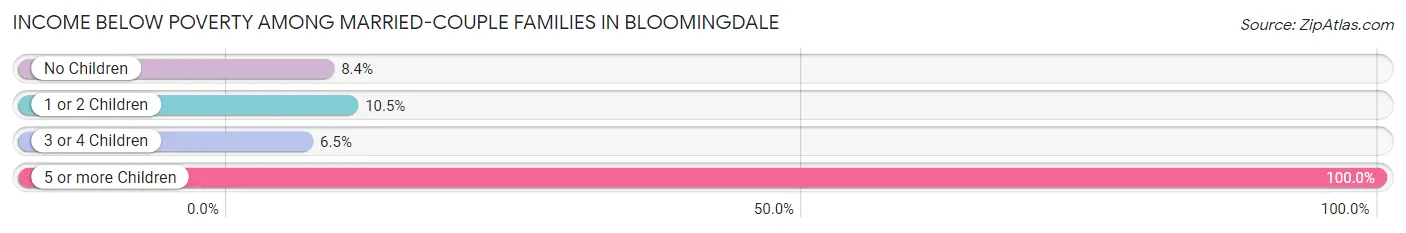
Income Below Poverty Among Married-Couple Families in Bloomingdale
The poverty statistics for married-couple families in Bloomingdale show that 9.0% or 128 of the total 1,422 families live below the poverty line. Families with 5 or more children have the highest poverty rate of 100.0%, comprising of 1 families. On the other hand, families with 3 or 4 children have the lowest poverty rate of 6.5%, which includes 7 families.
| Children | Above Poverty | Below Poverty |
| No Children | 766 (91.6%) | 70 (8.4%) |
| 1 or 2 Children | 428 (89.5%) | 50 (10.5%) |
| 3 or 4 Children | 100 (93.5%) | 7 (6.5%) |
| 5 or more Children | 0 (0.0%) | 1 (100.0%) |
| Total | 1,294 (91.0%) | 128 (9.0%) |
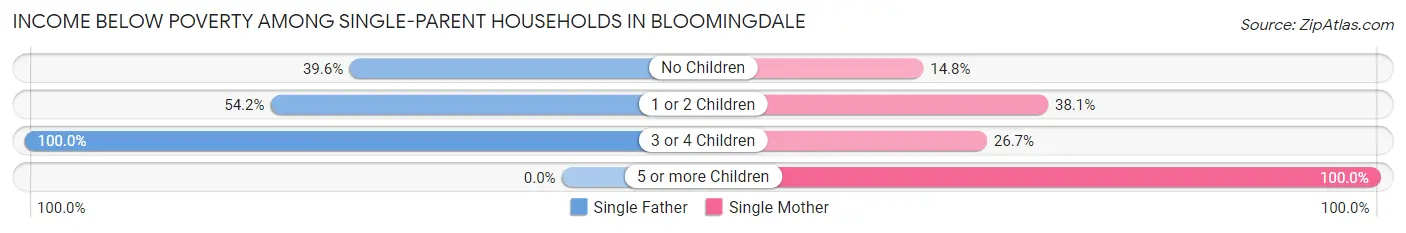
Income Below Poverty Among Single-Parent Households in Bloomingdale
According to the poverty data in Bloomingdale, 65.2% or 105 single-father households and 35.4% or 201 single-mother households are living below the poverty line. Among single-father households, those with 3 or 4 children have the highest poverty rate, with 54 households (100.0%) experiencing poverty. Likewise, among single-mother households, those with 5 or more children have the highest poverty rate, with 87 households (100.0%) falling below the poverty line.
| Children | Single Father | Single Mother |
| No Children | 19 (39.6%) | 43 (14.8%) |
| 1 or 2 Children | 32 (54.2%) | 67 (38.1%) |
| 3 or 4 Children | 54 (100.0%) | 4 (26.7%) |
| 5 or more Children | 0 (0.0%) | 87 (100.0%) |
| Total | 105 (65.2%) | 201 (35.4%) |
Income Below Poverty Among Married-Couple vs Single-Parent Households in Bloomingdale
The poverty data for Bloomingdale shows that 128 of the married-couple family households (9.0%) and 306 of the single-parent households (42.0%) are living below the poverty level. Within the married-couple family households, those with 5 or more children have the highest poverty rate, with 1 households (100.0%) falling below the poverty line. Among the single-parent households, those with 5 or more children have the highest poverty rate, with 87 household (100.0%) living below poverty.
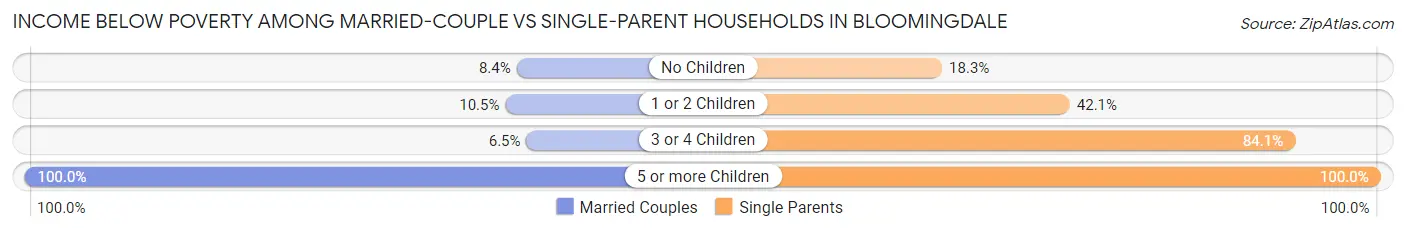
| Children | Married-Couple Families | Single-Parent Households |
| No Children | 70 (8.4%) | 62 (18.3%) |
| 1 or 2 Children | 50 (10.5%) | 99 (42.1%) |
| 3 or 4 Children | 7 (6.5%) | 58 (84.1%) |
| 5 or more Children | 1 (100.0%) | 87 (100.0%) |
| Total | 128 (9.0%) | 306 (42.0%) |
Employment Characteristics in Bloomingdale
Employment by Class of Employer in Bloomingdale
Among the 3,684 employed individuals in Bloomingdale, private company employees (2,927 | 79.4%), not-for-profit organizations (187 | 5.1%), and self-employed (not incorporated) (173 | 4.7%) make up the most common classes of employment.
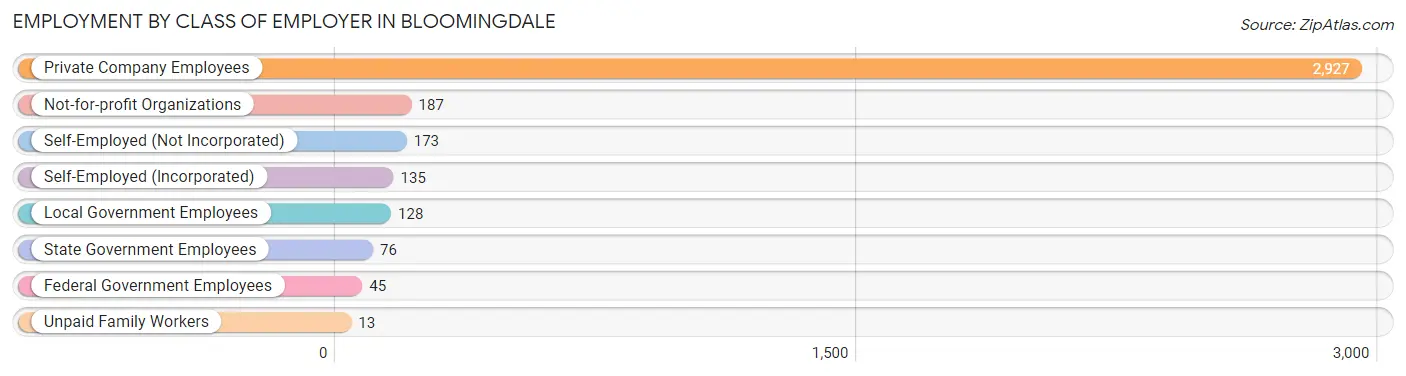
| Employer Class | # Employees | % Employees |
| Private Company Employees | 2,927 | 79.4% |
| Self-Employed (Incorporated) | 135 | 3.7% |
| Self-Employed (Not Incorporated) | 173 | 4.7% |
| Not-for-profit Organizations | 187 | 5.1% |
| Local Government Employees | 128 | 3.5% |
| State Government Employees | 76 | 2.1% |
| Federal Government Employees | 45 | 1.2% |
| Unpaid Family Workers | 13 | 0.4% |
| Total | 3,684 | 100.0% |
Employment Status by Age in Bloomingdale
According to the labor force statistics for Bloomingdale, out of the total population over 16 years of age (7,298), 55.5% or 4,050 individuals are in the labor force, with 4.6% or 186 of them unemployed. The age group with the highest labor force participation rate is 25 to 29 years, with 89.0% or 525 individuals in the labor force. Within the labor force, the 60 to 64 years age range has the highest percentage of unemployed individuals, with 15.8% or 32 of them being unemployed.
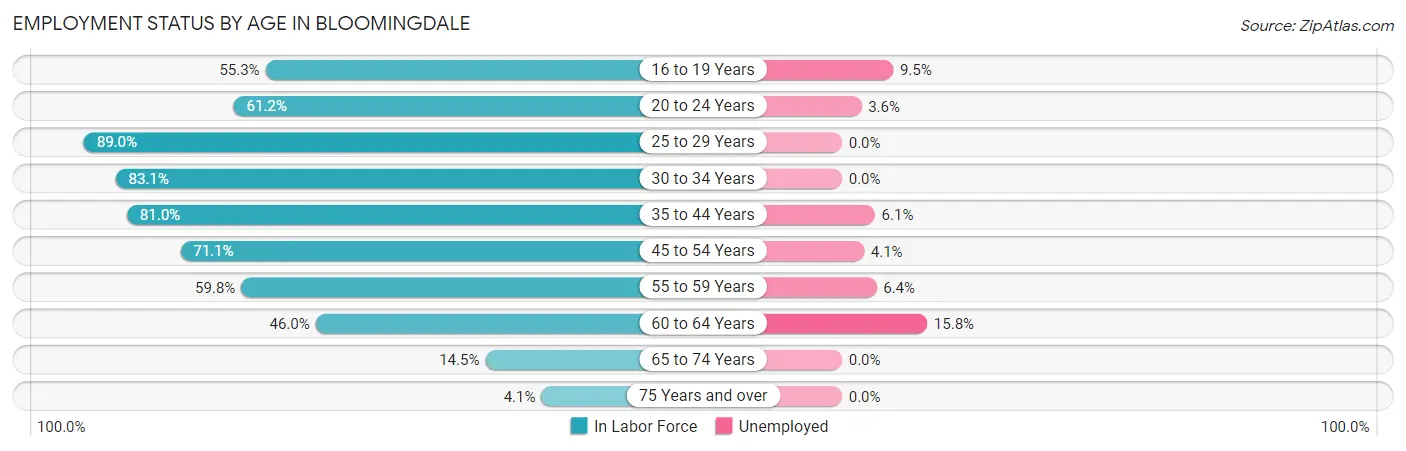
| Age Bracket | In Labor Force | Unemployed |
| 16 to 19 Years | 263 (55.3%) | 25 (9.5%) |
| 20 to 24 Years | 309 (61.2%) | 11 (3.6%) |
| 25 to 29 Years | 525 (89.0%) | 0 (0.0%) |
| 30 to 34 Years | 325 (83.1%) | 0 (0.0%) |
| 35 to 44 Years | 884 (81.0%) | 54 (6.1%) |
| 45 to 54 Years | 1,046 (71.1%) | 43 (4.1%) |
| 55 to 59 Years | 345 (59.8%) | 22 (6.4%) |
| 60 to 64 Years | 203 (46.0%) | 32 (15.8%) |
| 65 to 74 Years | 111 (14.5%) | 0 (0.0%) |
| 75 Years and over | 41 (4.1%) | 0 (0.0%) |
| Total | 4,050 (55.5%) | 186 (4.6%) |
Employment Status by Educational Attainment in Bloomingdale
According to labor force statistics for Bloomingdale, 73.0% of individuals (3,330) out of the total population between 25 and 64 years of age (4,561) are in the labor force, with 4.5% or 150 of them being unemployed. The group with the highest labor force participation rate are those with the educational attainment of college / associate degree, with 80.0% or 1,098 individuals in the labor force. Within the labor force, individuals with less than high school education have the highest percentage of unemployment, with 10.5% or 46 of them being unemployed.
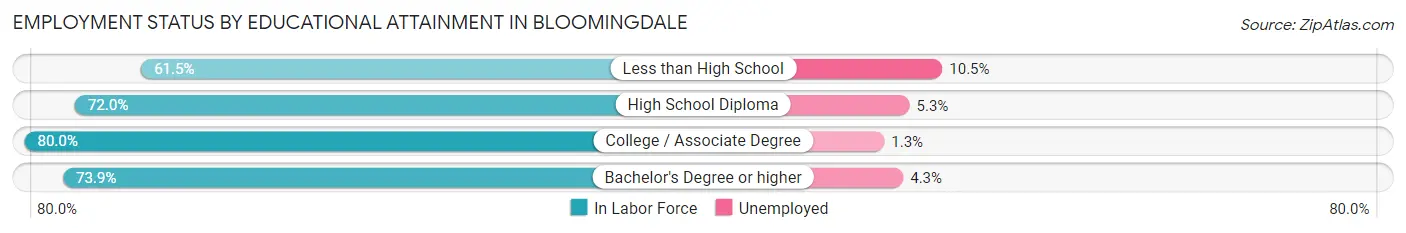
| Educational Attainment | In Labor Force | Unemployed |
| Less than High School | 439 (61.5%) | 75 (10.5%) |
| High School Diploma | 1,442 (72.0%) | 106 (5.3%) |
| College / Associate Degree | 1,098 (80.0%) | 18 (1.3%) |
| Bachelor's Degree or higher | 348 (73.9%) | 20 (4.3%) |
| Total | 3,330 (73.0%) | 205 (4.5%) |
Employment Occupations by Sex in Bloomingdale
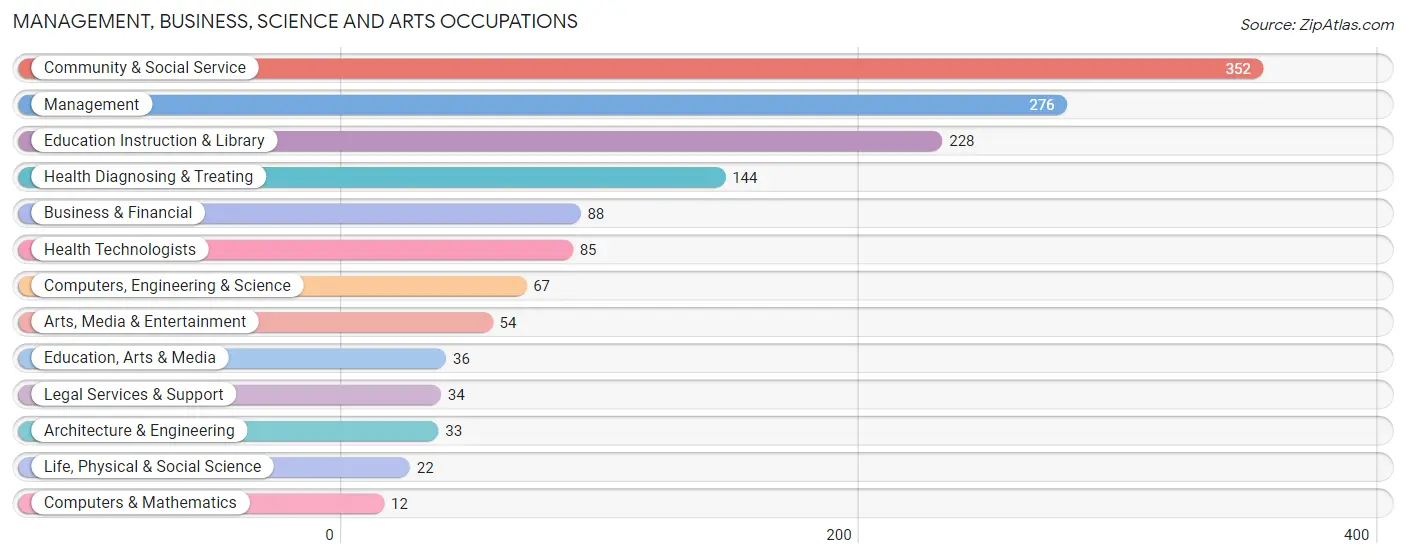
Management, Business, Science and Arts Occupations
The most common Management, Business, Science and Arts occupations in Bloomingdale are Community & Social Service (352 | 9.1%), Management (276 | 7.1%), Education Instruction & Library (228 | 5.9%), Health Diagnosing & Treating (144 | 3.7%), and Business & Financial (88 | 2.3%).
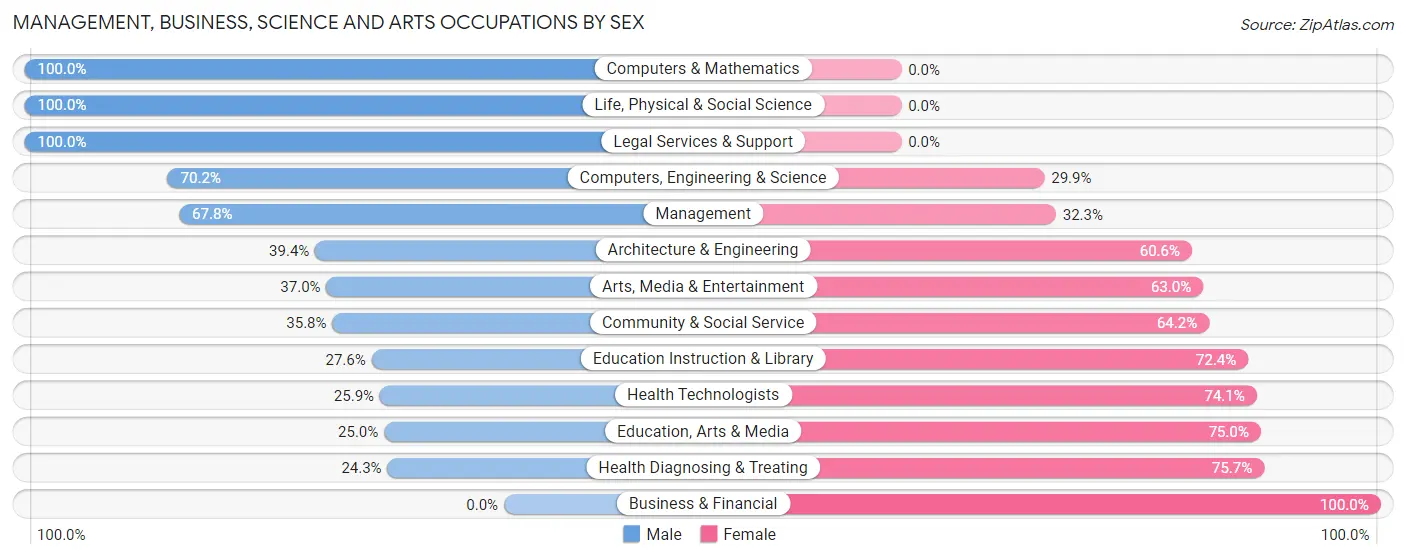
Management, Business, Science and Arts Occupations by Sex
Within the Management, Business, Science and Arts occupations in Bloomingdale, the most male-oriented occupations are Computers & Mathematics (100.0%), Life, Physical & Social Science (100.0%), and Legal Services & Support (100.0%), while the most female-oriented occupations are Business & Financial (100.0%), Health Diagnosing & Treating (75.7%), and Education, Arts & Media (75.0%).
| Occupation | Male | Female |
| Management | 187 (67.7%) | 89 (32.3%) |
| Business & Financial | 0 (0.0%) | 88 (100.0%) |
| Computers, Engineering & Science | 47 (70.2%) | 20 (29.8%) |
| Computers & Mathematics | 12 (100.0%) | 0 (0.0%) |
| Architecture & Engineering | 13 (39.4%) | 20 (60.6%) |
| Life, Physical & Social Science | 22 (100.0%) | 0 (0.0%) |
| Community & Social Service | 126 (35.8%) | 226 (64.2%) |
| Education, Arts & Media | 9 (25.0%) | 27 (75.0%) |
| Legal Services & Support | 34 (100.0%) | 0 (0.0%) |
| Education Instruction & Library | 63 (27.6%) | 165 (72.4%) |
| Arts, Media & Entertainment | 20 (37.0%) | 34 (63.0%) |
| Health Diagnosing & Treating | 35 (24.3%) | 109 (75.7%) |
| Health Technologists | 22 (25.9%) | 63 (74.1%) |
| Total (Category) | 395 (42.6%) | 532 (57.4%) |
| Total (Overall) | 2,188 (56.6%) | 1,677 (43.4%) |
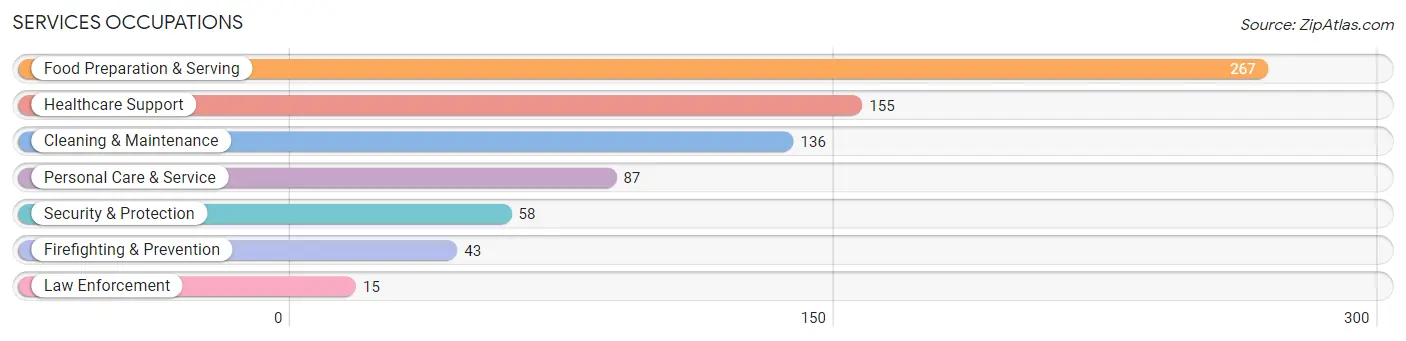
Services Occupations
The most common Services occupations in Bloomingdale are Food Preparation & Serving (267 | 6.9%), Healthcare Support (155 | 4.0%), Cleaning & Maintenance (136 | 3.5%), Personal Care & Service (87 | 2.2%), and Security & Protection (58 | 1.5%).
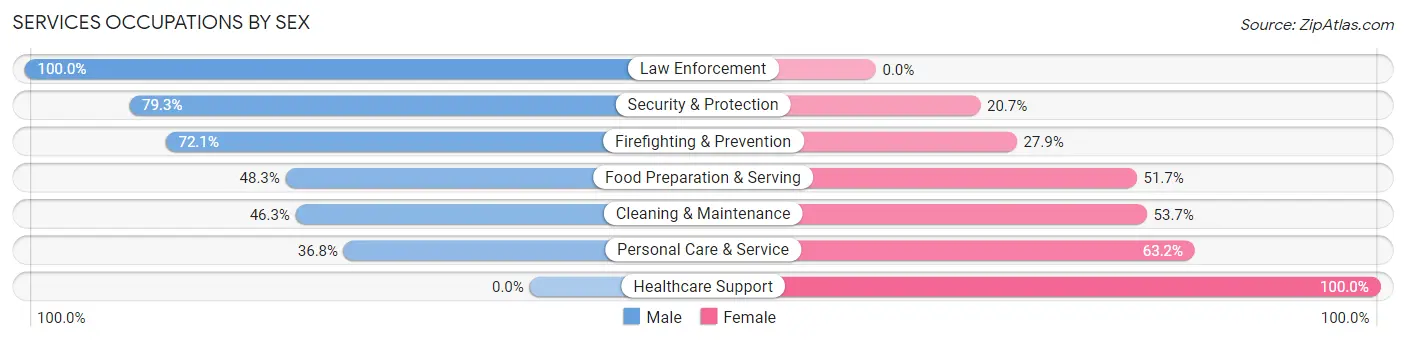
Services Occupations by Sex
Within the Services occupations in Bloomingdale, the most male-oriented occupations are Law Enforcement (100.0%), Security & Protection (79.3%), and Firefighting & Prevention (72.1%), while the most female-oriented occupations are Healthcare Support (100.0%), Personal Care & Service (63.2%), and Cleaning & Maintenance (53.7%).
| Occupation | Male | Female |
| Healthcare Support | 0 (0.0%) | 155 (100.0%) |
| Security & Protection | 46 (79.3%) | 12 (20.7%) |
| Firefighting & Prevention | 31 (72.1%) | 12 (27.9%) |
| Law Enforcement | 15 (100.0%) | 0 (0.0%) |
| Food Preparation & Serving | 129 (48.3%) | 138 (51.7%) |
| Cleaning & Maintenance | 63 (46.3%) | 73 (53.7%) |
| Personal Care & Service | 32 (36.8%) | 55 (63.2%) |
| Total (Category) | 270 (38.4%) | 433 (61.6%) |
| Total (Overall) | 2,188 (56.6%) | 1,677 (43.4%) |
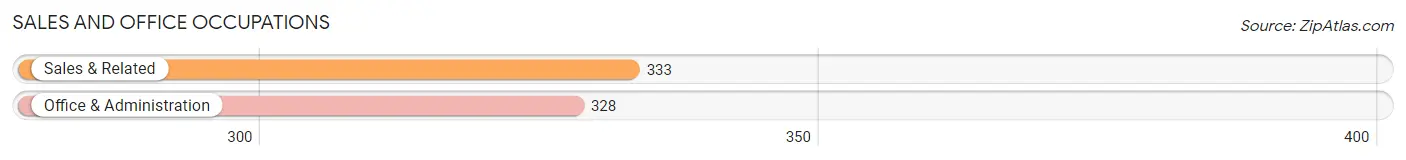
Sales and Office Occupations
The most common Sales and Office occupations in Bloomingdale are Sales & Related (333 | 8.6%), and Office & Administration (328 | 8.5%).
Sales and Office Occupations by Sex
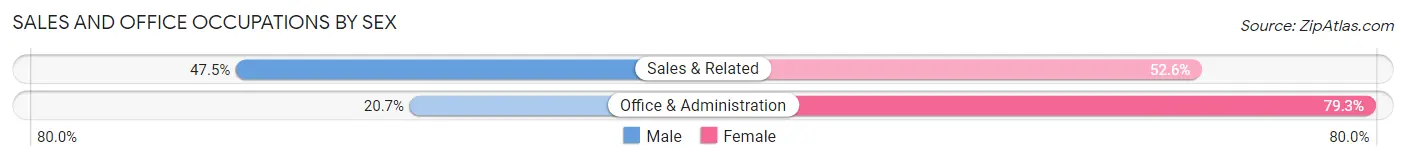
| Occupation | Male | Female |
| Sales & Related | 158 (47.4%) | 175 (52.5%) |
| Office & Administration | 68 (20.7%) | 260 (79.3%) |
| Total (Category) | 226 (34.2%) | 435 (65.8%) |
| Total (Overall) | 2,188 (56.6%) | 1,677 (43.4%) |
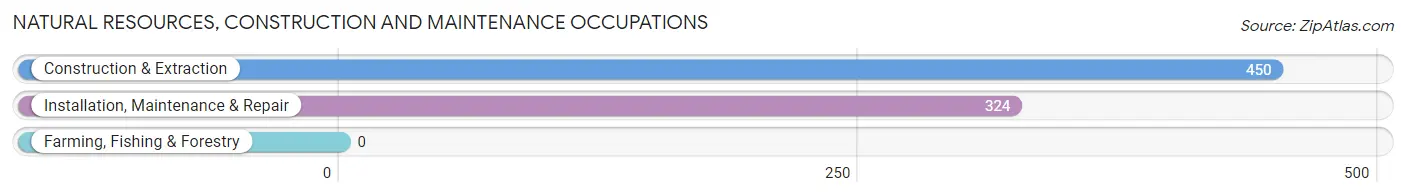
Natural Resources, Construction and Maintenance Occupations
The most common Natural Resources, Construction and Maintenance occupations in Bloomingdale are Construction & Extraction (450 | 11.6%), and Installation, Maintenance & Repair (324 | 8.4%).
Natural Resources, Construction and Maintenance Occupations by Sex
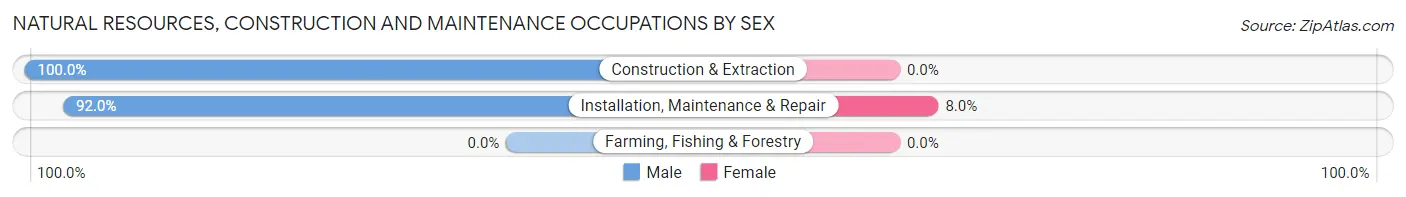
| Occupation | Male | Female |
| Farming, Fishing & Forestry | 0 (0.0%) | 0 (0.0%) |
| Construction & Extraction | 450 (100.0%) | 0 (0.0%) |
| Installation, Maintenance & Repair | 298 (92.0%) | 26 (8.0%) |
| Total (Category) | 748 (96.6%) | 26 (3.4%) |
| Total (Overall) | 2,188 (56.6%) | 1,677 (43.4%) |
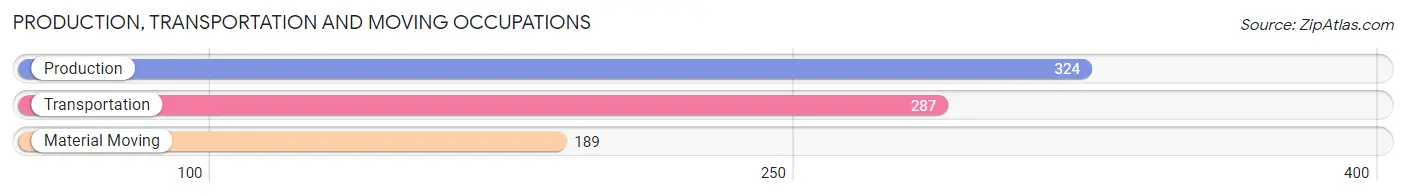
Production, Transportation and Moving Occupations
The most common Production, Transportation and Moving occupations in Bloomingdale are Production (324 | 8.4%), Transportation (287 | 7.4%), and Material Moving (189 | 4.9%).
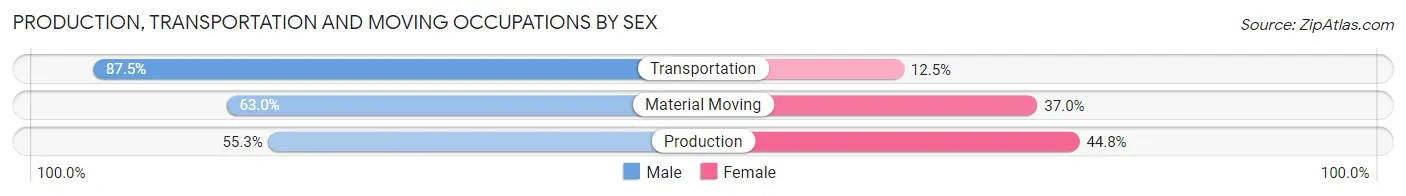
Production, Transportation and Moving Occupations by Sex
| Occupation | Male | Female |
| Production | 179 (55.2%) | 145 (44.8%) |
| Transportation | 251 (87.5%) | 36 (12.5%) |
| Material Moving | 119 (63.0%) | 70 (37.0%) |
| Total (Category) | 549 (68.6%) | 251 (31.4%) |
| Total (Overall) | 2,188 (56.6%) | 1,677 (43.4%) |
Employment Industries by Sex in Bloomingdale
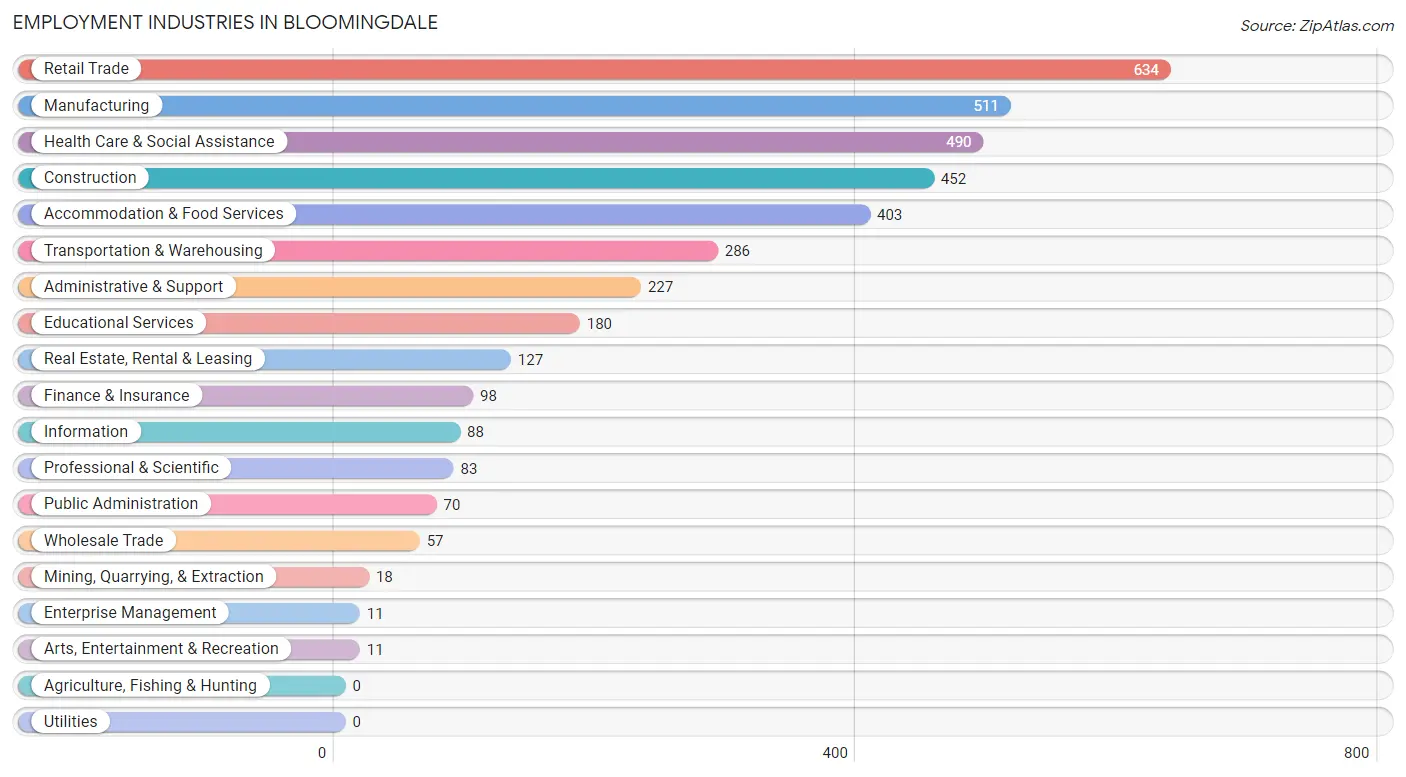
Employment Industries in Bloomingdale
The major employment industries in Bloomingdale include Retail Trade (634 | 16.4%), Manufacturing (511 | 13.2%), Health Care & Social Assistance (490 | 12.7%), Construction (452 | 11.7%), and Accommodation & Food Services (403 | 10.4%).
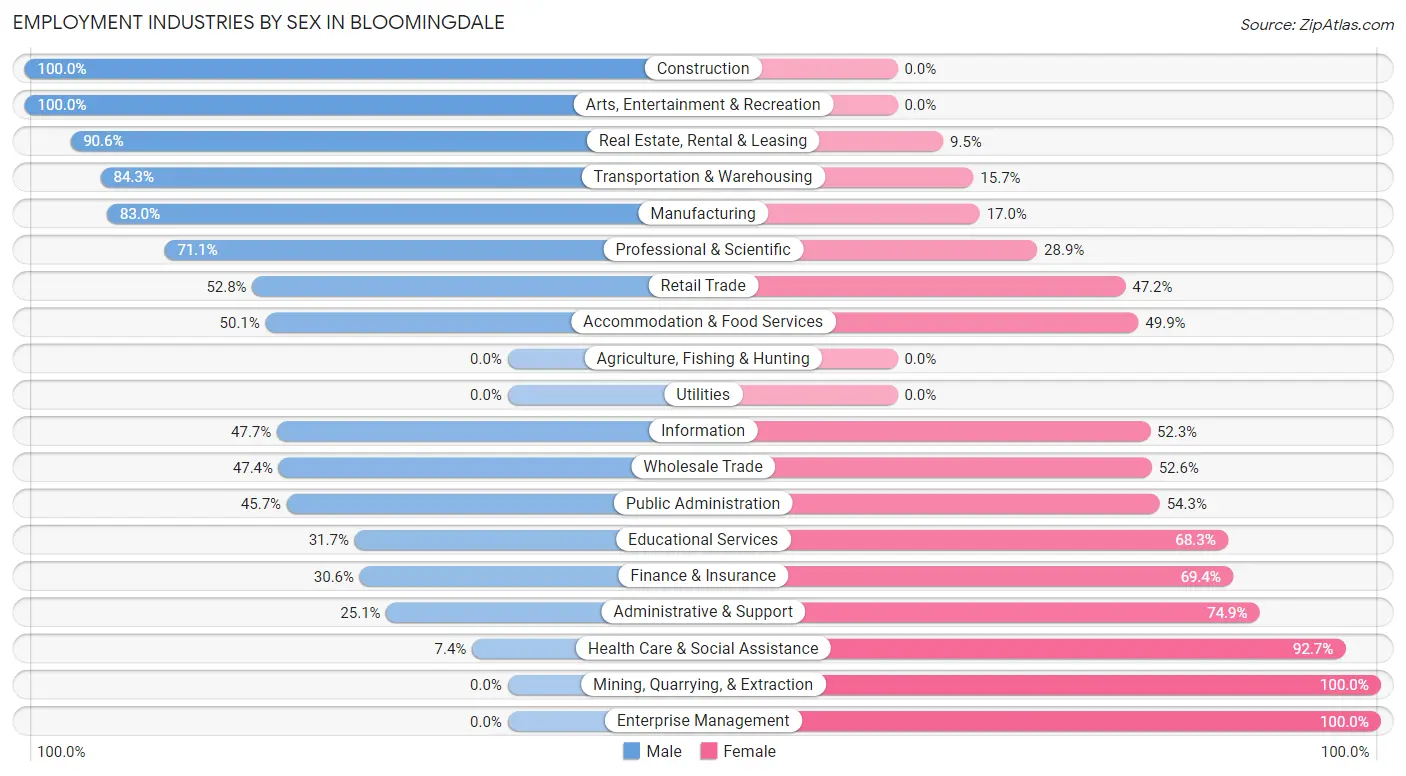
Employment Industries by Sex in Bloomingdale
The Bloomingdale industries that see more men than women are Construction (100.0%), Arts, Entertainment & Recreation (100.0%), and Real Estate, Rental & Leasing (90.5%), whereas the industries that tend to have a higher number of women are Mining, Quarrying, & Extraction (100.0%), Enterprise Management (100.0%), and Health Care & Social Assistance (92.6%).
| Industry | Male | Female |
| Agriculture, Fishing & Hunting | 0 (0.0%) | 0 (0.0%) |
| Mining, Quarrying, & Extraction | 0 (0.0%) | 18 (100.0%) |
| Construction | 452 (100.0%) | 0 (0.0%) |
| Manufacturing | 424 (83.0%) | 87 (17.0%) |
| Wholesale Trade | 27 (47.4%) | 30 (52.6%) |
| Retail Trade | 335 (52.8%) | 299 (47.2%) |
| Transportation & Warehousing | 241 (84.3%) | 45 (15.7%) |
| Utilities | 0 (0.0%) | 0 (0.0%) |
| Information | 42 (47.7%) | 46 (52.3%) |
| Finance & Insurance | 30 (30.6%) | 68 (69.4%) |
| Real Estate, Rental & Leasing | 115 (90.5%) | 12 (9.5%) |
| Professional & Scientific | 59 (71.1%) | 24 (28.9%) |
| Enterprise Management | 0 (0.0%) | 11 (100.0%) |
| Administrative & Support | 57 (25.1%) | 170 (74.9%) |
| Educational Services | 57 (31.7%) | 123 (68.3%) |
| Health Care & Social Assistance | 36 (7.3%) | 454 (92.6%) |
| Arts, Entertainment & Recreation | 11 (100.0%) | 0 (0.0%) |
| Accommodation & Food Services | 202 (50.1%) | 201 (49.9%) |
| Public Administration | 32 (45.7%) | 38 (54.3%) |
| Total | 2,188 (56.6%) | 1,677 (43.4%) |
Education in Bloomingdale
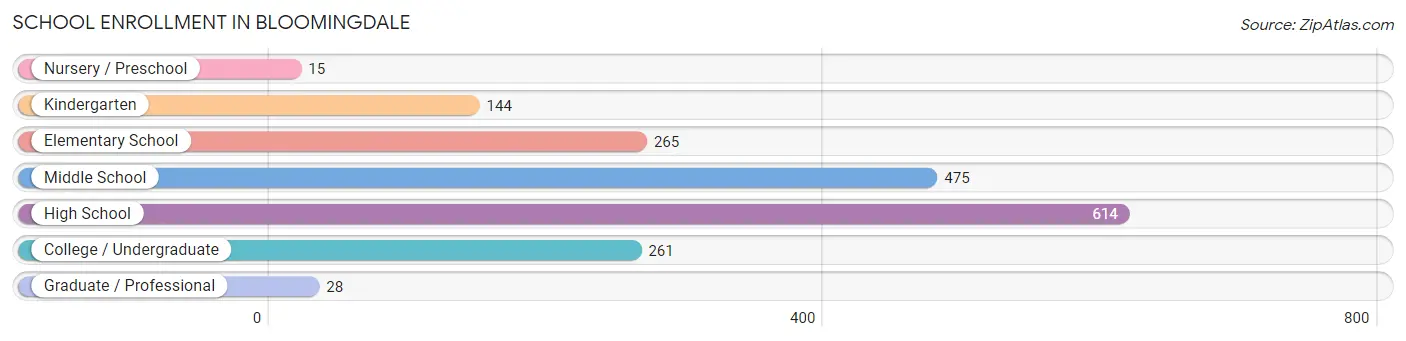
School Enrollment in Bloomingdale
The most common levels of schooling among the 1,802 students in Bloomingdale are high school (614 | 34.1%), middle school (475 | 26.4%), and elementary school (265 | 14.7%).
| School Level | # Students | % Students |
| Nursery / Preschool | 15 | 0.8% |
| Kindergarten | 144 | 8.0% |
| Elementary School | 265 | 14.7% |
| Middle School | 475 | 26.4% |
| High School | 614 | 34.1% |
| College / Undergraduate | 261 | 14.5% |
| Graduate / Professional | 28 | 1.5% |
| Total | 1,802 | 100.0% |
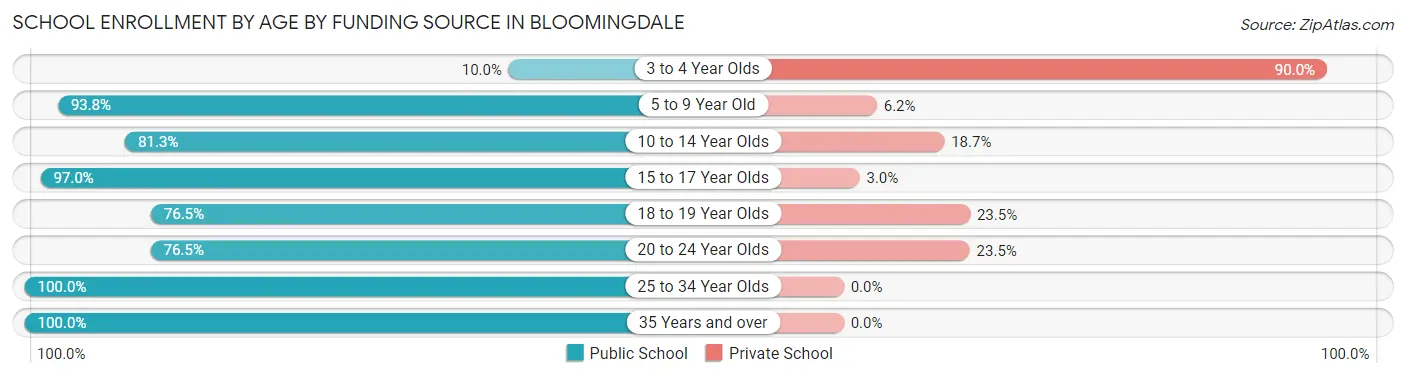
School Enrollment by Age by Funding Source in Bloomingdale
Out of a total of 1,802 students who are enrolled in schools in Bloomingdale, 218 (12.1%) attend a private institution, while the remaining 1,584 (87.9%) are enrolled in public schools. The age group of 3 to 4 year olds has the highest likelihood of being enrolled in private schools, with 9 (90.0% in the age bracket) enrolled. Conversely, the age group of 25 to 34 year olds has the lowest likelihood of being enrolled in a private school, with 40 (100.0% in the age bracket) attending a public institution.
| Age Bracket | Public School | Private School |
| 3 to 4 Year Olds | 1 (10.0%) | 9 (90.0%) |
| 5 to 9 Year Old | 350 (93.8%) | 23 (6.2%) |
| 10 to 14 Year Olds | 525 (81.3%) | 121 (18.7%) |
| 15 to 17 Year Olds | 459 (97.0%) | 14 (3.0%) |
| 18 to 19 Year Olds | 91 (76.5%) | 28 (23.5%) |
| 20 to 24 Year Olds | 75 (76.5%) | 23 (23.5%) |
| 25 to 34 Year Olds | 40 (100.0%) | 0 (0.0%) |
| 35 Years and over | 43 (100.0%) | 0 (0.0%) |
| Total | 1,584 (87.9%) | 218 (12.1%) |
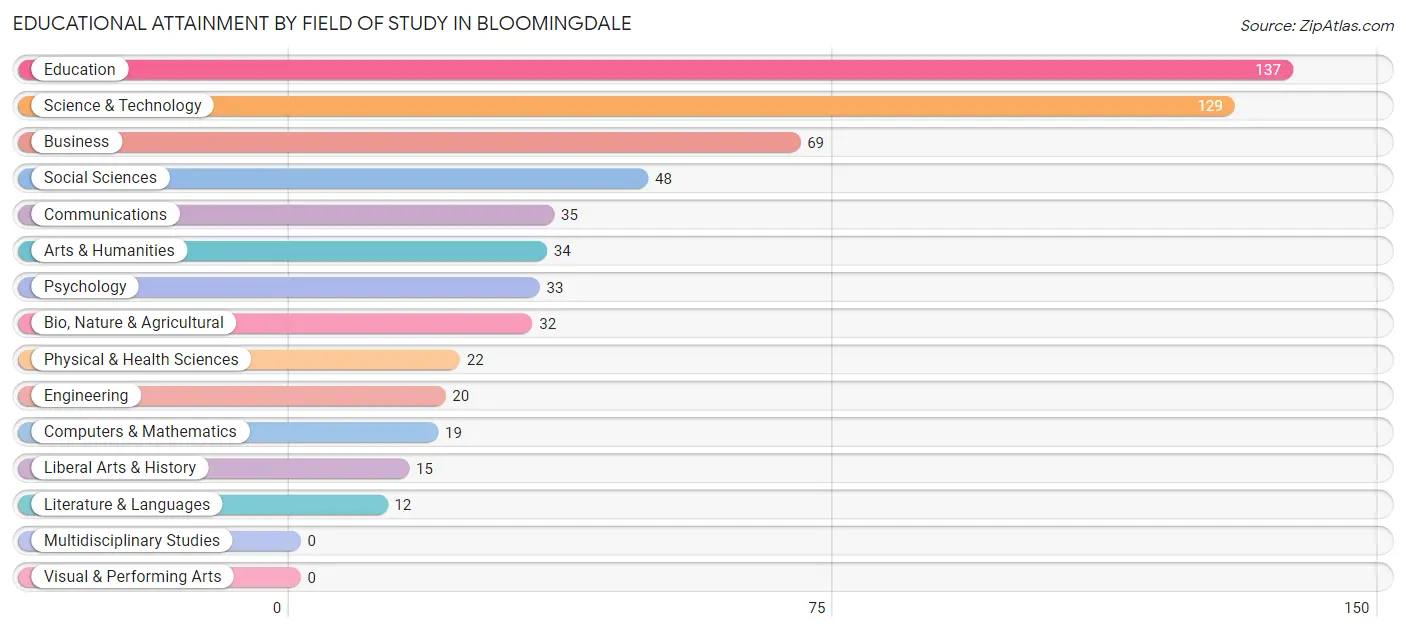
Educational Attainment by Field of Study in Bloomingdale
Education (137 | 22.6%), science & technology (129 | 21.3%), business (69 | 11.4%), social sciences (48 | 7.9%), and communications (35 | 5.8%) are the most common fields of study among 605 individuals in Bloomingdale who have obtained a bachelor's degree or higher.
| Field of Study | # Graduates | % Graduates |
| Computers & Mathematics | 19 | 3.1% |
| Bio, Nature & Agricultural | 32 | 5.3% |
| Physical & Health Sciences | 22 | 3.6% |
| Psychology | 33 | 5.4% |
| Social Sciences | 48 | 7.9% |
| Engineering | 20 | 3.3% |
| Multidisciplinary Studies | 0 | 0.0% |
| Science & Technology | 129 | 21.3% |
| Business | 69 | 11.4% |
| Education | 137 | 22.6% |
| Literature & Languages | 12 | 2.0% |
| Liberal Arts & History | 15 | 2.5% |
| Visual & Performing Arts | 0 | 0.0% |
| Communications | 35 | 5.8% |
| Arts & Humanities | 34 | 5.6% |
| Total | 605 | 100.0% |
Transportation & Commute in Bloomingdale
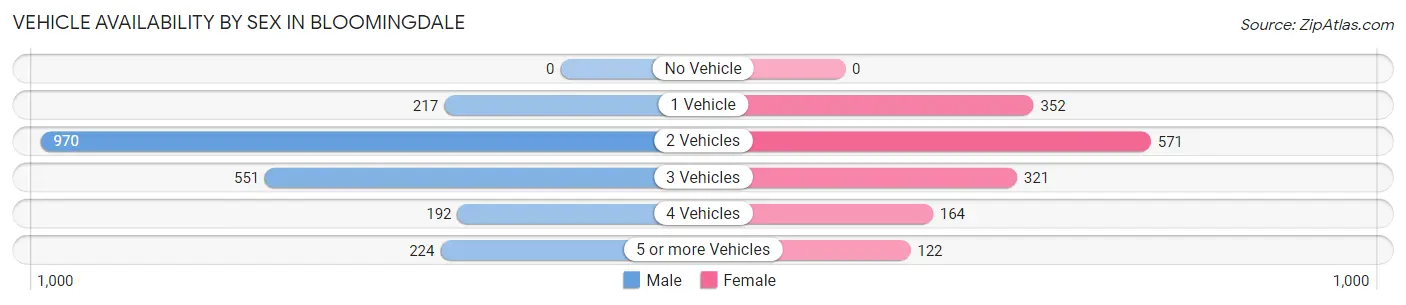
Vehicle Availability by Sex in Bloomingdale
The most prevalent vehicle ownership categories in Bloomingdale are males with 2 vehicles (970, accounting for 45.0%) and females with 2 vehicles (571, making up 63.4%).
| Vehicles Available | Male | Female |
| No Vehicle | 0 (0.0%) | 0 (0.0%) |
| 1 Vehicle | 217 (10.1%) | 352 (23.0%) |
| 2 Vehicles | 970 (45.0%) | 571 (37.3%) |
| 3 Vehicles | 551 (25.6%) | 321 (21.0%) |
| 4 Vehicles | 192 (8.9%) | 164 (10.7%) |
| 5 or more Vehicles | 224 (10.4%) | 122 (8.0%) |
| Total | 2,154 (100.0%) | 1,530 (100.0%) |
Commute Time in Bloomingdale
The most frequently occuring commute durations in Bloomingdale are 15 to 19 minutes (838 commuters, 23.8%), 10 to 14 minutes (717 commuters, 20.3%), and 20 to 24 minutes (606 commuters, 17.2%).
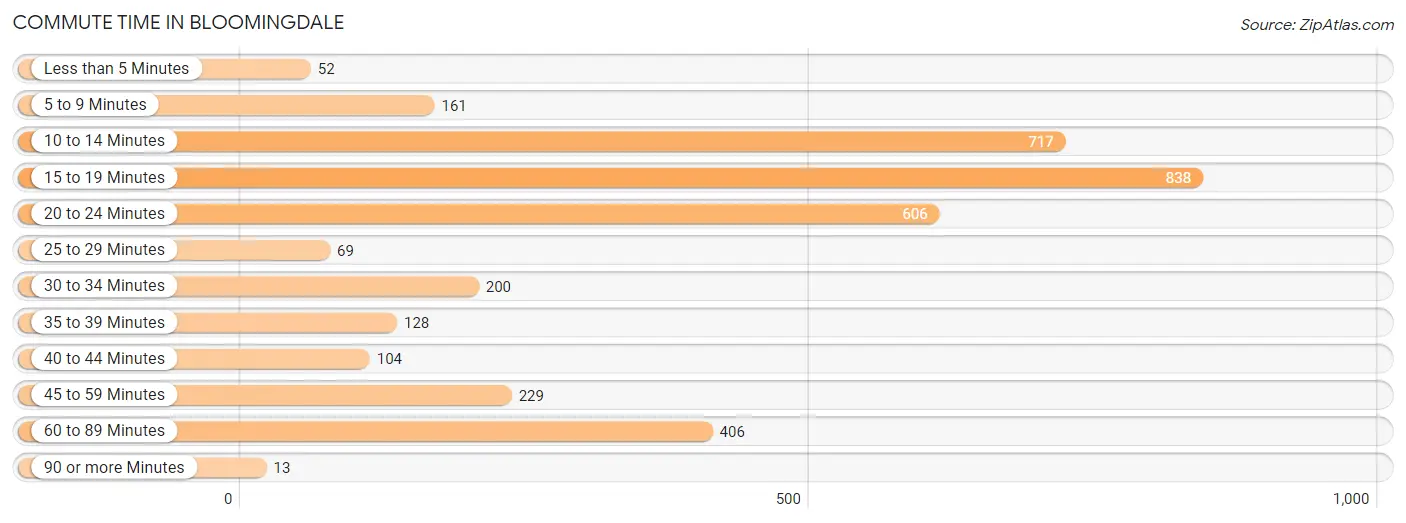
| Commute Time | # Commuters | % Commuters |
| Less than 5 Minutes | 52 | 1.5% |
| 5 to 9 Minutes | 161 | 4.6% |
| 10 to 14 Minutes | 717 | 20.3% |
| 15 to 19 Minutes | 838 | 23.8% |
| 20 to 24 Minutes | 606 | 17.2% |
| 25 to 29 Minutes | 69 | 2.0% |
| 30 to 34 Minutes | 200 | 5.7% |
| 35 to 39 Minutes | 128 | 3.6% |
| 40 to 44 Minutes | 104 | 2.9% |
| 45 to 59 Minutes | 229 | 6.5% |
| 60 to 89 Minutes | 406 | 11.5% |
| 90 or more Minutes | 13 | 0.4% |
Commute Time by Sex in Bloomingdale
The most common commute times in Bloomingdale are 10 to 14 minutes (433 commuters, 20.6%) for males and 15 to 19 minutes (477 commuters, 33.5%) for females.
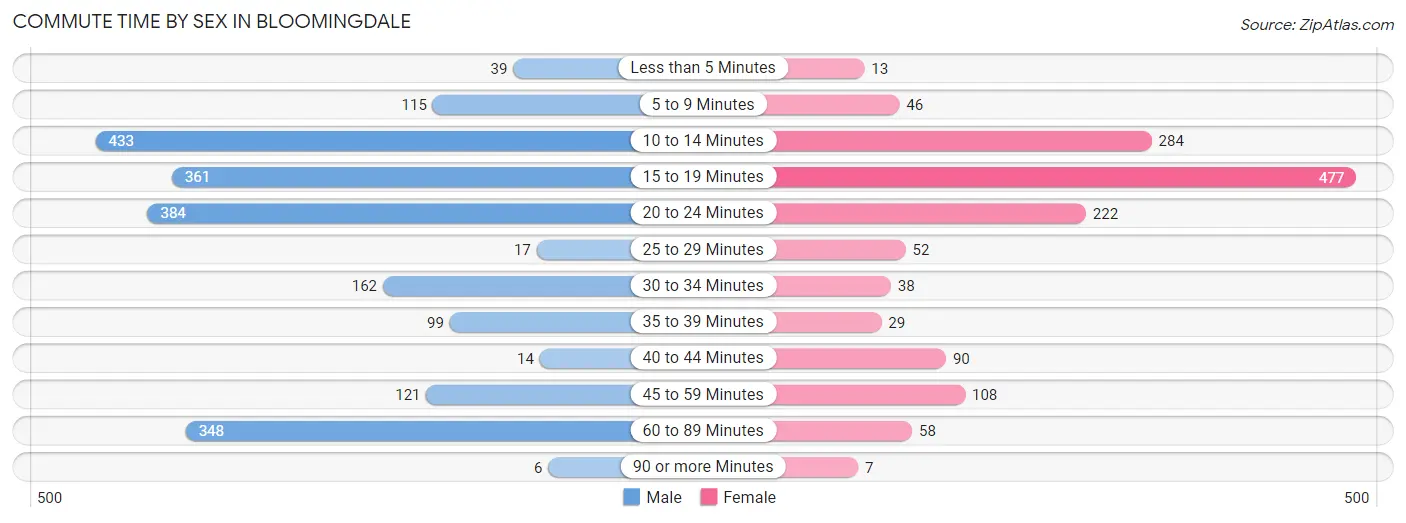
| Commute Time | Male | Female |
| Less than 5 Minutes | 39 (1.9%) | 13 (0.9%) |
| 5 to 9 Minutes | 115 (5.5%) | 46 (3.2%) |
| 10 to 14 Minutes | 433 (20.6%) | 284 (19.9%) |
| 15 to 19 Minutes | 361 (17.2%) | 477 (33.5%) |
| 20 to 24 Minutes | 384 (18.3%) | 222 (15.6%) |
| 25 to 29 Minutes | 17 (0.8%) | 52 (3.6%) |
| 30 to 34 Minutes | 162 (7.7%) | 38 (2.7%) |
| 35 to 39 Minutes | 99 (4.7%) | 29 (2.0%) |
| 40 to 44 Minutes | 14 (0.7%) | 90 (6.3%) |
| 45 to 59 Minutes | 121 (5.8%) | 108 (7.6%) |
| 60 to 89 Minutes | 348 (16.6%) | 58 (4.1%) |
| 90 or more Minutes | 6 (0.3%) | 7 (0.5%) |
Time of Departure to Work by Sex in Bloomingdale
The most frequent times of departure to work in Bloomingdale are 7:00 AM to 7:29 AM (376, 17.9%) for males and 7:30 AM to 7:59 AM (329, 23.1%) for females.
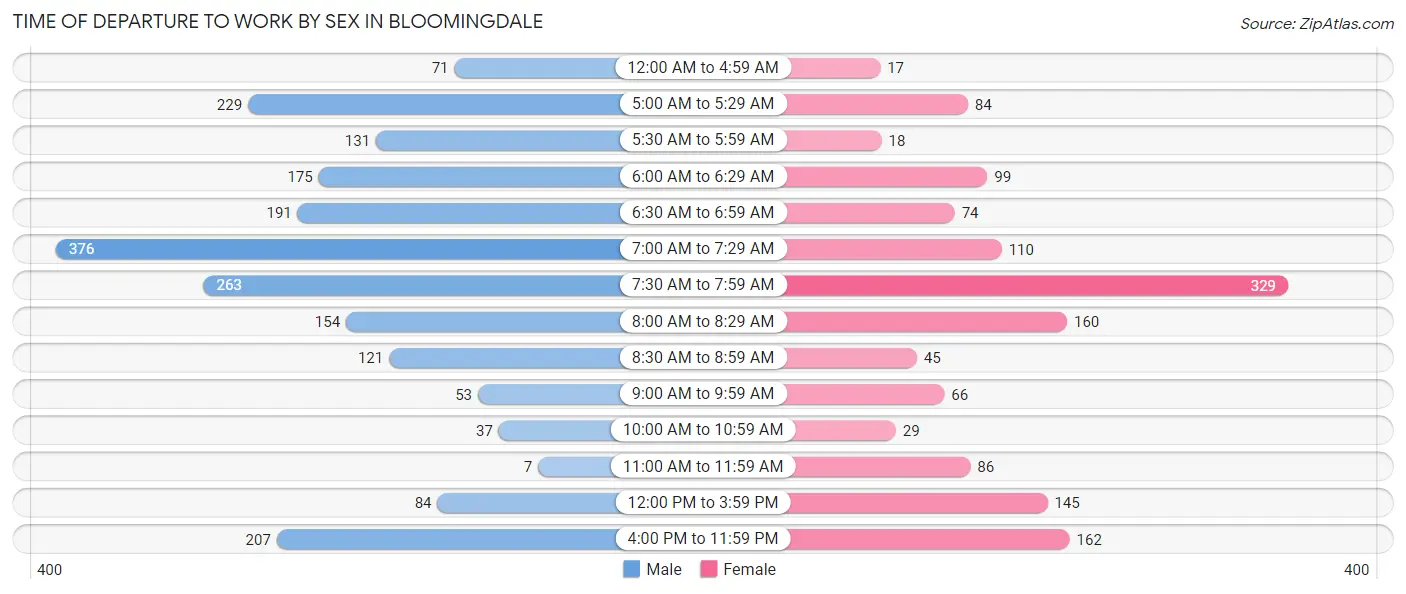
| Time of Departure | Male | Female |
| 12:00 AM to 4:59 AM | 71 (3.4%) | 17 (1.2%) |
| 5:00 AM to 5:29 AM | 229 (10.9%) | 84 (5.9%) |
| 5:30 AM to 5:59 AM | 131 (6.2%) | 18 (1.3%) |
| 6:00 AM to 6:29 AM | 175 (8.3%) | 99 (7.0%) |
| 6:30 AM to 6:59 AM | 191 (9.1%) | 74 (5.2%) |
| 7:00 AM to 7:29 AM | 376 (17.9%) | 110 (7.7%) |
| 7:30 AM to 7:59 AM | 263 (12.5%) | 329 (23.1%) |
| 8:00 AM to 8:29 AM | 154 (7.3%) | 160 (11.2%) |
| 8:30 AM to 8:59 AM | 121 (5.8%) | 45 (3.2%) |
| 9:00 AM to 9:59 AM | 53 (2.5%) | 66 (4.6%) |
| 10:00 AM to 10:59 AM | 37 (1.8%) | 29 (2.0%) |
| 11:00 AM to 11:59 AM | 7 (0.3%) | 86 (6.0%) |
| 12:00 PM to 3:59 PM | 84 (4.0%) | 145 (10.2%) |
| 4:00 PM to 11:59 PM | 207 (9.9%) | 162 (11.4%) |
| Total | 2,099 (100.0%) | 1,424 (100.0%) |
Housing Occupancy in Bloomingdale
Occupancy by Ownership in Bloomingdale
Of the total 3,653 dwellings in Bloomingdale, owner-occupied units account for 2,725 (74.6%), while renter-occupied units make up 928 (25.4%).
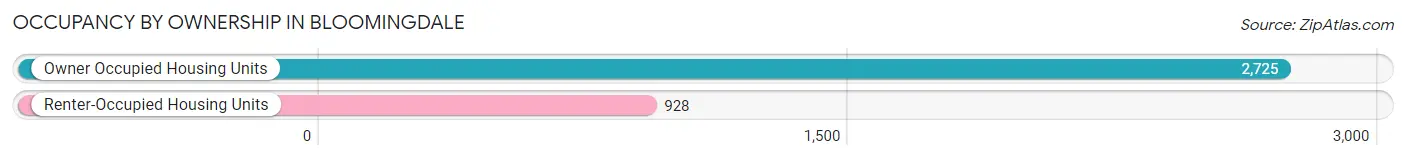
| Occupancy | # Housing Units | % Housing Units |
| Owner Occupied Housing Units | 2,725 | 74.6% |
| Renter-Occupied Housing Units | 928 | 25.4% |
| Total Occupied Housing Units | 3,653 | 100.0% |
Occupancy by Household Size in Bloomingdale
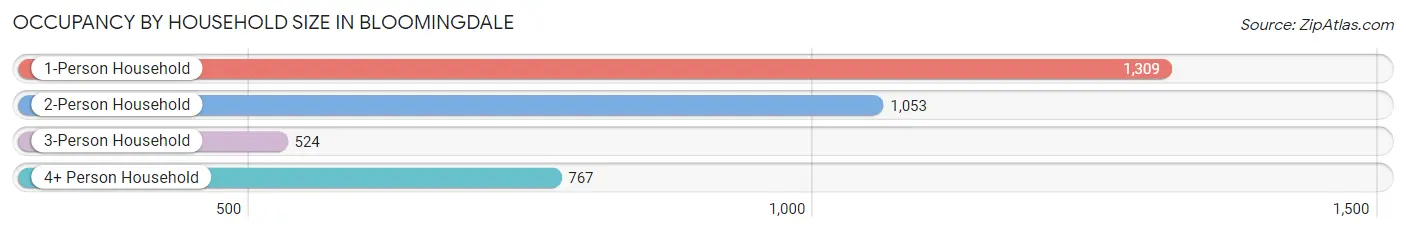
| Household Size | # Housing Units | % Housing Units |
| 1-Person Household | 1,309 | 35.8% |
| 2-Person Household | 1,053 | 28.8% |
| 3-Person Household | 524 | 14.3% |
| 4+ Person Household | 767 | 21.0% |
| Total Housing Units | 3,653 | 100.0% |
Occupancy by Ownership by Household Size in Bloomingdale
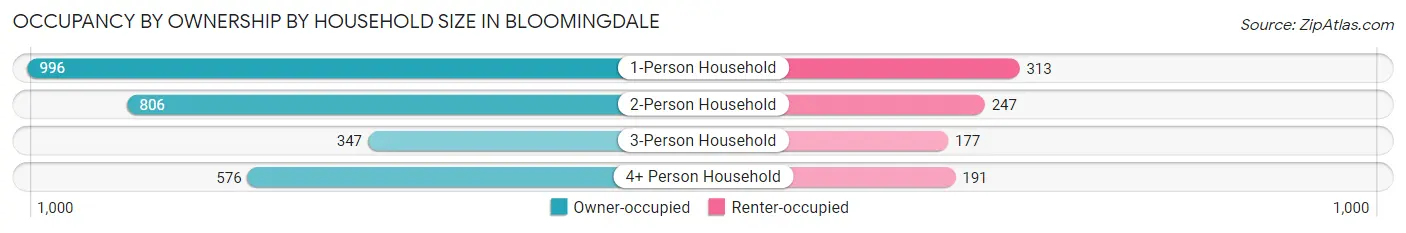
| Household Size | Owner-occupied | Renter-occupied |
| 1-Person Household | 996 (76.1%) | 313 (23.9%) |
| 2-Person Household | 806 (76.5%) | 247 (23.5%) |
| 3-Person Household | 347 (66.2%) | 177 (33.8%) |
| 4+ Person Household | 576 (75.1%) | 191 (24.9%) |
| Total Housing Units | 2,725 (74.6%) | 928 (25.4%) |
Occupancy by Educational Attainment in Bloomingdale
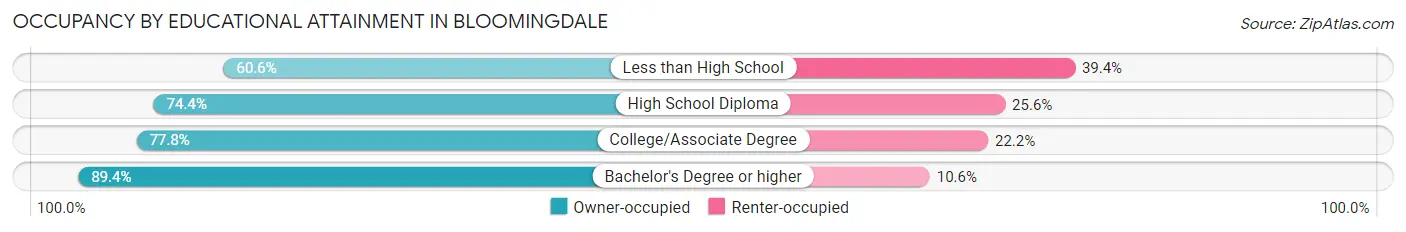
| Household Size | Owner-occupied | Renter-occupied |
| Less than High School | 392 (60.6%) | 255 (39.4%) |
| High School Diploma | 1,138 (74.4%) | 391 (25.6%) |
| College/Associate Degree | 842 (77.8%) | 240 (22.2%) |
| Bachelor's Degree or higher | 353 (89.4%) | 42 (10.6%) |
Occupancy by Age of Householder in Bloomingdale
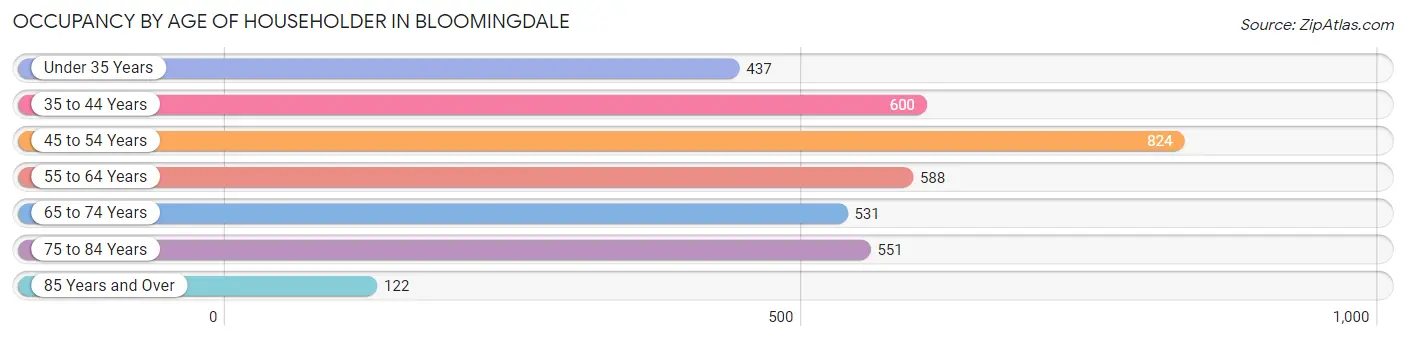
| Age Bracket | # Households | % Households |
| Under 35 Years | 437 | 12.0% |
| 35 to 44 Years | 600 | 16.4% |
| 45 to 54 Years | 824 | 22.6% |
| 55 to 64 Years | 588 | 16.1% |
| 65 to 74 Years | 531 | 14.5% |
| 75 to 84 Years | 551 | 15.1% |
| 85 Years and Over | 122 | 3.3% |
| Total | 3,653 | 100.0% |
Housing Finances in Bloomingdale
Median Income by Occupancy in Bloomingdale
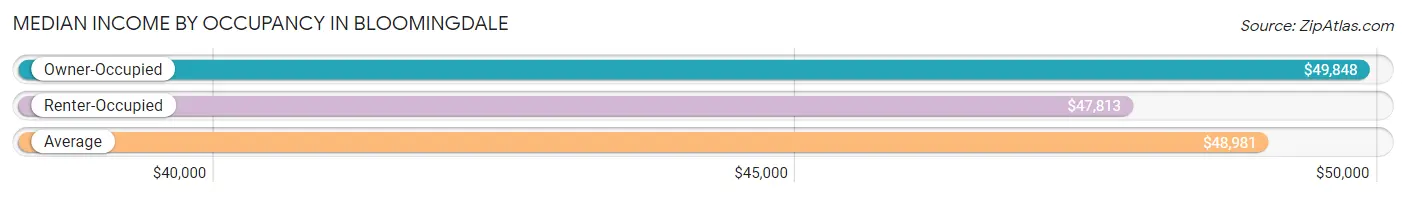
| Occupancy Type | # Households | Median Income |
| Owner-Occupied | 2,725 (74.6%) | $49,848 |
| Renter-Occupied | 928 (25.4%) | $47,813 |
| Average | 3,653 (100.0%) | $48,981 |
Occupancy by Householder Income Bracket in Bloomingdale
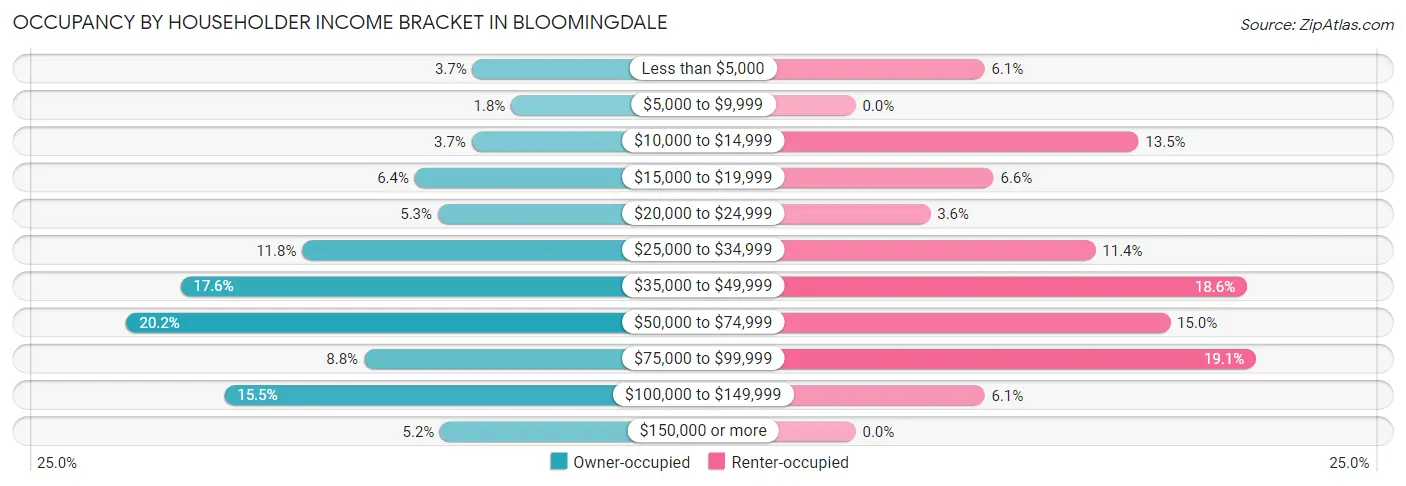
| Income Bracket | Owner-occupied | Renter-occupied |
| Less than $5,000 | 100 (3.7%) | 57 (6.1%) |
| $5,000 to $9,999 | 50 (1.8%) | 0 (0.0%) |
| $10,000 to $14,999 | 101 (3.7%) | 125 (13.5%) |
| $15,000 to $19,999 | 175 (6.4%) | 61 (6.6%) |
| $20,000 to $24,999 | 145 (5.3%) | 33 (3.6%) |
| $25,000 to $34,999 | 321 (11.8%) | 106 (11.4%) |
| $35,000 to $49,999 | 479 (17.6%) | 173 (18.6%) |
| $50,000 to $74,999 | 549 (20.2%) | 139 (15.0%) |
| $75,000 to $99,999 | 241 (8.8%) | 177 (19.1%) |
| $100,000 to $149,999 | 422 (15.5%) | 57 (6.1%) |
| $150,000 or more | 142 (5.2%) | 0 (0.0%) |
| Total | 2,725 (100.0%) | 928 (100.0%) |
Monthly Housing Cost Tiers in Bloomingdale
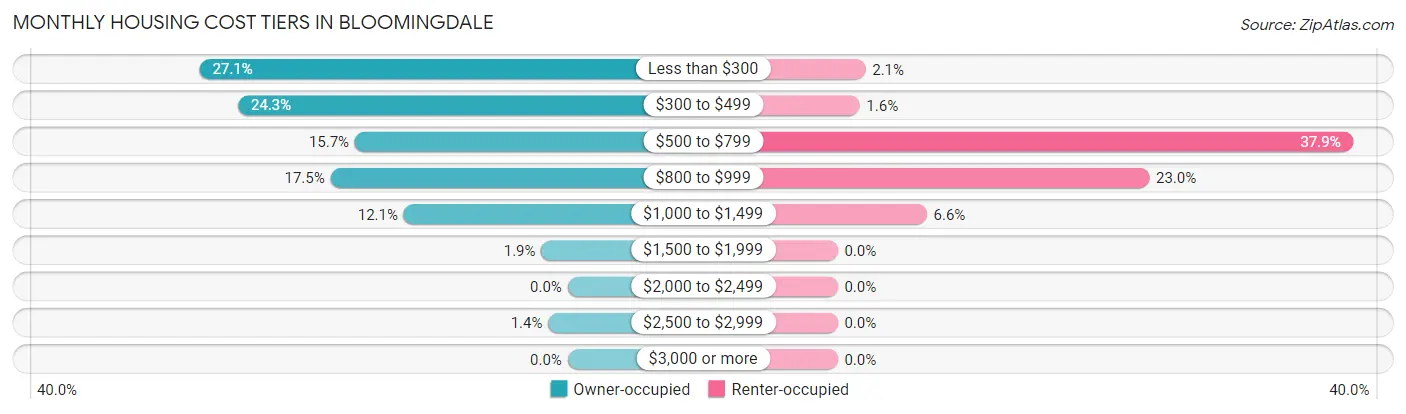
| Monthly Cost | Owner-occupied | Renter-occupied |
| Less than $300 | 739 (27.1%) | 19 (2.1%) |
| $300 to $499 | 662 (24.3%) | 15 (1.6%) |
| $500 to $799 | 427 (15.7%) | 352 (37.9%) |
| $800 to $999 | 476 (17.5%) | 213 (23.0%) |
| $1,000 to $1,499 | 329 (12.1%) | 61 (6.6%) |
| $1,500 to $1,999 | 53 (1.9%) | 0 (0.0%) |
| $2,000 to $2,499 | 0 (0.0%) | 0 (0.0%) |
| $2,500 to $2,999 | 39 (1.4%) | 0 (0.0%) |
| $3,000 or more | 0 (0.0%) | 0 (0.0%) |
| Total | 2,725 (100.0%) | 928 (100.0%) |
Physical Housing Characteristics in Bloomingdale
Housing Structures in Bloomingdale
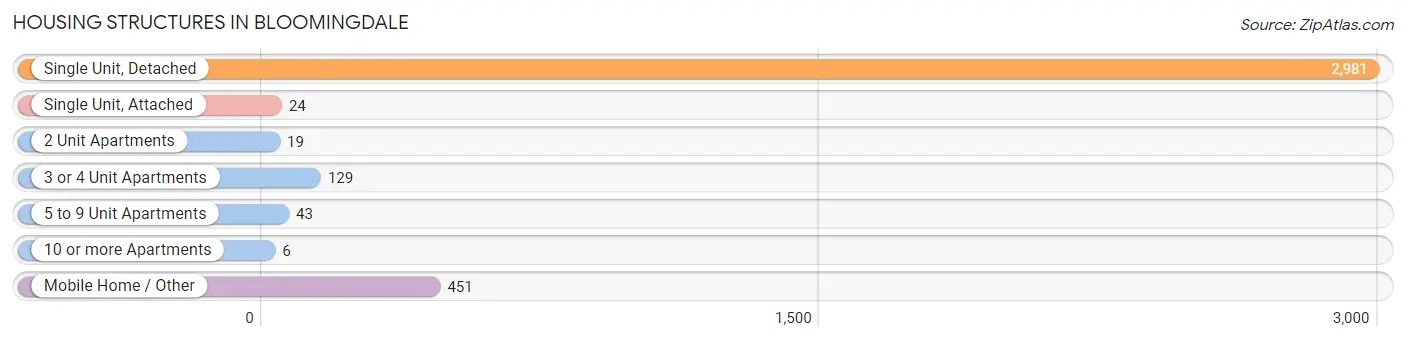
| Structure Type | # Housing Units | % Housing Units |
| Single Unit, Detached | 2,981 | 81.6% |
| Single Unit, Attached | 24 | 0.7% |
| 2 Unit Apartments | 19 | 0.5% |
| 3 or 4 Unit Apartments | 129 | 3.5% |
| 5 to 9 Unit Apartments | 43 | 1.2% |
| 10 or more Apartments | 6 | 0.2% |
| Mobile Home / Other | 451 | 12.3% |
| Total | 3,653 | 100.0% |
Housing Structures by Occupancy in Bloomingdale
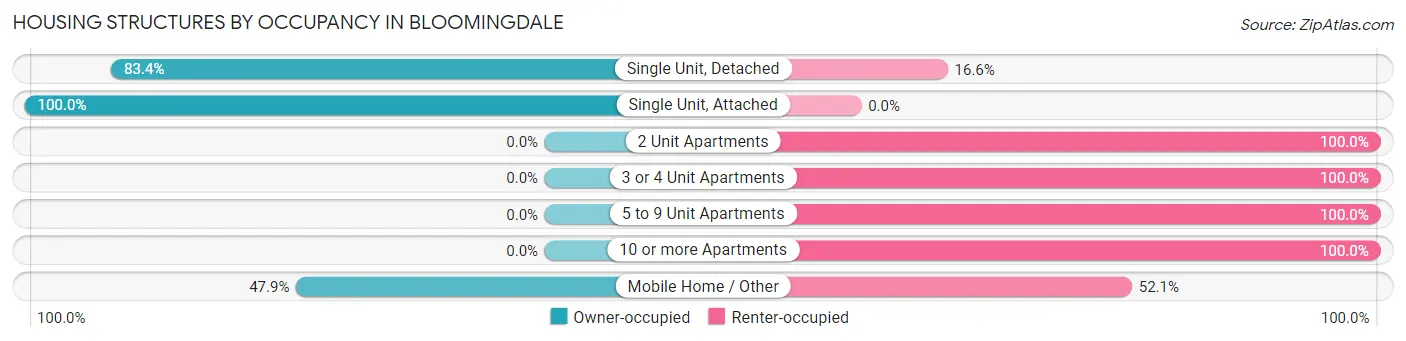
| Structure Type | Owner-occupied | Renter-occupied |
| Single Unit, Detached | 2,485 (83.4%) | 496 (16.6%) |
| Single Unit, Attached | 24 (100.0%) | 0 (0.0%) |
| 2 Unit Apartments | 0 (0.0%) | 19 (100.0%) |
| 3 or 4 Unit Apartments | 0 (0.0%) | 129 (100.0%) |
| 5 to 9 Unit Apartments | 0 (0.0%) | 43 (100.0%) |
| 10 or more Apartments | 0 (0.0%) | 6 (100.0%) |
| Mobile Home / Other | 216 (47.9%) | 235 (52.1%) |
| Total | 2,725 (74.6%) | 928 (25.4%) |
Housing Structures by Number of Rooms in Bloomingdale
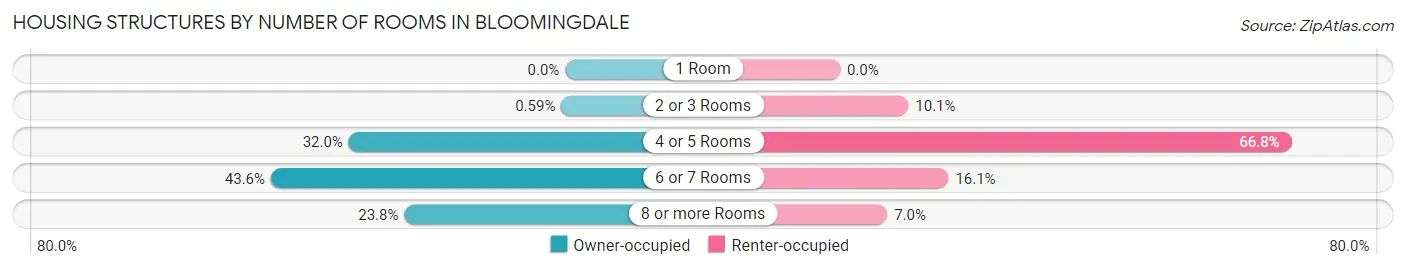
| Number of Rooms | Owner-occupied | Renter-occupied |
| 1 Room | 0 (0.0%) | 0 (0.0%) |
| 2 or 3 Rooms | 16 (0.6%) | 94 (10.1%) |
| 4 or 5 Rooms | 873 (32.0%) | 620 (66.8%) |
| 6 or 7 Rooms | 1,187 (43.6%) | 149 (16.1%) |
| 8 or more Rooms | 649 (23.8%) | 65 (7.0%) |
| Total | 2,725 (100.0%) | 928 (100.0%) |
Housing Structure by Heating Type in Bloomingdale
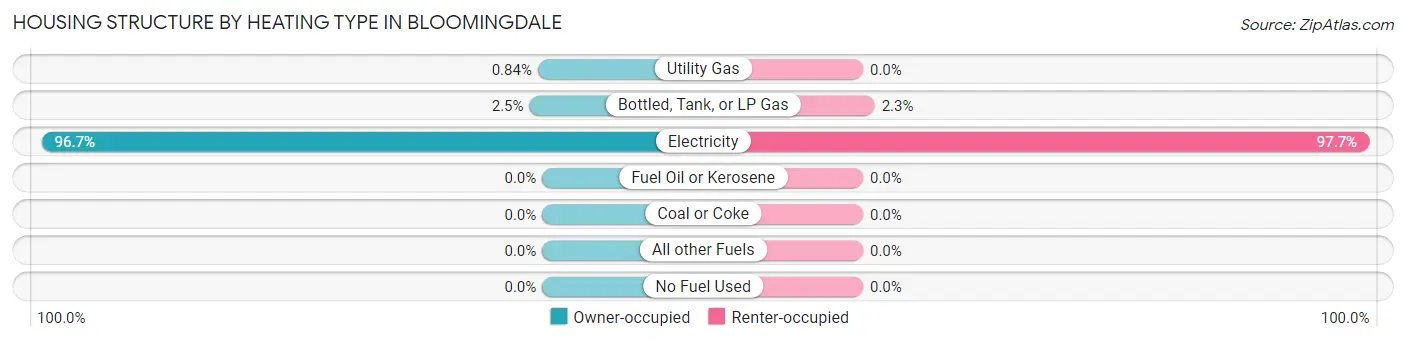
| Heating Type | Owner-occupied | Renter-occupied |
| Utility Gas | 23 (0.8%) | 0 (0.0%) |
| Bottled, Tank, or LP Gas | 67 (2.5%) | 21 (2.3%) |
| Electricity | 2,635 (96.7%) | 907 (97.7%) |
| Fuel Oil or Kerosene | 0 (0.0%) | 0 (0.0%) |
| Coal or Coke | 0 (0.0%) | 0 (0.0%) |
| All other Fuels | 0 (0.0%) | 0 (0.0%) |
| No Fuel Used | 0 (0.0%) | 0 (0.0%) |
| Total | 2,725 (100.0%) | 928 (100.0%) |
Household Vehicle Usage in Bloomingdale
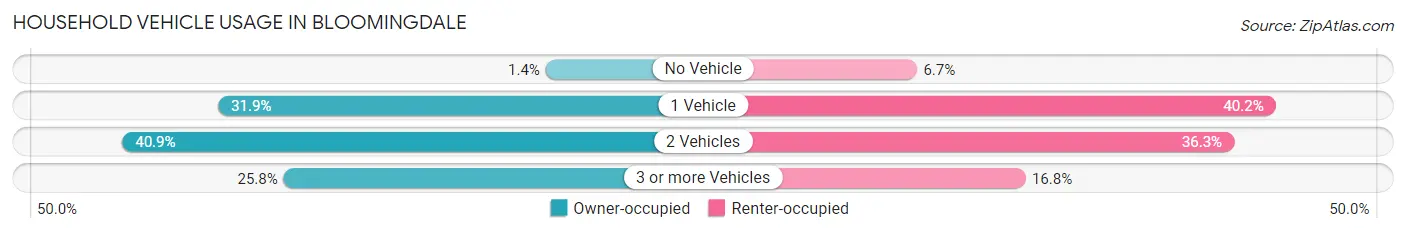
| Vehicles per Household | Owner-occupied | Renter-occupied |
| No Vehicle | 37 (1.4%) | 62 (6.7%) |
| 1 Vehicle | 870 (31.9%) | 373 (40.2%) |
| 2 Vehicles | 1,114 (40.9%) | 337 (36.3%) |
| 3 or more Vehicles | 704 (25.8%) | 156 (16.8%) |
| Total | 2,725 (100.0%) | 928 (100.0%) |
Real Estate & Mortgages in Bloomingdale
Real Estate and Mortgage Overview in Bloomingdale
| Characteristic | Without Mortgage | With Mortgage |
| Housing Units | 1,563 | 1,162 |
| Median Property Value | $120,600 | $149,700 |
| Median Household Income | $45,051 | $45 |
| Monthly Housing Costs | $309 | $0 |
| Real Estate Taxes | $709 | $29 |
Property Value by Mortgage Status in Bloomingdale
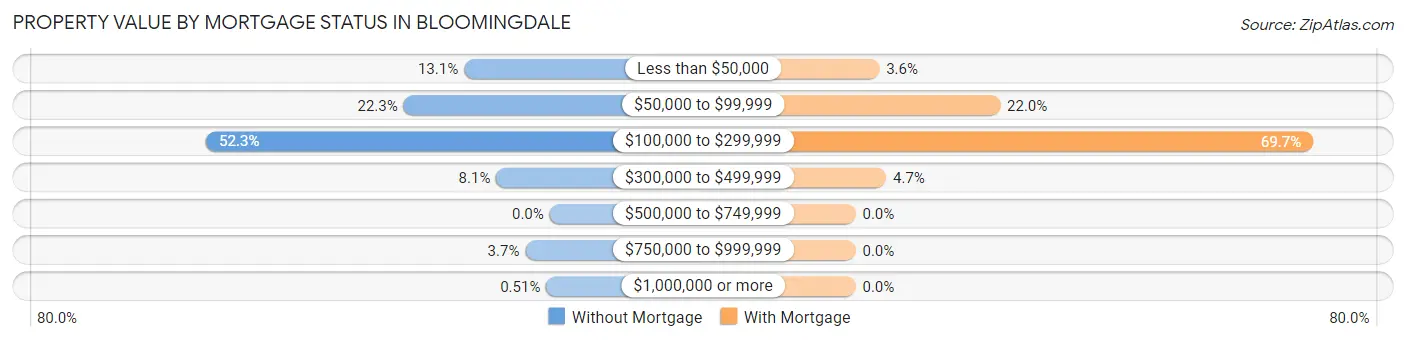
| Property Value | Without Mortgage | With Mortgage |
| Less than $50,000 | 204 (13.1%) | 42 (3.6%) |
| $50,000 to $99,999 | 348 (22.3%) | 256 (22.0%) |
| $100,000 to $299,999 | 818 (52.3%) | 810 (69.7%) |
| $300,000 to $499,999 | 127 (8.1%) | 54 (4.6%) |
| $500,000 to $749,999 | 0 (0.0%) | 0 (0.0%) |
| $750,000 to $999,999 | 58 (3.7%) | 0 (0.0%) |
| $1,000,000 or more | 8 (0.5%) | 0 (0.0%) |
| Total | 1,563 (100.0%) | 1,162 (100.0%) |
Household Income by Mortgage Status in Bloomingdale
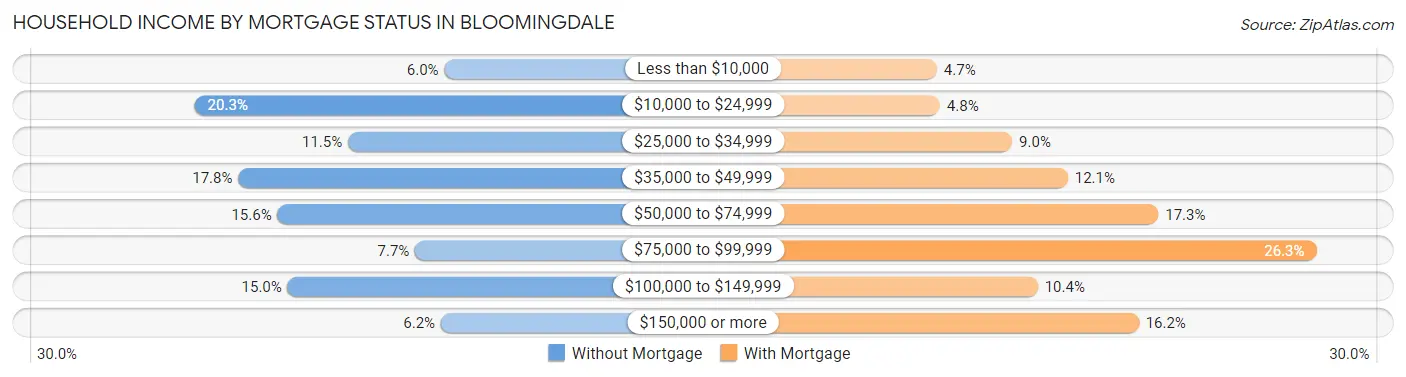
| Household Income | Without Mortgage | With Mortgage |
| Less than $10,000 | 94 (6.0%) | 54 (4.6%) |
| $10,000 to $24,999 | 317 (20.3%) | 56 (4.8%) |
| $25,000 to $34,999 | 180 (11.5%) | 104 (8.9%) |
| $35,000 to $49,999 | 278 (17.8%) | 141 (12.1%) |
| $50,000 to $74,999 | 243 (15.5%) | 201 (17.3%) |
| $75,000 to $99,999 | 120 (7.7%) | 306 (26.3%) |
| $100,000 to $149,999 | 234 (15.0%) | 121 (10.4%) |
| $150,000 or more | 97 (6.2%) | 188 (16.2%) |
| Total | 1,563 (100.0%) | 1,162 (100.0%) |
Property Value to Household Income Ratio in Bloomingdale
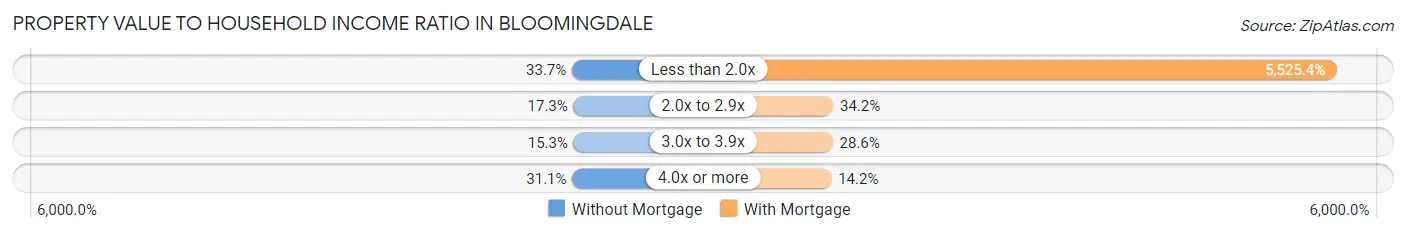
| Value-to-Income Ratio | Without Mortgage | With Mortgage |
| Less than 2.0x | 526 (33.7%) | 64,205 (5,525.4%) |
| 2.0x to 2.9x | 270 (17.3%) | 397 (34.2%) |
| 3.0x to 3.9x | 239 (15.3%) | 332 (28.6%) |
| 4.0x or more | 486 (31.1%) | 165 (14.2%) |
| Total | 1,563 (100.0%) | 1,162 (100.0%) |
Real Estate Taxes by Mortgage Status in Bloomingdale
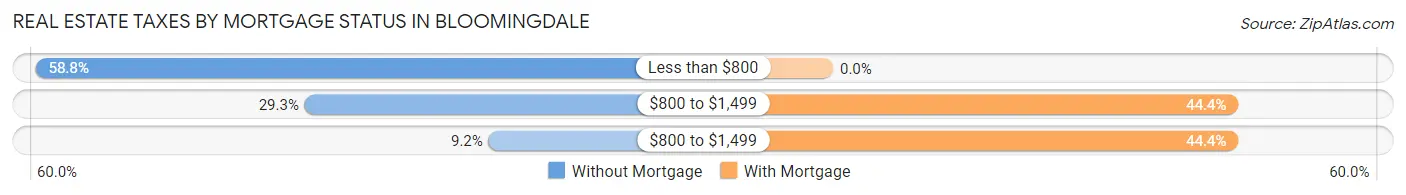
| Property Taxes | Without Mortgage | With Mortgage |
| Less than $800 | 919 (58.8%) | 0 (0.0%) |
| $800 to $1,499 | 458 (29.3%) | 516 (44.4%) |
| $800 to $1,499 | 143 (9.1%) | 516 (44.4%) |
| Total | 1,563 (100.0%) | 1,162 (100.0%) |
Health & Disability in Bloomingdale
Health Insurance Coverage by Age in Bloomingdale
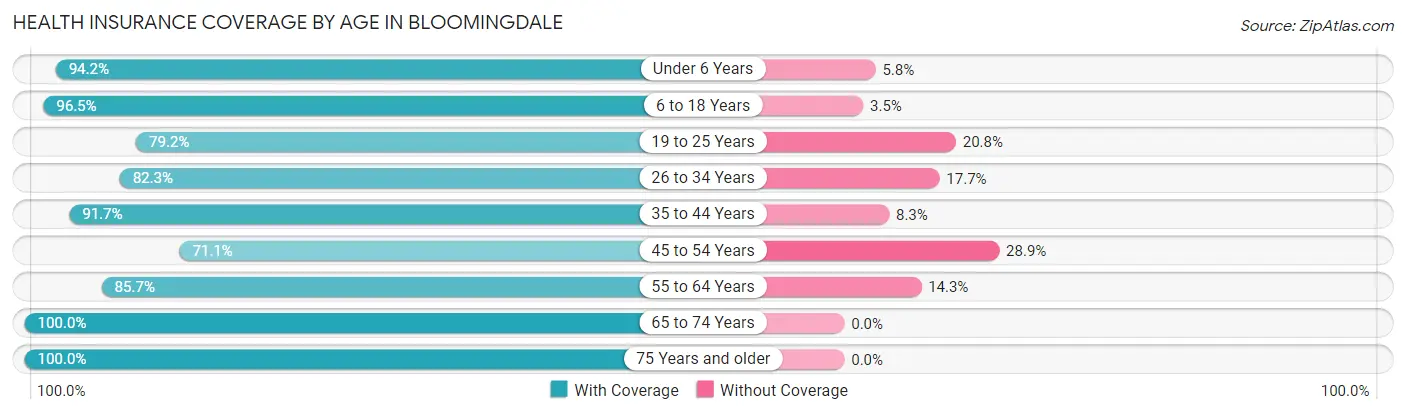
| Age Bracket | With Coverage | Without Coverage |
| Under 6 Years | 405 (94.2%) | 25 (5.8%) |
| 6 to 18 Years | 1,539 (96.5%) | 56 (3.5%) |
| 19 to 25 Years | 514 (79.2%) | 135 (20.8%) |
| 26 to 34 Years | 770 (82.3%) | 166 (17.7%) |
| 35 to 44 Years | 1,000 (91.7%) | 91 (8.3%) |
| 45 to 54 Years | 1,022 (71.1%) | 415 (28.9%) |
| 55 to 64 Years | 872 (85.7%) | 146 (14.3%) |
| 65 to 74 Years | 767 (100.0%) | 0 (0.0%) |
| 75 Years and older | 989 (100.0%) | 0 (0.0%) |
| Total | 7,878 (88.4%) | 1,034 (11.6%) |
Health Insurance Coverage by Citizenship Status in Bloomingdale
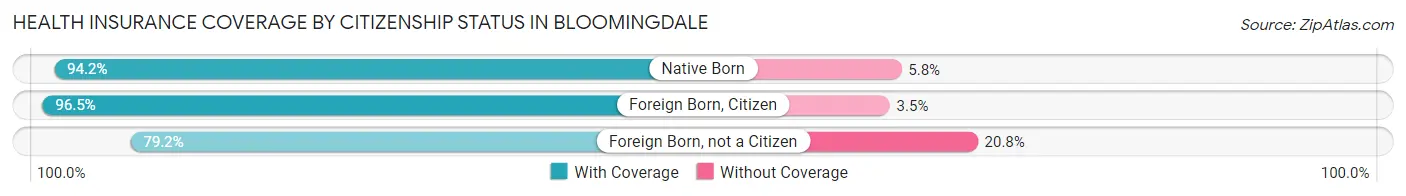
| Citizenship Status | With Coverage | Without Coverage |
| Native Born | 405 (94.2%) | 25 (5.8%) |
| Foreign Born, Citizen | 1,539 (96.5%) | 56 (3.5%) |
| Foreign Born, not a Citizen | 514 (79.2%) | 135 (20.8%) |
Health Insurance Coverage by Household Income in Bloomingdale
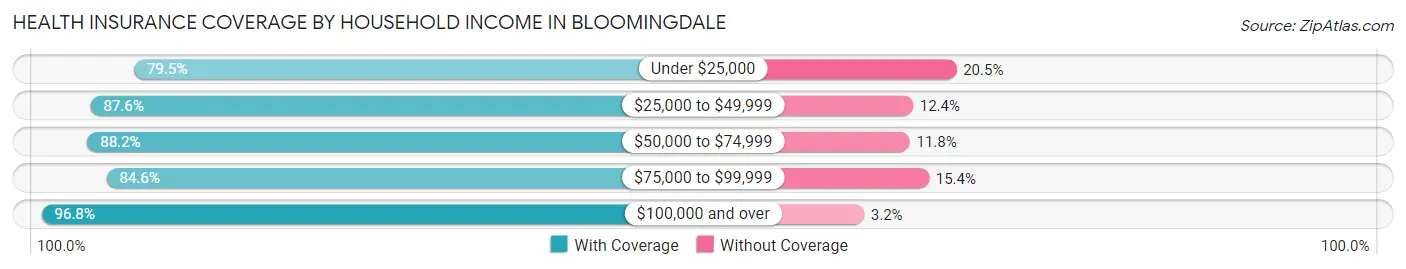
| Household Income | With Coverage | Without Coverage |
| Under $25,000 | 1,047 (79.5%) | 270 (20.5%) |
| $25,000 to $49,999 | 2,332 (87.6%) | 329 (12.4%) |
| $50,000 to $74,999 | 1,546 (88.2%) | 206 (11.8%) |
| $75,000 to $99,999 | 887 (84.6%) | 161 (15.4%) |
| $100,000 and over | 2,066 (96.8%) | 68 (3.2%) |
Public vs Private Health Insurance Coverage by Age in Bloomingdale
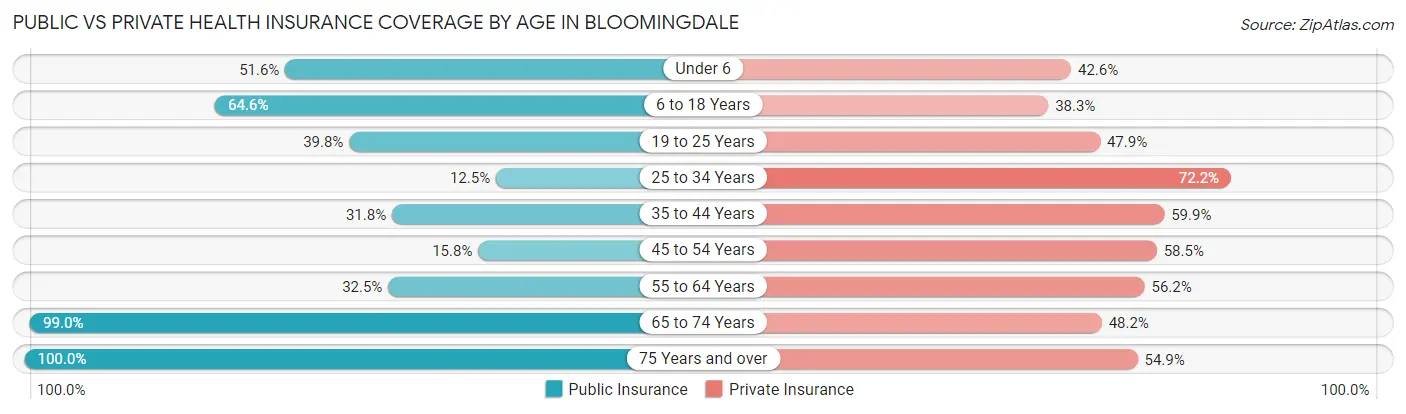
| Age Bracket | Public Insurance | Private Insurance |
| Under 6 | 222 (51.6%) | 183 (42.6%) |
| 6 to 18 Years | 1,031 (64.6%) | 611 (38.3%) |
| 19 to 25 Years | 258 (39.8%) | 311 (47.9%) |
| 25 to 34 Years | 117 (12.5%) | 676 (72.2%) |
| 35 to 44 Years | 347 (31.8%) | 653 (59.9%) |
| 45 to 54 Years | 227 (15.8%) | 840 (58.5%) |
| 55 to 64 Years | 331 (32.5%) | 572 (56.2%) |
| 65 to 74 Years | 759 (99.0%) | 370 (48.2%) |
| 75 Years and over | 989 (100.0%) | 543 (54.9%) |
| Total | 4,281 (48.0%) | 4,759 (53.4%) |
Disability Status by Sex by Age in Bloomingdale
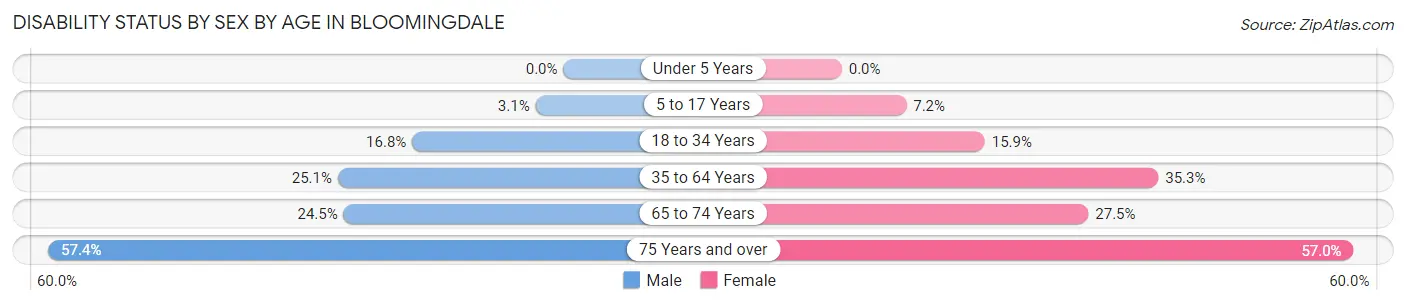
| Age Bracket | Male | Female |
| Under 5 Years | 0 (0.0%) | 0 (0.0%) |
| 5 to 17 Years | 22 (3.1%) | 57 (7.2%) |
| 18 to 34 Years | 165 (16.8%) | 112 (15.9%) |
| 35 to 64 Years | 471 (25.1%) | 589 (35.2%) |
| 65 to 74 Years | 71 (24.5%) | 131 (27.5%) |
| 75 Years and over | 210 (57.4%) | 355 (57.0%) |
Disability Class by Sex by Age in Bloomingdale
Disability Class: Hearing Difficulty
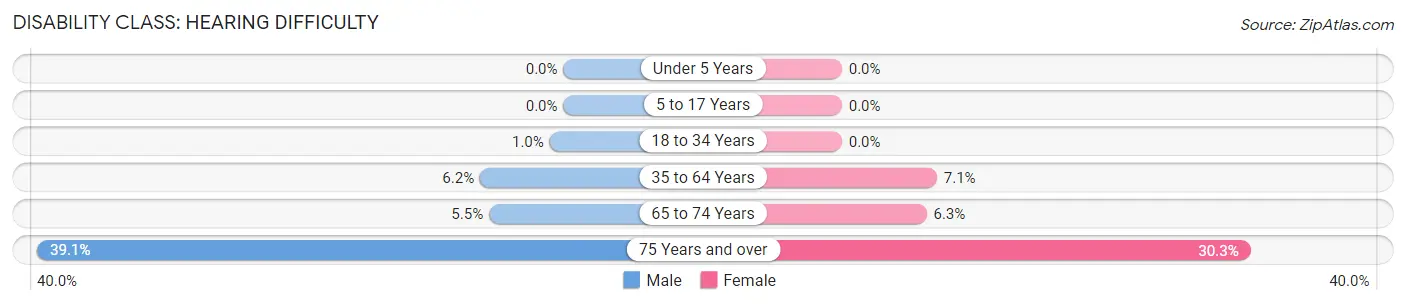
| Age Bracket | Male | Female |
| Under 5 Years | 0 (0.0%) | 0 (0.0%) |
| 5 to 17 Years | 0 (0.0%) | 0 (0.0%) |
| 18 to 34 Years | 10 (1.0%) | 0 (0.0%) |
| 35 to 64 Years | 116 (6.2%) | 118 (7.1%) |
| 65 to 74 Years | 16 (5.5%) | 30 (6.3%) |
| 75 Years and over | 143 (39.1%) | 189 (30.3%) |
Disability Class: Vision Difficulty
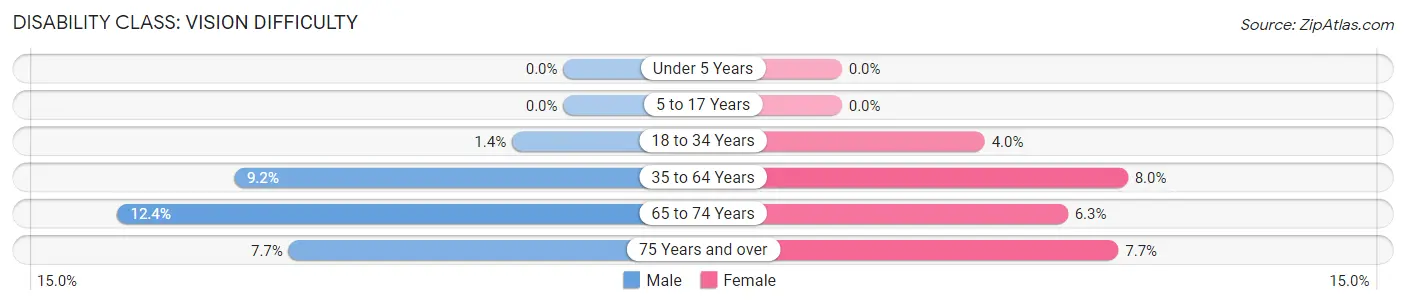
| Age Bracket | Male | Female |
| Under 5 Years | 0 (0.0%) | 0 (0.0%) |
| 5 to 17 Years | 0 (0.0%) | 0 (0.0%) |
| 18 to 34 Years | 14 (1.4%) | 28 (4.0%) |
| 35 to 64 Years | 172 (9.2%) | 133 (8.0%) |
| 65 to 74 Years | 36 (12.4%) | 30 (6.3%) |
| 75 Years and over | 28 (7.6%) | 48 (7.7%) |
Disability Class: Cognitive Difficulty
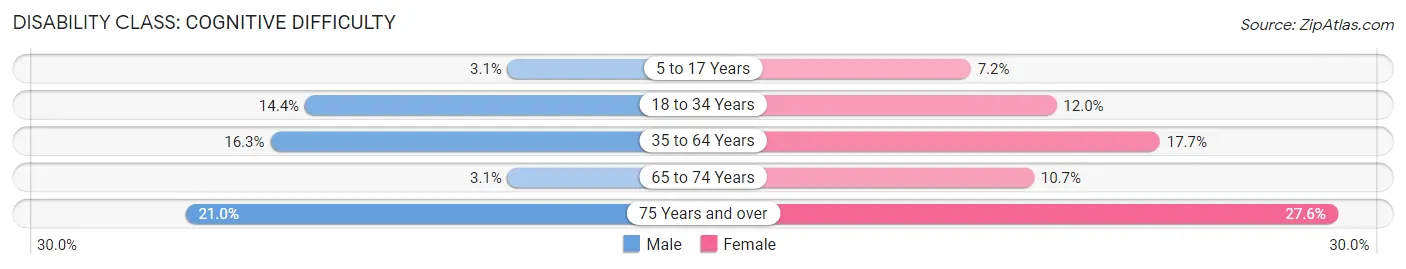
| Age Bracket | Male | Female |
| 5 to 17 Years | 22 (3.1%) | 57 (7.2%) |
| 18 to 34 Years | 141 (14.4%) | 84 (11.9%) |
| 35 to 64 Years | 306 (16.3%) | 296 (17.7%) |
| 65 to 74 Years | 9 (3.1%) | 51 (10.7%) |
| 75 Years and over | 77 (21.0%) | 172 (27.6%) |
Disability Class: Ambulatory Difficulty
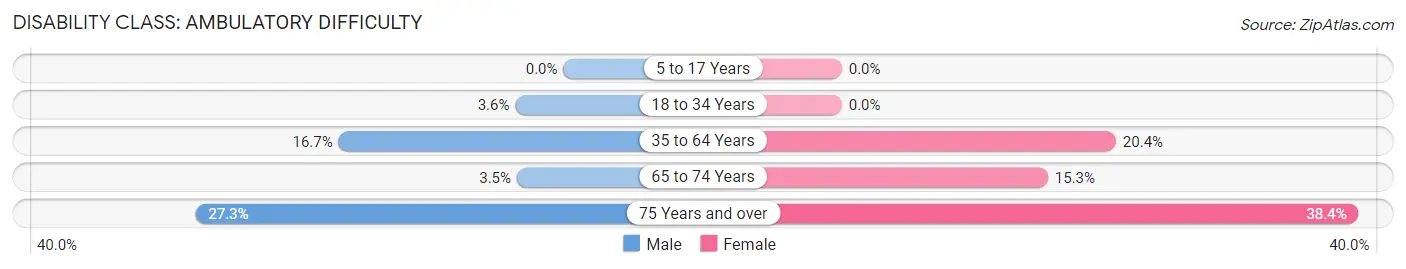
| Age Bracket | Male | Female |
| 5 to 17 Years | 0 (0.0%) | 0 (0.0%) |
| 18 to 34 Years | 35 (3.6%) | 0 (0.0%) |
| 35 to 64 Years | 313 (16.7%) | 340 (20.3%) |
| 65 to 74 Years | 10 (3.5%) | 73 (15.3%) |
| 75 Years and over | 100 (27.3%) | 239 (38.4%) |
Disability Class: Self-Care Difficulty
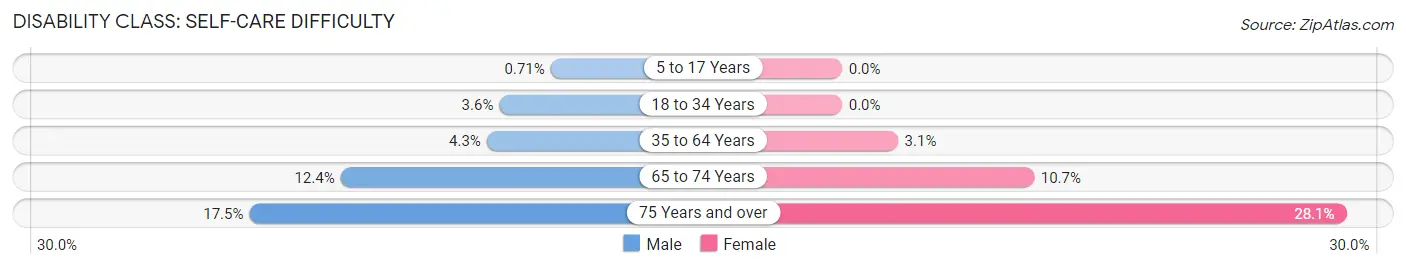
| Age Bracket | Male | Female |
| 5 to 17 Years | 5 (0.7%) | 0 (0.0%) |
| 18 to 34 Years | 35 (3.6%) | 0 (0.0%) |
| 35 to 64 Years | 80 (4.3%) | 52 (3.1%) |
| 65 to 74 Years | 36 (12.4%) | 51 (10.7%) |
| 75 Years and over | 64 (17.5%) | 175 (28.1%) |
Technology Access in Bloomingdale
Computing Device Access in Bloomingdale
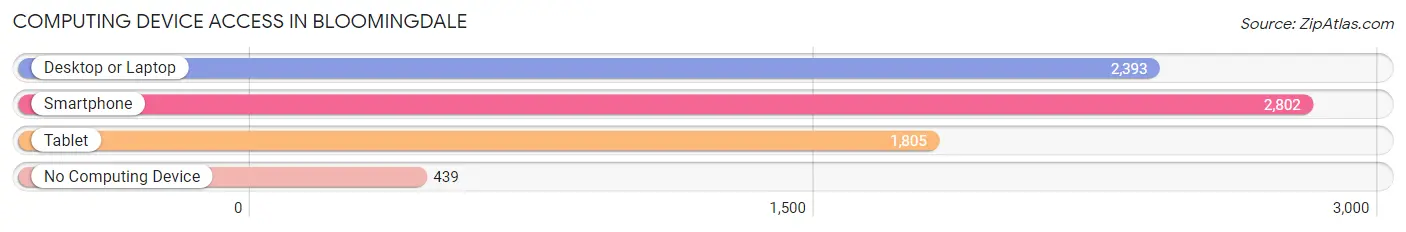
| Device Type | # Households | % Households |
| Desktop or Laptop | 2,393 | 65.5% |
| Smartphone | 2,802 | 76.7% |
| Tablet | 1,805 | 49.4% |
| No Computing Device | 439 | 12.0% |
| Total | 3,653 | 100.0% |
Internet Access in Bloomingdale
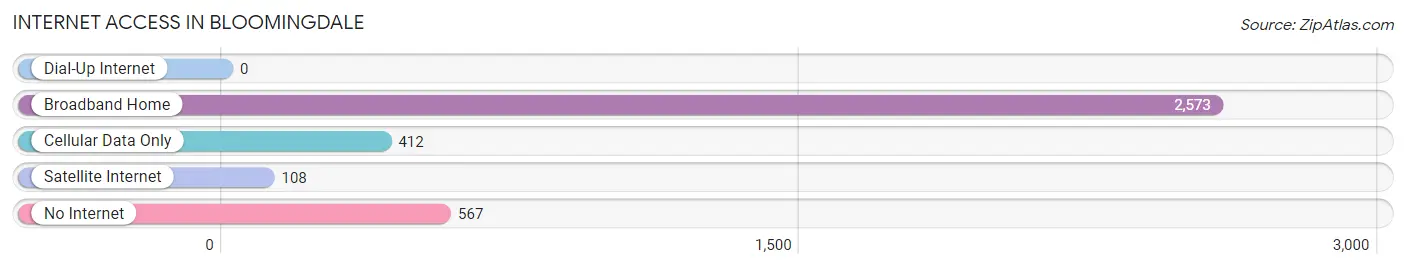
| Internet Type | # Households | % Households |
| Dial-Up Internet | 0 | 0.0% |
| Broadband Home | 2,573 | 70.4% |
| Cellular Data Only | 412 | 11.3% |
| Satellite Internet | 108 | 3.0% |
| No Internet | 567 | 15.5% |
| Total | 3,653 | 100.0% |
Bloomingdale Summary
Bloomingdale is a small town located in Hamilton County, Tennessee. It is situated on the banks of the Tennessee River, just north of Chattanooga. The town was founded in 1837 and has a population of just over 1,000 people.
History
Bloomingdale was founded in 1837 by a group of settlers from North Carolina. The town was named after the blooming wildflowers that grew in the area. The town was originally a farming community, but it soon became a popular stop for travelers on the Tennessee River. In the late 1800s, the town was home to a number of businesses, including a general store, a blacksmith shop, and a hotel.
In the early 1900s, the town began to decline as the railroad bypassed it. The town was nearly abandoned by the 1940s, but it was revived in the 1950s when the Tennessee Valley Authority (TVA) built a dam on the Tennessee River. The dam created a lake, which brought new life to the town.
Geography
Bloomingdale is located in Hamilton County, Tennessee, on the banks of the Tennessee River. The town is situated at the base of Lookout Mountain, which provides a stunning backdrop. The town is surrounded by rolling hills and lush forests. The climate is mild, with hot summers and cool winters.
Economy
The economy of Bloomingdale is largely based on tourism. The town is a popular destination for fishing, boating, and camping. There are also several restaurants and shops in the town. The TVA dam has also created a number of jobs in the area.
Demographics
As of the 2010 census, the population of Bloomingdale was 1,072. The racial makeup of the town was 95.3% White, 1.2% African American, 0.3% Native American, 0.2% Asian, 0.1% Pacific Islander, and 2.9% from other races. The median household income was $37,500, and the median family income was $45,000. The per capita income was $19,000.
Conclusion
Bloomingdale is a small town located in Hamilton County, Tennessee. It was founded in 1837 and has a population of just over 1,000 people. The town is situated on the banks of the Tennessee River and is surrounded by rolling hills and lush forests. The economy of Bloomingdale is largely based on tourism, and the town is a popular destination for fishing, boating, and camping. The racial makeup of the town is predominantly White, with a small percentage of African American, Native American, Asian, and Pacific Islander residents. The median household income is $37,500, and the median family income is $45,000.
Common Questions
What is the Total Population of Bloomingdale?
Total Population of Bloomingdale is 8,946.
What is the Total Male Population of Bloomingdale?
Total Male Population of Bloomingdale is 4,538.
What is the Total Female Population of Bloomingdale?
Total Female Population of Bloomingdale is 4,408.
What is the Ratio of Males per 100 Females in Bloomingdale?
There are 102.95 Males per 100 Females in Bloomingdale.
What is the Ratio of Females per 100 Males in Bloomingdale?
There are 97.14 Females per 100 Males in Bloomingdale.
What is the Median Population Age in Bloomingdale?
Median Population Age in Bloomingdale is 41.0 Years.
What is the Average Family Size in Bloomingdale
Average Family Size in Bloomingdale is 3.2 People.
What is the Average Household Size in Bloomingdale
Average Household Size in Bloomingdale is 2.4 People.
What is Per Capita Income in Bloomingdale?
Per Capita income in Bloomingdale is $28,424.
What is the Median Family Income in Bloomingdale?
Median Family Income in Bloomingdale is $59,460.
What is the Median Household income in Bloomingdale?
Median Household Income in Bloomingdale is $48,981.
What is Income or Wage Gap in Bloomingdale?
Income or Wage Gap in Bloomingdale is 31.1%.
Women in Bloomingdale earn 68.9 cents for every dollar earned by a man.
What is Family Income Deficit in Bloomingdale?
Family Income Deficit in Bloomingdale is $14,700.
Families that are below poverty line in Bloomingdale earn $14,700 less on average than the poverty threshold level.
What is Inequality or Gini Index in Bloomingdale?
Inequality or Gini Index in Bloomingdale is 0.47.
How Large is the Labor Force in Bloomingdale?
There are 4,050 People in the Labor Forcein in Bloomingdale.
What is the Percentage of People in the Labor Force in Bloomingdale?
55.5% of People are in the Labor Force in Bloomingdale.
What is the Unemployment Rate in Bloomingdale?
Unemployment Rate in Bloomingdale is 4.6%.