Cities with the Lowest Costs of Housing as Percentage of Income in New Mexico
RELATED REPORTS & OPTIONS
Lowest Housing Costs / Income
New Mexico
Compare Cities
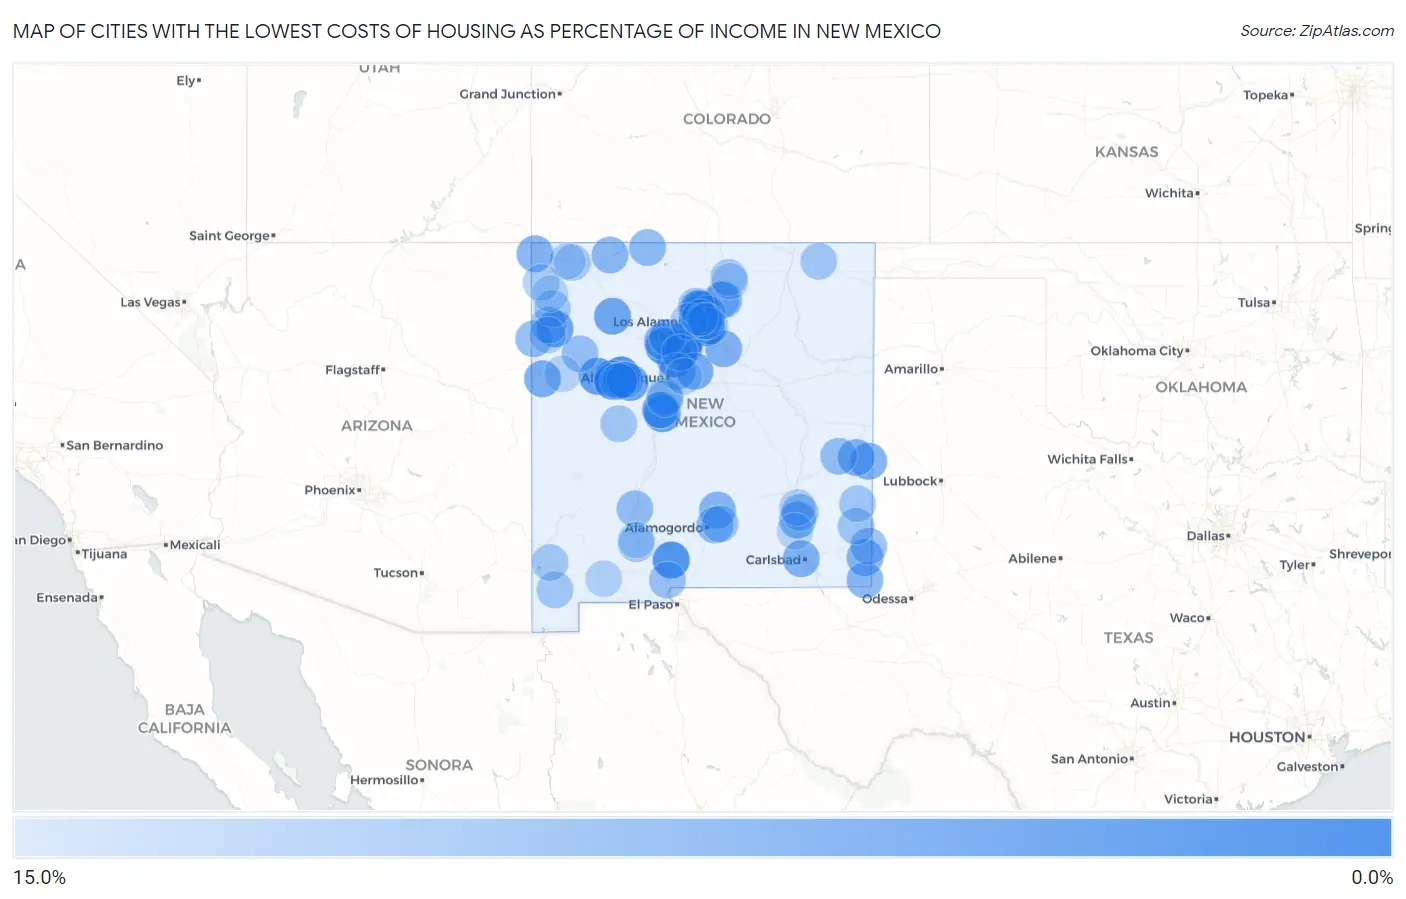
Map of Cities with the Lowest Costs of Housing as Percentage of Income in New Mexico
15.0%
0.0%
Cities with the Lowest Costs of Housing as Percentage of Income in New Mexico
| City | Housing Costs / Income | vs State | vs National | |
| 1. | Sombrillo | 2.6% | 18.8%(-16.2)#1 | 20.4%(-17.8)#3 |
| 2. | Tesuque Pueblo | 4.0% | 18.8%(-14.9)#2 | 20.4%(-16.4)#33 |
| 3. | San Ildefonso Pueblo | 4.0% | 18.8%(-14.8)#3 | 20.4%(-16.4)#34 |
| 4. | Encinal | 4.4% | 18.8%(-14.5)#4 | 20.4%(-16.0)#44 |
| 5. | Organ | 4.7% | 18.8%(-14.1)#5 | 20.4%(-15.7)#59 |
| 6. | Acomita Lake | 4.7% | 18.8%(-14.1)#6 | 20.4%(-15.6)#60 |
| 7. | Ohkay Owingeh | 5.0% | 18.8%(-13.8)#7 | 20.4%(-15.3)#78 |
| 8. | Little Walnut | 5.1% | 18.8%(-13.8)#8 | 20.4%(-15.3)#82 |
| 9. | Cochiti | 5.2% | 18.8%(-13.7)#9 | 20.4%(-15.2)#92 |
| 10. | Fort Wingate | 5.2% | 18.8%(-13.6)#10 | 20.4%(-15.2)#94 |
| 11. | Bluewater | 5.4% | 18.8%(-13.4)#11 | 20.4%(-15.0)#105 |
| 12. | Santa Ana Pueblo | 5.4% | 18.8%(-13.4)#12 | 20.4%(-14.9)#106 |
| 13. | Santa Clara Pueblo | 5.5% | 18.8%(-13.3)#13 | 20.4%(-14.9)#113 |
| 14. | Zia Pueblo | 5.8% | 18.8%(-13.1)#14 | 20.4%(-14.6)#139 |
| 15. | San Rafael | 5.9% | 18.8%(-12.9)#15 | 20.4%(-14.5)#151 |
| 16. | Casa Colorada | 6.2% | 18.8%(-12.6)#16 | 20.4%(-14.2)#194 |
| 17. | Skyline Ganipa | 6.2% | 18.8%(-12.6)#17 | 20.4%(-14.2)#195 |
| 18. | Santo Domingo Pueblo | 6.3% | 18.8%(-12.6)#18 | 20.4%(-14.1)#206 |
| 19. | Mesita | 6.4% | 18.8%(-12.4)#19 | 20.4%(-14.0)#227 |
| 20. | Chamita | 6.6% | 18.8%(-12.2)#20 | 20.4%(-13.8)#257 |
| 21. | Brimhall Nizhoni | 6.6% | 18.8%(-12.2)#21 | 20.4%(-13.7)#265 |
| 22. | Pueblo Pintado | 6.8% | 18.8%(-12.0)#22 | 20.4%(-13.6)#295 |
| 23. | Seton | 6.9% | 18.8%(-12.0)#23 | 20.4%(-13.5)#313 |
| 24. | Zuni Pueblo | 7.7% | 18.8%(-11.1)#24 | 20.4%(-12.7)#491 |
| 25. | Cedar Grove | 7.7% | 18.8%(-11.1)#25 | 20.4%(-12.7)#492 |
| 26. | Causey | 7.8% | 18.8%(-11.0)#26 | 20.4%(-12.6)#515 |
| 27. | Rowe | 8.1% | 18.8%(-10.7)#27 | 20.4%(-12.3)#603 |
| 28. | Happy Valley | 8.2% | 18.8%(-10.6)#28 | 20.4%(-12.1)#628 |
| 29. | Sundance | 8.3% | 18.8%(-10.5)#29 | 20.4%(-12.1)#661 |
| 30. | Paraje | 8.3% | 18.8%(-10.5)#30 | 20.4%(-12.0)#664 |
| 31. | Dora | 8.4% | 18.8%(-10.4)#31 | 20.4%(-12.0)#686 |
| 32. | Eunice | 8.4% | 18.8%(-10.4)#32 | 20.4%(-12.0)#695 |
| 33. | Beclabito | 8.4% | 18.8%(-10.4)#33 | 20.4%(-11.9)#698 |
| 34. | Lake Arthur | 8.5% | 18.8%(-10.3)#34 | 20.4%(-11.9)#726 |
| 35. | Jemez Pueblo | 8.7% | 18.8%(-10.2)#35 | 20.4%(-11.7)#779 |
| 36. | Mescalero | 8.7% | 18.8%(-10.1)#36 | 20.4%(-11.7)#788 |
| 37. | Iyanbito | 8.7% | 18.8%(-10.1)#37 | 20.4%(-11.6)#797 |
| 38. | Ponderosa | 8.9% | 18.8%(-9.97)#38 | 20.4%(-11.5)#838 |
| 39. | Jal | 8.9% | 18.8%(-9.96)#39 | 20.4%(-11.5)#844 |
| 40. | Navajo Dam | 9.0% | 18.8%(-9.89)#40 | 20.4%(-11.4)#879 |
| 41. | Jarales | 9.0% | 18.8%(-9.80)#41 | 20.4%(-11.3)#913 |
| 42. | Dulce | 9.1% | 18.8%(-9.71)#42 | 20.4%(-11.2)#950 |
| 43. | High Rolls | 9.2% | 18.8%(-9.61)#43 | 20.4%(-11.1)#989 |
| 44. | Vadito | 9.3% | 18.8%(-9.54)#44 | 20.4%(-11.1)#1,024 |
| 45. | Laguna | 9.3% | 18.8%(-9.53)#45 | 20.4%(-11.1)#1,029 |
| 46. | Tse Bonito | 9.4% | 18.8%(-9.44)#46 | 20.4%(-11.0)#1,087 |
| 47. | Picacho Hills | 9.4% | 18.8%(-9.42)#47 | 20.4%(-11.0)#1,093 |
| 48. | Mount Taylor | 9.4% | 18.8%(-9.40)#48 | 20.4%(-10.9)#1,110 |
| 49. | Sandia Heights | 9.5% | 18.8%(-9.37)#49 | 20.4%(-10.9)#1,120 |
| 50. | Elida | 9.6% | 18.8%(-9.25)#50 | 20.4%(-10.8)#1,177 |
| 51. | Picuris Pueblo | 9.6% | 18.8%(-9.24)#51 | 20.4%(-10.8)#1,184 |
| 52. | Chimayo | 9.6% | 18.8%(-9.20)#52 | 20.4%(-10.7)#1,203 |
| 53. | Elephant Butte | 9.7% | 18.8%(-9.11)#53 | 20.4%(-10.6)#1,258 |
| 54. | Pena Blanca | 9.8% | 18.8%(-9.07)#54 | 20.4%(-10.6)#1,270 |
| 55. | Placitas Cdp Sandoval County | 9.8% | 18.8%(-9.04)#55 | 20.4%(-10.6)#1,297 |
| 56. | Nadine | 9.8% | 18.8%(-9.01)#56 | 20.4%(-10.5)#1,324 |
| 57. | Thoreau | 10.0% | 18.8%(-8.80)#57 | 20.4%(-10.3)#1,432 |
| 58. | Vado | 10.1% | 18.8%(-8.75)#58 | 20.4%(-10.3)#1,466 |
| 59. | Hagerman | 10.1% | 18.8%(-8.69)#59 | 20.4%(-10.2)#1,498 |
| 60. | Cloudcroft | 10.3% | 18.8%(-8.54)#60 | 20.4%(-10.1)#1,586 |
| 61. | Seama | 10.4% | 18.8%(-8.43)#61 | 20.4%(-9.96)#1,660 |
| 62. | Chili | 10.4% | 18.8%(-8.41)#62 | 20.4%(-9.95)#1,669 |
| 63. | Canada De Los Alamos | 10.5% | 18.8%(-8.37)#63 | 20.4%(-9.90)#1,704 |
| 64. | Lovington | 10.5% | 18.8%(-8.32)#64 | 20.4%(-9.85)#1,738 |
| 65. | Tohatchi | 10.5% | 18.8%(-8.30)#65 | 20.4%(-9.83)#1,755 |
| 66. | Valencia | 10.5% | 18.8%(-8.30)#66 | 20.4%(-9.83)#1,757 |
| 67. | South River | 10.6% | 18.8%(-8.21)#67 | 20.4%(-9.74)#1,829 |
| 68. | Tatum | 10.8% | 18.8%(-8.05)#68 | 20.4%(-9.58)#1,935 |
| 69. | Capulin | 10.8% | 18.8%(-8.03)#69 | 20.4%(-9.56)#1,946 |
| 70. | Haystack | 10.8% | 18.8%(-8.00)#70 | 20.4%(-9.53)#1,976 |
| 71. | Alamo | 10.8% | 18.8%(-7.99)#71 | 20.4%(-9.53)#1,977 |
| 72. | Windmill | 10.9% | 18.8%(-7.98)#72 | 20.4%(-9.51)#1,991 |
| 73. | Glen Acres | 11.0% | 18.8%(-7.86)#73 | 20.4%(-9.39)#2,084 |
| 74. | Naschitti | 11.0% | 18.8%(-7.82)#74 | 20.4%(-9.36)#2,111 |
| 75. | Rio Rancho Estates | 11.1% | 18.8%(-7.77)#75 | 20.4%(-9.30)#2,149 |
| 76. | Hatch | 11.1% | 18.8%(-7.74)#76 | 20.4%(-9.28)#2,172 |
| 77. | Upper Fruitland | 11.1% | 18.8%(-7.73)#77 | 20.4%(-9.26)#2,178 |
| 78. | Pueblitos | 11.3% | 18.8%(-7.59)#78 | 20.4%(-9.12)#2,292 |
| 79. | Arroyo Seco | 11.3% | 18.8%(-7.53)#79 | 20.4%(-9.07)#2,338 |
| 80. | Chupadero | 11.3% | 18.8%(-7.52)#80 | 20.4%(-9.05)#2,345 |
| 81. | Los Alamos | 11.6% | 18.8%(-7.26)#81 | 20.4%(-8.79)#2,589 |
| 82. | El Cerro | 11.6% | 18.8%(-7.22)#82 | 20.4%(-8.75)#2,626 |
| 83. | Sanostee | 11.7% | 18.8%(-7.14)#83 | 20.4%(-8.68)#2,703 |
| 84. | Las Campanas | 11.7% | 18.8%(-7.13)#84 | 20.4%(-8.67)#2,712 |
| 85. | Pojoaque | 11.7% | 18.8%(-7.13)#85 | 20.4%(-8.66)#2,719 |
| 86. | Nambe | 11.8% | 18.8%(-7.04)#86 | 20.4%(-8.57)#2,827 |
| 87. | Twin Lakes | 11.9% | 18.8%(-6.98)#87 | 20.4%(-8.52)#2,895 |
| 88. | Dexter | 11.9% | 18.8%(-6.98)#88 | 20.4%(-8.51)#2,900 |
| 89. | Lindrith | 11.9% | 18.8%(-6.93)#89 | 20.4%(-8.47)#2,939 |
| 90. | San Felipe Pueblo | 11.9% | 18.8%(-6.91)#90 | 20.4%(-8.45)#2,965 |
| 91. | Sunshine | 12.0% | 18.8%(-6.89)#91 | 20.4%(-8.42)#2,988 |
| 92. | San Jose Cdp Rio Arriba County | 12.1% | 18.8%(-6.75)#92 | 20.4%(-8.29)#3,110 |
| 93. | Cedar Crest | 12.1% | 18.8%(-6.72)#93 | 20.4%(-8.26)#3,140 |
| 94. | Nenahnezad | 12.1% | 18.8%(-6.70)#94 | 20.4%(-8.23)#3,181 |
| 95. | Taos Pueblo | 12.2% | 18.8%(-6.64)#95 | 20.4%(-8.18)#3,245 |
| 96. | La Mesilla | 12.3% | 18.8%(-6.53)#96 | 20.4%(-8.07)#3,362 |
| 97. | Salem | 12.3% | 18.8%(-6.51)#97 | 20.4%(-8.05)#3,382 |
| 98. | Newcomb | 12.4% | 18.8%(-6.48)#98 | 20.4%(-8.01)#3,422 |
| 99. | Ramah | 12.4% | 18.8%(-6.42)#99 | 20.4%(-7.95)#3,491 |
| 100. | Artesia | 12.4% | 18.8%(-6.39)#100 | 20.4%(-7.93)#3,520 |
Common Questions
What are the Top 10 Cities with the Lowest Costs of Housing as Percentage of Income in New Mexico?
Top 10 Cities with the Lowest Costs of Housing as Percentage of Income in New Mexico are:
#1
2.6%
#2
4.0%
#3
4.0%
#4
4.4%
#5
4.7%
#6
4.7%
#7
5.0%
#8
5.2%
#9
5.4%
#10
5.5%
What city has the Lowest Costs of Housing as Percentage of Income in New Mexico?
Sombrillo has the Lowest Costs of Housing as Percentage of Income in New Mexico with 2.6%.
What is the Average Housing Costs as Percentage of Income in the State of New Mexico?
Average Housing Costs as Percentage of Income in New Mexico is 18.8%.
What is the Average Housing Costs as Percentage of Income in the United States?
Average Housing Costs as Percentage of Income in the United States is 20.4%.