Lake View, SC
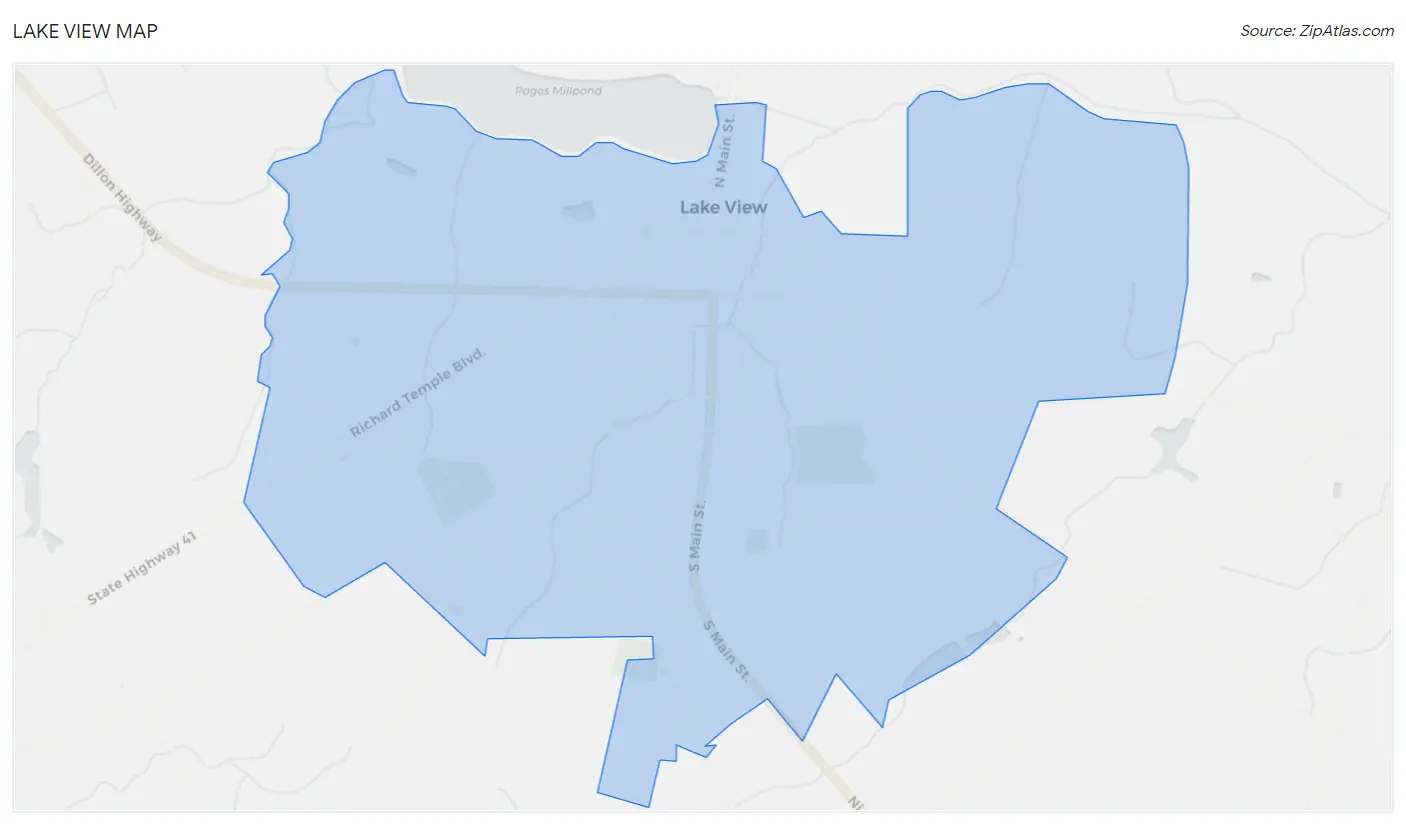
Lake View Map
Lake View Overview
702
TOTAL POPULATION
327
MALE POPULATION
375
FEMALE POPULATION
87.20
MALES / 100 FEMALES
114.68
FEMALES / 100 MALES
48.0
MEDIAN AGE
3.4
AVG FAMILY SIZE
2.3
AVG HOUSEHOLD SIZE
$18,178
PER CAPITA INCOME
$45,682
AVG FAMILY INCOME
$24,853
AVG HOUSEHOLD INCOME
23.2%
WAGE / INCOME GAP [ % ]
76.8¢/ $1
WAGE / INCOME GAP [ $ ]
0.53
INEQUALITY / GINI INDEX
253
LABOR FORCE [ PEOPLE ]
44.9%
PERCENT IN LABOR FORCE
3.6%
UNEMPLOYMENT RATE
Lake View Zip Codes
Lake View Area Codes
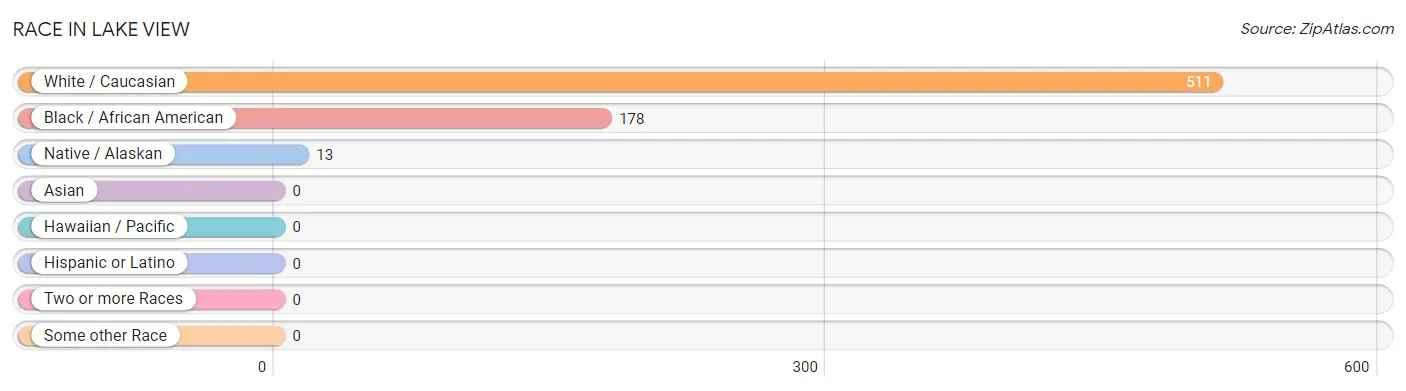
Race in Lake View
The most populous races in Lake View are White / Caucasian (511 | 72.8%), Black / African American (178 | 25.4%), and Native / Alaskan (13 | 1.8%).
| Race | # Population | % Population |
| Asian | 0 | 0.0% |
| Black / African American | 178 | 25.4% |
| Hawaiian / Pacific | 0 | 0.0% |
| Hispanic or Latino | 0 | 0.0% |
| Native / Alaskan | 13 | 1.8% |
| White / Caucasian | 511 | 72.8% |
| Two or more Races | 0 | 0.0% |
| Some other Race | 0 | 0.0% |
| Total | 702 | 100.0% |
Ancestry in Lake View
The most populous ancestries reported in Lake View are American (199 | 28.3%), English (103 | 14.7%), Scottish (21 | 3.0%), Irish (18 | 2.6%), and Scotch-Irish (9 | 1.3%), together accounting for 49.8% of all Lake View residents.
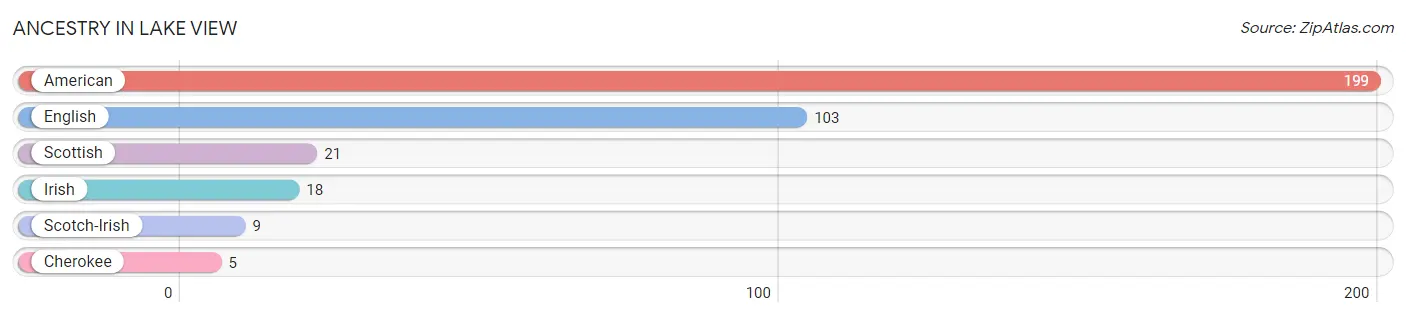
| Ancestry | # Population | % Population |
| American | 199 | 28.3% |
| Cherokee | 5 | 0.7% |
| English | 103 | 14.7% |
| Irish | 18 | 2.6% |
| Scotch-Irish | 9 | 1.3% |
| Scottish | 21 | 3.0% | View All 6 Rows |
Immigrants in Lake View

| Immigration Origin | # Population | % Population | View All 0 Rows |
Sex and Age in Lake View
Sex and Age in Lake View
The most populous age groups in Lake View are 15 to 19 Years (42 | 12.8%) for men and 50 to 54 Years (43 | 11.5%) for women.
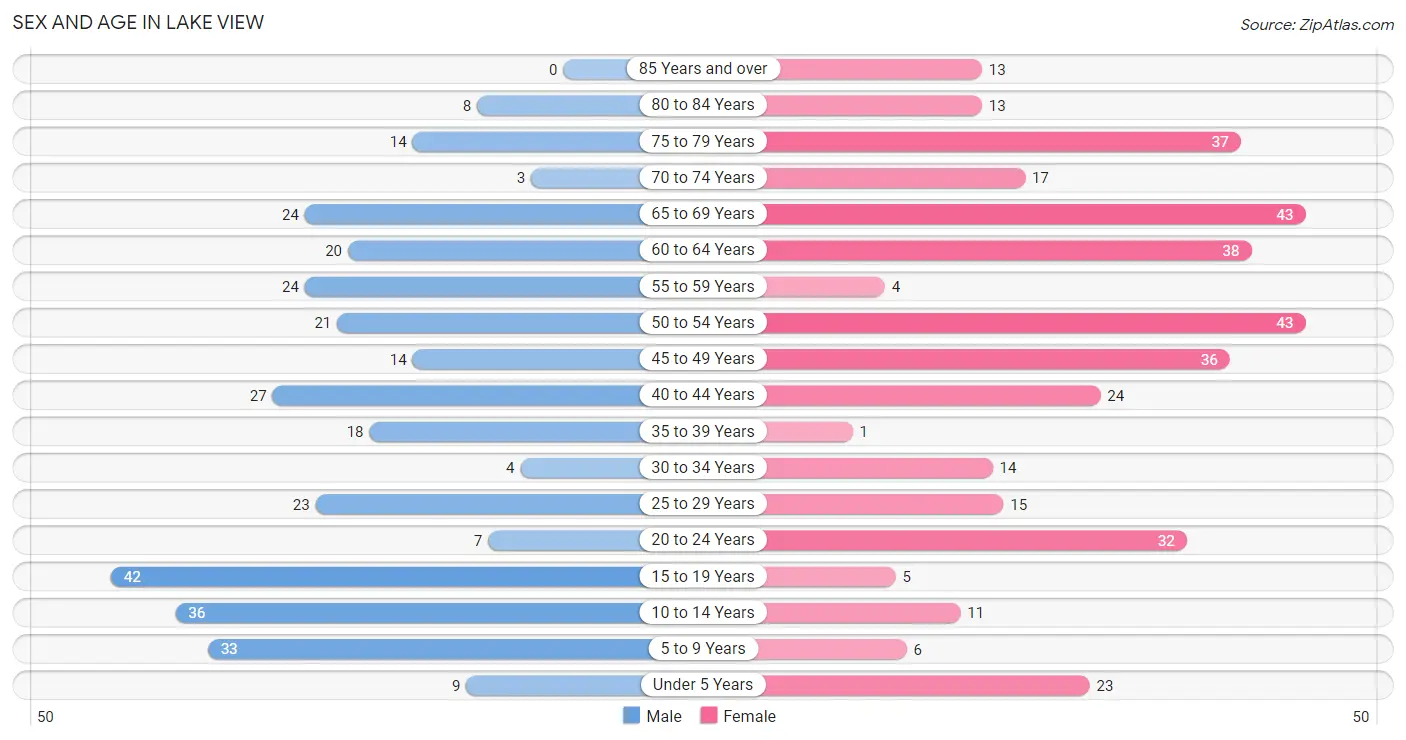
| Age Bracket | Male | Female |
| Under 5 Years | 9 (2.8%) | 23 (6.1%) |
| 5 to 9 Years | 33 (10.1%) | 6 (1.6%) |
| 10 to 14 Years | 36 (11.0%) | 11 (2.9%) |
| 15 to 19 Years | 42 (12.8%) | 5 (1.3%) |
| 20 to 24 Years | 7 (2.1%) | 32 (8.5%) |
| 25 to 29 Years | 23 (7.0%) | 15 (4.0%) |
| 30 to 34 Years | 4 (1.2%) | 14 (3.7%) |
| 35 to 39 Years | 18 (5.5%) | 1 (0.3%) |
| 40 to 44 Years | 27 (8.3%) | 24 (6.4%) |
| 45 to 49 Years | 14 (4.3%) | 36 (9.6%) |
| 50 to 54 Years | 21 (6.4%) | 43 (11.5%) |
| 55 to 59 Years | 24 (7.3%) | 4 (1.1%) |
| 60 to 64 Years | 20 (6.1%) | 38 (10.1%) |
| 65 to 69 Years | 24 (7.3%) | 43 (11.5%) |
| 70 to 74 Years | 3 (0.9%) | 17 (4.5%) |
| 75 to 79 Years | 14 (4.3%) | 37 (9.9%) |
| 80 to 84 Years | 8 (2.5%) | 13 (3.5%) |
| 85 Years and over | 0 (0.0%) | 13 (3.5%) |
| Total | 327 (100.0%) | 375 (100.0%) |
Families and Households in Lake View
Median Family Size in Lake View
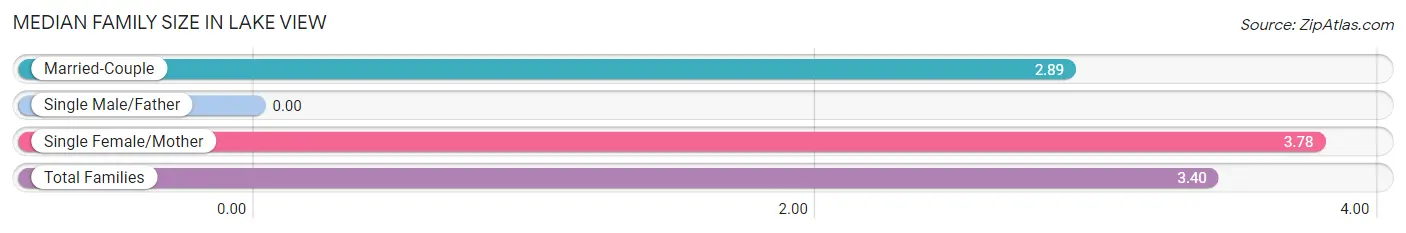
| Family Type | # Families | Family Size |
| Married-Couple | 53 (42.1%) | 2.89 |
| Single Male/Father | 0 (0.0%) | - |
| Single Female/Mother | 73 (57.9%) | 3.78 |
| Total Families | 126 (100.0%) | 3.40 |
Median Household Size in Lake View
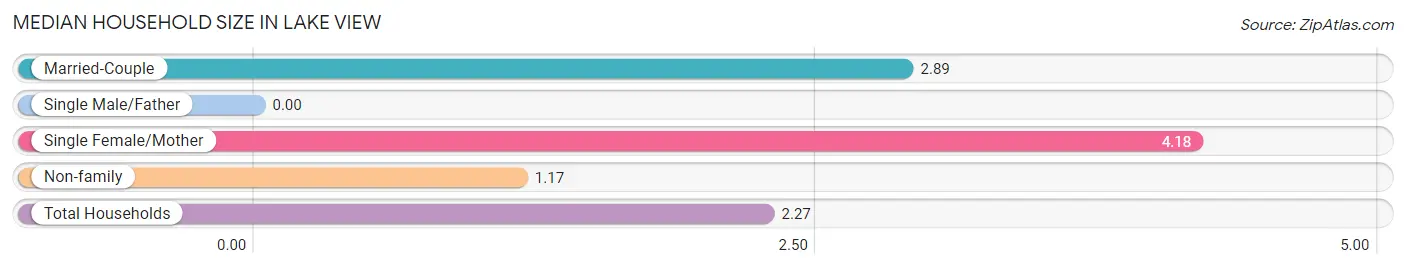
| Household Type | # Households | Household Size |
| Married-Couple | 53 (18.8%) | 2.89 |
| Single Male/Father | 0 (0.0%) | - |
| Single Female/Mother | 73 (25.9%) | 4.18 |
| Non-family | 156 (55.3%) | 1.17 |
| Total Households | 282 (100.0%) | 2.27 |
Household Size by Marriage Status in Lake View
Out of a total of 282 households in Lake View, 126 (44.7%) are family households, while 156 (55.3%) are nonfamily households. The most numerous type of family households are 2-person households, comprising 41, and the most common type of nonfamily households are 1-person households, comprising 146.
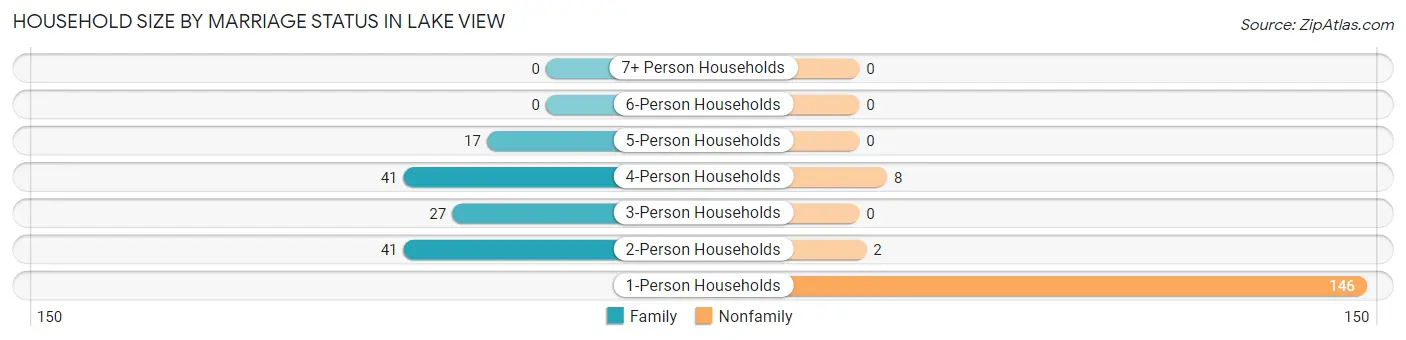
| Household Size | Family Households | Nonfamily Households |
| 1-Person Households | - | 146 (51.8%) |
| 2-Person Households | 41 (14.5%) | 2 (0.7%) |
| 3-Person Households | 27 (9.6%) | 0 (0.0%) |
| 4-Person Households | 41 (14.5%) | 8 (2.8%) |
| 5-Person Households | 17 (6.0%) | 0 (0.0%) |
| 6-Person Households | 0 (0.0%) | 0 (0.0%) |
| 7+ Person Households | 0 (0.0%) | 0 (0.0%) |
| Total | 126 (44.7%) | 156 (55.3%) |
Female Fertility in Lake View
Fertility by Age in Lake View
Average fertility rate in Lake View is 43.0 births per 1,000 women. Women in the age bracket of 20 to 34 years have the highest fertility rate with 98.0 births per 1,000 women. Women in the age bracket of 20 to 34 years acount for 100.0% of all women with births.
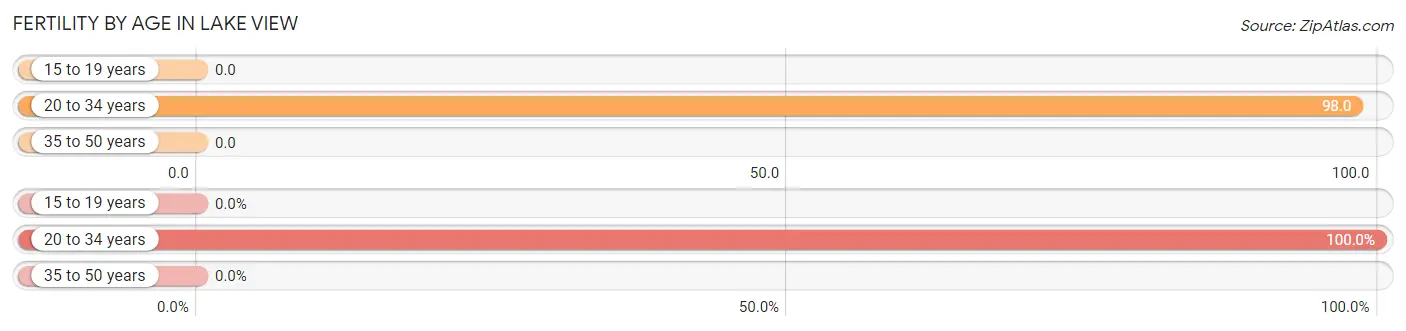
| Age Bracket | Women with Births | Births / 1,000 Women |
| 15 to 19 years | 0 (0.0%) | 0.0 |
| 20 to 34 years | 6 (100.0%) | 98.0 |
| 35 to 50 years | 0 (0.0%) | 0.0 |
| Total | 6 (100.0%) | 43.0 |
Fertility by Age by Marriage Status in Lake View
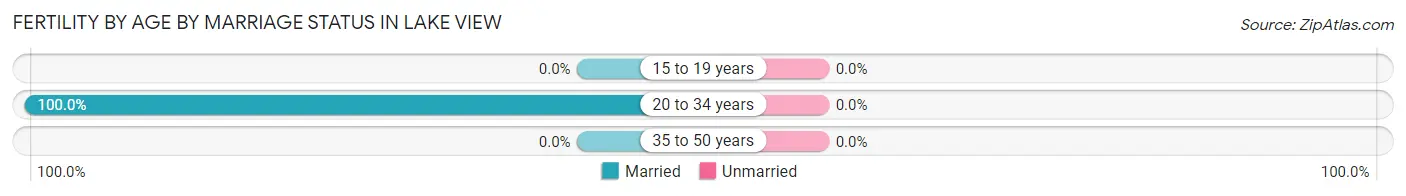
| Age Bracket | Married | Unmarried |
| 15 to 19 years | 0 (0.0%) | 0 (0.0%) |
| 20 to 34 years | 6 (100.0%) | 0 (0.0%) |
| 35 to 50 years | 0 (0.0%) | 0 (0.0%) |
| Total | 6 (100.0%) | 0 (0.0%) |
Fertility by Education in Lake View
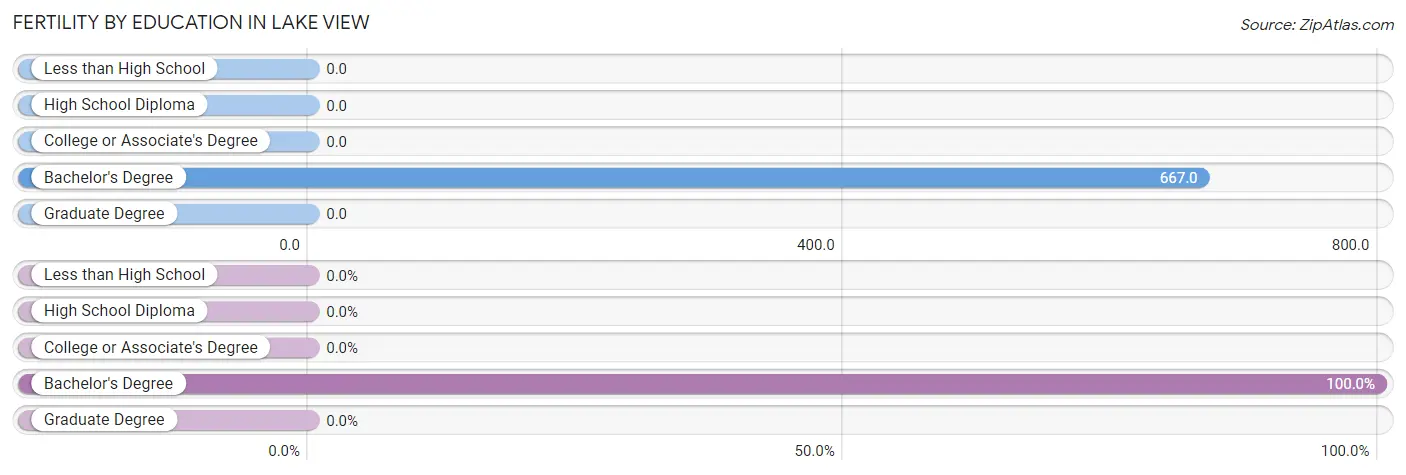
| Educational Attainment | Women with Births | Births / 1,000 Women |
| Less than High School | 0 (0.0%) | 0.0 |
| High School Diploma | 0 (0.0%) | 0.0 |
| College or Associate's Degree | 0 (0.0%) | 0.0 |
| Bachelor's Degree | 6 (100.0%) | 667.0 |
| Graduate Degree | 0 (0.0%) | 0.0 |
| Total | 6 (100.0%) | 43.0 |
Fertility by Education by Marriage Status in Lake View
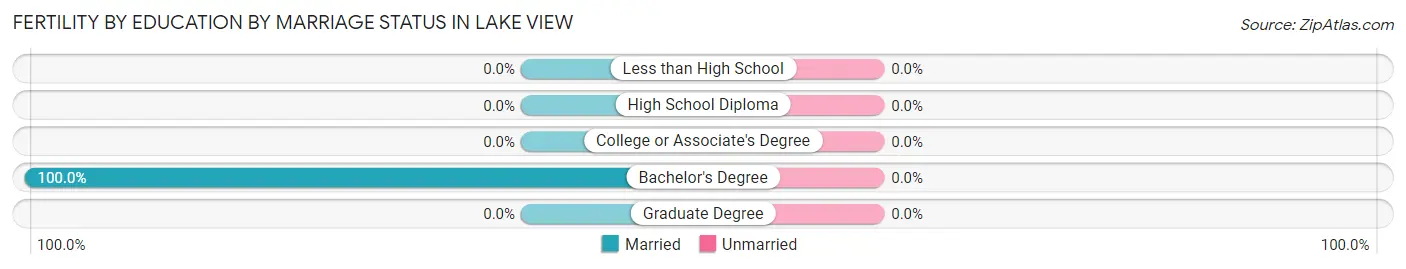
| Educational Attainment | Married | Unmarried |
| Less than High School | 0 (0.0%) | 0 (0.0%) |
| High School Diploma | 0 (0.0%) | 0 (0.0%) |
| College or Associate's Degree | 0 (0.0%) | 0 (0.0%) |
| Bachelor's Degree | 6 (100.0%) | 0 (0.0%) |
| Graduate Degree | 0 (0.0%) | 0 (0.0%) |
| Total | 6 (100.0%) | 0 (0.0%) |
Income in Lake View
Income Overview in Lake View
Per Capita Income in Lake View is $18,178, while median incomes of families and households are $45,682 and $24,853 respectively.
| Characteristic | Number | Measure |
| Per Capita Income | 702 | $18,178 |
| Median Family Income | 126 | $45,682 |
| Mean Family Income | 126 | $58,494 |
| Median Household Income | 282 | $24,853 |
| Mean Household Income | 282 | $39,839 |
| Income Deficit | 126 | $0 |
| Wage / Income Gap (%) | 702 | 23.24% |
| Wage / Income Gap ($) | 702 | 76.76¢ per $1 |
| Gini / Inequality Index | 702 | 0.53 |
Earnings by Sex in Lake View
Average Earnings in Lake View are $33,150, $42,667 for men and $32,750 for women, a difference of 23.2%.
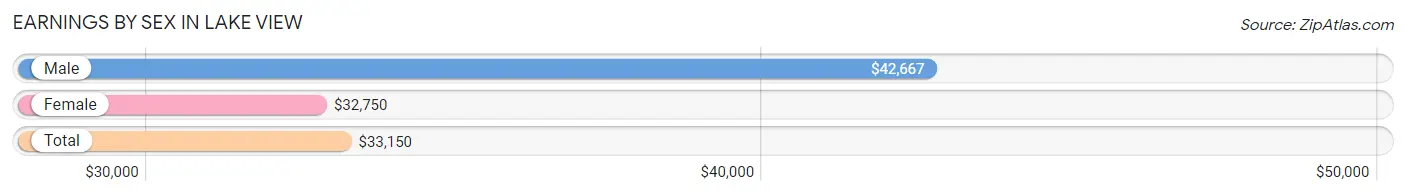
| Sex | Number | Average Earnings |
| Male | 114 (45.4%) | $42,667 |
| Female | 137 (54.6%) | $32,750 |
| Total | 251 (100.0%) | $33,150 |
Earnings by Sex by Income Bracket in Lake View
The most common earnings brackets in Lake View are $45,000 to $49,999 for men (31 | 27.2%) and $30,000 to $34,999 for women (25 | 18.2%).
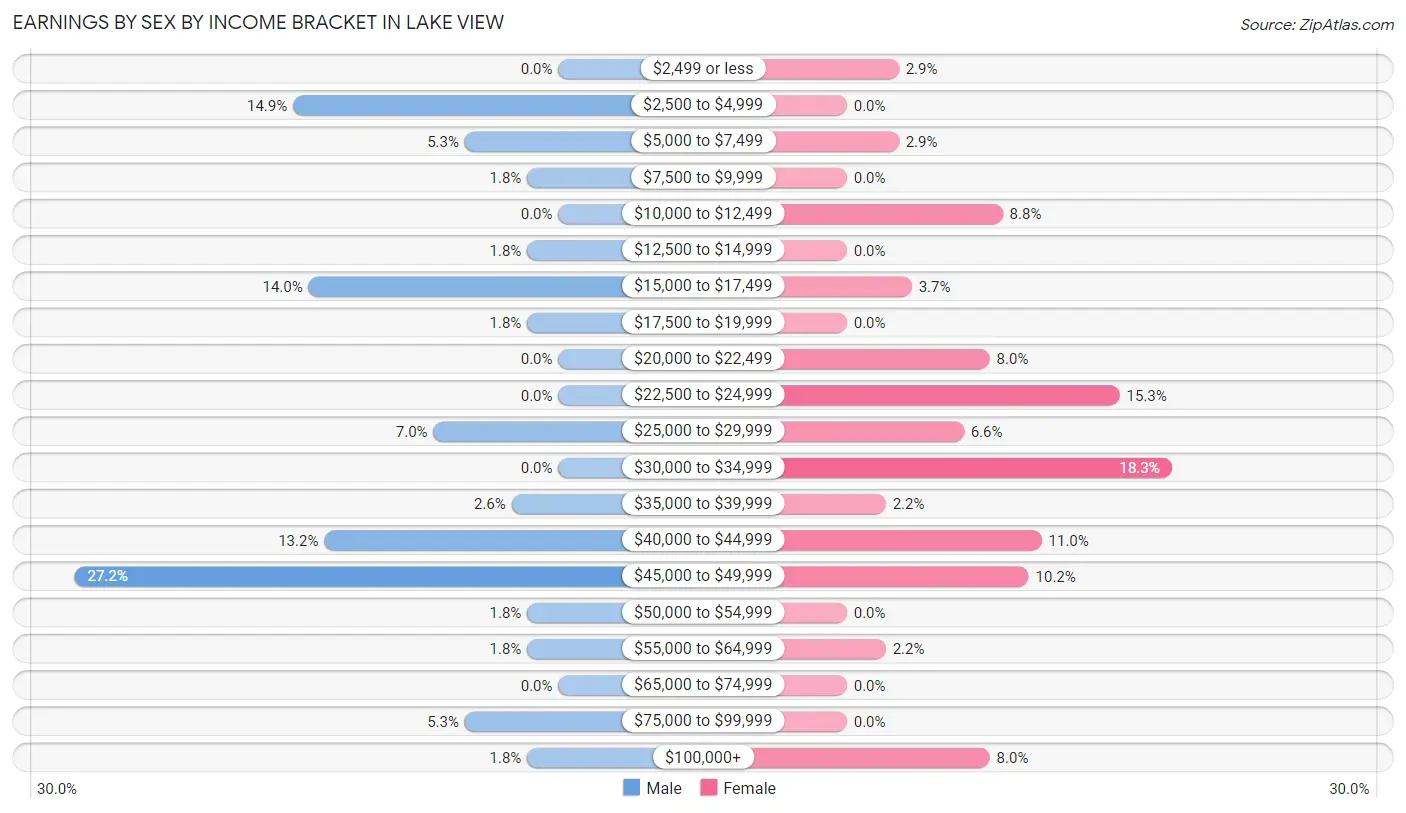
| Income | Male | Female |
| $2,499 or less | 0 (0.0%) | 4 (2.9%) |
| $2,500 to $4,999 | 17 (14.9%) | 0 (0.0%) |
| $5,000 to $7,499 | 6 (5.3%) | 4 (2.9%) |
| $7,500 to $9,999 | 2 (1.8%) | 0 (0.0%) |
| $10,000 to $12,499 | 0 (0.0%) | 12 (8.8%) |
| $12,500 to $14,999 | 2 (1.8%) | 0 (0.0%) |
| $15,000 to $17,499 | 16 (14.0%) | 5 (3.6%) |
| $17,500 to $19,999 | 2 (1.8%) | 0 (0.0%) |
| $20,000 to $22,499 | 0 (0.0%) | 11 (8.0%) |
| $22,500 to $24,999 | 0 (0.0%) | 21 (15.3%) |
| $25,000 to $29,999 | 8 (7.0%) | 9 (6.6%) |
| $30,000 to $34,999 | 0 (0.0%) | 25 (18.2%) |
| $35,000 to $39,999 | 3 (2.6%) | 3 (2.2%) |
| $40,000 to $44,999 | 15 (13.2%) | 15 (11.0%) |
| $45,000 to $49,999 | 31 (27.2%) | 14 (10.2%) |
| $50,000 to $54,999 | 2 (1.8%) | 0 (0.0%) |
| $55,000 to $64,999 | 2 (1.8%) | 3 (2.2%) |
| $65,000 to $74,999 | 0 (0.0%) | 0 (0.0%) |
| $75,000 to $99,999 | 6 (5.3%) | 0 (0.0%) |
| $100,000+ | 2 (1.8%) | 11 (8.0%) |
| Total | 114 (100.0%) | 137 (100.0%) |
Earnings by Sex by Educational Attainment in Lake View
Average earnings in Lake View are $44,167 for men and $34,350 for women, a difference of 22.2%. Men with an educational attainment of college or associate's degree enjoy the highest average annual earnings of $45,000, while those with high school diploma education earn the least with $43,500. Women with an educational attainment of high school diploma earn the most with the average annual earnings of $34,946, while those with college or associate's degree education have the smallest earnings of $15,250.
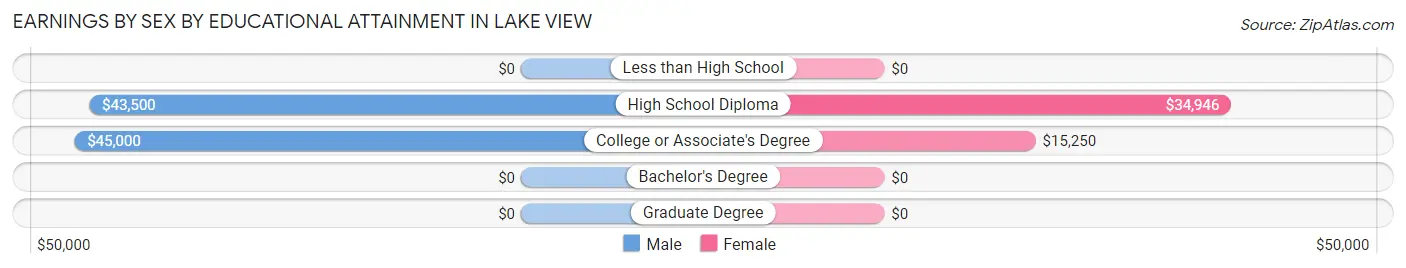
| Educational Attainment | Male Income | Female Income |
| Less than High School | - | - |
| High School Diploma | $43,500 | $34,946 |
| College or Associate's Degree | $45,000 | $15,250 |
| Bachelor's Degree | - | - |
| Graduate Degree | - | - |
| Total | $44,167 | $34,350 |
Family Income in Lake View
Family Income Brackets in Lake View
According to the Lake View family income data, there are 42 families falling into the $35,000 to $49,999 income range, which is the most common income bracket and makes up 33.3% of all families.
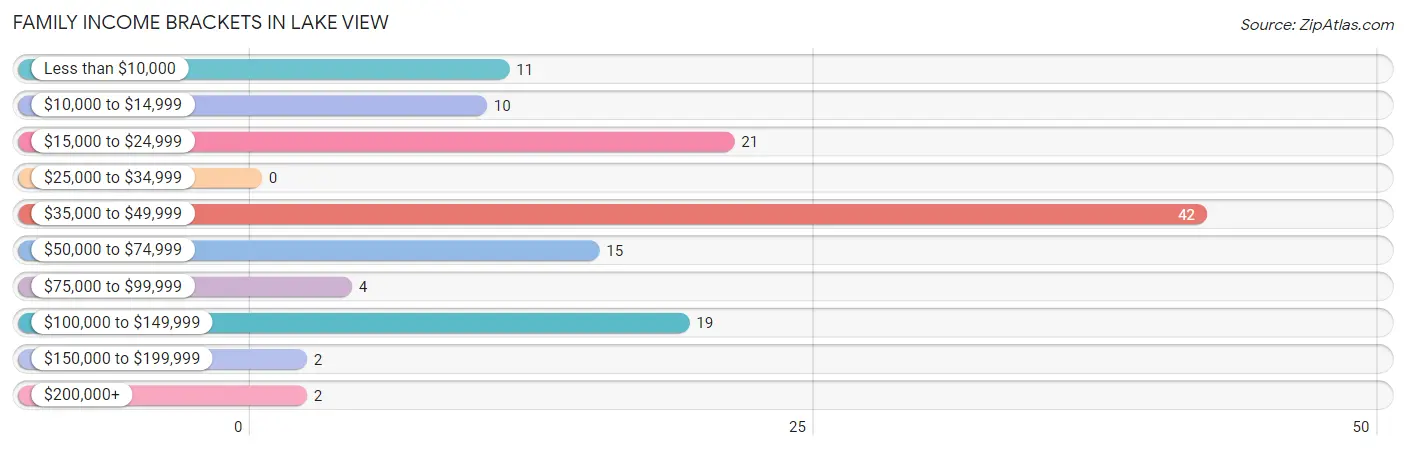
| Income Bracket | # Families | % Families |
| Less than $10,000 | 11 | 8.7% |
| $10,000 to $14,999 | 10 | 7.9% |
| $15,000 to $24,999 | 21 | 16.7% |
| $25,000 to $34,999 | 0 | 0.0% |
| $35,000 to $49,999 | 42 | 33.3% |
| $50,000 to $74,999 | 15 | 11.9% |
| $75,000 to $99,999 | 4 | 3.2% |
| $100,000 to $149,999 | 19 | 15.1% |
| $150,000 to $199,999 | 2 | 1.6% |
| $200,000+ | 2 | 1.6% |
Family Income by Famaliy Size in Lake View
2-person families (41 | 32.5%) account for the highest median family income in Lake View with $44,464 per family, while 2-person families (41 | 32.5%) have the highest median income of $22,232 per family member.
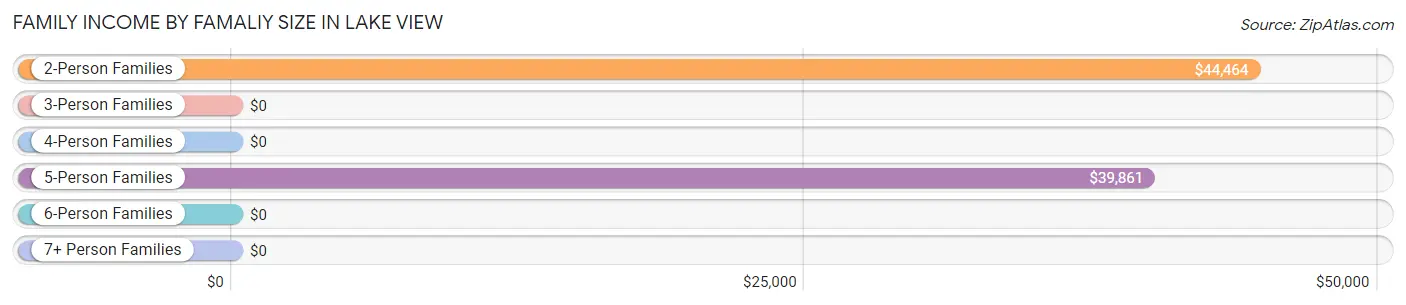
| Income Bracket | # Families | Median Income |
| 2-Person Families | 41 (32.5%) | $44,464 |
| 3-Person Families | 45 (35.7%) | $0 |
| 4-Person Families | 23 (18.2%) | $0 |
| 5-Person Families | 17 (13.5%) | $39,861 |
| 6-Person Families | 0 (0.0%) | $0 |
| 7+ Person Families | 0 (0.0%) | $0 |
| Total | 126 (100.0%) | $45,682 |
Family Income by Number of Earners in Lake View
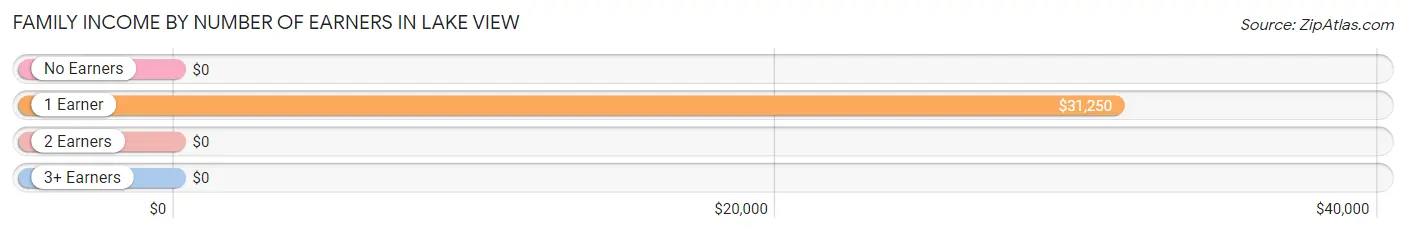
| Number of Earners | # Families | Median Income |
| No Earners | 37 (29.4%) | $0 |
| 1 Earner | 42 (33.3%) | $31,250 |
| 2 Earners | 45 (35.7%) | $0 |
| 3+ Earners | 2 (1.6%) | $0 |
| Total | 126 (100.0%) | $45,682 |
Household Income in Lake View
Household Income Brackets in Lake View
With 56 households falling in the category, the $10,000 to $14,999 income range is the most frequent in Lake View, accounting for 19.9% of all households. In contrast, only 2 households (0.7%) fall into the $150,000 to $199,999 income bracket, making it the least populous group.
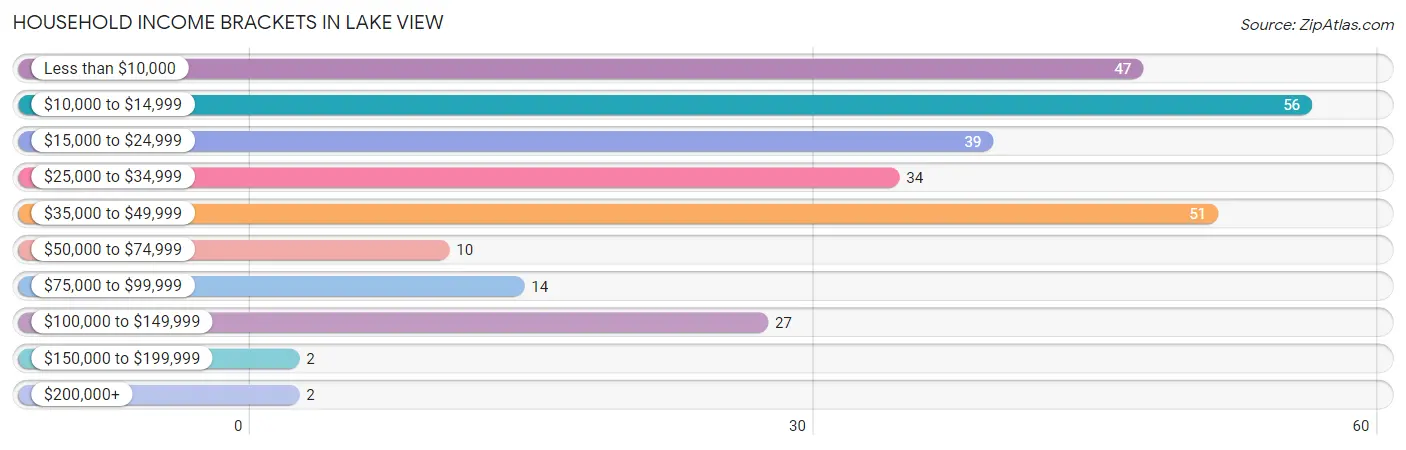
| Income Bracket | # Households | % Households |
| Less than $10,000 | 47 | 16.7% |
| $10,000 to $14,999 | 56 | 19.9% |
| $15,000 to $24,999 | 39 | 13.8% |
| $25,000 to $34,999 | 34 | 12.1% |
| $35,000 to $49,999 | 51 | 18.1% |
| $50,000 to $74,999 | 10 | 3.5% |
| $75,000 to $99,999 | 14 | 5.0% |
| $100,000 to $149,999 | 27 | 9.6% |
| $150,000 to $199,999 | 2 | 0.7% |
| $200,000+ | 2 | 0.7% |
Household Income by Householder Age in Lake View
The median household income in Lake View is $24,853, with the highest median household income of $45,568 found in the 45 to 64 years age bracket for the primary householder. A total of 109 households (38.7%) fall into this category. Meanwhile, the 15 to 24 years age bracket for the primary householder has the lowest median household income of $0, with 8 households (2.8%) in this group.
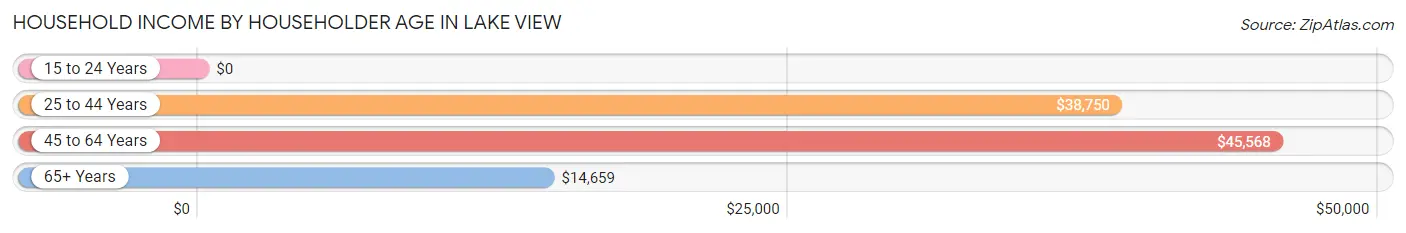
| Income Bracket | # Households | Median Income |
| 15 to 24 Years | 8 (2.8%) | $0 |
| 25 to 44 Years | 46 (16.3%) | $38,750 |
| 45 to 64 Years | 109 (38.7%) | $45,568 |
| 65+ Years | 119 (42.2%) | $14,659 |
| Total | 282 (100.0%) | $24,853 |
Poverty in Lake View
Income Below Poverty by Sex and Age in Lake View
With 30.7% poverty level for males and 33.8% for females among the residents of Lake View, 45 to 54 year old males and 12 to 14 year old females are the most vulnerable to poverty, with 25 males (71.4%) and 6 females (100.0%) in their respective age groups living below the poverty level.
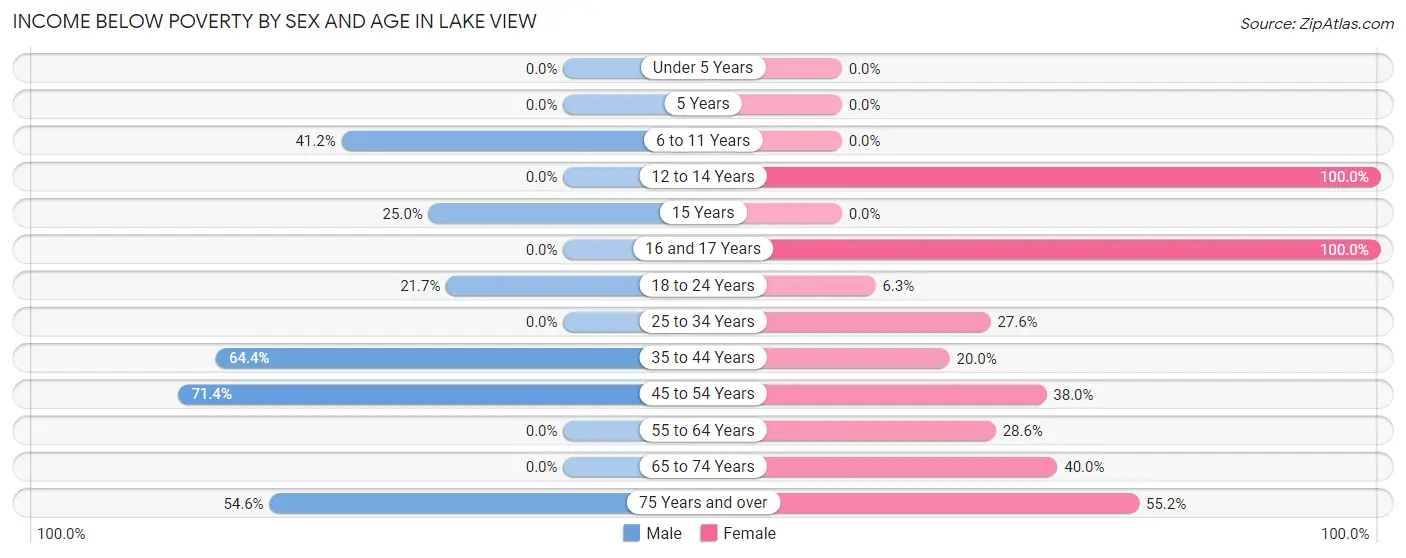
| Age Bracket | Male | Female |
| Under 5 Years | 0 (0.0%) | 0 (0.0%) |
| 5 Years | 0 (0.0%) | 0 (0.0%) |
| 6 to 11 Years | 21 (41.2%) | 0 (0.0%) |
| 12 to 14 Years | 0 (0.0%) | 6 (100.0%) |
| 15 Years | 5 (25.0%) | 0 (0.0%) |
| 16 and 17 Years | 0 (0.0%) | 5 (100.0%) |
| 18 to 24 Years | 5 (21.7%) | 2 (6.2%) |
| 25 to 34 Years | 0 (0.0%) | 8 (27.6%) |
| 35 to 44 Years | 29 (64.4%) | 5 (20.0%) |
| 45 to 54 Years | 25 (71.4%) | 30 (38.0%) |
| 55 to 64 Years | 0 (0.0%) | 12 (28.6%) |
| 65 to 74 Years | 0 (0.0%) | 24 (40.0%) |
| 75 Years and over | 12 (54.5%) | 32 (55.2%) |
| Total | 97 (30.7%) | 124 (33.8%) |
Income Above Poverty by Sex and Age in Lake View
According to the poverty statistics in Lake View, males aged under 5 years and females aged under 5 years are the age groups that are most secure financially, with 100.0% of males and 100.0% of females in these age groups living above the poverty line.
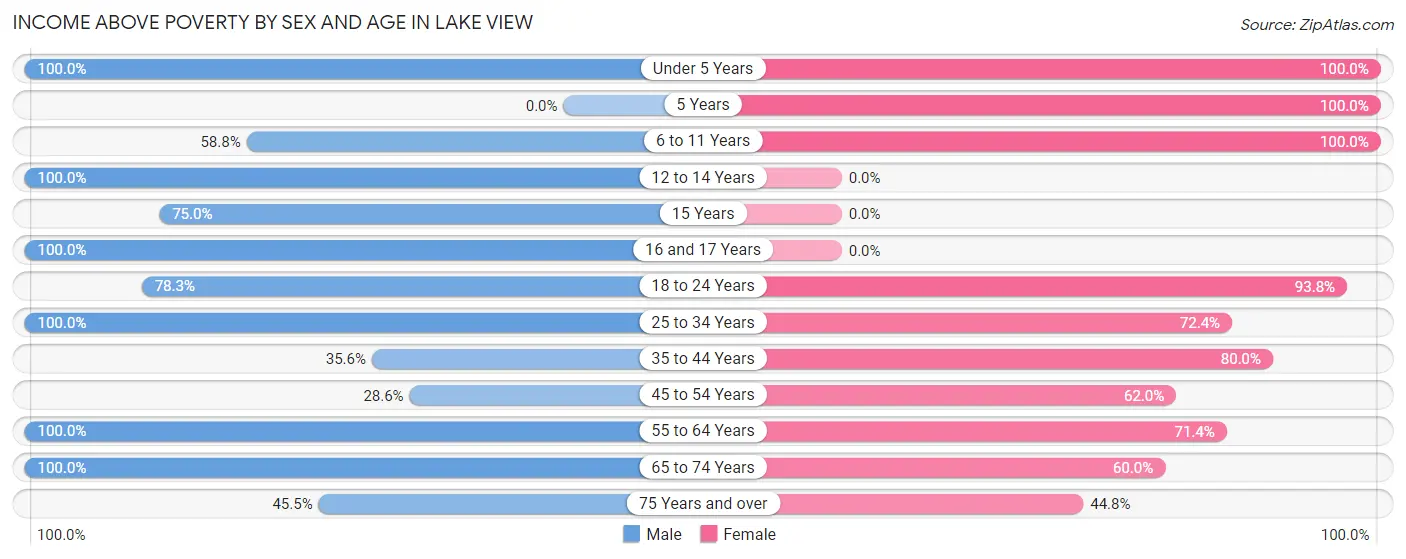
| Age Bracket | Male | Female |
| Under 5 Years | 9 (100.0%) | 23 (100.0%) |
| 5 Years | 0 (0.0%) | 5 (100.0%) |
| 6 to 11 Years | 30 (58.8%) | 3 (100.0%) |
| 12 to 14 Years | 7 (100.0%) | 0 (0.0%) |
| 15 Years | 15 (75.0%) | 0 (0.0%) |
| 16 and 17 Years | 6 (100.0%) | 0 (0.0%) |
| 18 to 24 Years | 18 (78.3%) | 30 (93.8%) |
| 25 to 34 Years | 27 (100.0%) | 21 (72.4%) |
| 35 to 44 Years | 16 (35.6%) | 20 (80.0%) |
| 45 to 54 Years | 10 (28.6%) | 49 (62.0%) |
| 55 to 64 Years | 44 (100.0%) | 30 (71.4%) |
| 65 to 74 Years | 27 (100.0%) | 36 (60.0%) |
| 75 Years and over | 10 (45.5%) | 26 (44.8%) |
| Total | 219 (69.3%) | 243 (66.2%) |
Income Below Poverty Among Married-Couple Families in Lake View
The poverty statistics for married-couple families in Lake View show that 22.6% or 12 of the total 53 families live below the poverty line. Families with 1 or 2 children have the highest poverty rate of 54.5%, comprising of 6 families. On the other hand, families with 3 or 4 children have the lowest poverty rate of 0.0%, which includes 0 families.
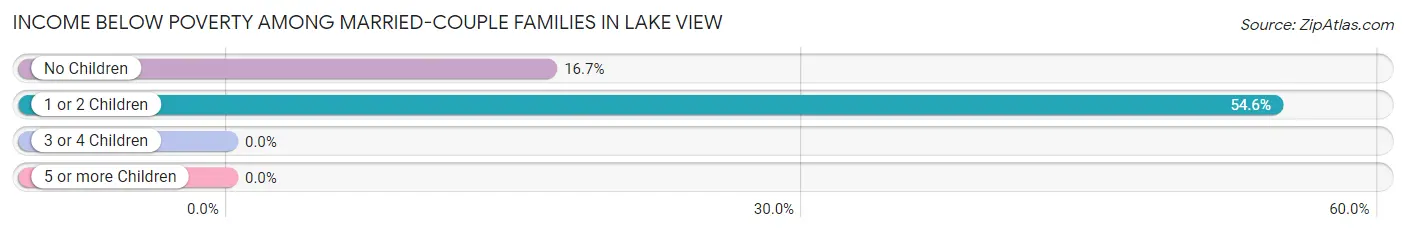
| Children | Above Poverty | Below Poverty |
| No Children | 30 (83.3%) | 6 (16.7%) |
| 1 or 2 Children | 5 (45.5%) | 6 (54.5%) |
| 3 or 4 Children | 6 (100.0%) | 0 (0.0%) |
| 5 or more Children | 0 (0.0%) | 0 (0.0%) |
| Total | 41 (77.4%) | 12 (22.6%) |
Income Below Poverty Among Single-Parent Households in Lake View
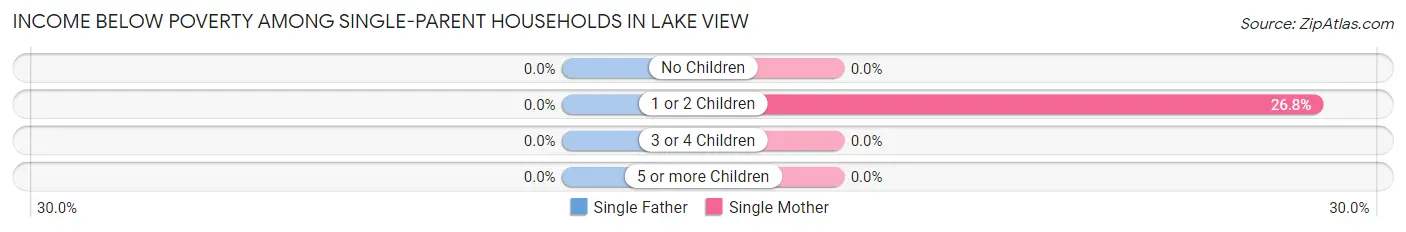
| Children | Single Father | Single Mother |
| No Children | 0 (0.0%) | 0 (0.0%) |
| 1 or 2 Children | 0 (0.0%) | 15 (26.8%) |
| 3 or 4 Children | 0 (0.0%) | 0 (0.0%) |
| 5 or more Children | 0 (0.0%) | 0 (0.0%) |
| Total | 0 (0.0%) | 15 (20.5%) |
Income Below Poverty Among Married-Couple vs Single-Parent Households in Lake View
The poverty data for Lake View shows that 12 of the married-couple family households (22.6%) and 15 of the single-parent households (20.5%) are living below the poverty level. Within the married-couple family households, those with 1 or 2 children have the highest poverty rate, with 6 households (54.5%) falling below the poverty line. Among the single-parent households, those with 1 or 2 children have the highest poverty rate, with 15 household (26.8%) living below poverty.
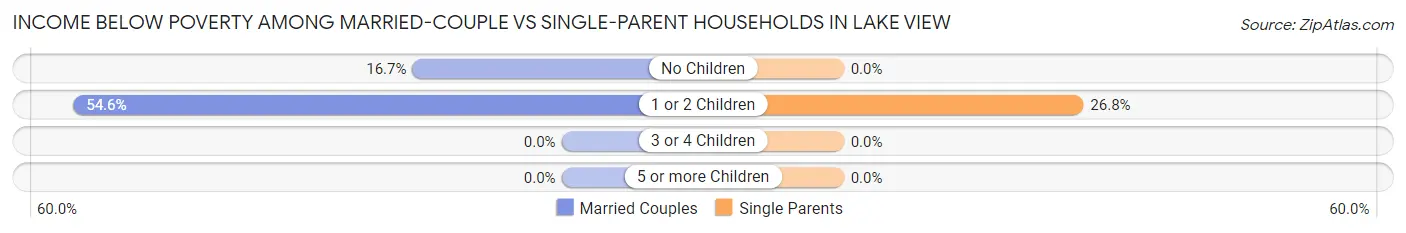
| Children | Married-Couple Families | Single-Parent Households |
| No Children | 6 (16.7%) | 0 (0.0%) |
| 1 or 2 Children | 6 (54.5%) | 15 (26.8%) |
| 3 or 4 Children | 0 (0.0%) | 0 (0.0%) |
| 5 or more Children | 0 (0.0%) | 0 (0.0%) |
| Total | 12 (22.6%) | 15 (20.5%) |
Employment Characteristics in Lake View
Employment by Class of Employer in Lake View
Among the 230 employed individuals in Lake View, private company employees (168 | 73.0%), local government employees (19 | 8.3%), and not-for-profit organizations (14 | 6.1%) make up the most common classes of employment.
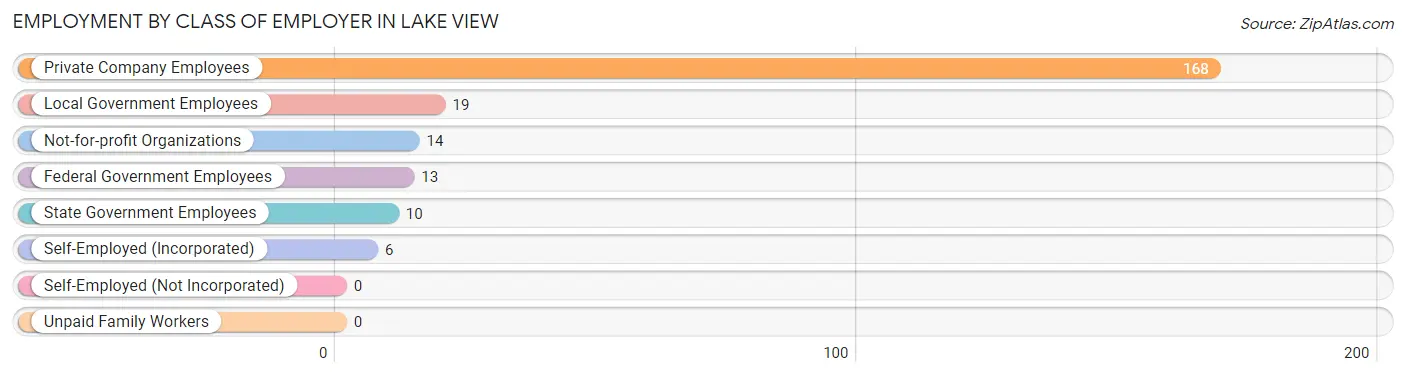
| Employer Class | # Employees | % Employees |
| Private Company Employees | 168 | 73.0% |
| Self-Employed (Incorporated) | 6 | 2.6% |
| Self-Employed (Not Incorporated) | 0 | 0.0% |
| Not-for-profit Organizations | 14 | 6.1% |
| Local Government Employees | 19 | 8.3% |
| State Government Employees | 10 | 4.3% |
| Federal Government Employees | 13 | 5.7% |
| Unpaid Family Workers | 0 | 0.0% |
| Total | 230 | 100.0% |
Employment Status by Age in Lake View
According to the labor force statistics for Lake View, out of the total population over 16 years of age (564), 44.9% or 253 individuals are in the labor force, with 3.6% or 9 of them unemployed. The age group with the highest labor force participation rate is 25 to 29 years, with 100.0% or 38 individuals in the labor force. Within the labor force, the 30 to 34 years age range has the highest percentage of unemployed individuals, with 87.5% or 7 of them being unemployed.
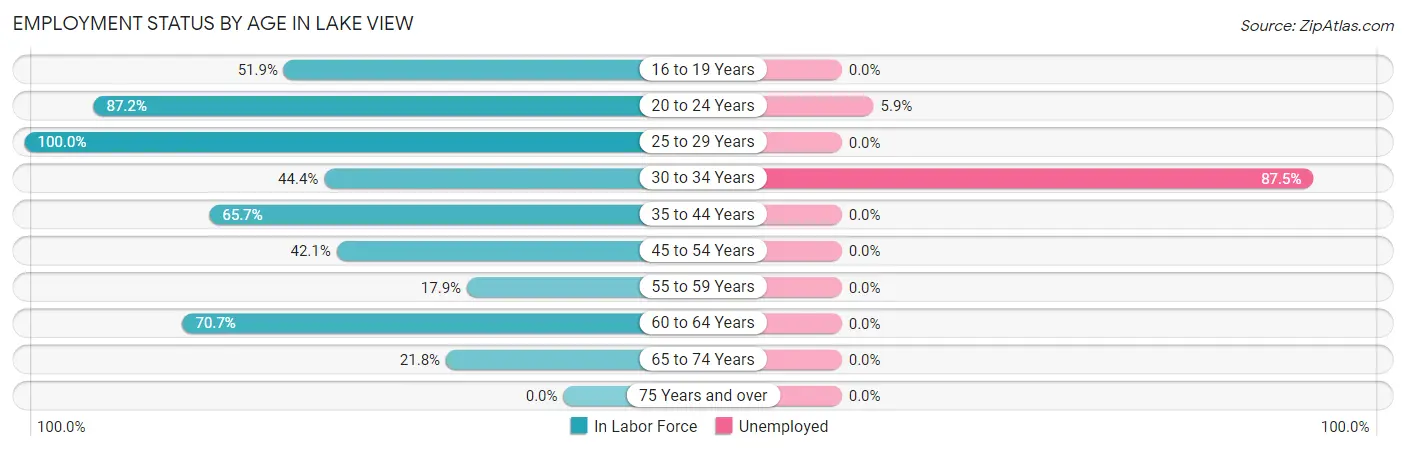
| Age Bracket | In Labor Force | Unemployed |
| 16 to 19 Years | 14 (51.9%) | 0 (0.0%) |
| 20 to 24 Years | 34 (87.2%) | 2 (5.9%) |
| 25 to 29 Years | 38 (100.0%) | 0 (0.0%) |
| 30 to 34 Years | 8 (44.4%) | 7 (87.5%) |
| 35 to 44 Years | 46 (65.7%) | 0 (0.0%) |
| 45 to 54 Years | 48 (42.1%) | 0 (0.0%) |
| 55 to 59 Years | 5 (17.9%) | 0 (0.0%) |
| 60 to 64 Years | 41 (70.7%) | 0 (0.0%) |
| 65 to 74 Years | 19 (21.8%) | 0 (0.0%) |
| 75 Years and over | 0 (0.0%) | 0 (0.0%) |
| Total | 253 (44.9%) | 9 (3.6%) |
Employment Status by Educational Attainment in Lake View
According to labor force statistics for Lake View, 57.1% of individuals (186) out of the total population between 25 and 64 years of age (326) are in the labor force, with 3.8% or 7 of them being unemployed. The group with the highest labor force participation rate are those with the educational attainment of bachelor's degree or higher, with 77.3% or 34 individuals in the labor force. Within the labor force, individuals with college / associate degree education have the highest percentage of unemployment, with 21.9% or 7 of them being unemployed.
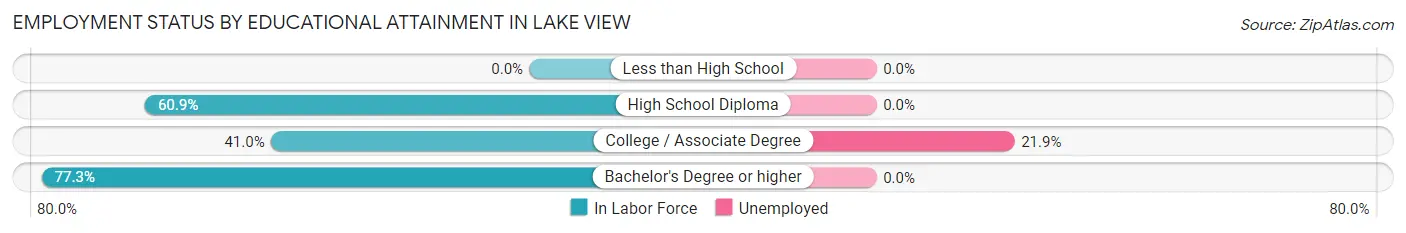
| Educational Attainment | In Labor Force | Unemployed |
| Less than High School | 0 (0.0%) | 0 (0.0%) |
| High School Diploma | 120 (60.9%) | 0 (0.0%) |
| College / Associate Degree | 32 (41.0%) | 17 (21.9%) |
| Bachelor's Degree or higher | 34 (77.3%) | 0 (0.0%) |
| Total | 186 (57.1%) | 12 (3.8%) |
Employment Occupations by Sex in Lake View
Management, Business, Science and Arts Occupations
The most common Management, Business, Science and Arts occupations in Lake View are Community & Social Service (28 | 11.5%), Education, Arts & Media (15 | 6.1%), Management (12 | 4.9%), Education Instruction & Library (11 | 4.5%), and Health Diagnosing & Treating (11 | 4.5%).
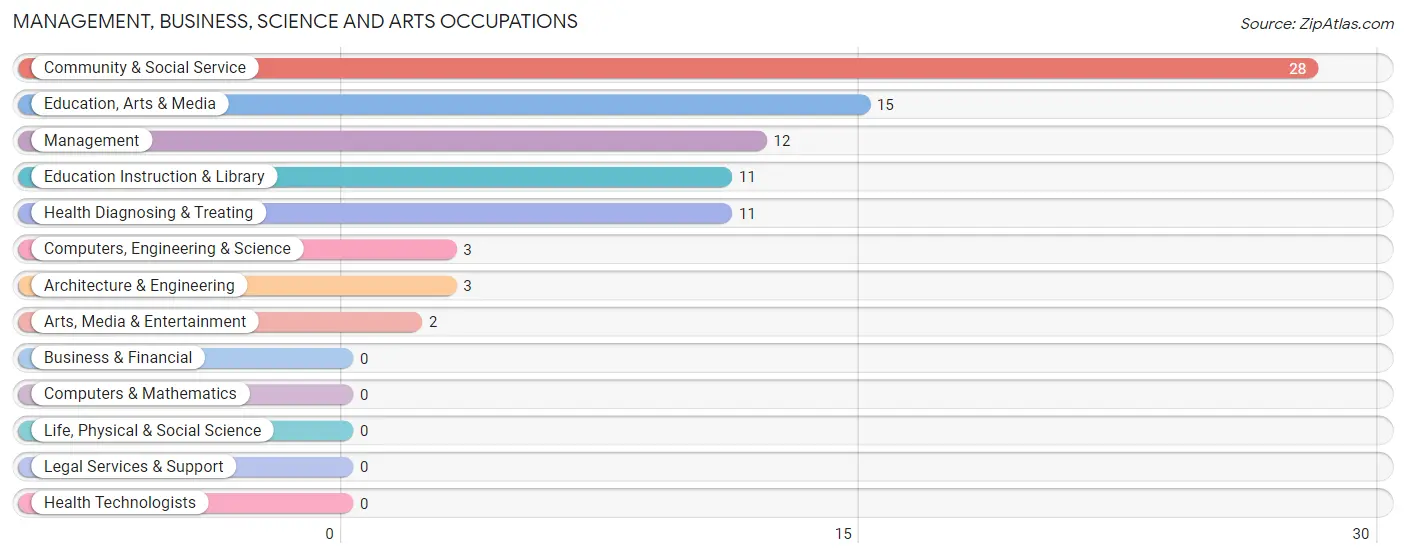
Management, Business, Science and Arts Occupations by Sex
Within the Management, Business, Science and Arts occupations in Lake View, the most male-oriented occupations are Computers, Engineering & Science (100.0%), Architecture & Engineering (100.0%), and Arts, Media & Entertainment (100.0%), while the most female-oriented occupations are Health Diagnosing & Treating (100.0%), Management (83.3%), and Education Instruction & Library (81.8%).
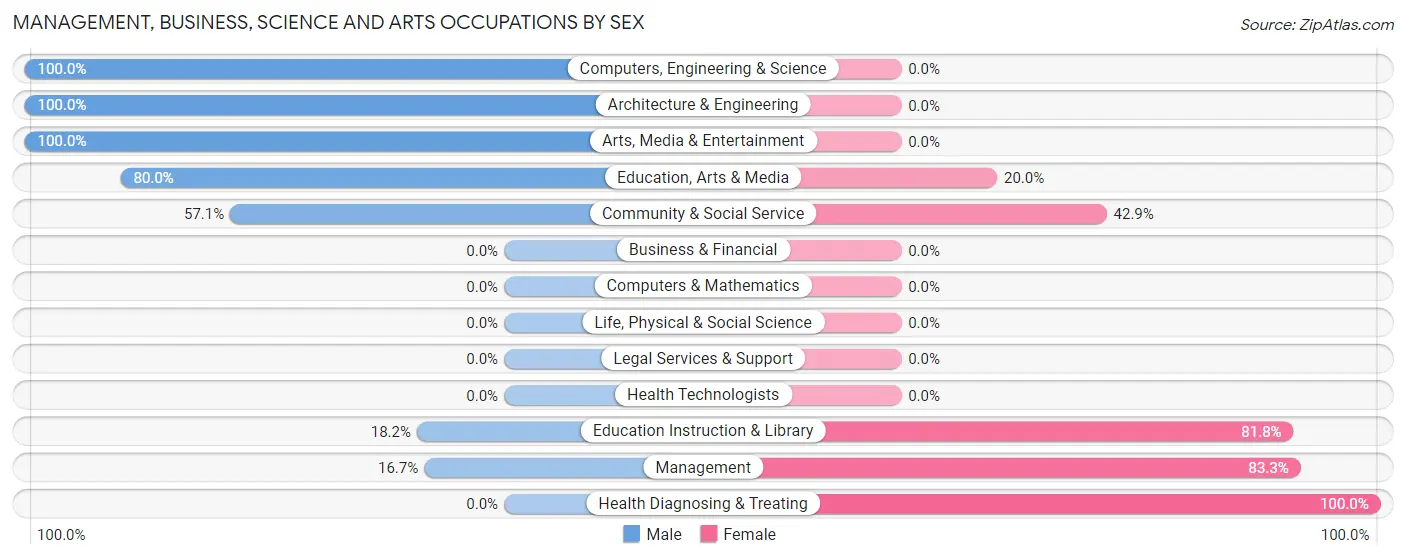
| Occupation | Male | Female |
| Management | 2 (16.7%) | 10 (83.3%) |
| Business & Financial | 0 (0.0%) | 0 (0.0%) |
| Computers, Engineering & Science | 3 (100.0%) | 0 (0.0%) |
| Computers & Mathematics | 0 (0.0%) | 0 (0.0%) |
| Architecture & Engineering | 3 (100.0%) | 0 (0.0%) |
| Life, Physical & Social Science | 0 (0.0%) | 0 (0.0%) |
| Community & Social Service | 16 (57.1%) | 12 (42.9%) |
| Education, Arts & Media | 12 (80.0%) | 3 (20.0%) |
| Legal Services & Support | 0 (0.0%) | 0 (0.0%) |
| Education Instruction & Library | 2 (18.2%) | 9 (81.8%) |
| Arts, Media & Entertainment | 2 (100.0%) | 0 (0.0%) |
| Health Diagnosing & Treating | 0 (0.0%) | 11 (100.0%) |
| Health Technologists | 0 (0.0%) | 0 (0.0%) |
| Total (Category) | 21 (38.9%) | 33 (61.1%) |
| Total (Overall) | 110 (45.1%) | 134 (54.9%) |
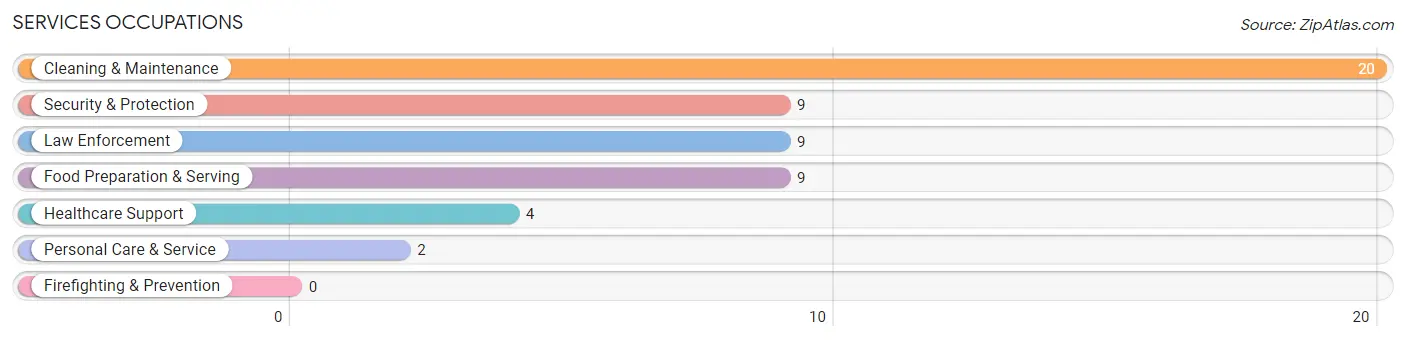
Services Occupations
The most common Services occupations in Lake View are Cleaning & Maintenance (20 | 8.2%), Security & Protection (9 | 3.7%), Law Enforcement (9 | 3.7%), Food Preparation & Serving (9 | 3.7%), and Healthcare Support (4 | 1.6%).
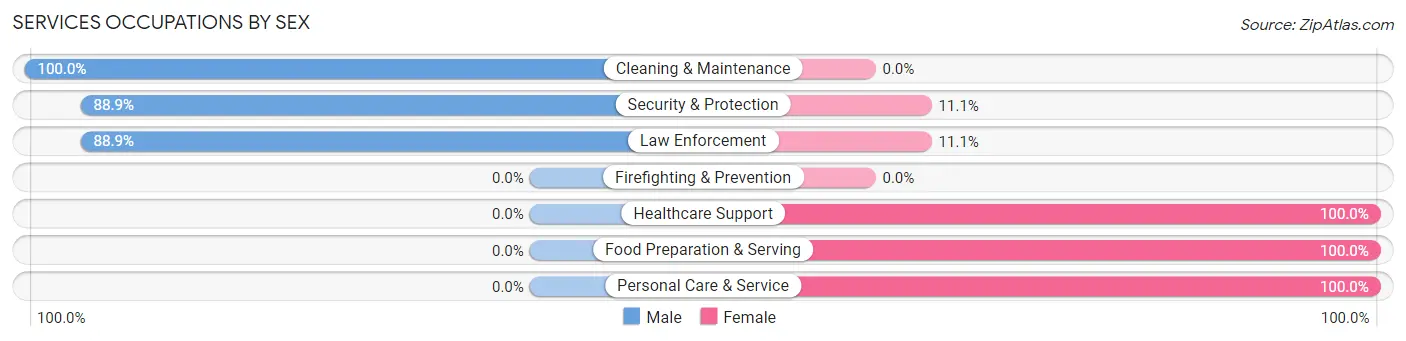
Services Occupations by Sex
Within the Services occupations in Lake View, the most male-oriented occupations are Cleaning & Maintenance (100.0%), Security & Protection (88.9%), and Law Enforcement (88.9%), while the most female-oriented occupations are Healthcare Support (100.0%), Food Preparation & Serving (100.0%), and Personal Care & Service (100.0%).
| Occupation | Male | Female |
| Healthcare Support | 0 (0.0%) | 4 (100.0%) |
| Security & Protection | 8 (88.9%) | 1 (11.1%) |
| Firefighting & Prevention | 0 (0.0%) | 0 (0.0%) |
| Law Enforcement | 8 (88.9%) | 1 (11.1%) |
| Food Preparation & Serving | 0 (0.0%) | 9 (100.0%) |
| Cleaning & Maintenance | 20 (100.0%) | 0 (0.0%) |
| Personal Care & Service | 0 (0.0%) | 2 (100.0%) |
| Total (Category) | 28 (63.6%) | 16 (36.4%) |
| Total (Overall) | 110 (45.1%) | 134 (54.9%) |
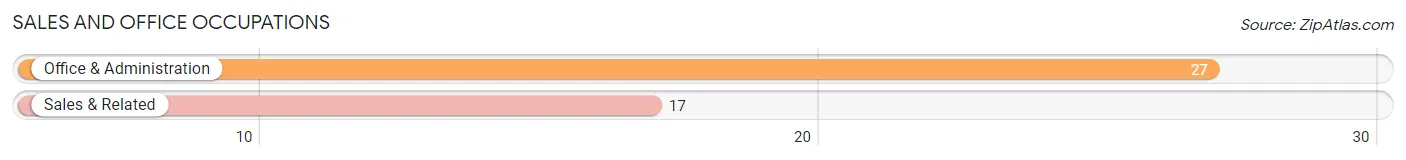
Sales and Office Occupations
The most common Sales and Office occupations in Lake View are Office & Administration (27 | 11.1%), and Sales & Related (17 | 7.0%).
Sales and Office Occupations by Sex
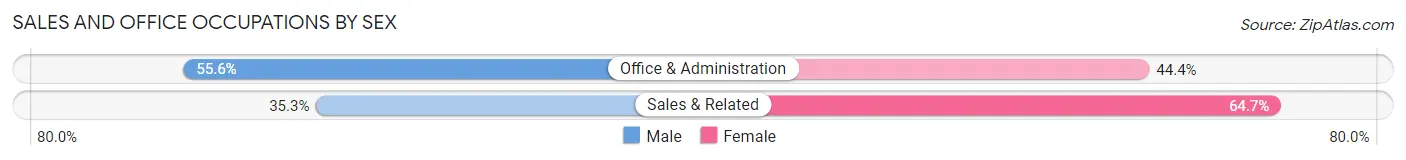
| Occupation | Male | Female |
| Sales & Related | 6 (35.3%) | 11 (64.7%) |
| Office & Administration | 15 (55.6%) | 12 (44.4%) |
| Total (Category) | 21 (47.7%) | 23 (52.3%) |
| Total (Overall) | 110 (45.1%) | 134 (54.9%) |
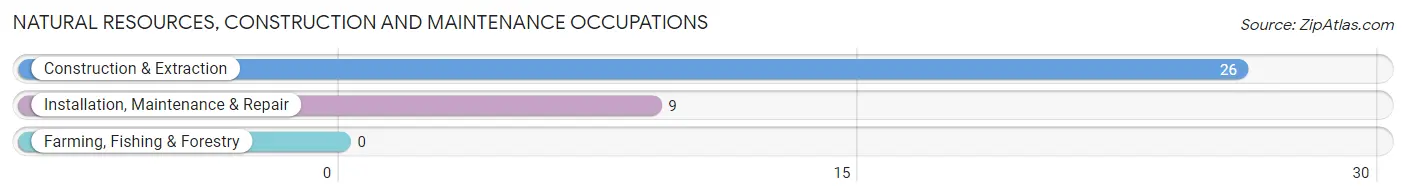
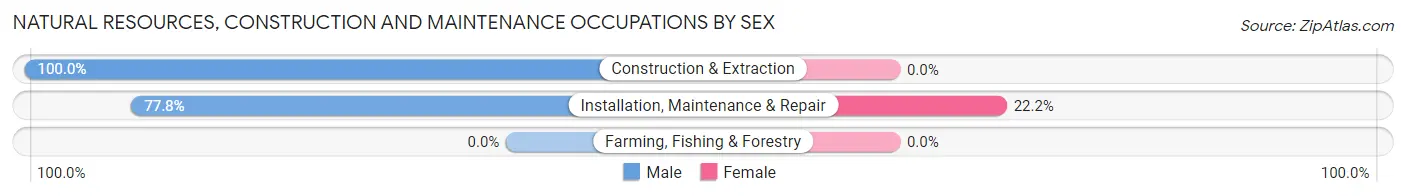
Natural Resources, Construction and Maintenance Occupations
The most common Natural Resources, Construction and Maintenance occupations in Lake View are Construction & Extraction (26 | 10.7%), and Installation, Maintenance & Repair (9 | 3.7%).
Natural Resources, Construction and Maintenance Occupations by Sex
| Occupation | Male | Female |
| Farming, Fishing & Forestry | 0 (0.0%) | 0 (0.0%) |
| Construction & Extraction | 26 (100.0%) | 0 (0.0%) |
| Installation, Maintenance & Repair | 7 (77.8%) | 2 (22.2%) |
| Total (Category) | 33 (94.3%) | 2 (5.7%) |
| Total (Overall) | 110 (45.1%) | 134 (54.9%) |
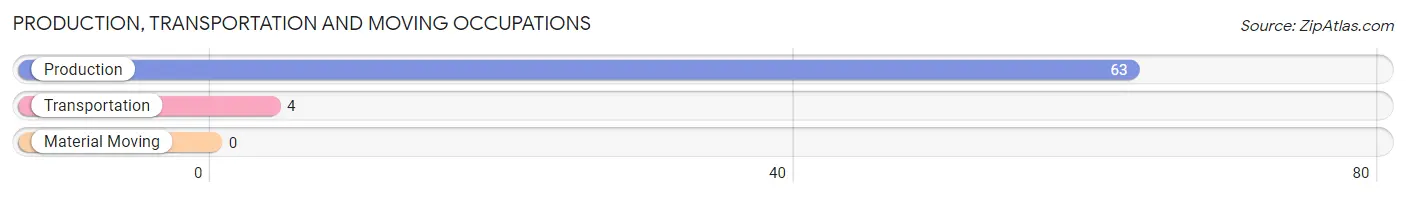
Production, Transportation and Moving Occupations
The most common Production, Transportation and Moving occupations in Lake View are Production (63 | 25.8%), and Transportation (4 | 1.6%).
Production, Transportation and Moving Occupations by Sex
| Occupation | Male | Female |
| Production | 3 (4.8%) | 60 (95.2%) |
| Transportation | 4 (100.0%) | 0 (0.0%) |
| Material Moving | 0 (0.0%) | 0 (0.0%) |
| Total (Category) | 7 (10.4%) | 60 (89.5%) |
| Total (Overall) | 110 (45.1%) | 134 (54.9%) |
Employment Industries by Sex in Lake View
Employment Industries in Lake View
The major employment industries in Lake View include Manufacturing (73 | 29.9%), Retail Trade (47 | 19.3%), Health Care & Social Assistance (24 | 9.8%), Administrative & Support (19 | 7.8%), and Construction (14 | 5.7%).
Employment Industries by Sex in Lake View
The Lake View industries that see more men than women are Construction (100.0%), Transportation & Warehousing (100.0%), and Utilities (100.0%), whereas the industries that tend to have a higher number of women are Health Care & Social Assistance (100.0%), Accommodation & Food Services (100.0%), and Manufacturing (95.9%).
| Industry | Male | Female |
| Agriculture, Fishing & Hunting | 0 (0.0%) | 0 (0.0%) |
| Mining, Quarrying, & Extraction | 0 (0.0%) | 0 (0.0%) |
| Construction | 14 (100.0%) | 0 (0.0%) |
| Manufacturing | 3 (4.1%) | 70 (95.9%) |
| Wholesale Trade | 0 (0.0%) | 0 (0.0%) |
| Retail Trade | 29 (61.7%) | 18 (38.3%) |
| Transportation & Warehousing | 2 (100.0%) | 0 (0.0%) |
| Utilities | 3 (100.0%) | 0 (0.0%) |
| Information | 0 (0.0%) | 0 (0.0%) |
| Finance & Insurance | 6 (54.5%) | 5 (45.5%) |
| Real Estate, Rental & Leasing | 0 (0.0%) | 0 (0.0%) |
| Professional & Scientific | 4 (100.0%) | 0 (0.0%) |
| Enterprise Management | 0 (0.0%) | 0 (0.0%) |
| Administrative & Support | 17 (89.5%) | 2 (10.5%) |
| Educational Services | 2 (16.7%) | 10 (83.3%) |
| Health Care & Social Assistance | 0 (0.0%) | 24 (100.0%) |
| Arts, Entertainment & Recreation | 0 (0.0%) | 0 (0.0%) |
| Accommodation & Food Services | 0 (0.0%) | 1 (100.0%) |
| Public Administration | 11 (84.6%) | 2 (15.4%) |
| Total | 110 (45.1%) | 134 (54.9%) |
Education in Lake View
School Enrollment in Lake View
The most common levels of schooling among the 142 students in Lake View are middle school (40 | 28.2%), high school (35 | 24.6%), and elementary school (29 | 20.4%).
| School Level | # Students | % Students |
| Nursery / Preschool | 11 | 7.7% |
| Kindergarten | 4 | 2.8% |
| Elementary School | 29 | 20.4% |
| Middle School | 40 | 28.2% |
| High School | 35 | 24.6% |
| College / Undergraduate | 17 | 12.0% |
| Graduate / Professional | 6 | 4.2% |
| Total | 142 | 100.0% |
School Enrollment by Age by Funding Source in Lake View
Out of a total of 142 students who are enrolled in schools in Lake View, 17 (12.0%) attend a private institution, while the remaining 125 (88.0%) are enrolled in public schools. The age group of 3 to 4 year olds has the highest likelihood of being enrolled in private schools, with 6 (100.0% in the age bracket) enrolled. Conversely, the age group of 10 to 14 year olds has the lowest likelihood of being enrolled in a private school, with 47 (100.0% in the age bracket) attending a public institution.
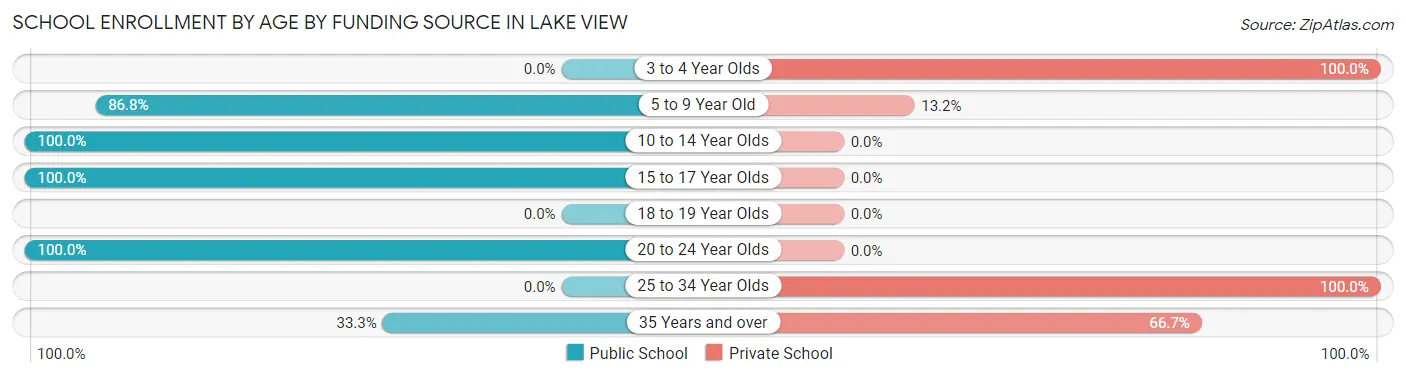
| Age Bracket | Public School | Private School |
| 3 to 4 Year Olds | 0 (0.0%) | 6 (100.0%) |
| 5 to 9 Year Old | 33 (86.8%) | 5 (13.2%) |
| 10 to 14 Year Olds | 47 (100.0%) | 0 (0.0%) |
| 15 to 17 Year Olds | 28 (100.0%) | 0 (0.0%) |
| 18 to 19 Year Olds | 0 (0.0%) | 0 (0.0%) |
| 20 to 24 Year Olds | 16 (100.0%) | 0 (0.0%) |
| 25 to 34 Year Olds | 0 (0.0%) | 4 (100.0%) |
| 35 Years and over | 1 (33.3%) | 2 (66.7%) |
| Total | 125 (88.0%) | 17 (12.0%) |
Educational Attainment by Field of Study in Lake View
Education (20 | 31.2%), liberal arts & history (16 | 25.0%), business (8 | 12.5%), social sciences (6 | 9.4%), and communications (6 | 9.4%) are the most common fields of study among 64 individuals in Lake View who have obtained a bachelor's degree or higher.
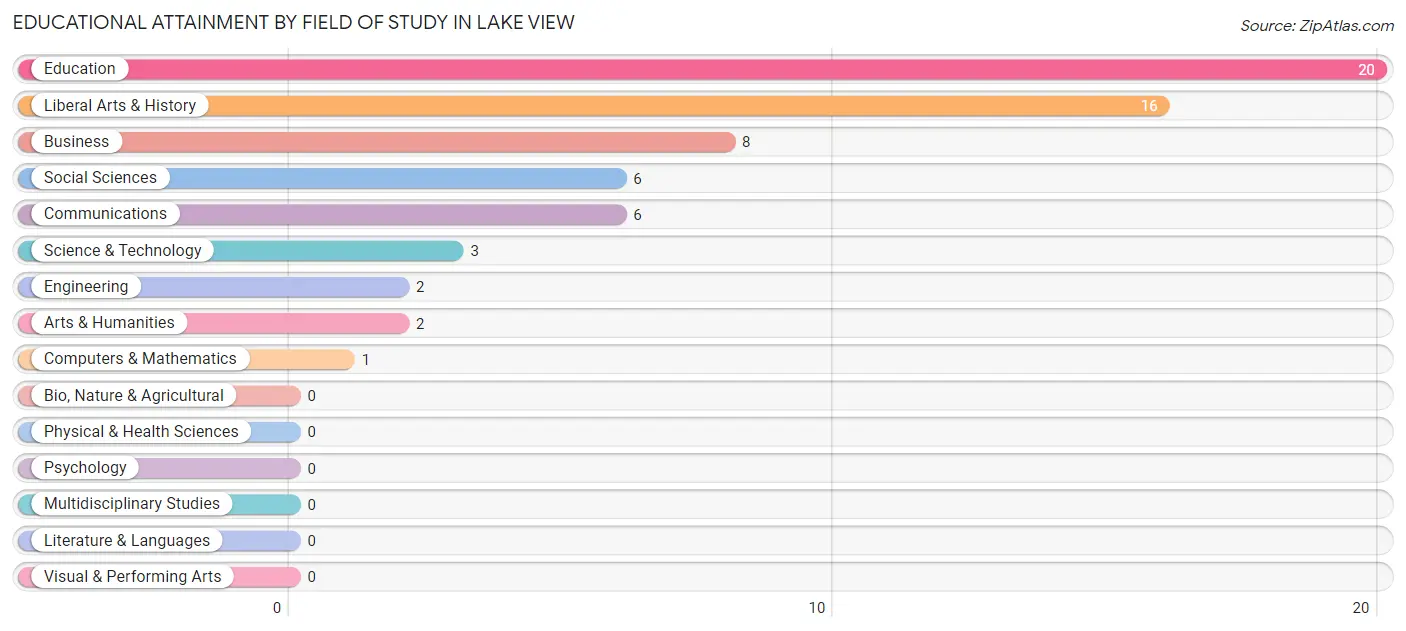
| Field of Study | # Graduates | % Graduates |
| Computers & Mathematics | 1 | 1.6% |
| Bio, Nature & Agricultural | 0 | 0.0% |
| Physical & Health Sciences | 0 | 0.0% |
| Psychology | 0 | 0.0% |
| Social Sciences | 6 | 9.4% |
| Engineering | 2 | 3.1% |
| Multidisciplinary Studies | 0 | 0.0% |
| Science & Technology | 3 | 4.7% |
| Business | 8 | 12.5% |
| Education | 20 | 31.2% |
| Literature & Languages | 0 | 0.0% |
| Liberal Arts & History | 16 | 25.0% |
| Visual & Performing Arts | 0 | 0.0% |
| Communications | 6 | 9.4% |
| Arts & Humanities | 2 | 3.1% |
| Total | 64 | 100.0% |
Transportation & Commute in Lake View
Vehicle Availability by Sex in Lake View
The most prevalent vehicle ownership categories in Lake View are males with 3 vehicles (38, accounting for 40.9%) and females with 3 vehicles (38, making up 31.7%).
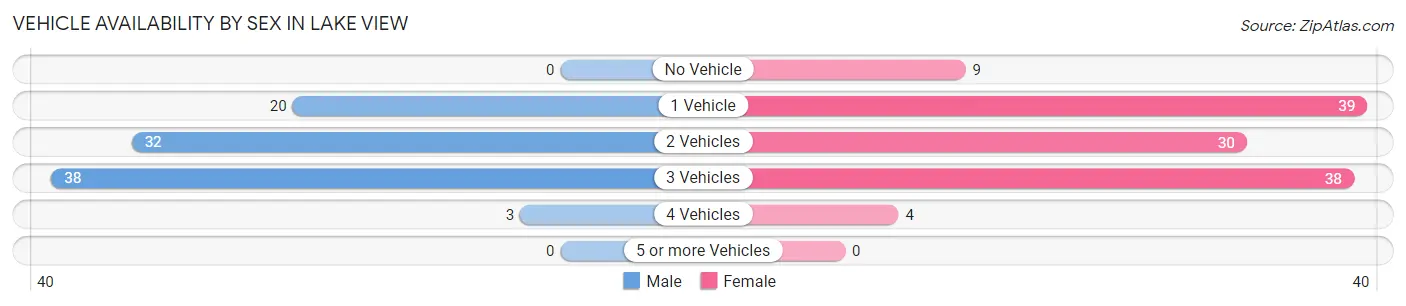
| Vehicles Available | Male | Female |
| No Vehicle | 0 (0.0%) | 9 (7.5%) |
| 1 Vehicle | 20 (21.5%) | 39 (32.5%) |
| 2 Vehicles | 32 (34.4%) | 30 (25.0%) |
| 3 Vehicles | 38 (40.9%) | 38 (31.7%) |
| 4 Vehicles | 3 (3.2%) | 4 (3.3%) |
| 5 or more Vehicles | 0 (0.0%) | 0 (0.0%) |
| Total | 93 (100.0%) | 120 (100.0%) |
Commute Time in Lake View
The most frequently occuring commute durations in Lake View are 15 to 19 minutes (45 commuters, 20.3%), 45 to 59 minutes (40 commuters, 18.0%), and 5 to 9 minutes (39 commuters, 17.6%).
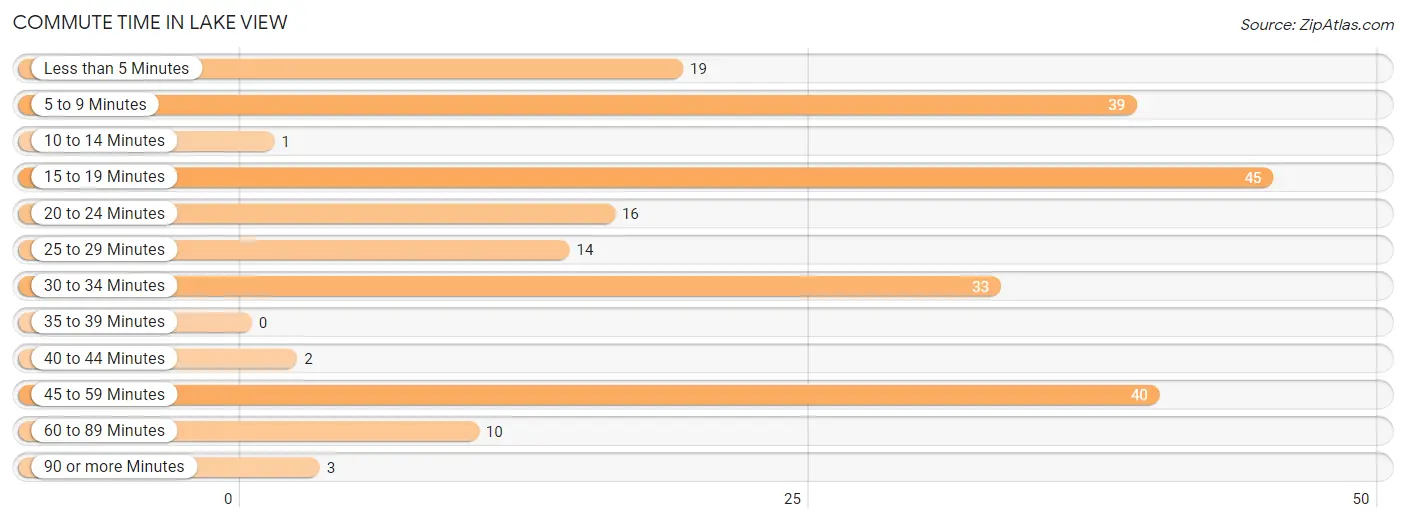
| Commute Time | # Commuters | % Commuters |
| Less than 5 Minutes | 19 | 8.6% |
| 5 to 9 Minutes | 39 | 17.6% |
| 10 to 14 Minutes | 1 | 0.4% |
| 15 to 19 Minutes | 45 | 20.3% |
| 20 to 24 Minutes | 16 | 7.2% |
| 25 to 29 Minutes | 14 | 6.3% |
| 30 to 34 Minutes | 33 | 14.9% |
| 35 to 39 Minutes | 0 | 0.0% |
| 40 to 44 Minutes | 2 | 0.9% |
| 45 to 59 Minutes | 40 | 18.0% |
| 60 to 89 Minutes | 10 | 4.5% |
| 90 or more Minutes | 3 | 1.3% |
Commute Time by Sex in Lake View
The most common commute times in Lake View are 5 to 9 minutes (34 commuters, 31.5%) for males and 45 to 59 minutes (26 commuters, 22.8%) for females.
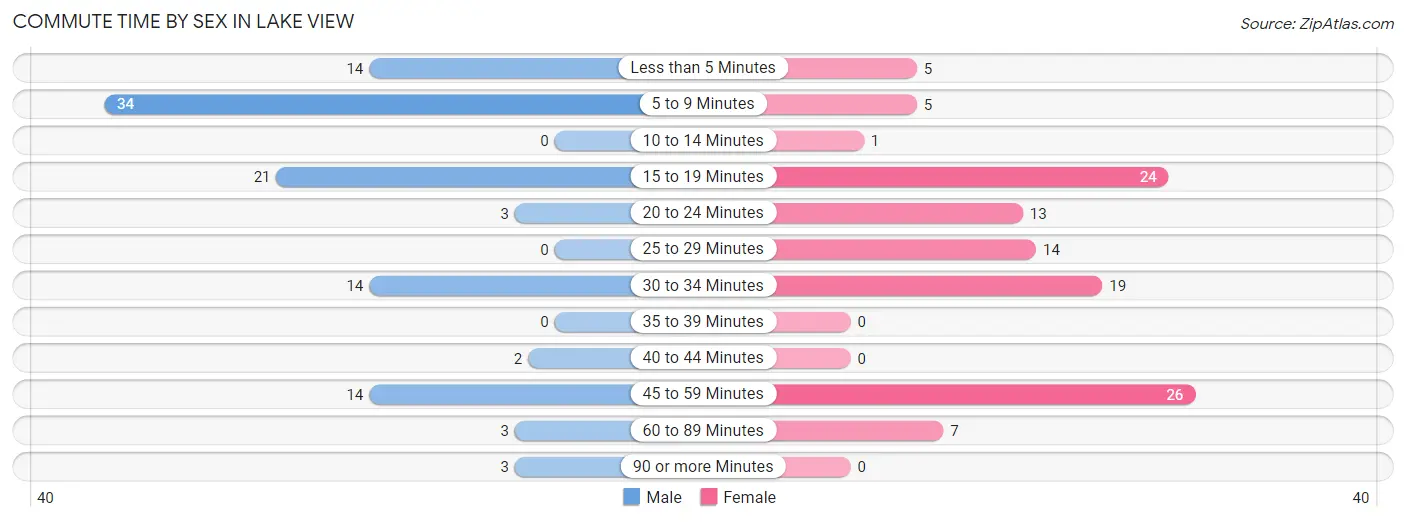
| Commute Time | Male | Female |
| Less than 5 Minutes | 14 (13.0%) | 5 (4.4%) |
| 5 to 9 Minutes | 34 (31.5%) | 5 (4.4%) |
| 10 to 14 Minutes | 0 (0.0%) | 1 (0.9%) |
| 15 to 19 Minutes | 21 (19.4%) | 24 (21.0%) |
| 20 to 24 Minutes | 3 (2.8%) | 13 (11.4%) |
| 25 to 29 Minutes | 0 (0.0%) | 14 (12.3%) |
| 30 to 34 Minutes | 14 (13.0%) | 19 (16.7%) |
| 35 to 39 Minutes | 0 (0.0%) | 0 (0.0%) |
| 40 to 44 Minutes | 2 (1.8%) | 0 (0.0%) |
| 45 to 59 Minutes | 14 (13.0%) | 26 (22.8%) |
| 60 to 89 Minutes | 3 (2.8%) | 7 (6.1%) |
| 90 or more Minutes | 3 (2.8%) | 0 (0.0%) |
Time of Departure to Work by Sex in Lake View
The most frequent times of departure to work in Lake View are 8:00 AM to 8:29 AM (30, 27.8%) for males and 7:00 AM to 7:29 AM (24, 21.0%) for females.
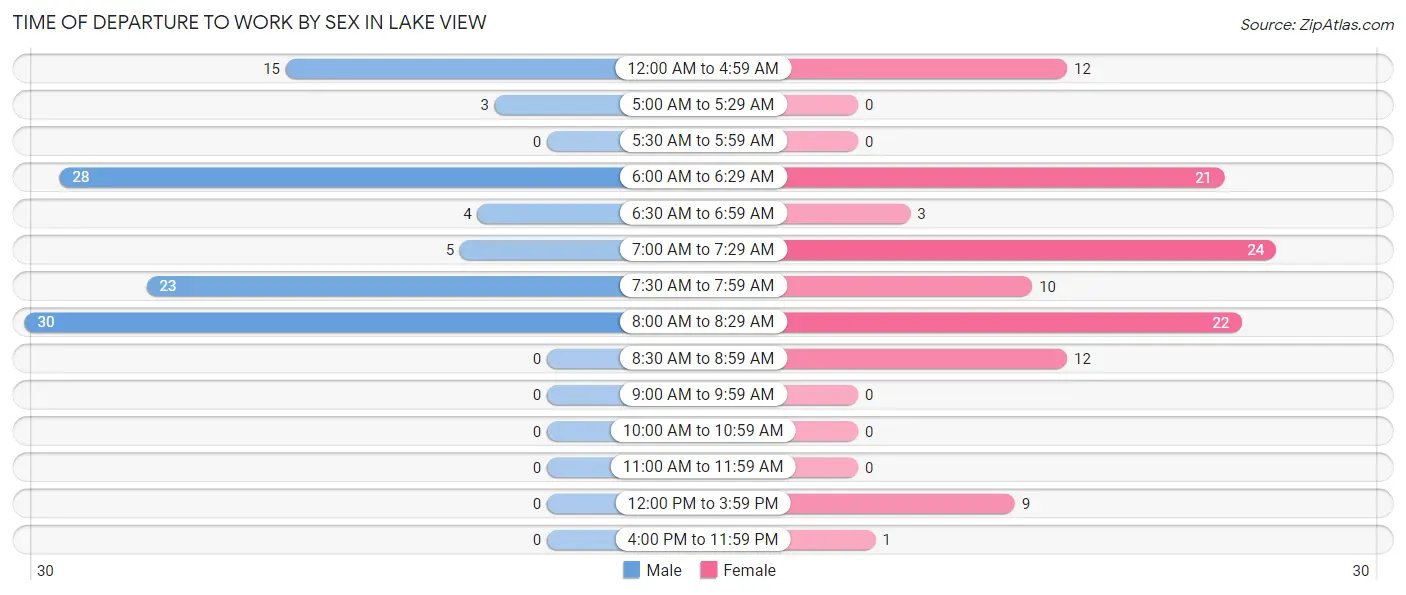
| Time of Departure | Male | Female |
| 12:00 AM to 4:59 AM | 15 (13.9%) | 12 (10.5%) |
| 5:00 AM to 5:29 AM | 3 (2.8%) | 0 (0.0%) |
| 5:30 AM to 5:59 AM | 0 (0.0%) | 0 (0.0%) |
| 6:00 AM to 6:29 AM | 28 (25.9%) | 21 (18.4%) |
| 6:30 AM to 6:59 AM | 4 (3.7%) | 3 (2.6%) |
| 7:00 AM to 7:29 AM | 5 (4.6%) | 24 (21.0%) |
| 7:30 AM to 7:59 AM | 23 (21.3%) | 10 (8.8%) |
| 8:00 AM to 8:29 AM | 30 (27.8%) | 22 (19.3%) |
| 8:30 AM to 8:59 AM | 0 (0.0%) | 12 (10.5%) |
| 9:00 AM to 9:59 AM | 0 (0.0%) | 0 (0.0%) |
| 10:00 AM to 10:59 AM | 0 (0.0%) | 0 (0.0%) |
| 11:00 AM to 11:59 AM | 0 (0.0%) | 0 (0.0%) |
| 12:00 PM to 3:59 PM | 0 (0.0%) | 9 (7.9%) |
| 4:00 PM to 11:59 PM | 0 (0.0%) | 1 (0.9%) |
| Total | 108 (100.0%) | 114 (100.0%) |
Housing Occupancy in Lake View
Occupancy by Ownership in Lake View
Of the total 282 dwellings in Lake View, owner-occupied units account for 131 (46.5%), while renter-occupied units make up 151 (53.5%).
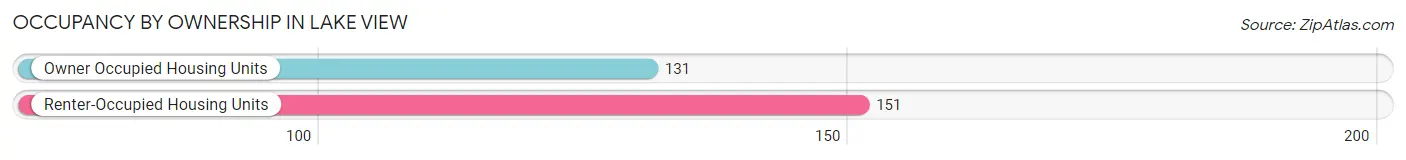
| Occupancy | # Housing Units | % Housing Units |
| Owner Occupied Housing Units | 131 | 46.5% |
| Renter-Occupied Housing Units | 151 | 53.5% |
| Total Occupied Housing Units | 282 | 100.0% |
Occupancy by Household Size in Lake View
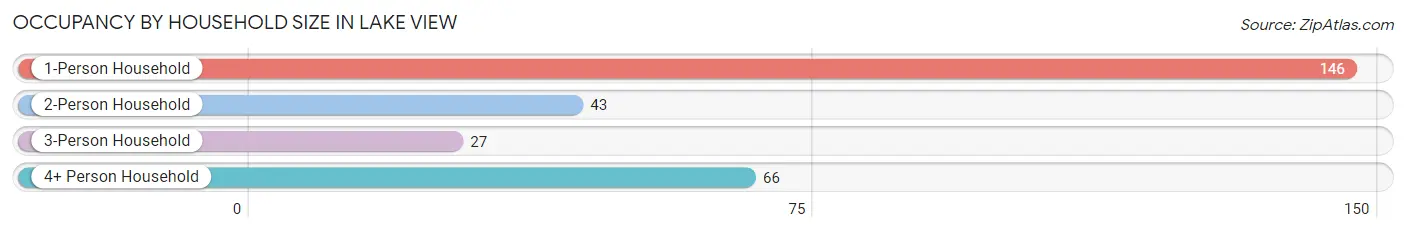
| Household Size | # Housing Units | % Housing Units |
| 1-Person Household | 146 | 51.8% |
| 2-Person Household | 43 | 15.2% |
| 3-Person Household | 27 | 9.6% |
| 4+ Person Household | 66 | 23.4% |
| Total Housing Units | 282 | 100.0% |
Occupancy by Ownership by Household Size in Lake View
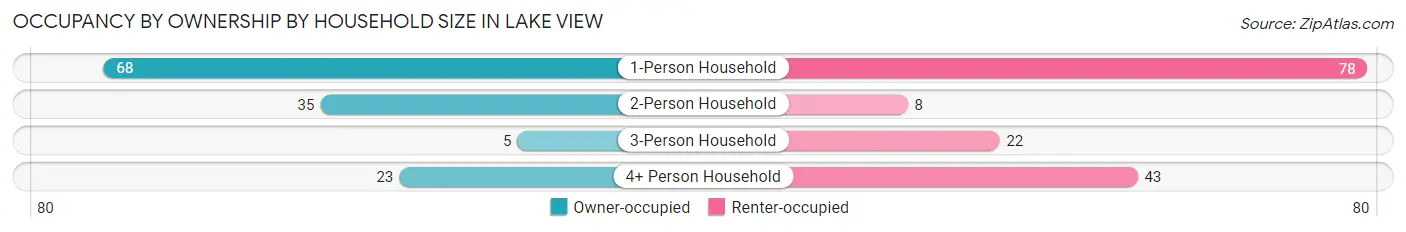
| Household Size | Owner-occupied | Renter-occupied |
| 1-Person Household | 68 (46.6%) | 78 (53.4%) |
| 2-Person Household | 35 (81.4%) | 8 (18.6%) |
| 3-Person Household | 5 (18.5%) | 22 (81.5%) |
| 4+ Person Household | 23 (34.8%) | 43 (65.1%) |
| Total Housing Units | 131 (46.5%) | 151 (53.5%) |
Occupancy by Educational Attainment in Lake View
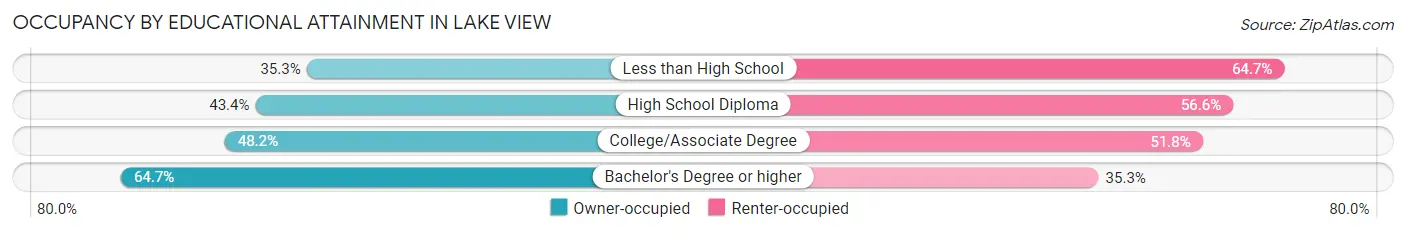
| Household Size | Owner-occupied | Renter-occupied |
| Less than High School | 12 (35.3%) | 22 (64.7%) |
| High School Diploma | 56 (43.4%) | 73 (56.6%) |
| College/Associate Degree | 41 (48.2%) | 44 (51.8%) |
| Bachelor's Degree or higher | 22 (64.7%) | 12 (35.3%) |
Occupancy by Age of Householder in Lake View
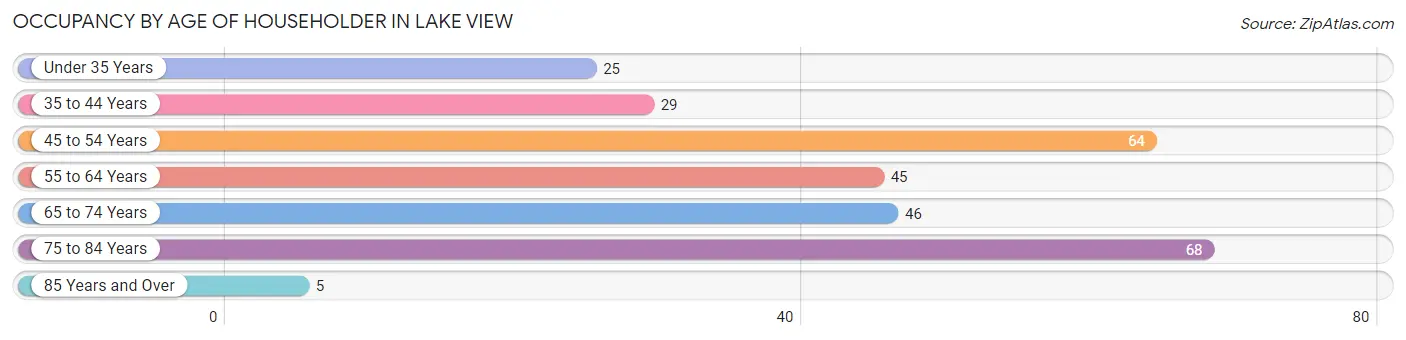
| Age Bracket | # Households | % Households |
| Under 35 Years | 25 | 8.9% |
| 35 to 44 Years | 29 | 10.3% |
| 45 to 54 Years | 64 | 22.7% |
| 55 to 64 Years | 45 | 16.0% |
| 65 to 74 Years | 46 | 16.3% |
| 75 to 84 Years | 68 | 24.1% |
| 85 Years and Over | 5 | 1.8% |
| Total | 282 | 100.0% |
Housing Finances in Lake View
Median Income by Occupancy in Lake View
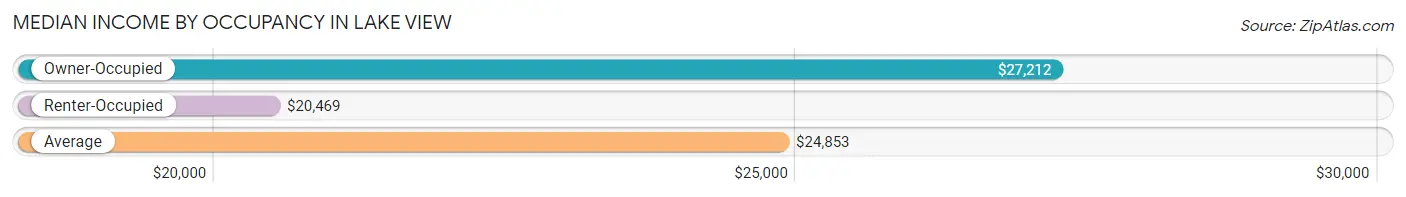
| Occupancy Type | # Households | Median Income |
| Owner-Occupied | 131 (46.5%) | $27,212 |
| Renter-Occupied | 151 (53.5%) | $20,469 |
| Average | 282 (100.0%) | $24,853 |
Occupancy by Householder Income Bracket in Lake View
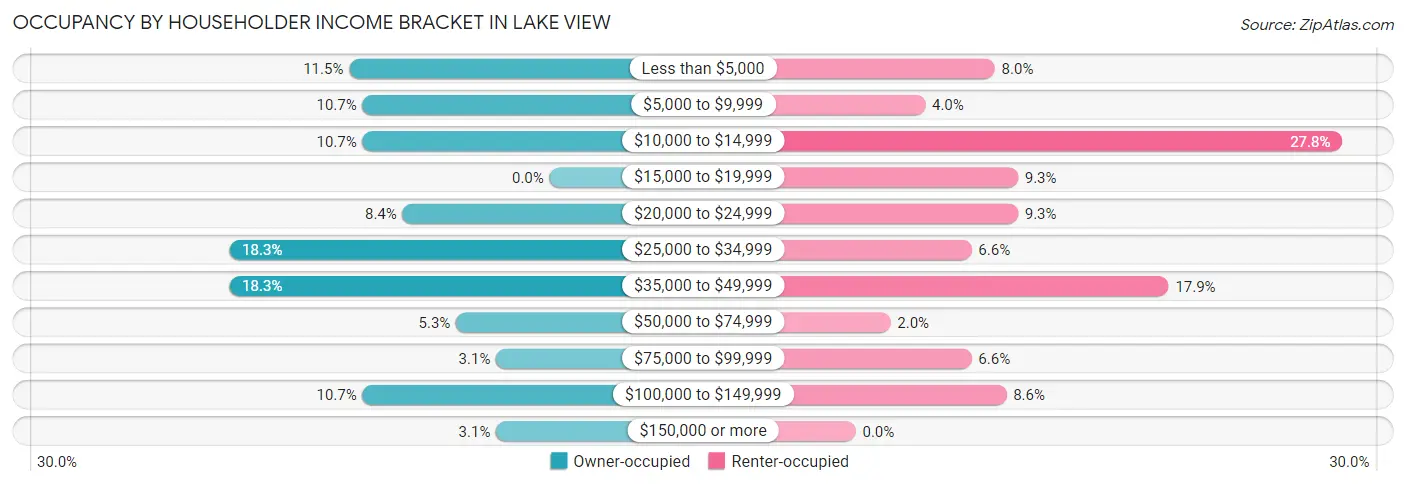
| Income Bracket | Owner-occupied | Renter-occupied |
| Less than $5,000 | 15 (11.5%) | 12 (8.0%) |
| $5,000 to $9,999 | 14 (10.7%) | 6 (4.0%) |
| $10,000 to $14,999 | 14 (10.7%) | 42 (27.8%) |
| $15,000 to $19,999 | 0 (0.0%) | 14 (9.3%) |
| $20,000 to $24,999 | 11 (8.4%) | 14 (9.3%) |
| $25,000 to $34,999 | 24 (18.3%) | 10 (6.6%) |
| $35,000 to $49,999 | 24 (18.3%) | 27 (17.9%) |
| $50,000 to $74,999 | 7 (5.3%) | 3 (2.0%) |
| $75,000 to $99,999 | 4 (3.0%) | 10 (6.6%) |
| $100,000 to $149,999 | 14 (10.7%) | 13 (8.6%) |
| $150,000 or more | 4 (3.0%) | 0 (0.0%) |
| Total | 131 (100.0%) | 151 (100.0%) |
Monthly Housing Cost Tiers in Lake View
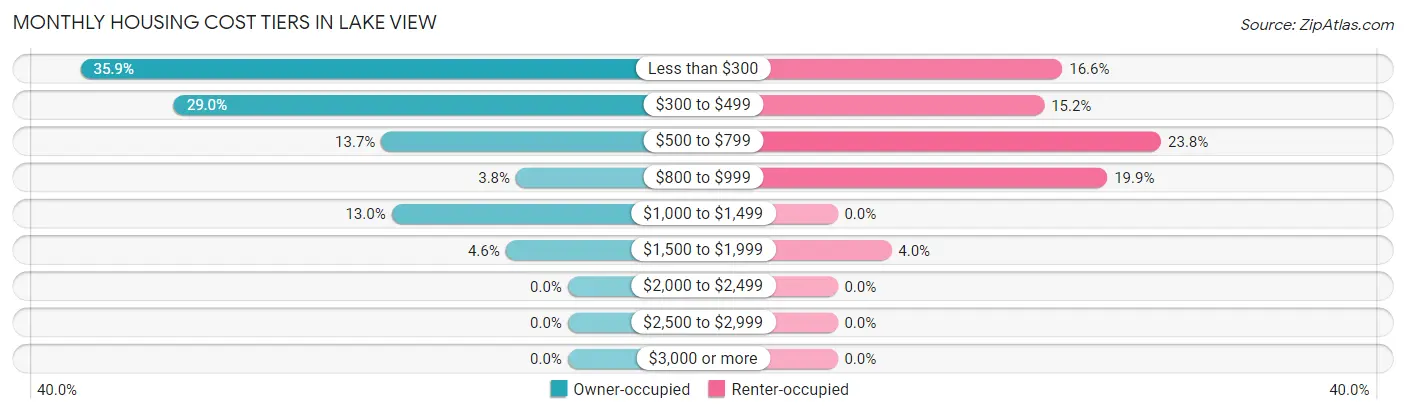
| Monthly Cost | Owner-occupied | Renter-occupied |
| Less than $300 | 47 (35.9%) | 25 (16.6%) |
| $300 to $499 | 38 (29.0%) | 23 (15.2%) |
| $500 to $799 | 18 (13.7%) | 36 (23.8%) |
| $800 to $999 | 5 (3.8%) | 30 (19.9%) |
| $1,000 to $1,499 | 17 (13.0%) | 0 (0.0%) |
| $1,500 to $1,999 | 6 (4.6%) | 6 (4.0%) |
| $2,000 to $2,499 | 0 (0.0%) | 0 (0.0%) |
| $2,500 to $2,999 | 0 (0.0%) | 0 (0.0%) |
| $3,000 or more | 0 (0.0%) | 0 (0.0%) |
| Total | 131 (100.0%) | 151 (100.0%) |
Physical Housing Characteristics in Lake View
Housing Structures in Lake View
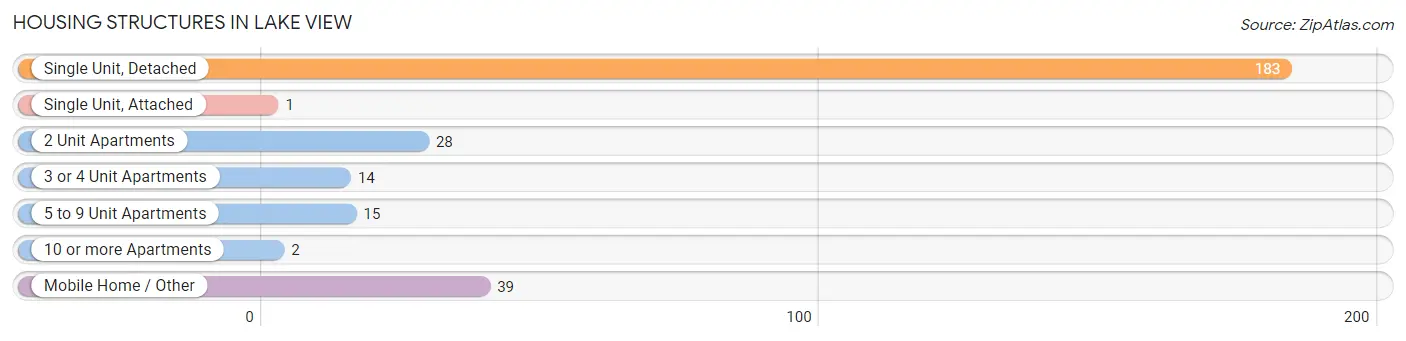
| Structure Type | # Housing Units | % Housing Units |
| Single Unit, Detached | 183 | 64.9% |
| Single Unit, Attached | 1 | 0.4% |
| 2 Unit Apartments | 28 | 9.9% |
| 3 or 4 Unit Apartments | 14 | 5.0% |
| 5 to 9 Unit Apartments | 15 | 5.3% |
| 10 or more Apartments | 2 | 0.7% |
| Mobile Home / Other | 39 | 13.8% |
| Total | 282 | 100.0% |
Housing Structures by Occupancy in Lake View
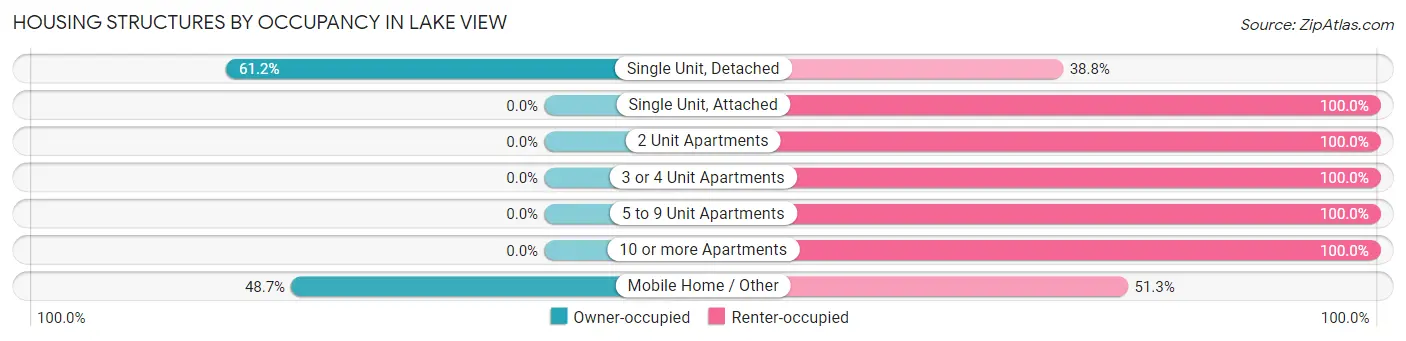
| Structure Type | Owner-occupied | Renter-occupied |
| Single Unit, Detached | 112 (61.2%) | 71 (38.8%) |
| Single Unit, Attached | 0 (0.0%) | 1 (100.0%) |
| 2 Unit Apartments | 0 (0.0%) | 28 (100.0%) |
| 3 or 4 Unit Apartments | 0 (0.0%) | 14 (100.0%) |
| 5 to 9 Unit Apartments | 0 (0.0%) | 15 (100.0%) |
| 10 or more Apartments | 0 (0.0%) | 2 (100.0%) |
| Mobile Home / Other | 19 (48.7%) | 20 (51.3%) |
| Total | 131 (46.5%) | 151 (53.5%) |
Housing Structures by Number of Rooms in Lake View
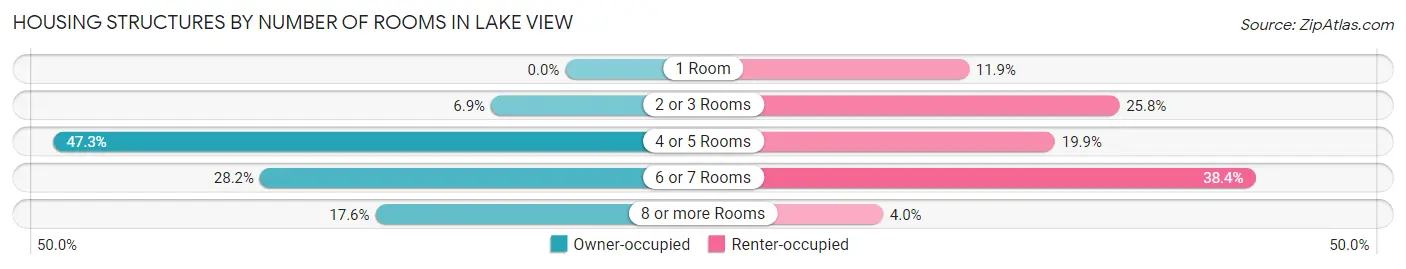
| Number of Rooms | Owner-occupied | Renter-occupied |
| 1 Room | 0 (0.0%) | 18 (11.9%) |
| 2 or 3 Rooms | 9 (6.9%) | 39 (25.8%) |
| 4 or 5 Rooms | 62 (47.3%) | 30 (19.9%) |
| 6 or 7 Rooms | 37 (28.2%) | 58 (38.4%) |
| 8 or more Rooms | 23 (17.6%) | 6 (4.0%) |
| Total | 131 (100.0%) | 151 (100.0%) |
Housing Structure by Heating Type in Lake View
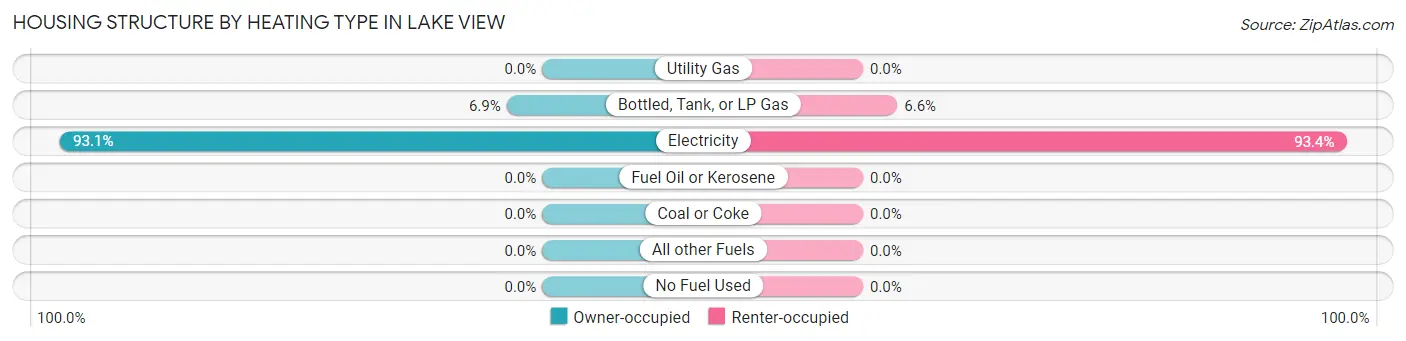
| Heating Type | Owner-occupied | Renter-occupied |
| Utility Gas | 0 (0.0%) | 0 (0.0%) |
| Bottled, Tank, or LP Gas | 9 (6.9%) | 10 (6.6%) |
| Electricity | 122 (93.1%) | 141 (93.4%) |
| Fuel Oil or Kerosene | 0 (0.0%) | 0 (0.0%) |
| Coal or Coke | 0 (0.0%) | 0 (0.0%) |
| All other Fuels | 0 (0.0%) | 0 (0.0%) |
| No Fuel Used | 0 (0.0%) | 0 (0.0%) |
| Total | 131 (100.0%) | 151 (100.0%) |
Household Vehicle Usage in Lake View
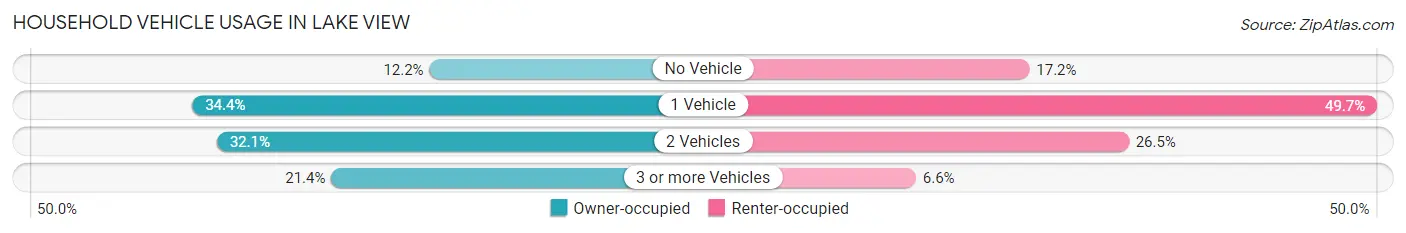
| Vehicles per Household | Owner-occupied | Renter-occupied |
| No Vehicle | 16 (12.2%) | 26 (17.2%) |
| 1 Vehicle | 45 (34.4%) | 75 (49.7%) |
| 2 Vehicles | 42 (32.1%) | 40 (26.5%) |
| 3 or more Vehicles | 28 (21.4%) | 10 (6.6%) |
| Total | 131 (100.0%) | 151 (100.0%) |
Real Estate & Mortgages in Lake View
Real Estate and Mortgage Overview in Lake View
| Characteristic | Without Mortgage | With Mortgage |
| Housing Units | 98 | 33 |
| Median Property Value | $57,300 | $156,300 |
| Median Household Income | $23,864 | $2 |
| Monthly Housing Costs | $309 | $0 |
| Real Estate Taxes | $440 | $0 |
Property Value by Mortgage Status in Lake View
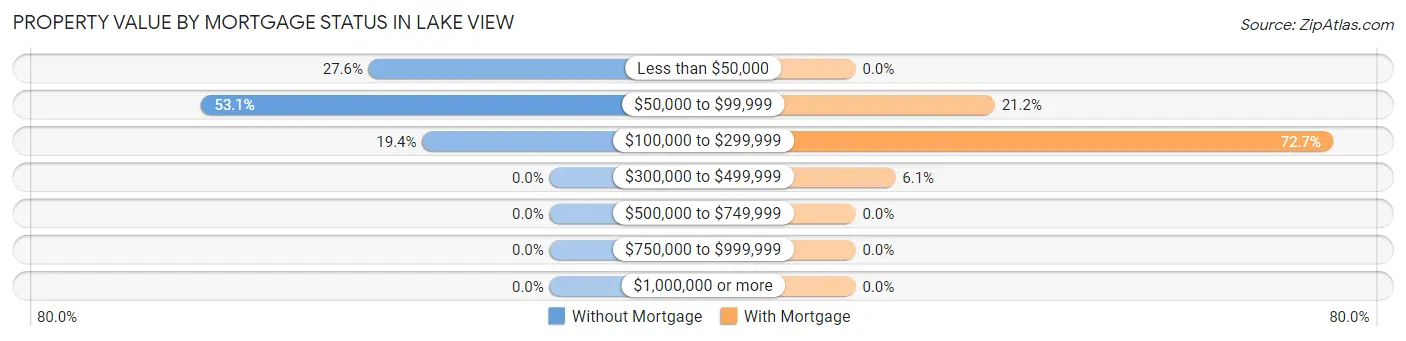
| Property Value | Without Mortgage | With Mortgage |
| Less than $50,000 | 27 (27.6%) | 0 (0.0%) |
| $50,000 to $99,999 | 52 (53.1%) | 7 (21.2%) |
| $100,000 to $299,999 | 19 (19.4%) | 24 (72.7%) |
| $300,000 to $499,999 | 0 (0.0%) | 2 (6.1%) |
| $500,000 to $749,999 | 0 (0.0%) | 0 (0.0%) |
| $750,000 to $999,999 | 0 (0.0%) | 0 (0.0%) |
| $1,000,000 or more | 0 (0.0%) | 0 (0.0%) |
| Total | 98 (100.0%) | 33 (100.0%) |
Household Income by Mortgage Status in Lake View
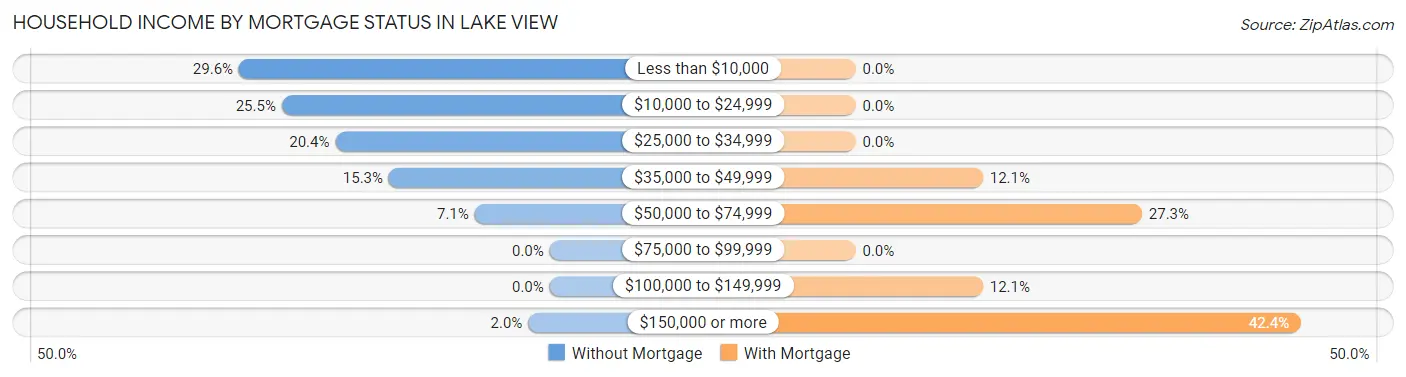
| Household Income | Without Mortgage | With Mortgage |
| Less than $10,000 | 29 (29.6%) | 0 (0.0%) |
| $10,000 to $24,999 | 25 (25.5%) | 0 (0.0%) |
| $25,000 to $34,999 | 20 (20.4%) | 0 (0.0%) |
| $35,000 to $49,999 | 15 (15.3%) | 4 (12.1%) |
| $50,000 to $74,999 | 7 (7.1%) | 9 (27.3%) |
| $75,000 to $99,999 | 0 (0.0%) | 0 (0.0%) |
| $100,000 to $149,999 | 0 (0.0%) | 4 (12.1%) |
| $150,000 or more | 2 (2.0%) | 14 (42.4%) |
| Total | 98 (100.0%) | 33 (100.0%) |
Property Value to Household Income Ratio in Lake View
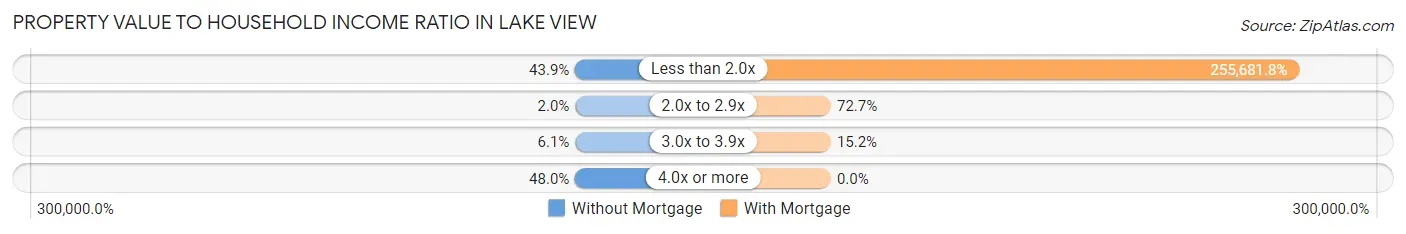
| Value-to-Income Ratio | Without Mortgage | With Mortgage |
| Less than 2.0x | 43 (43.9%) | 84,375 (255,681.8%) |
| 2.0x to 2.9x | 2 (2.0%) | 24 (72.7%) |
| 3.0x to 3.9x | 6 (6.1%) | 5 (15.1%) |
| 4.0x or more | 47 (48.0%) | 0 (0.0%) |
| Total | 98 (100.0%) | 33 (100.0%) |
Real Estate Taxes by Mortgage Status in Lake View
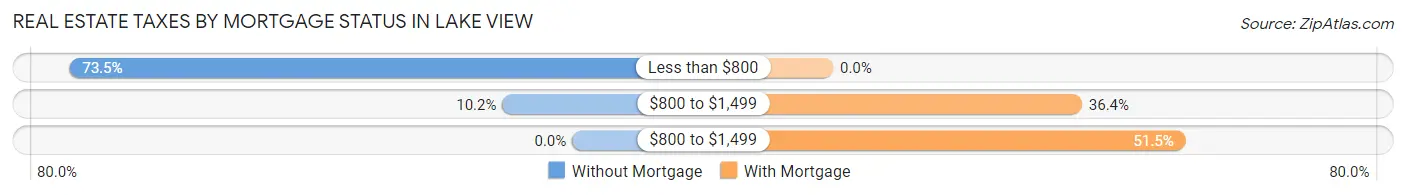
| Property Taxes | Without Mortgage | With Mortgage |
| Less than $800 | 72 (73.5%) | 0 (0.0%) |
| $800 to $1,499 | 10 (10.2%) | 12 (36.4%) |
| $800 to $1,499 | 0 (0.0%) | 17 (51.5%) |
| Total | 98 (100.0%) | 33 (100.0%) |
Health & Disability in Lake View
Health Insurance Coverage by Age in Lake View
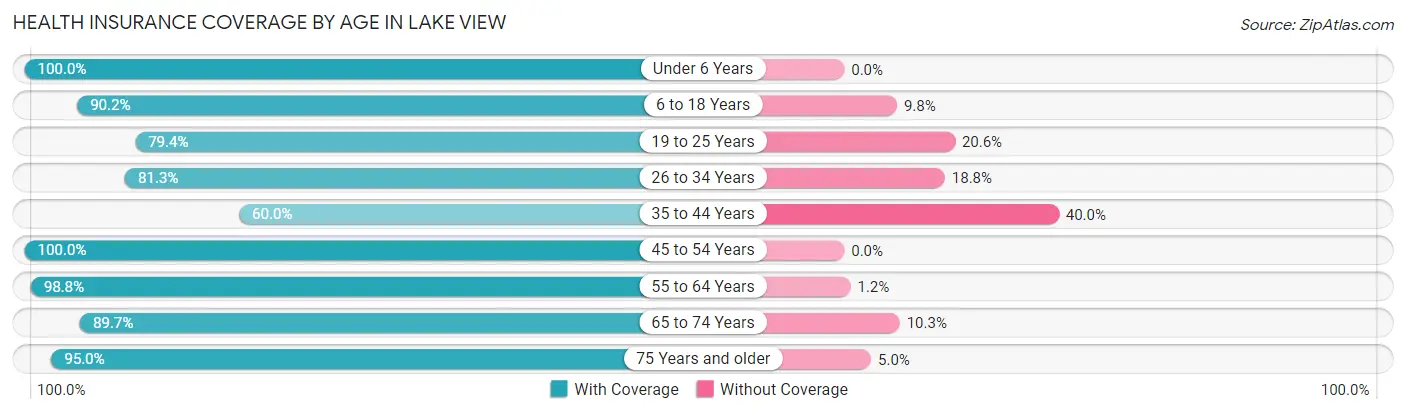
| Age Bracket | With Coverage | Without Coverage |
| Under 6 Years | 37 (100.0%) | 0 (0.0%) |
| 6 to 18 Years | 101 (90.2%) | 11 (9.8%) |
| 19 to 25 Years | 50 (79.4%) | 13 (20.6%) |
| 26 to 34 Years | 39 (81.2%) | 9 (18.8%) |
| 35 to 44 Years | 42 (60.0%) | 28 (40.0%) |
| 45 to 54 Years | 114 (100.0%) | 0 (0.0%) |
| 55 to 64 Years | 85 (98.8%) | 1 (1.2%) |
| 65 to 74 Years | 78 (89.7%) | 9 (10.3%) |
| 75 Years and older | 76 (95.0%) | 4 (5.0%) |
| Total | 622 (89.2%) | 75 (10.8%) |
Health Insurance Coverage by Citizenship Status in Lake View
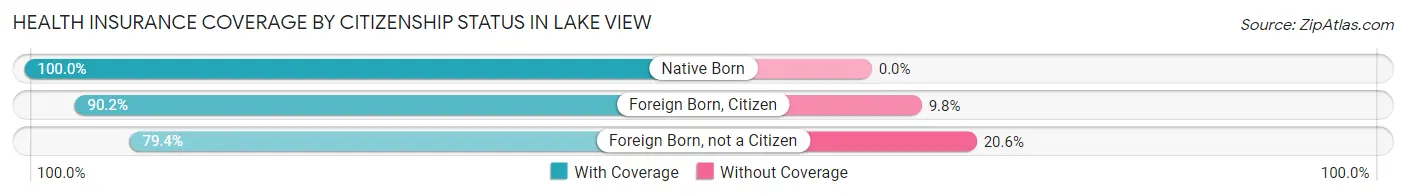
| Citizenship Status | With Coverage | Without Coverage |
| Native Born | 37 (100.0%) | 0 (0.0%) |
| Foreign Born, Citizen | 101 (90.2%) | 11 (9.8%) |
| Foreign Born, not a Citizen | 50 (79.4%) | 13 (20.6%) |
Health Insurance Coverage by Household Income in Lake View
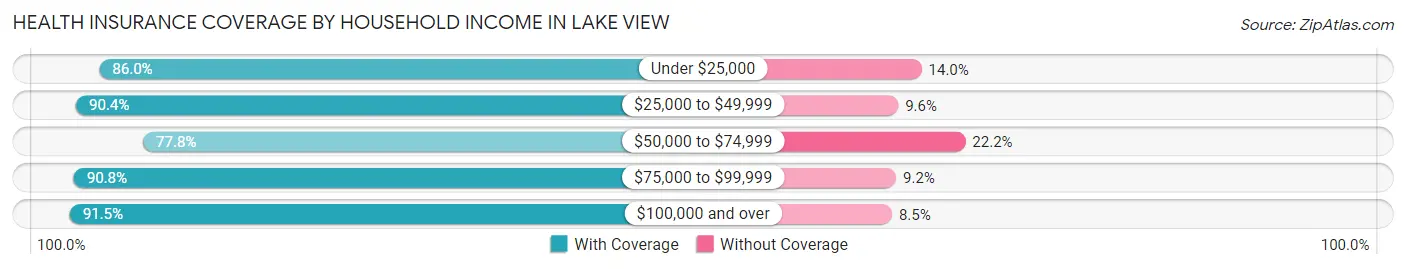
| Household Income | With Coverage | Without Coverage |
| Under $25,000 | 227 (86.0%) | 37 (14.0%) |
| $25,000 to $49,999 | 150 (90.4%) | 16 (9.6%) |
| $50,000 to $74,999 | 21 (77.8%) | 6 (22.2%) |
| $75,000 to $99,999 | 59 (90.8%) | 6 (9.2%) |
| $100,000 and over | 108 (91.5%) | 10 (8.5%) |
Public vs Private Health Insurance Coverage by Age in Lake View
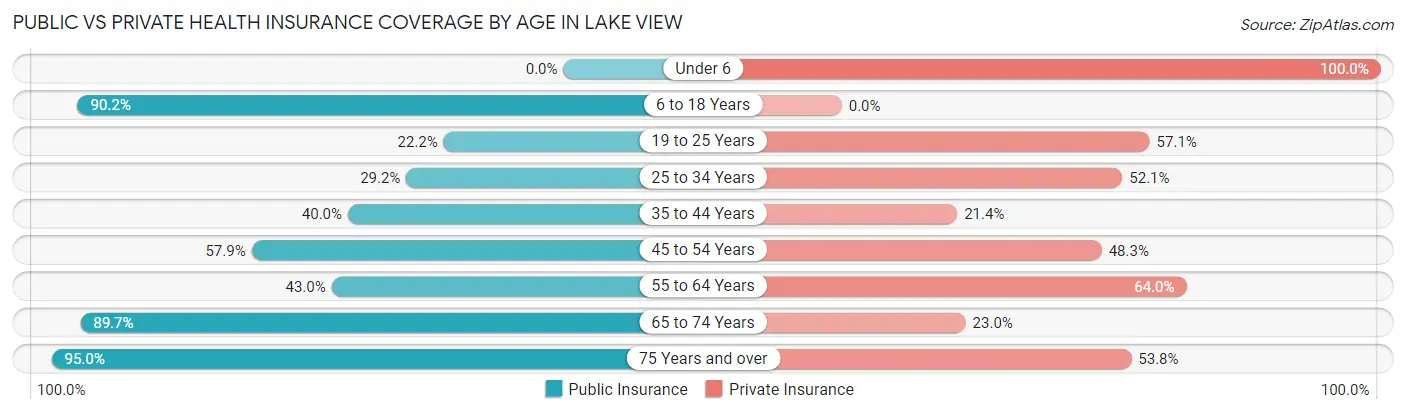
| Age Bracket | Public Insurance | Private Insurance |
| Under 6 | 0 (0.0%) | 37 (100.0%) |
| 6 to 18 Years | 101 (90.2%) | 0 (0.0%) |
| 19 to 25 Years | 14 (22.2%) | 36 (57.1%) |
| 25 to 34 Years | 14 (29.2%) | 25 (52.1%) |
| 35 to 44 Years | 28 (40.0%) | 15 (21.4%) |
| 45 to 54 Years | 66 (57.9%) | 55 (48.2%) |
| 55 to 64 Years | 37 (43.0%) | 55 (63.9%) |
| 65 to 74 Years | 78 (89.7%) | 20 (23.0%) |
| 75 Years and over | 76 (95.0%) | 43 (53.7%) |
| Total | 414 (59.4%) | 286 (41.0%) |
Disability Status by Sex by Age in Lake View
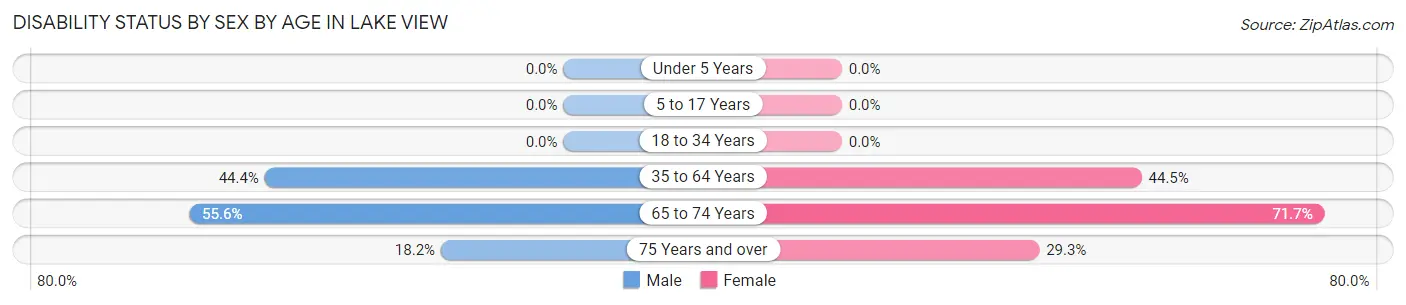
| Age Bracket | Male | Female |
| Under 5 Years | 0 (0.0%) | 0 (0.0%) |
| 5 to 17 Years | 0 (0.0%) | 0 (0.0%) |
| 18 to 34 Years | 0 (0.0%) | 0 (0.0%) |
| 35 to 64 Years | 55 (44.4%) | 65 (44.5%) |
| 65 to 74 Years | 15 (55.6%) | 43 (71.7%) |
| 75 Years and over | 4 (18.2%) | 17 (29.3%) |
Disability Class by Sex by Age in Lake View
Disability Class: Hearing Difficulty
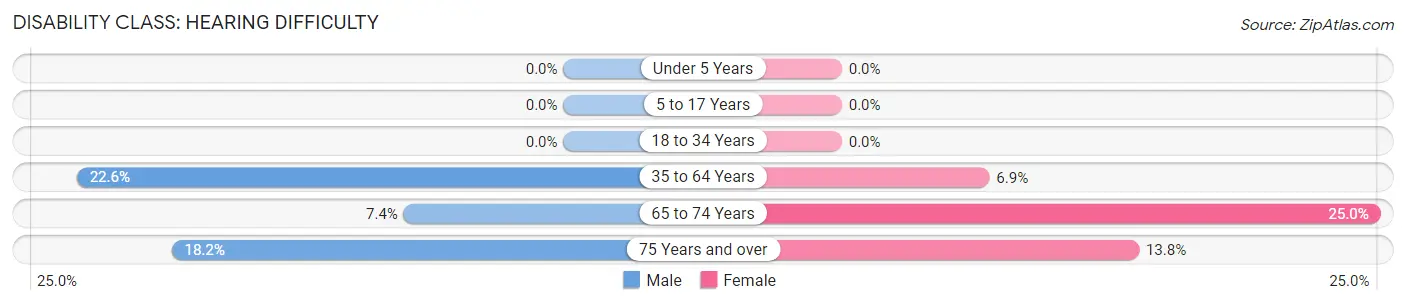
| Age Bracket | Male | Female |
| Under 5 Years | 0 (0.0%) | 0 (0.0%) |
| 5 to 17 Years | 0 (0.0%) | 0 (0.0%) |
| 18 to 34 Years | 0 (0.0%) | 0 (0.0%) |
| 35 to 64 Years | 28 (22.6%) | 10 (6.9%) |
| 65 to 74 Years | 2 (7.4%) | 15 (25.0%) |
| 75 Years and over | 4 (18.2%) | 8 (13.8%) |
Disability Class: Vision Difficulty
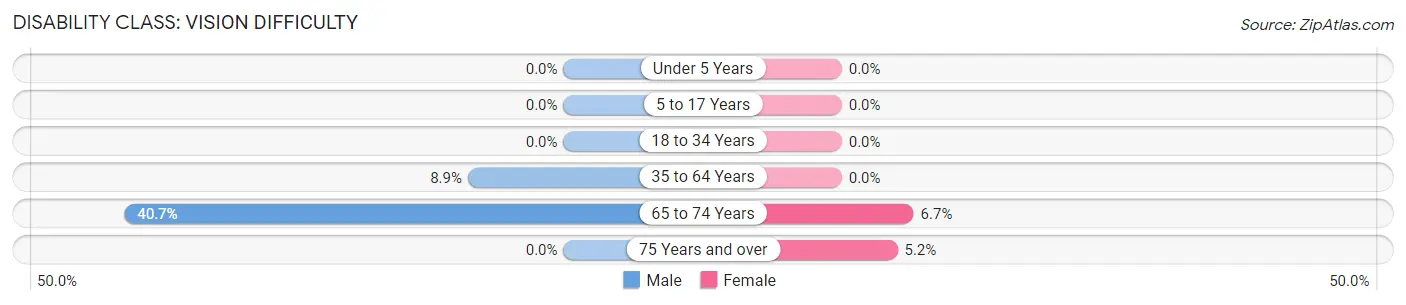
| Age Bracket | Male | Female |
| Under 5 Years | 0 (0.0%) | 0 (0.0%) |
| 5 to 17 Years | 0 (0.0%) | 0 (0.0%) |
| 18 to 34 Years | 0 (0.0%) | 0 (0.0%) |
| 35 to 64 Years | 11 (8.9%) | 0 (0.0%) |
| 65 to 74 Years | 11 (40.7%) | 4 (6.7%) |
| 75 Years and over | 0 (0.0%) | 3 (5.2%) |
Disability Class: Cognitive Difficulty
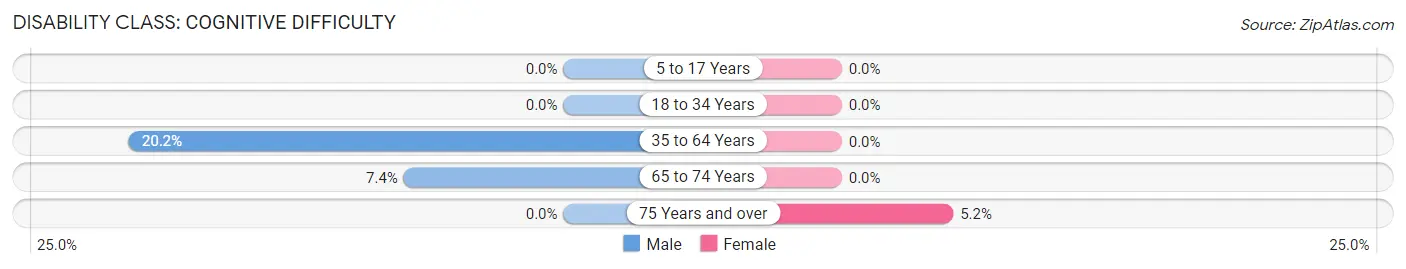
| Age Bracket | Male | Female |
| 5 to 17 Years | 0 (0.0%) | 0 (0.0%) |
| 18 to 34 Years | 0 (0.0%) | 0 (0.0%) |
| 35 to 64 Years | 25 (20.2%) | 0 (0.0%) |
| 65 to 74 Years | 2 (7.4%) | 0 (0.0%) |
| 75 Years and over | 0 (0.0%) | 3 (5.2%) |
Disability Class: Ambulatory Difficulty
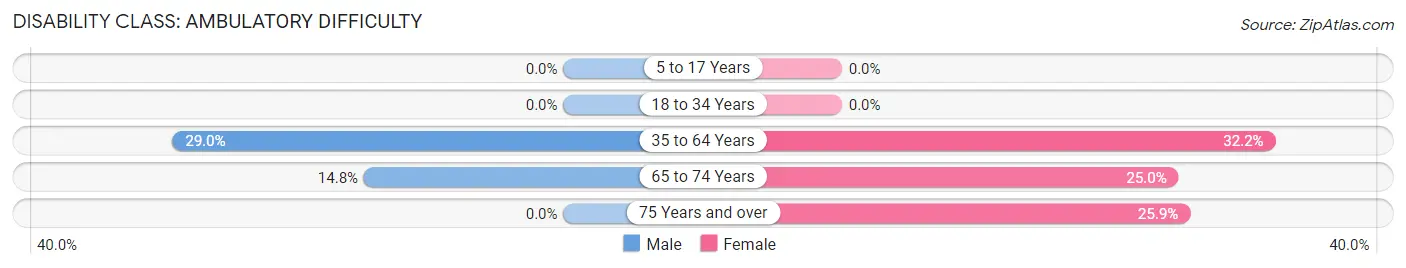
| Age Bracket | Male | Female |
| 5 to 17 Years | 0 (0.0%) | 0 (0.0%) |
| 18 to 34 Years | 0 (0.0%) | 0 (0.0%) |
| 35 to 64 Years | 36 (29.0%) | 47 (32.2%) |
| 65 to 74 Years | 4 (14.8%) | 15 (25.0%) |
| 75 Years and over | 0 (0.0%) | 15 (25.9%) |
Disability Class: Self-Care Difficulty
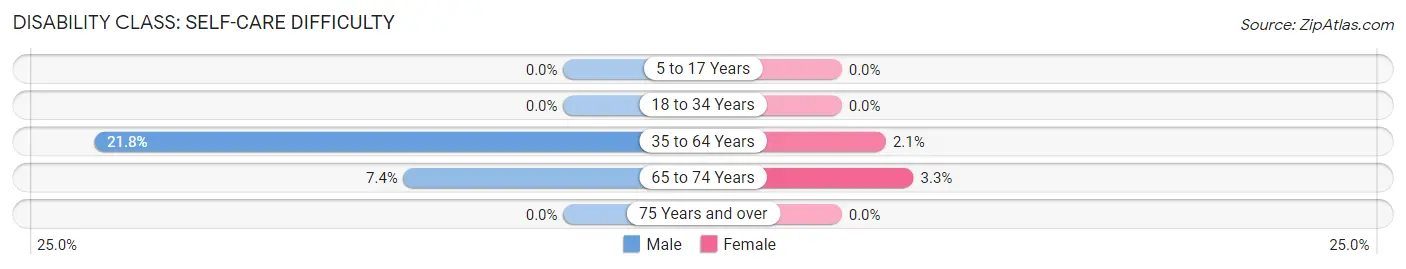
| Age Bracket | Male | Female |
| 5 to 17 Years | 0 (0.0%) | 0 (0.0%) |
| 18 to 34 Years | 0 (0.0%) | 0 (0.0%) |
| 35 to 64 Years | 27 (21.8%) | 3 (2.1%) |
| 65 to 74 Years | 2 (7.4%) | 2 (3.3%) |
| 75 Years and over | 0 (0.0%) | 0 (0.0%) |
Technology Access in Lake View
Computing Device Access in Lake View
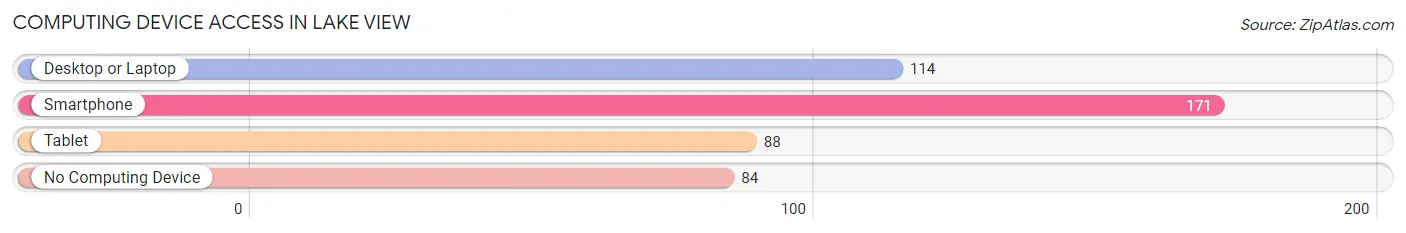
| Device Type | # Households | % Households |
| Desktop or Laptop | 114 | 40.4% |
| Smartphone | 171 | 60.6% |
| Tablet | 88 | 31.2% |
| No Computing Device | 84 | 29.8% |
| Total | 282 | 100.0% |
Internet Access in Lake View
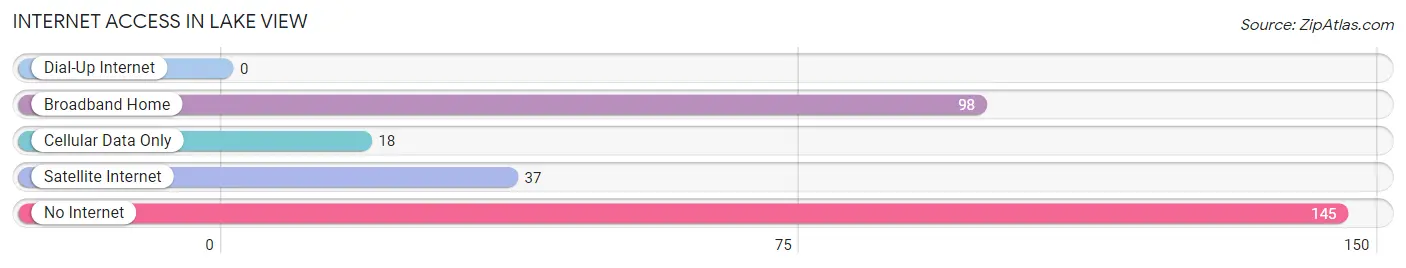
| Internet Type | # Households | % Households |
| Dial-Up Internet | 0 | 0.0% |
| Broadband Home | 98 | 34.7% |
| Cellular Data Only | 18 | 6.4% |
| Satellite Internet | 37 | 13.1% |
| No Internet | 145 | 51.4% |
| Total | 282 | 100.0% |
Lake View Summary
View, SC is a small town located in the foothills of the Blue Ridge Mountains in Pickens County, South Carolina. The town is situated on the banks of Lake Hartwell, a large man-made lake created by the U.S. Army Corps of Engineers in the 1950s. The town is home to a population of approximately 1,000 people and is a popular destination for outdoor recreation, such as fishing, boating, and camping.
History
The area that is now Lake View was originally inhabited by the Cherokee Indians. The first European settlers arrived in the area in the late 1700s and early 1800s. The town was officially established in 1820 and was named after the nearby lake. In the late 1800s, the town was a popular destination for wealthy families from the nearby cities of Greenville and Spartanburg. The town was also home to a number of resorts and hotels, which attracted visitors from all over the country.
In the early 1900s, the town began to decline as the railroad bypassed the area and the resorts and hotels closed. The town was revitalized in the 1950s when the U.S. Army Corps of Engineers created Lake Hartwell. The lake provided a new source of recreation and tourism for the area, and the town began to grow again.
Geography
Lake View is located in the foothills of the Blue Ridge Mountains in Pickens County, South Carolina. The town is situated on the banks of Lake Hartwell, a large man-made lake created by the U.S. Army Corps of Engineers in the 1950s. The lake is approximately 56,000 acres in size and is a popular destination for fishing, boating, and camping. The town is also located near the Chattooga River, which is a popular destination for whitewater rafting and kayaking.
The town is located approximately 30 miles from the cities of Greenville and Spartanburg. It is also located approximately 50 miles from the city of Asheville, North Carolina.
Economy
The economy of Lake View is largely based on tourism and recreation. The town is a popular destination for outdoor recreation, such as fishing, boating, and camping. The town is also home to a number of restaurants, shops, and other businesses that cater to visitors.
The town is also home to a number of manufacturing and industrial businesses. The largest employer in the town is the Lake View Manufacturing Company, which produces a variety of products, including furniture, textiles, and automotive parts.
Demographics
As of the 2010 census, the population of Lake View was 1,000. The racial makeup of the town was 95.2% White, 2.2% African American, 0.7% Native American, 0.3% Asian, and 1.6% from other races. The median household income was $37,500 and the median family income was $45,000. The per capita income was $19,000.
Conclusion
Lake View, SC is a small town located in the foothills of the Blue Ridge Mountains in Pickens County, South Carolina. The town is situated on the banks of Lake Hartwell, a large man-made lake created by the U.S. Army Corps of Engineers in the 1950s. The town is home to a population of approximately 1,000 people and is a popular destination for outdoor recreation, such as fishing, boating, and camping. The economy of the town is largely based on tourism and recreation, and the town is also home to a number of manufacturing and industrial businesses. The racial makeup of the town is predominantly White, with a small percentage of African American, Native American, and Asian residents. The median household income is $37,500 and the median family income is $45,000.
Common Questions
What is the Total Population of Lake View?
Total Population of Lake View is 702.
What is the Total Male Population of Lake View?
Total Male Population of Lake View is 327.
What is the Total Female Population of Lake View?
Total Female Population of Lake View is 375.
What is the Ratio of Males per 100 Females in Lake View?
There are 87.20 Males per 100 Females in Lake View.
What is the Ratio of Females per 100 Males in Lake View?
There are 114.68 Females per 100 Males in Lake View.
What is the Median Population Age in Lake View?
Median Population Age in Lake View is 48.0 Years.
What is the Average Family Size in Lake View
Average Family Size in Lake View is 3.4 People.
What is the Average Household Size in Lake View
Average Household Size in Lake View is 2.3 People.
What is Per Capita Income in Lake View?
Per Capita income in Lake View is $18,178.
What is the Median Family Income in Lake View?
Median Family Income in Lake View is $45,682.
What is the Median Household income in Lake View?
Median Household Income in Lake View is $24,853.
What is Income or Wage Gap in Lake View?
Income or Wage Gap in Lake View is 23.2%.
Women in Lake View earn 76.8 cents for every dollar earned by a man.
What is Inequality or Gini Index in Lake View?
Inequality or Gini Index in Lake View is 0.53.
How Large is the Labor Force in Lake View?
There are 253 People in the Labor Forcein in Lake View.
What is the Percentage of People in the Labor Force in Lake View?
44.9% of People are in the Labor Force in Lake View.
What is the Unemployment Rate in Lake View?
Unemployment Rate in Lake View is 3.6%.