Laurys Station, PA
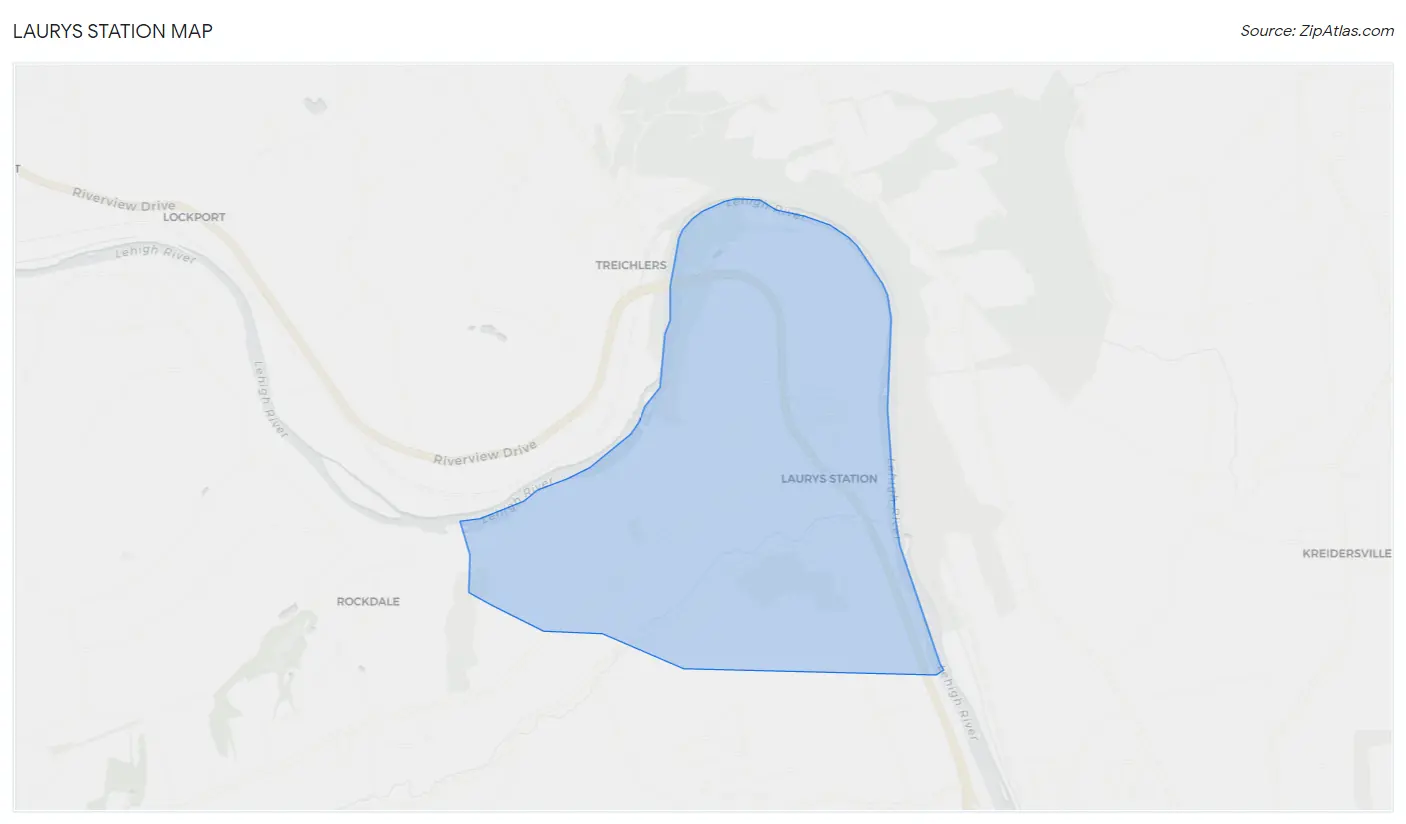
Laurys Station Map
Laurys Station Overview
728
TOTAL POPULATION
347
MALE POPULATION
381
FEMALE POPULATION
91.08
MALES / 100 FEMALES
109.80
FEMALES / 100 MALES
55.4
MEDIAN AGE
2.5
AVG FAMILY SIZE
2.2
AVG HOUSEHOLD SIZE
$64,811
PER CAPITA INCOME
$165,139
AVG FAMILY INCOME
$136,250
AVG HOUSEHOLD INCOME
4.4%
WAGE / INCOME GAP [ % ]
95.6¢/ $1
WAGE / INCOME GAP [ $ ]
0.40
INEQUALITY / GINI INDEX
472
LABOR FORCE [ PEOPLE ]
68.8%
PERCENT IN LABOR FORCE
Laurys Station Zip Codes
Laurys Station Area Codes
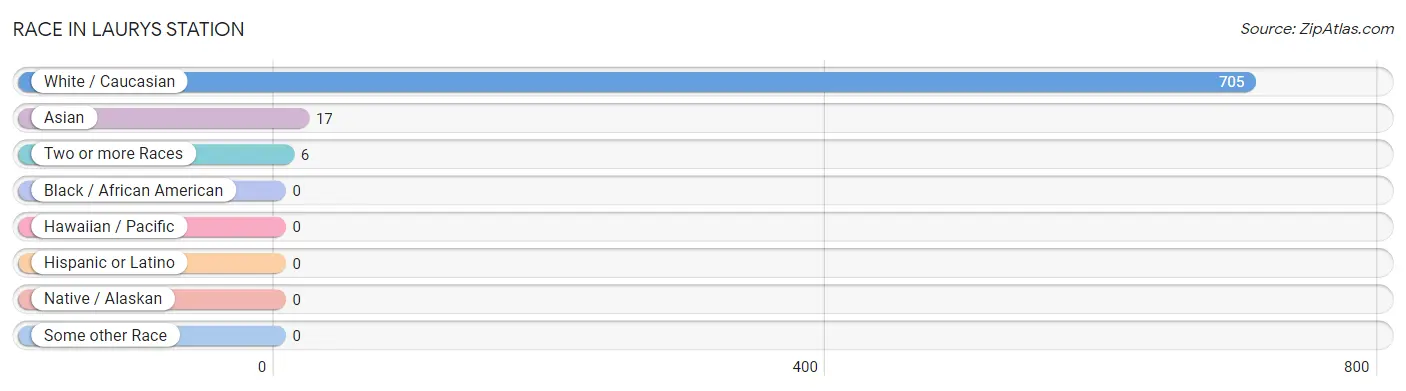
Race in Laurys Station
The most populous races in Laurys Station are White / Caucasian (705 | 96.8%), Asian (17 | 2.3%), and Two or more Races (6 | 0.8%).
| Race | # Population | % Population |
| Asian | 17 | 2.3% |
| Black / African American | 0 | 0.0% |
| Hawaiian / Pacific | 0 | 0.0% |
| Hispanic or Latino | 0 | 0.0% |
| Native / Alaskan | 0 | 0.0% |
| White / Caucasian | 705 | 96.8% |
| Two or more Races | 6 | 0.8% |
| Some other Race | 0 | 0.0% |
| Total | 728 | 100.0% |
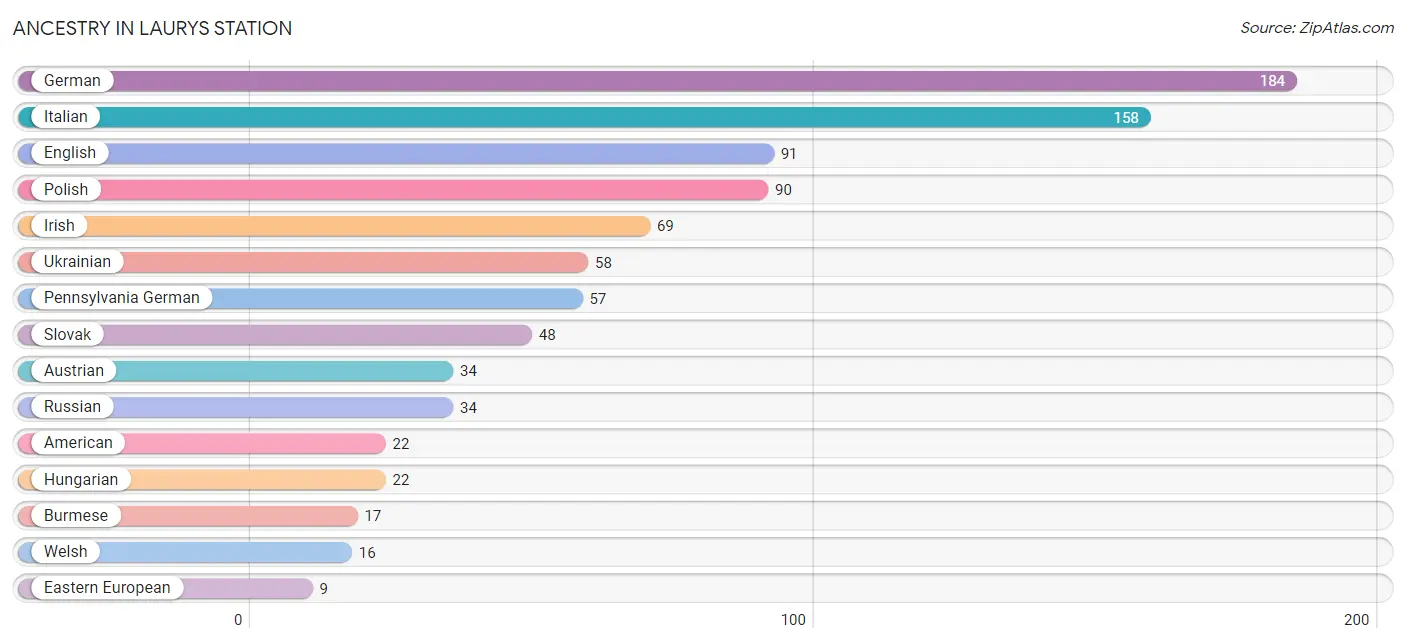
Ancestry in Laurys Station
The most populous ancestries reported in Laurys Station are German (184 | 25.3%), Italian (158 | 21.7%), English (91 | 12.5%), Polish (90 | 12.4%), and Irish (69 | 9.5%), together accounting for 81.3% of all Laurys Station residents.
| Ancestry | # Population | % Population |
| American | 22 | 3.0% |
| Arab | 5 | 0.7% |
| Austrian | 34 | 4.7% |
| Burmese | 17 | 2.3% |
| Czechoslovakian | 8 | 1.1% |
| Delaware | 6 | 0.8% |
| Eastern European | 9 | 1.2% |
| English | 91 | 12.5% |
| German | 184 | 25.3% |
| Greek | 8 | 1.1% |
| Hungarian | 22 | 3.0% |
| Irish | 69 | 9.5% |
| Italian | 158 | 21.7% |
| Palestinian | 5 | 0.7% |
| Pennsylvania German | 57 | 7.8% |
| Polish | 90 | 12.4% |
| Russian | 34 | 4.7% |
| Scottish | 9 | 1.2% |
| Slovak | 48 | 6.6% |
| Ukrainian | 58 | 8.0% |
| Welsh | 16 | 2.2% | View All 21 Rows |
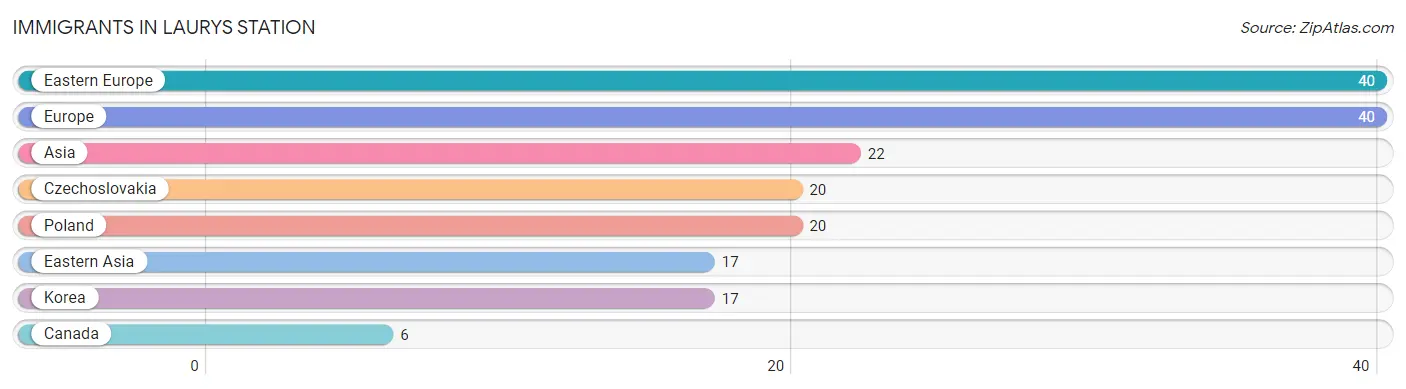
Immigrants in Laurys Station
The most numerous immigrant groups reported in Laurys Station came from Eastern Europe (40 | 5.5%), Europe (40 | 5.5%), Asia (22 | 3.0%), Czechoslovakia (20 | 2.8%), and Poland (20 | 2.8%), together accounting for 19.5% of all Laurys Station residents.
| Immigration Origin | # Population | % Population |
| Asia | 22 | 3.0% |
| Canada | 6 | 0.8% |
| Czechoslovakia | 20 | 2.8% |
| Eastern Asia | 17 | 2.3% |
| Eastern Europe | 40 | 5.5% |
| Europe | 40 | 5.5% |
| Korea | 17 | 2.3% |
| Poland | 20 | 2.8% | View All 8 Rows |
Sex and Age in Laurys Station
Sex and Age in Laurys Station
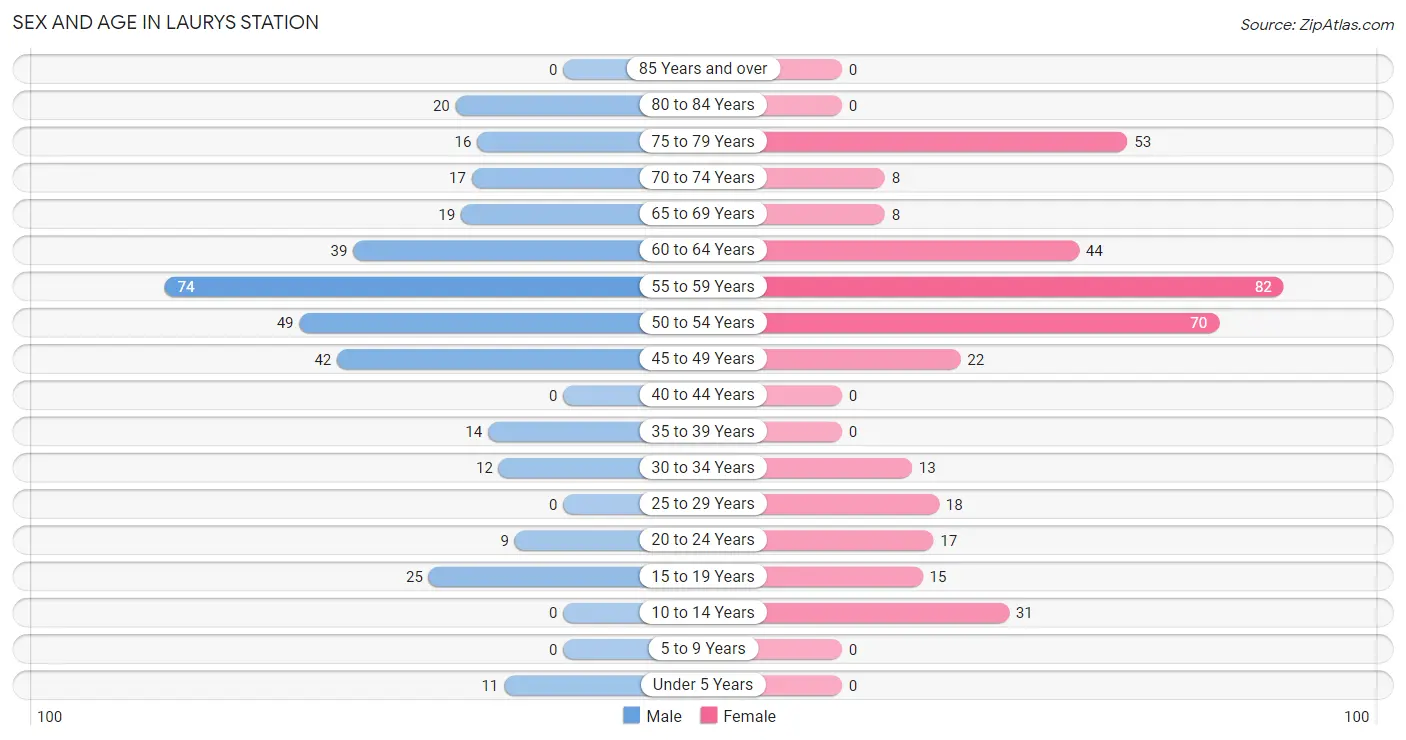
The most populous age groups in Laurys Station are 55 to 59 Years (74 | 21.3%) for men and 55 to 59 Years (82 | 21.5%) for women.
| Age Bracket | Male | Female |
| Under 5 Years | 11 (3.2%) | 0 (0.0%) |
| 5 to 9 Years | 0 (0.0%) | 0 (0.0%) |
| 10 to 14 Years | 0 (0.0%) | 31 (8.1%) |
| 15 to 19 Years | 25 (7.2%) | 15 (3.9%) |
| 20 to 24 Years | 9 (2.6%) | 17 (4.5%) |
| 25 to 29 Years | 0 (0.0%) | 18 (4.7%) |
| 30 to 34 Years | 12 (3.5%) | 13 (3.4%) |
| 35 to 39 Years | 14 (4.0%) | 0 (0.0%) |
| 40 to 44 Years | 0 (0.0%) | 0 (0.0%) |
| 45 to 49 Years | 42 (12.1%) | 22 (5.8%) |
| 50 to 54 Years | 49 (14.1%) | 70 (18.4%) |
| 55 to 59 Years | 74 (21.3%) | 82 (21.5%) |
| 60 to 64 Years | 39 (11.2%) | 44 (11.6%) |
| 65 to 69 Years | 19 (5.5%) | 8 (2.1%) |
| 70 to 74 Years | 17 (4.9%) | 8 (2.1%) |
| 75 to 79 Years | 16 (4.6%) | 53 (13.9%) |
| 80 to 84 Years | 20 (5.8%) | 0 (0.0%) |
| 85 Years and over | 0 (0.0%) | 0 (0.0%) |
| Total | 347 (100.0%) | 381 (100.0%) |
Families and Households in Laurys Station
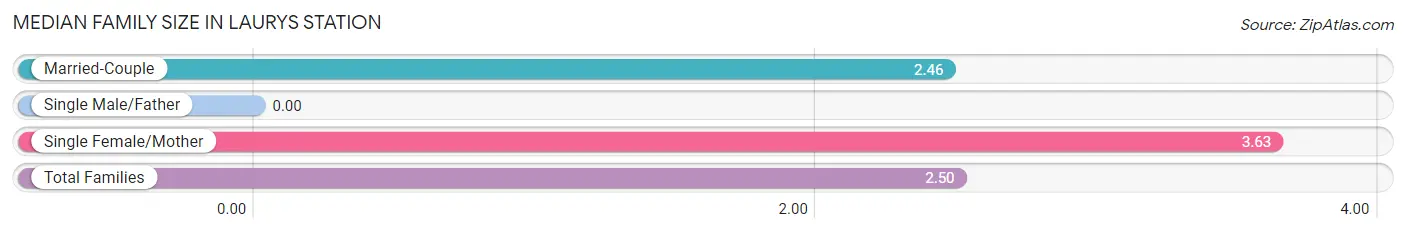
Median Family Size in Laurys Station
| Family Type | # Families | Family Size |
| Married-Couple | 251 (96.9%) | 2.46 |
| Single Male/Father | 0 (0.0%) | - |
| Single Female/Mother | 8 (3.1%) | 3.63 |
| Total Families | 259 (100.0%) | 2.50 |
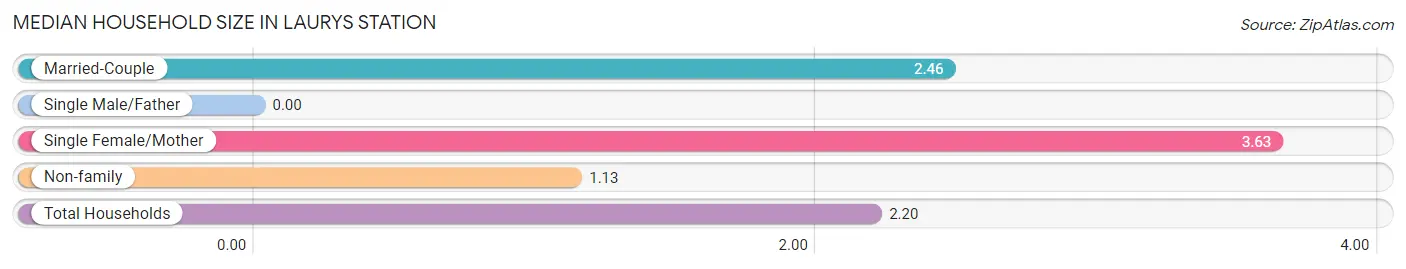
Median Household Size in Laurys Station
| Household Type | # Households | Household Size |
| Married-Couple | 251 (75.8%) | 2.46 |
| Single Male/Father | 0 (0.0%) | - |
| Single Female/Mother | 8 (2.4%) | 3.63 |
| Non-family | 72 (21.7%) | 1.13 |
| Total Households | 331 (100.0%) | 2.20 |
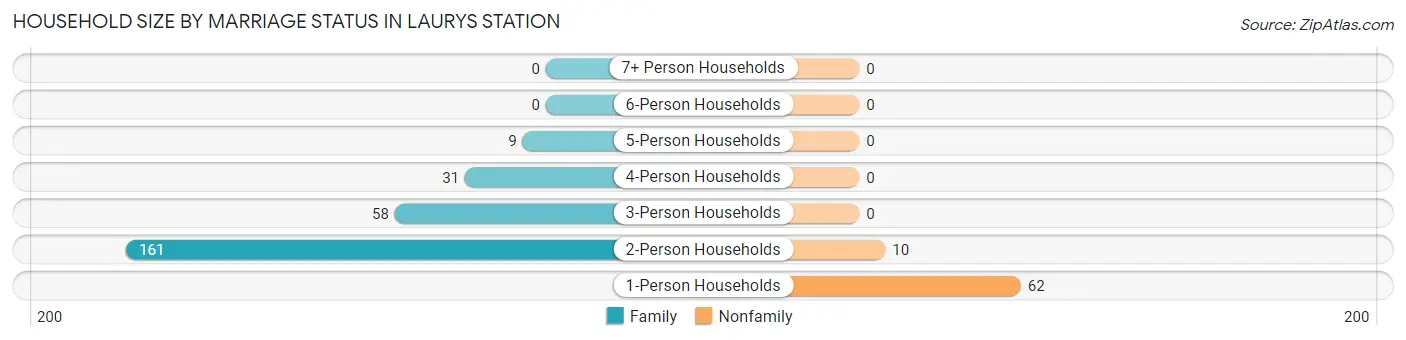
Household Size by Marriage Status in Laurys Station
Out of a total of 331 households in Laurys Station, 259 (78.2%) are family households, while 72 (21.7%) are nonfamily households. The most numerous type of family households are 2-person households, comprising 161, and the most common type of nonfamily households are 1-person households, comprising 62.
| Household Size | Family Households | Nonfamily Households |
| 1-Person Households | - | 62 (18.7%) |
| 2-Person Households | 161 (48.6%) | 10 (3.0%) |
| 3-Person Households | 58 (17.5%) | 0 (0.0%) |
| 4-Person Households | 31 (9.4%) | 0 (0.0%) |
| 5-Person Households | 9 (2.7%) | 0 (0.0%) |
| 6-Person Households | 0 (0.0%) | 0 (0.0%) |
| 7+ Person Households | 0 (0.0%) | 0 (0.0%) |
| Total | 259 (78.2%) | 72 (21.7%) |
Female Fertility in Laurys Station
Fertility by Age in Laurys Station
| Age Bracket | Women with Births | Births / 1,000 Women |
| 15 to 19 years | 0 (0.0%) | 0.0 |
| 20 to 34 years | 0 (0.0%) | 0.0 |
| 35 to 50 years | 0 (0.0%) | 0.0 |
| Total | 0 (0.0%) | 0.0 |
Fertility by Age by Marriage Status in Laurys Station
| Age Bracket | Married | Unmarried |
| 15 to 19 years | 0 (0.0%) | 0 (0.0%) |
| 20 to 34 years | 0 (0.0%) | 0 (0.0%) |
| 35 to 50 years | 0 (0.0%) | 0 (0.0%) |
| Total | 0 (0.0%) | 0 (0.0%) |
Fertility by Education in Laurys Station
| Educational Attainment | Women with Births | Births / 1,000 Women |
| Less than High School | 0 (0.0%) | 0.0 |
| High School Diploma | 0 (0.0%) | 0.0 |
| College or Associate's Degree | 0 (0.0%) | 0.0 |
| Bachelor's Degree | 0 (0.0%) | 0.0 |
| Graduate Degree | 0 (0.0%) | 0.0 |
| Total | 0 (0.0%) | 0.0 |
Fertility by Education by Marriage Status in Laurys Station
| Educational Attainment | Married | Unmarried |
| Less than High School | 0 (0.0%) | 0 (0.0%) |
| High School Diploma | 0 (0.0%) | 0 (0.0%) |
| College or Associate's Degree | 0 (0.0%) | 0 (0.0%) |
| Bachelor's Degree | 0 (0.0%) | 0 (0.0%) |
| Graduate Degree | 0 (0.0%) | 0 (0.0%) |
| Total | 0 (0.0%) | 0 (0.0%) |
Income in Laurys Station
Income Overview in Laurys Station
Per Capita Income in Laurys Station is $64,811, while median incomes of families and households are $165,139 and $136,250 respectively.
| Characteristic | Number | Measure |
| Per Capita Income | 728 | $64,811 |
| Median Family Income | 259 | $165,139 |
| Mean Family Income | 259 | $177,803 |
| Median Household Income | 331 | $136,250 |
| Mean Household Income | 331 | $148,269 |
| Income Deficit | 259 | $0 |
| Wage / Income Gap (%) | 728 | 4.38% |
| Wage / Income Gap ($) | 728 | 95.62¢ per $1 |
| Gini / Inequality Index | 728 | 0.40 |
Earnings by Sex in Laurys Station
Average Earnings in Laurys Station are $83,333, $82,708 for men and $86,500 for women, a difference of 4.4%.
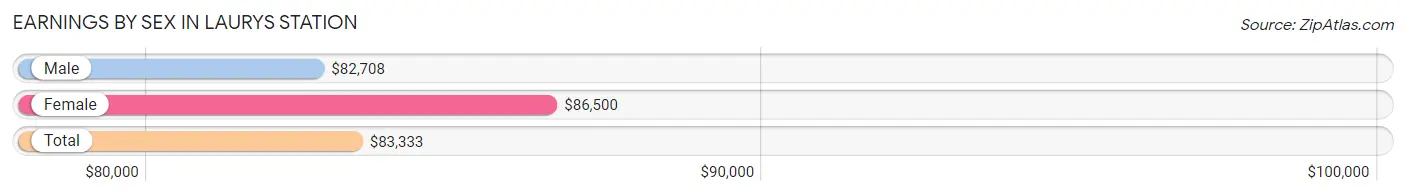
| Sex | Number | Average Earnings |
| Male | 240 (50.8%) | $82,708 |
| Female | 232 (49.1%) | $86,500 |
| Total | 472 (100.0%) | $83,333 |
Earnings by Sex by Income Bracket in Laurys Station
The most common earnings brackets in Laurys Station are $100,000+ for men (89 | 37.1%) and $100,000+ for women (92 | 39.7%).
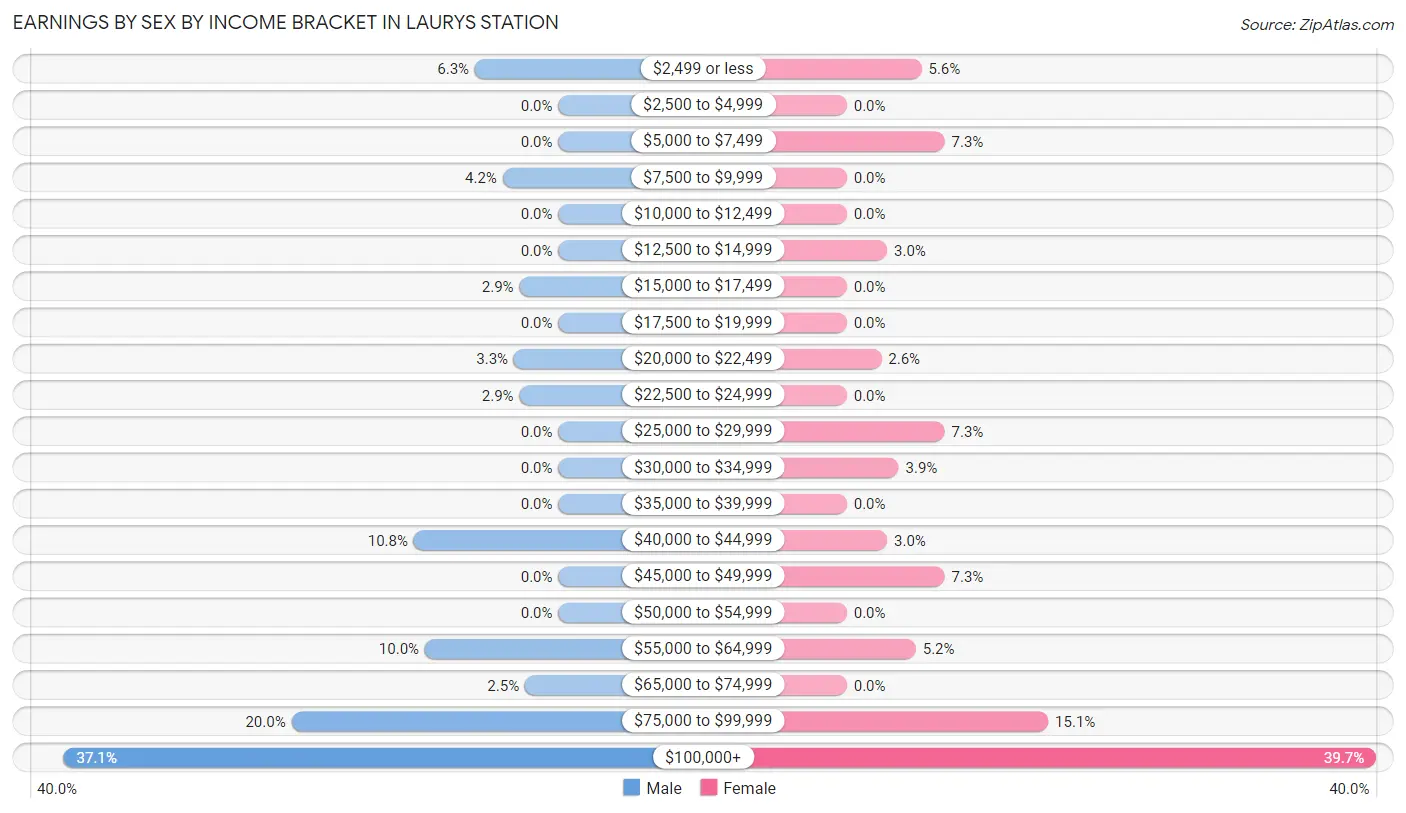
| Income | Male | Female |
| $2,499 or less | 15 (6.2%) | 13 (5.6%) |
| $2,500 to $4,999 | 0 (0.0%) | 0 (0.0%) |
| $5,000 to $7,499 | 0 (0.0%) | 17 (7.3%) |
| $7,500 to $9,999 | 10 (4.2%) | 0 (0.0%) |
| $10,000 to $12,499 | 0 (0.0%) | 0 (0.0%) |
| $12,500 to $14,999 | 0 (0.0%) | 7 (3.0%) |
| $15,000 to $17,499 | 7 (2.9%) | 0 (0.0%) |
| $17,500 to $19,999 | 0 (0.0%) | 0 (0.0%) |
| $20,000 to $22,499 | 8 (3.3%) | 6 (2.6%) |
| $22,500 to $24,999 | 7 (2.9%) | 0 (0.0%) |
| $25,000 to $29,999 | 0 (0.0%) | 17 (7.3%) |
| $30,000 to $34,999 | 0 (0.0%) | 9 (3.9%) |
| $35,000 to $39,999 | 0 (0.0%) | 0 (0.0%) |
| $40,000 to $44,999 | 26 (10.8%) | 7 (3.0%) |
| $45,000 to $49,999 | 0 (0.0%) | 17 (7.3%) |
| $50,000 to $54,999 | 0 (0.0%) | 0 (0.0%) |
| $55,000 to $64,999 | 24 (10.0%) | 12 (5.2%) |
| $65,000 to $74,999 | 6 (2.5%) | 0 (0.0%) |
| $75,000 to $99,999 | 48 (20.0%) | 35 (15.1%) |
| $100,000+ | 89 (37.1%) | 92 (39.7%) |
| Total | 240 (100.0%) | 232 (100.0%) |
Earnings by Sex by Educational Attainment in Laurys Station
Average earnings in Laurys Station are $92,813 for men and $92,031 for women, a difference of 0.8%. Men with an educational attainment of graduate degree enjoy the highest average annual earnings of $117,143, while those with college or associate's degree education earn the least with $76,786. Women with an educational attainment of bachelor's degree earn the most with the average annual earnings of $142,000, while those with college or associate's degree education have the smallest earnings of $40,714.
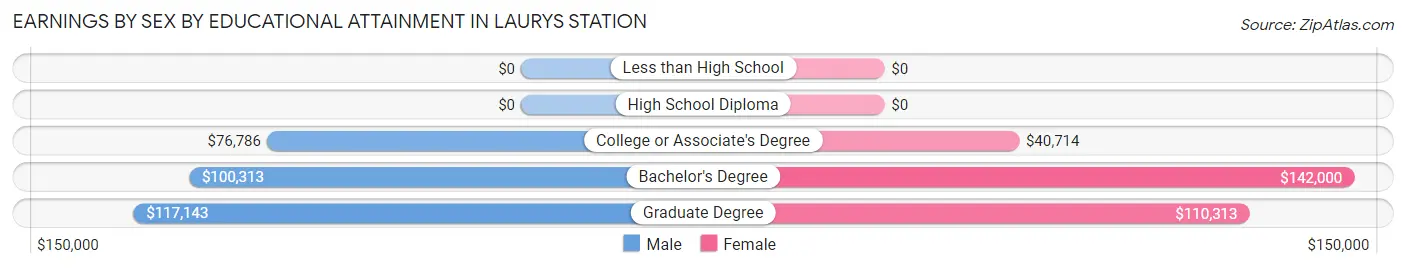
| Educational Attainment | Male Income | Female Income |
| Less than High School | - | - |
| High School Diploma | - | - |
| College or Associate's Degree | $76,786 | $40,714 |
| Bachelor's Degree | $100,313 | $142,000 |
| Graduate Degree | $117,143 | $110,313 |
| Total | $92,813 | $92,031 |
Family Income in Laurys Station
Family Income Brackets in Laurys Station
According to the Laurys Station family income data, there are 100 families falling into the $200,000+ income range, which is the most common income bracket and makes up 38.6% of all families.
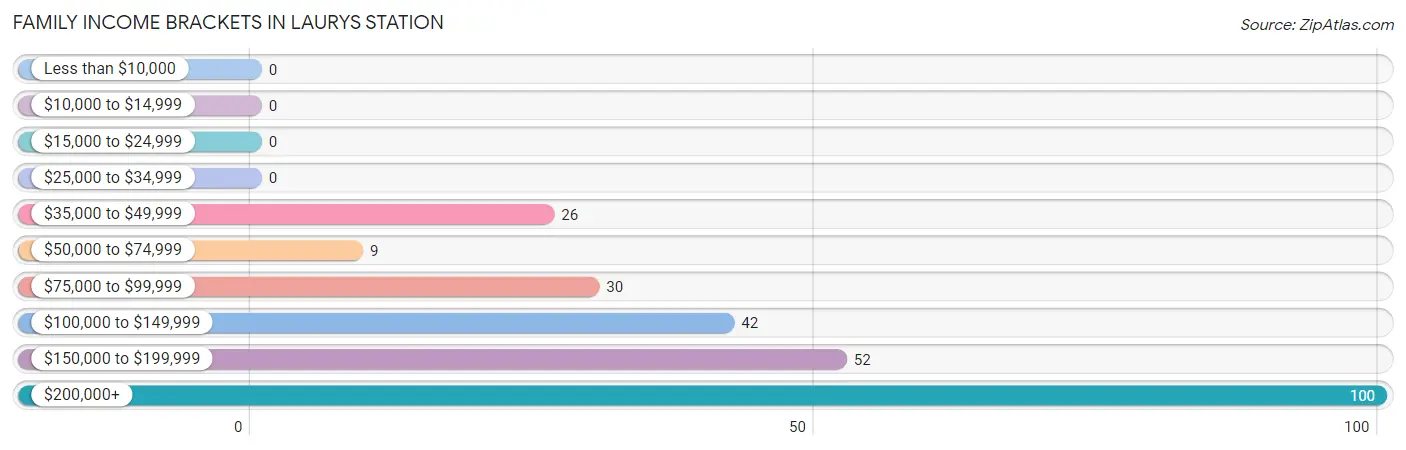
| Income Bracket | # Families | % Families |
| Less than $10,000 | 0 | 0.0% |
| $10,000 to $14,999 | 0 | 0.0% |
| $15,000 to $24,999 | 0 | 0.0% |
| $25,000 to $34,999 | 0 | 0.0% |
| $35,000 to $49,999 | 26 | 10.0% |
| $50,000 to $74,999 | 9 | 3.5% |
| $75,000 to $99,999 | 30 | 11.6% |
| $100,000 to $149,999 | 42 | 16.2% |
| $150,000 to $199,999 | 52 | 20.1% |
| $200,000+ | 100 | 38.6% |
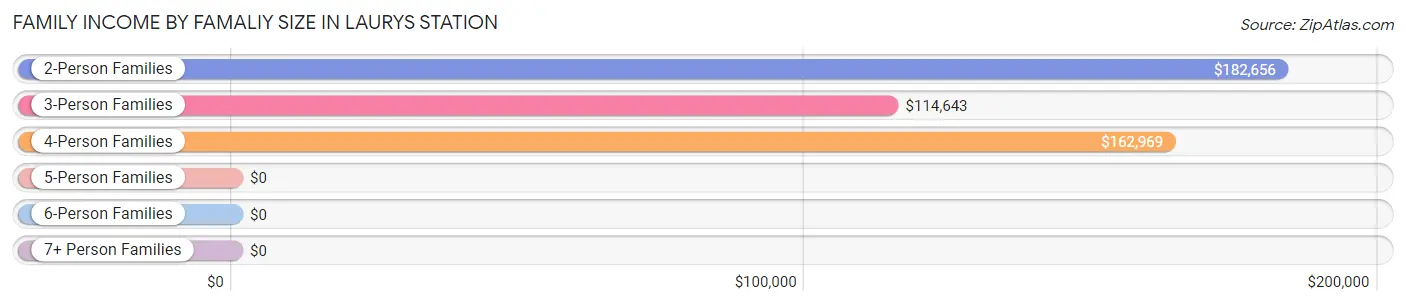
Family Income by Famaliy Size in Laurys Station
2-person families (161 | 62.2%) account for the highest median family income in Laurys Station with $182,656 per family, while 2-person families (161 | 62.2%) have the highest median income of $91,328 per family member.
| Income Bracket | # Families | Median Income |
| 2-Person Families | 161 (62.2%) | $182,656 |
| 3-Person Families | 58 (22.4%) | $114,643 |
| 4-Person Families | 31 (12.0%) | $162,969 |
| 5-Person Families | 9 (3.5%) | $0 |
| 6-Person Families | 0 (0.0%) | $0 |
| 7+ Person Families | 0 (0.0%) | $0 |
| Total | 259 (100.0%) | $165,139 |
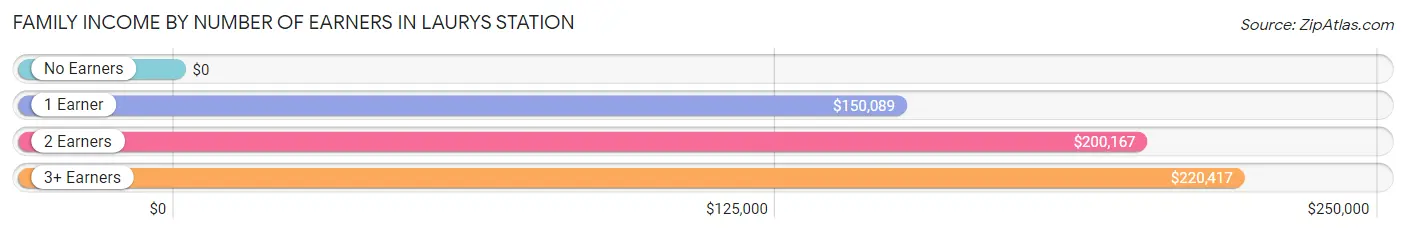
Family Income by Number of Earners in Laurys Station
| Number of Earners | # Families | Median Income |
| No Earners | 37 (14.3%) | $0 |
| 1 Earner | 45 (17.4%) | $150,089 |
| 2 Earners | 144 (55.6%) | $200,167 |
| 3+ Earners | 33 (12.7%) | $220,417 |
| Total | 259 (100.0%) | $165,139 |
Household Income in Laurys Station
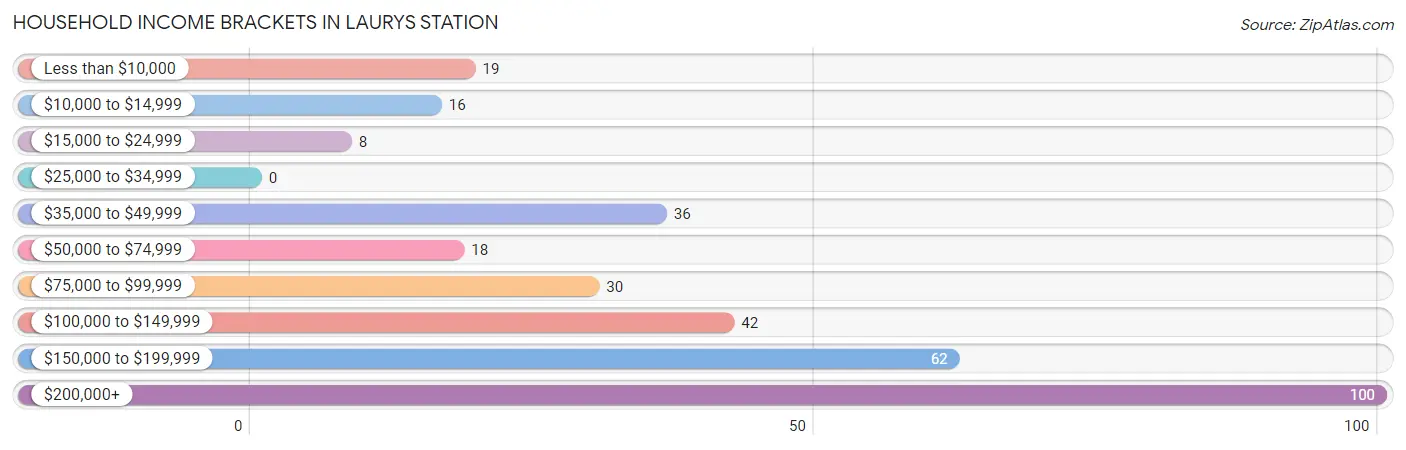
Household Income Brackets in Laurys Station
With 100 households falling in the category, the $200,000+ income range is the most frequent in Laurys Station, accounting for 30.2% of all households.
| Income Bracket | # Households | % Households |
| Less than $10,000 | 19 | 5.7% |
| $10,000 to $14,999 | 16 | 4.8% |
| $15,000 to $24,999 | 8 | 2.4% |
| $25,000 to $34,999 | 0 | 0.0% |
| $35,000 to $49,999 | 36 | 10.9% |
| $50,000 to $74,999 | 18 | 5.4% |
| $75,000 to $99,999 | 30 | 9.1% |
| $100,000 to $149,999 | 42 | 12.7% |
| $150,000 to $199,999 | 62 | 18.7% |
| $200,000+ | 100 | 30.2% |
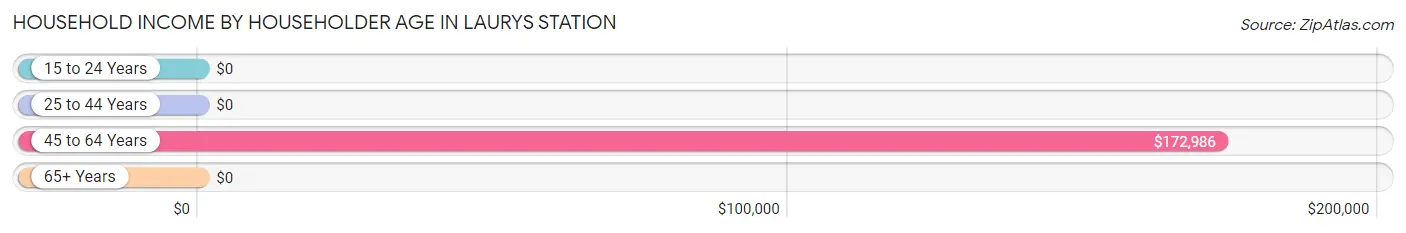
Household Income by Householder Age in Laurys Station
The median household income in Laurys Station is $136,250, with the highest median household income of $172,986 found in the 45 to 64 years age bracket for the primary householder. A total of 237 households (71.6%) fall into this category.
| Income Bracket | # Households | Median Income |
| 15 to 24 Years | 0 (0.0%) | $0 |
| 25 to 44 Years | 12 (3.6%) | $0 |
| 45 to 64 Years | 237 (71.6%) | $172,986 |
| 65+ Years | 82 (24.8%) | $0 |
| Total | 331 (100.0%) | $136,250 |
Poverty in Laurys Station
Income Below Poverty by Sex and Age in Laurys Station
With 4.0% poverty level for males and 3.2% for females among the residents of Laurys Station, 55 to 64 year old males and 55 to 64 year old females are the most vulnerable to poverty, with 8 males (7.1%) and 12 females (9.5%) in their respective age groups living below the poverty level.
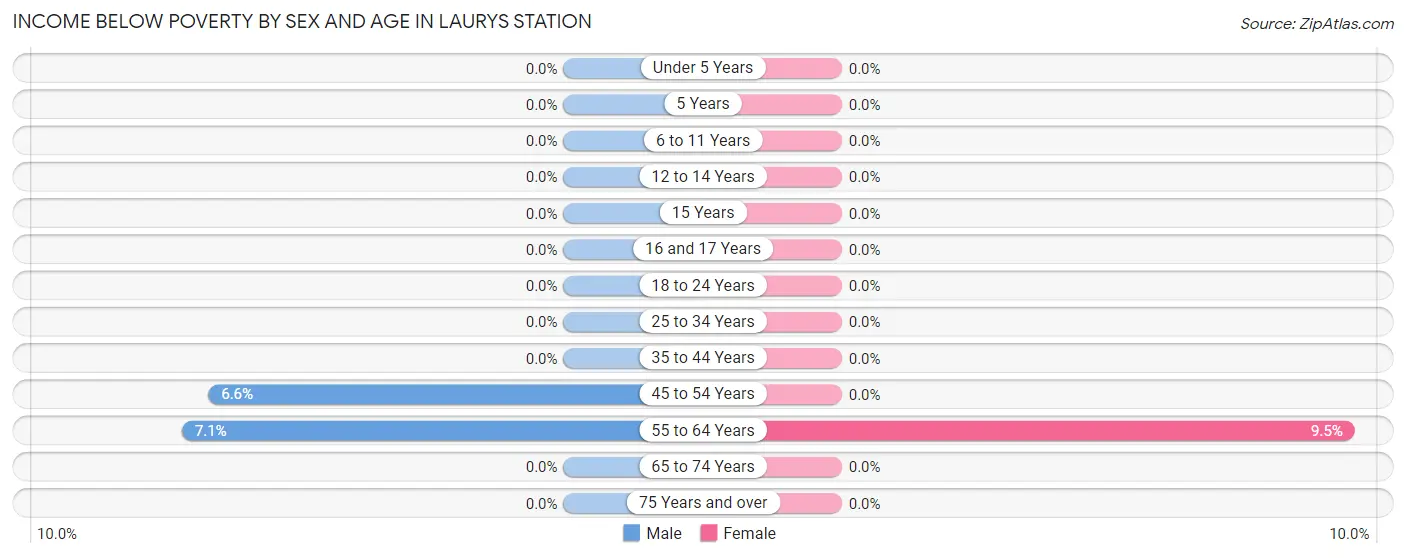
| Age Bracket | Male | Female |
| Under 5 Years | 0 (0.0%) | 0 (0.0%) |
| 5 Years | 0 (0.0%) | 0 (0.0%) |
| 6 to 11 Years | 0 (0.0%) | 0 (0.0%) |
| 12 to 14 Years | 0 (0.0%) | 0 (0.0%) |
| 15 Years | 0 (0.0%) | 0 (0.0%) |
| 16 and 17 Years | 0 (0.0%) | 0 (0.0%) |
| 18 to 24 Years | 0 (0.0%) | 0 (0.0%) |
| 25 to 34 Years | 0 (0.0%) | 0 (0.0%) |
| 35 to 44 Years | 0 (0.0%) | 0 (0.0%) |
| 45 to 54 Years | 6 (6.6%) | 0 (0.0%) |
| 55 to 64 Years | 8 (7.1%) | 12 (9.5%) |
| 65 to 74 Years | 0 (0.0%) | 0 (0.0%) |
| 75 Years and over | 0 (0.0%) | 0 (0.0%) |
| Total | 14 (4.0%) | 12 (3.2%) |
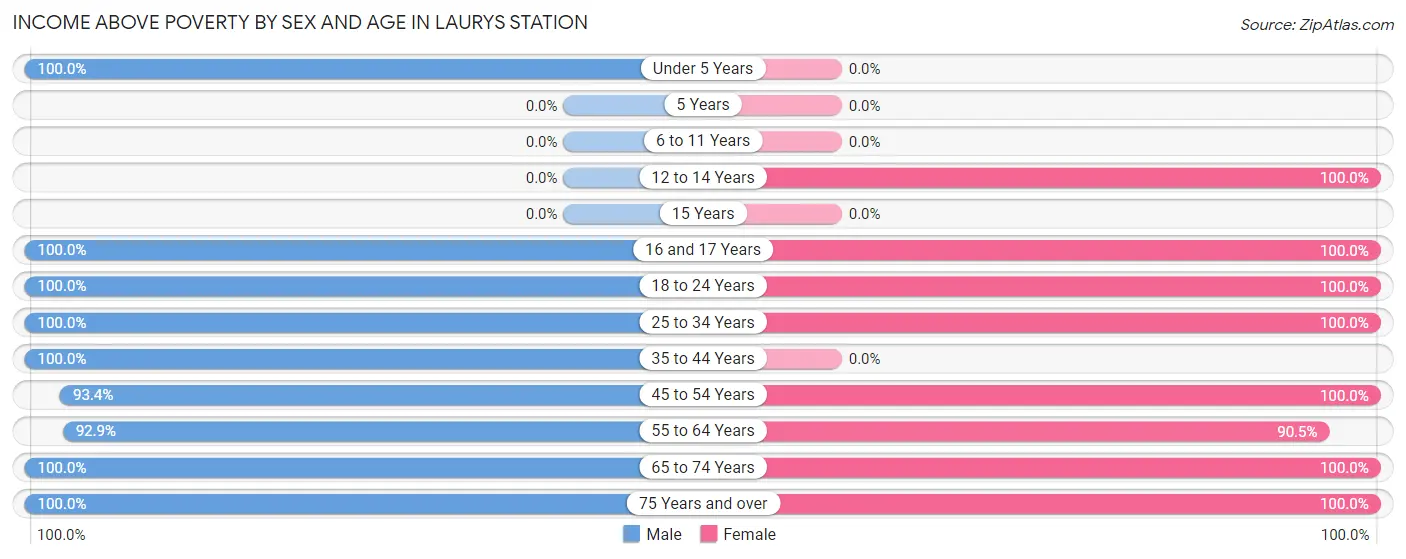
Income Above Poverty by Sex and Age in Laurys Station
According to the poverty statistics in Laurys Station, males aged under 5 years and females aged 12 to 14 years are the age groups that are most secure financially, with 100.0% of males and 100.0% of females in these age groups living above the poverty line.
| Age Bracket | Male | Female |
| Under 5 Years | 11 (100.0%) | 0 (0.0%) |
| 5 Years | 0 (0.0%) | 0 (0.0%) |
| 6 to 11 Years | 0 (0.0%) | 0 (0.0%) |
| 12 to 14 Years | 0 (0.0%) | 31 (100.0%) |
| 15 Years | 0 (0.0%) | 0 (0.0%) |
| 16 and 17 Years | 7 (100.0%) | 15 (100.0%) |
| 18 to 24 Years | 27 (100.0%) | 17 (100.0%) |
| 25 to 34 Years | 12 (100.0%) | 31 (100.0%) |
| 35 to 44 Years | 14 (100.0%) | 0 (0.0%) |
| 45 to 54 Years | 85 (93.4%) | 92 (100.0%) |
| 55 to 64 Years | 105 (92.9%) | 114 (90.5%) |
| 65 to 74 Years | 36 (100.0%) | 16 (100.0%) |
| 75 Years and over | 36 (100.0%) | 53 (100.0%) |
| Total | 333 (96.0%) | 369 (96.9%) |
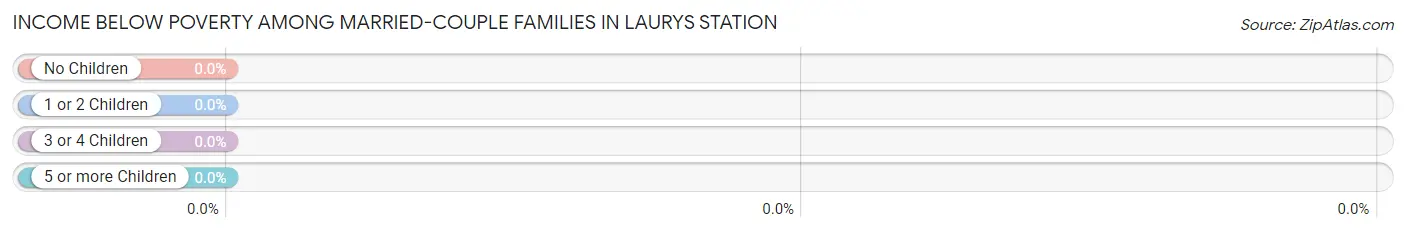
Income Below Poverty Among Married-Couple Families in Laurys Station
| Children | Above Poverty | Below Poverty |
| No Children | 205 (100.0%) | 0 (0.0%) |
| 1 or 2 Children | 46 (100.0%) | 0 (0.0%) |
| 3 or 4 Children | 0 (0.0%) | 0 (0.0%) |
| 5 or more Children | 0 (0.0%) | 0 (0.0%) |
| Total | 251 (100.0%) | 0 (0.0%) |
Income Below Poverty Among Single-Parent Households in Laurys Station
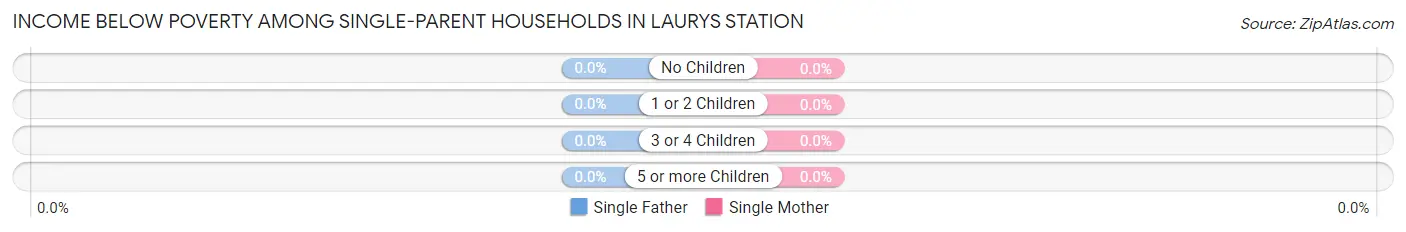
| Children | Single Father | Single Mother |
| No Children | 0 (0.0%) | 0 (0.0%) |
| 1 or 2 Children | 0 (0.0%) | 0 (0.0%) |
| 3 or 4 Children | 0 (0.0%) | 0 (0.0%) |
| 5 or more Children | 0 (0.0%) | 0 (0.0%) |
| Total | 0 (0.0%) | 0 (0.0%) |
Income Below Poverty Among Married-Couple vs Single-Parent Households in Laurys Station
| Children | Married-Couple Families | Single-Parent Households |
| No Children | 0 (0.0%) | 0 (0.0%) |
| 1 or 2 Children | 0 (0.0%) | 0 (0.0%) |
| 3 or 4 Children | 0 (0.0%) | 0 (0.0%) |
| 5 or more Children | 0 (0.0%) | 0 (0.0%) |
| Total | 0 (0.0%) | 0 (0.0%) |
Employment Characteristics in Laurys Station
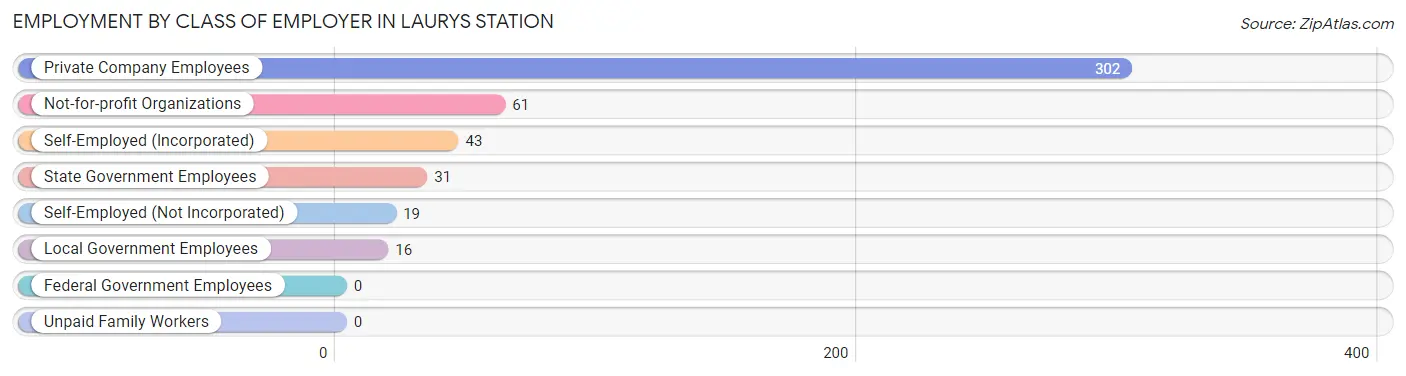
Employment by Class of Employer in Laurys Station
Among the 472 employed individuals in Laurys Station, private company employees (302 | 64.0%), not-for-profit organizations (61 | 12.9%), and self-employed (incorporated) (43 | 9.1%) make up the most common classes of employment.
| Employer Class | # Employees | % Employees |
| Private Company Employees | 302 | 64.0% |
| Self-Employed (Incorporated) | 43 | 9.1% |
| Self-Employed (Not Incorporated) | 19 | 4.0% |
| Not-for-profit Organizations | 61 | 12.9% |
| Local Government Employees | 16 | 3.4% |
| State Government Employees | 31 | 6.6% |
| Federal Government Employees | 0 | 0.0% |
| Unpaid Family Workers | 0 | 0.0% |
| Total | 472 | 100.0% |
Employment Status by Age in Laurys Station
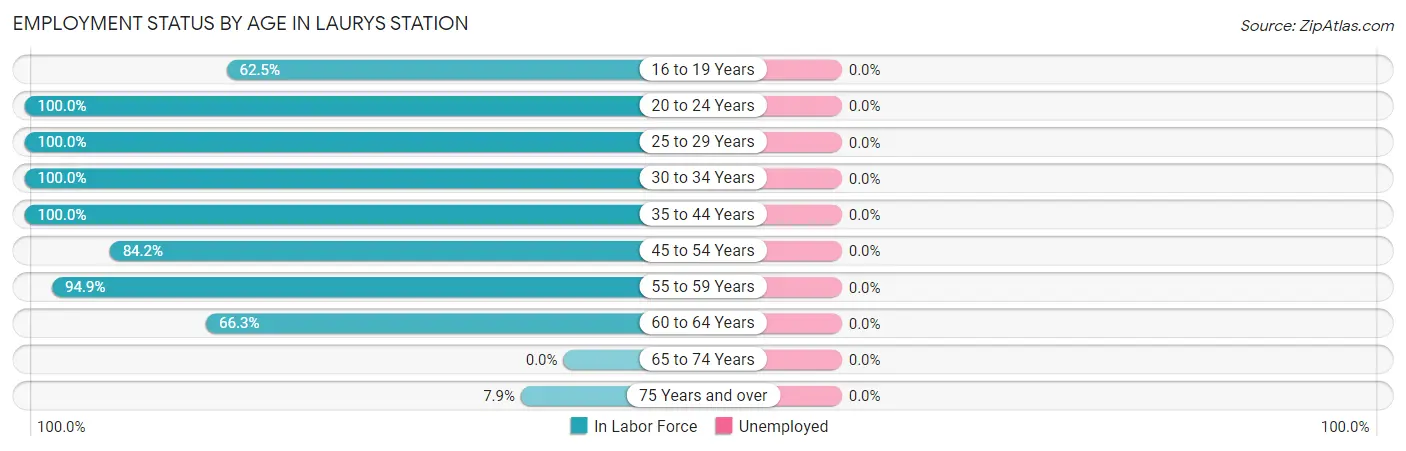
| Age Bracket | In Labor Force | Unemployed |
| 16 to 19 Years | 25 (62.5%) | 0 (0.0%) |
| 20 to 24 Years | 26 (100.0%) | 0 (0.0%) |
| 25 to 29 Years | 18 (100.0%) | 0 (0.0%) |
| 30 to 34 Years | 25 (100.0%) | 0 (0.0%) |
| 35 to 44 Years | 14 (100.0%) | 0 (0.0%) |
| 45 to 54 Years | 154 (84.2%) | 0 (0.0%) |
| 55 to 59 Years | 148 (94.9%) | 0 (0.0%) |
| 60 to 64 Years | 55 (66.3%) | 0 (0.0%) |
| 65 to 74 Years | 0 (0.0%) | 0 (0.0%) |
| 75 Years and over | 7 (7.9%) | 0 (0.0%) |
| Total | 472 (68.8%) | 0 (0.0%) |
Employment Status by Educational Attainment in Laurys Station
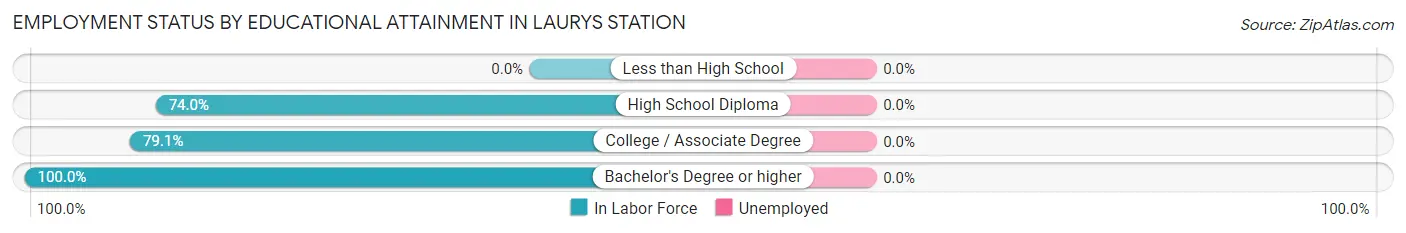
| Educational Attainment | In Labor Force | Unemployed |
| Less than High School | 0 (0.0%) | 0 (0.0%) |
| High School Diploma | 71 (74.0%) | 0 (0.0%) |
| College / Associate Degree | 129 (79.1%) | 0 (0.0%) |
| Bachelor's Degree or higher | 214 (100.0%) | 0 (0.0%) |
| Total | 414 (86.4%) | 0 (0.0%) |
Employment Occupations by Sex in Laurys Station
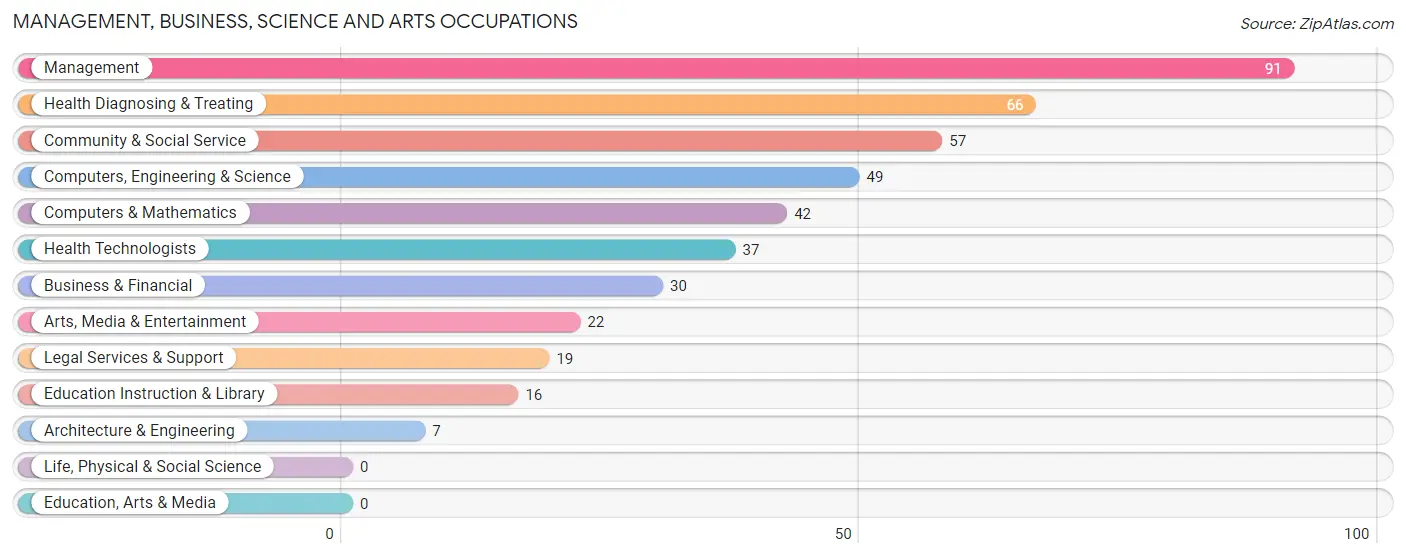
Management, Business, Science and Arts Occupations
The most common Management, Business, Science and Arts occupations in Laurys Station are Management (91 | 19.3%), Health Diagnosing & Treating (66 | 14.0%), Community & Social Service (57 | 12.1%), Computers, Engineering & Science (49 | 10.4%), and Computers & Mathematics (42 | 8.9%).
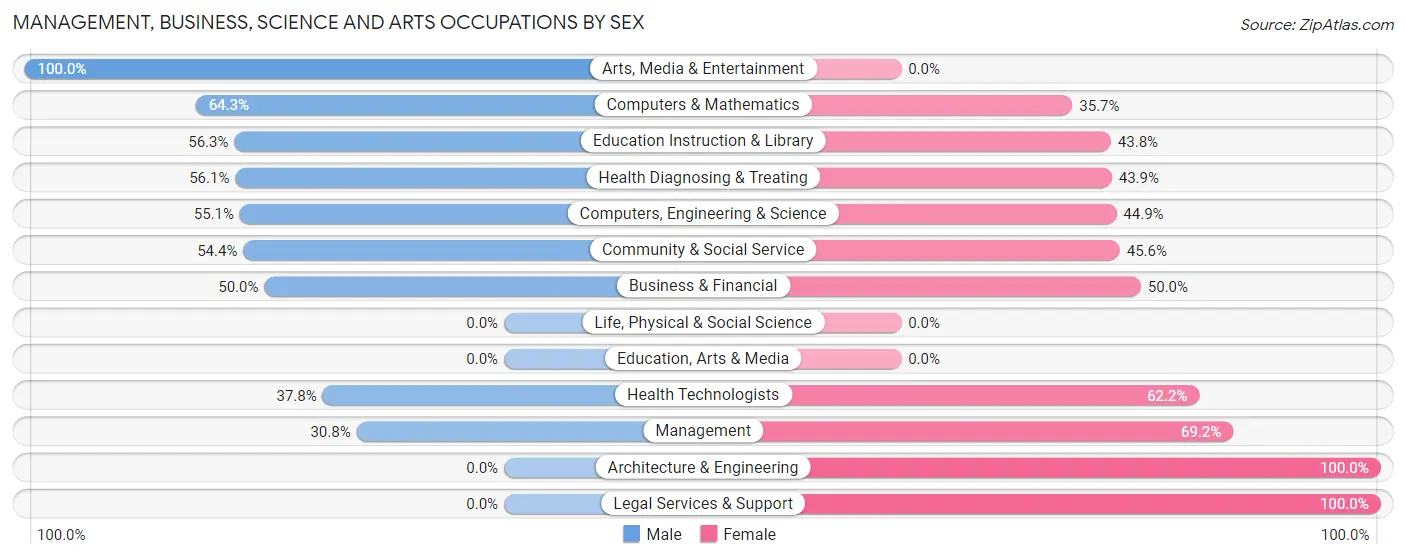
Management, Business, Science and Arts Occupations by Sex
Within the Management, Business, Science and Arts occupations in Laurys Station, the most male-oriented occupations are Arts, Media & Entertainment (100.0%), Computers & Mathematics (64.3%), and Education Instruction & Library (56.2%), while the most female-oriented occupations are Architecture & Engineering (100.0%), Legal Services & Support (100.0%), and Management (69.2%).
| Occupation | Male | Female |
| Management | 28 (30.8%) | 63 (69.2%) |
| Business & Financial | 15 (50.0%) | 15 (50.0%) |
| Computers, Engineering & Science | 27 (55.1%) | 22 (44.9%) |
| Computers & Mathematics | 27 (64.3%) | 15 (35.7%) |
| Architecture & Engineering | 0 (0.0%) | 7 (100.0%) |
| Life, Physical & Social Science | 0 (0.0%) | 0 (0.0%) |
| Community & Social Service | 31 (54.4%) | 26 (45.6%) |
| Education, Arts & Media | 0 (0.0%) | 0 (0.0%) |
| Legal Services & Support | 0 (0.0%) | 19 (100.0%) |
| Education Instruction & Library | 9 (56.2%) | 7 (43.8%) |
| Arts, Media & Entertainment | 22 (100.0%) | 0 (0.0%) |
| Health Diagnosing & Treating | 37 (56.1%) | 29 (43.9%) |
| Health Technologists | 14 (37.8%) | 23 (62.2%) |
| Total (Category) | 138 (47.1%) | 155 (52.9%) |
| Total (Overall) | 240 (50.8%) | 232 (49.1%) |
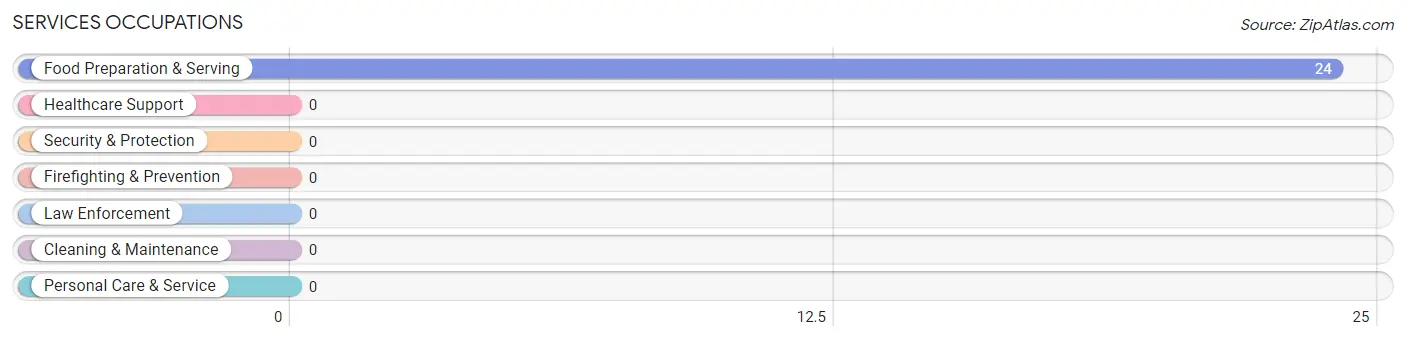
Services Occupations
The most common Services occupations in Laurys Station are , and Food Preparation & Serving (24 | 5.1%).
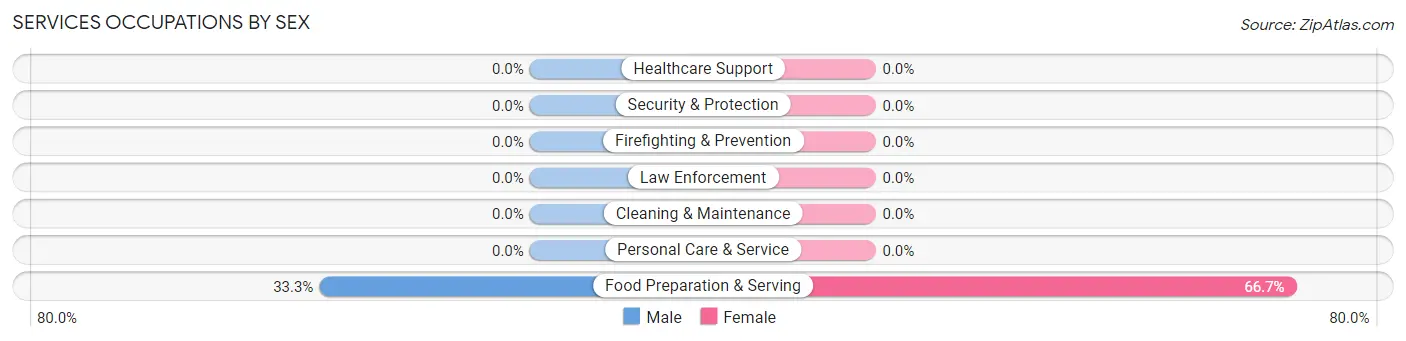
Services Occupations by Sex
| Occupation | Male | Female |
| Healthcare Support | 0 (0.0%) | 0 (0.0%) |
| Security & Protection | 0 (0.0%) | 0 (0.0%) |
| Firefighting & Prevention | 0 (0.0%) | 0 (0.0%) |
| Law Enforcement | 0 (0.0%) | 0 (0.0%) |
| Food Preparation & Serving | 8 (33.3%) | 16 (66.7%) |
| Cleaning & Maintenance | 0 (0.0%) | 0 (0.0%) |
| Personal Care & Service | 0 (0.0%) | 0 (0.0%) |
| Total (Category) | 8 (33.3%) | 16 (66.7%) |
| Total (Overall) | 240 (50.8%) | 232 (49.1%) |
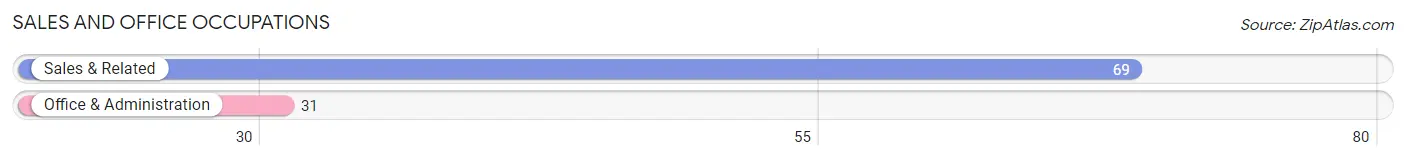
Sales and Office Occupations
The most common Sales and Office occupations in Laurys Station are Sales & Related (69 | 14.6%), and Office & Administration (31 | 6.6%).
Sales and Office Occupations by Sex

| Occupation | Male | Female |
| Sales & Related | 48 (69.6%) | 21 (30.4%) |
| Office & Administration | 8 (25.8%) | 23 (74.2%) |
| Total (Category) | 56 (56.0%) | 44 (44.0%) |
| Total (Overall) | 240 (50.8%) | 232 (49.1%) |
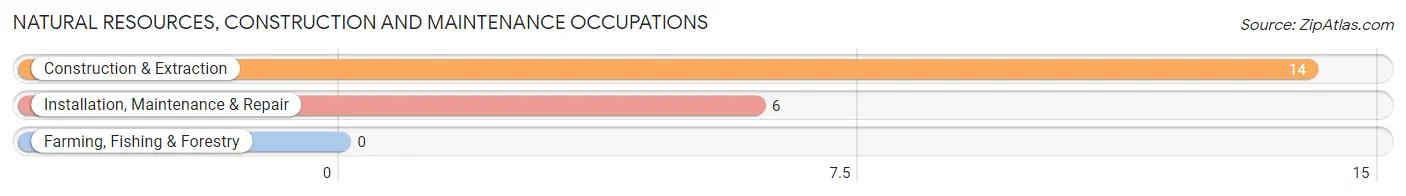
Natural Resources, Construction and Maintenance Occupations
The most common Natural Resources, Construction and Maintenance occupations in Laurys Station are Construction & Extraction (14 | 3.0%), and Installation, Maintenance & Repair (6 | 1.3%).
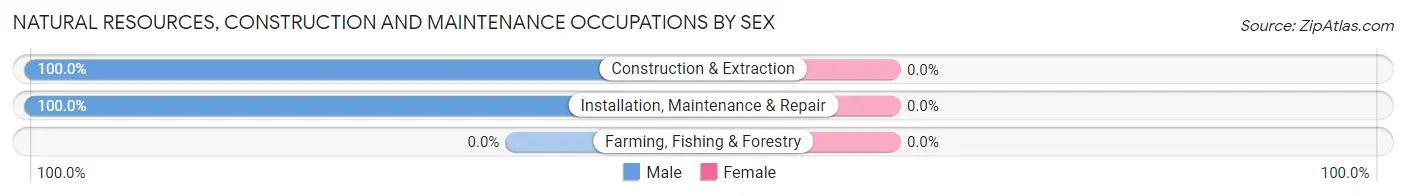
Natural Resources, Construction and Maintenance Occupations by Sex
| Occupation | Male | Female |
| Farming, Fishing & Forestry | 0 (0.0%) | 0 (0.0%) |
| Construction & Extraction | 14 (100.0%) | 0 (0.0%) |
| Installation, Maintenance & Repair | 6 (100.0%) | 0 (0.0%) |
| Total (Category) | 20 (100.0%) | 0 (0.0%) |
| Total (Overall) | 240 (50.8%) | 232 (49.1%) |
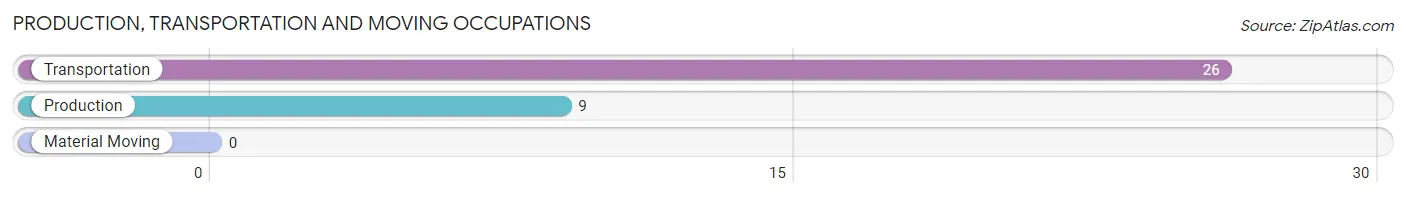
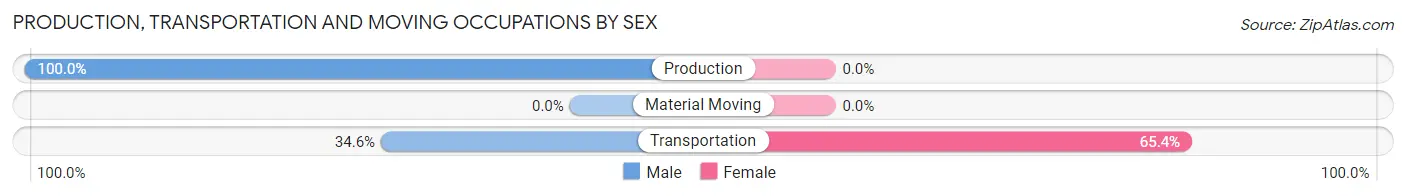
Production, Transportation and Moving Occupations
The most common Production, Transportation and Moving occupations in Laurys Station are Transportation (26 | 5.5%), and Production (9 | 1.9%).
Production, Transportation and Moving Occupations by Sex
| Occupation | Male | Female |
| Production | 9 (100.0%) | 0 (0.0%) |
| Transportation | 9 (34.6%) | 17 (65.4%) |
| Material Moving | 0 (0.0%) | 0 (0.0%) |
| Total (Category) | 18 (51.4%) | 17 (48.6%) |
| Total (Overall) | 240 (50.8%) | 232 (49.1%) |
Employment Industries by Sex in Laurys Station
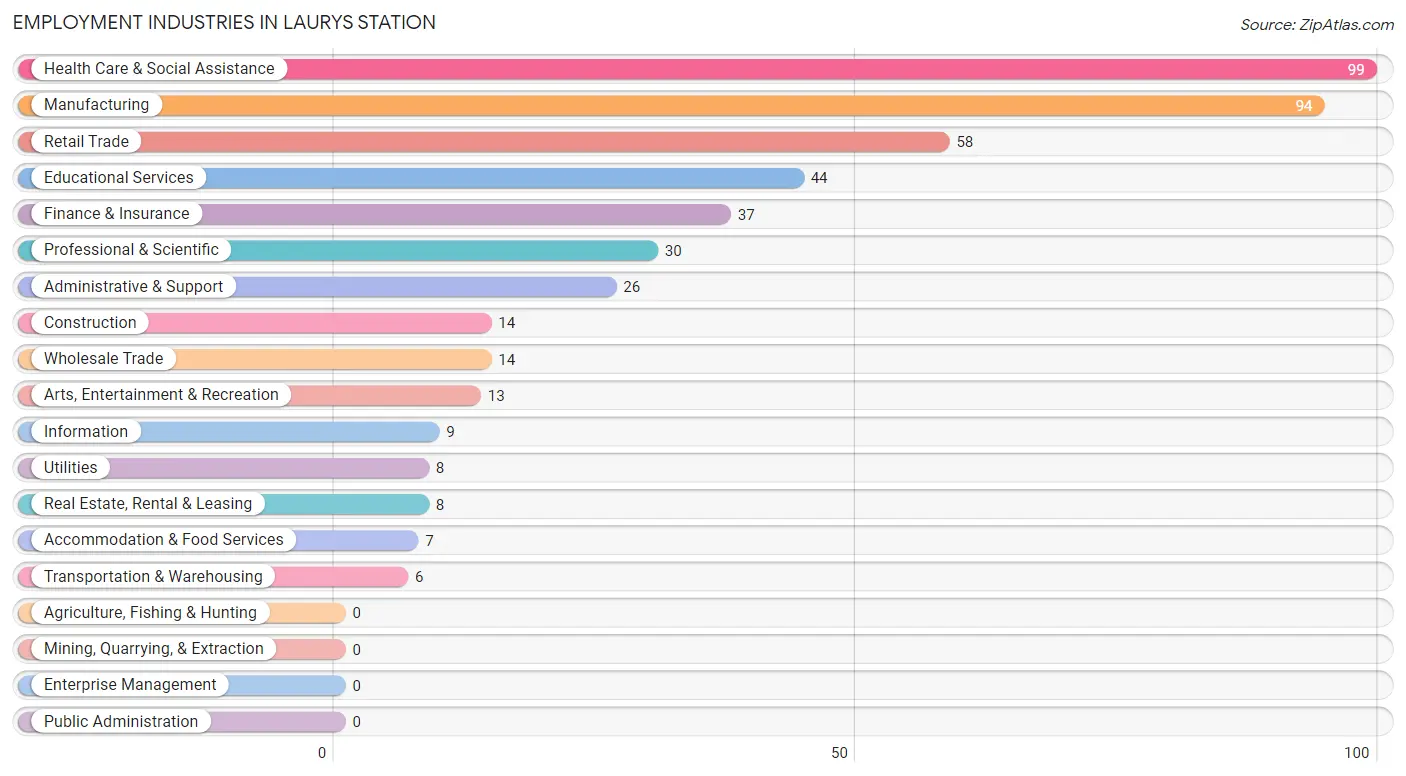
Employment Industries in Laurys Station
The major employment industries in Laurys Station include Health Care & Social Assistance (99 | 21.0%), Manufacturing (94 | 19.9%), Retail Trade (58 | 12.3%), Educational Services (44 | 9.3%), and Finance & Insurance (37 | 7.8%).
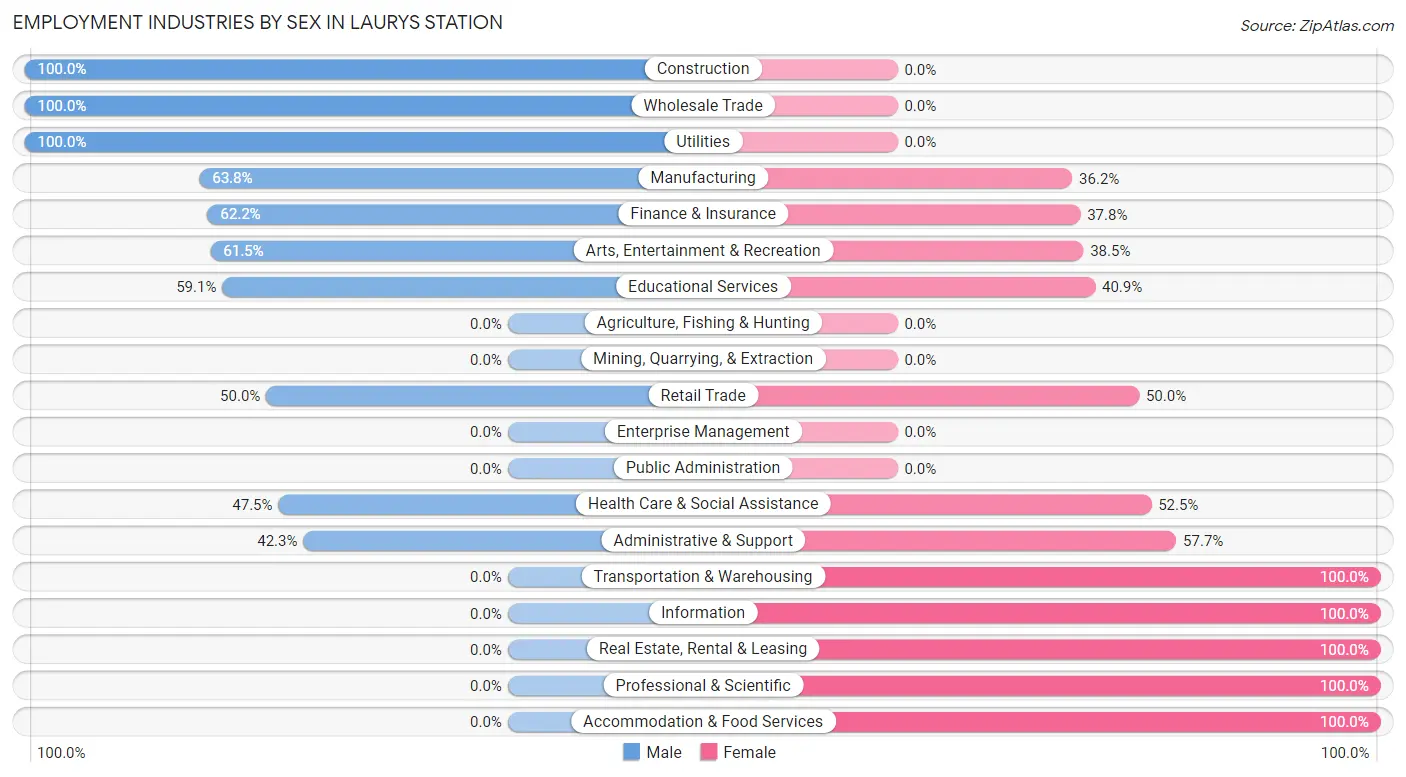
Employment Industries by Sex in Laurys Station
The Laurys Station industries that see more men than women are Construction (100.0%), Wholesale Trade (100.0%), and Utilities (100.0%), whereas the industries that tend to have a higher number of women are Transportation & Warehousing (100.0%), Information (100.0%), and Real Estate, Rental & Leasing (100.0%).
| Industry | Male | Female |
| Agriculture, Fishing & Hunting | 0 (0.0%) | 0 (0.0%) |
| Mining, Quarrying, & Extraction | 0 (0.0%) | 0 (0.0%) |
| Construction | 14 (100.0%) | 0 (0.0%) |
| Manufacturing | 60 (63.8%) | 34 (36.2%) |
| Wholesale Trade | 14 (100.0%) | 0 (0.0%) |
| Retail Trade | 29 (50.0%) | 29 (50.0%) |
| Transportation & Warehousing | 0 (0.0%) | 6 (100.0%) |
| Utilities | 8 (100.0%) | 0 (0.0%) |
| Information | 0 (0.0%) | 9 (100.0%) |
| Finance & Insurance | 23 (62.2%) | 14 (37.8%) |
| Real Estate, Rental & Leasing | 0 (0.0%) | 8 (100.0%) |
| Professional & Scientific | 0 (0.0%) | 30 (100.0%) |
| Enterprise Management | 0 (0.0%) | 0 (0.0%) |
| Administrative & Support | 11 (42.3%) | 15 (57.7%) |
| Educational Services | 26 (59.1%) | 18 (40.9%) |
| Health Care & Social Assistance | 47 (47.5%) | 52 (52.5%) |
| Arts, Entertainment & Recreation | 8 (61.5%) | 5 (38.5%) |
| Accommodation & Food Services | 0 (0.0%) | 7 (100.0%) |
| Public Administration | 0 (0.0%) | 0 (0.0%) |
| Total | 240 (50.8%) | 232 (49.1%) |
Education in Laurys Station
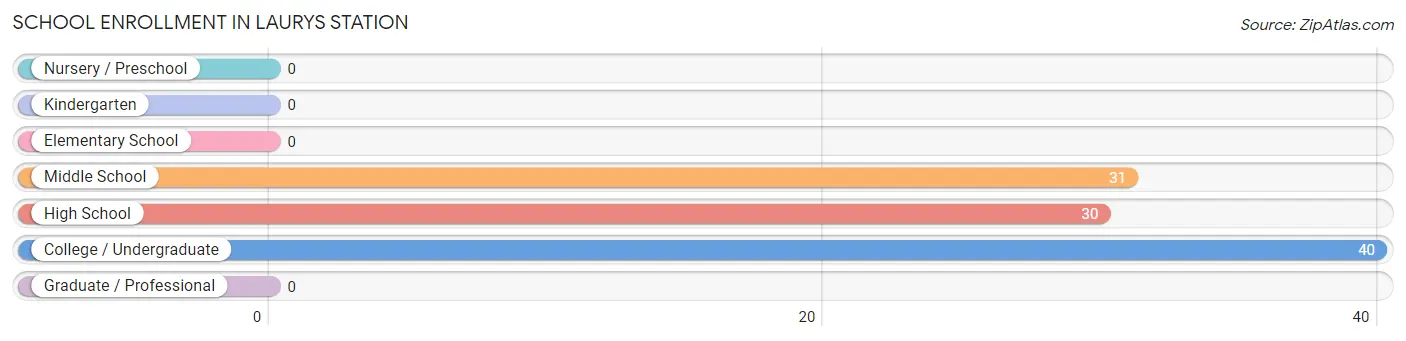
School Enrollment in Laurys Station
The most common levels of schooling among the 101 students in Laurys Station are college / undergraduate (40 | 39.6%), middle school (31 | 30.7%), and high school (30 | 29.7%).
| School Level | # Students | % Students |
| Nursery / Preschool | 0 | 0.0% |
| Kindergarten | 0 | 0.0% |
| Elementary School | 0 | 0.0% |
| Middle School | 31 | 30.7% |
| High School | 30 | 29.7% |
| College / Undergraduate | 40 | 39.6% |
| Graduate / Professional | 0 | 0.0% |
| Total | 101 | 100.0% |
School Enrollment by Age by Funding Source in Laurys Station
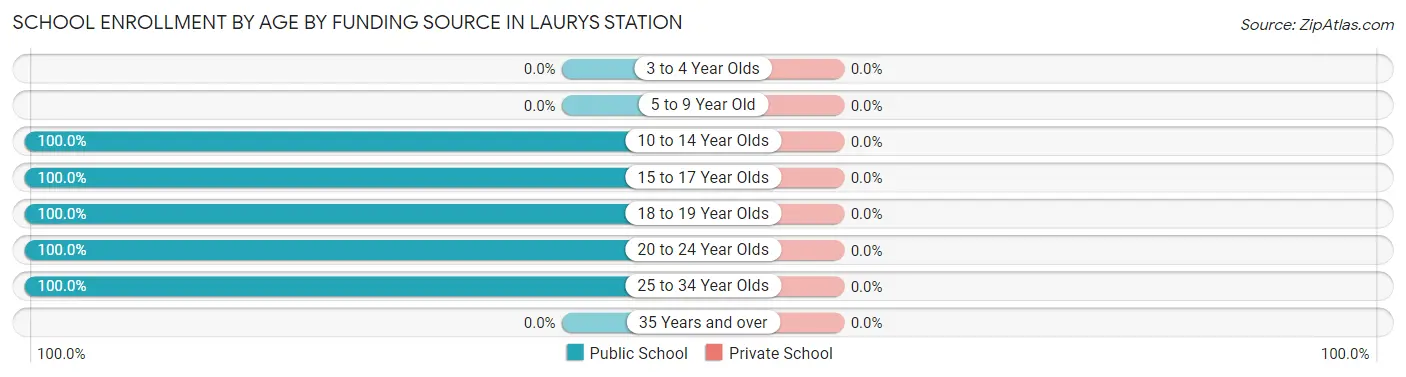
| Age Bracket | Public School | Private School |
| 3 to 4 Year Olds | 0 (0.0%) | 0 (0.0%) |
| 5 to 9 Year Old | 0 (0.0%) | 0 (0.0%) |
| 10 to 14 Year Olds | 31 (100.0%) | 0 (0.0%) |
| 15 to 17 Year Olds | 22 (100.0%) | 0 (0.0%) |
| 18 to 19 Year Olds | 18 (100.0%) | 0 (0.0%) |
| 20 to 24 Year Olds | 17 (100.0%) | 0 (0.0%) |
| 25 to 34 Year Olds | 13 (100.0%) | 0 (0.0%) |
| 35 Years and over | 0 (0.0%) | 0 (0.0%) |
| Total | 101 (100.0%) | 0 (0.0%) |
Educational Attainment by Field of Study in Laurys Station
Education (71 | 29.5%), business (50 | 20.7%), science & technology (31 | 12.9%), bio, nature & agricultural (22 | 9.1%), and physical & health sciences (16 | 6.6%) are the most common fields of study among 241 individuals in Laurys Station who have obtained a bachelor's degree or higher.
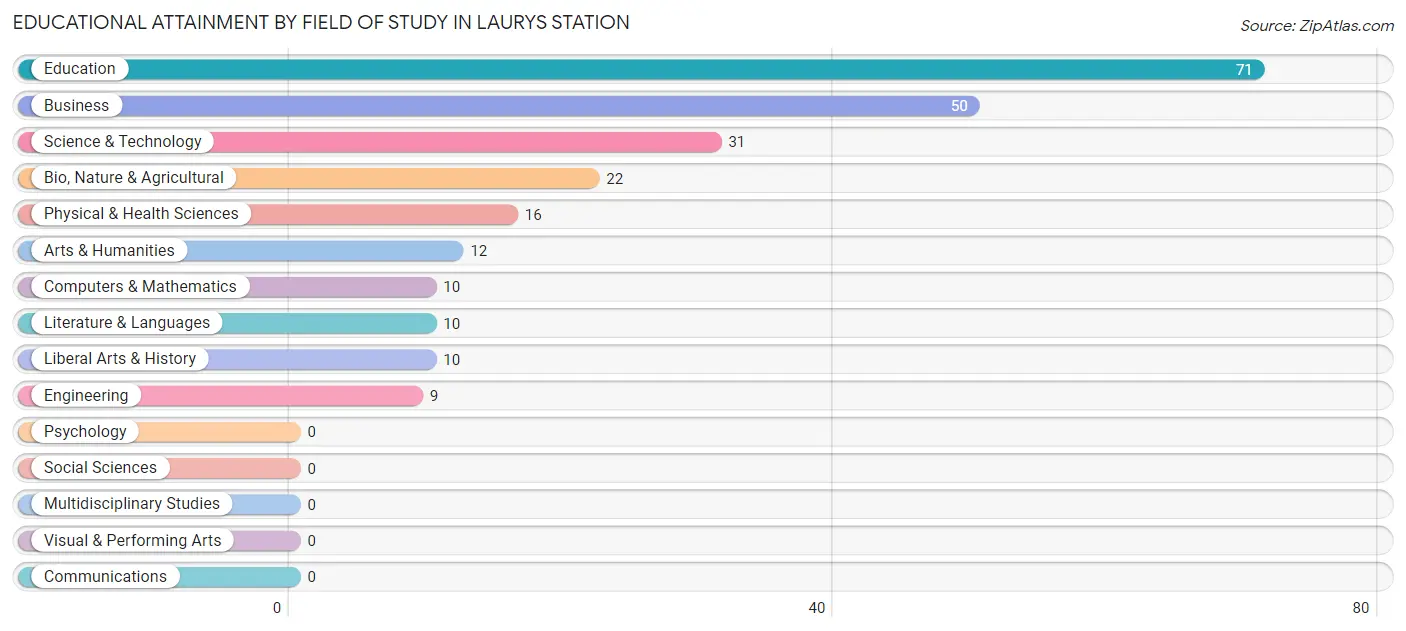
| Field of Study | # Graduates | % Graduates |
| Computers & Mathematics | 10 | 4.2% |
| Bio, Nature & Agricultural | 22 | 9.1% |
| Physical & Health Sciences | 16 | 6.6% |
| Psychology | 0 | 0.0% |
| Social Sciences | 0 | 0.0% |
| Engineering | 9 | 3.7% |
| Multidisciplinary Studies | 0 | 0.0% |
| Science & Technology | 31 | 12.9% |
| Business | 50 | 20.7% |
| Education | 71 | 29.5% |
| Literature & Languages | 10 | 4.2% |
| Liberal Arts & History | 10 | 4.2% |
| Visual & Performing Arts | 0 | 0.0% |
| Communications | 0 | 0.0% |
| Arts & Humanities | 12 | 5.0% |
| Total | 241 | 100.0% |
Transportation & Commute in Laurys Station
Vehicle Availability by Sex in Laurys Station
The most prevalent vehicle ownership categories in Laurys Station are males with 3 vehicles (91, accounting for 37.9%) and females with 3 vehicles (76, making up 39.2%).
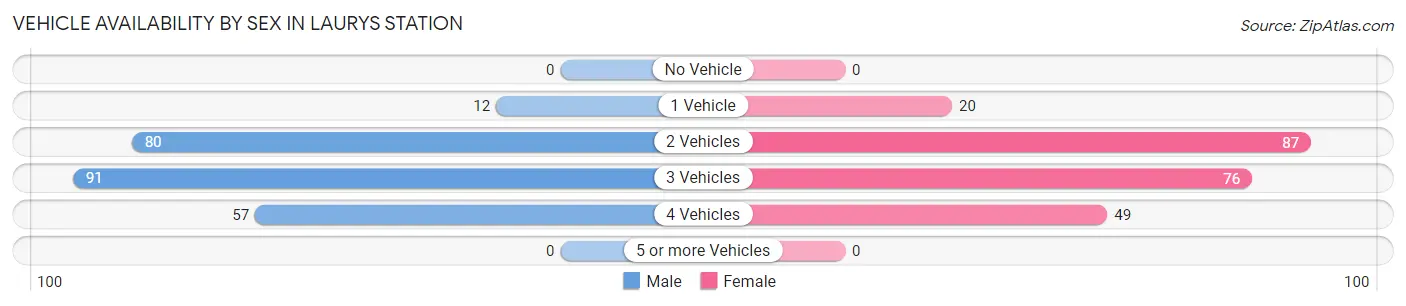
| Vehicles Available | Male | Female |
| No Vehicle | 0 (0.0%) | 0 (0.0%) |
| 1 Vehicle | 12 (5.0%) | 20 (8.6%) |
| 2 Vehicles | 80 (33.3%) | 87 (37.5%) |
| 3 Vehicles | 91 (37.9%) | 76 (32.8%) |
| 4 Vehicles | 57 (23.7%) | 49 (21.1%) |
| 5 or more Vehicles | 0 (0.0%) | 0 (0.0%) |
| Total | 240 (100.0%) | 232 (100.0%) |
Commute Time in Laurys Station
The most frequently occuring commute durations in Laurys Station are 30 to 34 minutes (90 commuters, 20.2%), 25 to 29 minutes (78 commuters, 17.5%), and 20 to 24 minutes (60 commuters, 13.5%).
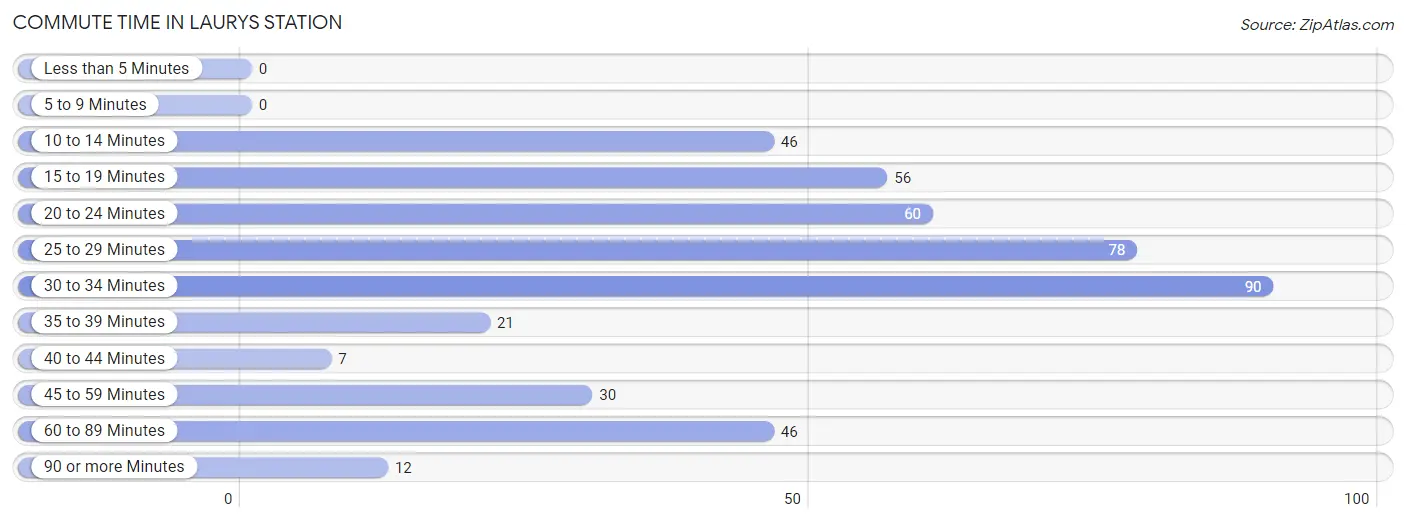
| Commute Time | # Commuters | % Commuters |
| Less than 5 Minutes | 0 | 0.0% |
| 5 to 9 Minutes | 0 | 0.0% |
| 10 to 14 Minutes | 46 | 10.3% |
| 15 to 19 Minutes | 56 | 12.6% |
| 20 to 24 Minutes | 60 | 13.5% |
| 25 to 29 Minutes | 78 | 17.5% |
| 30 to 34 Minutes | 90 | 20.2% |
| 35 to 39 Minutes | 21 | 4.7% |
| 40 to 44 Minutes | 7 | 1.6% |
| 45 to 59 Minutes | 30 | 6.7% |
| 60 to 89 Minutes | 46 | 10.3% |
| 90 or more Minutes | 12 | 2.7% |
Commute Time by Sex in Laurys Station
The most common commute times in Laurys Station are 25 to 29 minutes (49 commuters, 21.9%) for males and 30 to 34 minutes (42 commuters, 18.9%) for females.
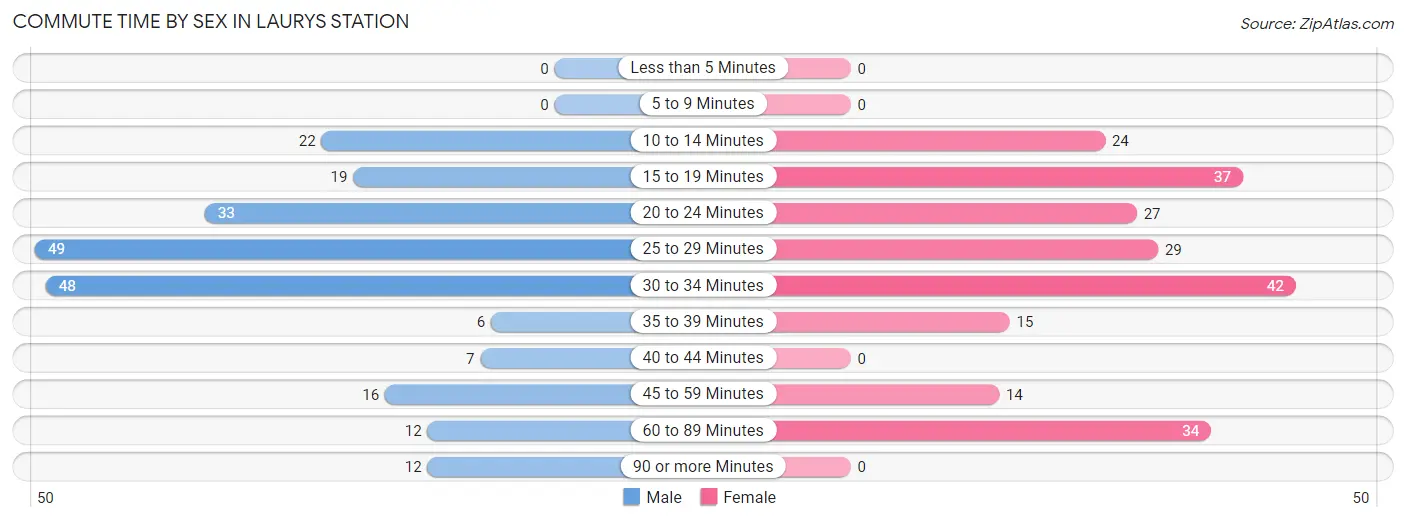
| Commute Time | Male | Female |
| Less than 5 Minutes | 0 (0.0%) | 0 (0.0%) |
| 5 to 9 Minutes | 0 (0.0%) | 0 (0.0%) |
| 10 to 14 Minutes | 22 (9.8%) | 24 (10.8%) |
| 15 to 19 Minutes | 19 (8.5%) | 37 (16.7%) |
| 20 to 24 Minutes | 33 (14.7%) | 27 (12.2%) |
| 25 to 29 Minutes | 49 (21.9%) | 29 (13.1%) |
| 30 to 34 Minutes | 48 (21.4%) | 42 (18.9%) |
| 35 to 39 Minutes | 6 (2.7%) | 15 (6.8%) |
| 40 to 44 Minutes | 7 (3.1%) | 0 (0.0%) |
| 45 to 59 Minutes | 16 (7.1%) | 14 (6.3%) |
| 60 to 89 Minutes | 12 (5.4%) | 34 (15.3%) |
| 90 or more Minutes | 12 (5.4%) | 0 (0.0%) |
Time of Departure to Work by Sex in Laurys Station
The most frequent times of departure to work in Laurys Station are 8:00 AM to 8:29 AM (83, 37.0%) for males and 9:00 AM to 9:59 AM (61, 27.5%) for females.
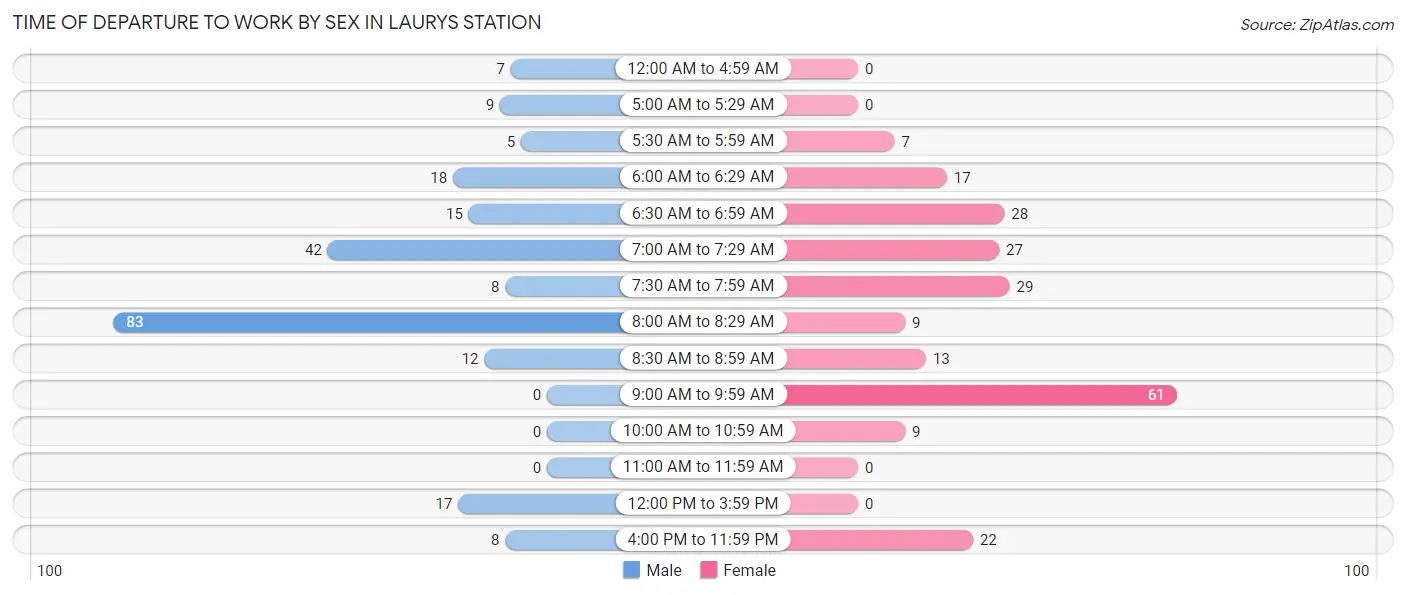
| Time of Departure | Male | Female |
| 12:00 AM to 4:59 AM | 7 (3.1%) | 0 (0.0%) |
| 5:00 AM to 5:29 AM | 9 (4.0%) | 0 (0.0%) |
| 5:30 AM to 5:59 AM | 5 (2.2%) | 7 (3.2%) |
| 6:00 AM to 6:29 AM | 18 (8.0%) | 17 (7.7%) |
| 6:30 AM to 6:59 AM | 15 (6.7%) | 28 (12.6%) |
| 7:00 AM to 7:29 AM | 42 (18.8%) | 27 (12.2%) |
| 7:30 AM to 7:59 AM | 8 (3.6%) | 29 (13.1%) |
| 8:00 AM to 8:29 AM | 83 (37.0%) | 9 (4.1%) |
| 8:30 AM to 8:59 AM | 12 (5.4%) | 13 (5.9%) |
| 9:00 AM to 9:59 AM | 0 (0.0%) | 61 (27.5%) |
| 10:00 AM to 10:59 AM | 0 (0.0%) | 9 (4.1%) |
| 11:00 AM to 11:59 AM | 0 (0.0%) | 0 (0.0%) |
| 12:00 PM to 3:59 PM | 17 (7.6%) | 0 (0.0%) |
| 4:00 PM to 11:59 PM | 8 (3.6%) | 22 (9.9%) |
| Total | 224 (100.0%) | 222 (100.0%) |
Housing Occupancy in Laurys Station
Occupancy by Ownership in Laurys Station
Of the total 331 dwellings in Laurys Station, owner-occupied units account for 298 (90.0%), while renter-occupied units make up 33 (10.0%).
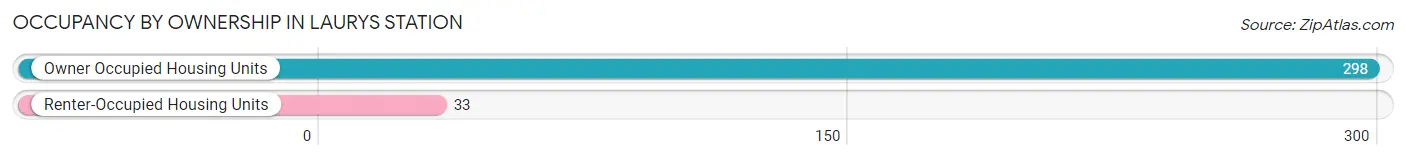
| Occupancy | # Housing Units | % Housing Units |
| Owner Occupied Housing Units | 298 | 90.0% |
| Renter-Occupied Housing Units | 33 | 10.0% |
| Total Occupied Housing Units | 331 | 100.0% |
Occupancy by Household Size in Laurys Station
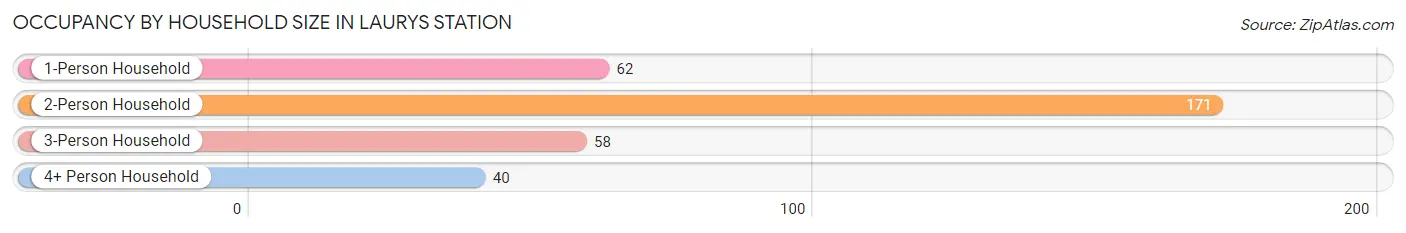
| Household Size | # Housing Units | % Housing Units |
| 1-Person Household | 62 | 18.7% |
| 2-Person Household | 171 | 51.7% |
| 3-Person Household | 58 | 17.5% |
| 4+ Person Household | 40 | 12.1% |
| Total Housing Units | 331 | 100.0% |
Occupancy by Ownership by Household Size in Laurys Station
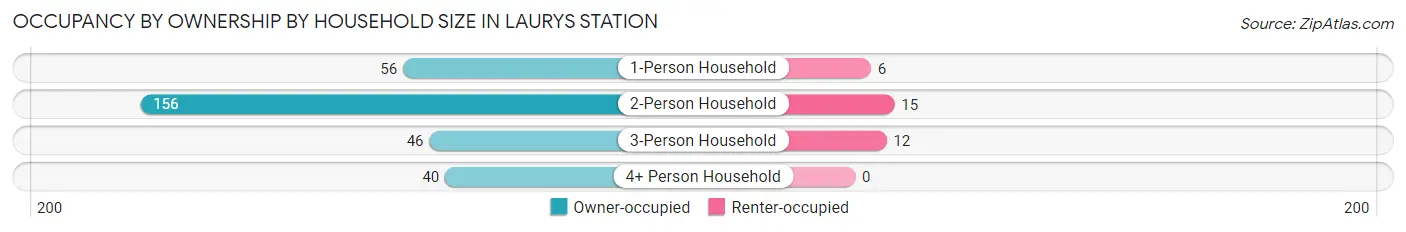
| Household Size | Owner-occupied | Renter-occupied |
| 1-Person Household | 56 (90.3%) | 6 (9.7%) |
| 2-Person Household | 156 (91.2%) | 15 (8.8%) |
| 3-Person Household | 46 (79.3%) | 12 (20.7%) |
| 4+ Person Household | 40 (100.0%) | 0 (0.0%) |
| Total Housing Units | 298 (90.0%) | 33 (10.0%) |
Occupancy by Educational Attainment in Laurys Station
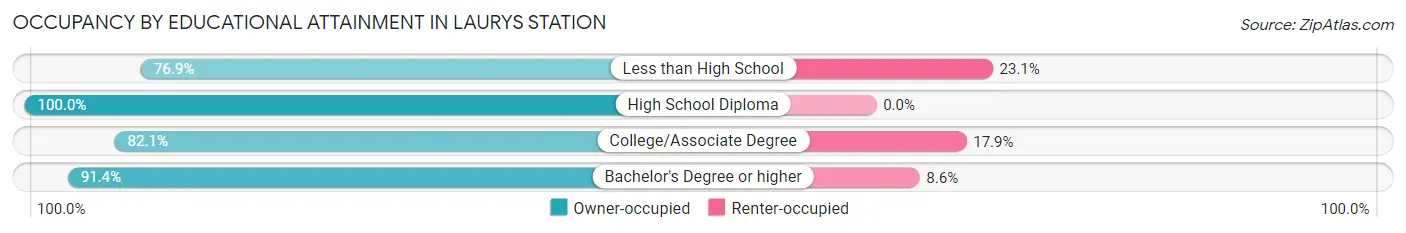
| Household Size | Owner-occupied | Renter-occupied |
| Less than High School | 20 (76.9%) | 6 (23.1%) |
| High School Diploma | 81 (100.0%) | 0 (0.0%) |
| College/Associate Degree | 69 (82.1%) | 15 (17.9%) |
| Bachelor's Degree or higher | 128 (91.4%) | 12 (8.6%) |
Occupancy by Age of Householder in Laurys Station
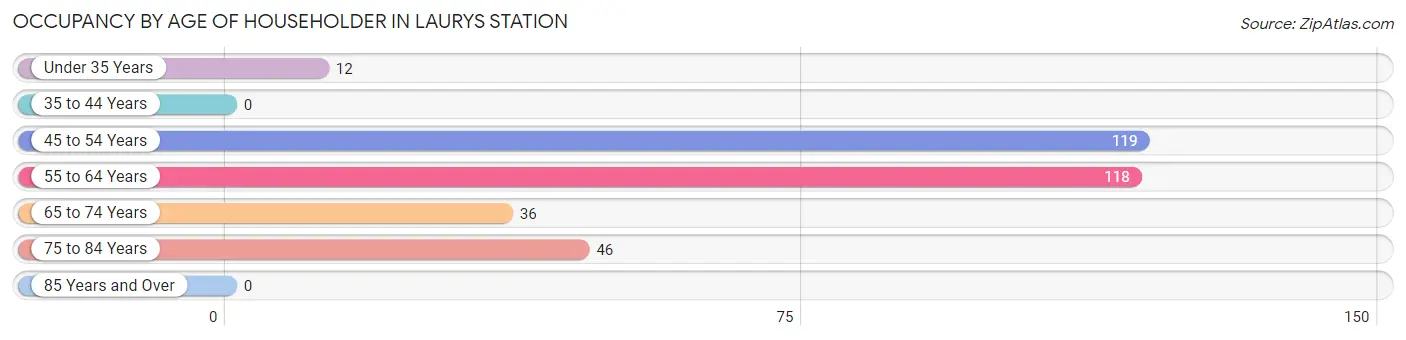
| Age Bracket | # Households | % Households |
| Under 35 Years | 12 | 3.6% |
| 35 to 44 Years | 0 | 0.0% |
| 45 to 54 Years | 119 | 35.9% |
| 55 to 64 Years | 118 | 35.6% |
| 65 to 74 Years | 36 | 10.9% |
| 75 to 84 Years | 46 | 13.9% |
| 85 Years and Over | 0 | 0.0% |
| Total | 331 | 100.0% |
Housing Finances in Laurys Station
Median Income by Occupancy in Laurys Station
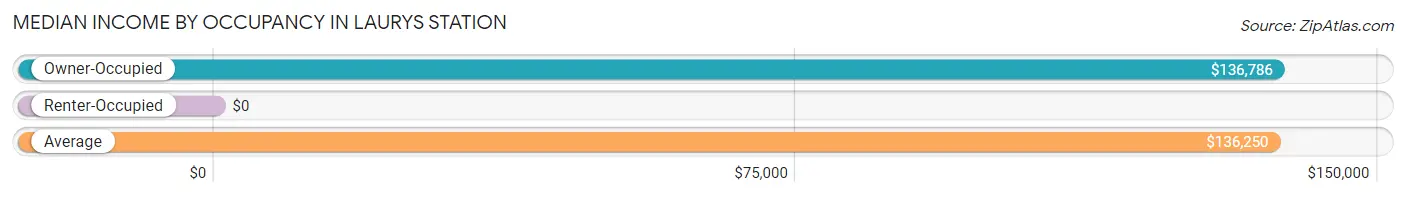
| Occupancy Type | # Households | Median Income |
| Owner-Occupied | 298 (90.0%) | $136,786 |
| Renter-Occupied | 33 (10.0%) | $0 |
| Average | 331 (100.0%) | $136,250 |
Occupancy by Householder Income Bracket in Laurys Station
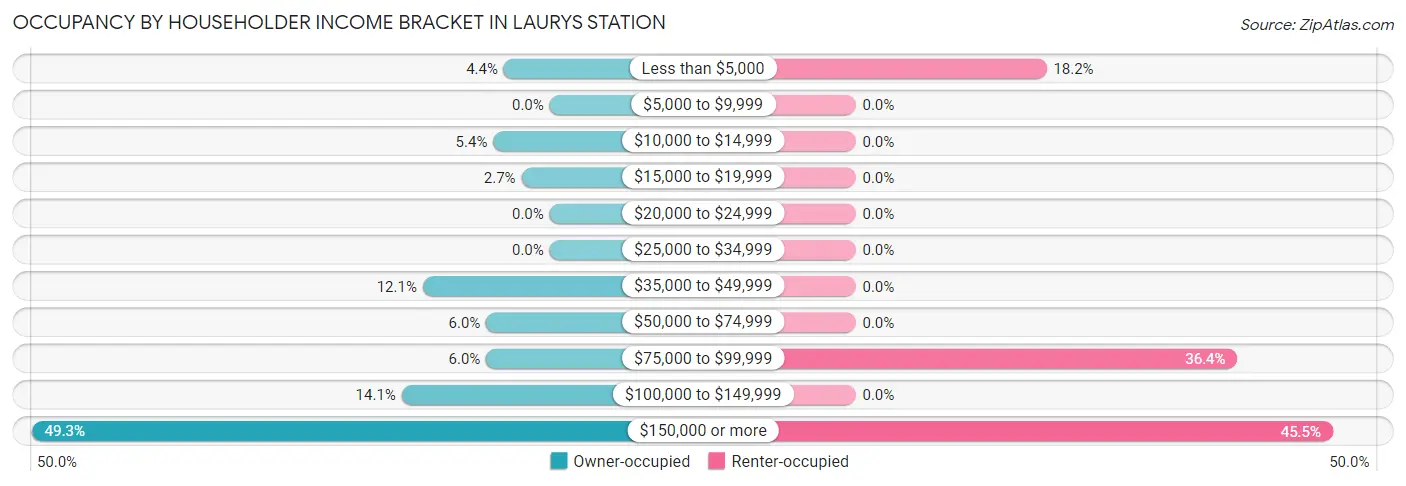
| Income Bracket | Owner-occupied | Renter-occupied |
| Less than $5,000 | 13 (4.4%) | 6 (18.2%) |
| $5,000 to $9,999 | 0 (0.0%) | 0 (0.0%) |
| $10,000 to $14,999 | 16 (5.4%) | 0 (0.0%) |
| $15,000 to $19,999 | 8 (2.7%) | 0 (0.0%) |
| $20,000 to $24,999 | 0 (0.0%) | 0 (0.0%) |
| $25,000 to $34,999 | 0 (0.0%) | 0 (0.0%) |
| $35,000 to $49,999 | 36 (12.1%) | 0 (0.0%) |
| $50,000 to $74,999 | 18 (6.0%) | 0 (0.0%) |
| $75,000 to $99,999 | 18 (6.0%) | 12 (36.4%) |
| $100,000 to $149,999 | 42 (14.1%) | 0 (0.0%) |
| $150,000 or more | 147 (49.3%) | 15 (45.5%) |
| Total | 298 (100.0%) | 33 (100.0%) |
Monthly Housing Cost Tiers in Laurys Station
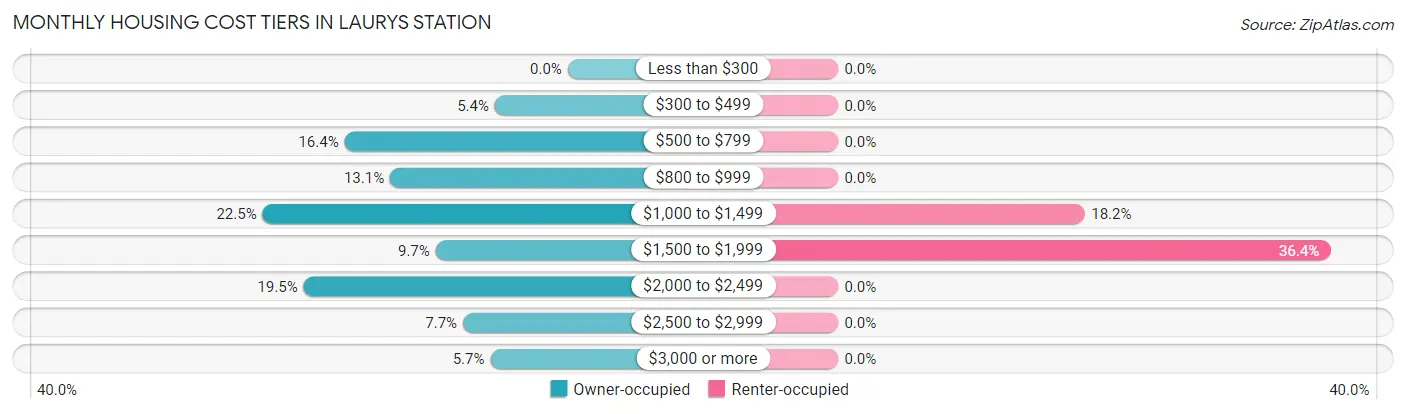
| Monthly Cost | Owner-occupied | Renter-occupied |
| Less than $300 | 0 (0.0%) | 0 (0.0%) |
| $300 to $499 | 16 (5.4%) | 0 (0.0%) |
| $500 to $799 | 49 (16.4%) | 0 (0.0%) |
| $800 to $999 | 39 (13.1%) | 0 (0.0%) |
| $1,000 to $1,499 | 67 (22.5%) | 6 (18.2%) |
| $1,500 to $1,999 | 29 (9.7%) | 12 (36.4%) |
| $2,000 to $2,499 | 58 (19.5%) | 0 (0.0%) |
| $2,500 to $2,999 | 23 (7.7%) | 0 (0.0%) |
| $3,000 or more | 17 (5.7%) | 0 (0.0%) |
| Total | 298 (100.0%) | 33 (100.0%) |
Physical Housing Characteristics in Laurys Station
Housing Structures in Laurys Station
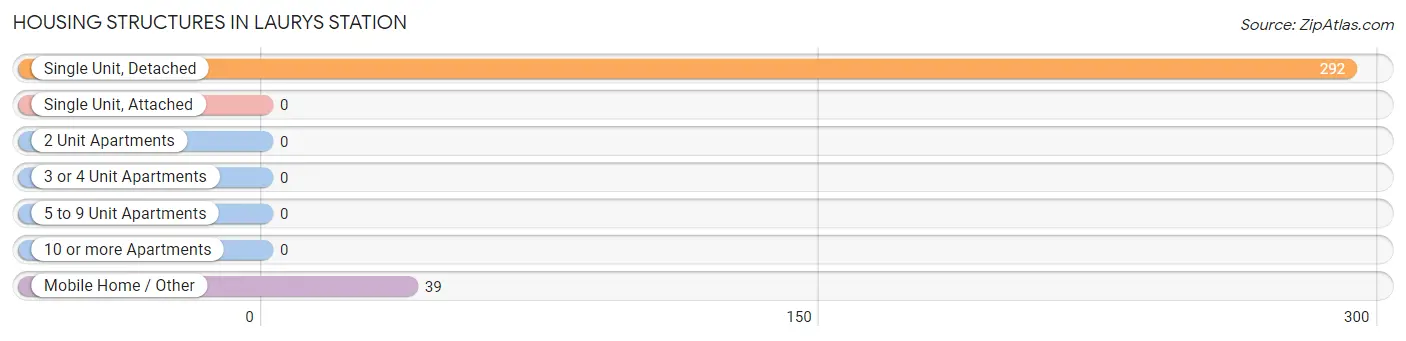
| Structure Type | # Housing Units | % Housing Units |
| Single Unit, Detached | 292 | 88.2% |
| Single Unit, Attached | 0 | 0.0% |
| 2 Unit Apartments | 0 | 0.0% |
| 3 or 4 Unit Apartments | 0 | 0.0% |
| 5 to 9 Unit Apartments | 0 | 0.0% |
| 10 or more Apartments | 0 | 0.0% |
| Mobile Home / Other | 39 | 11.8% |
| Total | 331 | 100.0% |
Housing Structures by Occupancy in Laurys Station
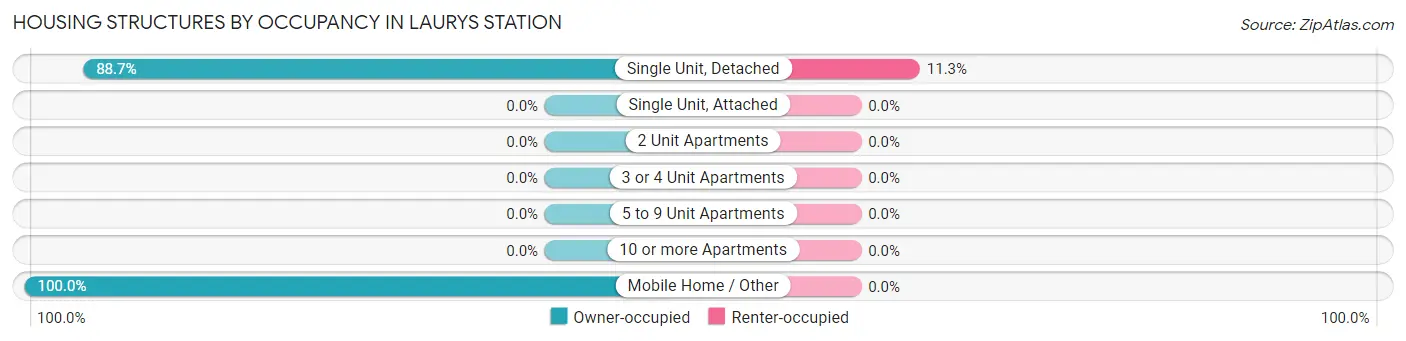
| Structure Type | Owner-occupied | Renter-occupied |
| Single Unit, Detached | 259 (88.7%) | 33 (11.3%) |
| Single Unit, Attached | 0 (0.0%) | 0 (0.0%) |
| 2 Unit Apartments | 0 (0.0%) | 0 (0.0%) |
| 3 or 4 Unit Apartments | 0 (0.0%) | 0 (0.0%) |
| 5 to 9 Unit Apartments | 0 (0.0%) | 0 (0.0%) |
| 10 or more Apartments | 0 (0.0%) | 0 (0.0%) |
| Mobile Home / Other | 39 (100.0%) | 0 (0.0%) |
| Total | 298 (90.0%) | 33 (10.0%) |
Housing Structures by Number of Rooms in Laurys Station
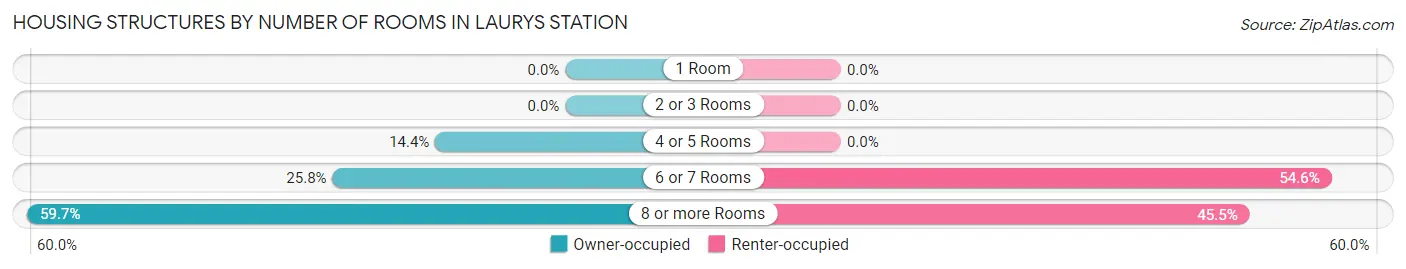
| Number of Rooms | Owner-occupied | Renter-occupied |
| 1 Room | 0 (0.0%) | 0 (0.0%) |
| 2 or 3 Rooms | 0 (0.0%) | 0 (0.0%) |
| 4 or 5 Rooms | 43 (14.4%) | 0 (0.0%) |
| 6 or 7 Rooms | 77 (25.8%) | 18 (54.5%) |
| 8 or more Rooms | 178 (59.7%) | 15 (45.5%) |
| Total | 298 (100.0%) | 33 (100.0%) |
Housing Structure by Heating Type in Laurys Station
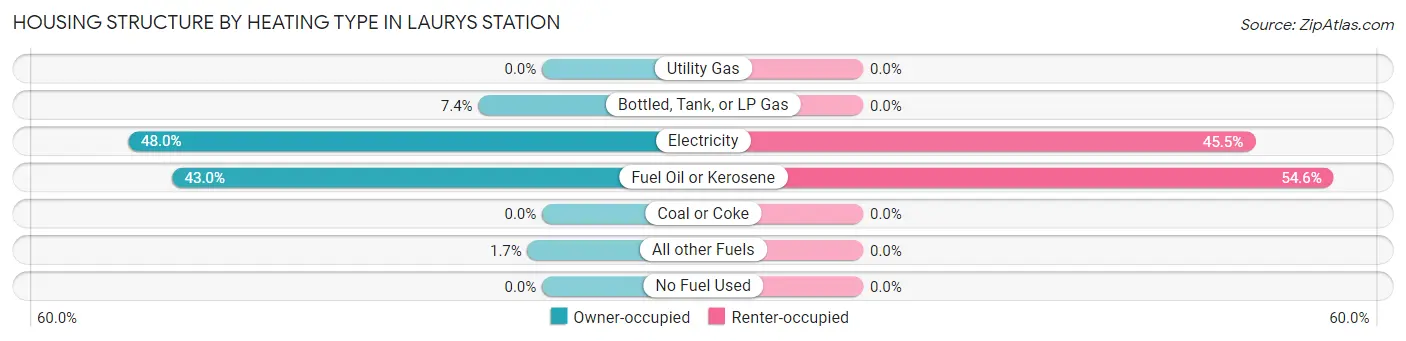
| Heating Type | Owner-occupied | Renter-occupied |
| Utility Gas | 0 (0.0%) | 0 (0.0%) |
| Bottled, Tank, or LP Gas | 22 (7.4%) | 0 (0.0%) |
| Electricity | 143 (48.0%) | 15 (45.5%) |
| Fuel Oil or Kerosene | 128 (42.9%) | 18 (54.5%) |
| Coal or Coke | 0 (0.0%) | 0 (0.0%) |
| All other Fuels | 5 (1.7%) | 0 (0.0%) |
| No Fuel Used | 0 (0.0%) | 0 (0.0%) |
| Total | 298 (100.0%) | 33 (100.0%) |
Household Vehicle Usage in Laurys Station
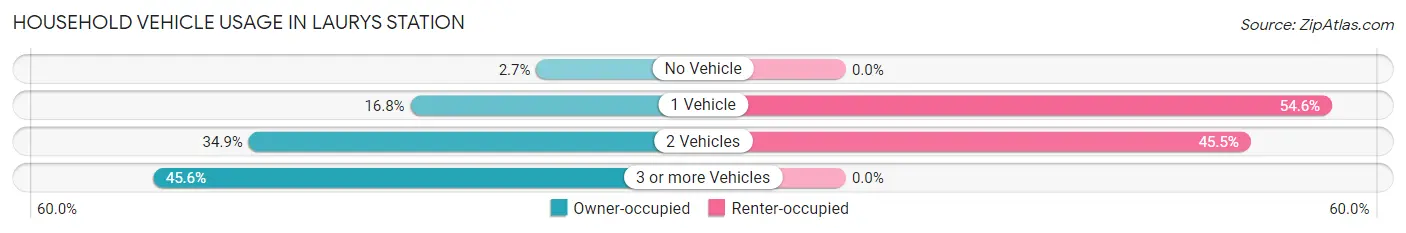
| Vehicles per Household | Owner-occupied | Renter-occupied |
| No Vehicle | 8 (2.7%) | 0 (0.0%) |
| 1 Vehicle | 50 (16.8%) | 18 (54.5%) |
| 2 Vehicles | 104 (34.9%) | 15 (45.5%) |
| 3 or more Vehicles | 136 (45.6%) | 0 (0.0%) |
| Total | 298 (100.0%) | 33 (100.0%) |
Real Estate & Mortgages in Laurys Station
Real Estate and Mortgage Overview in Laurys Station
| Characteristic | Without Mortgage | With Mortgage |
| Housing Units | 159 | 139 |
| Median Property Value | $400,600 | $342,700 |
| Median Household Income | $96,607 | $95 |
| Monthly Housing Costs | $953 | $17 |
| Real Estate Taxes | $5,404 | $0 |
Property Value by Mortgage Status in Laurys Station
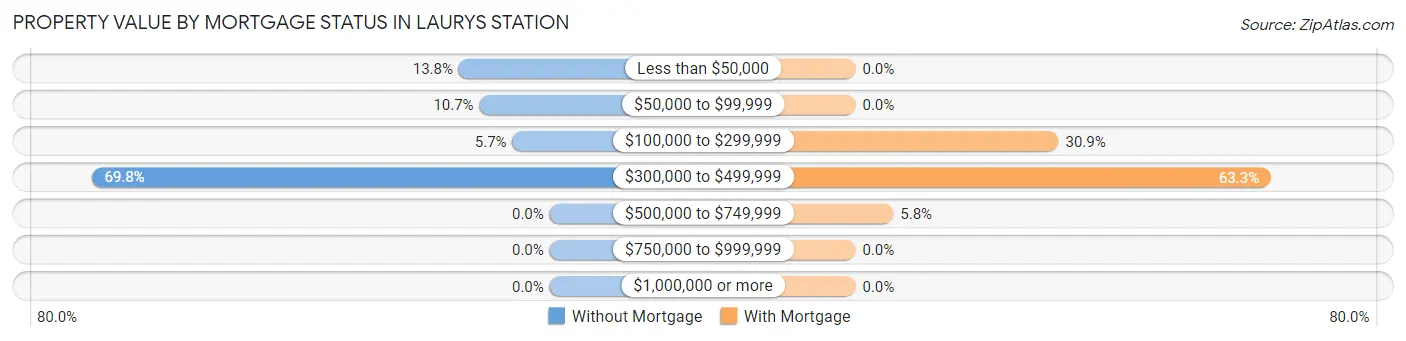
| Property Value | Without Mortgage | With Mortgage |
| Less than $50,000 | 22 (13.8%) | 0 (0.0%) |
| $50,000 to $99,999 | 17 (10.7%) | 0 (0.0%) |
| $100,000 to $299,999 | 9 (5.7%) | 43 (30.9%) |
| $300,000 to $499,999 | 111 (69.8%) | 88 (63.3%) |
| $500,000 to $749,999 | 0 (0.0%) | 8 (5.8%) |
| $750,000 to $999,999 | 0 (0.0%) | 0 (0.0%) |
| $1,000,000 or more | 0 (0.0%) | 0 (0.0%) |
| Total | 159 (100.0%) | 139 (100.0%) |
Household Income by Mortgage Status in Laurys Station
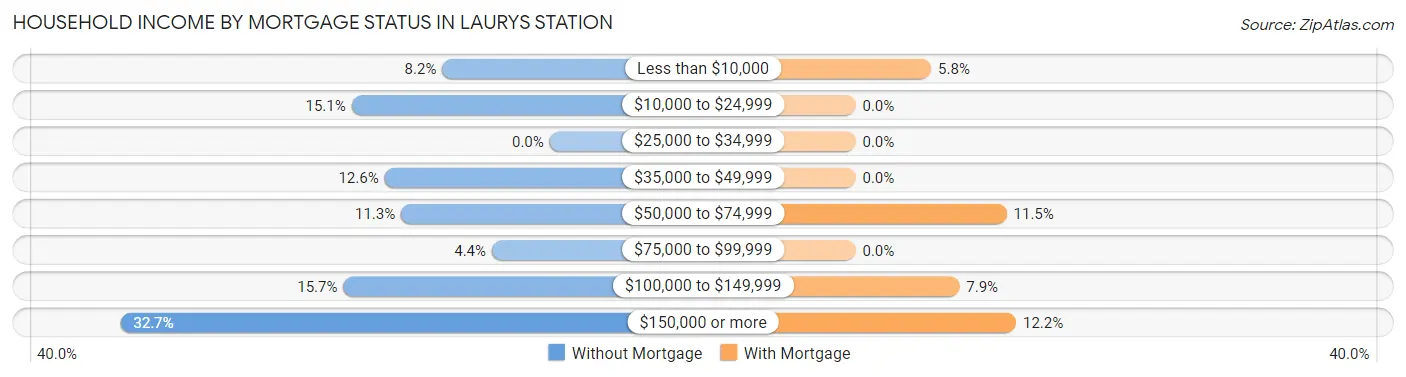
| Household Income | Without Mortgage | With Mortgage |
| Less than $10,000 | 13 (8.2%) | 8 (5.8%) |
| $10,000 to $24,999 | 24 (15.1%) | 0 (0.0%) |
| $25,000 to $34,999 | 0 (0.0%) | 0 (0.0%) |
| $35,000 to $49,999 | 20 (12.6%) | 0 (0.0%) |
| $50,000 to $74,999 | 18 (11.3%) | 16 (11.5%) |
| $75,000 to $99,999 | 7 (4.4%) | 0 (0.0%) |
| $100,000 to $149,999 | 25 (15.7%) | 11 (7.9%) |
| $150,000 or more | 52 (32.7%) | 17 (12.2%) |
| Total | 159 (100.0%) | 139 (100.0%) |
Property Value to Household Income Ratio in Laurys Station
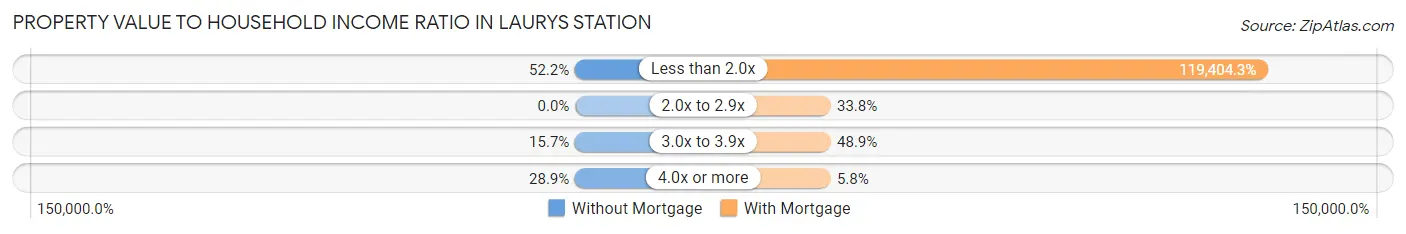
| Value-to-Income Ratio | Without Mortgage | With Mortgage |
| Less than 2.0x | 83 (52.2%) | 165,972 (119,404.3%) |
| 2.0x to 2.9x | 0 (0.0%) | 47 (33.8%) |
| 3.0x to 3.9x | 25 (15.7%) | 68 (48.9%) |
| 4.0x or more | 46 (28.9%) | 8 (5.8%) |
| Total | 159 (100.0%) | 139 (100.0%) |
Real Estate Taxes by Mortgage Status in Laurys Station
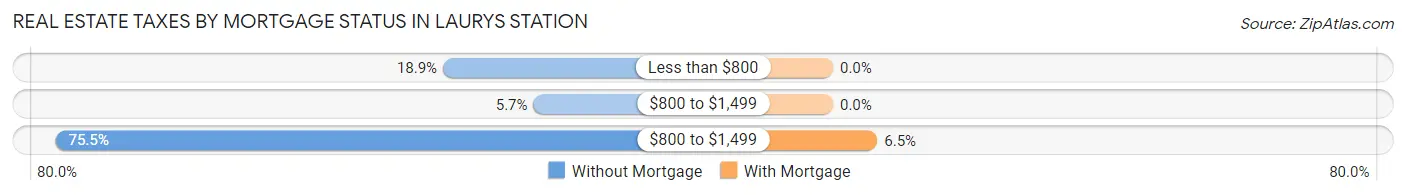
| Property Taxes | Without Mortgage | With Mortgage |
| Less than $800 | 30 (18.9%) | 0 (0.0%) |
| $800 to $1,499 | 9 (5.7%) | 0 (0.0%) |
| $800 to $1,499 | 120 (75.5%) | 9 (6.5%) |
| Total | 159 (100.0%) | 139 (100.0%) |
Health & Disability in Laurys Station
Health Insurance Coverage by Age in Laurys Station
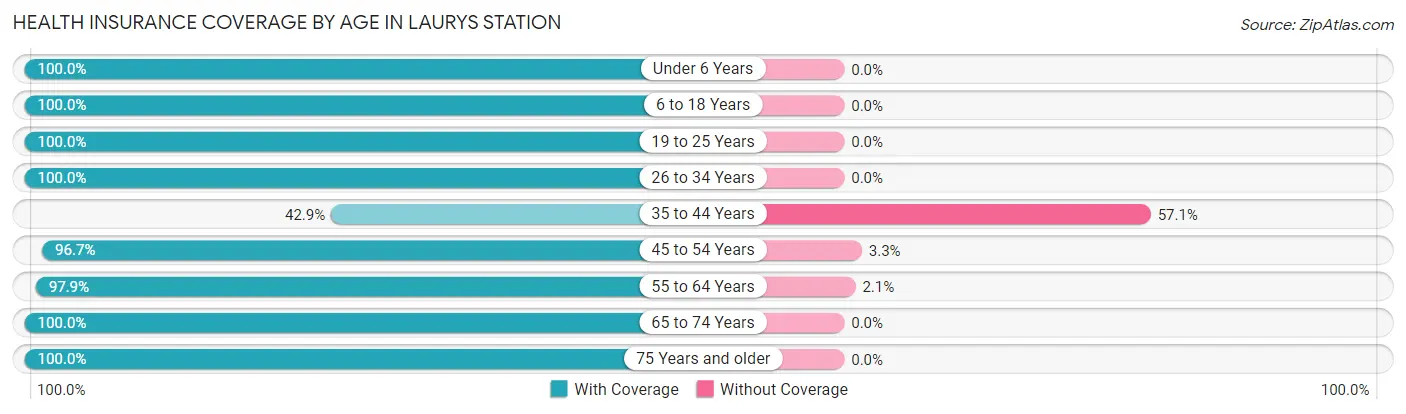
| Age Bracket | With Coverage | Without Coverage |
| Under 6 Years | 11 (100.0%) | 0 (0.0%) |
| 6 to 18 Years | 71 (100.0%) | 0 (0.0%) |
| 19 to 25 Years | 36 (100.0%) | 0 (0.0%) |
| 26 to 34 Years | 33 (100.0%) | 0 (0.0%) |
| 35 to 44 Years | 6 (42.9%) | 8 (57.1%) |
| 45 to 54 Years | 177 (96.7%) | 6 (3.3%) |
| 55 to 64 Years | 234 (97.9%) | 5 (2.1%) |
| 65 to 74 Years | 52 (100.0%) | 0 (0.0%) |
| 75 Years and older | 89 (100.0%) | 0 (0.0%) |
| Total | 709 (97.4%) | 19 (2.6%) |
Health Insurance Coverage by Citizenship Status in Laurys Station
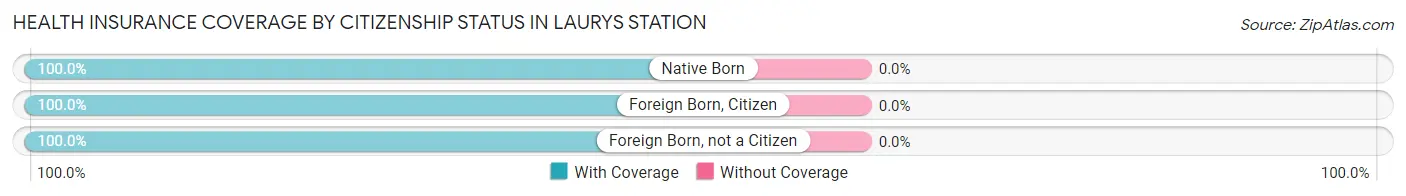
| Citizenship Status | With Coverage | Without Coverage |
| Native Born | 11 (100.0%) | 0 (0.0%) |
| Foreign Born, Citizen | 71 (100.0%) | 0 (0.0%) |
| Foreign Born, not a Citizen | 36 (100.0%) | 0 (0.0%) |
Health Insurance Coverage by Household Income in Laurys Station
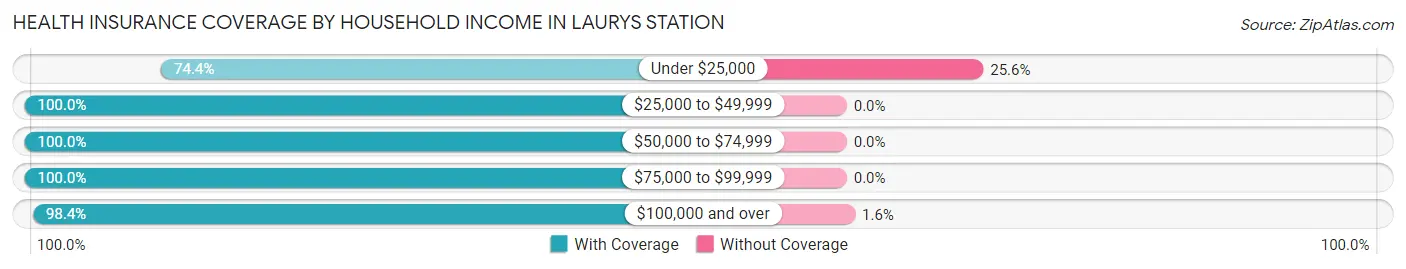
| Household Income | With Coverage | Without Coverage |
| Under $25,000 | 32 (74.4%) | 11 (25.6%) |
| $25,000 to $49,999 | 63 (100.0%) | 0 (0.0%) |
| $50,000 to $74,999 | 26 (100.0%) | 0 (0.0%) |
| $75,000 to $99,999 | 83 (100.0%) | 0 (0.0%) |
| $100,000 and over | 505 (98.4%) | 8 (1.6%) |
Public vs Private Health Insurance Coverage by Age in Laurys Station
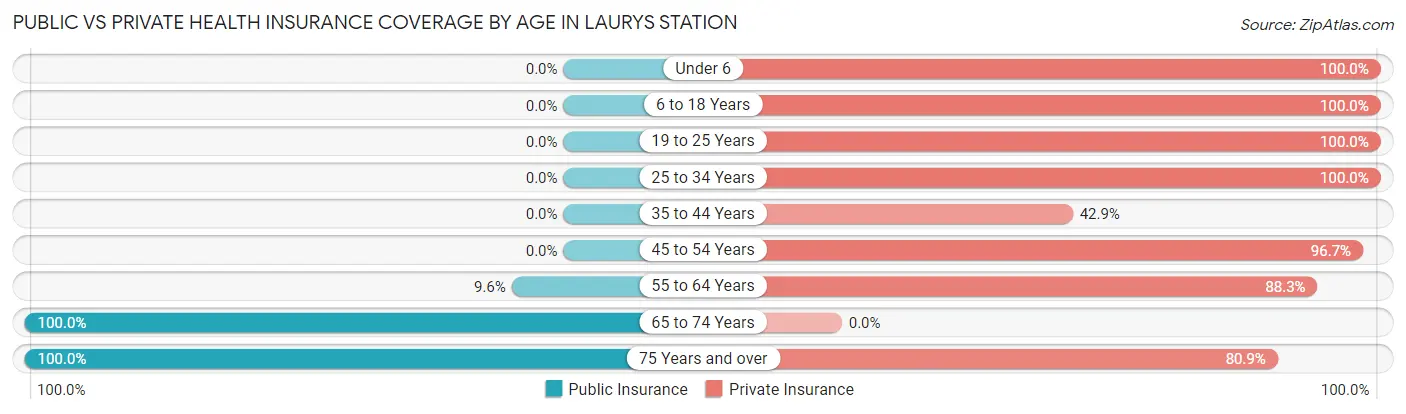
| Age Bracket | Public Insurance | Private Insurance |
| Under 6 | 0 (0.0%) | 11 (100.0%) |
| 6 to 18 Years | 0 (0.0%) | 71 (100.0%) |
| 19 to 25 Years | 0 (0.0%) | 36 (100.0%) |
| 25 to 34 Years | 0 (0.0%) | 33 (100.0%) |
| 35 to 44 Years | 0 (0.0%) | 6 (42.9%) |
| 45 to 54 Years | 0 (0.0%) | 177 (96.7%) |
| 55 to 64 Years | 23 (9.6%) | 211 (88.3%) |
| 65 to 74 Years | 52 (100.0%) | 0 (0.0%) |
| 75 Years and over | 89 (100.0%) | 72 (80.9%) |
| Total | 164 (22.5%) | 617 (84.8%) |
Disability Status by Sex by Age in Laurys Station
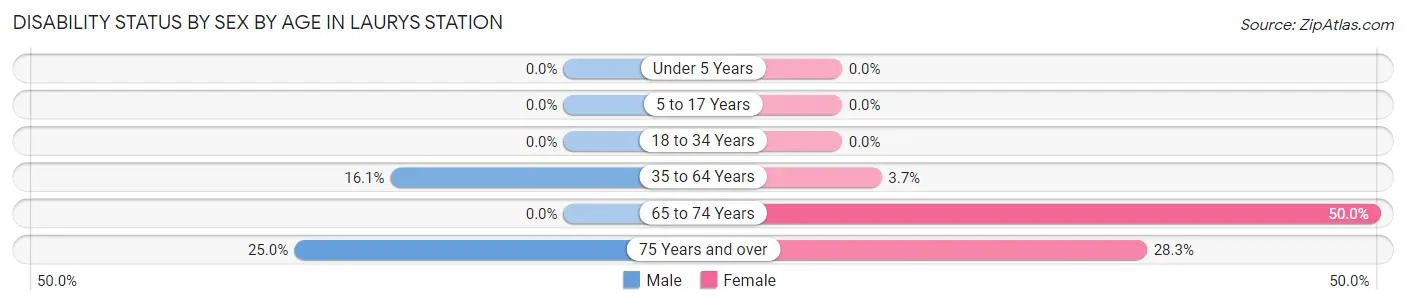
| Age Bracket | Male | Female |
| Under 5 Years | 0 (0.0%) | 0 (0.0%) |
| 5 to 17 Years | 0 (0.0%) | 0 (0.0%) |
| 18 to 34 Years | 0 (0.0%) | 0 (0.0%) |
| 35 to 64 Years | 35 (16.1%) | 8 (3.7%) |
| 65 to 74 Years | 0 (0.0%) | 8 (50.0%) |
| 75 Years and over | 9 (25.0%) | 15 (28.3%) |
Disability Class by Sex by Age in Laurys Station
Disability Class: Hearing Difficulty
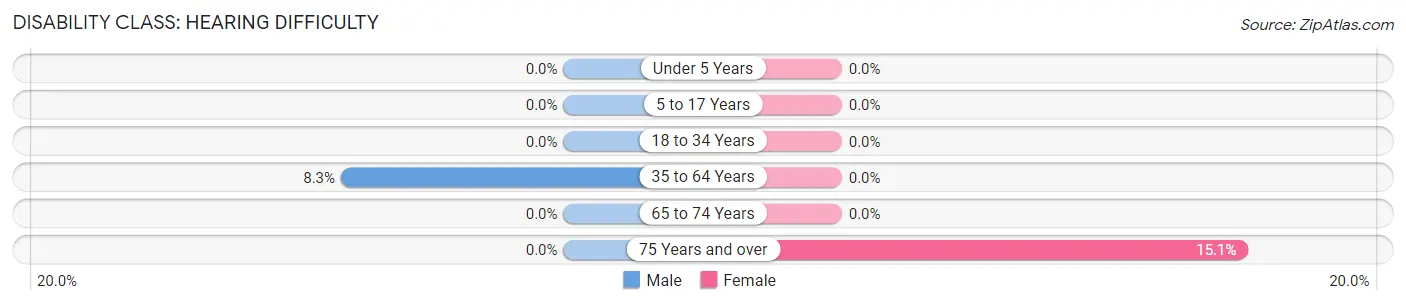
| Age Bracket | Male | Female |
| Under 5 Years | 0 (0.0%) | 0 (0.0%) |
| 5 to 17 Years | 0 (0.0%) | 0 (0.0%) |
| 18 to 34 Years | 0 (0.0%) | 0 (0.0%) |
| 35 to 64 Years | 18 (8.3%) | 0 (0.0%) |
| 65 to 74 Years | 0 (0.0%) | 0 (0.0%) |
| 75 Years and over | 0 (0.0%) | 8 (15.1%) |
Disability Class: Vision Difficulty
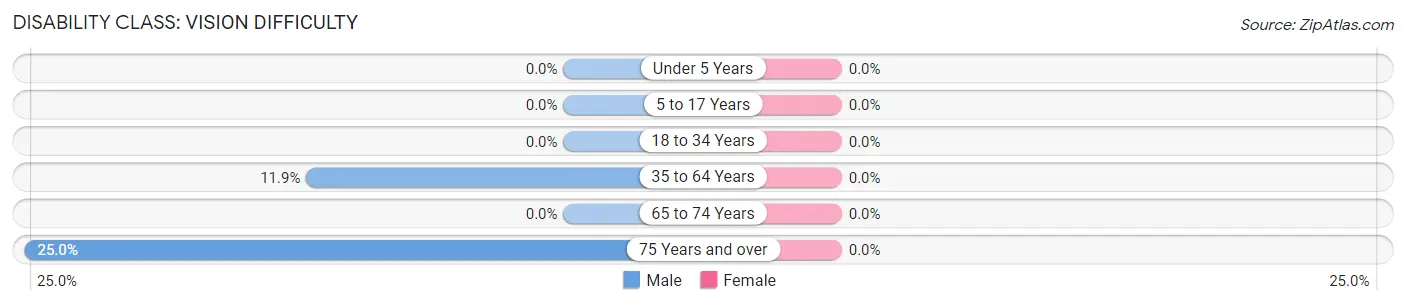
| Age Bracket | Male | Female |
| Under 5 Years | 0 (0.0%) | 0 (0.0%) |
| 5 to 17 Years | 0 (0.0%) | 0 (0.0%) |
| 18 to 34 Years | 0 (0.0%) | 0 (0.0%) |
| 35 to 64 Years | 26 (11.9%) | 0 (0.0%) |
| 65 to 74 Years | 0 (0.0%) | 0 (0.0%) |
| 75 Years and over | 9 (25.0%) | 0 (0.0%) |
Disability Class: Cognitive Difficulty
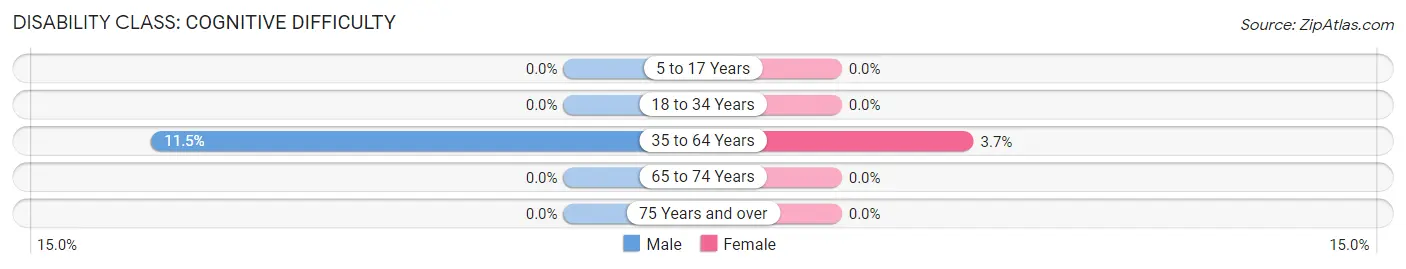
| Age Bracket | Male | Female |
| 5 to 17 Years | 0 (0.0%) | 0 (0.0%) |
| 18 to 34 Years | 0 (0.0%) | 0 (0.0%) |
| 35 to 64 Years | 25 (11.5%) | 8 (3.7%) |
| 65 to 74 Years | 0 (0.0%) | 0 (0.0%) |
| 75 Years and over | 0 (0.0%) | 0 (0.0%) |
Disability Class: Ambulatory Difficulty
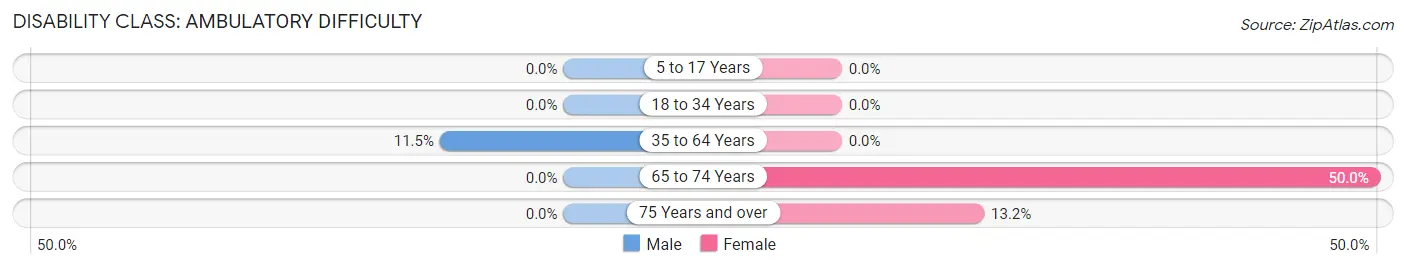
| Age Bracket | Male | Female |
| 5 to 17 Years | 0 (0.0%) | 0 (0.0%) |
| 18 to 34 Years | 0 (0.0%) | 0 (0.0%) |
| 35 to 64 Years | 25 (11.5%) | 0 (0.0%) |
| 65 to 74 Years | 0 (0.0%) | 8 (50.0%) |
| 75 Years and over | 0 (0.0%) | 7 (13.2%) |
Disability Class: Self-Care Difficulty
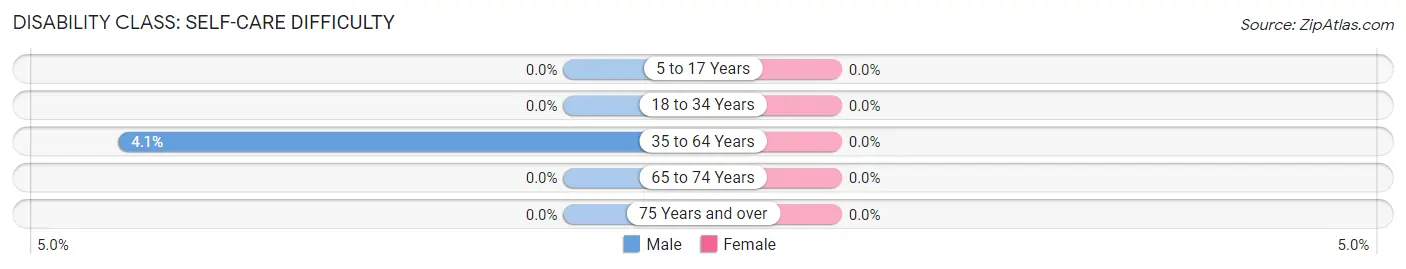
| Age Bracket | Male | Female |
| 5 to 17 Years | 0 (0.0%) | 0 (0.0%) |
| 18 to 34 Years | 0 (0.0%) | 0 (0.0%) |
| 35 to 64 Years | 9 (4.1%) | 0 (0.0%) |
| 65 to 74 Years | 0 (0.0%) | 0 (0.0%) |
| 75 Years and over | 0 (0.0%) | 0 (0.0%) |
Technology Access in Laurys Station
Computing Device Access in Laurys Station
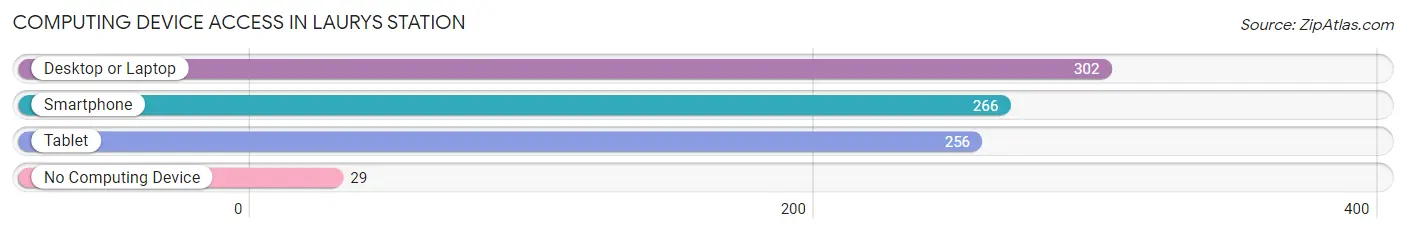
| Device Type | # Households | % Households |
| Desktop or Laptop | 302 | 91.2% |
| Smartphone | 266 | 80.4% |
| Tablet | 256 | 77.3% |
| No Computing Device | 29 | 8.8% |
| Total | 331 | 100.0% |
Internet Access in Laurys Station
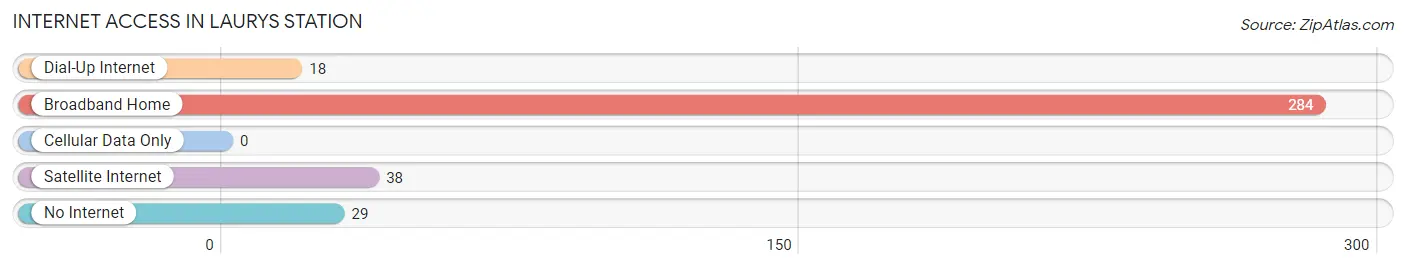
| Internet Type | # Households | % Households |
| Dial-Up Internet | 18 | 5.4% |
| Broadband Home | 284 | 85.8% |
| Cellular Data Only | 0 | 0.0% |
| Satellite Internet | 38 | 11.5% |
| No Internet | 29 | 8.8% |
| Total | 331 | 100.0% |
Laurys Station Summary
Laurys Station is a small unincorporated community located in North Whitehall Township, Lehigh County, Pennsylvania. It is situated in the Lehigh Valley region of the state, approximately 8 miles northwest of Allentown, the county seat. The community is located along the Lehigh River and is bordered by the townships of North Whitehall, South Whitehall, and Washington.
History
Laurys Station was founded in 1832 by John Lauer, a German immigrant who purchased a large tract of land in the area. He named the settlement after his son, Lawrence, and the nearby Lehigh Valley Railroad station. The railroad station was built in 1855 and was the first stop on the line between Allentown and Bethlehem. The station was a major hub for the transportation of coal, lumber, and other goods.
The community grew rapidly in the late 19th century, with the construction of several factories and businesses. The most prominent of these was the Laurys Station Iron Works, which was established in 1872 and produced a variety of iron products. The iron works was the largest employer in the area and provided jobs for many of the local residents.
The community continued to grow in the early 20th century, with the construction of several churches, schools, and other businesses. The population peaked in the 1950s, with over 1,000 residents. However, the population has since declined due to the decline of the local industries and the growth of nearby Allentown.
Geography
Laurys Station is located in the Lehigh Valley region of Pennsylvania, approximately 8 miles northwest of Allentown. The community is situated along the Lehigh River and is bordered by the townships of North Whitehall, South Whitehall, and Washington. The terrain is mostly flat, with some rolling hills in the surrounding area.
The climate in Laurys Station is typical of the Lehigh Valley region, with hot, humid summers and cold, snowy winters. The average annual temperature is around 50°F, with average highs in the summer reaching the mid-80s and average lows in the winter reaching the mid-20s.
Economy
Laurys Station is a primarily residential community, with no major industries or businesses. The local economy is largely supported by the nearby towns of Allentown and Bethlehem, which provide employment opportunities for many of the residents.
The community is also home to several small businesses, including a grocery store, a hardware store, and a few restaurants. There are also several churches and schools in the area.
Demographics
As of the 2010 census, the population of Laurys Station was 1,072. The racial makeup of the community was 97.3% White, 0.9% African American, 0.3% Native American, 0.3% Asian, and 0.9% from other races. The median household income was $50,938, and the median age was 43.7 years.
Conclusion
Laurys Station is a small unincorporated community located in North Whitehall Township, Lehigh County, Pennsylvania. It was founded in 1832 by John Lauer and was once a major hub for the transportation of coal, lumber, and other goods. The community has since declined in population due to the decline of the local industries and the growth of nearby Allentown. Today, Laurys Station is a primarily residential community, with no major industries or businesses. The local economy is largely supported by the nearby towns of Allentown and Bethlehem, which provide employment opportunities for many of the residents.
Common Questions
What is the Total Population of Laurys Station?
Total Population of Laurys Station is 728.
What is the Total Male Population of Laurys Station?
Total Male Population of Laurys Station is 347.
What is the Total Female Population of Laurys Station?
Total Female Population of Laurys Station is 381.
What is the Ratio of Males per 100 Females in Laurys Station?
There are 91.08 Males per 100 Females in Laurys Station.
What is the Ratio of Females per 100 Males in Laurys Station?
There are 109.80 Females per 100 Males in Laurys Station.
What is the Median Population Age in Laurys Station?
Median Population Age in Laurys Station is 55.4 Years.
What is the Average Family Size in Laurys Station
Average Family Size in Laurys Station is 2.5 People.
What is the Average Household Size in Laurys Station
Average Household Size in Laurys Station is 2.2 People.
What is Per Capita Income in Laurys Station?
Per Capita income in Laurys Station is $64,811.
What is the Median Family Income in Laurys Station?
Median Family Income in Laurys Station is $165,139.
What is the Median Household income in Laurys Station?
Median Household Income in Laurys Station is $136,250.
What is Income or Wage Gap in Laurys Station?
Income or Wage Gap in Laurys Station is 4.4%.
Women in Laurys Station earn 95.6 cents for every dollar earned by a man.
What is Inequality or Gini Index in Laurys Station?
Inequality or Gini Index in Laurys Station is 0.40.
How Large is the Labor Force in Laurys Station?
There are 472 People in the Labor Forcein in Laurys Station.
What is the Percentage of People in the Labor Force in Laurys Station?
68.8% of People are in the Labor Force in Laurys Station.