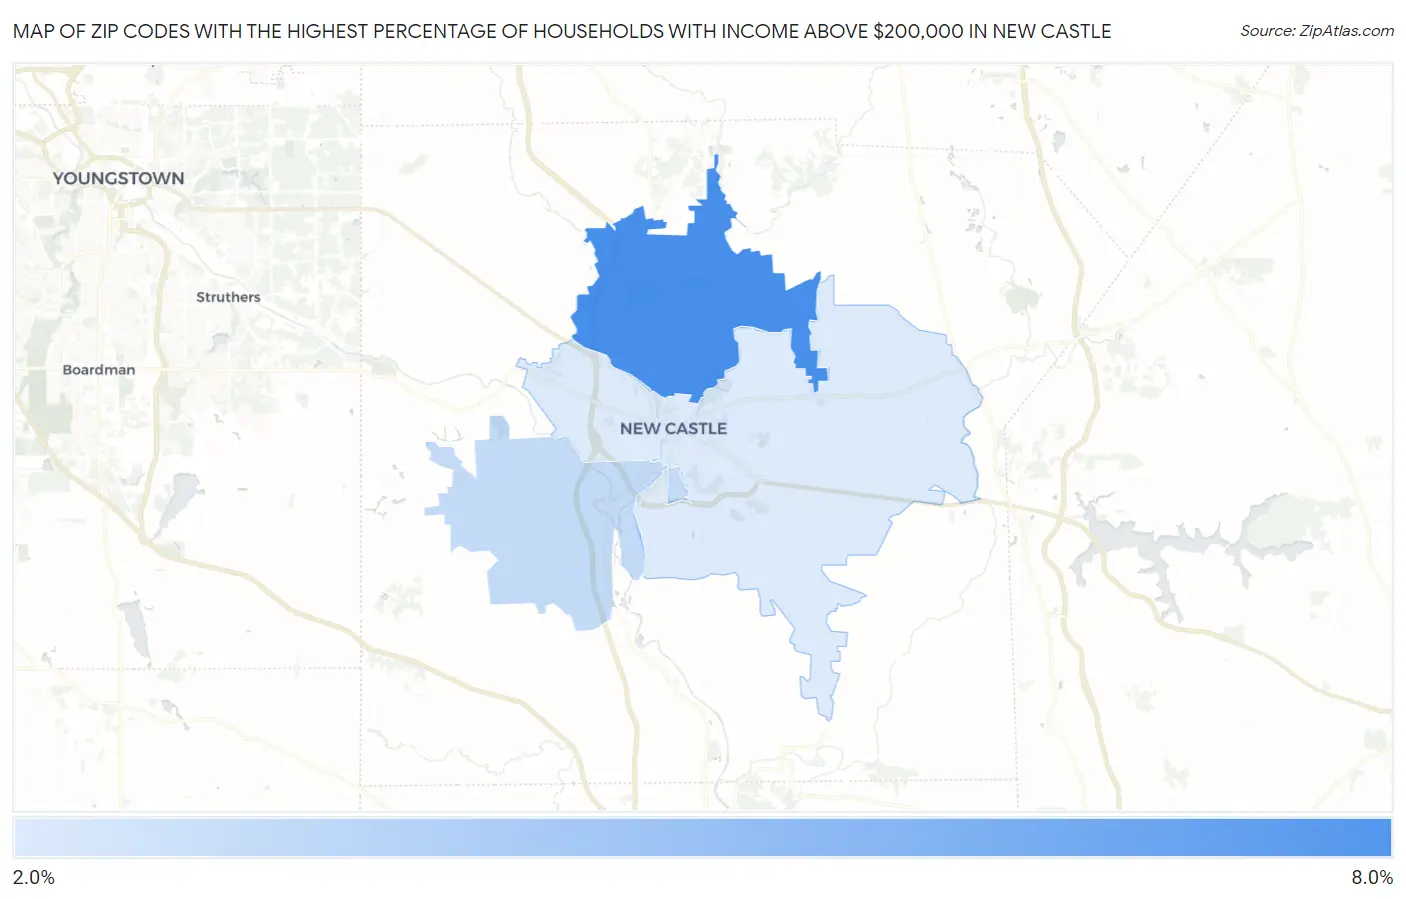
Zip Codes with the Highest Percentage of Households with Income Above $200,000 in New Castle, PA
RELATED REPORTS & OPTIONS
Household Income | $200k+
New Castle
Compare Zip Codes
Map of Zip Codes with the Highest Percentage of Households with Income Above $200,000 in New Castle
0.0%
8.0%
Zip Codes with the Highest Percentage of Households with Income Above $200,000 in New Castle, PA
| Zip Code | Households with Income > $200k | vs State | vs National | |
| 1. | 16105 | 8.0% | 10.2%(-2.20)#494 | 11.4%(-3.40)#10,382 |
| 2. | 16102 | 3.6% | 10.2%(-6.60)#974 | 11.4%(-7.80)#19,249 |
| 3. | 16101 | 2.7% | 10.2%(-7.50)#1,110 | 11.4%(-8.70)#21,726 |
1
Common Questions
What are the Top Zip Codes with the Highest Percentage of Households with Income Above $200,000 in New Castle, PA?
Top Zip Codes with the Highest Percentage of Households with Income Above $200,000 in New Castle, PA are:
What zip code has the Highest Percentage of Households with Income Above $200,000 in New Castle, PA?
16105 has the Highest Percentage of Households with Income Above $200,000 in New Castle, PA with 8.0%.
What is the Percentage of Households with Income Above $200,000 in New Castle, PA?
Percentage of Households with Income Above $200,000 in New Castle is 1.0%.
What is the Percentage of Households with Income Above $200,000 in Pennsylvania?
Percentage of Households with Income Above $200,000 in Pennsylvania is 10.2%.
What is the Percentage of Households with Income Above $200,000 in the United States?
Percentage of Households with Income Above $200,000 in the United States is 11.4%.