Owego, NY
Owego Map
Owego Overview
3,740
TOTAL POPULATION
1,591
MALE POPULATION
2,149
FEMALE POPULATION
74.03
MALES / 100 FEMALES
135.07
FEMALES / 100 MALES
41.8
MEDIAN AGE
2.9
AVG FAMILY SIZE
2.1
AVG HOUSEHOLD SIZE
$40,634
PER CAPITA INCOME
$80,777
AVG FAMILY INCOME
$51,200
AVG HOUSEHOLD INCOME
27.2%
WAGE / INCOME GAP [ % ]
72.8¢/ $1
WAGE / INCOME GAP [ $ ]
$18,835
FAMILY INCOME DEFICIT
0.57
INEQUALITY / GINI INDEX
1,635
LABOR FORCE [ PEOPLE ]
52.7%
PERCENT IN LABOR FORCE
3.1%
UNEMPLOYMENT RATE
Owego Zip Codes
Owego Area Codes
Race in Owego
The most populous races in Owego are White / Caucasian (3,431 | 91.7%), Two or more Races (127 | 3.4%), and Black / African American (93 | 2.5%).
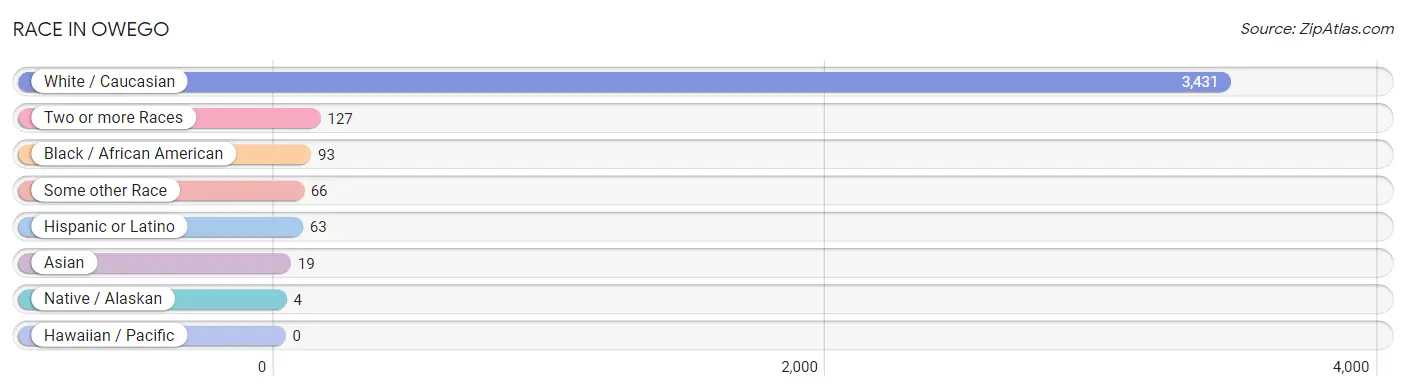
| Race | # Population | % Population |
| Asian | 19 | 0.5% |
| Black / African American | 93 | 2.5% |
| Hawaiian / Pacific | 0 | 0.0% |
| Hispanic or Latino | 63 | 1.7% |
| Native / Alaskan | 4 | 0.1% |
| White / Caucasian | 3,431 | 91.7% |
| Two or more Races | 127 | 3.4% |
| Some other Race | 66 | 1.8% |
| Total | 3,740 | 100.0% |
Ancestry in Owego
The most populous ancestries reported in Owego are German (507 | 13.6%), English (450 | 12.0%), Irish (405 | 10.8%), Italian (302 | 8.1%), and Dutch (174 | 4.6%), together accounting for 49.1% of all Owego residents.
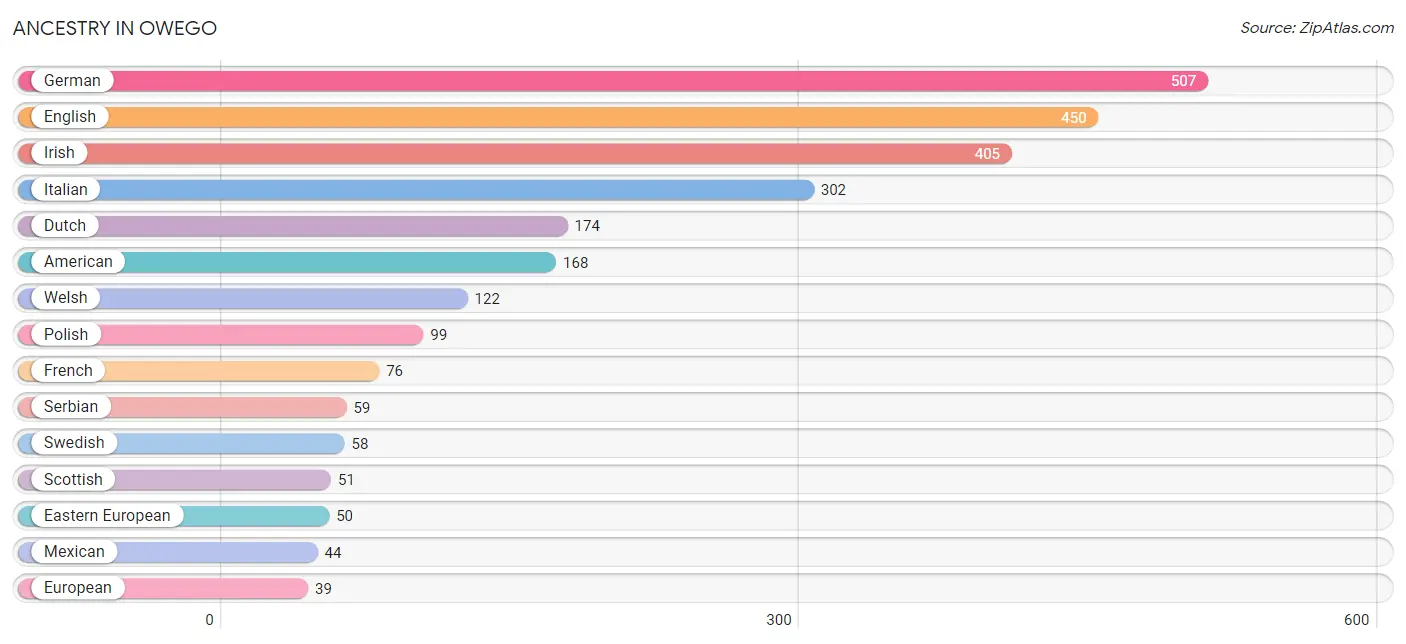
| Ancestry | # Population | % Population |
| American | 168 | 4.5% |
| Austrian | 13 | 0.4% |
| Belgian | 33 | 0.9% |
| British | 23 | 0.6% |
| Cherokee | 10 | 0.3% |
| Czech | 16 | 0.4% |
| Czechoslovakian | 30 | 0.8% |
| Dutch | 174 | 4.6% |
| Eastern European | 50 | 1.3% |
| English | 450 | 12.0% |
| European | 39 | 1.0% |
| French | 76 | 2.0% |
| French Canadian | 9 | 0.2% |
| German | 507 | 13.6% |
| Ghanaian | 35 | 0.9% |
| Indian (Asian) | 5 | 0.1% |
| Irish | 405 | 10.8% |
| Italian | 302 | 8.1% |
| Mexican | 44 | 1.2% |
| Norwegian | 33 | 0.9% |
| Polish | 99 | 2.6% |
| Portuguese | 16 | 0.4% |
| Puerto Rican | 19 | 0.5% |
| Scandinavian | 13 | 0.4% |
| Scotch-Irish | 20 | 0.5% |
| Scottish | 51 | 1.4% |
| Serbian | 59 | 1.6% |
| Slovak | 25 | 0.7% |
| Subsaharan African | 35 | 0.9% |
| Swedish | 58 | 1.5% |
| Ukrainian | 23 | 0.6% |
| Welsh | 122 | 3.3% | View All 32 Rows |
Immigrants in Owego
The most numerous immigrant groups reported in Owego came from Europe (36 | 1.0%), Asia (31 | 0.8%), Germany (24 | 0.6%), Western Europe (24 | 0.6%), and Pakistan (19 | 0.5%), together accounting for 3.6% of all Owego residents.
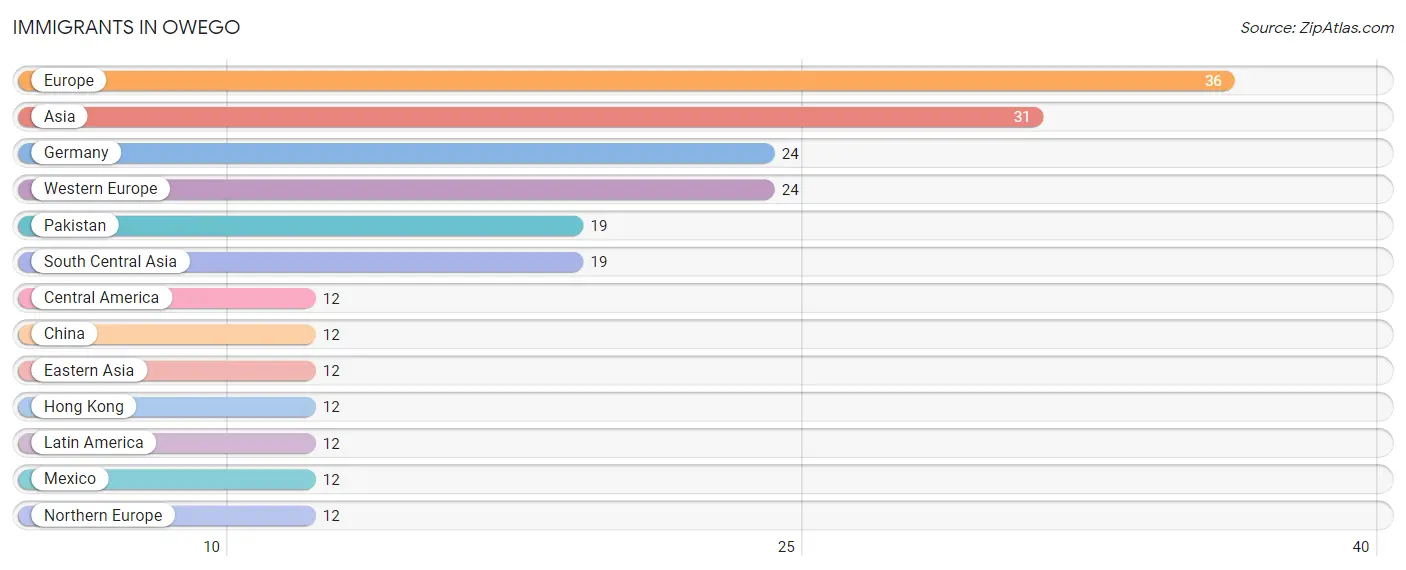
| Immigration Origin | # Population | % Population |
| Asia | 31 | 0.8% |
| Central America | 12 | 0.3% |
| China | 12 | 0.3% |
| Eastern Asia | 12 | 0.3% |
| Europe | 36 | 1.0% |
| Germany | 24 | 0.6% |
| Hong Kong | 12 | 0.3% |
| Latin America | 12 | 0.3% |
| Mexico | 12 | 0.3% |
| Northern Europe | 12 | 0.3% |
| Pakistan | 19 | 0.5% |
| South Central Asia | 19 | 0.5% |
| Western Europe | 24 | 0.6% | View All 13 Rows |
Sex and Age in Owego
Sex and Age in Owego
The most populous age groups in Owego are Under 5 Years (202 | 12.7%) for men and 10 to 14 Years (233 | 10.8%) for women.
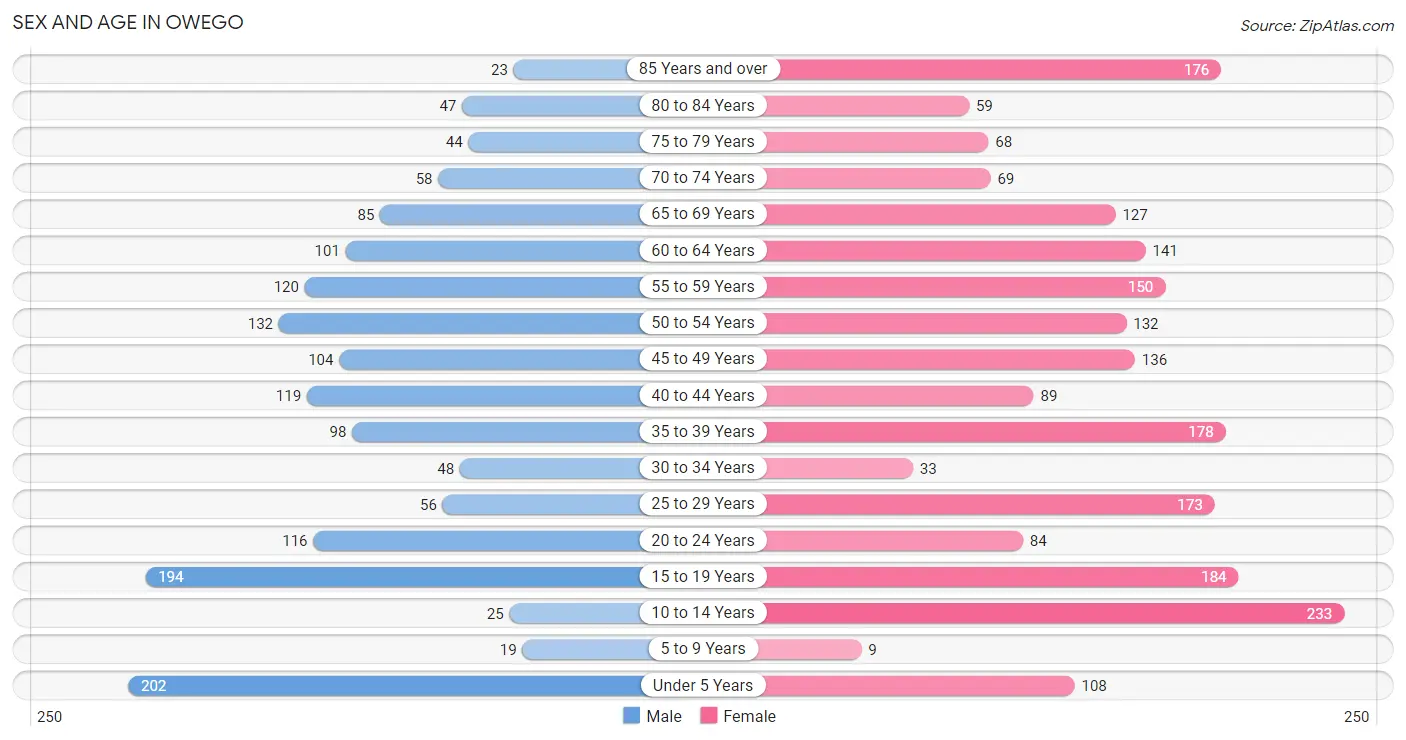
| Age Bracket | Male | Female |
| Under 5 Years | 202 (12.7%) | 108 (5.0%) |
| 5 to 9 Years | 19 (1.2%) | 9 (0.4%) |
| 10 to 14 Years | 25 (1.6%) | 233 (10.8%) |
| 15 to 19 Years | 194 (12.2%) | 184 (8.6%) |
| 20 to 24 Years | 116 (7.3%) | 84 (3.9%) |
| 25 to 29 Years | 56 (3.5%) | 173 (8.1%) |
| 30 to 34 Years | 48 (3.0%) | 33 (1.5%) |
| 35 to 39 Years | 98 (6.2%) | 178 (8.3%) |
| 40 to 44 Years | 119 (7.5%) | 89 (4.1%) |
| 45 to 49 Years | 104 (6.5%) | 136 (6.3%) |
| 50 to 54 Years | 132 (8.3%) | 132 (6.1%) |
| 55 to 59 Years | 120 (7.5%) | 150 (7.0%) |
| 60 to 64 Years | 101 (6.4%) | 141 (6.6%) |
| 65 to 69 Years | 85 (5.3%) | 127 (5.9%) |
| 70 to 74 Years | 58 (3.6%) | 69 (3.2%) |
| 75 to 79 Years | 44 (2.8%) | 68 (3.2%) |
| 80 to 84 Years | 47 (2.9%) | 59 (2.8%) |
| 85 Years and over | 23 (1.5%) | 176 (8.2%) |
| Total | 1,591 (100.0%) | 2,149 (100.0%) |
Families and Households in Owego
Median Family Size in Owego
The median family size in Owego is 2.94 persons per family, with single male/father families (92 | 12.1%) accounting for the largest median family size of 3.28 persons per family. On the other hand, single female/mother families (198 | 26.2%) represent the smallest median family size with 2.75 persons per family.
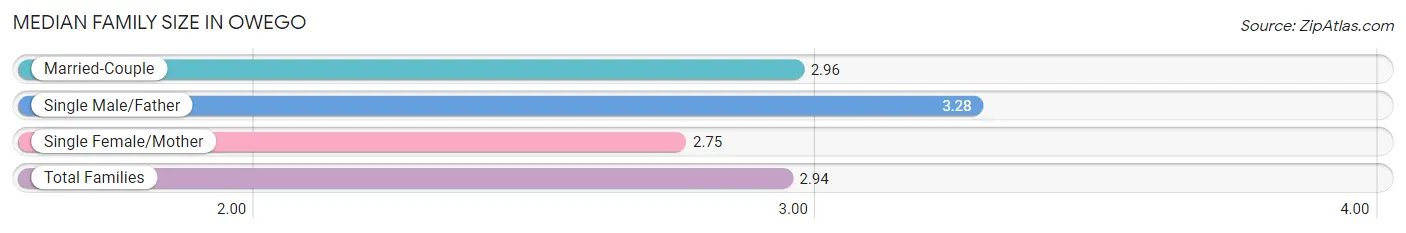
| Family Type | # Families | Family Size |
| Married-Couple | 467 (61.7%) | 2.96 |
| Single Male/Father | 92 (12.1%) | 3.28 |
| Single Female/Mother | 198 (26.2%) | 2.75 |
| Total Families | 757 (100.0%) | 2.94 |
Median Household Size in Owego
The median household size in Owego is 2.06 persons per household, with single male/father households (92 | 5.2%) accounting for the largest median household size of 3.98 persons per household. non-family households (1,009 | 57.1%) represent the smallest median household size with 1.28 persons per household.
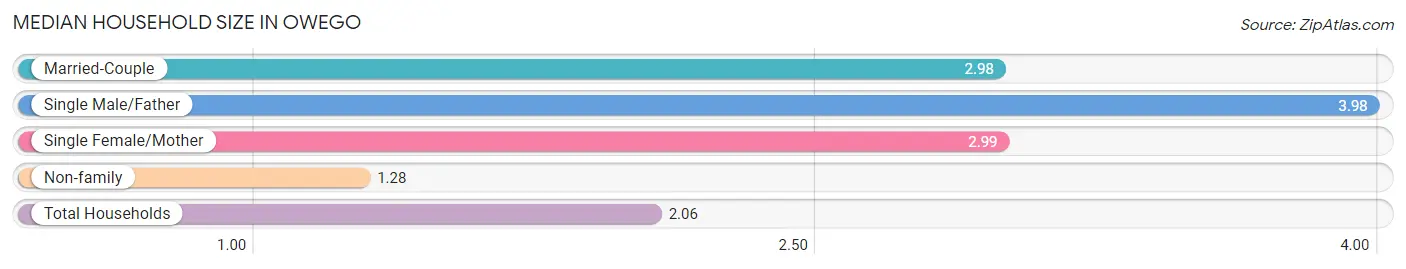
| Household Type | # Households | Household Size |
| Married-Couple | 467 (26.4%) | 2.98 |
| Single Male/Father | 92 (5.2%) | 3.98 |
| Single Female/Mother | 198 (11.2%) | 2.99 |
| Non-family | 1,009 (57.1%) | 1.28 |
| Total Households | 1,766 (100.0%) | 2.06 |
Household Size by Marriage Status in Owego
Out of a total of 1,766 households in Owego, 757 (42.9%) are family households, while 1,009 (57.1%) are nonfamily households. The most numerous type of family households are 2-person households, comprising 370, and the most common type of nonfamily households are 1-person households, comprising 811.
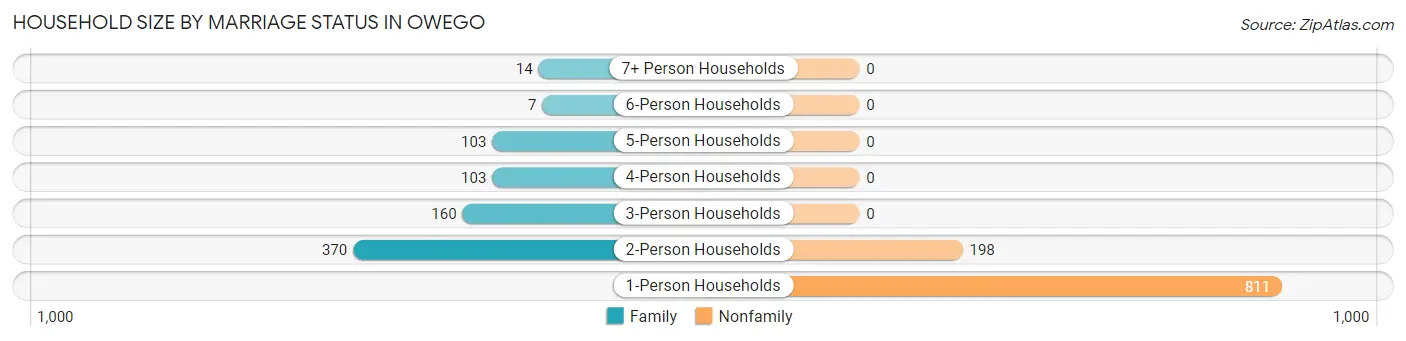
| Household Size | Family Households | Nonfamily Households |
| 1-Person Households | - | 811 (45.9%) |
| 2-Person Households | 370 (20.9%) | 198 (11.2%) |
| 3-Person Households | 160 (9.1%) | 0 (0.0%) |
| 4-Person Households | 103 (5.8%) | 0 (0.0%) |
| 5-Person Households | 103 (5.8%) | 0 (0.0%) |
| 6-Person Households | 7 (0.4%) | 0 (0.0%) |
| 7+ Person Households | 14 (0.8%) | 0 (0.0%) |
| Total | 757 (42.9%) | 1,009 (57.1%) |
Female Fertility in Owego
Fertility by Age in Owego
Average fertility rate in Owego is 52.0 births per 1,000 women. Women in the age bracket of 20 to 34 years have the highest fertility rate with 155.0 births per 1,000 women. Women in the age bracket of 20 to 34 years acount for 90.0% of all women with births.
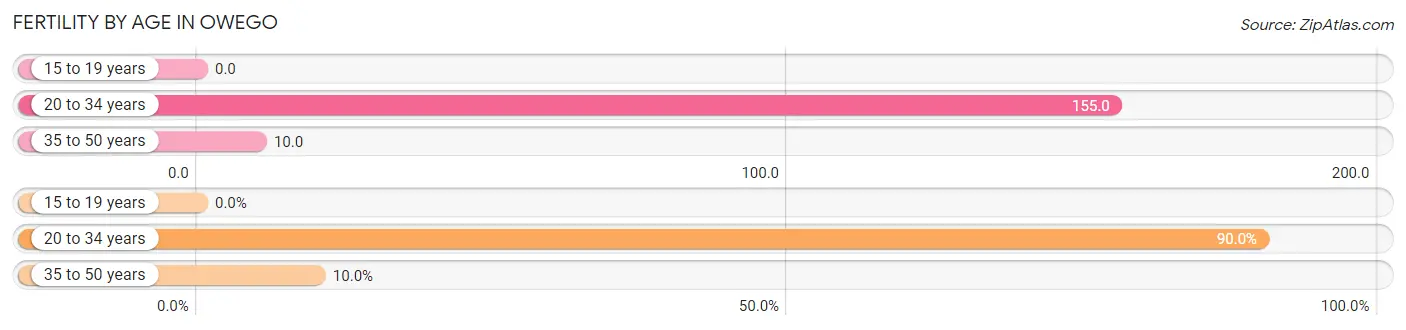
| Age Bracket | Women with Births | Births / 1,000 Women |
| 15 to 19 years | 0 (0.0%) | 0.0 |
| 20 to 34 years | 45 (90.0%) | 155.0 |
| 35 to 50 years | 5 (10.0%) | 10.0 |
| Total | 50 (100.0%) | 52.0 |
Fertility by Age by Marriage Status in Owego
34.0% of women with births (50) in Owego are married. The highest percentage of unmarried women with births falls into 20 to 34 years age bracket with 73.3% of them unmarried at the time of birth, while the lowest percentage of unmarried women with births belong to 35 to 50 years age bracket with 0.0% of them unmarried.
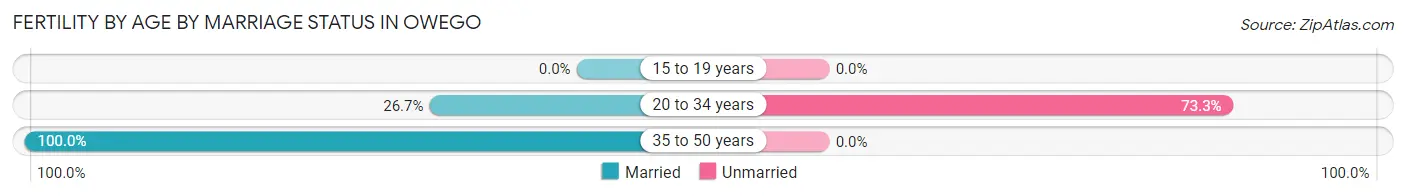
| Age Bracket | Married | Unmarried |
| 15 to 19 years | 0 (0.0%) | 0 (0.0%) |
| 20 to 34 years | 12 (26.7%) | 33 (73.3%) |
| 35 to 50 years | 5 (100.0%) | 0 (0.0%) |
| Total | 17 (34.0%) | 33 (66.0%) |
Fertility by Education in Owego
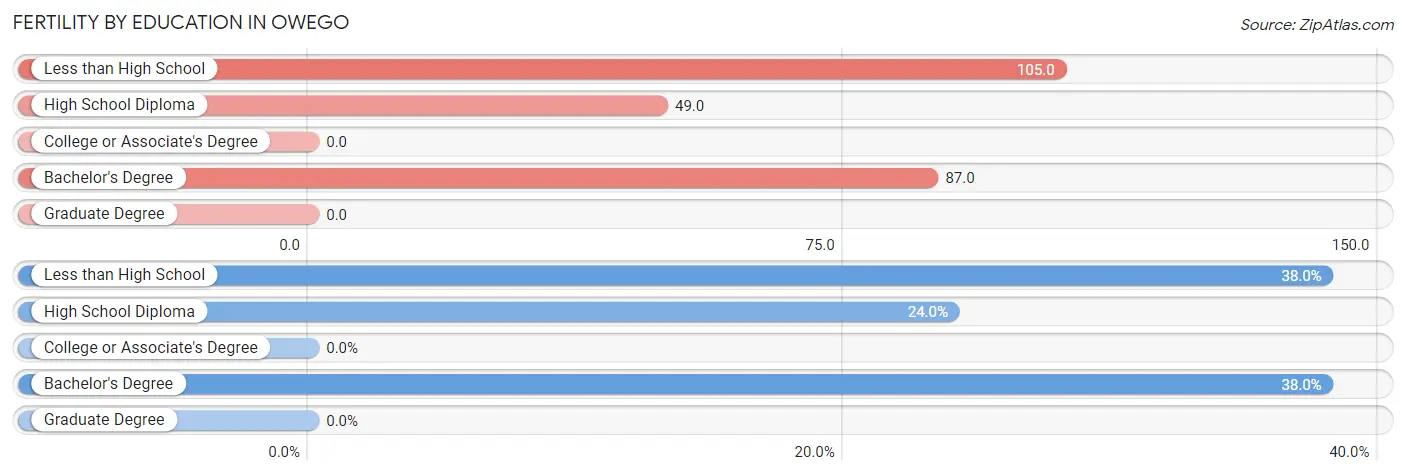
| Educational Attainment | Women with Births | Births / 1,000 Women |
| Less than High School | 19 (38.0%) | 105.0 |
| High School Diploma | 12 (24.0%) | 49.0 |
| College or Associate's Degree | 0 (0.0%) | 0.0 |
| Bachelor's Degree | 19 (38.0%) | 87.0 |
| Graduate Degree | 0 (0.0%) | 0.0 |
| Total | 50 (100.0%) | 52.0 |
Fertility by Education by Marriage Status in Owego
66.0% of women with births in Owego are unmarried. Women with the educational attainment of high school diploma are most likely to be married with 100.0% of them married at childbirth, while women with the educational attainment of bachelor's degree are least likely to be married with 100.0% of them unmarried at childbirth.
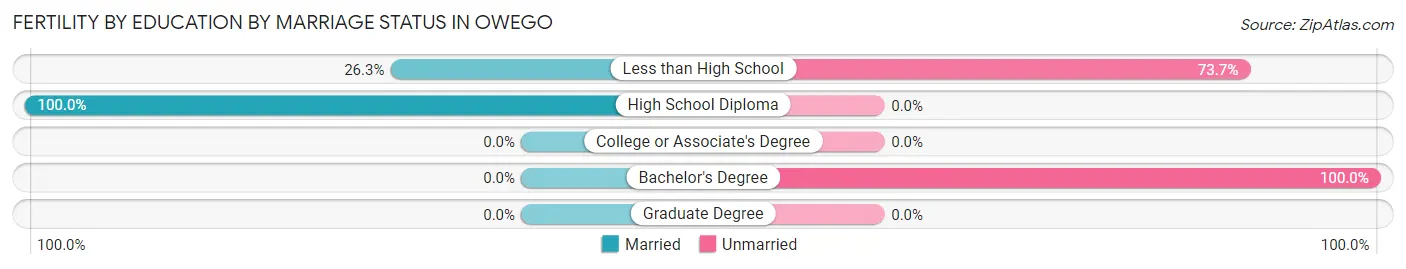
| Educational Attainment | Married | Unmarried |
| Less than High School | 5 (26.3%) | 14 (73.7%) |
| High School Diploma | 12 (100.0%) | 0 (0.0%) |
| College or Associate's Degree | 0 (0.0%) | 0 (0.0%) |
| Bachelor's Degree | 0 (0.0%) | 19 (100.0%) |
| Graduate Degree | 0 (0.0%) | 0 (0.0%) |
| Total | 17 (34.0%) | 33 (66.0%) |
Income in Owego
Income Overview in Owego
Per Capita Income in Owego is $40,634, while median incomes of families and households are $80,777 and $51,200 respectively.
| Characteristic | Number | Measure |
| Per Capita Income | 3,740 | $40,634 |
| Median Family Income | 757 | $80,777 |
| Mean Family Income | 757 | $109,678 |
| Median Household Income | 1,766 | $51,200 |
| Mean Household Income | 1,766 | $88,585 |
| Income Deficit | 757 | $18,835 |
| Wage / Income Gap (%) | 3,740 | 27.20% |
| Wage / Income Gap ($) | 3,740 | 72.80¢ per $1 |
| Gini / Inequality Index | 3,740 | 0.57 |
Earnings by Sex in Owego
Average Earnings in Owego are $40,104, $44,318 for men and $32,262 for women, a difference of 27.2%.
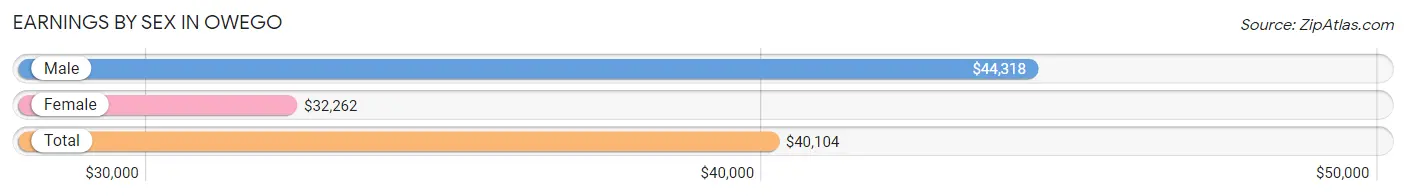
| Sex | Number | Average Earnings |
| Male | 992 (53.0%) | $44,318 |
| Female | 880 (47.0%) | $32,262 |
| Total | 1,872 (100.0%) | $40,104 |
Earnings by Sex by Income Bracket in Owego
The most common earnings brackets in Owego are $75,000 to $99,999 for men (168 | 16.9%) and $30,000 to $34,999 for women (126 | 14.3%).
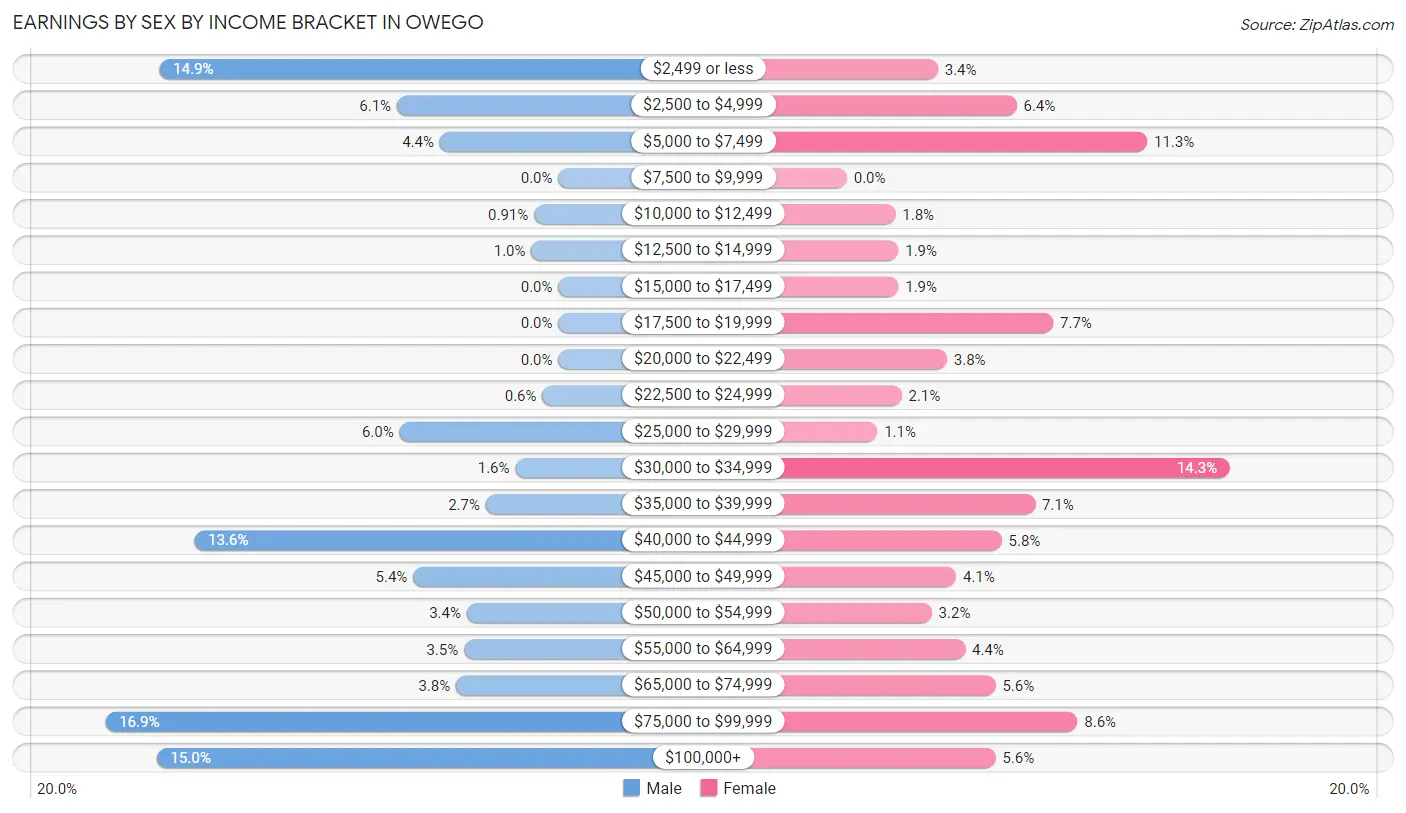
| Income | Male | Female |
| $2,499 or less | 148 (14.9%) | 30 (3.4%) |
| $2,500 to $4,999 | 60 (6.0%) | 56 (6.4%) |
| $5,000 to $7,499 | 44 (4.4%) | 99 (11.3%) |
| $7,500 to $9,999 | 0 (0.0%) | 0 (0.0%) |
| $10,000 to $12,499 | 9 (0.9%) | 16 (1.8%) |
| $12,500 to $14,999 | 10 (1.0%) | 17 (1.9%) |
| $15,000 to $17,499 | 0 (0.0%) | 17 (1.9%) |
| $17,500 to $19,999 | 0 (0.0%) | 68 (7.7%) |
| $20,000 to $22,499 | 0 (0.0%) | 33 (3.7%) |
| $22,500 to $24,999 | 6 (0.6%) | 18 (2.1%) |
| $25,000 to $29,999 | 59 (5.9%) | 10 (1.1%) |
| $30,000 to $34,999 | 16 (1.6%) | 126 (14.3%) |
| $35,000 to $39,999 | 27 (2.7%) | 62 (7.0%) |
| $40,000 to $44,999 | 135 (13.6%) | 51 (5.8%) |
| $45,000 to $49,999 | 54 (5.4%) | 36 (4.1%) |
| $50,000 to $54,999 | 34 (3.4%) | 28 (3.2%) |
| $55,000 to $64,999 | 35 (3.5%) | 39 (4.4%) |
| $65,000 to $74,999 | 38 (3.8%) | 49 (5.6%) |
| $75,000 to $99,999 | 168 (16.9%) | 76 (8.6%) |
| $100,000+ | 149 (15.0%) | 49 (5.6%) |
| Total | 992 (100.0%) | 880 (100.0%) |
Earnings by Sex by Educational Attainment in Owego
Average earnings in Owego are $46,759 for men and $36,042 for women, a difference of 22.9%. Men with an educational attainment of graduate degree enjoy the highest average annual earnings of $81,058, while those with high school diploma education earn the least with $41,540. Women with an educational attainment of graduate degree earn the most with the average annual earnings of $83,750, while those with less than high school education have the smallest earnings of $19,922.
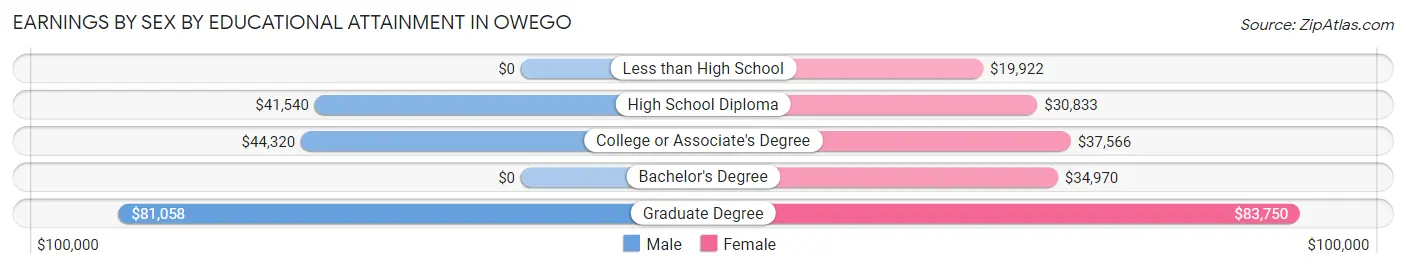
| Educational Attainment | Male Income | Female Income |
| Less than High School | - | - |
| High School Diploma | $41,540 | $30,833 |
| College or Associate's Degree | $44,320 | $37,566 |
| Bachelor's Degree | - | - |
| Graduate Degree | $81,058 | $83,750 |
| Total | $46,759 | $36,042 |
Family Income in Owego
Family Income Brackets in Owego
According to the Owego family income data, there are 162 families falling into the $75,000 to $99,999 income range, which is the most common income bracket and makes up 21.4% of all families.
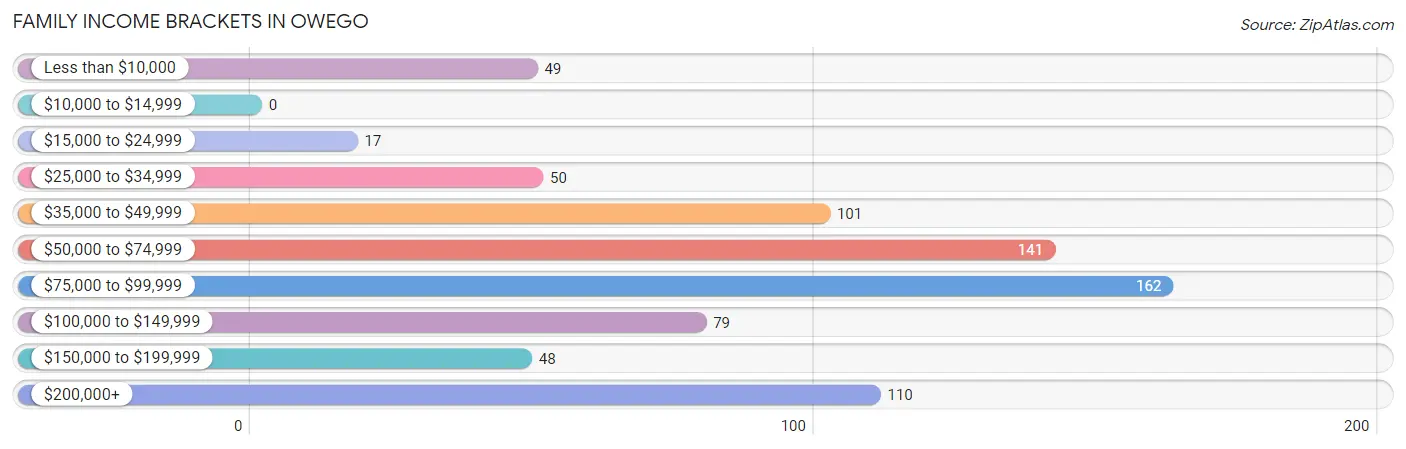
| Income Bracket | # Families | % Families |
| Less than $10,000 | 49 | 6.5% |
| $10,000 to $14,999 | 0 | 0.0% |
| $15,000 to $24,999 | 17 | 2.2% |
| $25,000 to $34,999 | 50 | 6.6% |
| $35,000 to $49,999 | 101 | 13.3% |
| $50,000 to $74,999 | 141 | 18.6% |
| $75,000 to $99,999 | 162 | 21.4% |
| $100,000 to $149,999 | 79 | 10.4% |
| $150,000 to $199,999 | 48 | 6.3% |
| $200,000+ | 110 | 14.5% |
Family Income by Famaliy Size in Owego
4-person families (160 | 21.1%) account for the highest median family income in Owego with $95,516 per family, while 2-person families (406 | 53.6%) have the highest median income of $34,772 per family member.
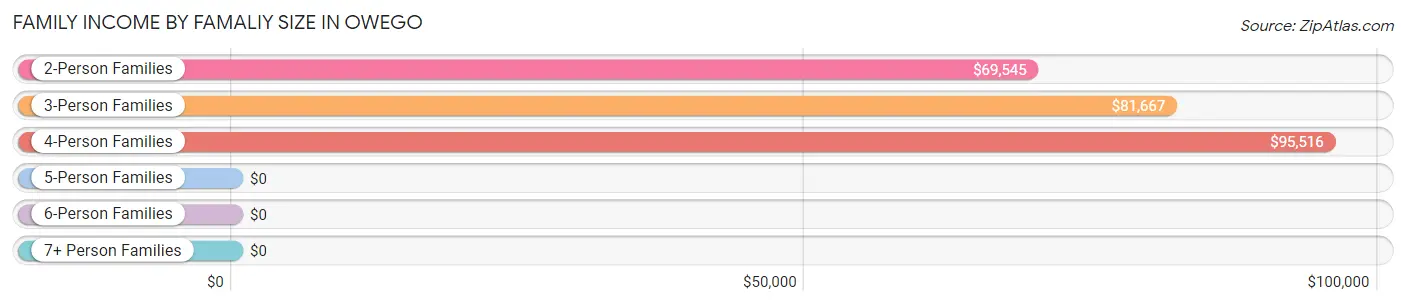
| Income Bracket | # Families | Median Income |
| 2-Person Families | 406 (53.6%) | $69,545 |
| 3-Person Families | 124 (16.4%) | $81,667 |
| 4-Person Families | 160 (21.1%) | $95,516 |
| 5-Person Families | 53 (7.0%) | $0 |
| 6-Person Families | 14 (1.8%) | $0 |
| 7+ Person Families | 0 (0.0%) | $0 |
| Total | 757 (100.0%) | $80,777 |
Family Income by Number of Earners in Owego
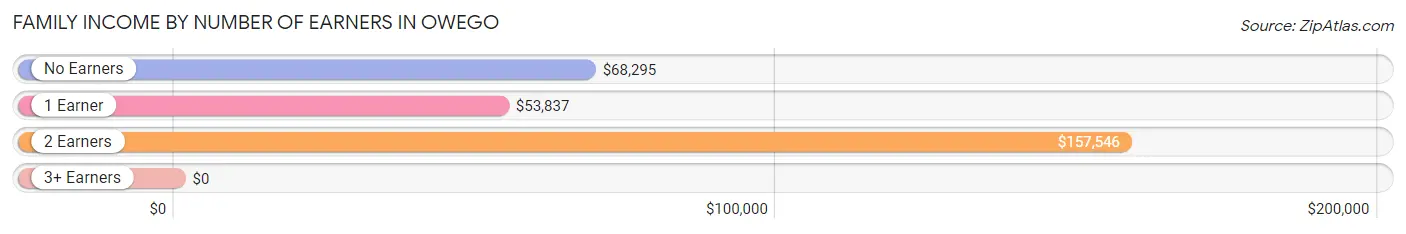
| Number of Earners | # Families | Median Income |
| No Earners | 103 (13.6%) | $68,295 |
| 1 Earner | 368 (48.6%) | $53,837 |
| 2 Earners | 233 (30.8%) | $157,546 |
| 3+ Earners | 53 (7.0%) | $0 |
| Total | 757 (100.0%) | $80,777 |
Household Income in Owego
Household Income Brackets in Owego
With 290 households falling in the category, the $75,000 to $99,999 income range is the most frequent in Owego, accounting for 16.4% of all households. In contrast, only 55 households (3.1%) fall into the $150,000 to $199,999 income bracket, making it the least populous group.
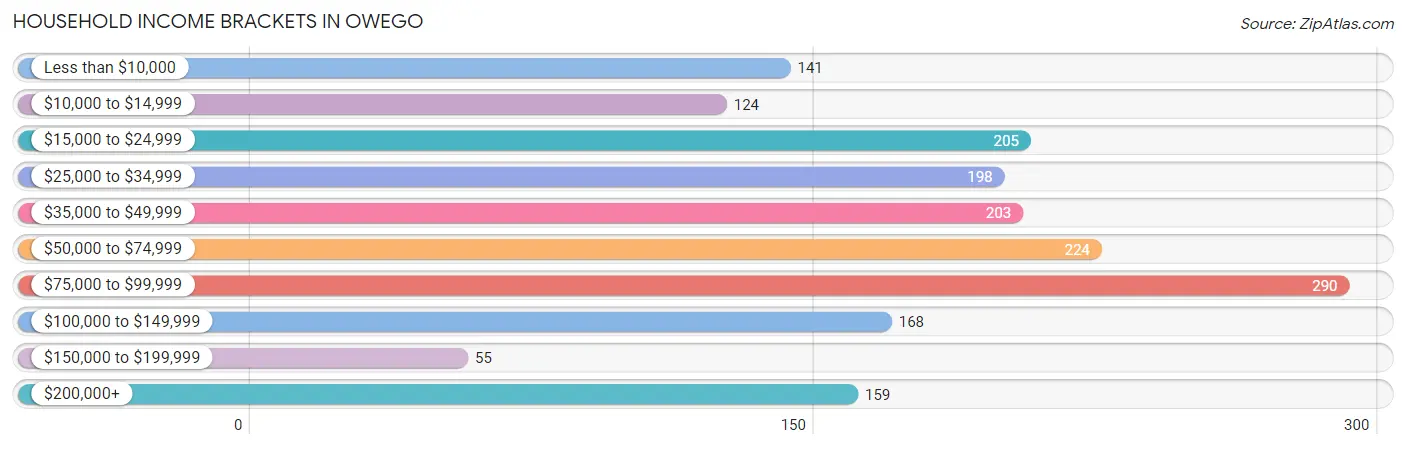
| Income Bracket | # Households | % Households |
| Less than $10,000 | 141 | 8.0% |
| $10,000 to $14,999 | 124 | 7.0% |
| $15,000 to $24,999 | 205 | 11.6% |
| $25,000 to $34,999 | 198 | 11.2% |
| $35,000 to $49,999 | 203 | 11.5% |
| $50,000 to $74,999 | 224 | 12.7% |
| $75,000 to $99,999 | 290 | 16.4% |
| $100,000 to $149,999 | 168 | 9.5% |
| $150,000 to $199,999 | 55 | 3.1% |
| $200,000+ | 159 | 9.0% |
Household Income by Householder Age in Owego
The median household income in Owego is $51,200, with the highest median household income of $71,429 found in the 45 to 64 years age bracket for the primary householder. A total of 632 households (35.8%) fall into this category. Meanwhile, the 15 to 24 years age bracket for the primary householder has the lowest median household income of $0, with 117 households (6.6%) in this group.
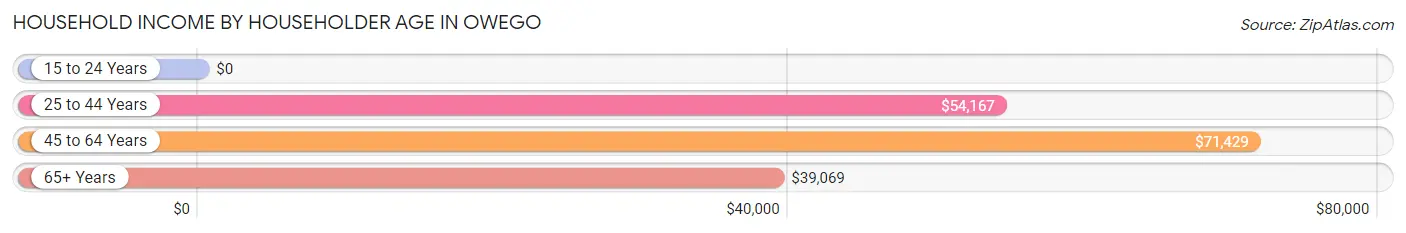
| Income Bracket | # Households | Median Income |
| 15 to 24 Years | 117 (6.6%) | $0 |
| 25 to 44 Years | 444 (25.1%) | $54,167 |
| 45 to 64 Years | 632 (35.8%) | $71,429 |
| 65+ Years | 573 (32.5%) | $39,069 |
| Total | 1,766 (100.0%) | $51,200 |
Poverty in Owego
Income Below Poverty by Sex and Age in Owego
With 15.7% poverty level for males and 18.4% for females among the residents of Owego, 6 to 11 year old males and 6 to 11 year old females are the most vulnerable to poverty, with 19 males (100.0%) and 19 females (100.0%) in their respective age groups living below the poverty level.
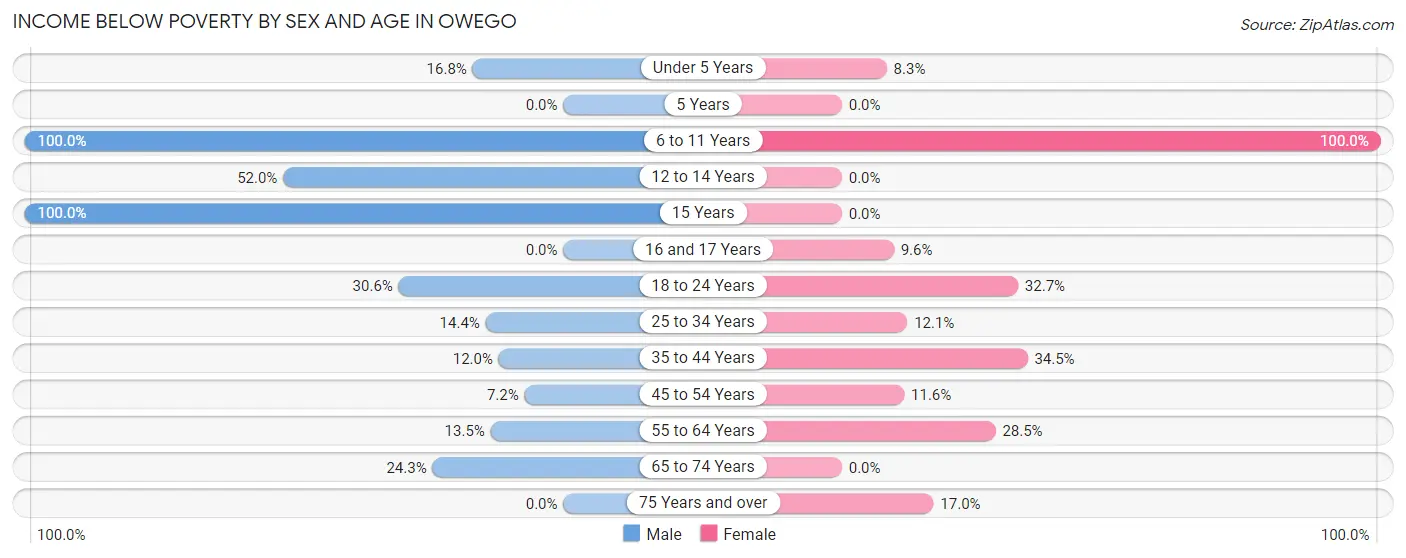
| Age Bracket | Male | Female |
| Under 5 Years | 34 (16.8%) | 9 (8.3%) |
| 5 Years | 0 (0.0%) | 0 (0.0%) |
| 6 to 11 Years | 19 (100.0%) | 19 (100.0%) |
| 12 to 14 Years | 13 (52.0%) | 0 (0.0%) |
| 15 Years | 13 (100.0%) | 0 (0.0%) |
| 16 and 17 Years | 0 (0.0%) | 8 (9.6%) |
| 18 to 24 Years | 48 (30.6%) | 51 (32.7%) |
| 25 to 34 Years | 15 (14.4%) | 25 (12.1%) |
| 35 to 44 Years | 26 (12.0%) | 92 (34.5%) |
| 45 to 54 Years | 17 (7.2%) | 31 (11.6%) |
| 55 to 64 Years | 29 (13.5%) | 83 (28.5%) |
| 65 to 74 Years | 34 (24.3%) | 0 (0.0%) |
| 75 Years and over | 0 (0.0%) | 42 (17.0%) |
| Total | 248 (15.7%) | 360 (18.4%) |
Income Above Poverty by Sex and Age in Owego
According to the poverty statistics in Owego, males aged 16 and 17 years and females aged 12 to 14 years are the age groups that are most secure financially, with 100.0% of males and 100.0% of females in these age groups living above the poverty line.
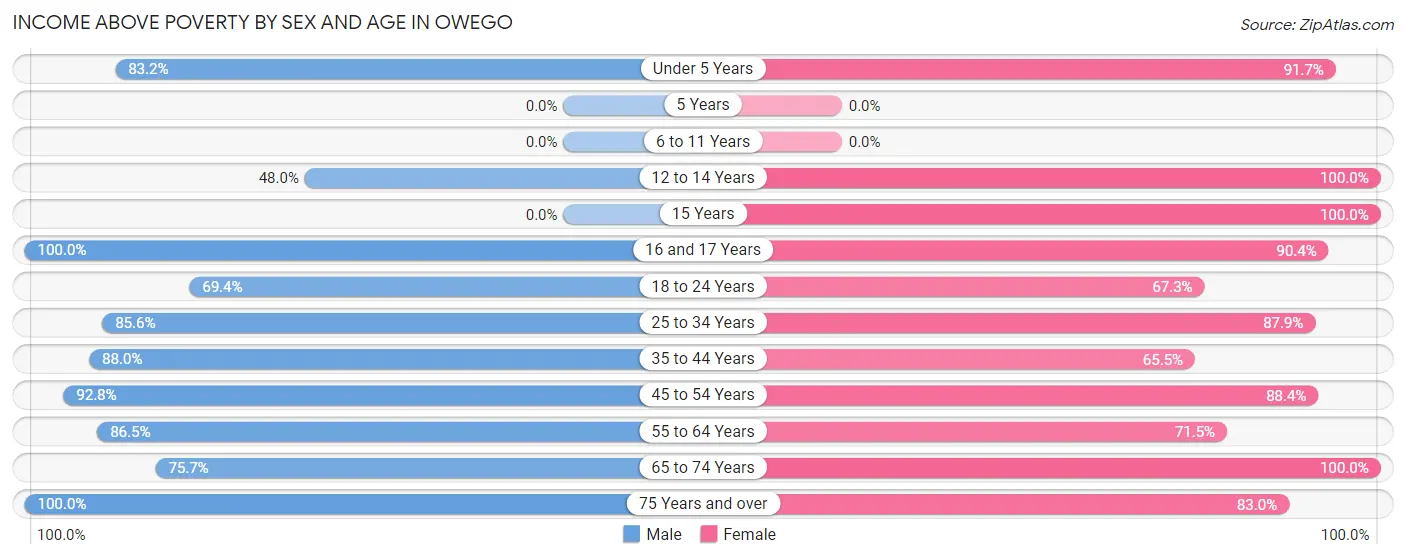
| Age Bracket | Male | Female |
| Under 5 Years | 168 (83.2%) | 99 (91.7%) |
| 5 Years | 0 (0.0%) | 0 (0.0%) |
| 6 to 11 Years | 0 (0.0%) | 0 (0.0%) |
| 12 to 14 Years | 12 (48.0%) | 84 (100.0%) |
| 15 Years | 0 (0.0%) | 29 (100.0%) |
| 16 and 17 Years | 140 (100.0%) | 75 (90.4%) |
| 18 to 24 Years | 109 (69.4%) | 105 (67.3%) |
| 25 to 34 Years | 89 (85.6%) | 181 (87.9%) |
| 35 to 44 Years | 191 (88.0%) | 175 (65.5%) |
| 45 to 54 Years | 219 (92.8%) | 237 (88.4%) |
| 55 to 64 Years | 186 (86.5%) | 208 (71.5%) |
| 65 to 74 Years | 106 (75.7%) | 196 (100.0%) |
| 75 Years and over | 114 (100.0%) | 205 (83.0%) |
| Total | 1,334 (84.3%) | 1,594 (81.6%) |
Income Below Poverty Among Married-Couple Families in Owego
The poverty statistics for married-couple families in Owego show that 7.5% or 35 of the total 467 families live below the poverty line. Families with 1 or 2 children have the highest poverty rate of 9.1%, comprising of 15 families. On the other hand, families with 3 or 4 children have the lowest poverty rate of 0.0%, which includes 0 families.
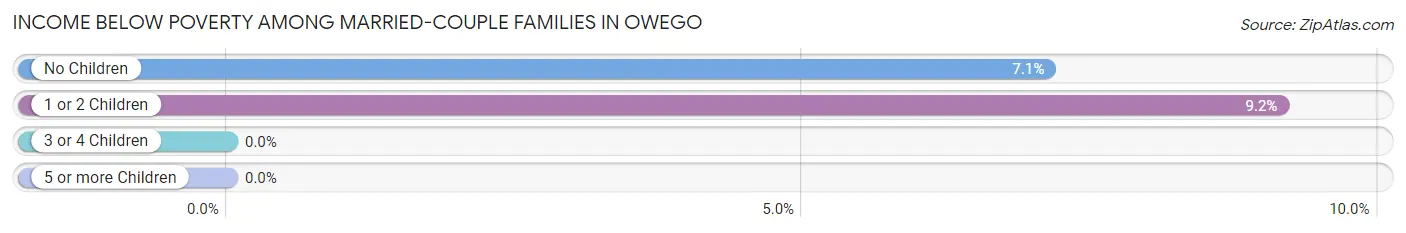
| Children | Above Poverty | Below Poverty |
| No Children | 261 (92.9%) | 20 (7.1%) |
| 1 or 2 Children | 149 (90.8%) | 15 (9.1%) |
| 3 or 4 Children | 22 (100.0%) | 0 (0.0%) |
| 5 or more Children | 0 (0.0%) | 0 (0.0%) |
| Total | 432 (92.5%) | 35 (7.5%) |
Income Below Poverty Among Single-Parent Households in Owego
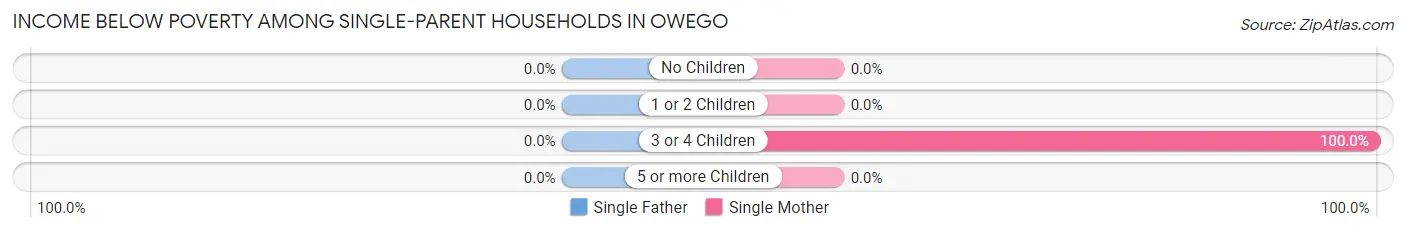
| Children | Single Father | Single Mother |
| No Children | 0 (0.0%) | 0 (0.0%) |
| 1 or 2 Children | 0 (0.0%) | 0 (0.0%) |
| 3 or 4 Children | 0 (0.0%) | 31 (100.0%) |
| 5 or more Children | 0 (0.0%) | 0 (0.0%) |
| Total | 0 (0.0%) | 31 (15.7%) |
Income Below Poverty Among Married-Couple vs Single-Parent Households in Owego
The poverty data for Owego shows that 35 of the married-couple family households (7.5%) and 31 of the single-parent households (10.7%) are living below the poverty level. Within the married-couple family households, those with 1 or 2 children have the highest poverty rate, with 15 households (9.1%) falling below the poverty line. Among the single-parent households, those with 3 or 4 children have the highest poverty rate, with 31 household (35.2%) living below poverty.
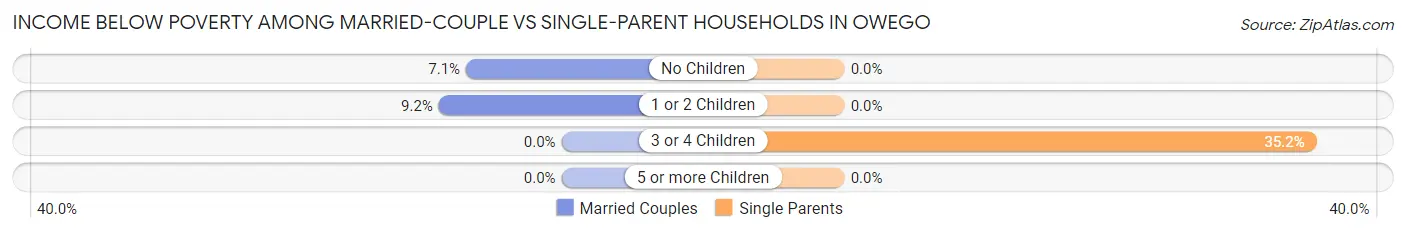
| Children | Married-Couple Families | Single-Parent Households |
| No Children | 20 (7.1%) | 0 (0.0%) |
| 1 or 2 Children | 15 (9.1%) | 0 (0.0%) |
| 3 or 4 Children | 0 (0.0%) | 31 (35.2%) |
| 5 or more Children | 0 (0.0%) | 0 (0.0%) |
| Total | 35 (7.5%) | 31 (10.7%) |
Employment Characteristics in Owego
Employment by Class of Employer in Owego
Among the 1,584 employed individuals in Owego, private company employees (803 | 50.7%), not-for-profit organizations (239 | 15.1%), and state government employees (218 | 13.8%) make up the most common classes of employment.
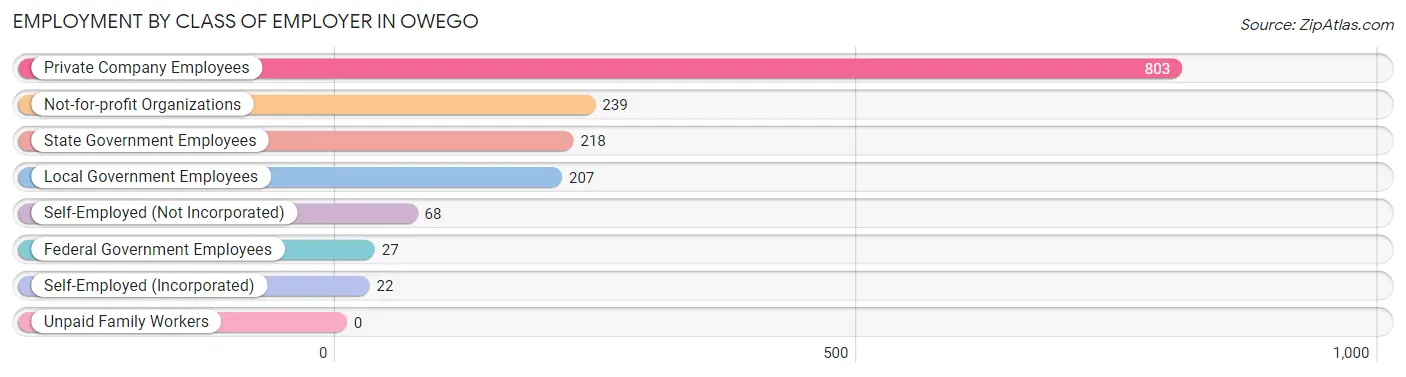
| Employer Class | # Employees | % Employees |
| Private Company Employees | 803 | 50.7% |
| Self-Employed (Incorporated) | 22 | 1.4% |
| Self-Employed (Not Incorporated) | 68 | 4.3% |
| Not-for-profit Organizations | 239 | 15.1% |
| Local Government Employees | 207 | 13.1% |
| State Government Employees | 218 | 13.8% |
| Federal Government Employees | 27 | 1.7% |
| Unpaid Family Workers | 0 | 0.0% |
| Total | 1,584 | 100.0% |
Employment Status by Age in Owego
According to the labor force statistics for Owego, out of the total population over 16 years of age (3,102), 52.7% or 1,635 individuals are in the labor force, with 3.1% or 51 of them unemployed. The age group with the highest labor force participation rate is 30 to 34 years, with 100.0% or 81 individuals in the labor force. Within the labor force, the 60 to 64 years age range has the highest percentage of unemployed individuals, with 11.3% or 15 of them being unemployed.
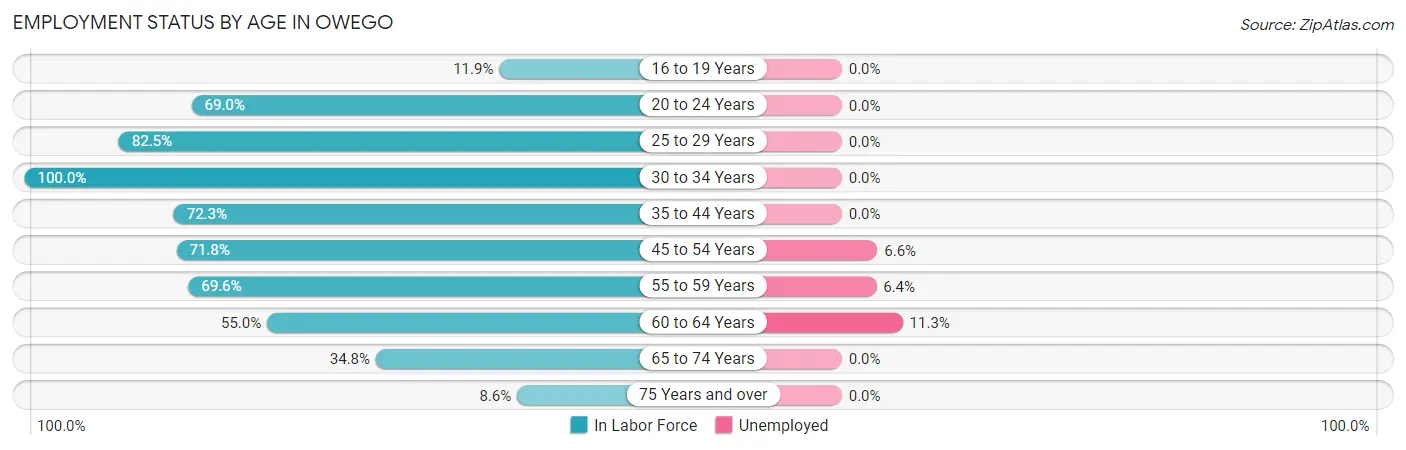
| Age Bracket | In Labor Force | Unemployed |
| 16 to 19 Years | 40 (11.9%) | 0 (0.0%) |
| 20 to 24 Years | 138 (69.0%) | 0 (0.0%) |
| 25 to 29 Years | 189 (82.5%) | 0 (0.0%) |
| 30 to 34 Years | 81 (100.0%) | 0 (0.0%) |
| 35 to 44 Years | 350 (72.3%) | 0 (0.0%) |
| 45 to 54 Years | 362 (71.8%) | 24 (6.6%) |
| 55 to 59 Years | 188 (69.6%) | 12 (6.4%) |
| 60 to 64 Years | 133 (55.0%) | 15 (11.3%) |
| 65 to 74 Years | 118 (34.8%) | 0 (0.0%) |
| 75 Years and over | 36 (8.6%) | 0 (0.0%) |
| Total | 1,635 (52.7%) | 51 (3.1%) |
Employment Status by Educational Attainment in Owego
According to labor force statistics for Owego, 72.0% of individuals (1,303) out of the total population between 25 and 64 years of age (1,810) are in the labor force, with 3.9% or 51 of them being unemployed. The group with the highest labor force participation rate are those with the educational attainment of bachelor's degree or higher, with 80.2% or 547 individuals in the labor force. Within the labor force, individuals with college / associate degree education have the highest percentage of unemployment, with 9.1% or 37 of them being unemployed.
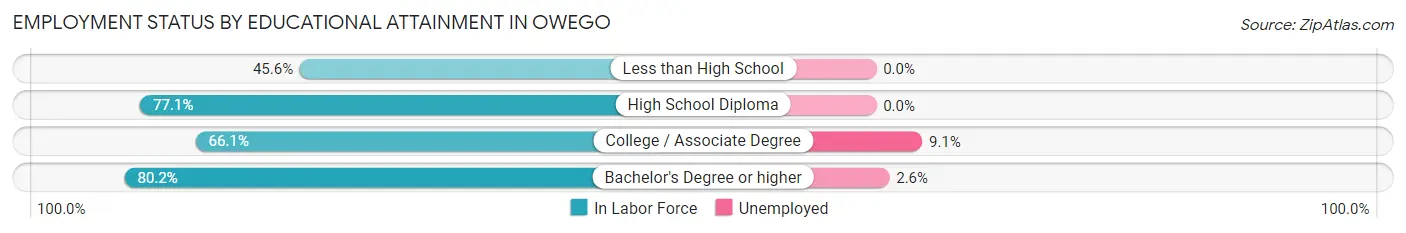
| Educational Attainment | In Labor Force | Unemployed |
| Less than High School | 67 (45.6%) | 0 (0.0%) |
| High School Diploma | 283 (77.1%) | 0 (0.0%) |
| College / Associate Degree | 406 (66.1%) | 56 (9.1%) |
| Bachelor's Degree or higher | 547 (80.2%) | 18 (2.6%) |
| Total | 1,303 (72.0%) | 71 (3.9%) |
Employment Occupations by Sex in Owego
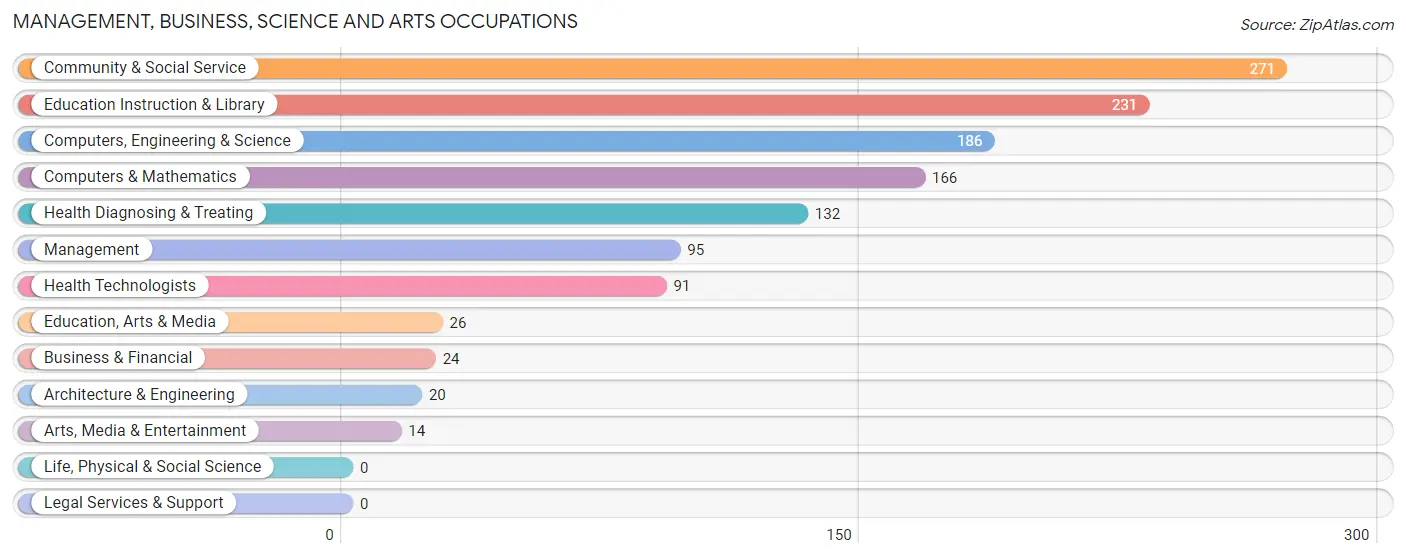
Management, Business, Science and Arts Occupations
The most common Management, Business, Science and Arts occupations in Owego are Community & Social Service (271 | 17.1%), Education Instruction & Library (231 | 14.6%), Computers, Engineering & Science (186 | 11.7%), Computers & Mathematics (166 | 10.5%), and Health Diagnosing & Treating (132 | 8.3%).
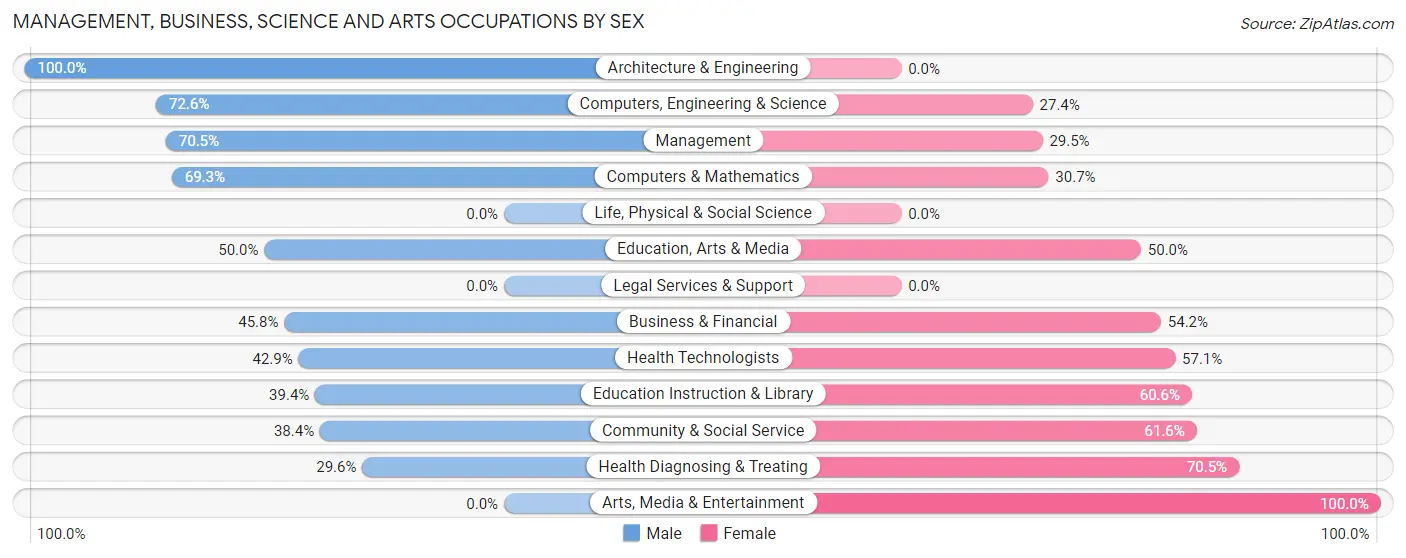
Management, Business, Science and Arts Occupations by Sex
Within the Management, Business, Science and Arts occupations in Owego, the most male-oriented occupations are Architecture & Engineering (100.0%), Computers, Engineering & Science (72.6%), and Management (70.5%), while the most female-oriented occupations are Arts, Media & Entertainment (100.0%), Health Diagnosing & Treating (70.5%), and Community & Social Service (61.6%).
| Occupation | Male | Female |
| Management | 67 (70.5%) | 28 (29.5%) |
| Business & Financial | 11 (45.8%) | 13 (54.2%) |
| Computers, Engineering & Science | 135 (72.6%) | 51 (27.4%) |
| Computers & Mathematics | 115 (69.3%) | 51 (30.7%) |
| Architecture & Engineering | 20 (100.0%) | 0 (0.0%) |
| Life, Physical & Social Science | 0 (0.0%) | 0 (0.0%) |
| Community & Social Service | 104 (38.4%) | 167 (61.6%) |
| Education, Arts & Media | 13 (50.0%) | 13 (50.0%) |
| Legal Services & Support | 0 (0.0%) | 0 (0.0%) |
| Education Instruction & Library | 91 (39.4%) | 140 (60.6%) |
| Arts, Media & Entertainment | 0 (0.0%) | 14 (100.0%) |
| Health Diagnosing & Treating | 39 (29.5%) | 93 (70.5%) |
| Health Technologists | 39 (42.9%) | 52 (57.1%) |
| Total (Category) | 356 (50.3%) | 352 (49.7%) |
| Total (Overall) | 847 (53.5%) | 737 (46.5%) |
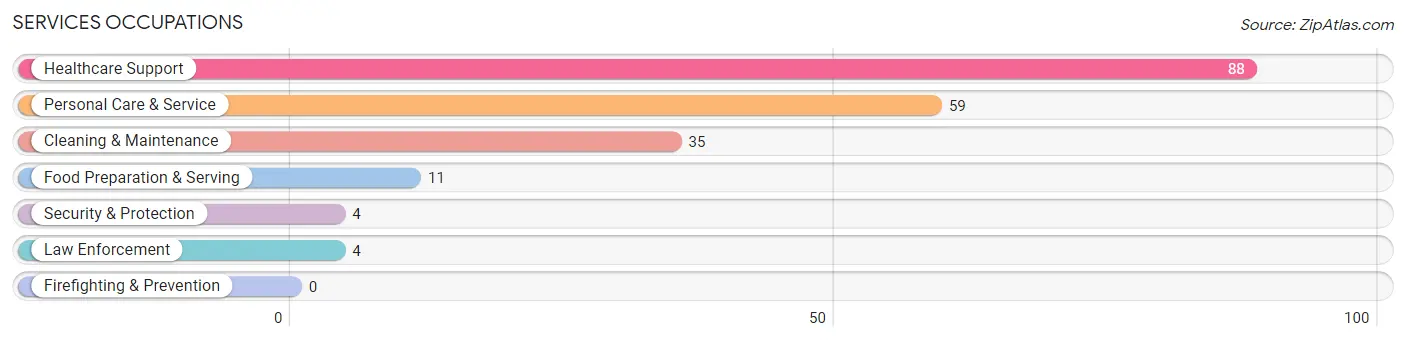
Services Occupations
The most common Services occupations in Owego are Healthcare Support (88 | 5.6%), Personal Care & Service (59 | 3.7%), Cleaning & Maintenance (35 | 2.2%), Food Preparation & Serving (11 | 0.7%), and Security & Protection (4 | 0.3%).
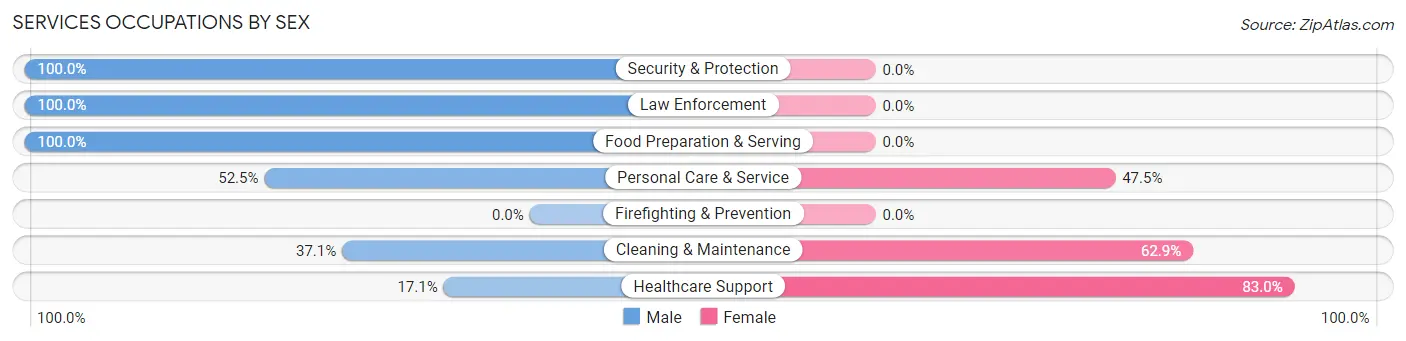
Services Occupations by Sex
Within the Services occupations in Owego, the most male-oriented occupations are Security & Protection (100.0%), Law Enforcement (100.0%), and Food Preparation & Serving (100.0%), while the most female-oriented occupations are Healthcare Support (83.0%), Cleaning & Maintenance (62.9%), and Personal Care & Service (47.5%).
| Occupation | Male | Female |
| Healthcare Support | 15 (17.1%) | 73 (83.0%) |
| Security & Protection | 4 (100.0%) | 0 (0.0%) |
| Firefighting & Prevention | 0 (0.0%) | 0 (0.0%) |
| Law Enforcement | 4 (100.0%) | 0 (0.0%) |
| Food Preparation & Serving | 11 (100.0%) | 0 (0.0%) |
| Cleaning & Maintenance | 13 (37.1%) | 22 (62.9%) |
| Personal Care & Service | 31 (52.5%) | 28 (47.5%) |
| Total (Category) | 74 (37.6%) | 123 (62.4%) |
| Total (Overall) | 847 (53.5%) | 737 (46.5%) |
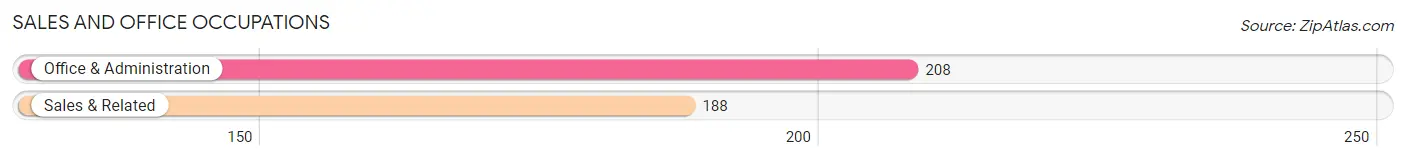
Sales and Office Occupations
The most common Sales and Office occupations in Owego are Office & Administration (208 | 13.1%), and Sales & Related (188 | 11.9%).
Sales and Office Occupations by Sex
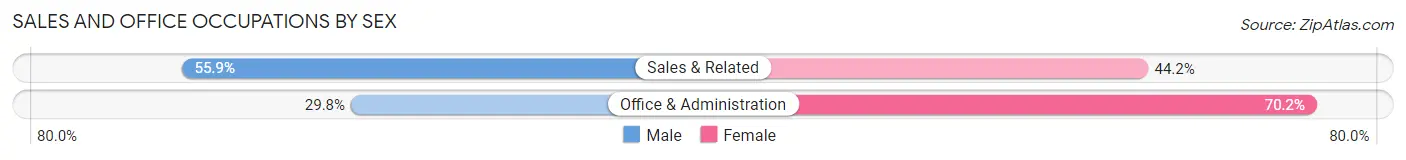
| Occupation | Male | Female |
| Sales & Related | 105 (55.8%) | 83 (44.2%) |
| Office & Administration | 62 (29.8%) | 146 (70.2%) |
| Total (Category) | 167 (42.2%) | 229 (57.8%) |
| Total (Overall) | 847 (53.5%) | 737 (46.5%) |
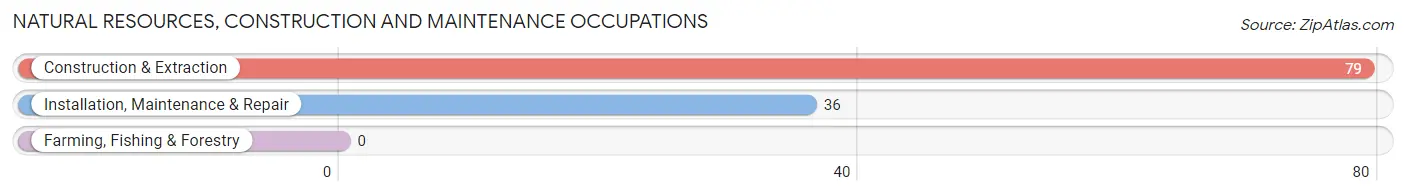
Natural Resources, Construction and Maintenance Occupations
The most common Natural Resources, Construction and Maintenance occupations in Owego are Construction & Extraction (79 | 5.0%), and Installation, Maintenance & Repair (36 | 2.3%).
Natural Resources, Construction and Maintenance Occupations by Sex
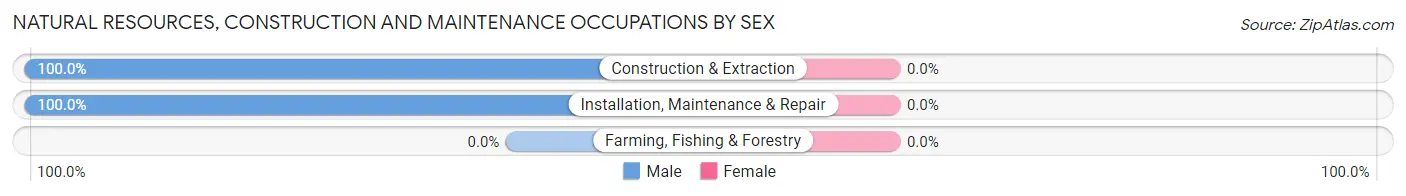
| Occupation | Male | Female |
| Farming, Fishing & Forestry | 0 (0.0%) | 0 (0.0%) |
| Construction & Extraction | 79 (100.0%) | 0 (0.0%) |
| Installation, Maintenance & Repair | 36 (100.0%) | 0 (0.0%) |
| Total (Category) | 115 (100.0%) | 0 (0.0%) |
| Total (Overall) | 847 (53.5%) | 737 (46.5%) |
Production, Transportation and Moving Occupations
The most common Production, Transportation and Moving occupations in Owego are Production (64 | 4.0%), Transportation (64 | 4.0%), and Material Moving (40 | 2.5%).
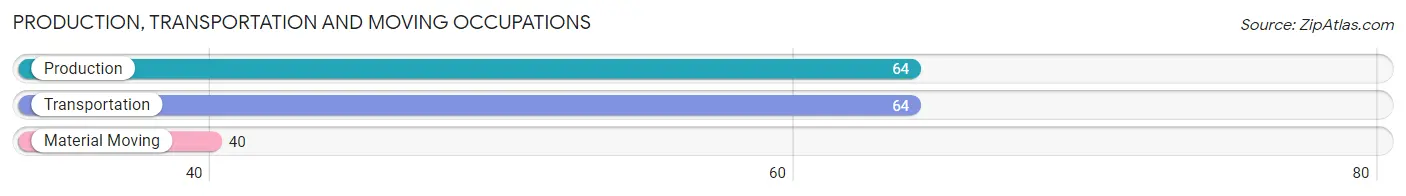
Production, Transportation and Moving Occupations by Sex
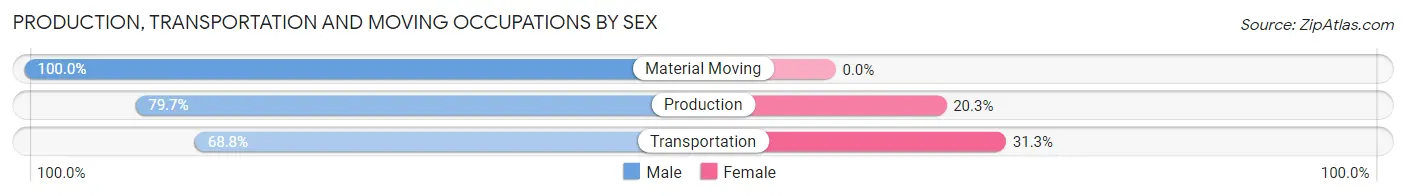
| Occupation | Male | Female |
| Production | 51 (79.7%) | 13 (20.3%) |
| Transportation | 44 (68.8%) | 20 (31.2%) |
| Material Moving | 40 (100.0%) | 0 (0.0%) |
| Total (Category) | 135 (80.4%) | 33 (19.6%) |
| Total (Overall) | 847 (53.5%) | 737 (46.5%) |
Employment Industries by Sex in Owego
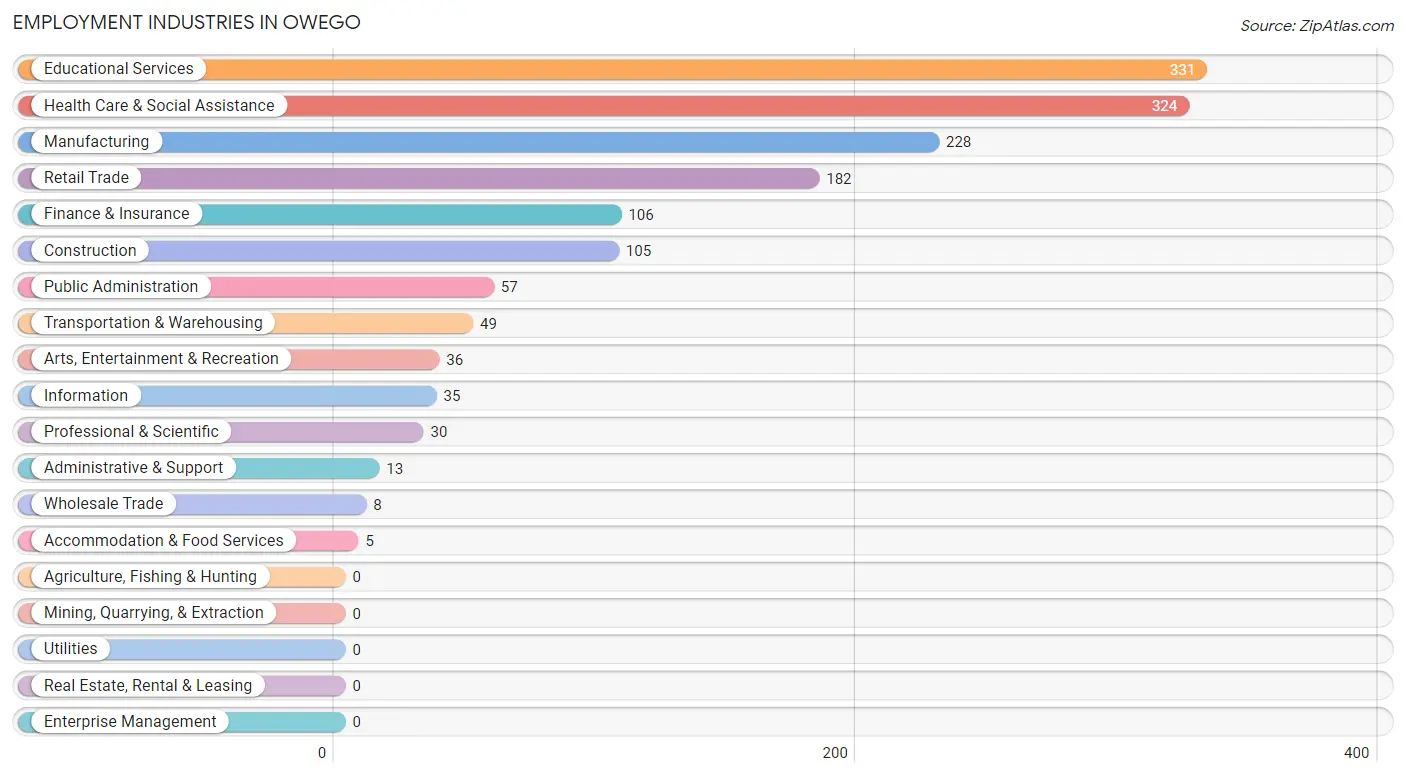
Employment Industries in Owego
The major employment industries in Owego include Educational Services (331 | 20.9%), Health Care & Social Assistance (324 | 20.4%), Manufacturing (228 | 14.4%), Retail Trade (182 | 11.5%), and Finance & Insurance (106 | 6.7%).
Employment Industries by Sex in Owego
The Owego industries that see more men than women are Wholesale Trade (100.0%), Professional & Scientific (100.0%), and Arts, Entertainment & Recreation (100.0%), whereas the industries that tend to have a higher number of women are Administrative & Support (100.0%), Accommodation & Food Services (100.0%), and Information (74.3%).
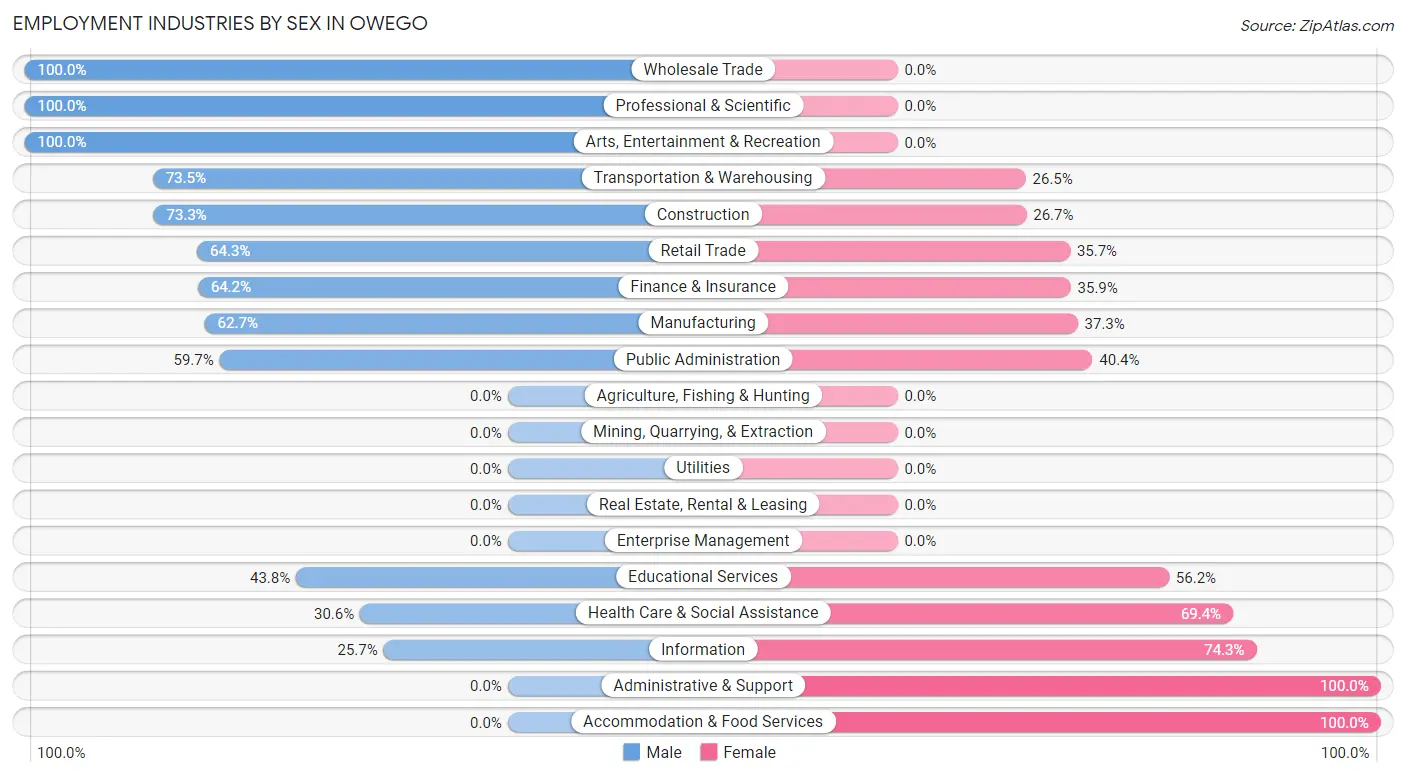
| Industry | Male | Female |
| Agriculture, Fishing & Hunting | 0 (0.0%) | 0 (0.0%) |
| Mining, Quarrying, & Extraction | 0 (0.0%) | 0 (0.0%) |
| Construction | 77 (73.3%) | 28 (26.7%) |
| Manufacturing | 143 (62.7%) | 85 (37.3%) |
| Wholesale Trade | 8 (100.0%) | 0 (0.0%) |
| Retail Trade | 117 (64.3%) | 65 (35.7%) |
| Transportation & Warehousing | 36 (73.5%) | 13 (26.5%) |
| Utilities | 0 (0.0%) | 0 (0.0%) |
| Information | 9 (25.7%) | 26 (74.3%) |
| Finance & Insurance | 68 (64.1%) | 38 (35.8%) |
| Real Estate, Rental & Leasing | 0 (0.0%) | 0 (0.0%) |
| Professional & Scientific | 30 (100.0%) | 0 (0.0%) |
| Enterprise Management | 0 (0.0%) | 0 (0.0%) |
| Administrative & Support | 0 (0.0%) | 13 (100.0%) |
| Educational Services | 145 (43.8%) | 186 (56.2%) |
| Health Care & Social Assistance | 99 (30.6%) | 225 (69.4%) |
| Arts, Entertainment & Recreation | 36 (100.0%) | 0 (0.0%) |
| Accommodation & Food Services | 0 (0.0%) | 5 (100.0%) |
| Public Administration | 34 (59.7%) | 23 (40.4%) |
| Total | 847 (53.5%) | 737 (46.5%) |
Education in Owego
School Enrollment in Owego
The most common levels of schooling among the 715 students in Owego are high school (258 | 36.1%), middle school (245 | 34.3%), and college / undergraduate (146 | 20.4%).
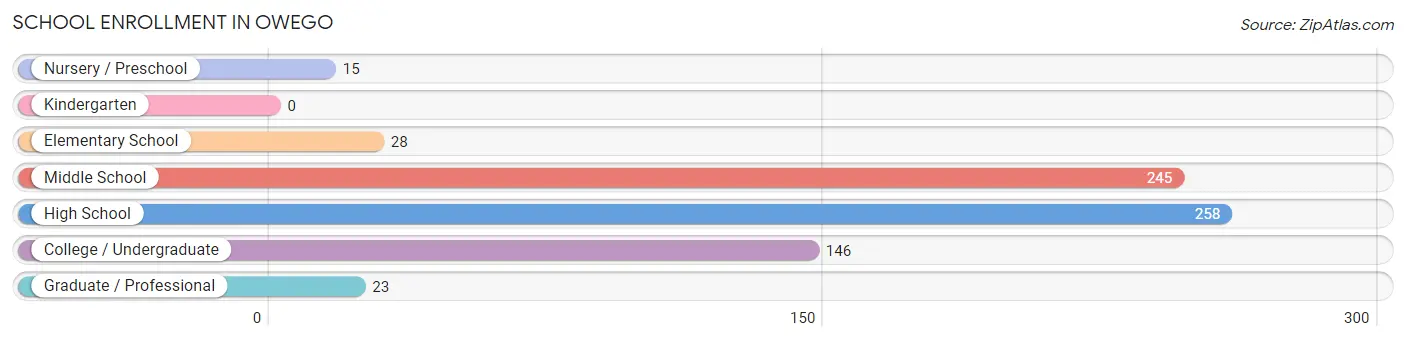
| School Level | # Students | % Students |
| Nursery / Preschool | 15 | 2.1% |
| Kindergarten | 0 | 0.0% |
| Elementary School | 28 | 3.9% |
| Middle School | 245 | 34.3% |
| High School | 258 | 36.1% |
| College / Undergraduate | 146 | 20.4% |
| Graduate / Professional | 23 | 3.2% |
| Total | 715 | 100.0% |
School Enrollment by Age by Funding Source in Owego
Out of a total of 715 students who are enrolled in schools in Owego, 110 (15.4%) attend a private institution, while the remaining 605 (84.6%) are enrolled in public schools. The age group of 20 to 24 year olds has the highest likelihood of being enrolled in private schools, with 43 (32.6% in the age bracket) enrolled. Conversely, the age group of 3 to 4 year olds has the lowest likelihood of being enrolled in a private school, with 15 (100.0% in the age bracket) attending a public institution.
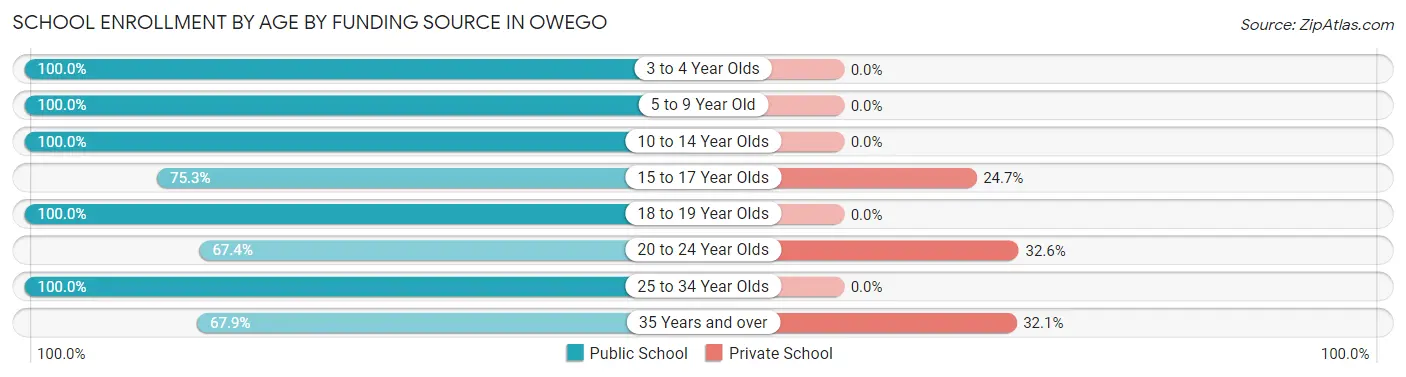
| Age Bracket | Public School | Private School |
| 3 to 4 Year Olds | 15 (100.0%) | 0 (0.0%) |
| 5 to 9 Year Old | 28 (100.0%) | 0 (0.0%) |
| 10 to 14 Year Olds | 216 (100.0%) | 0 (0.0%) |
| 15 to 17 Year Olds | 177 (75.3%) | 58 (24.7%) |
| 18 to 19 Year Olds | 41 (100.0%) | 0 (0.0%) |
| 20 to 24 Year Olds | 89 (67.4%) | 43 (32.6%) |
| 25 to 34 Year Olds | 20 (100.0%) | 0 (0.0%) |
| 35 Years and over | 19 (67.9%) | 9 (32.1%) |
| Total | 605 (84.6%) | 110 (15.4%) |
Educational Attainment by Field of Study in Owego
Education (178 | 19.9%), science & technology (122 | 13.7%), computers & mathematics (91 | 10.2%), bio, nature & agricultural (88 | 9.9%), and engineering (83 | 9.3%) are the most common fields of study among 893 individuals in Owego who have obtained a bachelor's degree or higher.
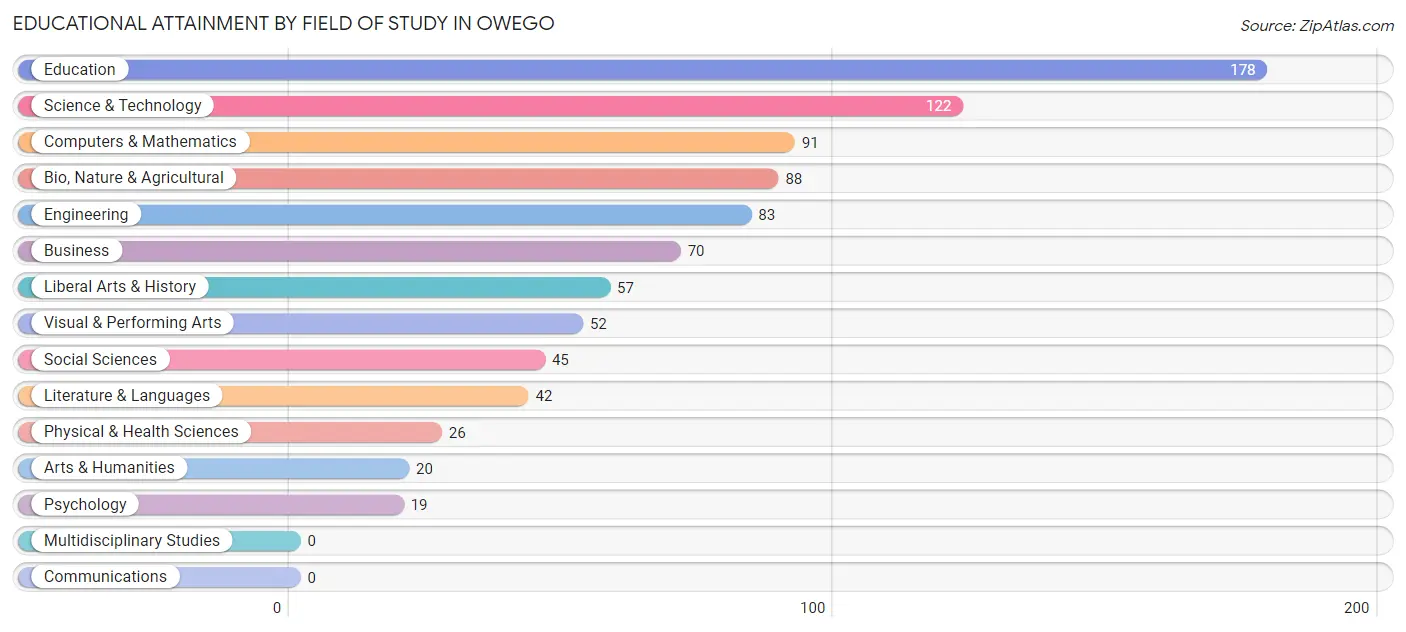
| Field of Study | # Graduates | % Graduates |
| Computers & Mathematics | 91 | 10.2% |
| Bio, Nature & Agricultural | 88 | 9.9% |
| Physical & Health Sciences | 26 | 2.9% |
| Psychology | 19 | 2.1% |
| Social Sciences | 45 | 5.0% |
| Engineering | 83 | 9.3% |
| Multidisciplinary Studies | 0 | 0.0% |
| Science & Technology | 122 | 13.7% |
| Business | 70 | 7.8% |
| Education | 178 | 19.9% |
| Literature & Languages | 42 | 4.7% |
| Liberal Arts & History | 57 | 6.4% |
| Visual & Performing Arts | 52 | 5.8% |
| Communications | 0 | 0.0% |
| Arts & Humanities | 20 | 2.2% |
| Total | 893 | 100.0% |
Transportation & Commute in Owego
Vehicle Availability by Sex in Owego
The most prevalent vehicle ownership categories in Owego are males with 2 vehicles (367, accounting for 43.9%) and females with 2 vehicles (302, making up 49.8%).
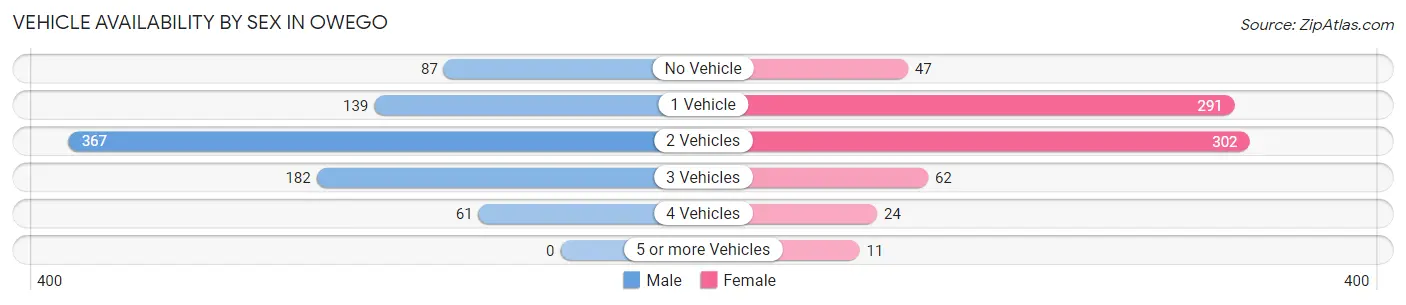
| Vehicles Available | Male | Female |
| No Vehicle | 87 (10.4%) | 47 (6.4%) |
| 1 Vehicle | 139 (16.6%) | 291 (39.5%) |
| 2 Vehicles | 367 (43.9%) | 302 (41.0%) |
| 3 Vehicles | 182 (21.8%) | 62 (8.4%) |
| 4 Vehicles | 61 (7.3%) | 24 (3.3%) |
| 5 or more Vehicles | 0 (0.0%) | 11 (1.5%) |
| Total | 836 (100.0%) | 737 (100.0%) |
Commute Time in Owego
The most frequently occuring commute durations in Owego are 5 to 9 minutes (433 commuters, 29.5%), 30 to 34 minutes (203 commuters, 13.9%), and 10 to 14 minutes (199 commuters, 13.6%).
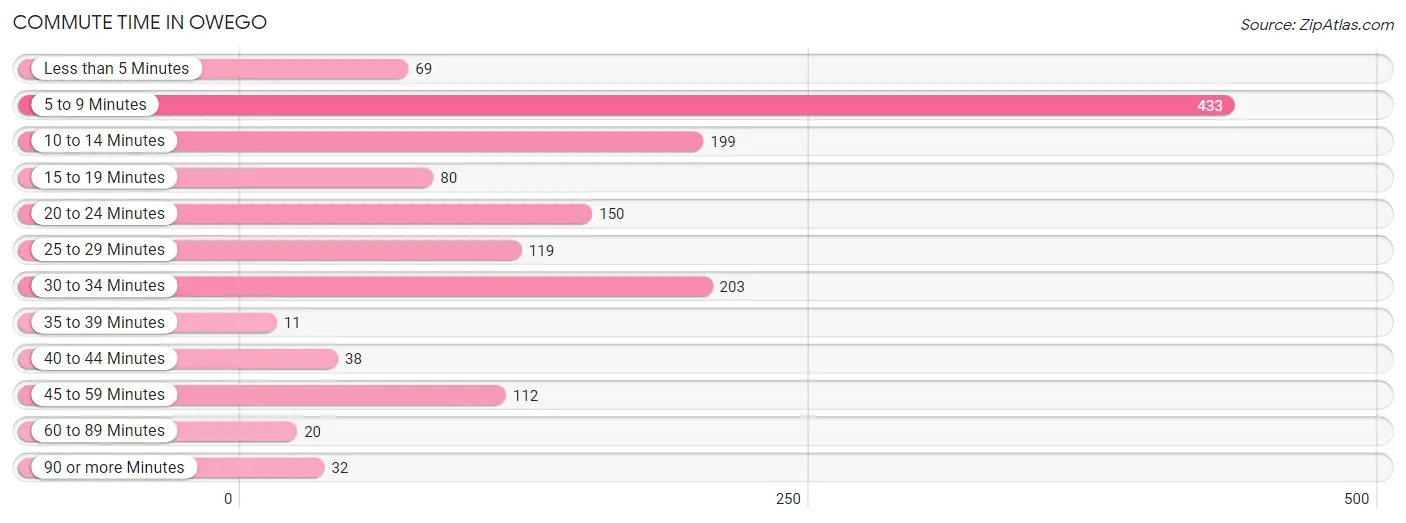
| Commute Time | # Commuters | % Commuters |
| Less than 5 Minutes | 69 | 4.7% |
| 5 to 9 Minutes | 433 | 29.5% |
| 10 to 14 Minutes | 199 | 13.6% |
| 15 to 19 Minutes | 80 | 5.5% |
| 20 to 24 Minutes | 150 | 10.2% |
| 25 to 29 Minutes | 119 | 8.1% |
| 30 to 34 Minutes | 203 | 13.9% |
| 35 to 39 Minutes | 11 | 0.7% |
| 40 to 44 Minutes | 38 | 2.6% |
| 45 to 59 Minutes | 112 | 7.6% |
| 60 to 89 Minutes | 20 | 1.4% |
| 90 or more Minutes | 32 | 2.2% |
Commute Time by Sex in Owego
The most common commute times in Owego are 5 to 9 minutes (229 commuters, 27.9%) for males and 5 to 9 minutes (204 commuters, 31.6%) for females.
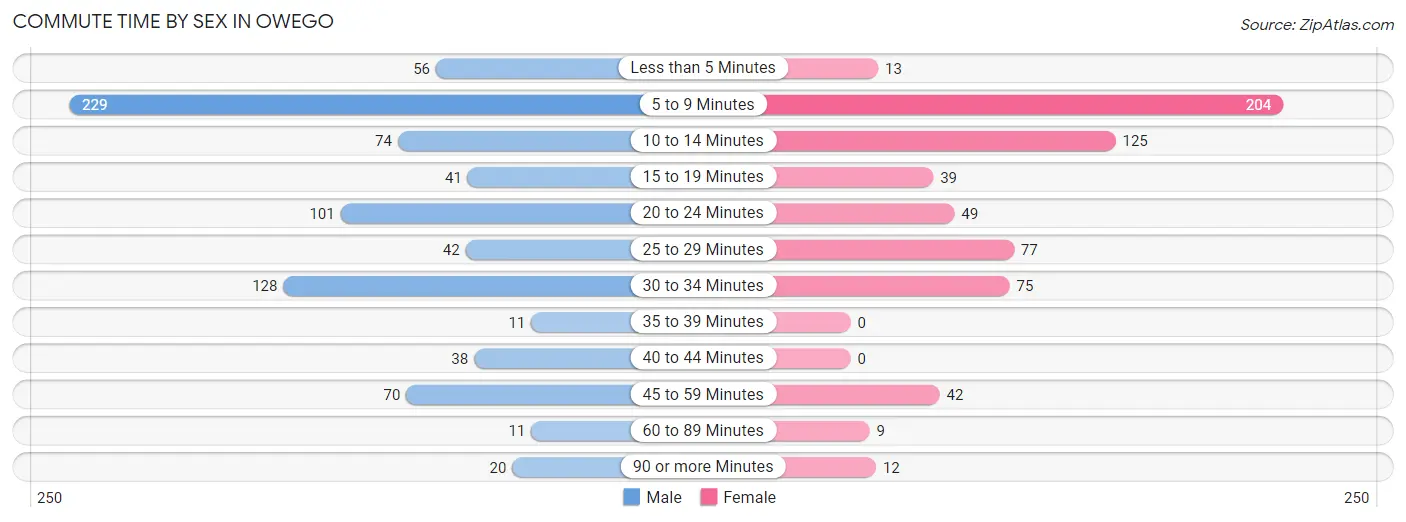
| Commute Time | Male | Female |
| Less than 5 Minutes | 56 (6.8%) | 13 (2.0%) |
| 5 to 9 Minutes | 229 (27.9%) | 204 (31.6%) |
| 10 to 14 Minutes | 74 (9.0%) | 125 (19.4%) |
| 15 to 19 Minutes | 41 (5.0%) | 39 (6.0%) |
| 20 to 24 Minutes | 101 (12.3%) | 49 (7.6%) |
| 25 to 29 Minutes | 42 (5.1%) | 77 (11.9%) |
| 30 to 34 Minutes | 128 (15.6%) | 75 (11.6%) |
| 35 to 39 Minutes | 11 (1.3%) | 0 (0.0%) |
| 40 to 44 Minutes | 38 (4.6%) | 0 (0.0%) |
| 45 to 59 Minutes | 70 (8.5%) | 42 (6.5%) |
| 60 to 89 Minutes | 11 (1.3%) | 9 (1.4%) |
| 90 or more Minutes | 20 (2.4%) | 12 (1.9%) |
Time of Departure to Work by Sex in Owego
The most frequent times of departure to work in Owego are 8:00 AM to 8:29 AM (183, 22.3%) for males and 7:00 AM to 7:29 AM (171, 26.5%) for females.
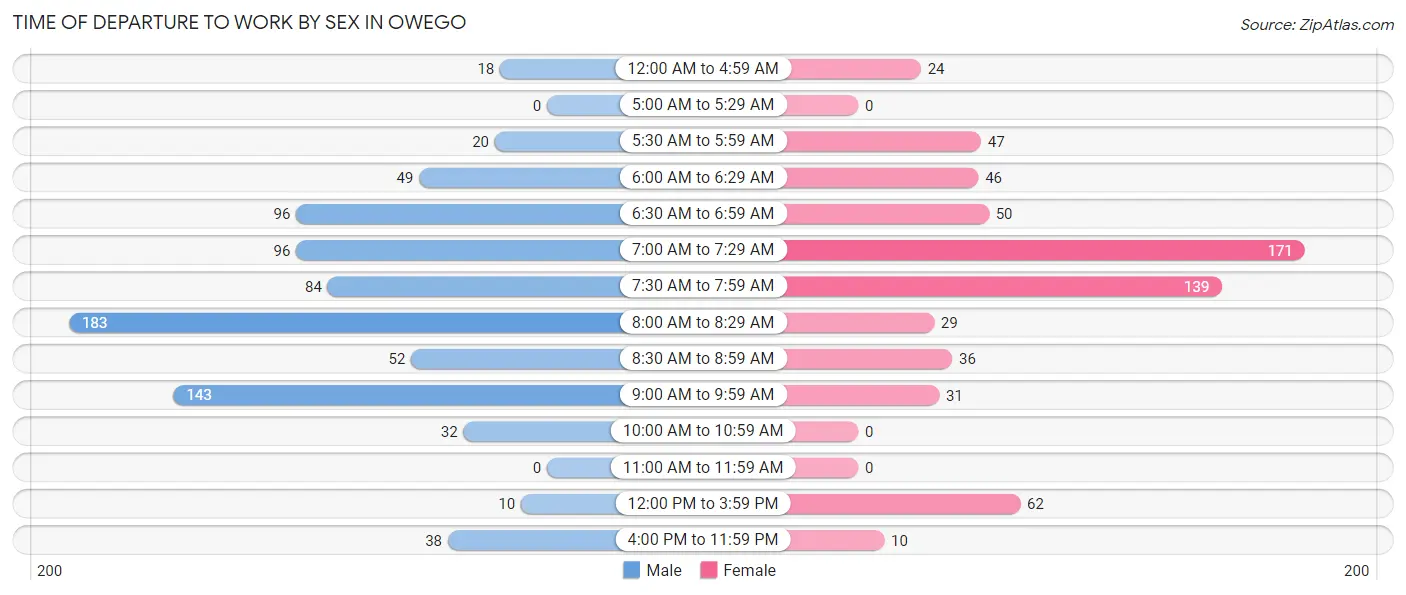
| Time of Departure | Male | Female |
| 12:00 AM to 4:59 AM | 18 (2.2%) | 24 (3.7%) |
| 5:00 AM to 5:29 AM | 0 (0.0%) | 0 (0.0%) |
| 5:30 AM to 5:59 AM | 20 (2.4%) | 47 (7.3%) |
| 6:00 AM to 6:29 AM | 49 (6.0%) | 46 (7.1%) |
| 6:30 AM to 6:59 AM | 96 (11.7%) | 50 (7.7%) |
| 7:00 AM to 7:29 AM | 96 (11.7%) | 171 (26.5%) |
| 7:30 AM to 7:59 AM | 84 (10.2%) | 139 (21.5%) |
| 8:00 AM to 8:29 AM | 183 (22.3%) | 29 (4.5%) |
| 8:30 AM to 8:59 AM | 52 (6.3%) | 36 (5.6%) |
| 9:00 AM to 9:59 AM | 143 (17.4%) | 31 (4.8%) |
| 10:00 AM to 10:59 AM | 32 (3.9%) | 0 (0.0%) |
| 11:00 AM to 11:59 AM | 0 (0.0%) | 0 (0.0%) |
| 12:00 PM to 3:59 PM | 10 (1.2%) | 62 (9.6%) |
| 4:00 PM to 11:59 PM | 38 (4.6%) | 10 (1.5%) |
| Total | 821 (100.0%) | 645 (100.0%) |
Housing Occupancy in Owego
Occupancy by Ownership in Owego
Of the total 1,766 dwellings in Owego, owner-occupied units account for 863 (48.9%), while renter-occupied units make up 903 (51.1%).
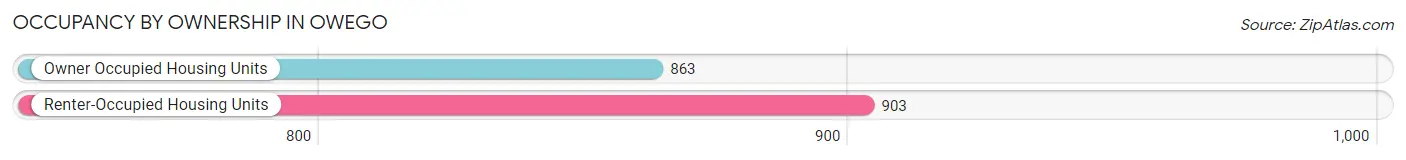
| Occupancy | # Housing Units | % Housing Units |
| Owner Occupied Housing Units | 863 | 48.9% |
| Renter-Occupied Housing Units | 903 | 51.1% |
| Total Occupied Housing Units | 1,766 | 100.0% |
Occupancy by Household Size in Owego
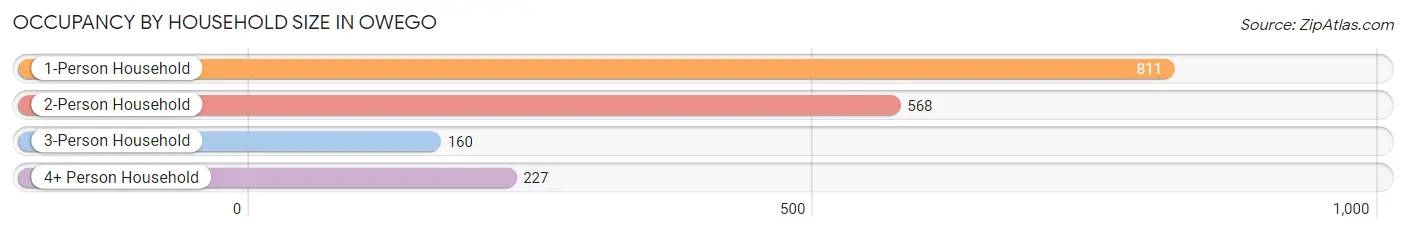
| Household Size | # Housing Units | % Housing Units |
| 1-Person Household | 811 | 45.9% |
| 2-Person Household | 568 | 32.2% |
| 3-Person Household | 160 | 9.1% |
| 4+ Person Household | 227 | 12.9% |
| Total Housing Units | 1,766 | 100.0% |
Occupancy by Ownership by Household Size in Owego
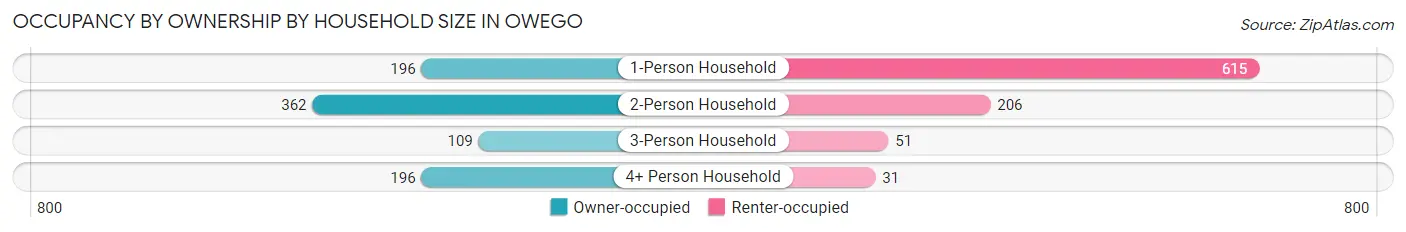
| Household Size | Owner-occupied | Renter-occupied |
| 1-Person Household | 196 (24.2%) | 615 (75.8%) |
| 2-Person Household | 362 (63.7%) | 206 (36.3%) |
| 3-Person Household | 109 (68.1%) | 51 (31.9%) |
| 4+ Person Household | 196 (86.3%) | 31 (13.7%) |
| Total Housing Units | 863 (48.9%) | 903 (51.1%) |
Occupancy by Educational Attainment in Owego
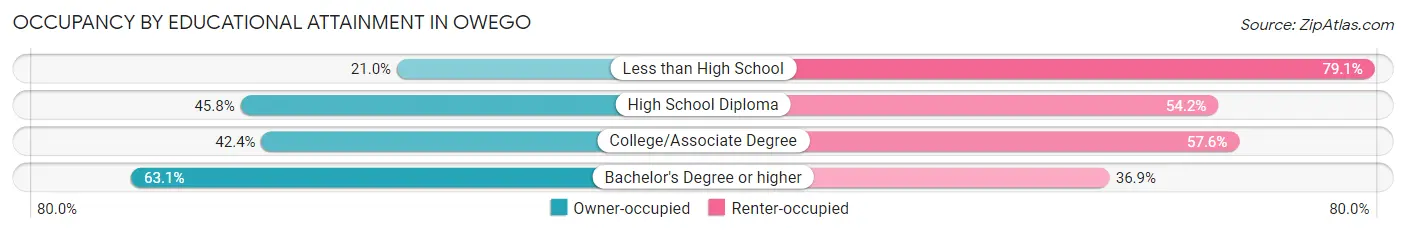
| Household Size | Owner-occupied | Renter-occupied |
| Less than High School | 31 (20.9%) | 117 (79.0%) |
| High School Diploma | 221 (45.8%) | 262 (54.2%) |
| College/Associate Degree | 216 (42.4%) | 293 (57.6%) |
| Bachelor's Degree or higher | 395 (63.1%) | 231 (36.9%) |
Occupancy by Age of Householder in Owego
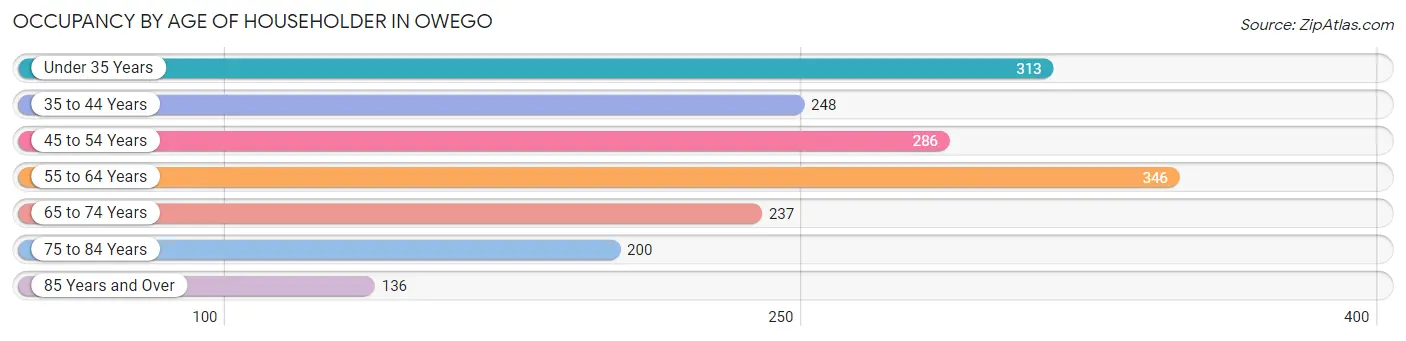
| Age Bracket | # Households | % Households |
| Under 35 Years | 313 | 17.7% |
| 35 to 44 Years | 248 | 14.0% |
| 45 to 54 Years | 286 | 16.2% |
| 55 to 64 Years | 346 | 19.6% |
| 65 to 74 Years | 237 | 13.4% |
| 75 to 84 Years | 200 | 11.3% |
| 85 Years and Over | 136 | 7.7% |
| Total | 1,766 | 100.0% |
Housing Finances in Owego
Median Income by Occupancy in Owego
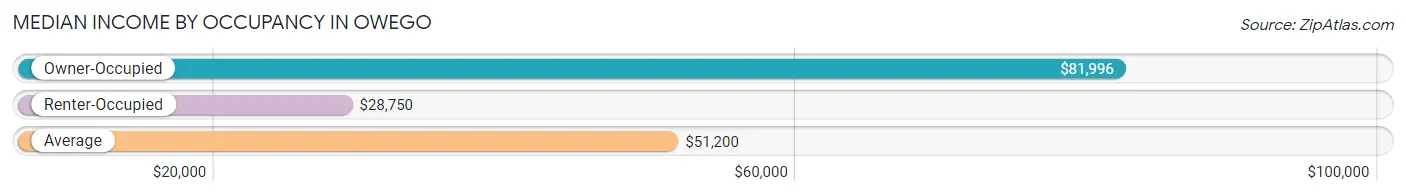
| Occupancy Type | # Households | Median Income |
| Owner-Occupied | 863 (48.9%) | $81,996 |
| Renter-Occupied | 903 (51.1%) | $28,750 |
| Average | 1,766 (100.0%) | $51,200 |
Occupancy by Householder Income Bracket in Owego
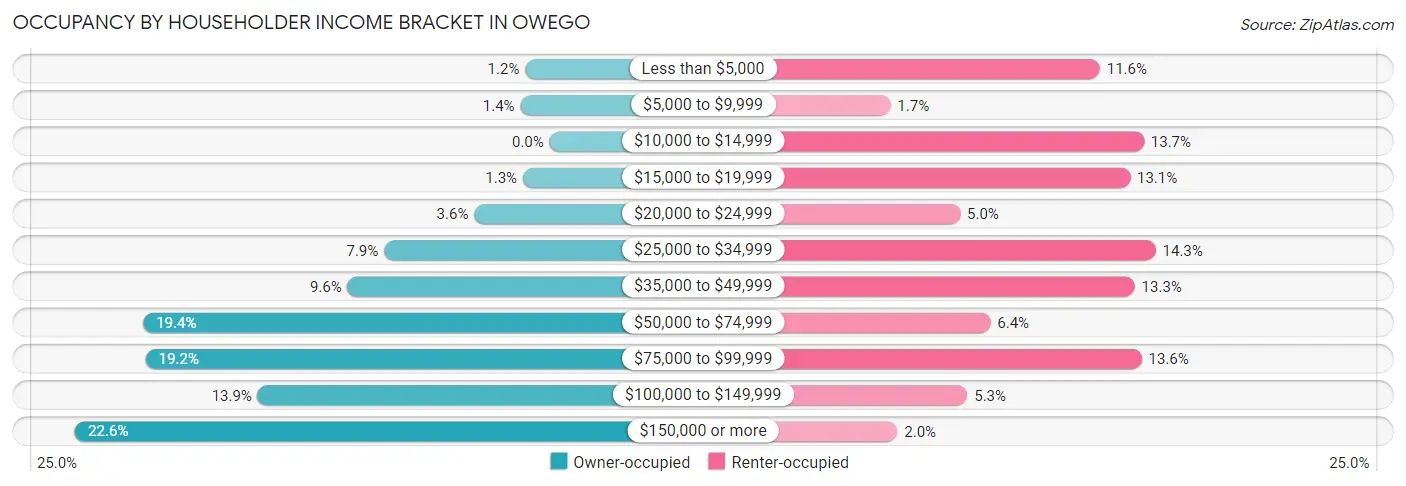
| Income Bracket | Owner-occupied | Renter-occupied |
| Less than $5,000 | 10 (1.2%) | 105 (11.6%) |
| $5,000 to $9,999 | 12 (1.4%) | 15 (1.7%) |
| $10,000 to $14,999 | 0 (0.0%) | 124 (13.7%) |
| $15,000 to $19,999 | 11 (1.3%) | 118 (13.1%) |
| $20,000 to $24,999 | 31 (3.6%) | 45 (5.0%) |
| $25,000 to $34,999 | 68 (7.9%) | 129 (14.3%) |
| $35,000 to $49,999 | 83 (9.6%) | 120 (13.3%) |
| $50,000 to $74,999 | 167 (19.4%) | 58 (6.4%) |
| $75,000 to $99,999 | 166 (19.2%) | 123 (13.6%) |
| $100,000 to $149,999 | 120 (13.9%) | 48 (5.3%) |
| $150,000 or more | 195 (22.6%) | 18 (2.0%) |
| Total | 863 (100.0%) | 903 (100.0%) |
Monthly Housing Cost Tiers in Owego
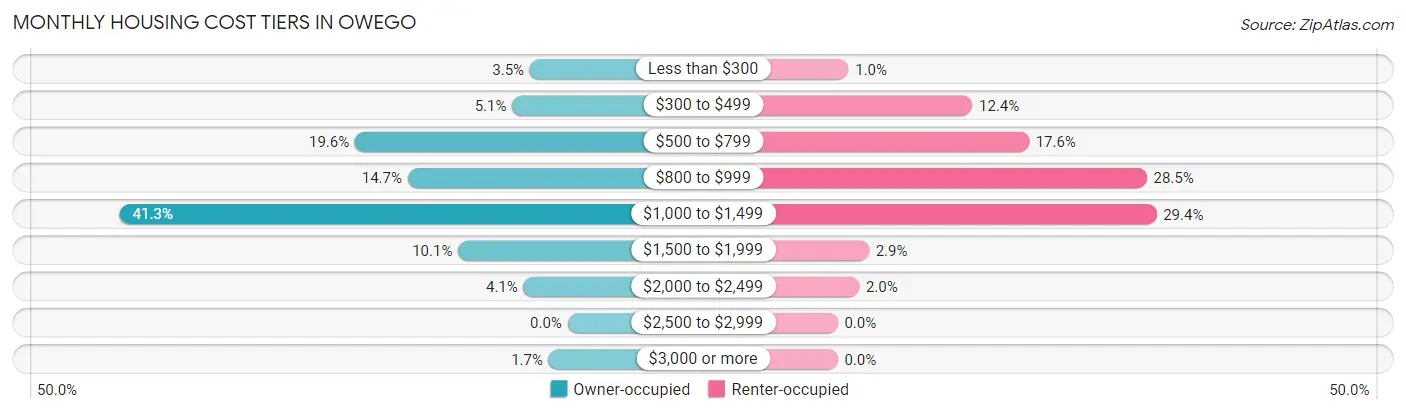
| Monthly Cost | Owner-occupied | Renter-occupied |
| Less than $300 | 30 (3.5%) | 9 (1.0%) |
| $300 to $499 | 44 (5.1%) | 112 (12.4%) |
| $500 to $799 | 169 (19.6%) | 159 (17.6%) |
| $800 to $999 | 127 (14.7%) | 257 (28.5%) |
| $1,000 to $1,499 | 356 (41.2%) | 265 (29.3%) |
| $1,500 to $1,999 | 87 (10.1%) | 26 (2.9%) |
| $2,000 to $2,499 | 35 (4.1%) | 18 (2.0%) |
| $2,500 to $2,999 | 0 (0.0%) | 0 (0.0%) |
| $3,000 or more | 15 (1.7%) | 0 (0.0%) |
| Total | 863 (100.0%) | 903 (100.0%) |
Physical Housing Characteristics in Owego
Housing Structures in Owego
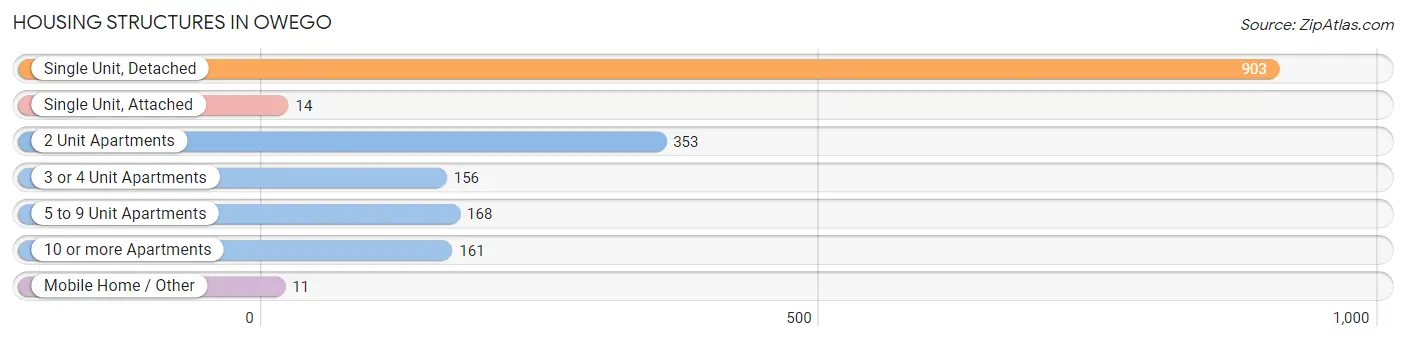
| Structure Type | # Housing Units | % Housing Units |
| Single Unit, Detached | 903 | 51.1% |
| Single Unit, Attached | 14 | 0.8% |
| 2 Unit Apartments | 353 | 20.0% |
| 3 or 4 Unit Apartments | 156 | 8.8% |
| 5 to 9 Unit Apartments | 168 | 9.5% |
| 10 or more Apartments | 161 | 9.1% |
| Mobile Home / Other | 11 | 0.6% |
| Total | 1,766 | 100.0% |
Housing Structures by Occupancy in Owego
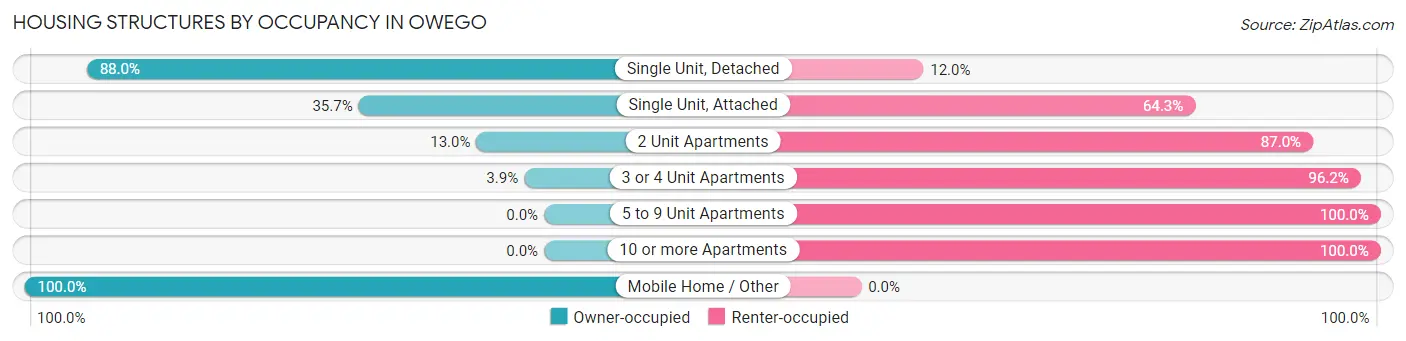
| Structure Type | Owner-occupied | Renter-occupied |
| Single Unit, Detached | 795 (88.0%) | 108 (12.0%) |
| Single Unit, Attached | 5 (35.7%) | 9 (64.3%) |
| 2 Unit Apartments | 46 (13.0%) | 307 (87.0%) |
| 3 or 4 Unit Apartments | 6 (3.8%) | 150 (96.2%) |
| 5 to 9 Unit Apartments | 0 (0.0%) | 168 (100.0%) |
| 10 or more Apartments | 0 (0.0%) | 161 (100.0%) |
| Mobile Home / Other | 11 (100.0%) | 0 (0.0%) |
| Total | 863 (48.9%) | 903 (51.1%) |
Housing Structures by Number of Rooms in Owego
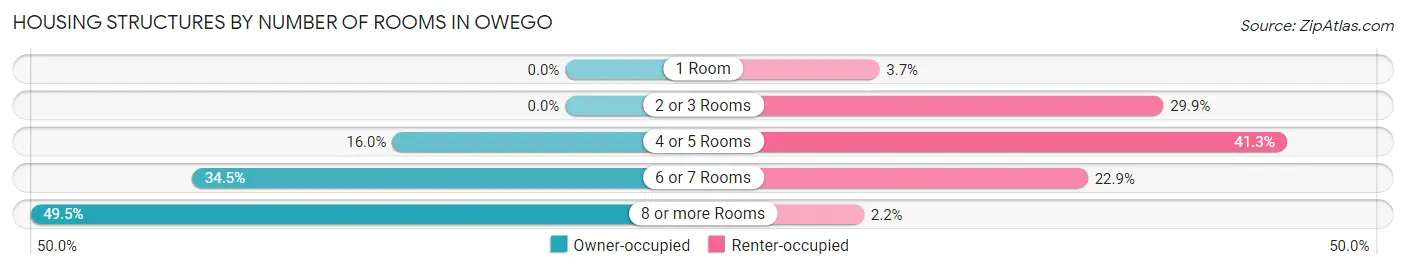
| Number of Rooms | Owner-occupied | Renter-occupied |
| 1 Room | 0 (0.0%) | 33 (3.6%) |
| 2 or 3 Rooms | 0 (0.0%) | 270 (29.9%) |
| 4 or 5 Rooms | 138 (16.0%) | 373 (41.3%) |
| 6 or 7 Rooms | 298 (34.5%) | 207 (22.9%) |
| 8 or more Rooms | 427 (49.5%) | 20 (2.2%) |
| Total | 863 (100.0%) | 903 (100.0%) |
Housing Structure by Heating Type in Owego
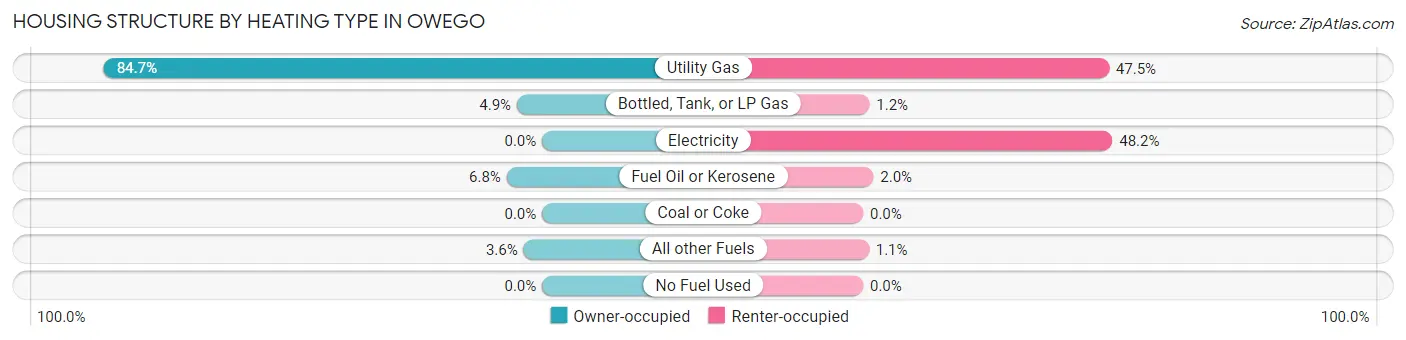
| Heating Type | Owner-occupied | Renter-occupied |
| Utility Gas | 731 (84.7%) | 429 (47.5%) |
| Bottled, Tank, or LP Gas | 42 (4.9%) | 11 (1.2%) |
| Electricity | 0 (0.0%) | 435 (48.2%) |
| Fuel Oil or Kerosene | 59 (6.8%) | 18 (2.0%) |
| Coal or Coke | 0 (0.0%) | 0 (0.0%) |
| All other Fuels | 31 (3.6%) | 10 (1.1%) |
| No Fuel Used | 0 (0.0%) | 0 (0.0%) |
| Total | 863 (100.0%) | 903 (100.0%) |
Household Vehicle Usage in Owego
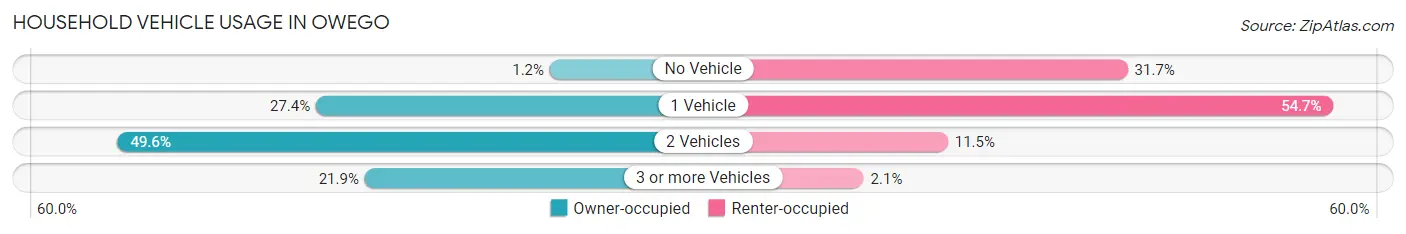
| Vehicles per Household | Owner-occupied | Renter-occupied |
| No Vehicle | 10 (1.2%) | 286 (31.7%) |
| 1 Vehicle | 236 (27.4%) | 494 (54.7%) |
| 2 Vehicles | 428 (49.6%) | 104 (11.5%) |
| 3 or more Vehicles | 189 (21.9%) | 19 (2.1%) |
| Total | 863 (100.0%) | 903 (100.0%) |
Real Estate & Mortgages in Owego
Real Estate and Mortgage Overview in Owego
| Characteristic | Without Mortgage | With Mortgage |
| Housing Units | 416 | 447 |
| Median Property Value | $142,900 | $104,500 |
| Median Household Income | $86,771 | $103 |
| Monthly Housing Costs | $776 | $15 |
| Real Estate Taxes | $4,398 | $10 |
Property Value by Mortgage Status in Owego
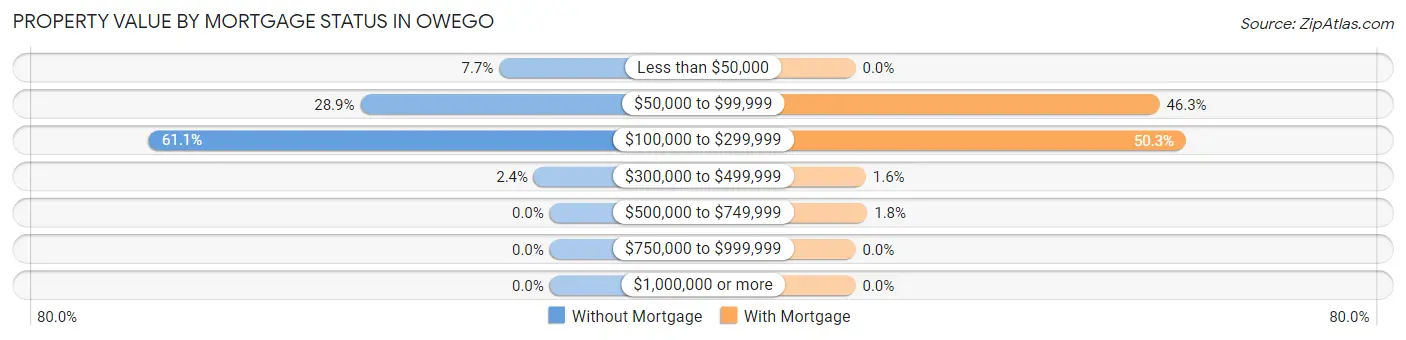
| Property Value | Without Mortgage | With Mortgage |
| Less than $50,000 | 32 (7.7%) | 0 (0.0%) |
| $50,000 to $99,999 | 120 (28.8%) | 207 (46.3%) |
| $100,000 to $299,999 | 254 (61.1%) | 225 (50.3%) |
| $300,000 to $499,999 | 10 (2.4%) | 7 (1.6%) |
| $500,000 to $749,999 | 0 (0.0%) | 8 (1.8%) |
| $750,000 to $999,999 | 0 (0.0%) | 0 (0.0%) |
| $1,000,000 or more | 0 (0.0%) | 0 (0.0%) |
| Total | 416 (100.0%) | 447 (100.0%) |
Household Income by Mortgage Status in Owego
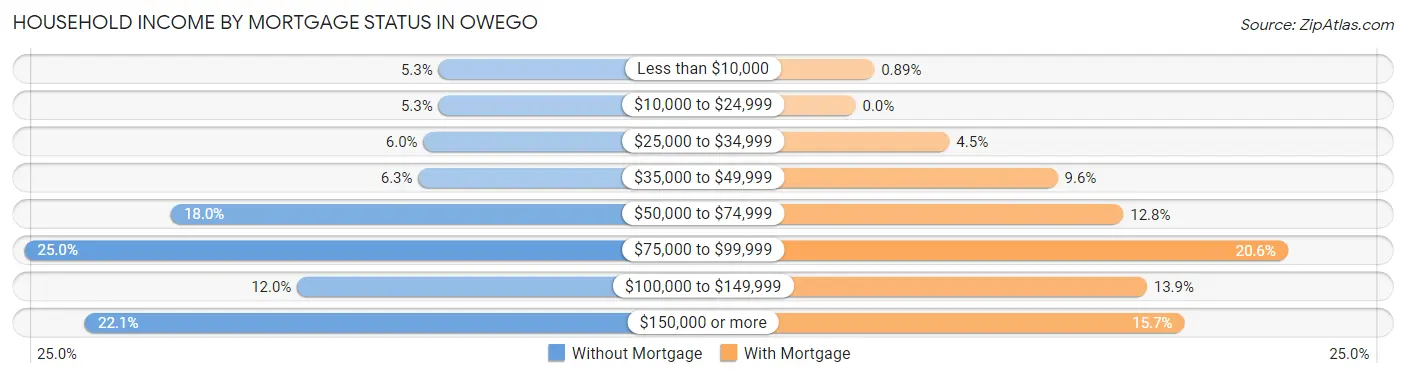
| Household Income | Without Mortgage | With Mortgage |
| Less than $10,000 | 22 (5.3%) | 4 (0.9%) |
| $10,000 to $24,999 | 22 (5.3%) | 0 (0.0%) |
| $25,000 to $34,999 | 25 (6.0%) | 20 (4.5%) |
| $35,000 to $49,999 | 26 (6.2%) | 43 (9.6%) |
| $50,000 to $74,999 | 75 (18.0%) | 57 (12.8%) |
| $75,000 to $99,999 | 104 (25.0%) | 92 (20.6%) |
| $100,000 to $149,999 | 50 (12.0%) | 62 (13.9%) |
| $150,000 or more | 92 (22.1%) | 70 (15.7%) |
| Total | 416 (100.0%) | 447 (100.0%) |
Property Value to Household Income Ratio in Owego
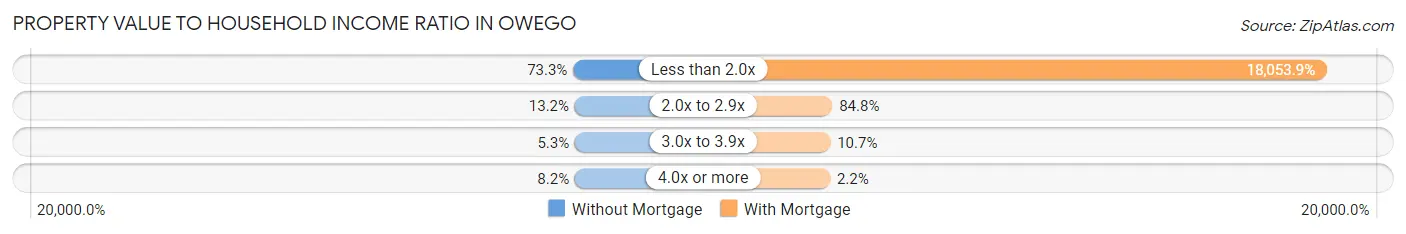
| Value-to-Income Ratio | Without Mortgage | With Mortgage |
| Less than 2.0x | 305 (73.3%) | 80,701 (18,053.9%) |
| 2.0x to 2.9x | 55 (13.2%) | 379 (84.8%) |
| 3.0x to 3.9x | 22 (5.3%) | 48 (10.7%) |
| 4.0x or more | 34 (8.2%) | 10 (2.2%) |
| Total | 416 (100.0%) | 447 (100.0%) |
Real Estate Taxes by Mortgage Status in Owego
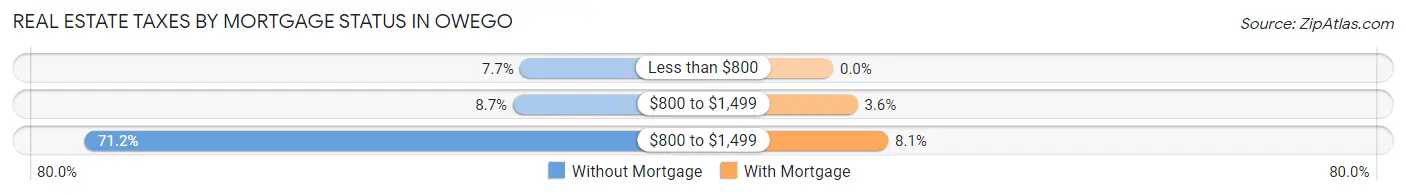
| Property Taxes | Without Mortgage | With Mortgage |
| Less than $800 | 32 (7.7%) | 0 (0.0%) |
| $800 to $1,499 | 36 (8.6%) | 16 (3.6%) |
| $800 to $1,499 | 296 (71.2%) | 36 (8.1%) |
| Total | 416 (100.0%) | 447 (100.0%) |
Health & Disability in Owego
Health Insurance Coverage by Age in Owego
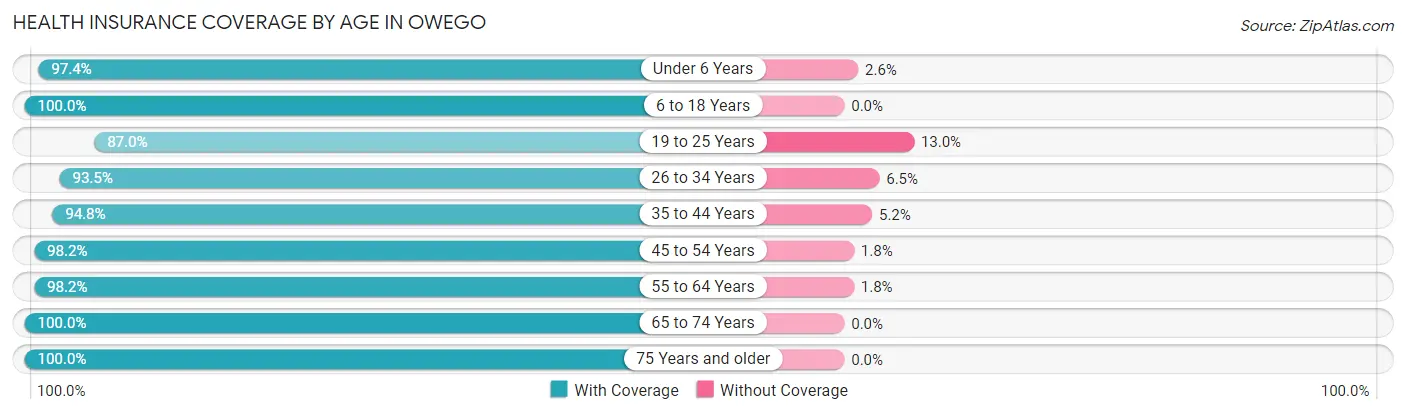
| Age Bracket | With Coverage | Without Coverage |
| Under 6 Years | 302 (97.4%) | 8 (2.6%) |
| 6 to 18 Years | 636 (100.0%) | 0 (0.0%) |
| 19 to 25 Years | 308 (87.0%) | 46 (13.0%) |
| 26 to 34 Years | 172 (93.5%) | 12 (6.5%) |
| 35 to 44 Years | 459 (94.8%) | 25 (5.2%) |
| 45 to 54 Years | 495 (98.2%) | 9 (1.8%) |
| 55 to 64 Years | 497 (98.2%) | 9 (1.8%) |
| 65 to 74 Years | 336 (100.0%) | 0 (0.0%) |
| 75 Years and older | 361 (100.0%) | 0 (0.0%) |
| Total | 3,566 (97.0%) | 109 (3.0%) |
Health Insurance Coverage by Citizenship Status in Owego
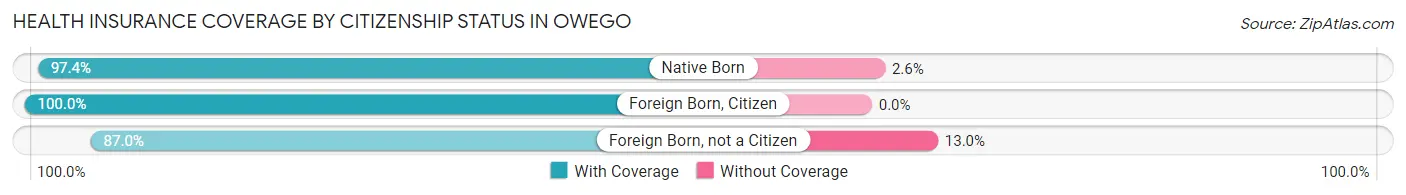
| Citizenship Status | With Coverage | Without Coverage |
| Native Born | 302 (97.4%) | 8 (2.6%) |
| Foreign Born, Citizen | 636 (100.0%) | 0 (0.0%) |
| Foreign Born, not a Citizen | 308 (87.0%) | 46 (13.0%) |
Health Insurance Coverage by Household Income in Owego
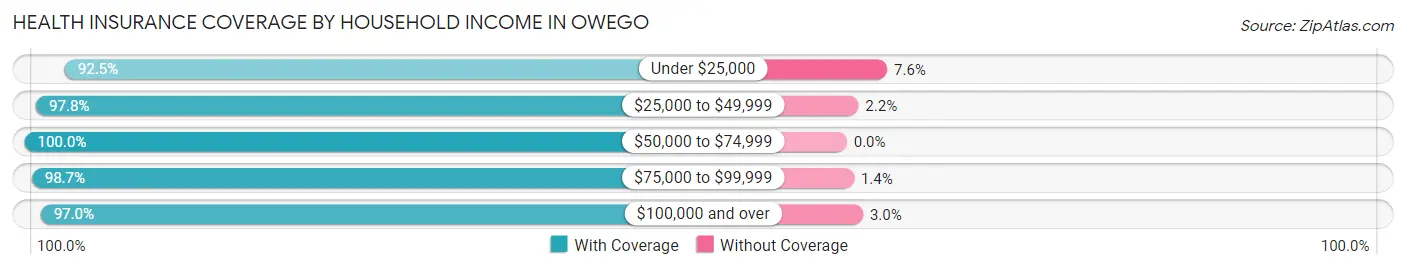
| Household Income | With Coverage | Without Coverage |
| Under $25,000 | 600 (92.4%) | 49 (7.5%) |
| $25,000 to $49,999 | 947 (97.8%) | 21 (2.2%) |
| $50,000 to $74,999 | 367 (100.0%) | 0 (0.0%) |
| $75,000 to $99,999 | 657 (98.7%) | 9 (1.3%) |
| $100,000 and over | 961 (97.0%) | 30 (3.0%) |
Public vs Private Health Insurance Coverage by Age in Owego
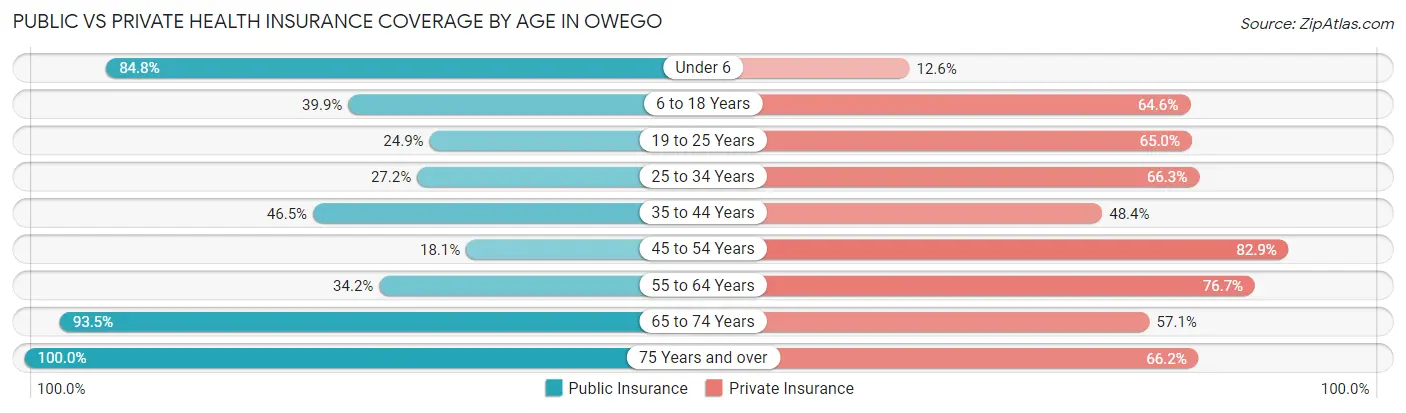
| Age Bracket | Public Insurance | Private Insurance |
| Under 6 | 263 (84.8%) | 39 (12.6%) |
| 6 to 18 Years | 254 (39.9%) | 411 (64.6%) |
| 19 to 25 Years | 88 (24.9%) | 230 (65.0%) |
| 25 to 34 Years | 50 (27.2%) | 122 (66.3%) |
| 35 to 44 Years | 225 (46.5%) | 234 (48.3%) |
| 45 to 54 Years | 91 (18.1%) | 418 (82.9%) |
| 55 to 64 Years | 173 (34.2%) | 388 (76.7%) |
| 65 to 74 Years | 314 (93.4%) | 192 (57.1%) |
| 75 Years and over | 361 (100.0%) | 239 (66.2%) |
| Total | 1,819 (49.5%) | 2,273 (61.9%) |
Disability Status by Sex by Age in Owego
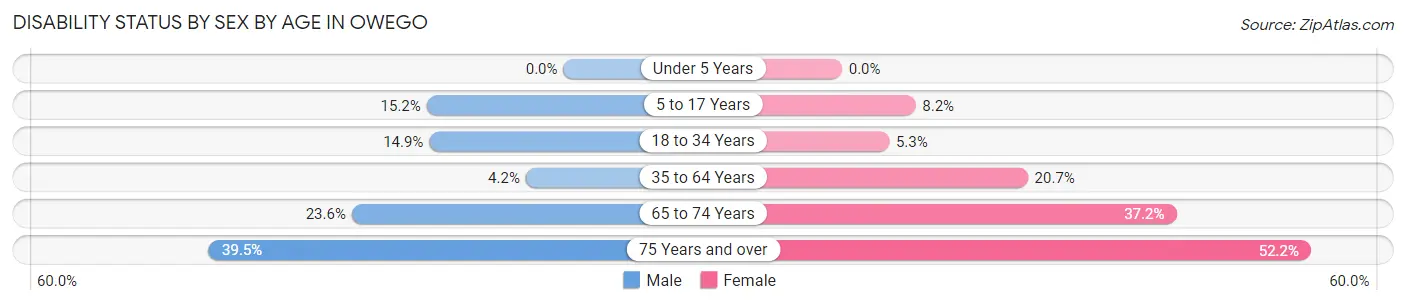
| Age Bracket | Male | Female |
| Under 5 Years | 0 (0.0%) | 0 (0.0%) |
| 5 to 17 Years | 30 (15.2%) | 29 (8.2%) |
| 18 to 34 Years | 39 (14.9%) | 19 (5.2%) |
| 35 to 64 Years | 28 (4.2%) | 171 (20.7%) |
| 65 to 74 Years | 33 (23.6%) | 73 (37.2%) |
| 75 Years and over | 45 (39.5%) | 129 (52.2%) |
Disability Class by Sex by Age in Owego
Disability Class: Hearing Difficulty
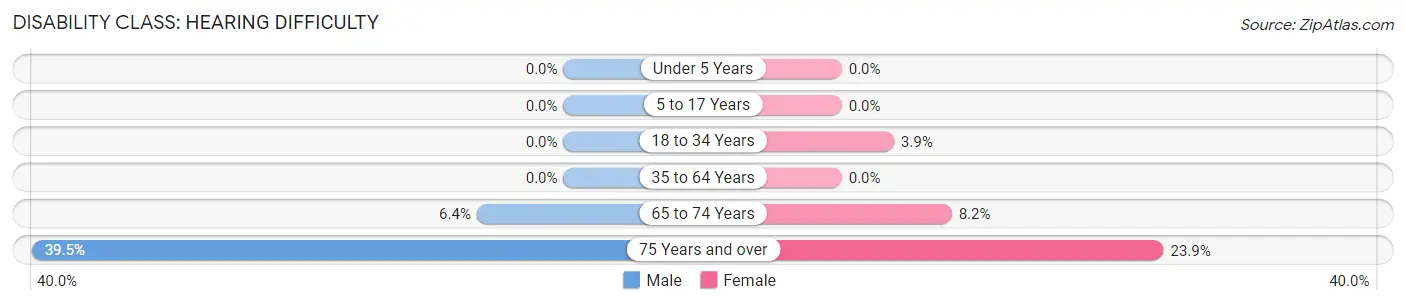
| Age Bracket | Male | Female |
| Under 5 Years | 0 (0.0%) | 0 (0.0%) |
| 5 to 17 Years | 0 (0.0%) | 0 (0.0%) |
| 18 to 34 Years | 0 (0.0%) | 14 (3.9%) |
| 35 to 64 Years | 0 (0.0%) | 0 (0.0%) |
| 65 to 74 Years | 9 (6.4%) | 16 (8.2%) |
| 75 Years and over | 45 (39.5%) | 59 (23.9%) |
Disability Class: Vision Difficulty
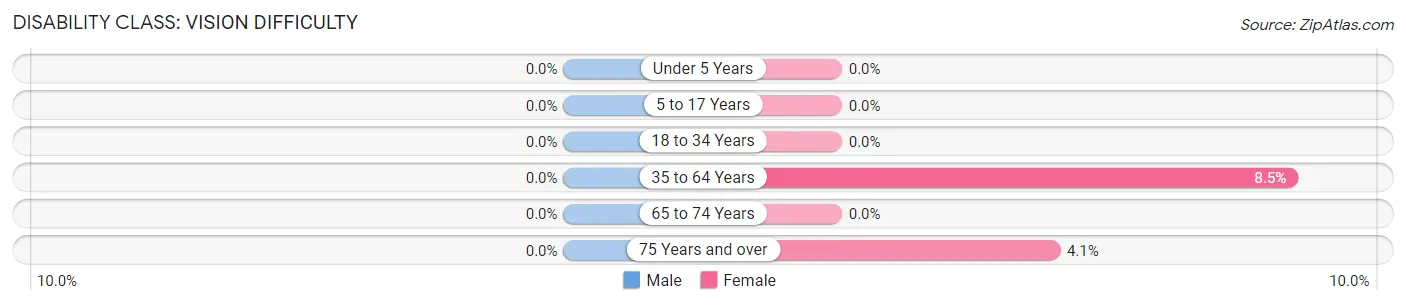
| Age Bracket | Male | Female |
| Under 5 Years | 0 (0.0%) | 0 (0.0%) |
| 5 to 17 Years | 0 (0.0%) | 0 (0.0%) |
| 18 to 34 Years | 0 (0.0%) | 0 (0.0%) |
| 35 to 64 Years | 0 (0.0%) | 70 (8.5%) |
| 65 to 74 Years | 0 (0.0%) | 0 (0.0%) |
| 75 Years and over | 0 (0.0%) | 10 (4.1%) |
Disability Class: Cognitive Difficulty
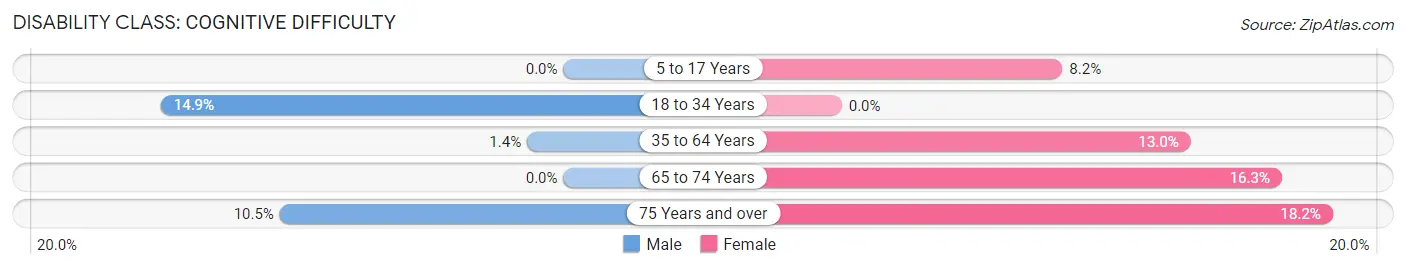
| Age Bracket | Male | Female |
| 5 to 17 Years | 0 (0.0%) | 29 (8.2%) |
| 18 to 34 Years | 39 (14.9%) | 0 (0.0%) |
| 35 to 64 Years | 9 (1.3%) | 107 (13.0%) |
| 65 to 74 Years | 0 (0.0%) | 32 (16.3%) |
| 75 Years and over | 12 (10.5%) | 45 (18.2%) |
Disability Class: Ambulatory Difficulty
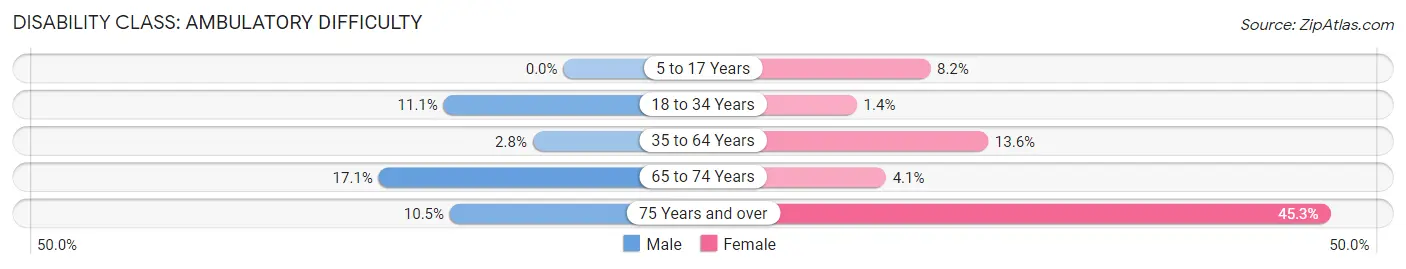
| Age Bracket | Male | Female |
| 5 to 17 Years | 0 (0.0%) | 29 (8.2%) |
| 18 to 34 Years | 29 (11.1%) | 5 (1.4%) |
| 35 to 64 Years | 19 (2.8%) | 112 (13.6%) |
| 65 to 74 Years | 24 (17.1%) | 8 (4.1%) |
| 75 Years and over | 12 (10.5%) | 112 (45.3%) |
Disability Class: Self-Care Difficulty
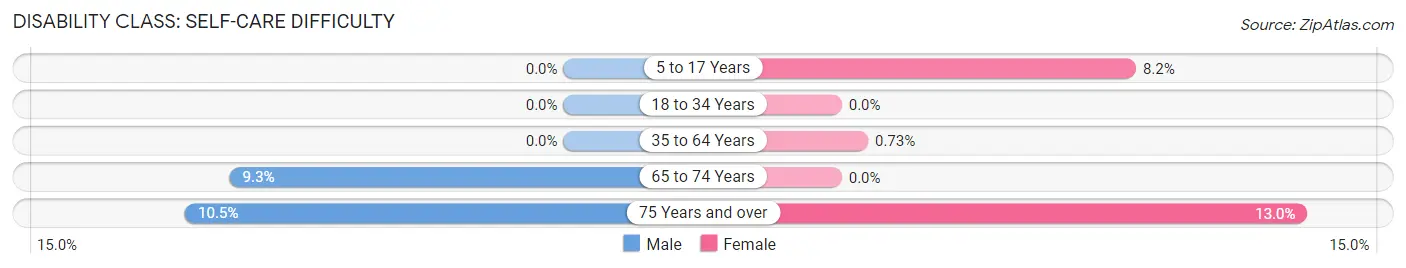
| Age Bracket | Male | Female |
| 5 to 17 Years | 0 (0.0%) | 29 (8.2%) |
| 18 to 34 Years | 0 (0.0%) | 0 (0.0%) |
| 35 to 64 Years | 0 (0.0%) | 6 (0.7%) |
| 65 to 74 Years | 13 (9.3%) | 0 (0.0%) |
| 75 Years and over | 12 (10.5%) | 32 (13.0%) |
Technology Access in Owego
Computing Device Access in Owego
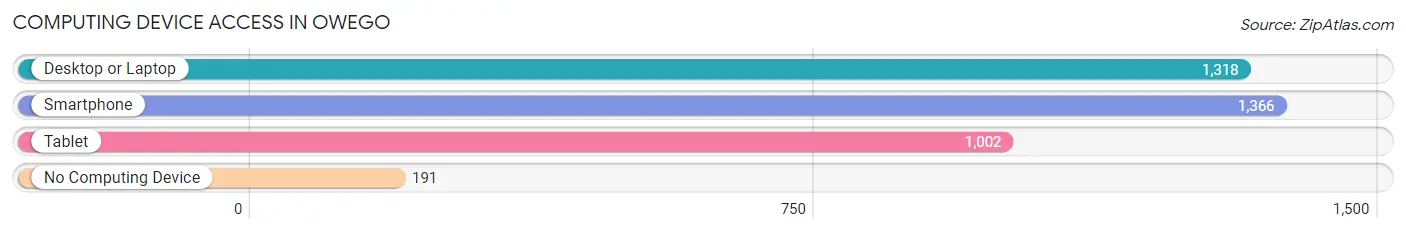
| Device Type | # Households | % Households |
| Desktop or Laptop | 1,318 | 74.6% |
| Smartphone | 1,366 | 77.3% |
| Tablet | 1,002 | 56.7% |
| No Computing Device | 191 | 10.8% |
| Total | 1,766 | 100.0% |
Internet Access in Owego
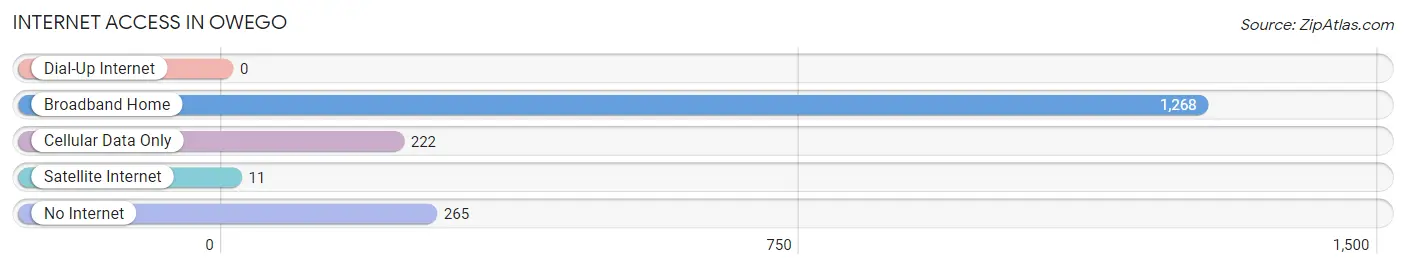
| Internet Type | # Households | % Households |
| Dial-Up Internet | 0 | 0.0% |
| Broadband Home | 1,268 | 71.8% |
| Cellular Data Only | 222 | 12.6% |
| Satellite Internet | 11 | 0.6% |
| No Internet | 265 | 15.0% |
| Total | 1,766 | 100.0% |
Owego Summary
Owego is a small town located in Tioga County, New York, United States. It is situated on the Susquehanna River, approximately 30 miles south of Binghamton. The population was 3,893 at the 2010 census. Owego is the county seat of Tioga County and is home to the Tioga County Courthouse.
History
The area that is now Owego was originally inhabited by the Iroquois and Susquehannock Native American tribes. The first European settlers arrived in the area in the late 1700s. The town of Owego was established in 1787 and was named after the Iroquois word for “where the river widens”.
In the early 1800s, Owego was a thriving port town and was the largest town in Tioga County. The town was a major stop on the Erie Canal and was home to several mills and factories. The town was also a major stop on the Underground Railroad, with many escaped slaves passing through the town on their way to freedom.
In the late 1800s, Owego experienced a period of economic decline as the Erie Canal was replaced by the railroad. The town’s economy was further weakened by the Great Depression and World War II.
In the 1950s, Owego experienced a period of economic revival as the town became a center for manufacturing and industry. The town was also home to several large companies, including IBM and Endicott Johnson.
Geography
Owego is located at 42°06′N 76°09′W (42.10, -76.15). According to the United States Census Bureau, the town has a total area of 3.2 square miles (8.3 km2), all of it land.
The Susquehanna River flows through the town and is a major source of recreation for the area. The Tioga River also flows through the town and is a popular spot for fishing and boating.
Economy
Owego’s economy is largely based on manufacturing and industry. The town is home to several large companies, including IBM and Endicott Johnson. The town is also home to several smaller businesses, including restaurants, retail stores, and service providers.
The town is also home to several educational institutions, including the State University of New York at Owego and the Owego Free Academy.
Demographics
As of the census of 2010, there were 3,893 people, 1,541 households, and 990 families residing in the town. The population density was 1,213.3 people per square mile (468.7/km2). There were 1,717 housing units at an average density of 535.2 per square mile (206.7/km2). The racial makeup of the town was 96.2% White, 0.7% African American, 0.3% Native American, 0.7% Asian, 0.1% Pacific Islander, 0.7% from other races, and 1.3% from two or more races. Hispanic or Latino of any race were 2.2% of the population.
There were 1,541 households, out of which 30.2% had children under the age of 18 living with them, 48.2% were married couples living together, 11.7% had a female householder with no husband present, and 35.3% were non-families. 29.2% of all households were made up of individuals, and 12.3% had someone living alone who was 65 years of age or older. The average household size was 2.45 and the average family size was 3.02.
In the town, the population was spread out, with 24.2% under the age of 18, 8.2% from 18 to 24, 27.2% from 25 to 44, 24.2% from 45 to 64, and 16.2% who were 65 years of age or older. The median age was 38 years. For every 100 females, there were 93.2 males. For every 100 females age 18 and over, there were 90.2 males.
The median income for a household in the town was $37,917, and the median income for a family was $45,938. Males had a median income of $35,938 versus $25,917 for females. The per capita income for the town was $19,917. About 8.2% of families and 11.2% of the population were below the poverty line, including 15.2% of those under age 18 and 8.2% of those age 65 or over.
Common Questions
What is the Total Population of Owego?
Total Population of Owego is 3,740.
What is the Total Male Population of Owego?
Total Male Population of Owego is 1,591.
What is the Total Female Population of Owego?
Total Female Population of Owego is 2,149.
What is the Ratio of Males per 100 Females in Owego?
There are 74.03 Males per 100 Females in Owego.
What is the Ratio of Females per 100 Males in Owego?
There are 135.07 Females per 100 Males in Owego.
What is the Median Population Age in Owego?
Median Population Age in Owego is 41.8 Years.
What is the Average Family Size in Owego
Average Family Size in Owego is 2.9 People.
What is the Average Household Size in Owego
Average Household Size in Owego is 2.1 People.
What is Per Capita Income in Owego?
Per Capita income in Owego is $40,634.
What is the Median Family Income in Owego?
Median Family Income in Owego is $80,777.
What is the Median Household income in Owego?
Median Household Income in Owego is $51,200.
What is Income or Wage Gap in Owego?
Income or Wage Gap in Owego is 27.2%.
Women in Owego earn 72.8 cents for every dollar earned by a man.
What is Family Income Deficit in Owego?
Family Income Deficit in Owego is $18,835.
Families that are below poverty line in Owego earn $18,835 less on average than the poverty threshold level.
What is Inequality or Gini Index in Owego?
Inequality or Gini Index in Owego is 0.57.
How Large is the Labor Force in Owego?
There are 1,635 People in the Labor Forcein in Owego.
What is the Percentage of People in the Labor Force in Owego?
52.7% of People are in the Labor Force in Owego.
What is the Unemployment Rate in Owego?
Unemployment Rate in Owego is 3.1%.