Elbridge, NY
Elbridge Map
Elbridge Overview
1,384
TOTAL POPULATION
652
MALE POPULATION
732
FEMALE POPULATION
89.07
MALES / 100 FEMALES
112.27
FEMALES / 100 MALES
37.9
MEDIAN AGE
3.2
AVG FAMILY SIZE
2.5
AVG HOUSEHOLD SIZE
$32,799
PER CAPITA INCOME
$80,417
AVG FAMILY INCOME
$59,937
AVG HOUSEHOLD INCOME
28.8%
WAGE / INCOME GAP [ % ]
71.2¢/ $1
WAGE / INCOME GAP [ $ ]
0.42
INEQUALITY / GINI INDEX
646
LABOR FORCE [ PEOPLE ]
62.2%
PERCENT IN LABOR FORCE
7.0%
UNEMPLOYMENT RATE
Elbridge Zip Codes
Elbridge Area Codes
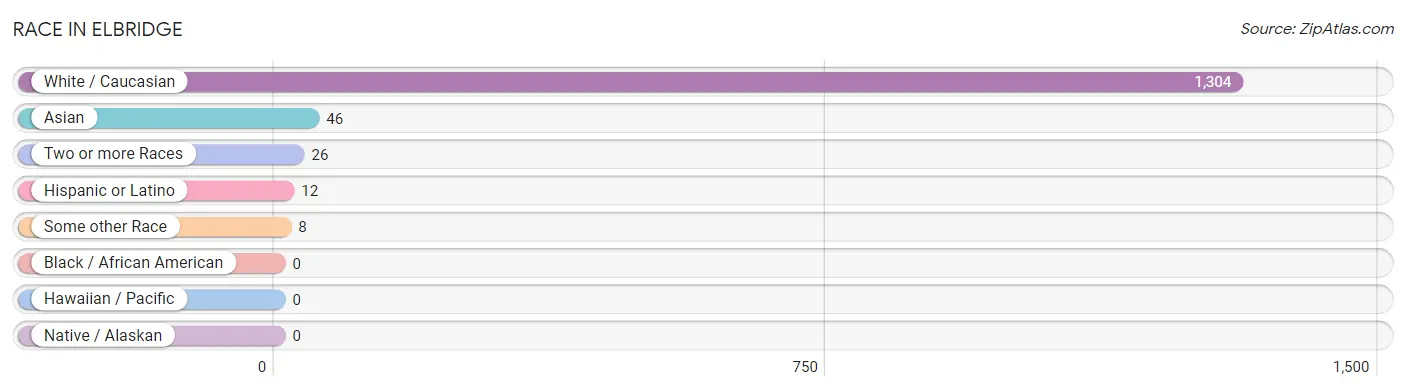
Race in Elbridge
The most populous races in Elbridge are White / Caucasian (1,304 | 94.2%), Asian (46 | 3.3%), and Two or more Races (26 | 1.9%).
| Race | # Population | % Population |
| Asian | 46 | 3.3% |
| Black / African American | 0 | 0.0% |
| Hawaiian / Pacific | 0 | 0.0% |
| Hispanic or Latino | 12 | 0.9% |
| Native / Alaskan | 0 | 0.0% |
| White / Caucasian | 1,304 | 94.2% |
| Two or more Races | 26 | 1.9% |
| Some other Race | 8 | 0.6% |
| Total | 1,384 | 100.0% |
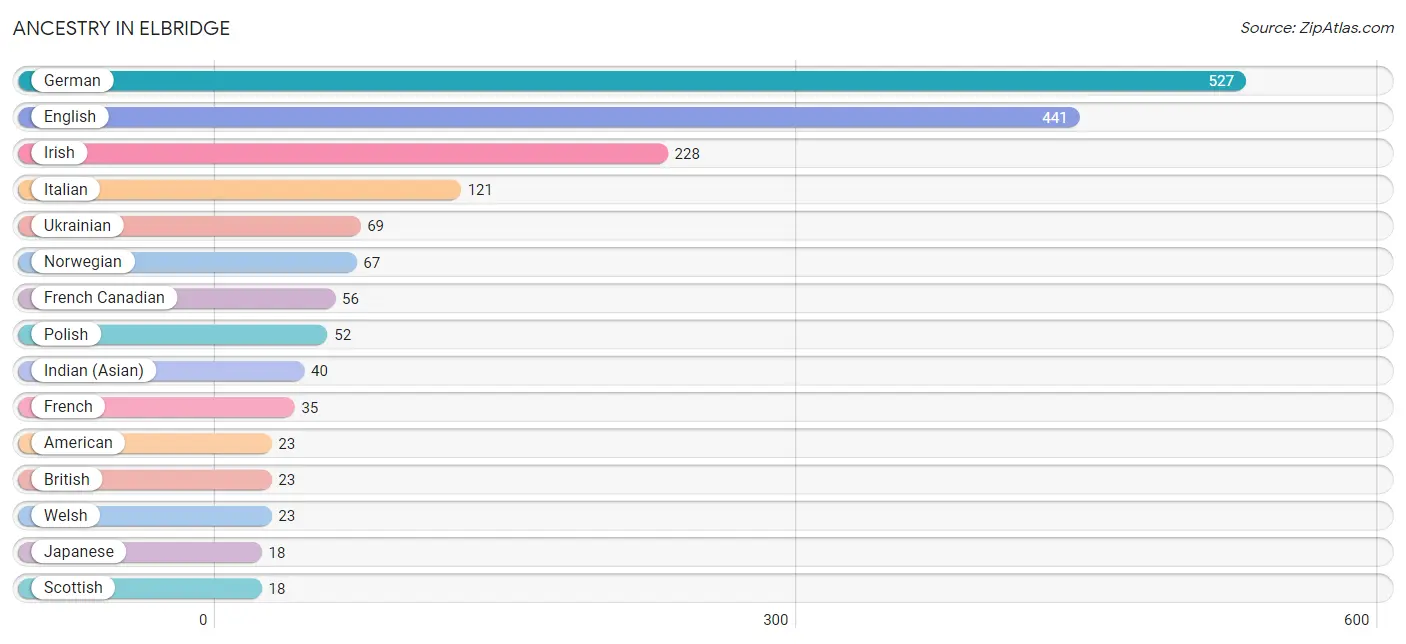
Ancestry in Elbridge
The most populous ancestries reported in Elbridge are German (527 | 38.1%), English (441 | 31.9%), Irish (228 | 16.5%), Italian (121 | 8.7%), and Ukrainian (69 | 5.0%), together accounting for 100.1% of all Elbridge residents.
| Ancestry | # Population | % Population |
| American | 23 | 1.7% |
| Australian | 3 | 0.2% |
| British | 23 | 1.7% |
| Central American | 4 | 0.3% |
| Czechoslovakian | 15 | 1.1% |
| Dutch | 17 | 1.2% |
| Eastern European | 8 | 0.6% |
| English | 441 | 31.9% |
| Finnish | 8 | 0.6% |
| French | 35 | 2.5% |
| French Canadian | 56 | 4.1% |
| German | 527 | 38.1% |
| Greek | 10 | 0.7% |
| Guatemalan | 4 | 0.3% |
| Hungarian | 3 | 0.2% |
| Indian (Asian) | 40 | 2.9% |
| Irish | 228 | 16.5% |
| Italian | 121 | 8.7% |
| Japanese | 18 | 1.3% |
| Korean | 1 | 0.1% |
| Mexican | 4 | 0.3% |
| Northern European | 9 | 0.6% |
| Norwegian | 67 | 4.8% |
| Pennsylvania German | 3 | 0.2% |
| Polish | 52 | 3.8% |
| Russian | 7 | 0.5% |
| Scottish | 18 | 1.3% |
| Spanish | 4 | 0.3% |
| Swedish | 18 | 1.3% |
| Swiss | 3 | 0.2% |
| Ukrainian | 69 | 5.0% |
| Welsh | 23 | 1.7% | View All 32 Rows |
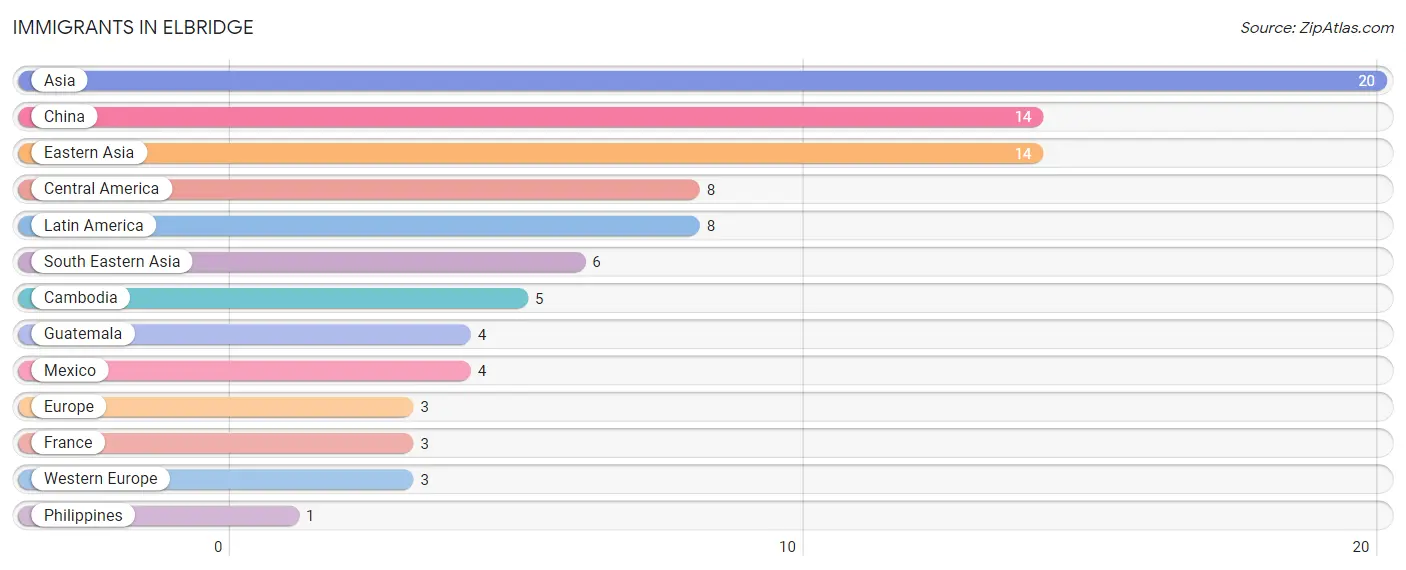
Immigrants in Elbridge
The most numerous immigrant groups reported in Elbridge came from Asia (20 | 1.5%), China (14 | 1.0%), Eastern Asia (14 | 1.0%), Central America (8 | 0.6%), and Latin America (8 | 0.6%), together accounting for 4.6% of all Elbridge residents.
| Immigration Origin | # Population | % Population |
| Asia | 20 | 1.5% |
| Cambodia | 5 | 0.4% |
| Central America | 8 | 0.6% |
| China | 14 | 1.0% |
| Eastern Asia | 14 | 1.0% |
| Europe | 3 | 0.2% |
| France | 3 | 0.2% |
| Guatemala | 4 | 0.3% |
| Latin America | 8 | 0.6% |
| Mexico | 4 | 0.3% |
| Philippines | 1 | 0.1% |
| South Eastern Asia | 6 | 0.4% |
| Western Europe | 3 | 0.2% | View All 13 Rows |
Sex and Age in Elbridge
Sex and Age in Elbridge
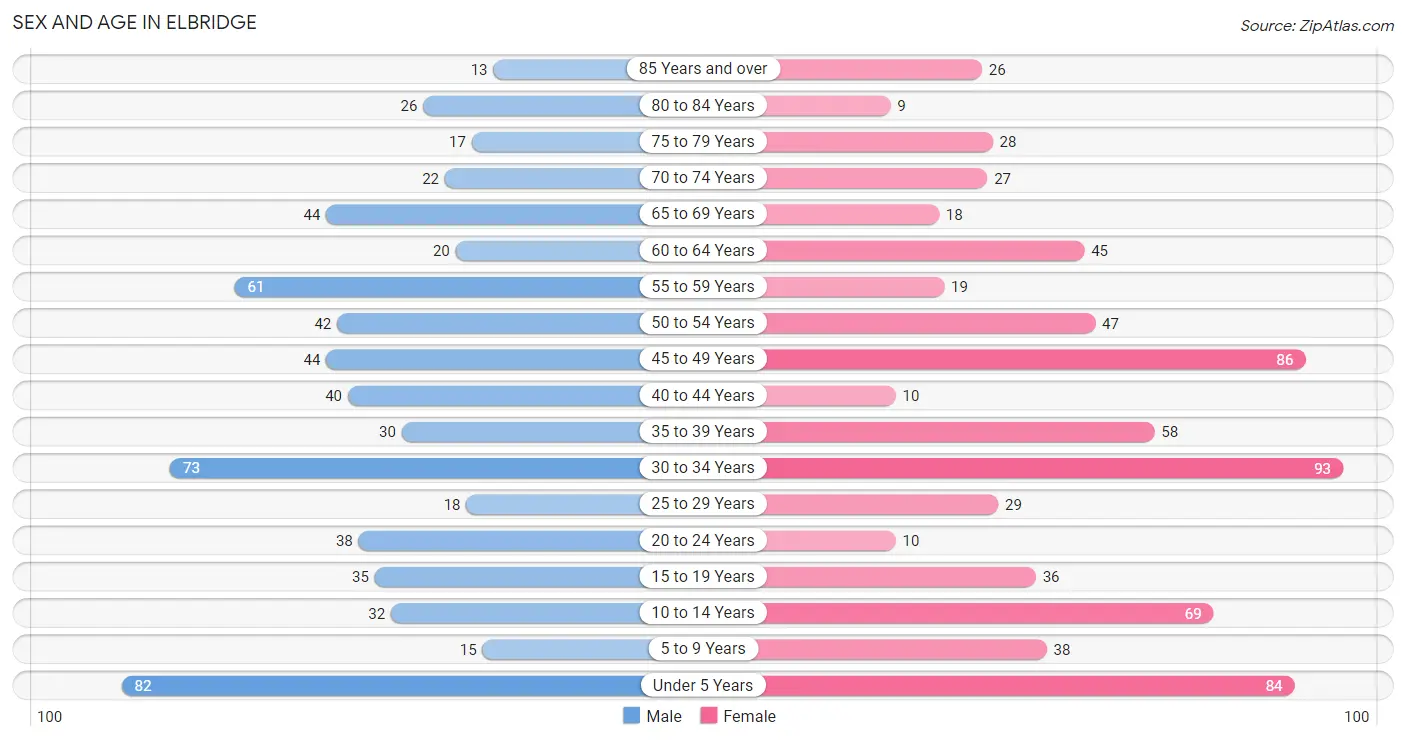
The most populous age groups in Elbridge are Under 5 Years (82 | 12.6%) for men and 30 to 34 Years (93 | 12.7%) for women.
| Age Bracket | Male | Female |
| Under 5 Years | 82 (12.6%) | 84 (11.5%) |
| 5 to 9 Years | 15 (2.3%) | 38 (5.2%) |
| 10 to 14 Years | 32 (4.9%) | 69 (9.4%) |
| 15 to 19 Years | 35 (5.4%) | 36 (4.9%) |
| 20 to 24 Years | 38 (5.8%) | 10 (1.4%) |
| 25 to 29 Years | 18 (2.8%) | 29 (4.0%) |
| 30 to 34 Years | 73 (11.2%) | 93 (12.7%) |
| 35 to 39 Years | 30 (4.6%) | 58 (7.9%) |
| 40 to 44 Years | 40 (6.1%) | 10 (1.4%) |
| 45 to 49 Years | 44 (6.8%) | 86 (11.7%) |
| 50 to 54 Years | 42 (6.4%) | 47 (6.4%) |
| 55 to 59 Years | 61 (9.4%) | 19 (2.6%) |
| 60 to 64 Years | 20 (3.1%) | 45 (6.1%) |
| 65 to 69 Years | 44 (6.8%) | 18 (2.5%) |
| 70 to 74 Years | 22 (3.4%) | 27 (3.7%) |
| 75 to 79 Years | 17 (2.6%) | 28 (3.8%) |
| 80 to 84 Years | 26 (4.0%) | 9 (1.2%) |
| 85 Years and over | 13 (2.0%) | 26 (3.5%) |
| Total | 652 (100.0%) | 732 (100.0%) |
Families and Households in Elbridge
Median Family Size in Elbridge
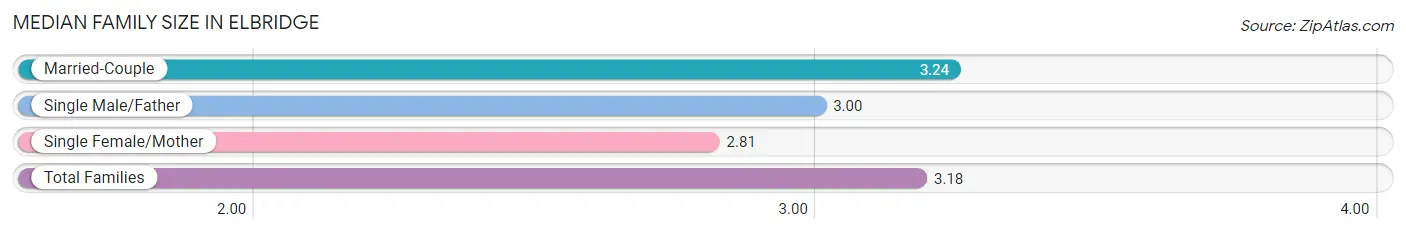
The median family size in Elbridge is 3.18 persons per family, with married-couple families (304 | 83.8%) accounting for the largest median family size of 3.24 persons per family. On the other hand, single female/mother families (48 | 13.2%) represent the smallest median family size with 2.81 persons per family.
| Family Type | # Families | Family Size |
| Married-Couple | 304 (83.8%) | 3.24 |
| Single Male/Father | 11 (3.0%) | 3.00 |
| Single Female/Mother | 48 (13.2%) | 2.81 |
| Total Families | 363 (100.0%) | 3.18 |
Median Household Size in Elbridge
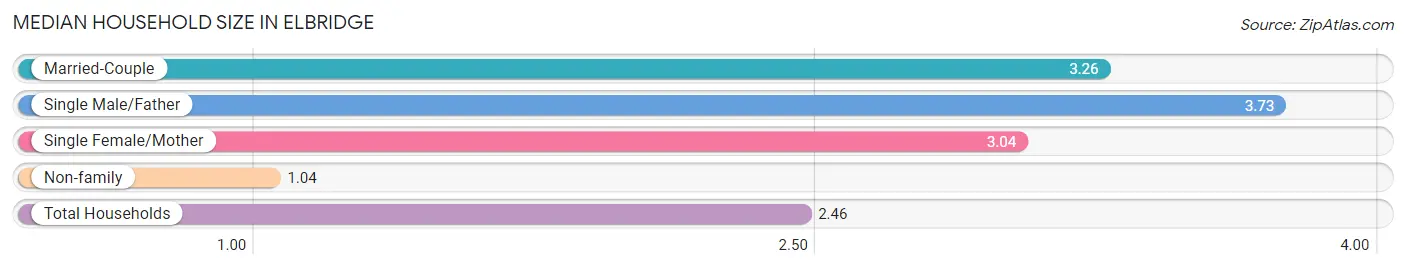
The median household size in Elbridge is 2.46 persons per household, with single male/father households (11 | 2.0%) accounting for the largest median household size of 3.73 persons per household. non-family households (199 | 35.4%) represent the smallest median household size with 1.04 persons per household.
| Household Type | # Households | Household Size |
| Married-Couple | 304 (54.1%) | 3.26 |
| Single Male/Father | 11 (2.0%) | 3.73 |
| Single Female/Mother | 48 (8.5%) | 3.04 |
| Non-family | 199 (35.4%) | 1.04 |
| Total Households | 562 (100.0%) | 2.46 |
Household Size by Marriage Status in Elbridge
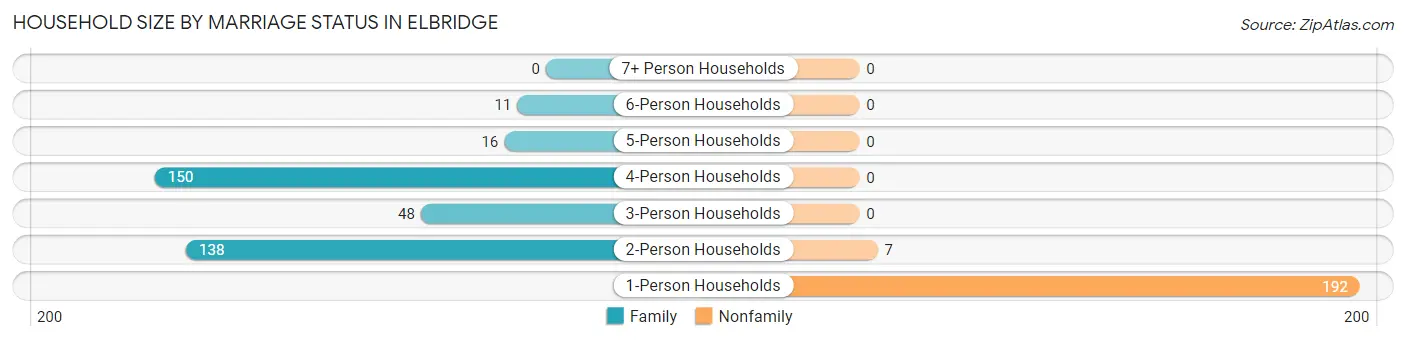
Out of a total of 562 households in Elbridge, 363 (64.6%) are family households, while 199 (35.4%) are nonfamily households. The most numerous type of family households are 4-person households, comprising 150, and the most common type of nonfamily households are 1-person households, comprising 192.
| Household Size | Family Households | Nonfamily Households |
| 1-Person Households | - | 192 (34.2%) |
| 2-Person Households | 138 (24.6%) | 7 (1.3%) |
| 3-Person Households | 48 (8.5%) | 0 (0.0%) |
| 4-Person Households | 150 (26.7%) | 0 (0.0%) |
| 5-Person Households | 16 (2.9%) | 0 (0.0%) |
| 6-Person Households | 11 (2.0%) | 0 (0.0%) |
| 7+ Person Households | 0 (0.0%) | 0 (0.0%) |
| Total | 363 (64.6%) | 199 (35.4%) |
Female Fertility in Elbridge
Fertility by Age in Elbridge
Average fertility rate in Elbridge is 230.0 births per 1,000 women. Women in the age bracket of 20 to 34 years have the highest fertility rate with 576.0 births per 1,000 women. Women in the age bracket of 20 to 34 years acount for 100.0% of all women with births.
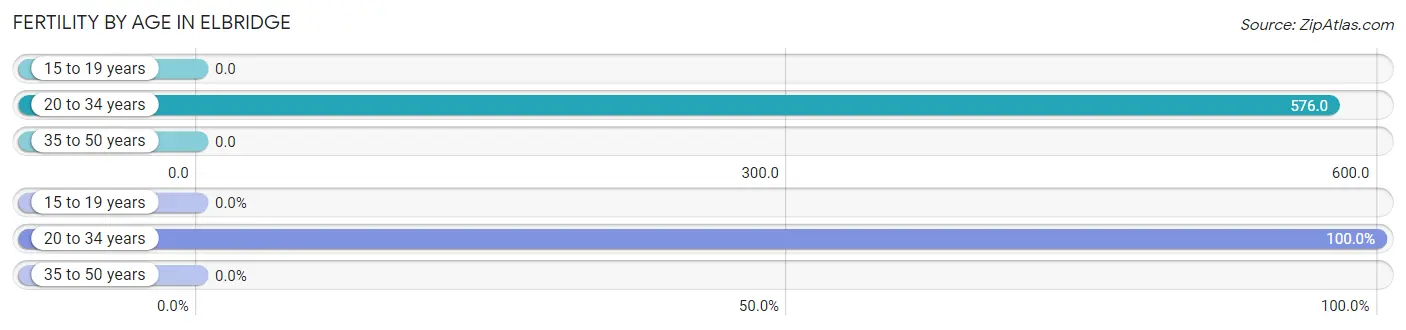
| Age Bracket | Women with Births | Births / 1,000 Women |
| 15 to 19 years | 0 (0.0%) | 0.0 |
| 20 to 34 years | 76 (100.0%) | 576.0 |
| 35 to 50 years | 0 (0.0%) | 0.0 |
| Total | 76 (100.0%) | 230.0 |
Fertility by Age by Marriage Status in Elbridge
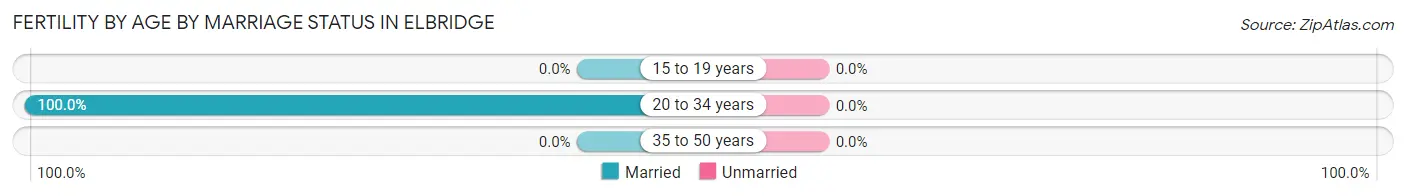
| Age Bracket | Married | Unmarried |
| 15 to 19 years | 0 (0.0%) | 0 (0.0%) |
| 20 to 34 years | 76 (100.0%) | 0 (0.0%) |
| 35 to 50 years | 0 (0.0%) | 0 (0.0%) |
| Total | 76 (100.0%) | 0 (0.0%) |
Fertility by Education in Elbridge
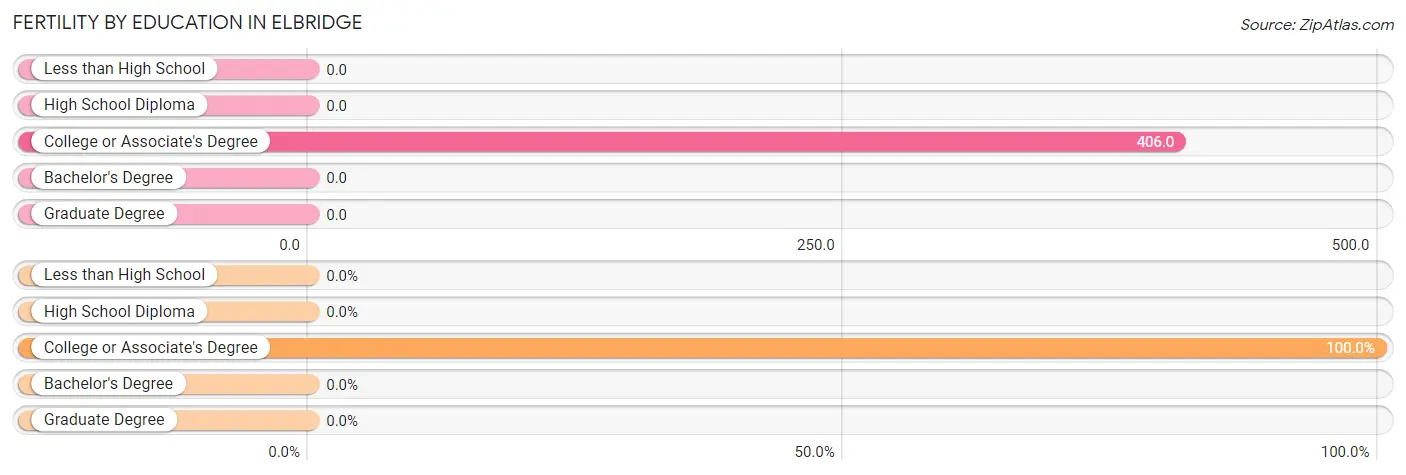
| Educational Attainment | Women with Births | Births / 1,000 Women |
| Less than High School | 0 (0.0%) | 0.0 |
| High School Diploma | 0 (0.0%) | 0.0 |
| College or Associate's Degree | 76 (100.0%) | 406.0 |
| Bachelor's Degree | 0 (0.0%) | 0.0 |
| Graduate Degree | 0 (0.0%) | 0.0 |
| Total | 76 (100.0%) | 230.0 |
Fertility by Education by Marriage Status in Elbridge
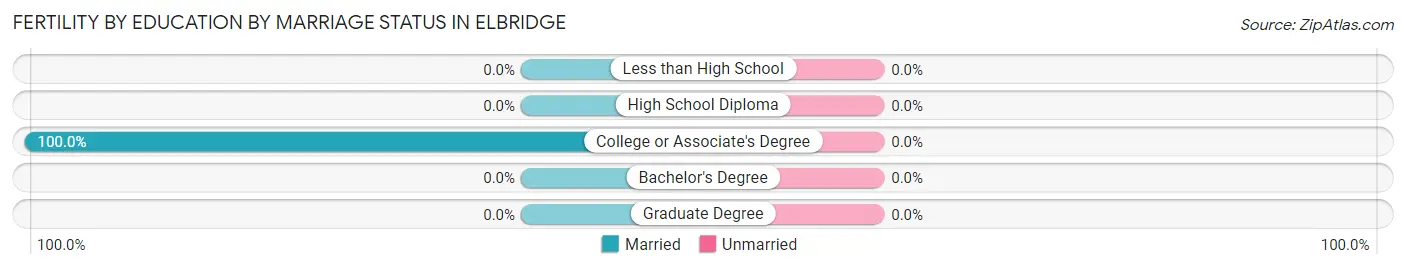
| Educational Attainment | Married | Unmarried |
| Less than High School | 0 (0.0%) | 0 (0.0%) |
| High School Diploma | 0 (0.0%) | 0 (0.0%) |
| College or Associate's Degree | 76 (100.0%) | 0 (0.0%) |
| Bachelor's Degree | 0 (0.0%) | 0 (0.0%) |
| Graduate Degree | 0 (0.0%) | 0 (0.0%) |
| Total | 76 (100.0%) | 0 (0.0%) |
Income in Elbridge
Income Overview in Elbridge
Per Capita Income in Elbridge is $32,799, while median incomes of families and households are $80,417 and $59,937 respectively.
| Characteristic | Number | Measure |
| Per Capita Income | 1,384 | $32,799 |
| Median Family Income | 363 | $80,417 |
| Mean Family Income | 363 | $87,140 |
| Median Household Income | 562 | $59,937 |
| Mean Household Income | 562 | $80,847 |
| Income Deficit | 363 | $0 |
| Wage / Income Gap (%) | 1,384 | 28.78% |
| Wage / Income Gap ($) | 1,384 | 71.22¢ per $1 |
| Gini / Inequality Index | 1,384 | 0.42 |
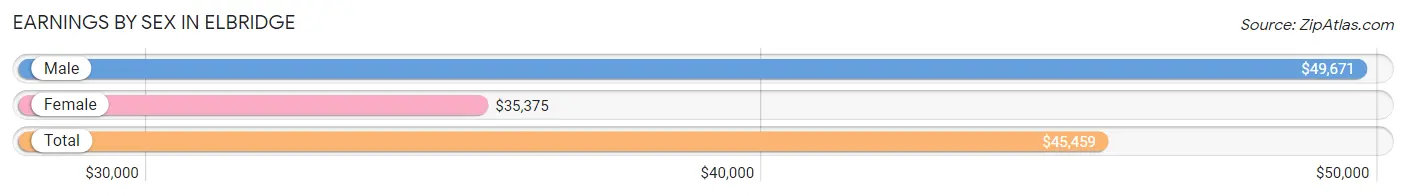
Earnings by Sex in Elbridge
Average Earnings in Elbridge are $45,459, $49,671 for men and $35,375 for women, a difference of 28.8%.
| Sex | Number | Average Earnings |
| Male | 383 (50.1%) | $49,671 |
| Female | 381 (49.9%) | $35,375 |
| Total | 764 (100.0%) | $45,459 |
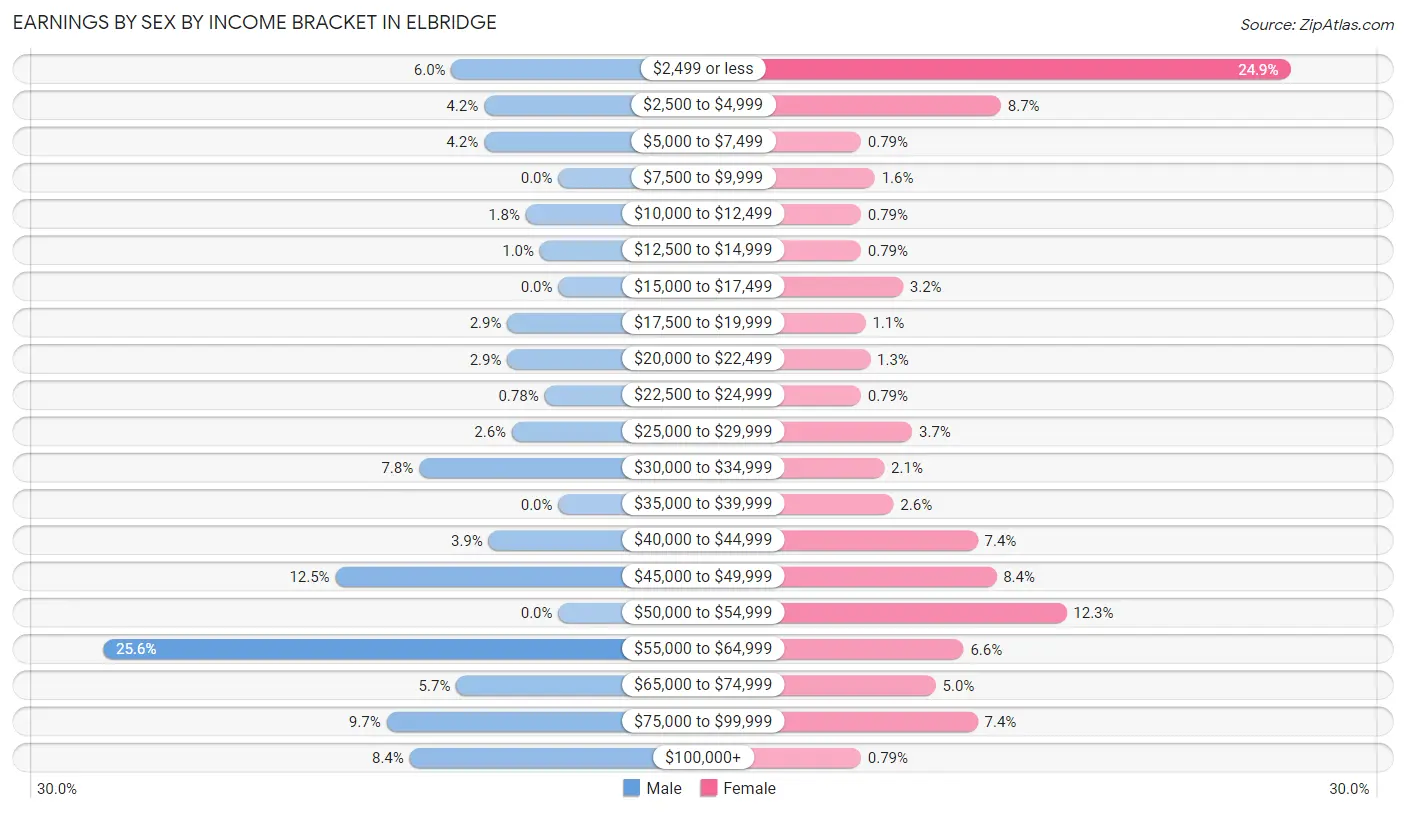
Earnings by Sex by Income Bracket in Elbridge
The most common earnings brackets in Elbridge are $55,000 to $64,999 for men (98 | 25.6%) and $2,499 or less for women (95 | 24.9%).
| Income | Male | Female |
| $2,499 or less | 23 (6.0%) | 95 (24.9%) |
| $2,500 to $4,999 | 16 (4.2%) | 33 (8.7%) |
| $5,000 to $7,499 | 16 (4.2%) | 3 (0.8%) |
| $7,500 to $9,999 | 0 (0.0%) | 6 (1.6%) |
| $10,000 to $12,499 | 7 (1.8%) | 3 (0.8%) |
| $12,500 to $14,999 | 4 (1.0%) | 3 (0.8%) |
| $15,000 to $17,499 | 0 (0.0%) | 12 (3.2%) |
| $17,500 to $19,999 | 11 (2.9%) | 4 (1.1%) |
| $20,000 to $22,499 | 11 (2.9%) | 5 (1.3%) |
| $22,500 to $24,999 | 3 (0.8%) | 3 (0.8%) |
| $25,000 to $29,999 | 10 (2.6%) | 14 (3.7%) |
| $30,000 to $34,999 | 30 (7.8%) | 8 (2.1%) |
| $35,000 to $39,999 | 0 (0.0%) | 10 (2.6%) |
| $40,000 to $44,999 | 15 (3.9%) | 28 (7.3%) |
| $45,000 to $49,999 | 48 (12.5%) | 32 (8.4%) |
| $50,000 to $54,999 | 0 (0.0%) | 47 (12.3%) |
| $55,000 to $64,999 | 98 (25.6%) | 25 (6.6%) |
| $65,000 to $74,999 | 22 (5.7%) | 19 (5.0%) |
| $75,000 to $99,999 | 37 (9.7%) | 28 (7.3%) |
| $100,000+ | 32 (8.4%) | 3 (0.8%) |
| Total | 383 (100.0%) | 381 (100.0%) |
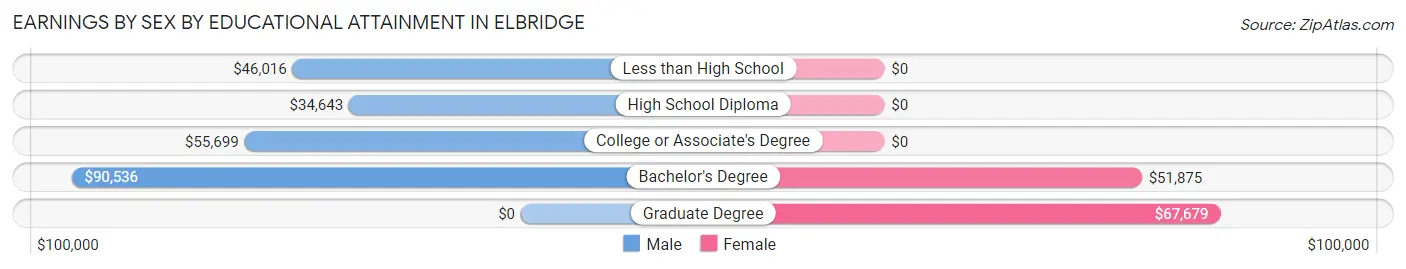
Earnings by Sex by Educational Attainment in Elbridge
Average earnings in Elbridge are $55,399 for men and $37,250 for women, a difference of 32.8%. Men with an educational attainment of bachelor's degree enjoy the highest average annual earnings of $90,536, while those with high school diploma education earn the least with $34,643. Women with an educational attainment of graduate degree earn the most with the average annual earnings of $67,679, while those with bachelor's degree education have the smallest earnings of $51,875.
| Educational Attainment | Male Income | Female Income |
| Less than High School | $46,016 | $0 |
| High School Diploma | $34,643 | $0 |
| College or Associate's Degree | $55,699 | $0 |
| Bachelor's Degree | $90,536 | $51,875 |
| Graduate Degree | - | - |
| Total | $55,399 | $37,250 |
Family Income in Elbridge
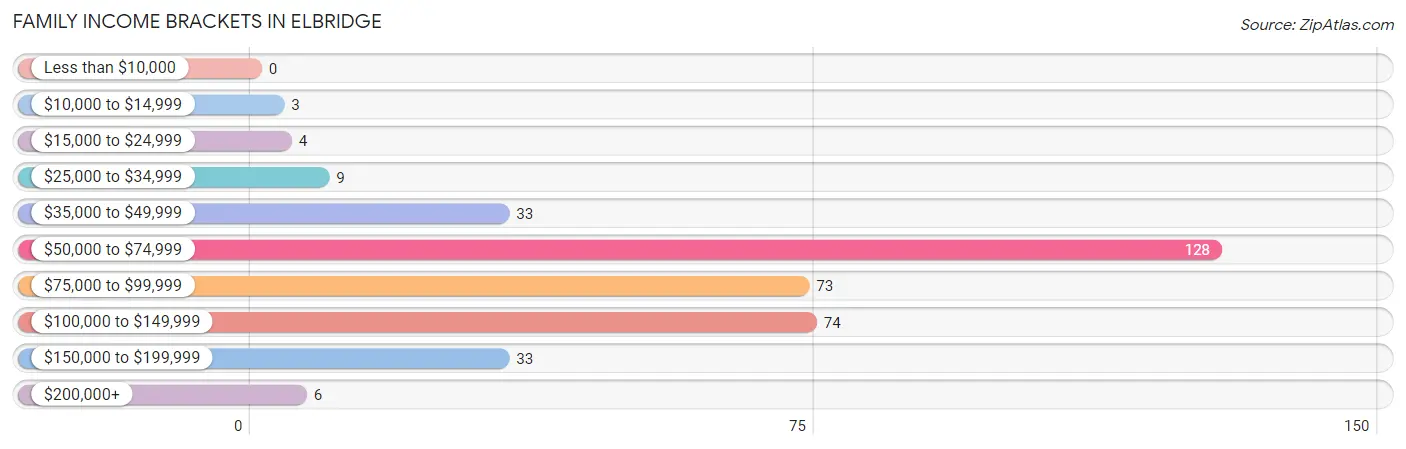
Family Income Brackets in Elbridge
According to the Elbridge family income data, there are 128 families falling into the $50,000 to $74,999 income range, which is the most common income bracket and makes up 35.3% of all families.
| Income Bracket | # Families | % Families |
| Less than $10,000 | 0 | 0.0% |
| $10,000 to $14,999 | 3 | 0.8% |
| $15,000 to $24,999 | 4 | 1.1% |
| $25,000 to $34,999 | 9 | 2.5% |
| $35,000 to $49,999 | 33 | 9.1% |
| $50,000 to $74,999 | 128 | 35.3% |
| $75,000 to $99,999 | 73 | 20.1% |
| $100,000 to $149,999 | 74 | 20.4% |
| $150,000 to $199,999 | 33 | 9.1% |
| $200,000+ | 6 | 1.7% |
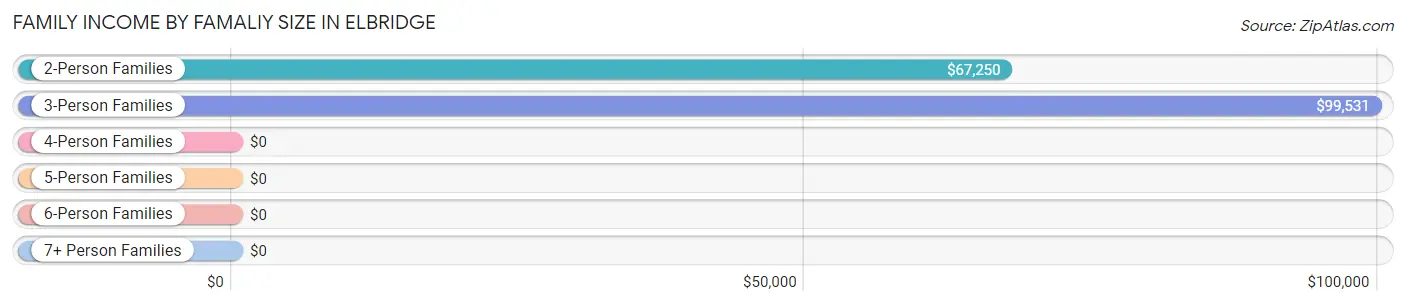
Family Income by Famaliy Size in Elbridge
3-person families (55 | 15.1%) account for the highest median family income in Elbridge with $99,531 per family, while 2-person families (144 | 39.7%) have the highest median income of $33,625 per family member.
| Income Bracket | # Families | Median Income |
| 2-Person Families | 144 (39.7%) | $67,250 |
| 3-Person Families | 55 (15.1%) | $99,531 |
| 4-Person Families | 140 (38.6%) | $0 |
| 5-Person Families | 13 (3.6%) | $0 |
| 6-Person Families | 11 (3.0%) | $0 |
| 7+ Person Families | 0 (0.0%) | $0 |
| Total | 363 (100.0%) | $80,417 |
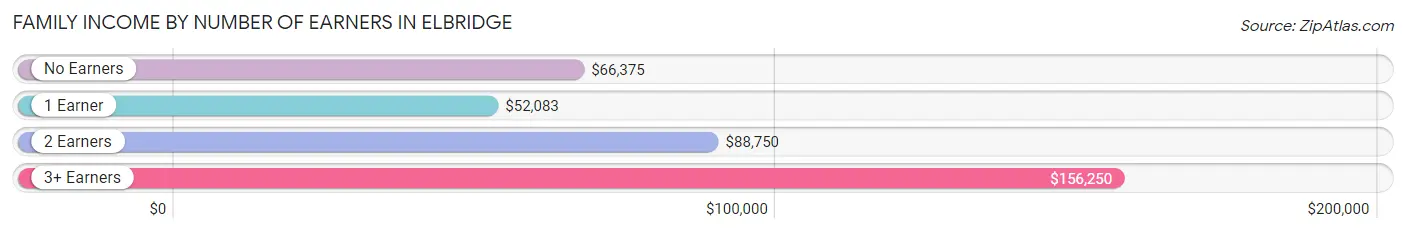
Family Income by Number of Earners in Elbridge
The median family income in Elbridge is $80,417, with families comprising 3+ earners (34) having the highest median family income of $156,250, while families with 1 earner (68) have the lowest median family income of $52,083, accounting for 9.4% and 18.7% of families, respectively.
| Number of Earners | # Families | Median Income |
| No Earners | 35 (9.6%) | $66,375 |
| 1 Earner | 68 (18.7%) | $52,083 |
| 2 Earners | 226 (62.3%) | $88,750 |
| 3+ Earners | 34 (9.4%) | $156,250 |
| Total | 363 (100.0%) | $80,417 |
Household Income in Elbridge
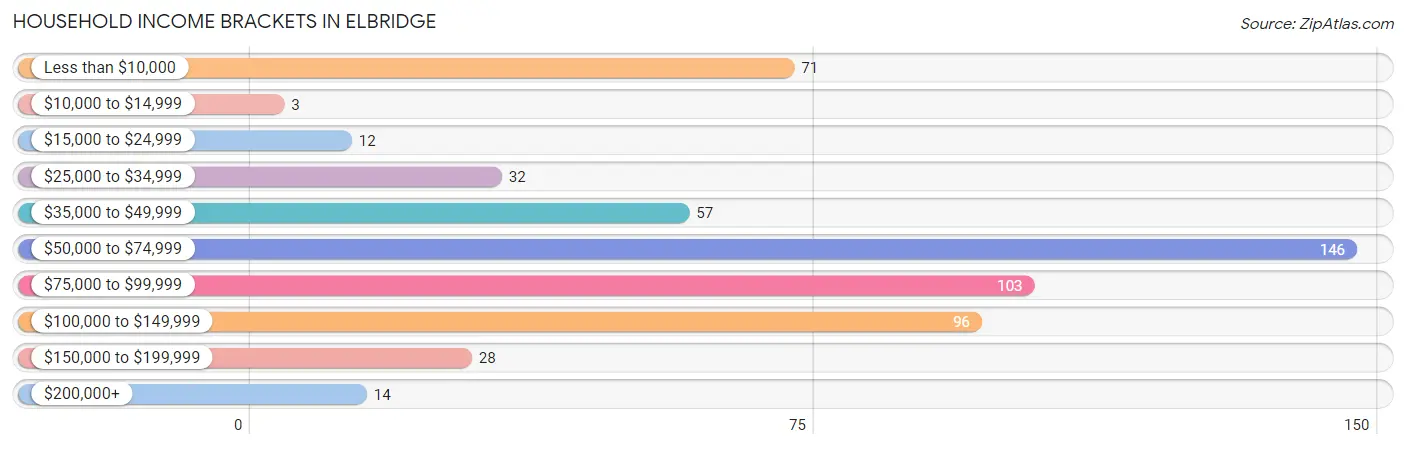
Household Income Brackets in Elbridge
With 146 households falling in the category, the $50,000 to $74,999 income range is the most frequent in Elbridge, accounting for 26.0% of all households. In contrast, only 3 households (0.5%) fall into the $10,000 to $14,999 income bracket, making it the least populous group.
| Income Bracket | # Households | % Households |
| Less than $10,000 | 71 | 12.6% |
| $10,000 to $14,999 | 3 | 0.5% |
| $15,000 to $24,999 | 12 | 2.1% |
| $25,000 to $34,999 | 32 | 5.7% |
| $35,000 to $49,999 | 57 | 10.1% |
| $50,000 to $74,999 | 146 | 26.0% |
| $75,000 to $99,999 | 103 | 18.3% |
| $100,000 to $149,999 | 96 | 17.1% |
| $150,000 to $199,999 | 28 | 5.0% |
| $200,000+ | 14 | 2.5% |
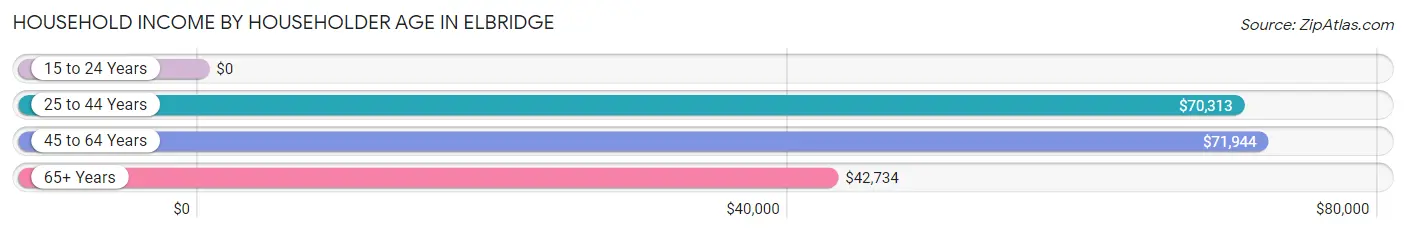
Household Income by Householder Age in Elbridge
The median household income in Elbridge is $59,937, with the highest median household income of $71,944 found in the 45 to 64 years age bracket for the primary householder. A total of 240 households (42.7%) fall into this category.
| Income Bracket | # Households | Median Income |
| 15 to 24 Years | 0 (0.0%) | $0 |
| 25 to 44 Years | 157 (27.9%) | $70,313 |
| 45 to 64 Years | 240 (42.7%) | $71,944 |
| 65+ Years | 165 (29.4%) | $42,734 |
| Total | 562 (100.0%) | $59,937 |
Poverty in Elbridge
Income Below Poverty by Sex and Age in Elbridge
With 4.1% poverty level for males and 7.8% for females among the residents of Elbridge, 75 year old and over males and 75 year old and over females are the most vulnerable to poverty, with 23 males (41.1%) and 19 females (30.2%) in their respective age groups living below the poverty level.
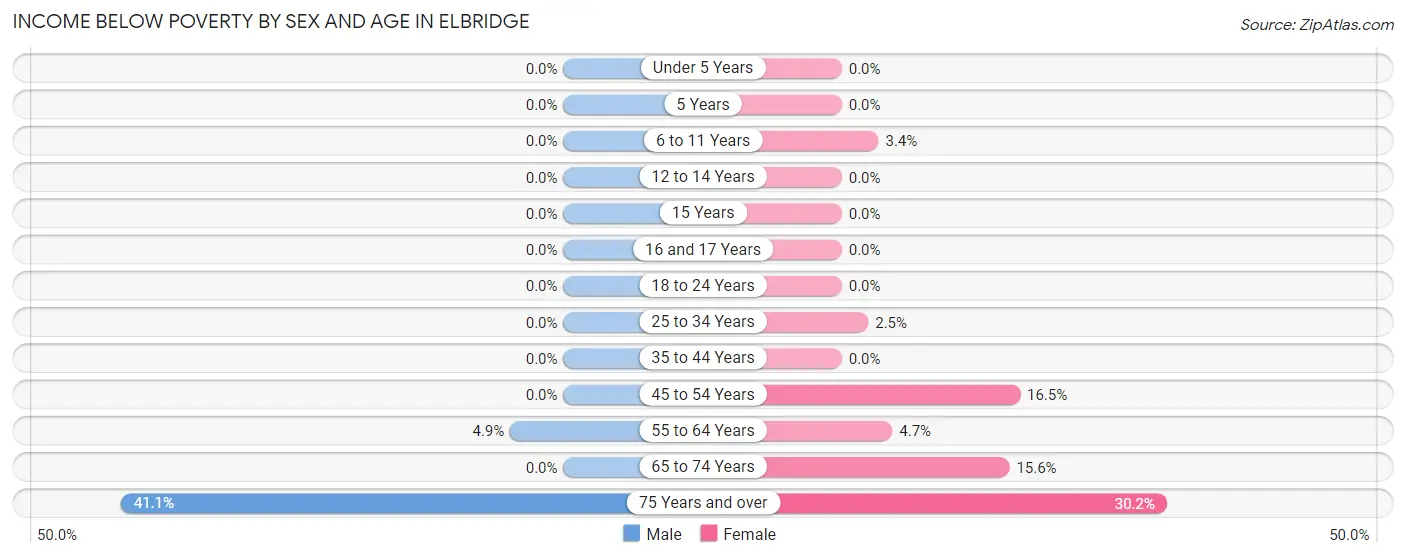
| Age Bracket | Male | Female |
| Under 5 Years | 0 (0.0%) | 0 (0.0%) |
| 5 Years | 0 (0.0%) | 0 (0.0%) |
| 6 to 11 Years | 0 (0.0%) | 3 (3.4%) |
| 12 to 14 Years | 0 (0.0%) | 0 (0.0%) |
| 15 Years | 0 (0.0%) | 0 (0.0%) |
| 16 and 17 Years | 0 (0.0%) | 0 (0.0%) |
| 18 to 24 Years | 0 (0.0%) | 0 (0.0%) |
| 25 to 34 Years | 0 (0.0%) | 3 (2.5%) |
| 35 to 44 Years | 0 (0.0%) | 0 (0.0%) |
| 45 to 54 Years | 0 (0.0%) | 22 (16.5%) |
| 55 to 64 Years | 4 (4.9%) | 3 (4.7%) |
| 65 to 74 Years | 0 (0.0%) | 7 (15.6%) |
| 75 Years and over | 23 (41.1%) | 19 (30.2%) |
| Total | 27 (4.1%) | 57 (7.8%) |
Income Above Poverty by Sex and Age in Elbridge
According to the poverty statistics in Elbridge, males aged under 5 years and females aged under 5 years are the age groups that are most secure financially, with 100.0% of males and 100.0% of females in these age groups living above the poverty line.
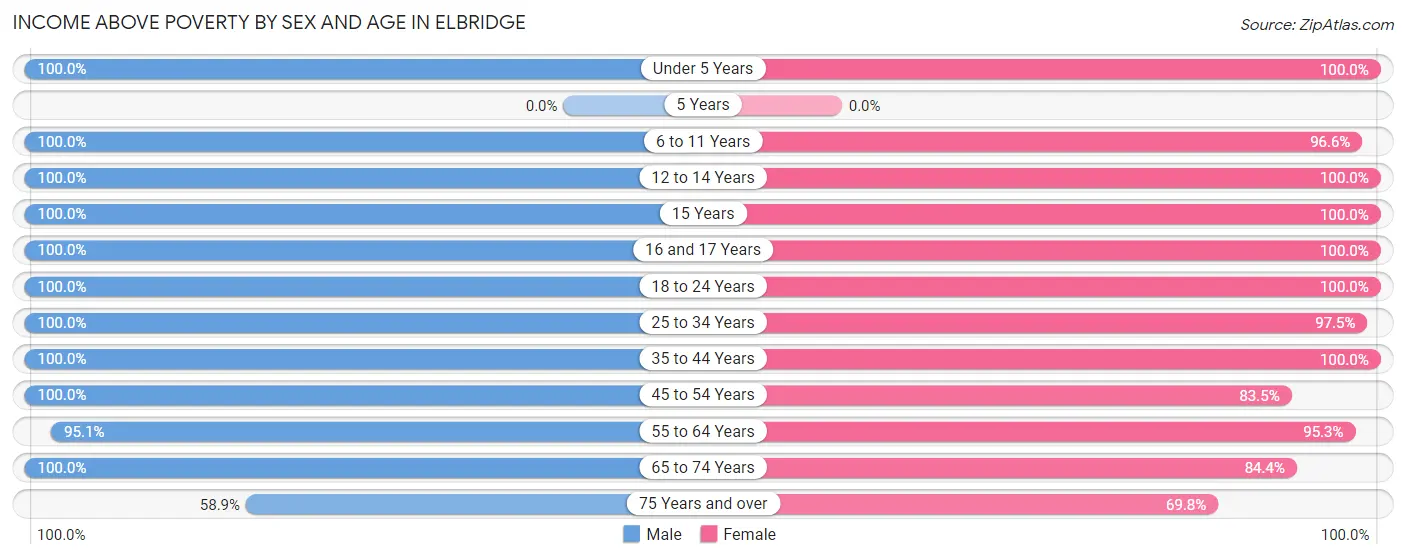
| Age Bracket | Male | Female |
| Under 5 Years | 82 (100.0%) | 84 (100.0%) |
| 5 Years | 0 (0.0%) | 0 (0.0%) |
| 6 to 11 Years | 30 (100.0%) | 85 (96.6%) |
| 12 to 14 Years | 17 (100.0%) | 19 (100.0%) |
| 15 Years | 14 (100.0%) | 12 (100.0%) |
| 16 and 17 Years | 17 (100.0%) | 19 (100.0%) |
| 18 to 24 Years | 42 (100.0%) | 15 (100.0%) |
| 25 to 34 Years | 91 (100.0%) | 119 (97.5%) |
| 35 to 44 Years | 70 (100.0%) | 68 (100.0%) |
| 45 to 54 Years | 86 (100.0%) | 111 (83.5%) |
| 55 to 64 Years | 77 (95.1%) | 61 (95.3%) |
| 65 to 74 Years | 66 (100.0%) | 38 (84.4%) |
| 75 Years and over | 33 (58.9%) | 44 (69.8%) |
| Total | 625 (95.9%) | 675 (92.2%) |
Income Below Poverty Among Married-Couple Families in Elbridge
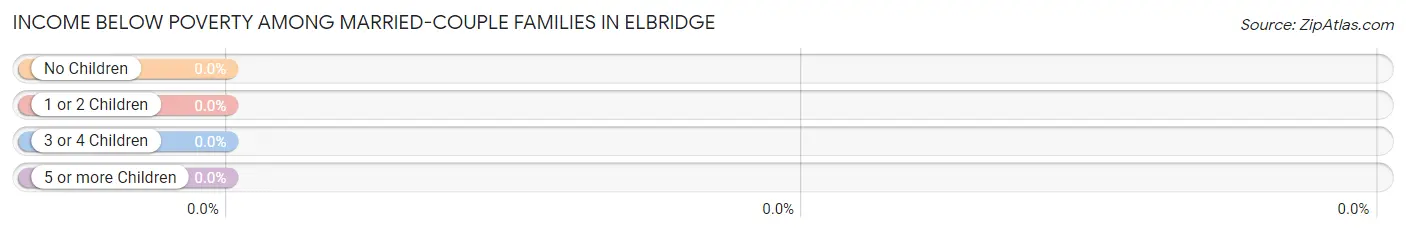
| Children | Above Poverty | Below Poverty |
| No Children | 144 (100.0%) | 0 (0.0%) |
| 1 or 2 Children | 142 (100.0%) | 0 (0.0%) |
| 3 or 4 Children | 18 (100.0%) | 0 (0.0%) |
| 5 or more Children | 0 (0.0%) | 0 (0.0%) |
| Total | 304 (100.0%) | 0 (0.0%) |
Income Below Poverty Among Single-Parent Households in Elbridge
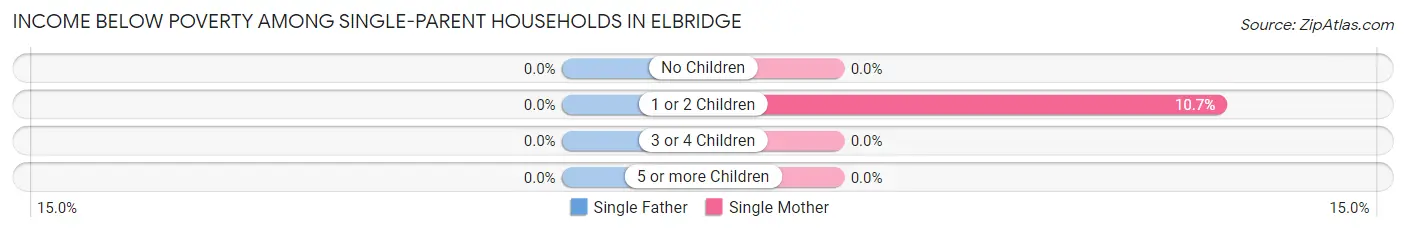
| Children | Single Father | Single Mother |
| No Children | 0 (0.0%) | 0 (0.0%) |
| 1 or 2 Children | 0 (0.0%) | 3 (10.7%) |
| 3 or 4 Children | 0 (0.0%) | 0 (0.0%) |
| 5 or more Children | 0 (0.0%) | 0 (0.0%) |
| Total | 0 (0.0%) | 3 (6.2%) |
Income Below Poverty Among Married-Couple vs Single-Parent Households in Elbridge
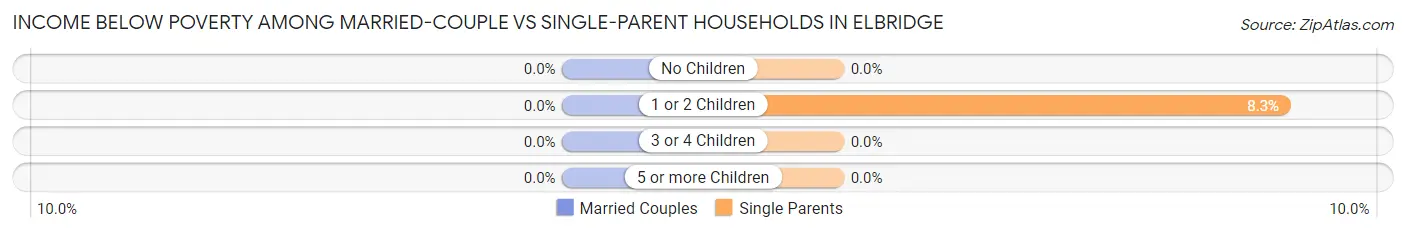
| Children | Married-Couple Families | Single-Parent Households |
| No Children | 0 (0.0%) | 0 (0.0%) |
| 1 or 2 Children | 0 (0.0%) | 3 (8.3%) |
| 3 or 4 Children | 0 (0.0%) | 0 (0.0%) |
| 5 or more Children | 0 (0.0%) | 0 (0.0%) |
| Total | 0 (0.0%) | 3 (5.1%) |
Employment Characteristics in Elbridge
Employment by Class of Employer in Elbridge
Among the 597 employed individuals in Elbridge, private company employees (356 | 59.6%), not-for-profit organizations (87 | 14.6%), and local government employees (46 | 7.7%) make up the most common classes of employment.
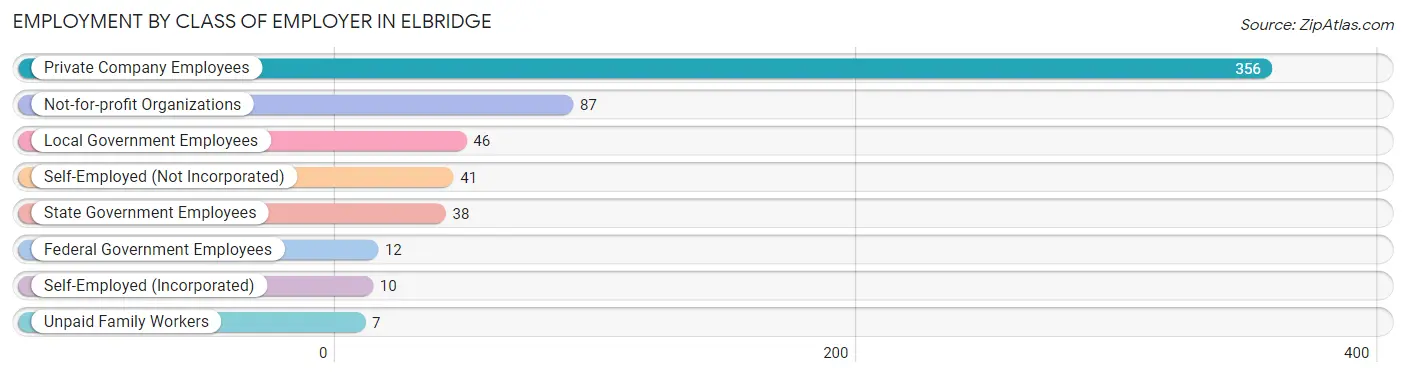
| Employer Class | # Employees | % Employees |
| Private Company Employees | 356 | 59.6% |
| Self-Employed (Incorporated) | 10 | 1.7% |
| Self-Employed (Not Incorporated) | 41 | 6.9% |
| Not-for-profit Organizations | 87 | 14.6% |
| Local Government Employees | 46 | 7.7% |
| State Government Employees | 38 | 6.4% |
| Federal Government Employees | 12 | 2.0% |
| Unpaid Family Workers | 7 | 1.2% |
| Total | 597 | 100.0% |
Employment Status by Age in Elbridge
According to the labor force statistics for Elbridge, out of the total population over 16 years of age (1,038), 62.2% or 646 individuals are in the labor force, with 7.0% or 45 of them unemployed. The age group with the highest labor force participation rate is 35 to 44 years, with 100.0% or 138 individuals in the labor force. Within the labor force, the 16 to 19 years age range has the highest percentage of unemployed individuals, with 50.0% or 4 of them being unemployed.
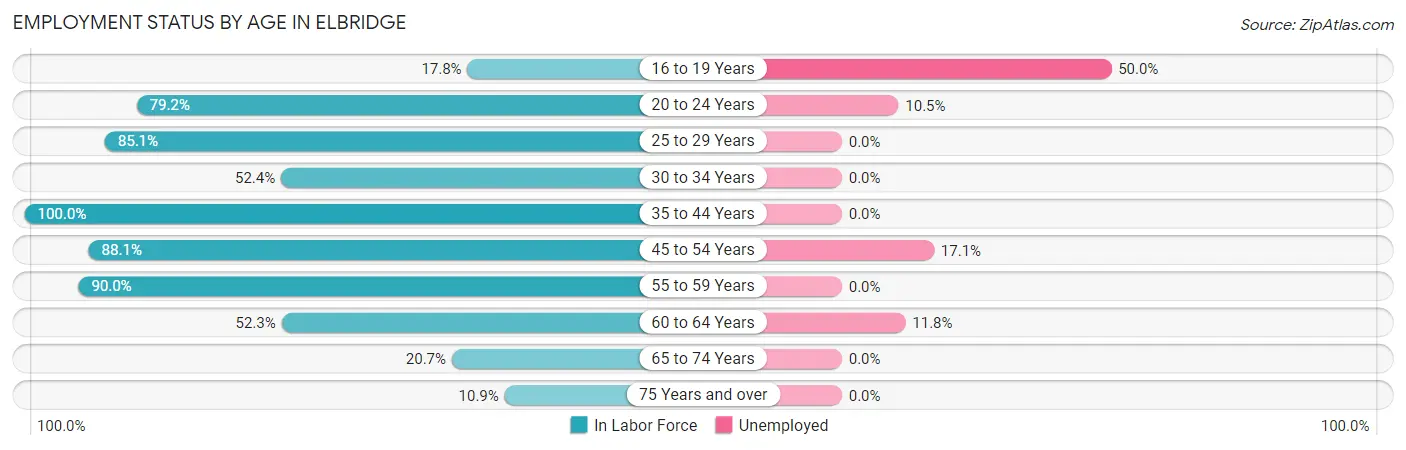
| Age Bracket | In Labor Force | Unemployed |
| 16 to 19 Years | 8 (17.8%) | 4 (50.0%) |
| 20 to 24 Years | 38 (79.2%) | 4 (10.5%) |
| 25 to 29 Years | 40 (85.1%) | 0 (0.0%) |
| 30 to 34 Years | 87 (52.4%) | 0 (0.0%) |
| 35 to 44 Years | 138 (100.0%) | 0 (0.0%) |
| 45 to 54 Years | 193 (88.1%) | 33 (17.1%) |
| 55 to 59 Years | 72 (90.0%) | 0 (0.0%) |
| 60 to 64 Years | 34 (52.3%) | 4 (11.8%) |
| 65 to 74 Years | 23 (20.7%) | 0 (0.0%) |
| 75 Years and over | 13 (10.9%) | 0 (0.0%) |
| Total | 646 (62.2%) | 45 (7.0%) |
Employment Status by Educational Attainment in Elbridge
According to labor force statistics for Elbridge, 78.9% of individuals (564) out of the total population between 25 and 64 years of age (715) are in the labor force, with 6.6% or 37 of them being unemployed. The group with the highest labor force participation rate are those with the educational attainment of bachelor's degree or higher, with 95.8% or 114 individuals in the labor force. Within the labor force, individuals with high school diploma education have the highest percentage of unemployment, with 21.1% or 26 of them being unemployed.
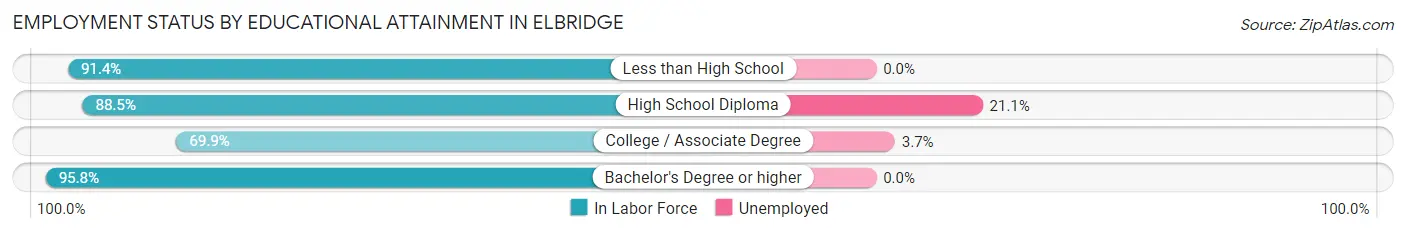
| Educational Attainment | In Labor Force | Unemployed |
| Less than High School | 32 (91.4%) | 0 (0.0%) |
| High School Diploma | 123 (88.5%) | 29 (21.1%) |
| College / Associate Degree | 295 (69.9%) | 16 (3.7%) |
| Bachelor's Degree or higher | 114 (95.8%) | 0 (0.0%) |
| Total | 564 (78.9%) | 47 (6.6%) |
Employment Occupations by Sex in Elbridge
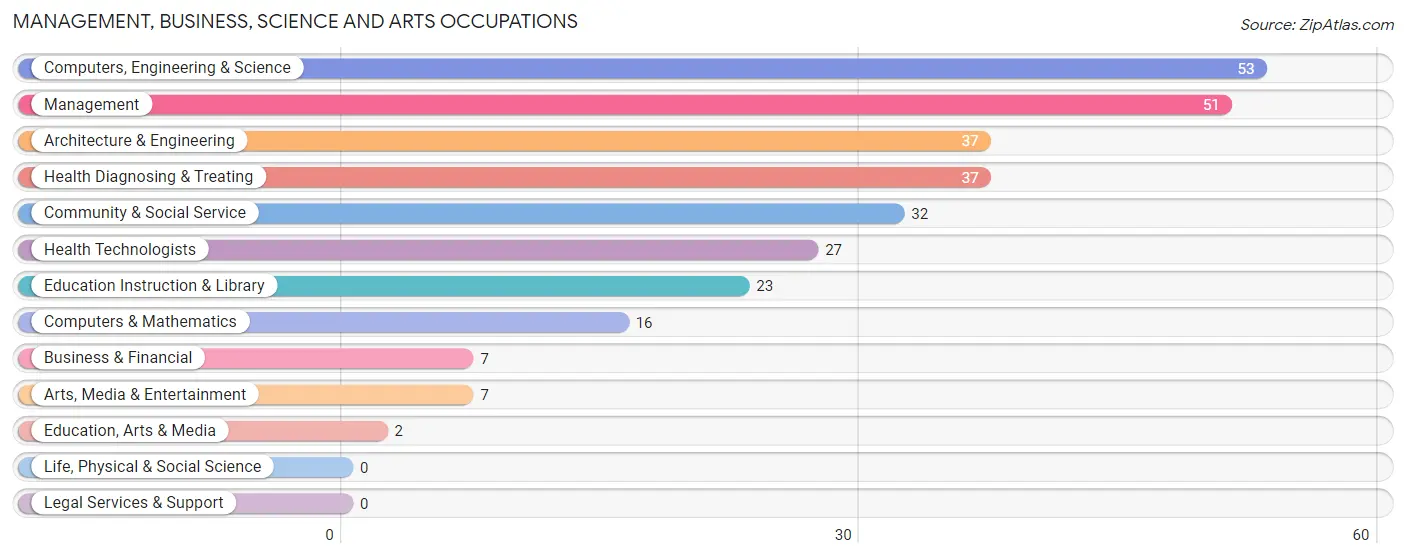
Management, Business, Science and Arts Occupations
The most common Management, Business, Science and Arts occupations in Elbridge are Computers, Engineering & Science (53 | 8.8%), Management (51 | 8.5%), Architecture & Engineering (37 | 6.2%), Health Diagnosing & Treating (37 | 6.2%), and Community & Social Service (32 | 5.3%).
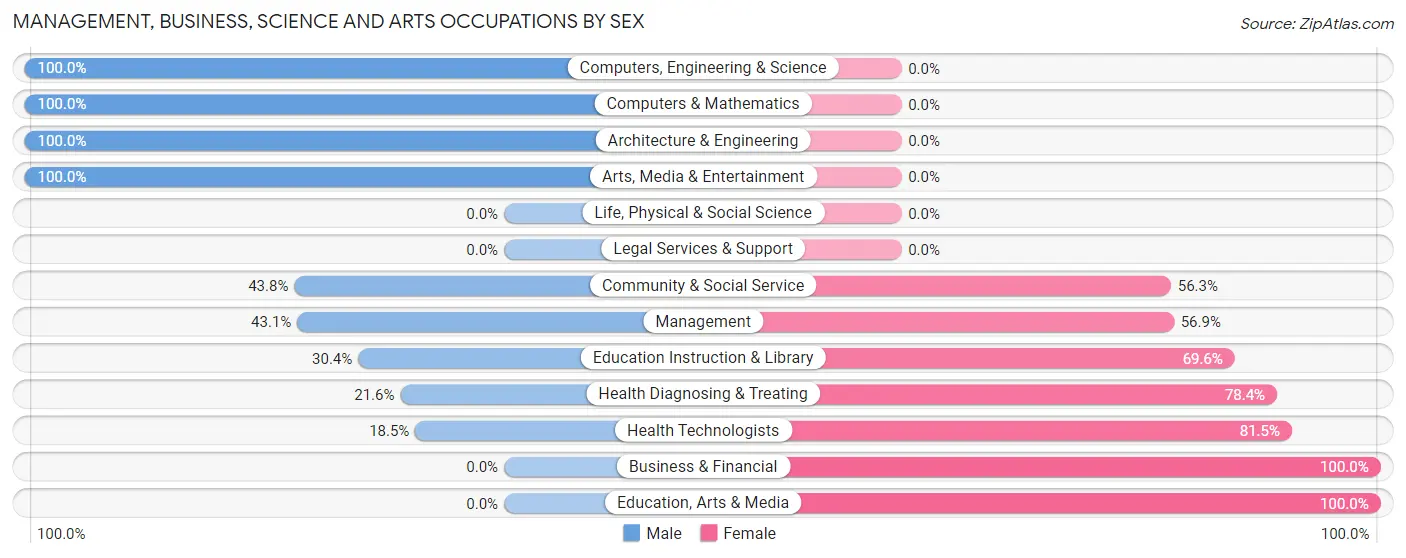
Management, Business, Science and Arts Occupations by Sex
Within the Management, Business, Science and Arts occupations in Elbridge, the most male-oriented occupations are Computers, Engineering & Science (100.0%), Computers & Mathematics (100.0%), and Architecture & Engineering (100.0%), while the most female-oriented occupations are Business & Financial (100.0%), Education, Arts & Media (100.0%), and Health Technologists (81.5%).
| Occupation | Male | Female |
| Management | 22 (43.1%) | 29 (56.9%) |
| Business & Financial | 0 (0.0%) | 7 (100.0%) |
| Computers, Engineering & Science | 53 (100.0%) | 0 (0.0%) |
| Computers & Mathematics | 16 (100.0%) | 0 (0.0%) |
| Architecture & Engineering | 37 (100.0%) | 0 (0.0%) |
| Life, Physical & Social Science | 0 (0.0%) | 0 (0.0%) |
| Community & Social Service | 14 (43.8%) | 18 (56.2%) |
| Education, Arts & Media | 0 (0.0%) | 2 (100.0%) |
| Legal Services & Support | 0 (0.0%) | 0 (0.0%) |
| Education Instruction & Library | 7 (30.4%) | 16 (69.6%) |
| Arts, Media & Entertainment | 7 (100.0%) | 0 (0.0%) |
| Health Diagnosing & Treating | 8 (21.6%) | 29 (78.4%) |
| Health Technologists | 5 (18.5%) | 22 (81.5%) |
| Total (Category) | 97 (53.9%) | 83 (46.1%) |
| Total (Overall) | 345 (57.4%) | 256 (42.6%) |
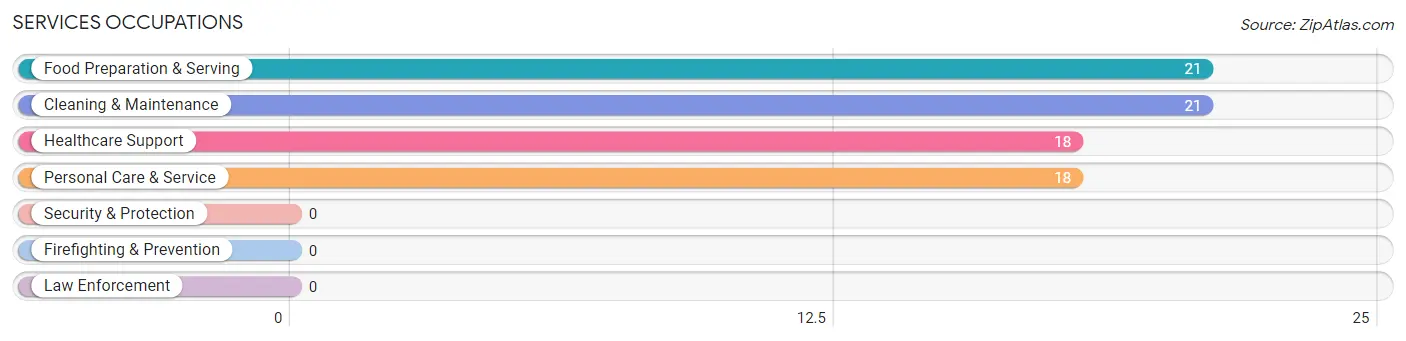
Services Occupations
The most common Services occupations in Elbridge are Food Preparation & Serving (21 | 3.5%), Cleaning & Maintenance (21 | 3.5%), Healthcare Support (18 | 3.0%), and Personal Care & Service (18 | 3.0%).
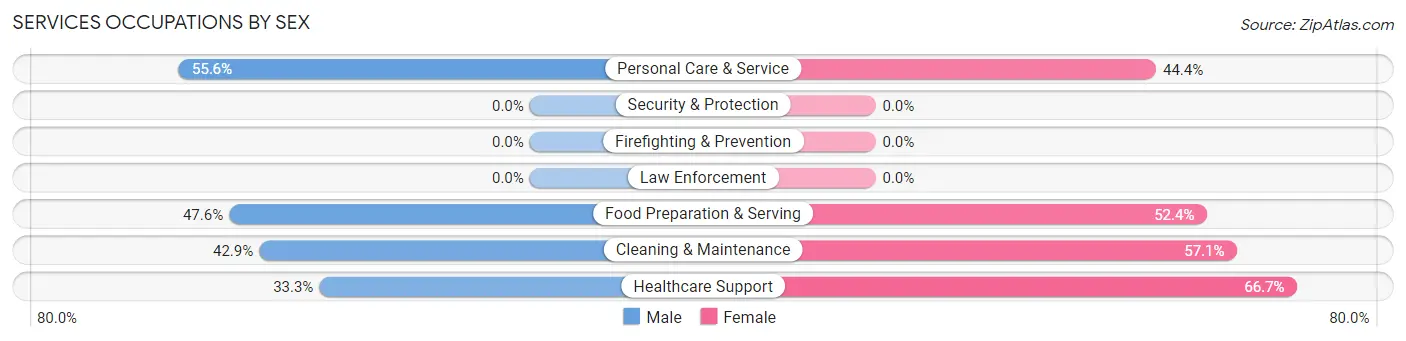
Services Occupations by Sex
Within the Services occupations in Elbridge, the most male-oriented occupations are Personal Care & Service (55.6%), Food Preparation & Serving (47.6%), and Cleaning & Maintenance (42.9%), while the most female-oriented occupations are Healthcare Support (66.7%), Cleaning & Maintenance (57.1%), and Food Preparation & Serving (52.4%).
| Occupation | Male | Female |
| Healthcare Support | 6 (33.3%) | 12 (66.7%) |
| Security & Protection | 0 (0.0%) | 0 (0.0%) |
| Firefighting & Prevention | 0 (0.0%) | 0 (0.0%) |
| Law Enforcement | 0 (0.0%) | 0 (0.0%) |
| Food Preparation & Serving | 10 (47.6%) | 11 (52.4%) |
| Cleaning & Maintenance | 9 (42.9%) | 12 (57.1%) |
| Personal Care & Service | 10 (55.6%) | 8 (44.4%) |
| Total (Category) | 35 (44.9%) | 43 (55.1%) |
| Total (Overall) | 345 (57.4%) | 256 (42.6%) |
Sales and Office Occupations
The most common Sales and Office occupations in Elbridge are Office & Administration (104 | 17.3%), and Sales & Related (61 | 10.2%).

Sales and Office Occupations by Sex

| Occupation | Male | Female |
| Sales & Related | 24 (39.3%) | 37 (60.7%) |
| Office & Administration | 23 (22.1%) | 81 (77.9%) |
| Total (Category) | 47 (28.5%) | 118 (71.5%) |
| Total (Overall) | 345 (57.4%) | 256 (42.6%) |
Natural Resources, Construction and Maintenance Occupations
The most common Natural Resources, Construction and Maintenance occupations in Elbridge are Construction & Extraction (86 | 14.3%), and Installation, Maintenance & Repair (40 | 6.7%).
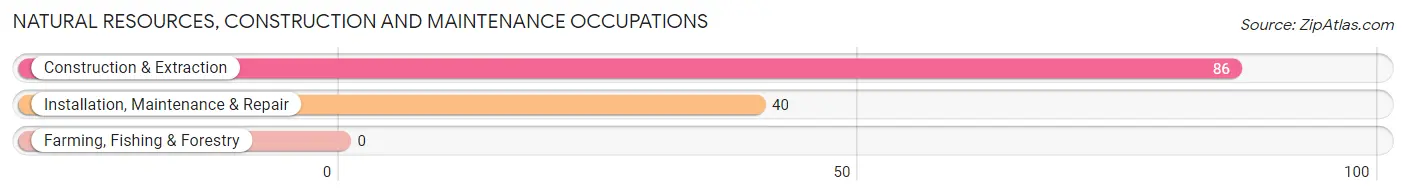
Natural Resources, Construction and Maintenance Occupations by Sex

| Occupation | Male | Female |
| Farming, Fishing & Forestry | 0 (0.0%) | 0 (0.0%) |
| Construction & Extraction | 86 (100.0%) | 0 (0.0%) |
| Installation, Maintenance & Repair | 34 (85.0%) | 6 (15.0%) |
| Total (Category) | 120 (95.2%) | 6 (4.8%) |
| Total (Overall) | 345 (57.4%) | 256 (42.6%) |
Production, Transportation and Moving Occupations
The most common Production, Transportation and Moving occupations in Elbridge are Production (31 | 5.2%), Transportation (11 | 1.8%), and Material Moving (10 | 1.7%).
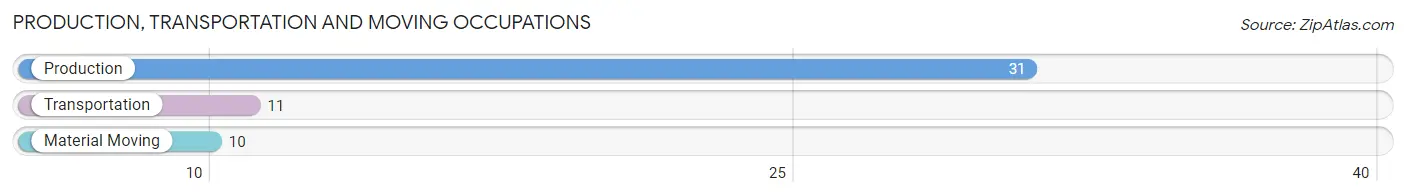
Production, Transportation and Moving Occupations by Sex
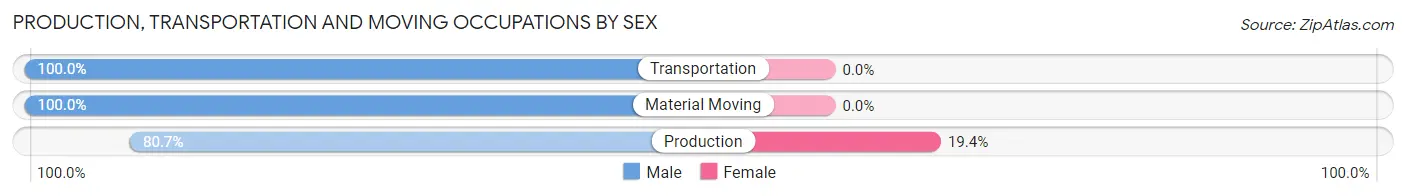
| Occupation | Male | Female |
| Production | 25 (80.6%) | 6 (19.4%) |
| Transportation | 11 (100.0%) | 0 (0.0%) |
| Material Moving | 10 (100.0%) | 0 (0.0%) |
| Total (Category) | 46 (88.5%) | 6 (11.5%) |
| Total (Overall) | 345 (57.4%) | 256 (42.6%) |
Employment Industries by Sex in Elbridge
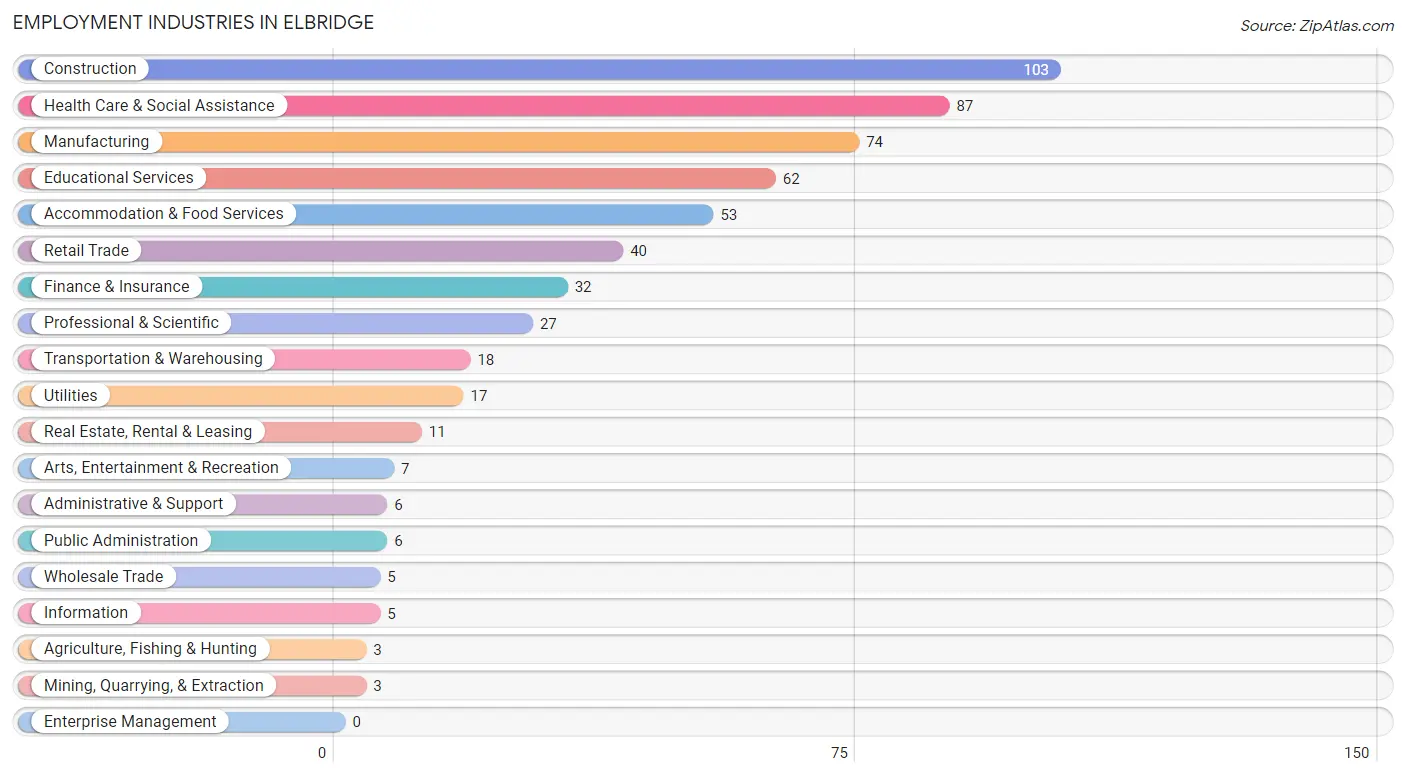
Employment Industries in Elbridge
The major employment industries in Elbridge include Construction (103 | 17.1%), Health Care & Social Assistance (87 | 14.5%), Manufacturing (74 | 12.3%), Educational Services (62 | 10.3%), and Accommodation & Food Services (53 | 8.8%).
Employment Industries by Sex in Elbridge
The Elbridge industries that see more men than women are Agriculture, Fishing & Hunting (100.0%), Mining, Quarrying, & Extraction (100.0%), and Construction (100.0%), whereas the industries that tend to have a higher number of women are Real Estate, Rental & Leasing (100.0%), Health Care & Social Assistance (83.9%), and Accommodation & Food Services (81.1%).
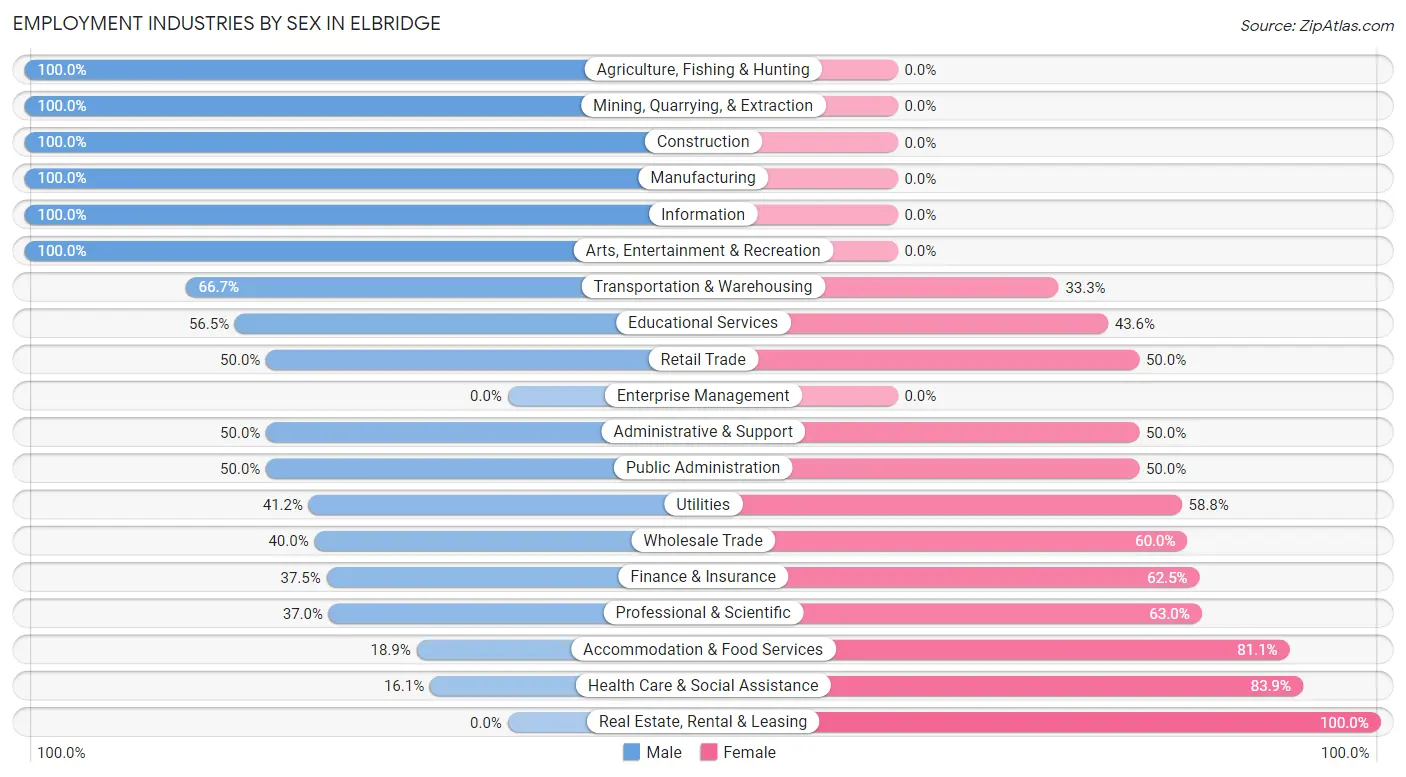
| Industry | Male | Female |
| Agriculture, Fishing & Hunting | 3 (100.0%) | 0 (0.0%) |
| Mining, Quarrying, & Extraction | 3 (100.0%) | 0 (0.0%) |
| Construction | 103 (100.0%) | 0 (0.0%) |
| Manufacturing | 74 (100.0%) | 0 (0.0%) |
| Wholesale Trade | 2 (40.0%) | 3 (60.0%) |
| Retail Trade | 20 (50.0%) | 20 (50.0%) |
| Transportation & Warehousing | 12 (66.7%) | 6 (33.3%) |
| Utilities | 7 (41.2%) | 10 (58.8%) |
| Information | 5 (100.0%) | 0 (0.0%) |
| Finance & Insurance | 12 (37.5%) | 20 (62.5%) |
| Real Estate, Rental & Leasing | 0 (0.0%) | 11 (100.0%) |
| Professional & Scientific | 10 (37.0%) | 17 (63.0%) |
| Enterprise Management | 0 (0.0%) | 0 (0.0%) |
| Administrative & Support | 3 (50.0%) | 3 (50.0%) |
| Educational Services | 35 (56.5%) | 27 (43.5%) |
| Health Care & Social Assistance | 14 (16.1%) | 73 (83.9%) |
| Arts, Entertainment & Recreation | 7 (100.0%) | 0 (0.0%) |
| Accommodation & Food Services | 10 (18.9%) | 43 (81.1%) |
| Public Administration | 3 (50.0%) | 3 (50.0%) |
| Total | 345 (57.4%) | 256 (42.6%) |
Education in Elbridge
School Enrollment in Elbridge
The most common levels of schooling among the 342 students in Elbridge are middle school (91 | 26.6%), high school (77 | 22.5%), and nursery / preschool (73 | 21.3%).
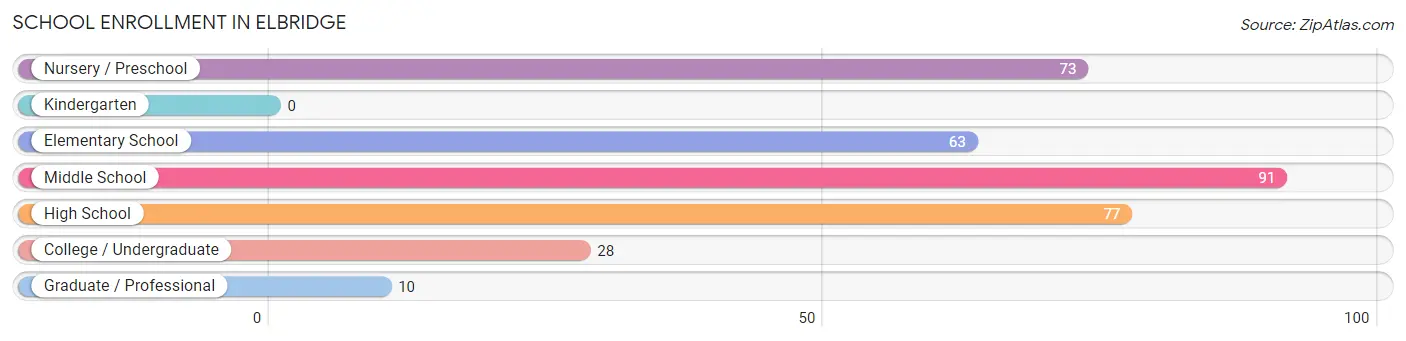
| School Level | # Students | % Students |
| Nursery / Preschool | 73 | 21.3% |
| Kindergarten | 0 | 0.0% |
| Elementary School | 63 | 18.4% |
| Middle School | 91 | 26.6% |
| High School | 77 | 22.5% |
| College / Undergraduate | 28 | 8.2% |
| Graduate / Professional | 10 | 2.9% |
| Total | 342 | 100.0% |
School Enrollment by Age by Funding Source in Elbridge
Out of a total of 342 students who are enrolled in schools in Elbridge, 15 (4.4%) attend a private institution, while the remaining 327 (95.6%) are enrolled in public schools. The age group of 20 to 24 year olds has the highest likelihood of being enrolled in private schools, with 7 (100.0% in the age bracket) enrolled. Conversely, the age group of 3 to 4 year olds has the lowest likelihood of being enrolled in a private school, with 73 (100.0% in the age bracket) attending a public institution.
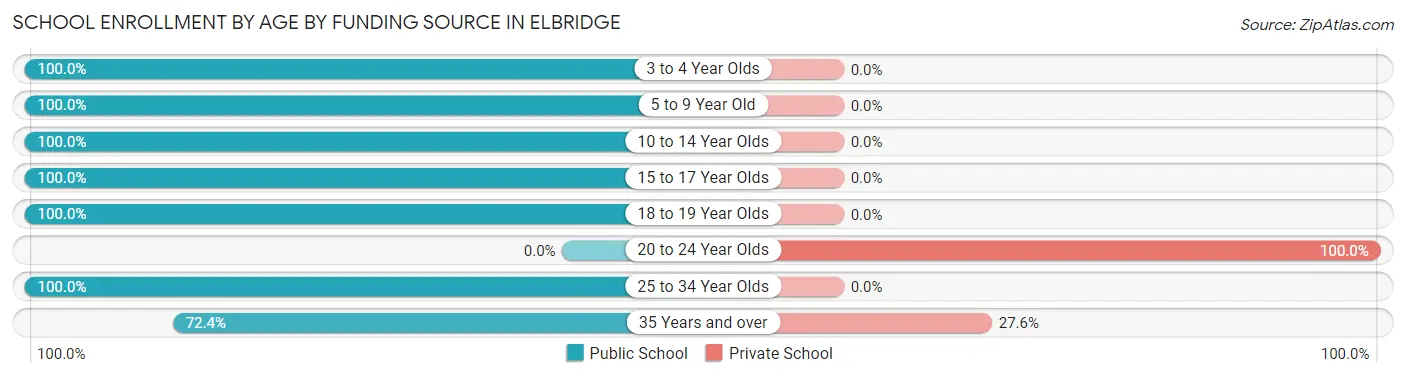
| Age Bracket | Public School | Private School |
| 3 to 4 Year Olds | 73 (100.0%) | 0 (0.0%) |
| 5 to 9 Year Old | 53 (100.0%) | 0 (0.0%) |
| 10 to 14 Year Olds | 101 (100.0%) | 0 (0.0%) |
| 15 to 17 Year Olds | 62 (100.0%) | 0 (0.0%) |
| 18 to 19 Year Olds | 7 (100.0%) | 0 (0.0%) |
| 20 to 24 Year Olds | 0 (0.0%) | 7 (100.0%) |
| 25 to 34 Year Olds | 10 (100.0%) | 0 (0.0%) |
| 35 Years and over | 21 (72.4%) | 8 (27.6%) |
| Total | 327 (95.6%) | 15 (4.4%) |
Educational Attainment by Field of Study in Elbridge
Science & technology (34 | 18.4%), engineering (29 | 15.7%), education (27 | 14.6%), communications (16 | 8.6%), and business (14 | 7.6%) are the most common fields of study among 185 individuals in Elbridge who have obtained a bachelor's degree or higher.
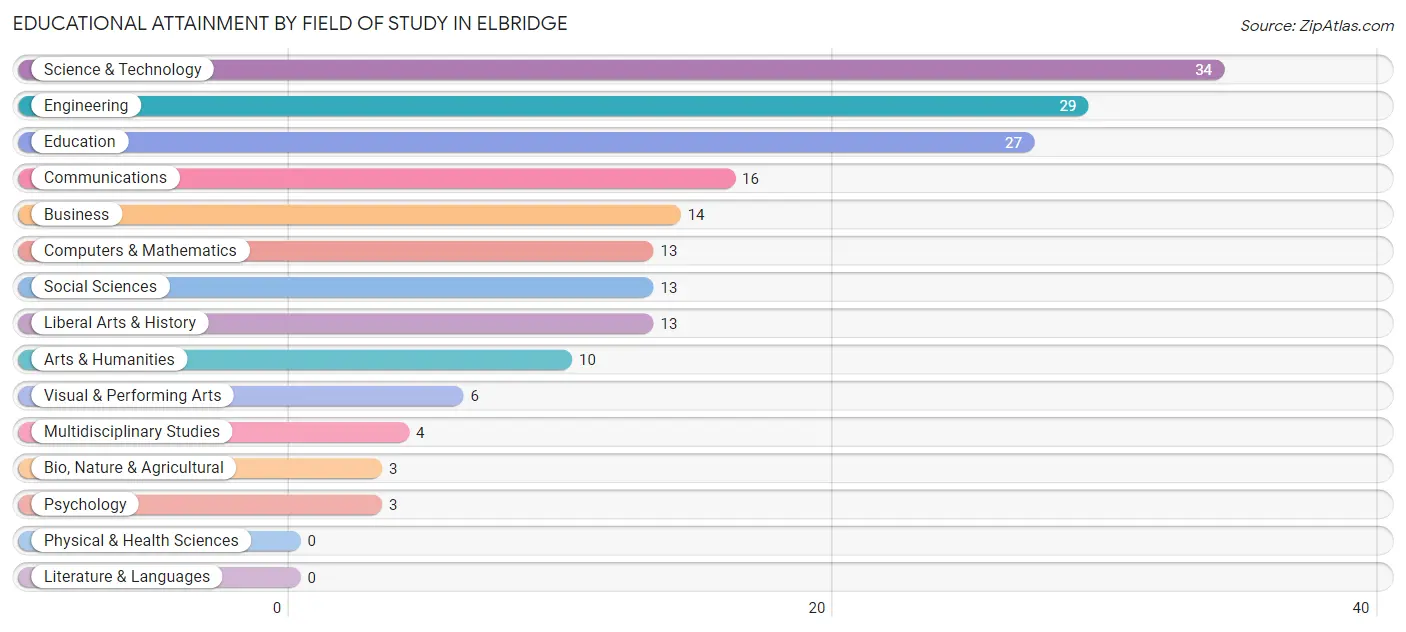
| Field of Study | # Graduates | % Graduates |
| Computers & Mathematics | 13 | 7.0% |
| Bio, Nature & Agricultural | 3 | 1.6% |
| Physical & Health Sciences | 0 | 0.0% |
| Psychology | 3 | 1.6% |
| Social Sciences | 13 | 7.0% |
| Engineering | 29 | 15.7% |
| Multidisciplinary Studies | 4 | 2.2% |
| Science & Technology | 34 | 18.4% |
| Business | 14 | 7.6% |
| Education | 27 | 14.6% |
| Literature & Languages | 0 | 0.0% |
| Liberal Arts & History | 13 | 7.0% |
| Visual & Performing Arts | 6 | 3.2% |
| Communications | 16 | 8.6% |
| Arts & Humanities | 10 | 5.4% |
| Total | 185 | 100.0% |
Transportation & Commute in Elbridge
Vehicle Availability by Sex in Elbridge
The most prevalent vehicle ownership categories in Elbridge are males with 2 vehicles (173, accounting for 50.7%) and females with 2 vehicles (174, making up 67.6%).
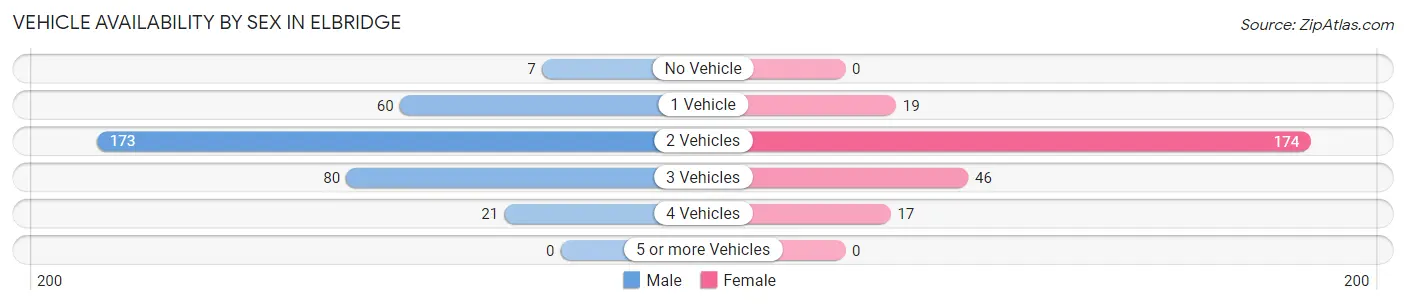
| Vehicles Available | Male | Female |
| No Vehicle | 7 (2.1%) | 0 (0.0%) |
| 1 Vehicle | 60 (17.6%) | 19 (7.4%) |
| 2 Vehicles | 173 (50.7%) | 174 (68.0%) |
| 3 Vehicles | 80 (23.5%) | 46 (18.0%) |
| 4 Vehicles | 21 (6.2%) | 17 (6.6%) |
| 5 or more Vehicles | 0 (0.0%) | 0 (0.0%) |
| Total | 341 (100.0%) | 256 (100.0%) |
Commute Time in Elbridge
The most frequently occuring commute durations in Elbridge are 15 to 19 minutes (117 commuters, 20.8%), 30 to 34 minutes (86 commuters, 15.3%), and 20 to 24 minutes (81 commuters, 14.4%).
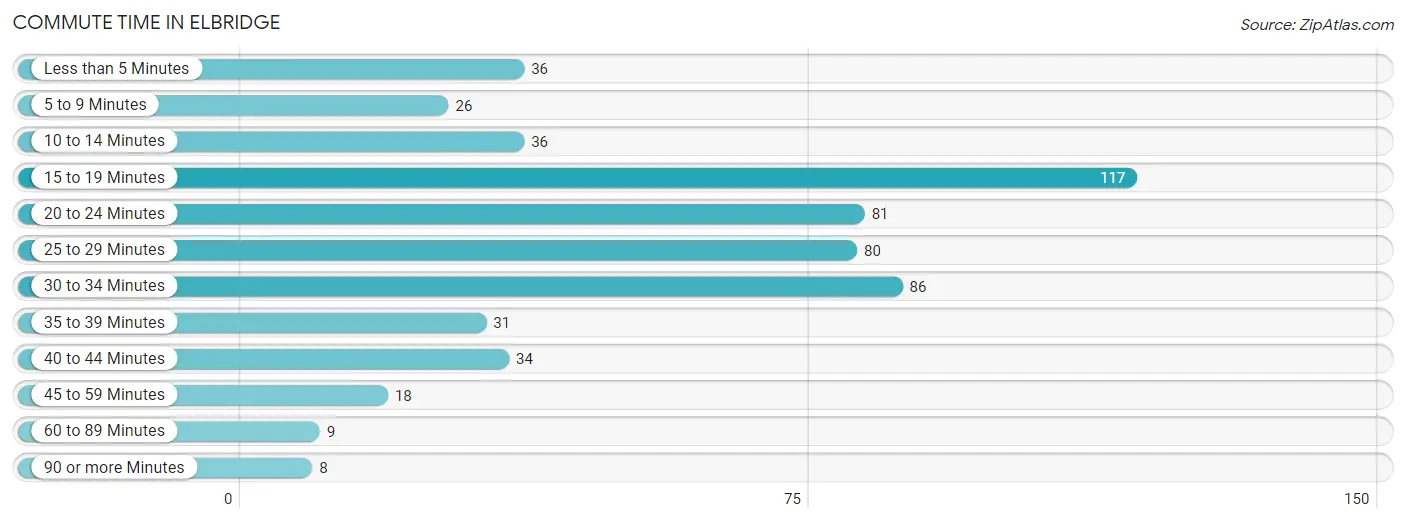
| Commute Time | # Commuters | % Commuters |
| Less than 5 Minutes | 36 | 6.4% |
| 5 to 9 Minutes | 26 | 4.6% |
| 10 to 14 Minutes | 36 | 6.4% |
| 15 to 19 Minutes | 117 | 20.8% |
| 20 to 24 Minutes | 81 | 14.4% |
| 25 to 29 Minutes | 80 | 14.2% |
| 30 to 34 Minutes | 86 | 15.3% |
| 35 to 39 Minutes | 31 | 5.5% |
| 40 to 44 Minutes | 34 | 6.0% |
| 45 to 59 Minutes | 18 | 3.2% |
| 60 to 89 Minutes | 9 | 1.6% |
| 90 or more Minutes | 8 | 1.4% |
Commute Time by Sex in Elbridge
The most common commute times in Elbridge are 15 to 19 minutes (91 commuters, 28.8%) for males and 25 to 29 minutes (53 commuters, 21.5%) for females.
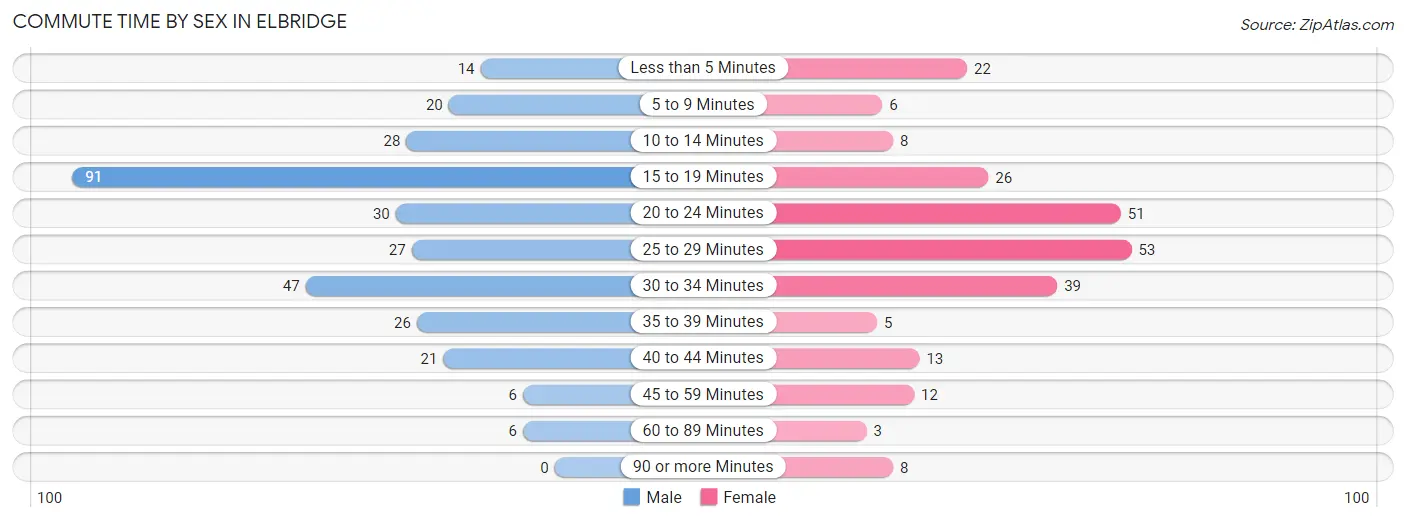
| Commute Time | Male | Female |
| Less than 5 Minutes | 14 (4.4%) | 22 (8.9%) |
| 5 to 9 Minutes | 20 (6.3%) | 6 (2.4%) |
| 10 to 14 Minutes | 28 (8.9%) | 8 (3.3%) |
| 15 to 19 Minutes | 91 (28.8%) | 26 (10.6%) |
| 20 to 24 Minutes | 30 (9.5%) | 51 (20.7%) |
| 25 to 29 Minutes | 27 (8.5%) | 53 (21.5%) |
| 30 to 34 Minutes | 47 (14.9%) | 39 (15.9%) |
| 35 to 39 Minutes | 26 (8.2%) | 5 (2.0%) |
| 40 to 44 Minutes | 21 (6.7%) | 13 (5.3%) |
| 45 to 59 Minutes | 6 (1.9%) | 12 (4.9%) |
| 60 to 89 Minutes | 6 (1.9%) | 3 (1.2%) |
| 90 or more Minutes | 0 (0.0%) | 8 (3.3%) |
Time of Departure to Work by Sex in Elbridge
The most frequent times of departure to work in Elbridge are 7:00 AM to 7:29 AM (62, 19.6%) for males and 7:30 AM to 7:59 AM (50, 20.3%) for females.
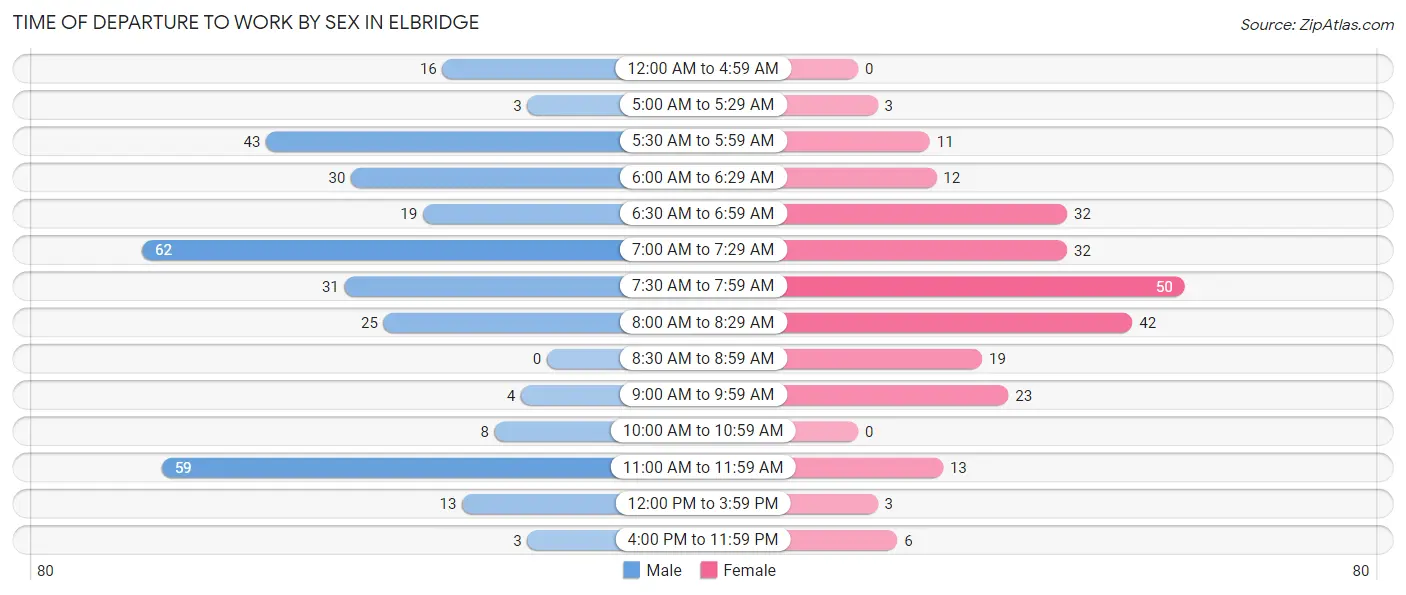
| Time of Departure | Male | Female |
| 12:00 AM to 4:59 AM | 16 (5.1%) | 0 (0.0%) |
| 5:00 AM to 5:29 AM | 3 (0.9%) | 3 (1.2%) |
| 5:30 AM to 5:59 AM | 43 (13.6%) | 11 (4.5%) |
| 6:00 AM to 6:29 AM | 30 (9.5%) | 12 (4.9%) |
| 6:30 AM to 6:59 AM | 19 (6.0%) | 32 (13.0%) |
| 7:00 AM to 7:29 AM | 62 (19.6%) | 32 (13.0%) |
| 7:30 AM to 7:59 AM | 31 (9.8%) | 50 (20.3%) |
| 8:00 AM to 8:29 AM | 25 (7.9%) | 42 (17.1%) |
| 8:30 AM to 8:59 AM | 0 (0.0%) | 19 (7.7%) |
| 9:00 AM to 9:59 AM | 4 (1.3%) | 23 (9.3%) |
| 10:00 AM to 10:59 AM | 8 (2.5%) | 0 (0.0%) |
| 11:00 AM to 11:59 AM | 59 (18.7%) | 13 (5.3%) |
| 12:00 PM to 3:59 PM | 13 (4.1%) | 3 (1.2%) |
| 4:00 PM to 11:59 PM | 3 (0.9%) | 6 (2.4%) |
| Total | 316 (100.0%) | 246 (100.0%) |
Housing Occupancy in Elbridge
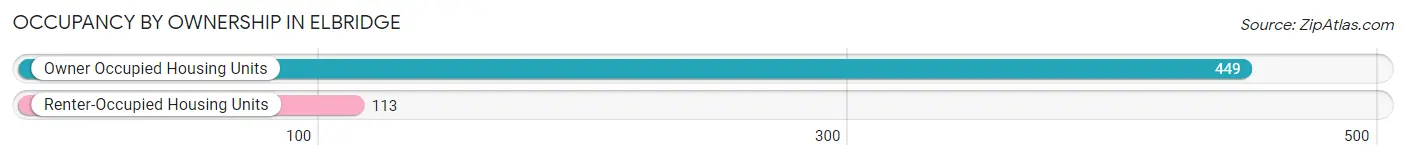
Occupancy by Ownership in Elbridge
Of the total 562 dwellings in Elbridge, owner-occupied units account for 449 (79.9%), while renter-occupied units make up 113 (20.1%).
| Occupancy | # Housing Units | % Housing Units |
| Owner Occupied Housing Units | 449 | 79.9% |
| Renter-Occupied Housing Units | 113 | 20.1% |
| Total Occupied Housing Units | 562 | 100.0% |
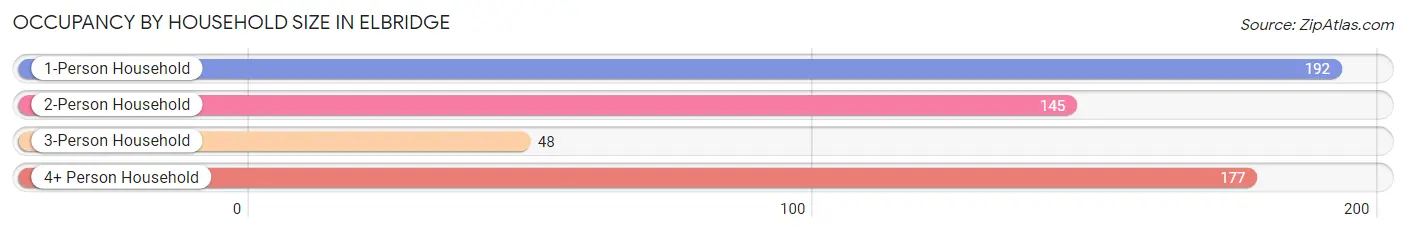
Occupancy by Household Size in Elbridge
| Household Size | # Housing Units | % Housing Units |
| 1-Person Household | 192 | 34.2% |
| 2-Person Household | 145 | 25.8% |
| 3-Person Household | 48 | 8.5% |
| 4+ Person Household | 177 | 31.5% |
| Total Housing Units | 562 | 100.0% |
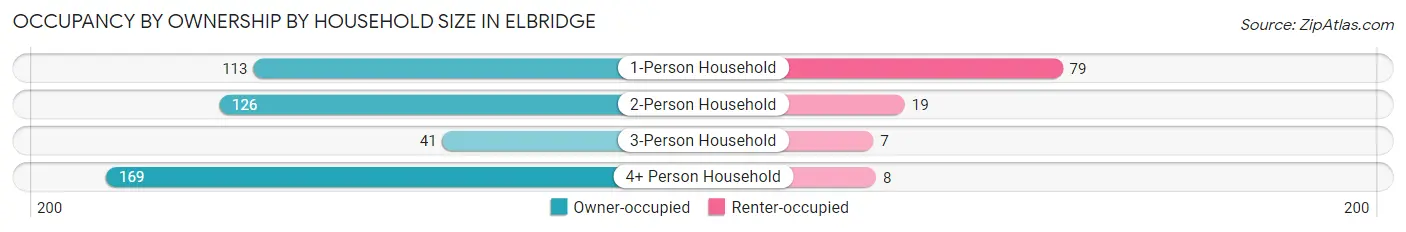
Occupancy by Ownership by Household Size in Elbridge
| Household Size | Owner-occupied | Renter-occupied |
| 1-Person Household | 113 (58.9%) | 79 (41.1%) |
| 2-Person Household | 126 (86.9%) | 19 (13.1%) |
| 3-Person Household | 41 (85.4%) | 7 (14.6%) |
| 4+ Person Household | 169 (95.5%) | 8 (4.5%) |
| Total Housing Units | 449 (79.9%) | 113 (20.1%) |
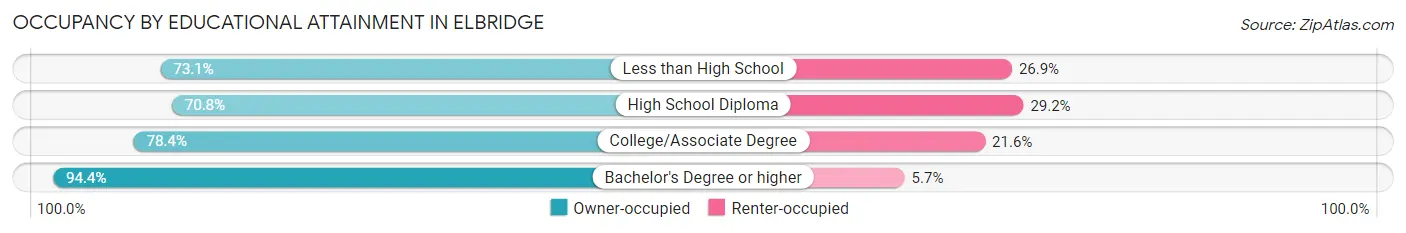
Occupancy by Educational Attainment in Elbridge
| Household Size | Owner-occupied | Renter-occupied |
| Less than High School | 38 (73.1%) | 14 (26.9%) |
| High School Diploma | 80 (70.8%) | 33 (29.2%) |
| College/Associate Degree | 214 (78.4%) | 59 (21.6%) |
| Bachelor's Degree or higher | 117 (94.4%) | 7 (5.7%) |
Occupancy by Age of Householder in Elbridge
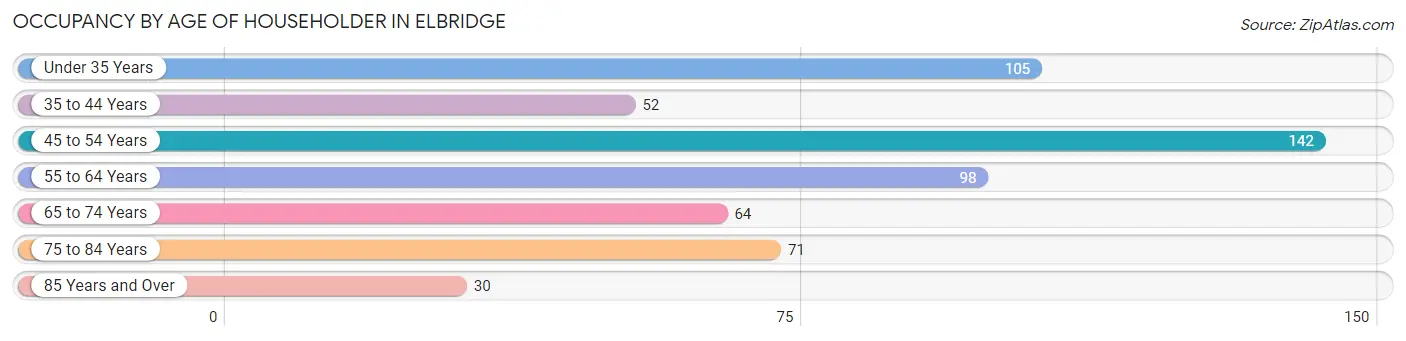
| Age Bracket | # Households | % Households |
| Under 35 Years | 105 | 18.7% |
| 35 to 44 Years | 52 | 9.2% |
| 45 to 54 Years | 142 | 25.3% |
| 55 to 64 Years | 98 | 17.4% |
| 65 to 74 Years | 64 | 11.4% |
| 75 to 84 Years | 71 | 12.6% |
| 85 Years and Over | 30 | 5.3% |
| Total | 562 | 100.0% |
Housing Finances in Elbridge
Median Income by Occupancy in Elbridge
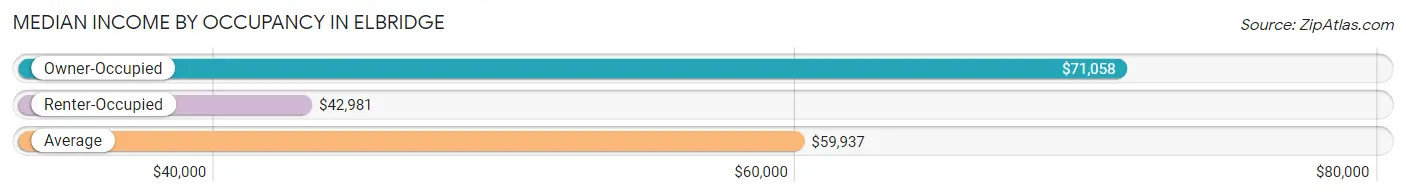
| Occupancy Type | # Households | Median Income |
| Owner-Occupied | 449 (79.9%) | $71,058 |
| Renter-Occupied | 113 (20.1%) | $42,981 |
| Average | 562 (100.0%) | $59,937 |
Occupancy by Householder Income Bracket in Elbridge
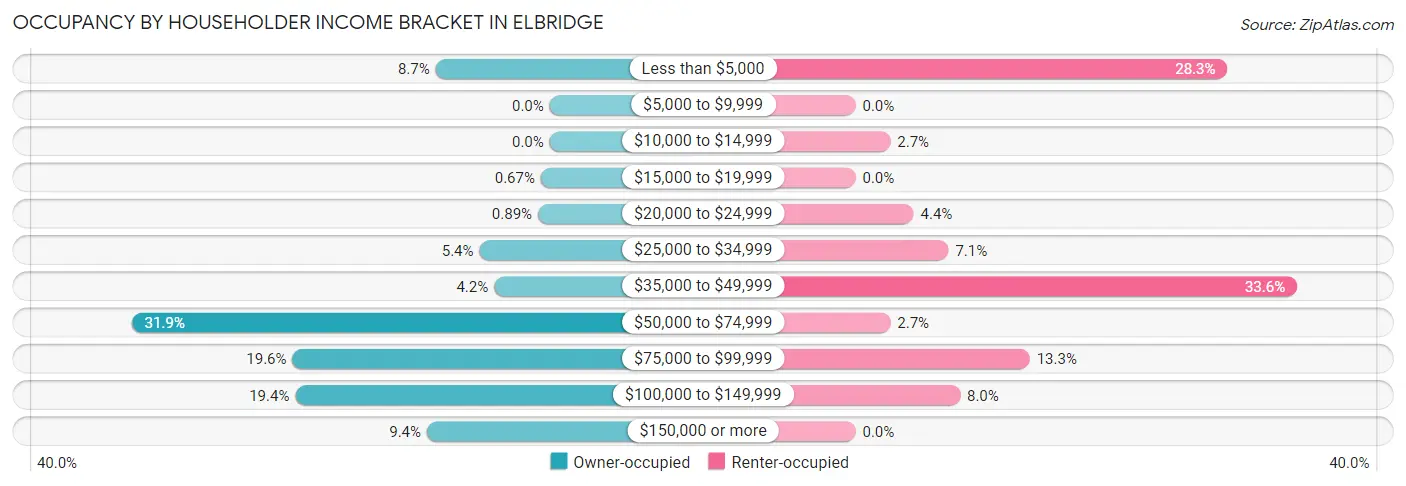
| Income Bracket | Owner-occupied | Renter-occupied |
| Less than $5,000 | 39 (8.7%) | 32 (28.3%) |
| $5,000 to $9,999 | 0 (0.0%) | 0 (0.0%) |
| $10,000 to $14,999 | 0 (0.0%) | 3 (2.6%) |
| $15,000 to $19,999 | 3 (0.7%) | 0 (0.0%) |
| $20,000 to $24,999 | 4 (0.9%) | 5 (4.4%) |
| $25,000 to $34,999 | 24 (5.3%) | 8 (7.1%) |
| $35,000 to $49,999 | 19 (4.2%) | 38 (33.6%) |
| $50,000 to $74,999 | 143 (31.9%) | 3 (2.6%) |
| $75,000 to $99,999 | 88 (19.6%) | 15 (13.3%) |
| $100,000 to $149,999 | 87 (19.4%) | 9 (8.0%) |
| $150,000 or more | 42 (9.3%) | 0 (0.0%) |
| Total | 449 (100.0%) | 113 (100.0%) |
Monthly Housing Cost Tiers in Elbridge
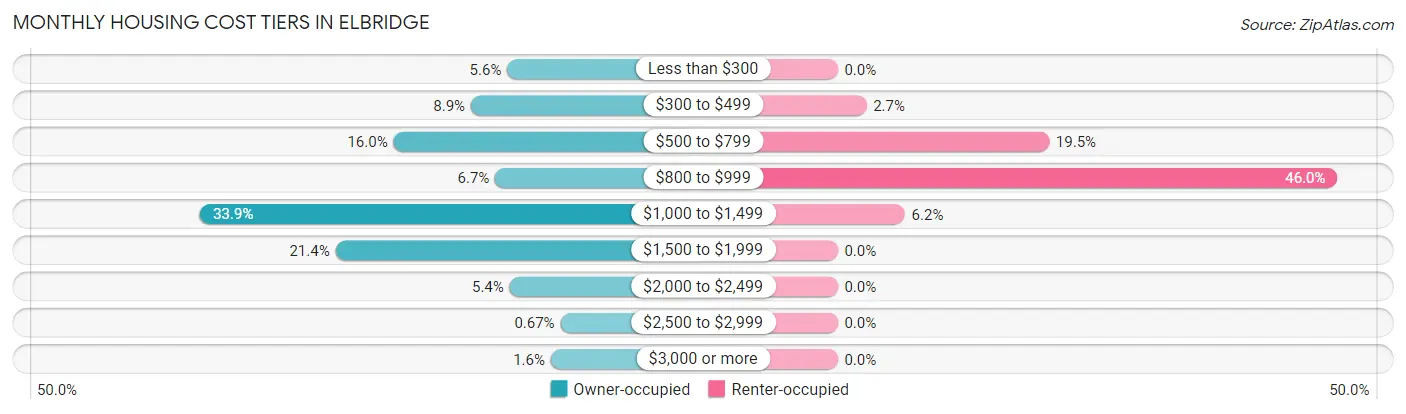
| Monthly Cost | Owner-occupied | Renter-occupied |
| Less than $300 | 25 (5.6%) | 0 (0.0%) |
| $300 to $499 | 40 (8.9%) | 3 (2.6%) |
| $500 to $799 | 72 (16.0%) | 22 (19.5%) |
| $800 to $999 | 30 (6.7%) | 52 (46.0%) |
| $1,000 to $1,499 | 152 (33.9%) | 7 (6.2%) |
| $1,500 to $1,999 | 96 (21.4%) | 0 (0.0%) |
| $2,000 to $2,499 | 24 (5.3%) | 0 (0.0%) |
| $2,500 to $2,999 | 3 (0.7%) | 0 (0.0%) |
| $3,000 or more | 7 (1.6%) | 0 (0.0%) |
| Total | 449 (100.0%) | 113 (100.0%) |
Physical Housing Characteristics in Elbridge
Housing Structures in Elbridge
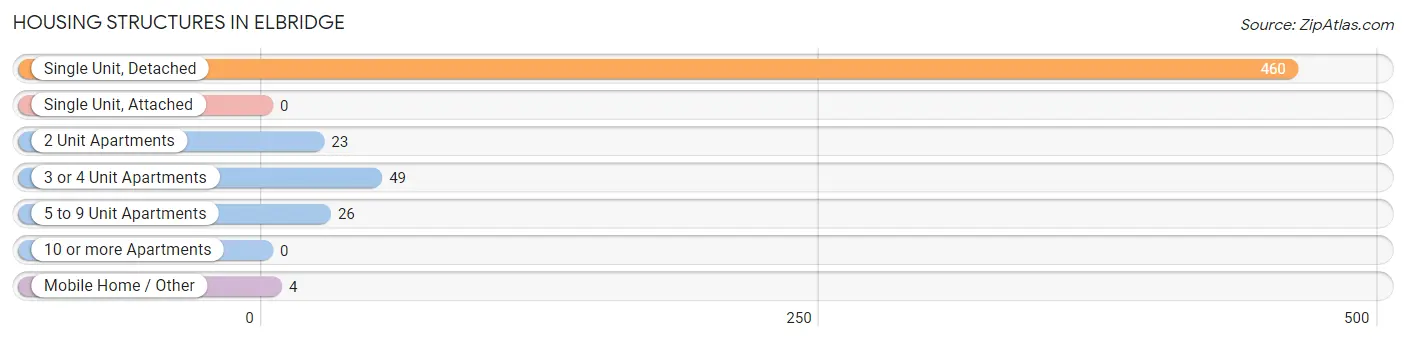
| Structure Type | # Housing Units | % Housing Units |
| Single Unit, Detached | 460 | 81.9% |
| Single Unit, Attached | 0 | 0.0% |
| 2 Unit Apartments | 23 | 4.1% |
| 3 or 4 Unit Apartments | 49 | 8.7% |
| 5 to 9 Unit Apartments | 26 | 4.6% |
| 10 or more Apartments | 0 | 0.0% |
| Mobile Home / Other | 4 | 0.7% |
| Total | 562 | 100.0% |
Housing Structures by Occupancy in Elbridge
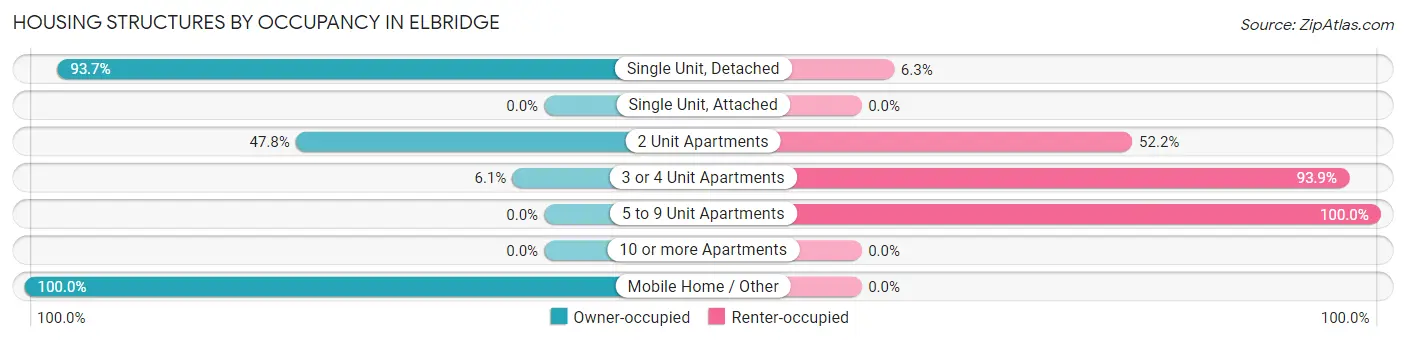
| Structure Type | Owner-occupied | Renter-occupied |
| Single Unit, Detached | 431 (93.7%) | 29 (6.3%) |
| Single Unit, Attached | 0 (0.0%) | 0 (0.0%) |
| 2 Unit Apartments | 11 (47.8%) | 12 (52.2%) |
| 3 or 4 Unit Apartments | 3 (6.1%) | 46 (93.9%) |
| 5 to 9 Unit Apartments | 0 (0.0%) | 26 (100.0%) |
| 10 or more Apartments | 0 (0.0%) | 0 (0.0%) |
| Mobile Home / Other | 4 (100.0%) | 0 (0.0%) |
| Total | 449 (79.9%) | 113 (20.1%) |
Housing Structures by Number of Rooms in Elbridge
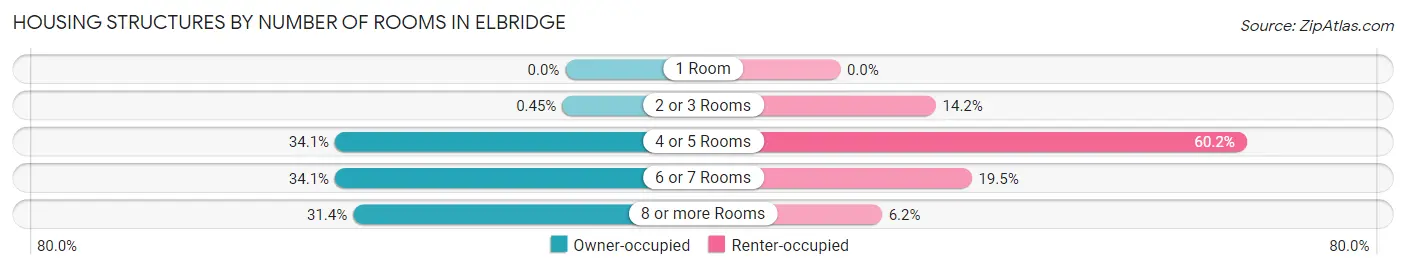
| Number of Rooms | Owner-occupied | Renter-occupied |
| 1 Room | 0 (0.0%) | 0 (0.0%) |
| 2 or 3 Rooms | 2 (0.4%) | 16 (14.2%) |
| 4 or 5 Rooms | 153 (34.1%) | 68 (60.2%) |
| 6 or 7 Rooms | 153 (34.1%) | 22 (19.5%) |
| 8 or more Rooms | 141 (31.4%) | 7 (6.2%) |
| Total | 449 (100.0%) | 113 (100.0%) |
Housing Structure by Heating Type in Elbridge
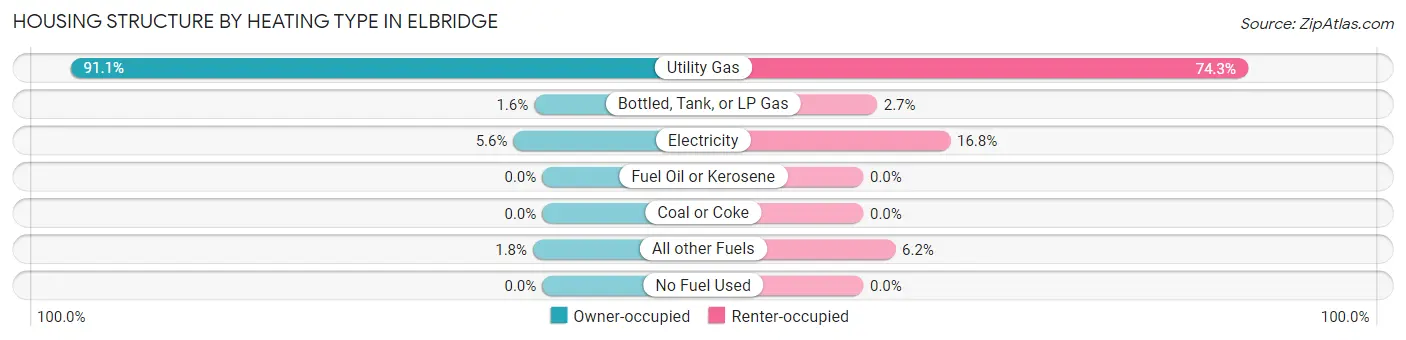
| Heating Type | Owner-occupied | Renter-occupied |
| Utility Gas | 409 (91.1%) | 84 (74.3%) |
| Bottled, Tank, or LP Gas | 7 (1.6%) | 3 (2.6%) |
| Electricity | 25 (5.6%) | 19 (16.8%) |
| Fuel Oil or Kerosene | 0 (0.0%) | 0 (0.0%) |
| Coal or Coke | 0 (0.0%) | 0 (0.0%) |
| All other Fuels | 8 (1.8%) | 7 (6.2%) |
| No Fuel Used | 0 (0.0%) | 0 (0.0%) |
| Total | 449 (100.0%) | 113 (100.0%) |
Household Vehicle Usage in Elbridge
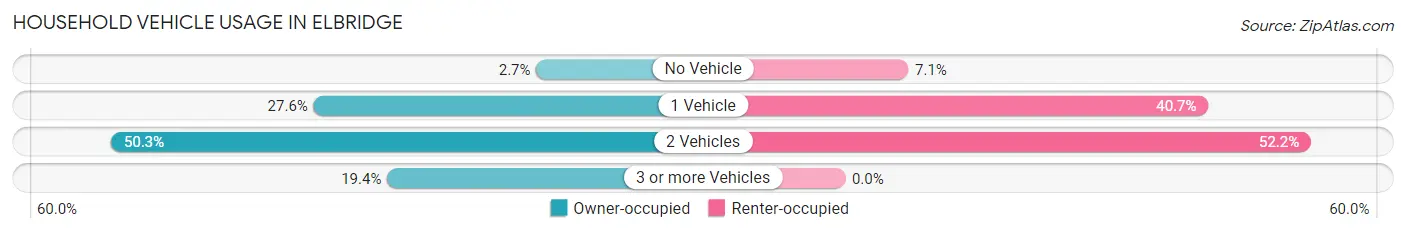
| Vehicles per Household | Owner-occupied | Renter-occupied |
| No Vehicle | 12 (2.7%) | 8 (7.1%) |
| 1 Vehicle | 124 (27.6%) | 46 (40.7%) |
| 2 Vehicles | 226 (50.3%) | 59 (52.2%) |
| 3 or more Vehicles | 87 (19.4%) | 0 (0.0%) |
| Total | 449 (100.0%) | 113 (100.0%) |
Real Estate & Mortgages in Elbridge
Real Estate and Mortgage Overview in Elbridge
| Characteristic | Without Mortgage | With Mortgage |
| Housing Units | 139 | 310 |
| Median Property Value | $133,800 | $141,400 |
| Median Household Income | $43,194 | $39 |
| Monthly Housing Costs | $558 | $4 |
| Real Estate Taxes | $3,480 | $16 |
Property Value by Mortgage Status in Elbridge
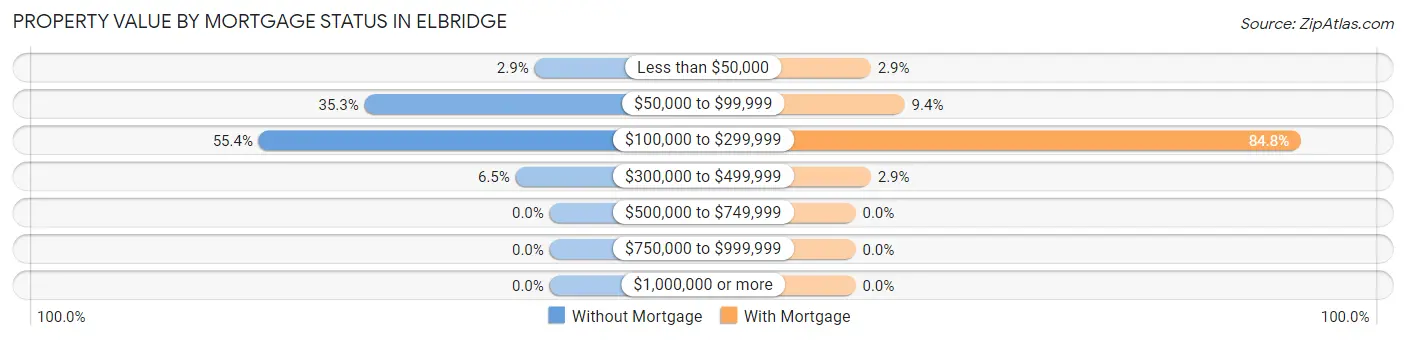
| Property Value | Without Mortgage | With Mortgage |
| Less than $50,000 | 4 (2.9%) | 9 (2.9%) |
| $50,000 to $99,999 | 49 (35.2%) | 29 (9.3%) |
| $100,000 to $299,999 | 77 (55.4%) | 263 (84.8%) |
| $300,000 to $499,999 | 9 (6.5%) | 9 (2.9%) |
| $500,000 to $749,999 | 0 (0.0%) | 0 (0.0%) |
| $750,000 to $999,999 | 0 (0.0%) | 0 (0.0%) |
| $1,000,000 or more | 0 (0.0%) | 0 (0.0%) |
| Total | 139 (100.0%) | 310 (100.0%) |
Household Income by Mortgage Status in Elbridge
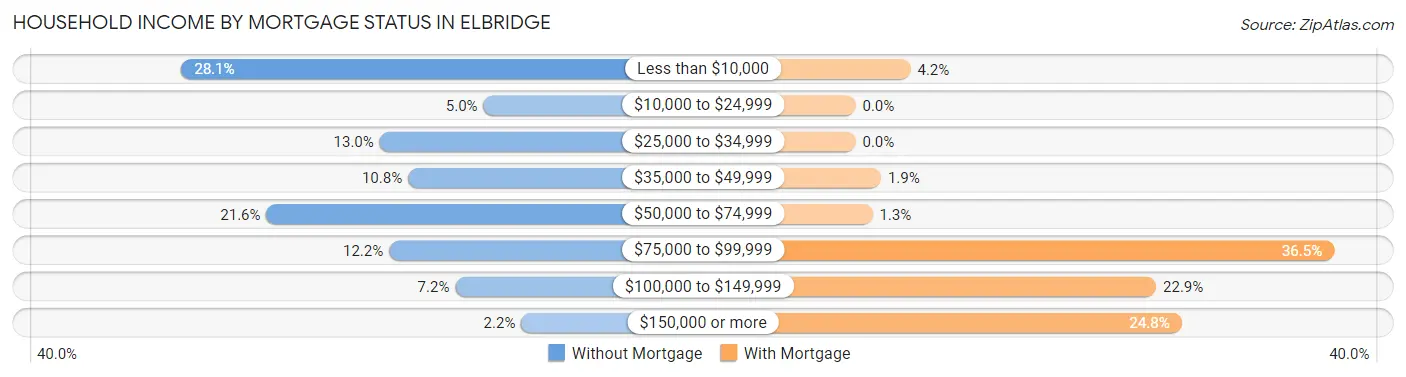
| Household Income | Without Mortgage | With Mortgage |
| Less than $10,000 | 39 (28.1%) | 13 (4.2%) |
| $10,000 to $24,999 | 7 (5.0%) | 0 (0.0%) |
| $25,000 to $34,999 | 18 (13.0%) | 0 (0.0%) |
| $35,000 to $49,999 | 15 (10.8%) | 6 (1.9%) |
| $50,000 to $74,999 | 30 (21.6%) | 4 (1.3%) |
| $75,000 to $99,999 | 17 (12.2%) | 113 (36.4%) |
| $100,000 to $149,999 | 10 (7.2%) | 71 (22.9%) |
| $150,000 or more | 3 (2.2%) | 77 (24.8%) |
| Total | 139 (100.0%) | 310 (100.0%) |
Property Value to Household Income Ratio in Elbridge
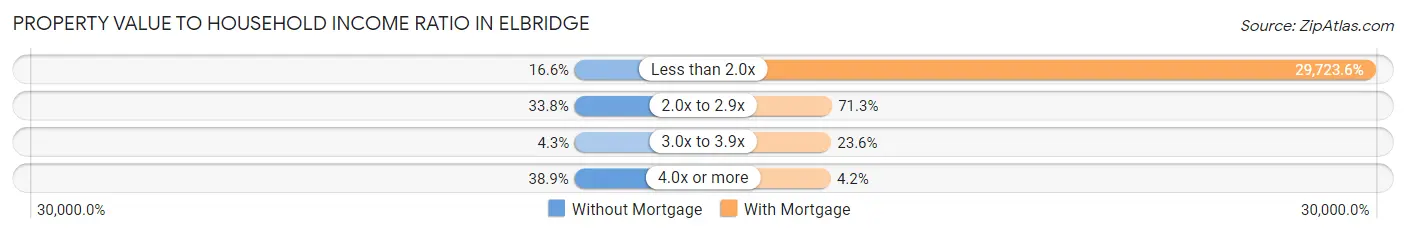
| Value-to-Income Ratio | Without Mortgage | With Mortgage |
| Less than 2.0x | 23 (16.6%) | 92,143 (29,723.6%) |
| 2.0x to 2.9x | 47 (33.8%) | 221 (71.3%) |
| 3.0x to 3.9x | 6 (4.3%) | 73 (23.5%) |
| 4.0x or more | 54 (38.9%) | 13 (4.2%) |
| Total | 139 (100.0%) | 310 (100.0%) |
Real Estate Taxes by Mortgage Status in Elbridge
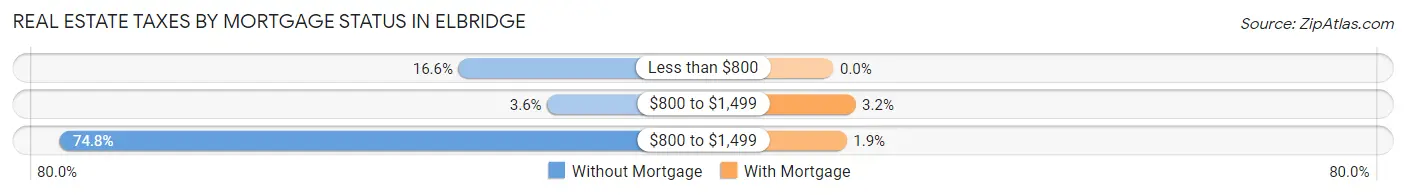
| Property Taxes | Without Mortgage | With Mortgage |
| Less than $800 | 23 (16.6%) | 0 (0.0%) |
| $800 to $1,499 | 5 (3.6%) | 10 (3.2%) |
| $800 to $1,499 | 104 (74.8%) | 6 (1.9%) |
| Total | 139 (100.0%) | 310 (100.0%) |
Health & Disability in Elbridge
Health Insurance Coverage by Age in Elbridge
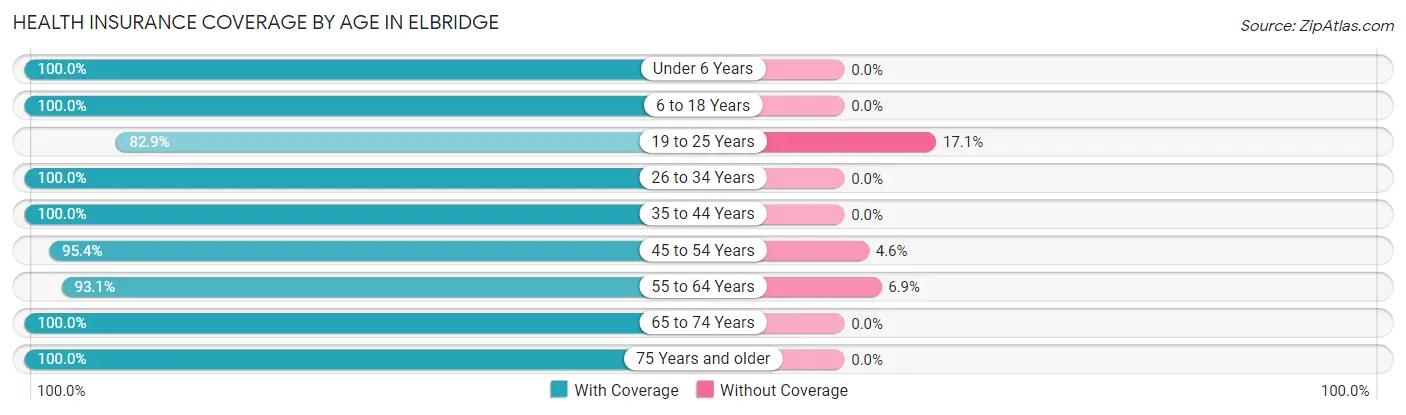
| Age Bracket | With Coverage | Without Coverage |
| Under 6 Years | 166 (100.0%) | 0 (0.0%) |
| 6 to 18 Years | 219 (100.0%) | 0 (0.0%) |
| 19 to 25 Years | 63 (82.9%) | 13 (17.1%) |
| 26 to 34 Years | 191 (100.0%) | 0 (0.0%) |
| 35 to 44 Years | 138 (100.0%) | 0 (0.0%) |
| 45 to 54 Years | 209 (95.4%) | 10 (4.6%) |
| 55 to 64 Years | 135 (93.1%) | 10 (6.9%) |
| 65 to 74 Years | 111 (100.0%) | 0 (0.0%) |
| 75 Years and older | 119 (100.0%) | 0 (0.0%) |
| Total | 1,351 (97.6%) | 33 (2.4%) |
Health Insurance Coverage by Citizenship Status in Elbridge
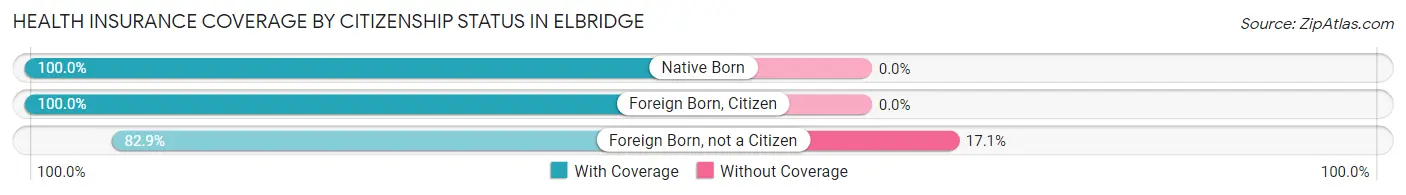
| Citizenship Status | With Coverage | Without Coverage |
| Native Born | 166 (100.0%) | 0 (0.0%) |
| Foreign Born, Citizen | 219 (100.0%) | 0 (0.0%) |
| Foreign Born, not a Citizen | 63 (82.9%) | 13 (17.1%) |
Health Insurance Coverage by Household Income in Elbridge
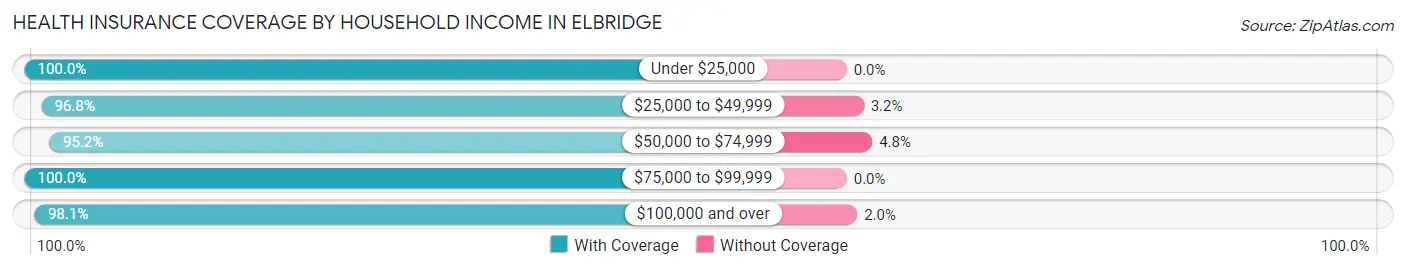
| Household Income | With Coverage | Without Coverage |
| Under $25,000 | 92 (100.0%) | 0 (0.0%) |
| $25,000 to $49,999 | 122 (96.8%) | 4 (3.2%) |
| $50,000 to $74,999 | 400 (95.2%) | 20 (4.8%) |
| $75,000 to $99,999 | 285 (100.0%) | 0 (0.0%) |
| $100,000 and over | 452 (98.1%) | 9 (1.9%) |
Public vs Private Health Insurance Coverage by Age in Elbridge
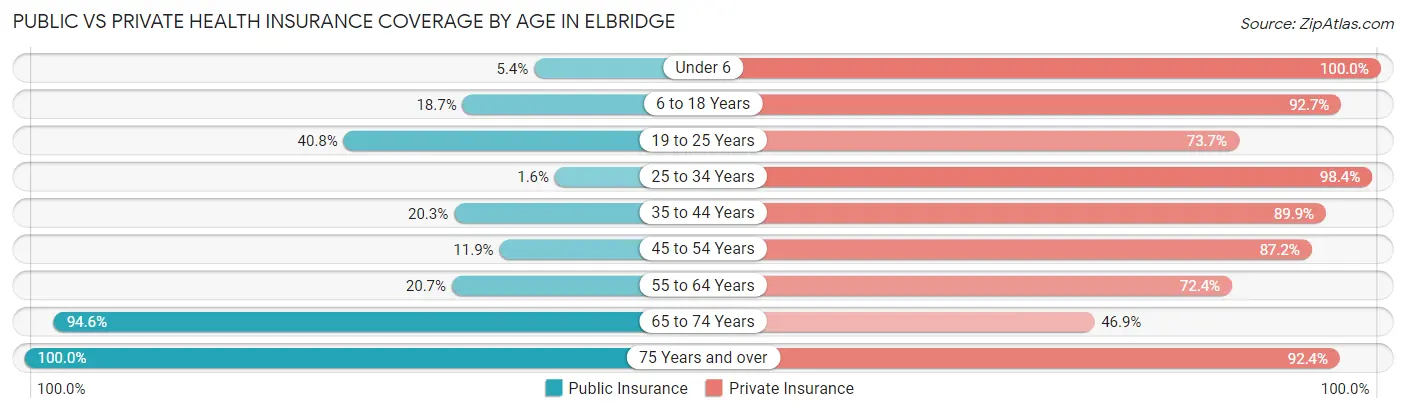
| Age Bracket | Public Insurance | Private Insurance |
| Under 6 | 9 (5.4%) | 166 (100.0%) |
| 6 to 18 Years | 41 (18.7%) | 203 (92.7%) |
| 19 to 25 Years | 31 (40.8%) | 56 (73.7%) |
| 25 to 34 Years | 3 (1.6%) | 188 (98.4%) |
| 35 to 44 Years | 28 (20.3%) | 124 (89.9%) |
| 45 to 54 Years | 26 (11.9%) | 191 (87.2%) |
| 55 to 64 Years | 30 (20.7%) | 105 (72.4%) |
| 65 to 74 Years | 105 (94.6%) | 52 (46.9%) |
| 75 Years and over | 119 (100.0%) | 110 (92.4%) |
| Total | 392 (28.3%) | 1,195 (86.3%) |
Disability Status by Sex by Age in Elbridge
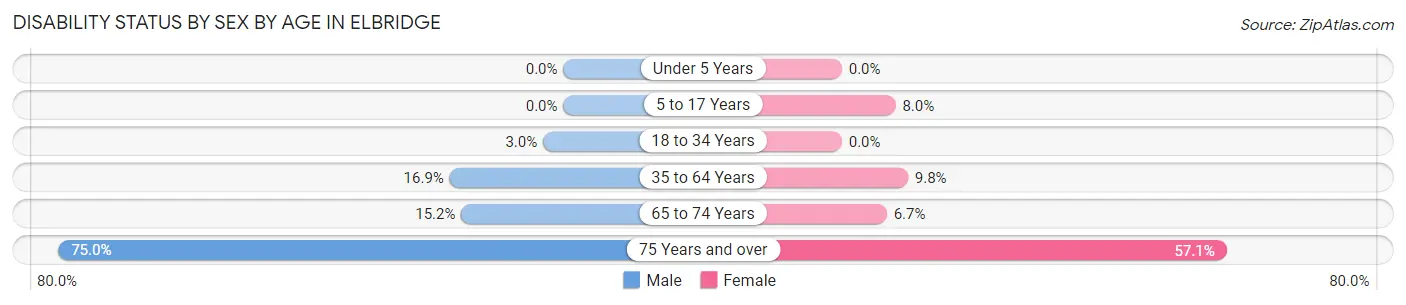
| Age Bracket | Male | Female |
| Under 5 Years | 0 (0.0%) | 0 (0.0%) |
| 5 to 17 Years | 0 (0.0%) | 11 (8.0%) |
| 18 to 34 Years | 4 (3.0%) | 0 (0.0%) |
| 35 to 64 Years | 40 (16.9%) | 26 (9.8%) |
| 65 to 74 Years | 10 (15.1%) | 3 (6.7%) |
| 75 Years and over | 42 (75.0%) | 36 (57.1%) |
Disability Class by Sex by Age in Elbridge
Disability Class: Hearing Difficulty
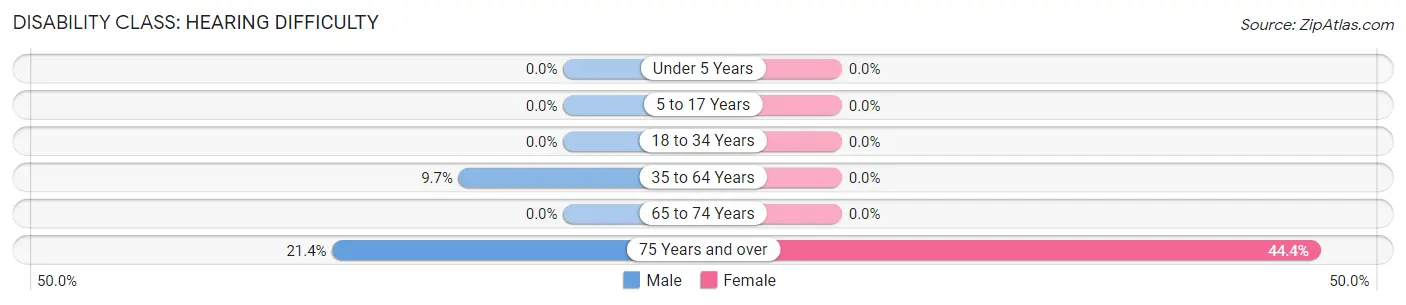
| Age Bracket | Male | Female |
| Under 5 Years | 0 (0.0%) | 0 (0.0%) |
| 5 to 17 Years | 0 (0.0%) | 0 (0.0%) |
| 18 to 34 Years | 0 (0.0%) | 0 (0.0%) |
| 35 to 64 Years | 23 (9.7%) | 0 (0.0%) |
| 65 to 74 Years | 0 (0.0%) | 0 (0.0%) |
| 75 Years and over | 12 (21.4%) | 28 (44.4%) |
Disability Class: Vision Difficulty
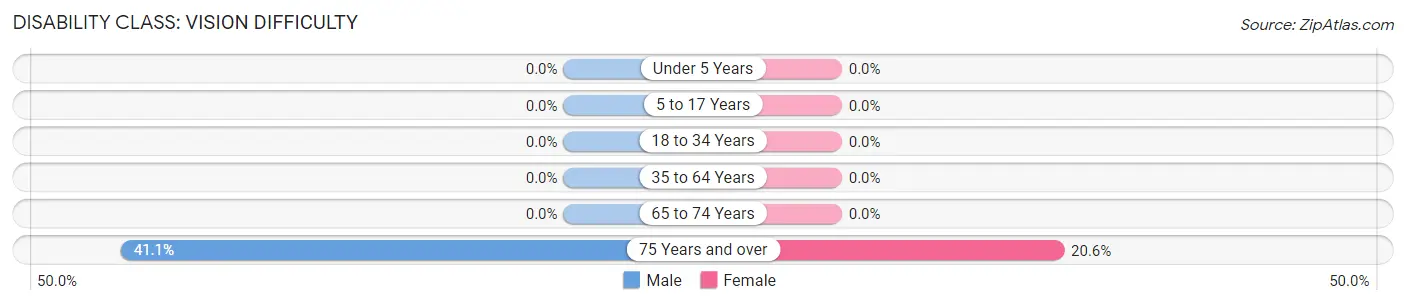
| Age Bracket | Male | Female |
| Under 5 Years | 0 (0.0%) | 0 (0.0%) |
| 5 to 17 Years | 0 (0.0%) | 0 (0.0%) |
| 18 to 34 Years | 0 (0.0%) | 0 (0.0%) |
| 35 to 64 Years | 0 (0.0%) | 0 (0.0%) |
| 65 to 74 Years | 0 (0.0%) | 0 (0.0%) |
| 75 Years and over | 23 (41.1%) | 13 (20.6%) |
Disability Class: Cognitive Difficulty
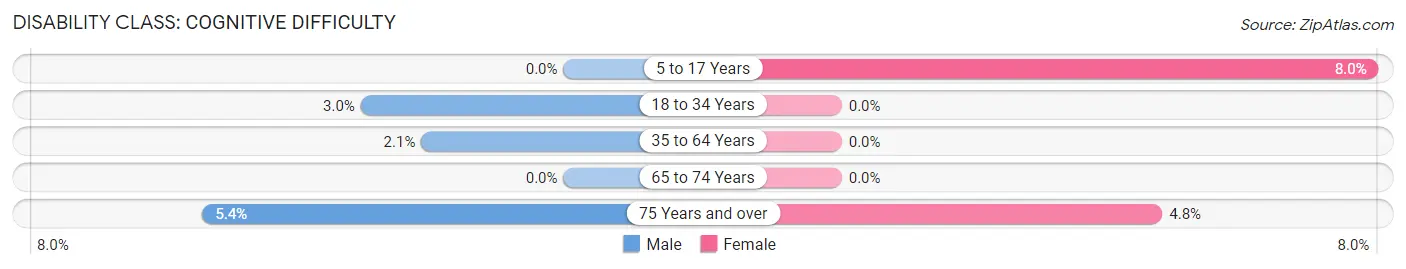
| Age Bracket | Male | Female |
| 5 to 17 Years | 0 (0.0%) | 11 (8.0%) |
| 18 to 34 Years | 4 (3.0%) | 0 (0.0%) |
| 35 to 64 Years | 5 (2.1%) | 0 (0.0%) |
| 65 to 74 Years | 0 (0.0%) | 0 (0.0%) |
| 75 Years and over | 3 (5.4%) | 3 (4.8%) |
Disability Class: Ambulatory Difficulty
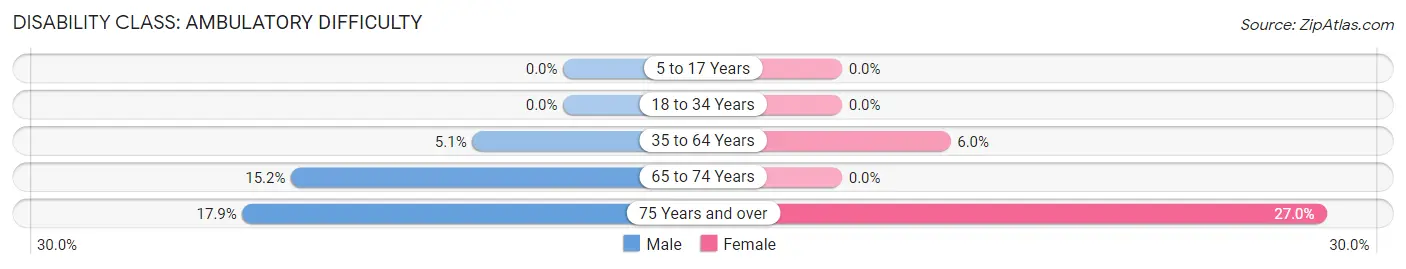
| Age Bracket | Male | Female |
| 5 to 17 Years | 0 (0.0%) | 0 (0.0%) |
| 18 to 34 Years | 0 (0.0%) | 0 (0.0%) |
| 35 to 64 Years | 12 (5.1%) | 16 (6.0%) |
| 65 to 74 Years | 10 (15.1%) | 0 (0.0%) |
| 75 Years and over | 10 (17.9%) | 17 (27.0%) |
Disability Class: Self-Care Difficulty
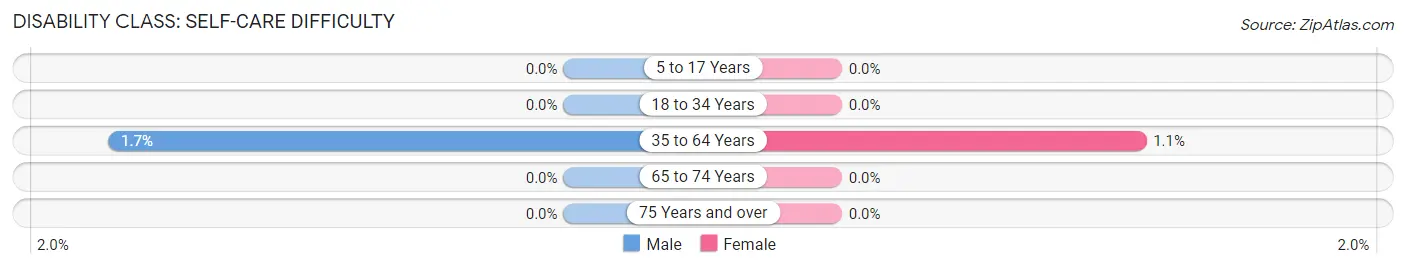
| Age Bracket | Male | Female |
| 5 to 17 Years | 0 (0.0%) | 0 (0.0%) |
| 18 to 34 Years | 0 (0.0%) | 0 (0.0%) |
| 35 to 64 Years | 4 (1.7%) | 3 (1.1%) |
| 65 to 74 Years | 0 (0.0%) | 0 (0.0%) |
| 75 Years and over | 0 (0.0%) | 0 (0.0%) |
Technology Access in Elbridge
Computing Device Access in Elbridge
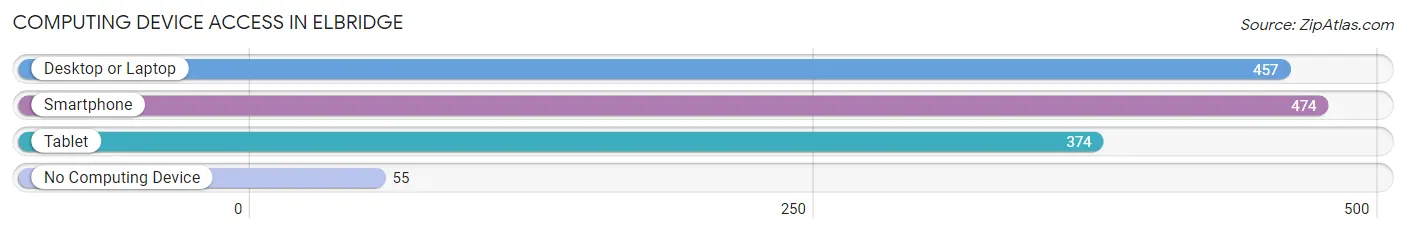
| Device Type | # Households | % Households |
| Desktop or Laptop | 457 | 81.3% |
| Smartphone | 474 | 84.3% |
| Tablet | 374 | 66.5% |
| No Computing Device | 55 | 9.8% |
| Total | 562 | 100.0% |
Internet Access in Elbridge
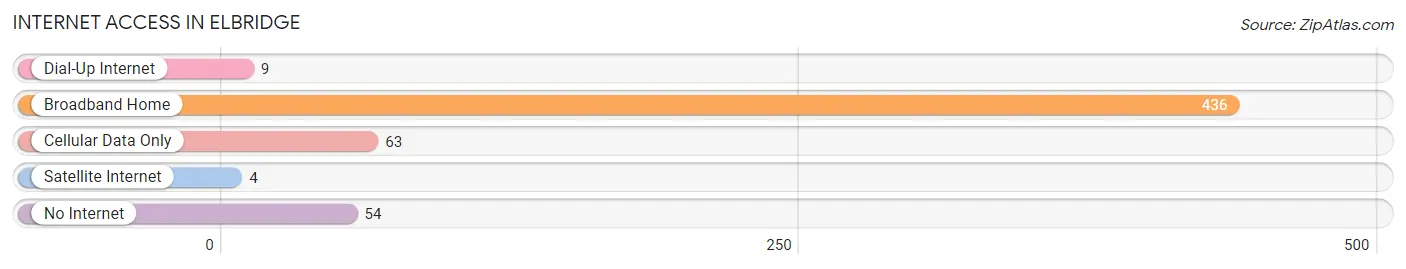
| Internet Type | # Households | % Households |
| Dial-Up Internet | 9 | 1.6% |
| Broadband Home | 436 | 77.6% |
| Cellular Data Only | 63 | 11.2% |
| Satellite Internet | 4 | 0.7% |
| No Internet | 54 | 9.6% |
| Total | 562 | 100.0% |
Elbridge Summary
Elbridge, NY is a small town located in Onondaga County, New York. It is situated in the Finger Lakes region of the state, and is part of the Syracuse Metropolitan Statistical Area. The town was founded in 1796 and has a population of approximately 3,000 people.
Geography
Elbridge is located in the Finger Lakes region of New York, and is situated in the northern part of Onondaga County. It is bordered by the towns of Camillus, Skaneateles, and Otisco. The town is located on the northern shore of Otisco Lake, and is home to several small creeks and streams. The terrain is mostly flat, with some rolling hills in the northern part of the town. The highest point in Elbridge is located at an elevation of 890 feet.
Climate
Elbridge has a humid continental climate, with cold winters and warm summers. The average annual temperature is around 48°F, with an average high of around 70°F in the summer and an average low of around 25°F in the winter. The town receives an average of 36 inches of precipitation per year, with most of it falling in the form of snow during the winter months.
Demographics
As of the 2010 census, Elbridge had a population of 3,085 people. The racial makeup of the town was 97.3% White, 0.7% African American, 0.3% Native American, 0.4% Asian, and 1.3% from other races. Hispanic or Latino of any race were 1.7% of the population.
The median household income in Elbridge was $50,938, and the median family income was $60,938. The per capita income for the town was $25,938. About 6.3% of families and 8.3% of the population were below the poverty line, including 10.3% of those under age 18 and 5.3% of those age 65 or over.
Economy
Elbridge is a small, rural town with a primarily agricultural economy. The town is home to several farms, which produce a variety of crops, including corn, soybeans, hay, and wheat. The town is also home to several small businesses, including a few restaurants, a grocery store, and a hardware store.
The town is also home to several manufacturing companies, including a plastics manufacturer, a metal fabricator, and a machine shop. The town is also home to a few small technology companies, including a software development firm and a web design firm.
Conclusion
Elbridge, NY is a small town located in Onondaga County, New York. It is situated in the Finger Lakes region of the state, and is part of the Syracuse Metropolitan Statistical Area. The town was founded in 1796 and has a population of approximately 3,000 people. Elbridge has a humid continental climate, with cold winters and warm summers. The town has a primarily agricultural economy, with several farms producing a variety of crops, as well as several small businesses and manufacturing companies. The median household income in Elbridge was $50,938, and the median family income was $60,938.
Common Questions
What is the Total Population of Elbridge?
Total Population of Elbridge is 1,384.
What is the Total Male Population of Elbridge?
Total Male Population of Elbridge is 652.
What is the Total Female Population of Elbridge?
Total Female Population of Elbridge is 732.
What is the Ratio of Males per 100 Females in Elbridge?
There are 89.07 Males per 100 Females in Elbridge.
What is the Ratio of Females per 100 Males in Elbridge?
There are 112.27 Females per 100 Males in Elbridge.
What is the Median Population Age in Elbridge?
Median Population Age in Elbridge is 37.9 Years.
What is the Average Family Size in Elbridge
Average Family Size in Elbridge is 3.2 People.
What is the Average Household Size in Elbridge
Average Household Size in Elbridge is 2.5 People.
What is Per Capita Income in Elbridge?
Per Capita income in Elbridge is $32,799.
What is the Median Family Income in Elbridge?
Median Family Income in Elbridge is $80,417.
What is the Median Household income in Elbridge?
Median Household Income in Elbridge is $59,937.
What is Income or Wage Gap in Elbridge?
Income or Wage Gap in Elbridge is 28.8%.
Women in Elbridge earn 71.2 cents for every dollar earned by a man.
What is Inequality or Gini Index in Elbridge?
Inequality or Gini Index in Elbridge is 0.42.
How Large is the Labor Force in Elbridge?
There are 646 People in the Labor Forcein in Elbridge.
What is the Percentage of People in the Labor Force in Elbridge?
62.2% of People are in the Labor Force in Elbridge.
What is the Unemployment Rate in Elbridge?
Unemployment Rate in Elbridge is 7.0%.