Copake Lake, NY
Copake Lake Map
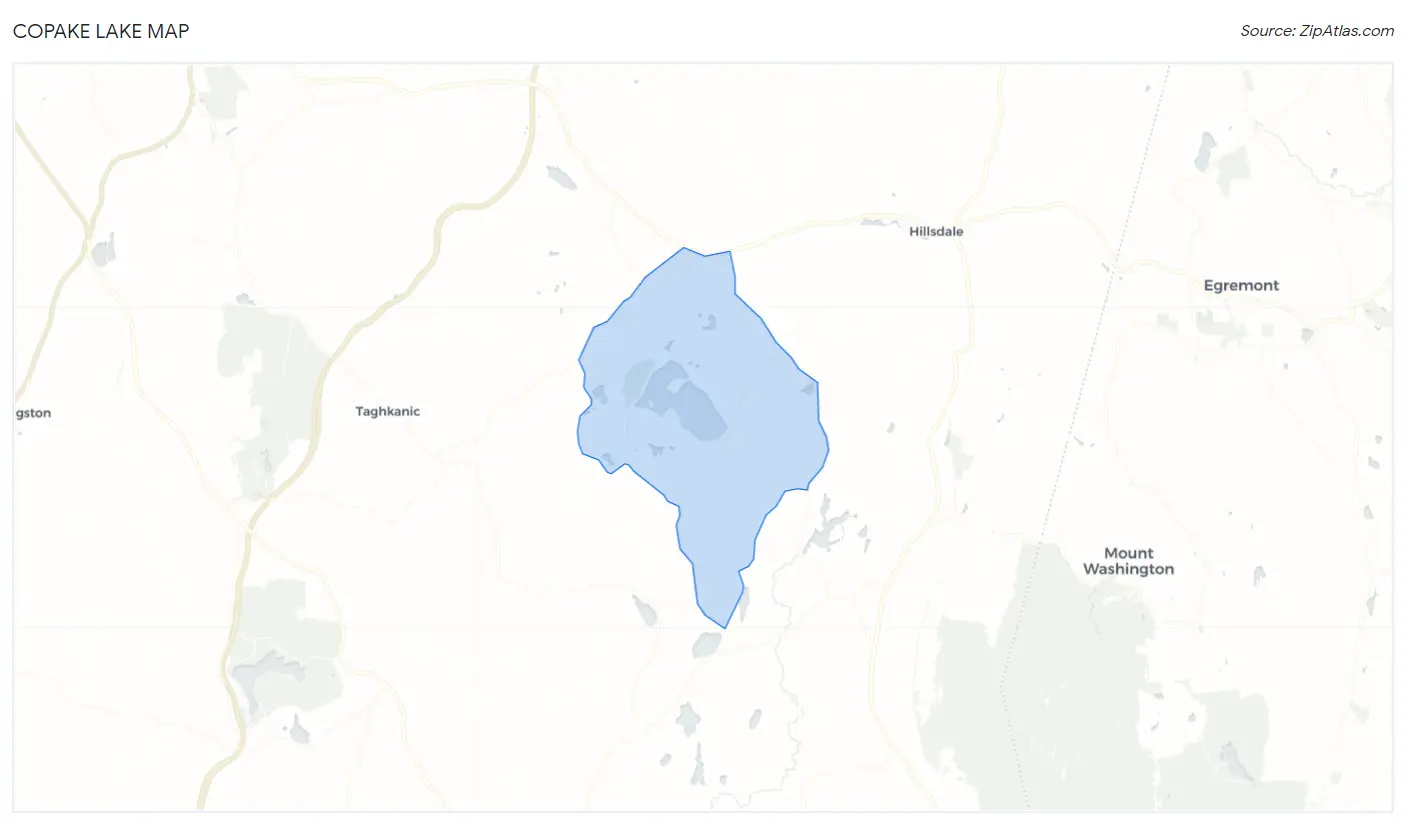
Copake Lake Overview
817
TOTAL POPULATION
435
MALE POPULATION
382
FEMALE POPULATION
113.87
MALES / 100 FEMALES
87.82
FEMALES / 100 MALES
59.9
MEDIAN AGE
2.2
AVG FAMILY SIZE
2.2
AVG HOUSEHOLD SIZE
$68,946
PER CAPITA INCOME
$113,517
AVG FAMILY INCOME
$113,550
AVG HOUSEHOLD INCOME
0.45
INEQUALITY / GINI INDEX
398
LABOR FORCE [ PEOPLE ]
55.9%
PERCENT IN LABOR FORCE
2.3%
UNEMPLOYMENT RATE
Race in Copake Lake
The most populous races in Copake Lake are White / Caucasian (763 | 93.4%), Hispanic or Latino (59 | 7.2%), and Some other Race (48 | 5.9%).
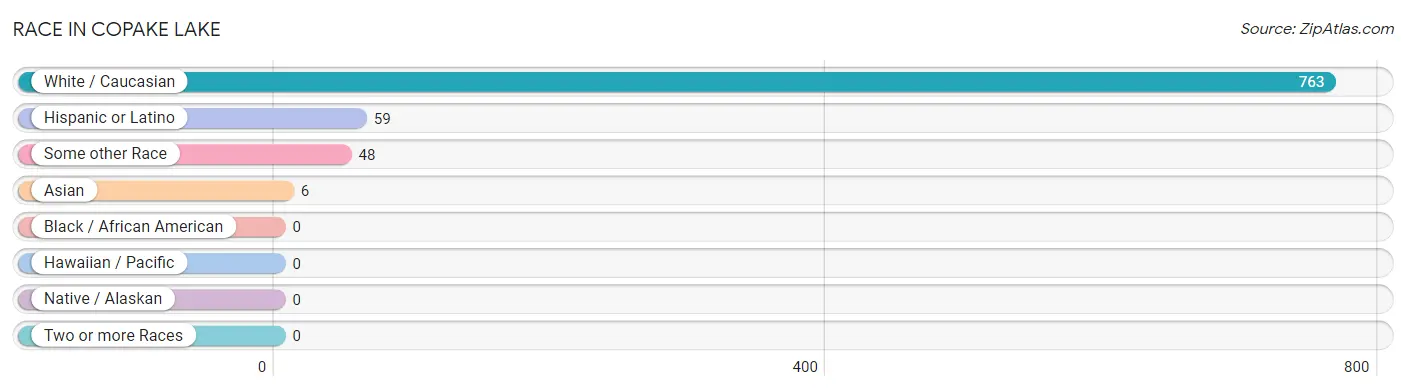
| Race | # Population | % Population |
| Asian | 6 | 0.7% |
| Black / African American | 0 | 0.0% |
| Hawaiian / Pacific | 0 | 0.0% |
| Hispanic or Latino | 59 | 7.2% |
| Native / Alaskan | 0 | 0.0% |
| White / Caucasian | 763 | 93.4% |
| Two or more Races | 0 | 0.0% |
| Some other Race | 48 | 5.9% |
| Total | 817 | 100.0% |
Ancestry in Copake Lake
The most populous ancestries reported in Copake Lake are Italian (130 | 15.9%), English (116 | 14.2%), German (109 | 13.3%), Irish (102 | 12.5%), and Polish (73 | 8.9%), together accounting for 64.9% of all Copake Lake residents.
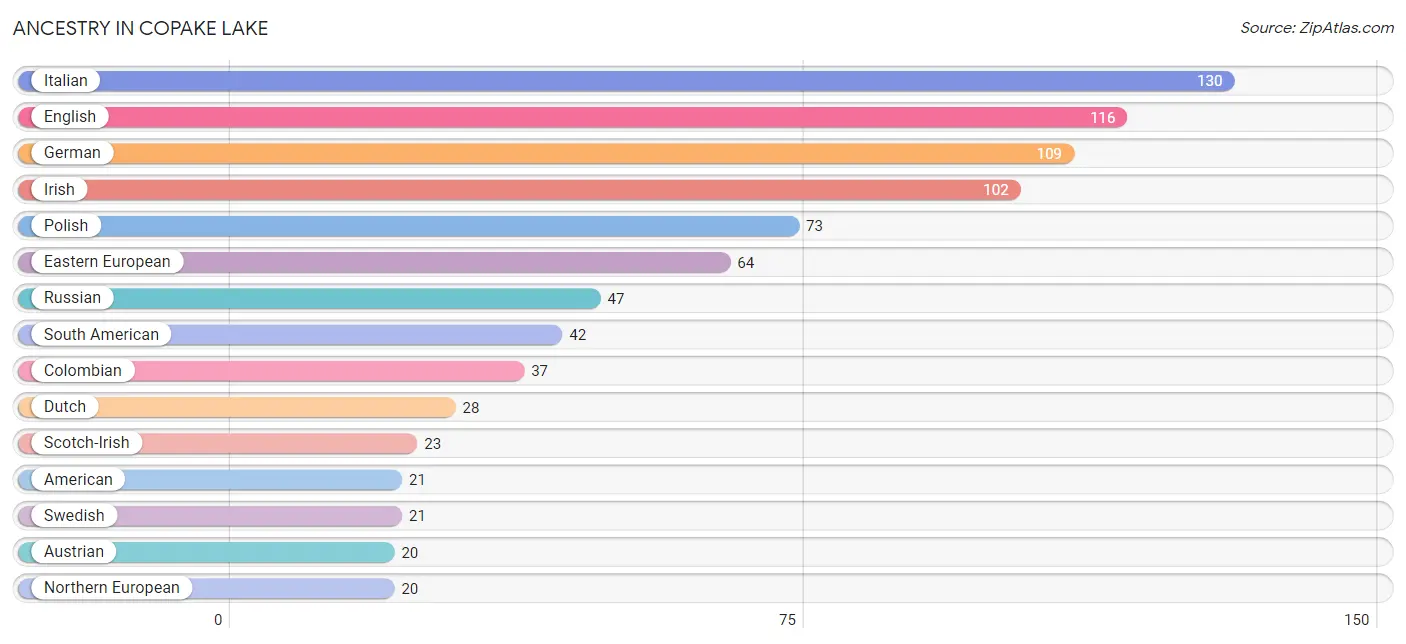
| Ancestry | # Population | % Population |
| American | 21 | 2.6% |
| Austrian | 20 | 2.5% |
| Colombian | 37 | 4.5% |
| Dutch | 28 | 3.4% |
| Eastern European | 64 | 7.8% |
| Ecuadorian | 5 | 0.6% |
| English | 116 | 14.2% |
| French | 6 | 0.7% |
| German | 109 | 13.3% |
| Greek | 8 | 1.0% |
| Indian (Asian) | 6 | 0.7% |
| Irish | 102 | 12.5% |
| Italian | 130 | 15.9% |
| Lithuanian | 8 | 1.0% |
| Mexican | 10 | 1.2% |
| Northern European | 20 | 2.5% |
| Norwegian | 15 | 1.8% |
| Polish | 73 | 8.9% |
| Puerto Rican | 7 | 0.9% |
| Russian | 47 | 5.8% |
| Scotch-Irish | 23 | 2.8% |
| Scottish | 8 | 1.0% |
| South American | 42 | 5.1% |
| Swedish | 21 | 2.6% |
| Swiss | 10 | 1.2% | View All 25 Rows |
Immigrants in Copake Lake
The most numerous immigrant groups reported in Copake Lake came from Canada (23 | 2.8%), Latin America (15 | 1.8%), South America (15 | 1.8%), Colombia (10 | 1.2%), and Asia (6 | 0.7%), together accounting for 8.5% of all Copake Lake residents.
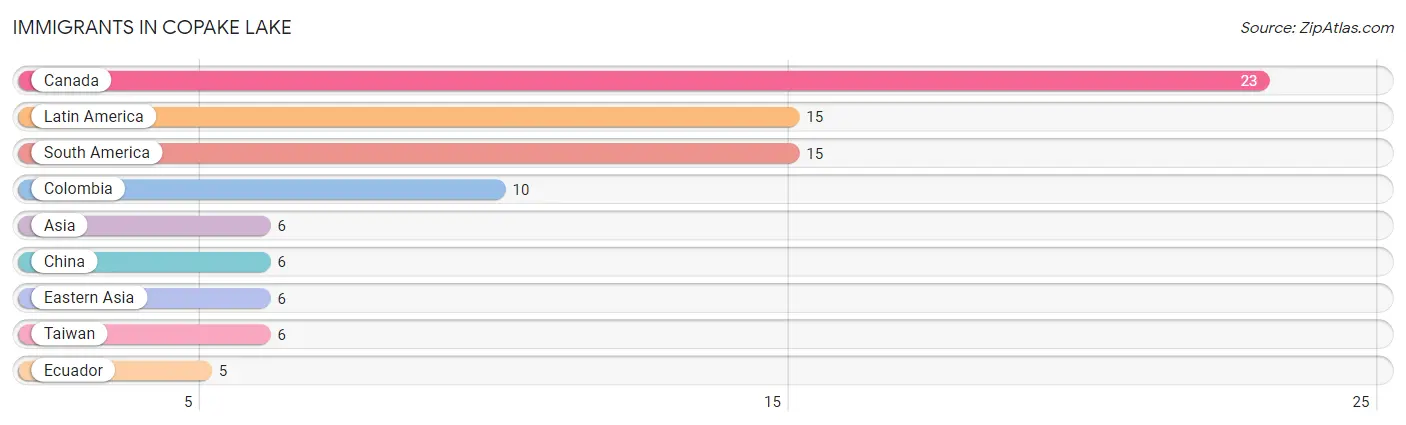
| Immigration Origin | # Population | % Population |
| Asia | 6 | 0.7% |
| Canada | 23 | 2.8% |
| China | 6 | 0.7% |
| Colombia | 10 | 1.2% |
| Eastern Asia | 6 | 0.7% |
| Ecuador | 5 | 0.6% |
| Latin America | 15 | 1.8% |
| South America | 15 | 1.8% |
| Taiwan | 6 | 0.7% | View All 9 Rows |
Sex and Age in Copake Lake
Sex and Age in Copake Lake
The most populous age groups in Copake Lake are 60 to 64 Years (95 | 21.8%) for men and 60 to 64 Years (73 | 19.1%) for women.
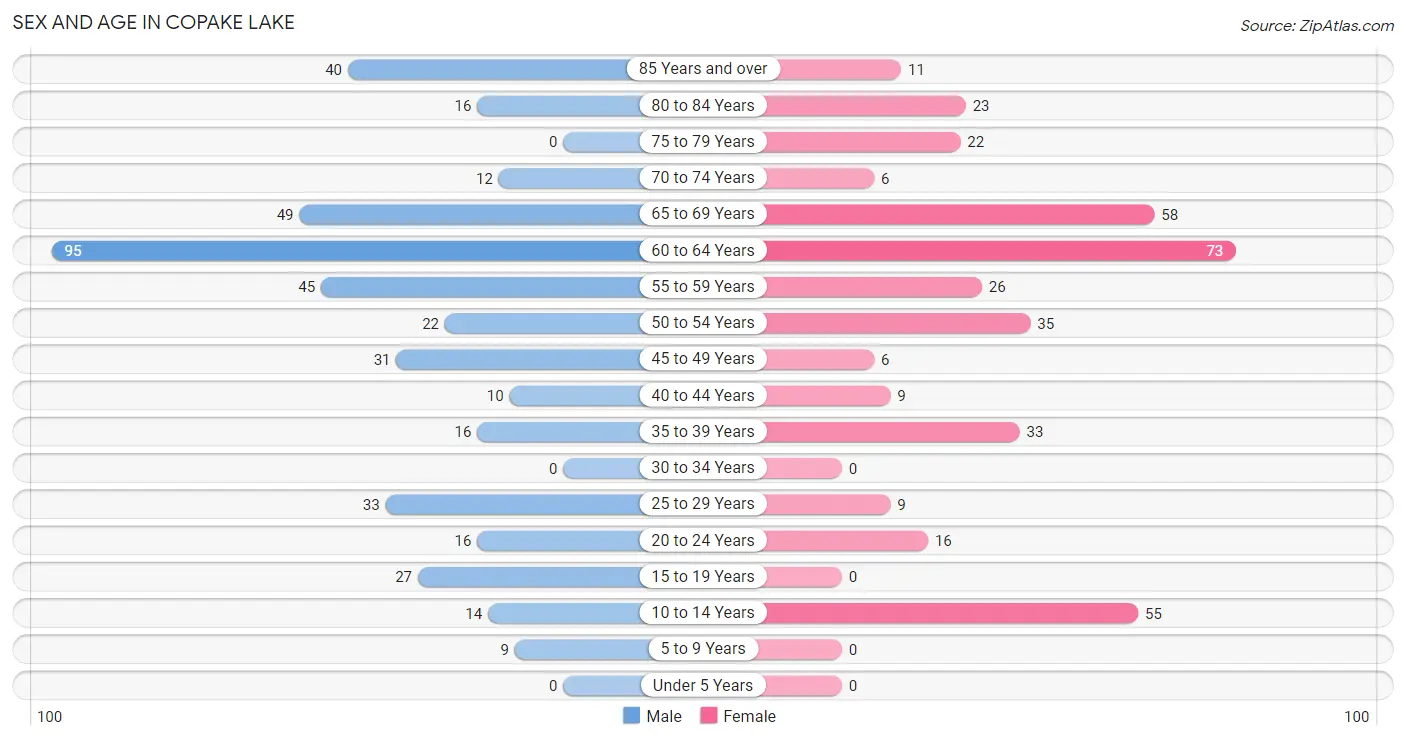
| Age Bracket | Male | Female |
| Under 5 Years | 0 (0.0%) | 0 (0.0%) |
| 5 to 9 Years | 9 (2.1%) | 0 (0.0%) |
| 10 to 14 Years | 14 (3.2%) | 55 (14.4%) |
| 15 to 19 Years | 27 (6.2%) | 0 (0.0%) |
| 20 to 24 Years | 16 (3.7%) | 16 (4.2%) |
| 25 to 29 Years | 33 (7.6%) | 9 (2.4%) |
| 30 to 34 Years | 0 (0.0%) | 0 (0.0%) |
| 35 to 39 Years | 16 (3.7%) | 33 (8.6%) |
| 40 to 44 Years | 10 (2.3%) | 9 (2.4%) |
| 45 to 49 Years | 31 (7.1%) | 6 (1.6%) |
| 50 to 54 Years | 22 (5.1%) | 35 (9.2%) |
| 55 to 59 Years | 45 (10.3%) | 26 (6.8%) |
| 60 to 64 Years | 95 (21.8%) | 73 (19.1%) |
| 65 to 69 Years | 49 (11.3%) | 58 (15.2%) |
| 70 to 74 Years | 12 (2.8%) | 6 (1.6%) |
| 75 to 79 Years | 0 (0.0%) | 22 (5.8%) |
| 80 to 84 Years | 16 (3.7%) | 23 (6.0%) |
| 85 Years and over | 40 (9.2%) | 11 (2.9%) |
| Total | 435 (100.0%) | 382 (100.0%) |
Families and Households in Copake Lake
Median Family Size in Copake Lake
The median family size in Copake Lake is 2.22 persons per family, with single female/mother families (52 | 16.8%) accounting for the largest median family size of 2.75 persons per family. On the other hand, married-couple families (225 | 72.8%) represent the smallest median family size with 2.11 persons per family.
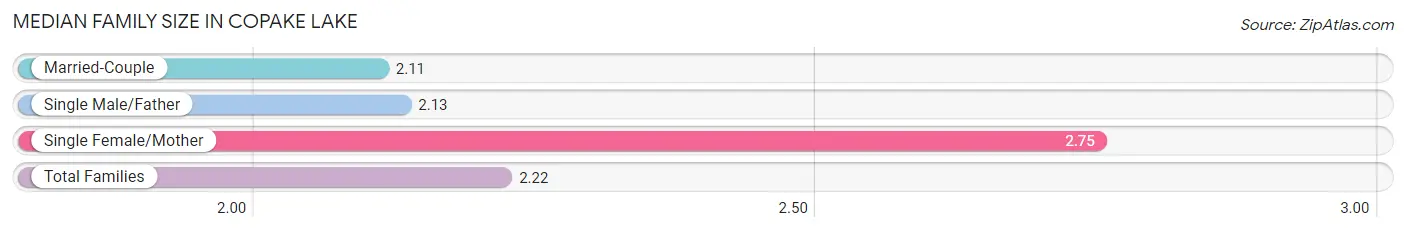
| Family Type | # Families | Family Size |
| Married-Couple | 225 (72.8%) | 2.11 |
| Single Male/Father | 32 (10.4%) | 2.13 |
| Single Female/Mother | 52 (16.8%) | 2.75 |
| Total Families | 309 (100.0%) | 2.22 |
Median Household Size in Copake Lake
The median household size in Copake Lake is 2.22 persons per household, with single female/mother households (52 | 14.1%) accounting for the largest median household size of 3.5 persons per household. non-family households (59 | 16.0%) represent the smallest median household size with 1.46 persons per household.
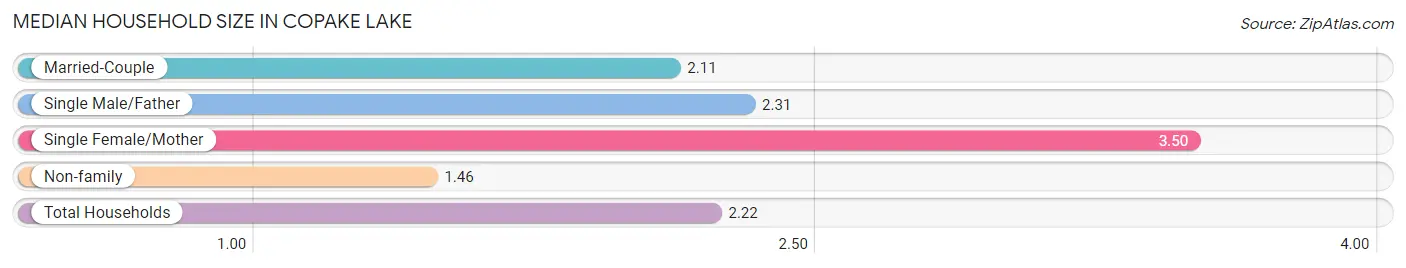
| Household Type | # Households | Household Size |
| Married-Couple | 225 (61.1%) | 2.11 |
| Single Male/Father | 32 (8.7%) | 2.31 |
| Single Female/Mother | 52 (14.1%) | 3.50 |
| Non-family | 59 (16.0%) | 1.46 |
| Total Households | 368 (100.0%) | 2.22 |
Household Size by Marriage Status in Copake Lake
Out of a total of 368 households in Copake Lake, 309 (84.0%) are family households, while 59 (16.0%) are nonfamily households. The most numerous type of family households are 2-person households, comprising 245, and the most common type of nonfamily households are 1-person households, comprising 32.
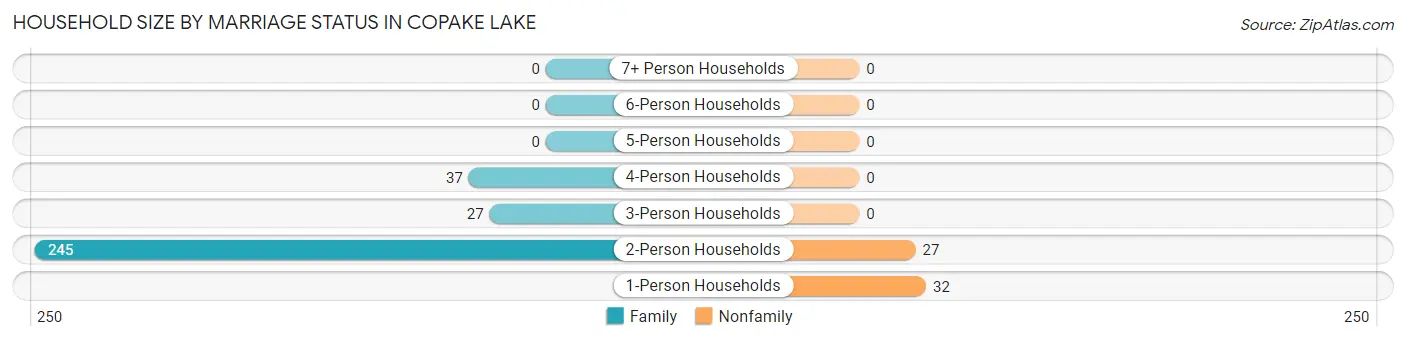
| Household Size | Family Households | Nonfamily Households |
| 1-Person Households | - | 32 (8.7%) |
| 2-Person Households | 245 (66.6%) | 27 (7.3%) |
| 3-Person Households | 27 (7.3%) | 0 (0.0%) |
| 4-Person Households | 37 (10.1%) | 0 (0.0%) |
| 5-Person Households | 0 (0.0%) | 0 (0.0%) |
| 6-Person Households | 0 (0.0%) | 0 (0.0%) |
| 7+ Person Households | 0 (0.0%) | 0 (0.0%) |
| Total | 309 (84.0%) | 59 (16.0%) |
Female Fertility in Copake Lake
Fertility by Age in Copake Lake
| Age Bracket | Women with Births | Births / 1,000 Women |
| 15 to 19 years | 0 (0.0%) | 0.0 |
| 20 to 34 years | 0 (0.0%) | 0.0 |
| 35 to 50 years | 0 (0.0%) | 0.0 |
| Total | 0 (0.0%) | 0.0 |
Fertility by Age by Marriage Status in Copake Lake
| Age Bracket | Married | Unmarried |
| 15 to 19 years | 0 (0.0%) | 0 (0.0%) |
| 20 to 34 years | 0 (0.0%) | 0 (0.0%) |
| 35 to 50 years | 0 (0.0%) | 0 (0.0%) |
| Total | 0 (0.0%) | 0 (0.0%) |
Fertility by Education in Copake Lake
| Educational Attainment | Women with Births | Births / 1,000 Women |
| Less than High School | 0 (0.0%) | 0.0 |
| High School Diploma | 0 (0.0%) | 0.0 |
| College or Associate's Degree | 0 (0.0%) | 0.0 |
| Bachelor's Degree | 0 (0.0%) | 0.0 |
| Graduate Degree | 0 (0.0%) | 0.0 |
| Total | 0 (0.0%) | 0.0 |
Fertility by Education by Marriage Status in Copake Lake
| Educational Attainment | Married | Unmarried |
| Less than High School | 0 (0.0%) | 0 (0.0%) |
| High School Diploma | 0 (0.0%) | 0 (0.0%) |
| College or Associate's Degree | 0 (0.0%) | 0 (0.0%) |
| Bachelor's Degree | 0 (0.0%) | 0 (0.0%) |
| Graduate Degree | 0 (0.0%) | 0 (0.0%) |
| Total | 0 (0.0%) | 0 (0.0%) |
Income in Copake Lake
Income Overview in Copake Lake
Per Capita Income in Copake Lake is $68,946, while median incomes of families and households are $113,517 and $113,550 respectively.
| Characteristic | Number | Measure |
| Per Capita Income | 817 | $68,946 |
| Median Family Income | 309 | $113,517 |
| Mean Family Income | 309 | $158,392 |
| Median Household Income | 368 | $113,550 |
| Mean Household Income | 368 | $148,551 |
| Income Deficit | 309 | $0 |
| Wage / Income Gap (%) | 817 | 0.00% |
| Wage / Income Gap ($) | 817 | 100.00¢ per $1 |
| Gini / Inequality Index | 817 | 0.45 |
Earnings by Sex in Copake Lake
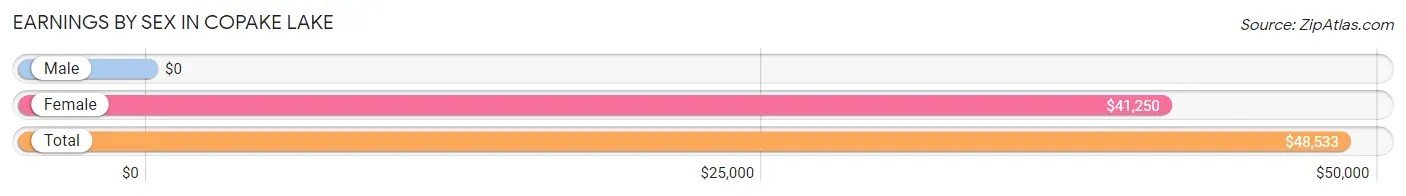
| Sex | Number | Average Earnings |
| Male | 215 (49.8%) | $0 |
| Female | 217 (50.2%) | $41,250 |
| Total | 432 (100.0%) | $48,533 |
Earnings by Sex by Income Bracket in Copake Lake
The most common earnings brackets in Copake Lake are $100,000+ for men (58 | 27.0%) and $55,000 to $64,999 for women (52 | 24.0%).
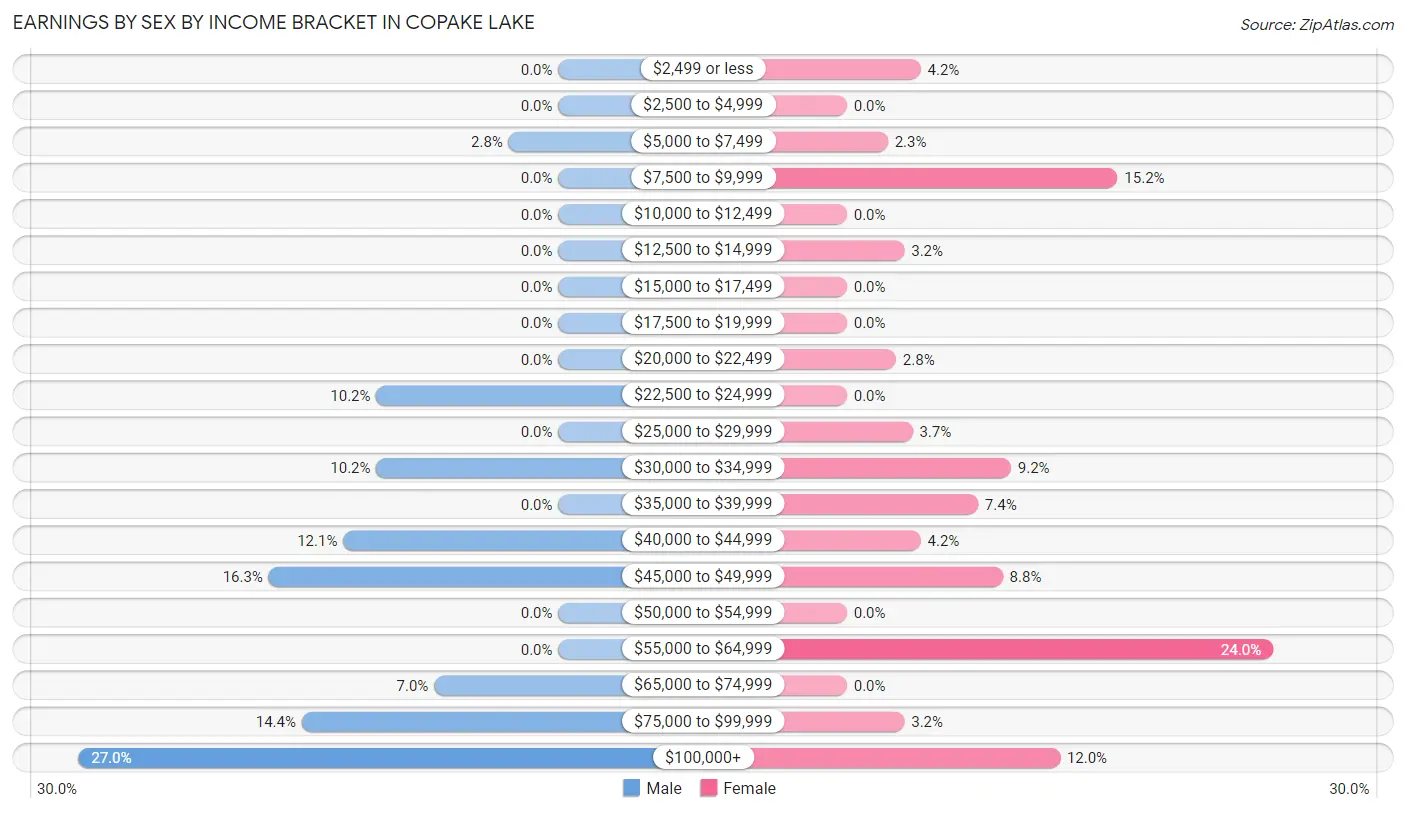
| Income | Male | Female |
| $2,499 or less | 0 (0.0%) | 9 (4.2%) |
| $2,500 to $4,999 | 0 (0.0%) | 0 (0.0%) |
| $5,000 to $7,499 | 6 (2.8%) | 5 (2.3%) |
| $7,500 to $9,999 | 0 (0.0%) | 33 (15.2%) |
| $10,000 to $12,499 | 0 (0.0%) | 0 (0.0%) |
| $12,500 to $14,999 | 0 (0.0%) | 7 (3.2%) |
| $15,000 to $17,499 | 0 (0.0%) | 0 (0.0%) |
| $17,500 to $19,999 | 0 (0.0%) | 0 (0.0%) |
| $20,000 to $22,499 | 0 (0.0%) | 6 (2.8%) |
| $22,500 to $24,999 | 22 (10.2%) | 0 (0.0%) |
| $25,000 to $29,999 | 0 (0.0%) | 8 (3.7%) |
| $30,000 to $34,999 | 22 (10.2%) | 20 (9.2%) |
| $35,000 to $39,999 | 0 (0.0%) | 16 (7.4%) |
| $40,000 to $44,999 | 26 (12.1%) | 9 (4.2%) |
| $45,000 to $49,999 | 35 (16.3%) | 19 (8.8%) |
| $50,000 to $54,999 | 0 (0.0%) | 0 (0.0%) |
| $55,000 to $64,999 | 0 (0.0%) | 52 (24.0%) |
| $65,000 to $74,999 | 15 (7.0%) | 0 (0.0%) |
| $75,000 to $99,999 | 31 (14.4%) | 7 (3.2%) |
| $100,000+ | 58 (27.0%) | 26 (12.0%) |
| Total | 215 (100.0%) | 217 (100.0%) |
Earnings by Sex by Educational Attainment in Copake Lake
Average earnings in Copake Lake are $66,607 for men and $47,961 for women, a difference of 28.0%. Men with an educational attainment of graduate degree enjoy the highest average annual earnings of $231,354, while those with bachelor's degree education earn the least with $47,593. Women with an educational attainment of college or associate's degree earn the most with the average annual earnings of $62,574, while those with college or associate's degree education have the smallest earnings of $62,574.
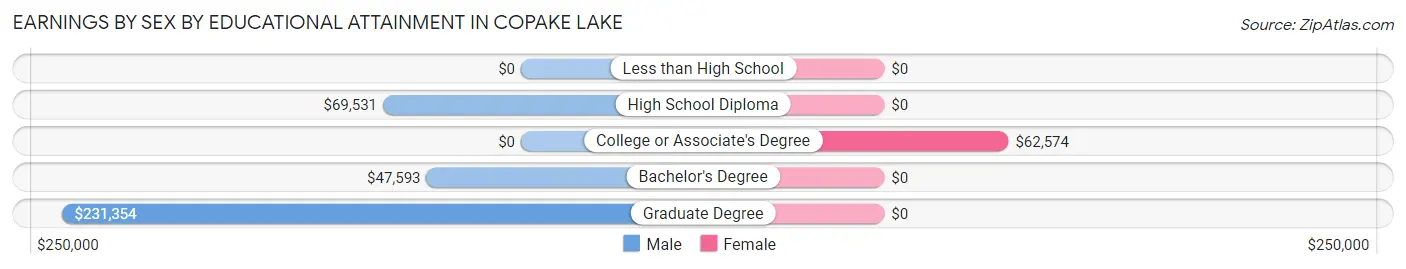
| Educational Attainment | Male Income | Female Income |
| Less than High School | - | - |
| High School Diploma | $69,531 | $0 |
| College or Associate's Degree | - | - |
| Bachelor's Degree | $47,593 | $0 |
| Graduate Degree | $231,354 | $0 |
| Total | $66,607 | $47,961 |
Family Income in Copake Lake
Family Income Brackets in Copake Lake
According to the Copake Lake family income data, there are 108 families falling into the $100,000 to $149,999 income range, which is the most common income bracket and makes up 34.9% of all families.
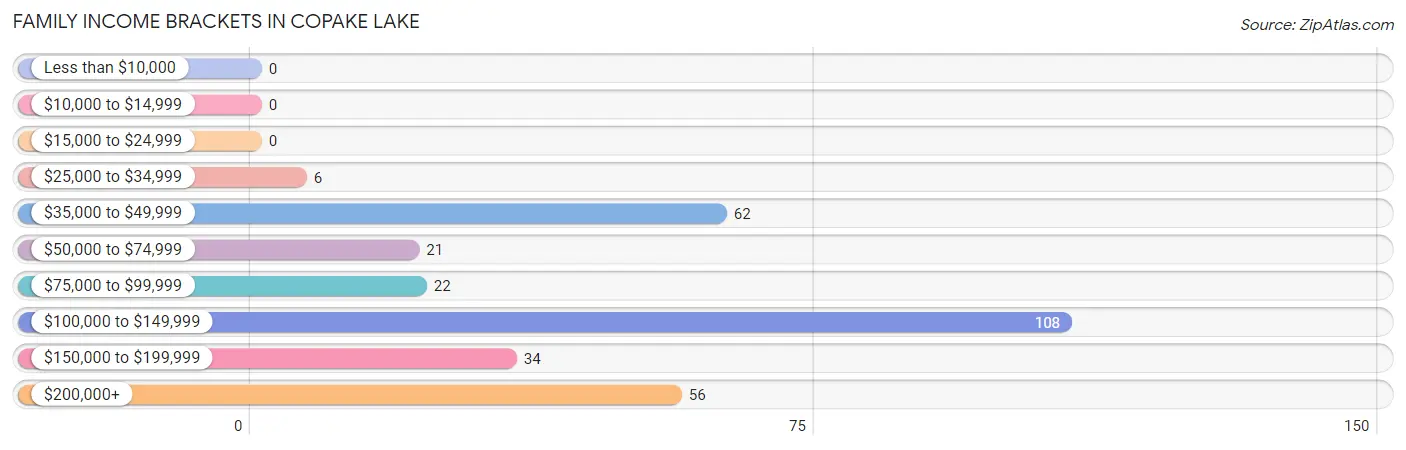
| Income Bracket | # Families | % Families |
| Less than $10,000 | 0 | 0.0% |
| $10,000 to $14,999 | 0 | 0.0% |
| $15,000 to $24,999 | 0 | 0.0% |
| $25,000 to $34,999 | 6 | 1.9% |
| $35,000 to $49,999 | 62 | 20.1% |
| $50,000 to $74,999 | 21 | 6.8% |
| $75,000 to $99,999 | 22 | 7.1% |
| $100,000 to $149,999 | 108 | 35.0% |
| $150,000 to $199,999 | 34 | 11.0% |
| $200,000+ | 56 | 18.1% |
Family Income by Famaliy Size in Copake Lake
2-person families (258 | 83.5%) account for the highest median family income in Copake Lake with $113,953 per family, while 2-person families (258 | 83.5%) have the highest median income of $56,976 per family member.
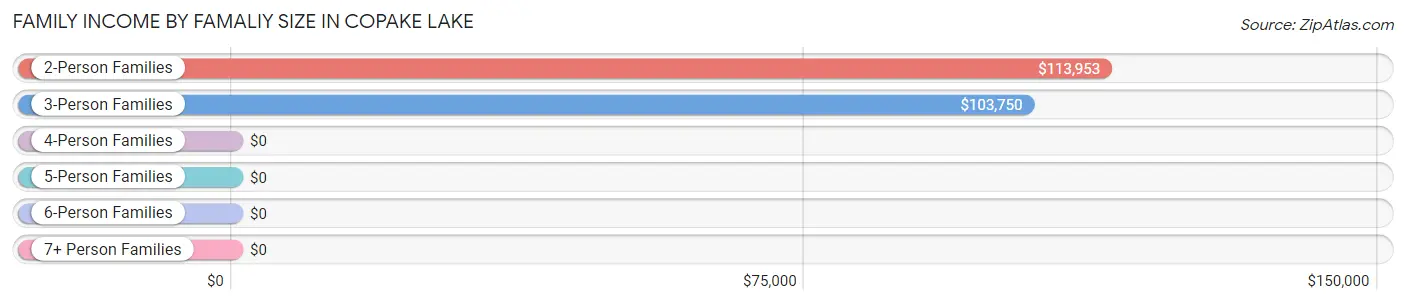
| Income Bracket | # Families | Median Income |
| 2-Person Families | 258 (83.5%) | $113,953 |
| 3-Person Families | 40 (12.9%) | $103,750 |
| 4-Person Families | 11 (3.6%) | $0 |
| 5-Person Families | 0 (0.0%) | $0 |
| 6-Person Families | 0 (0.0%) | $0 |
| 7+ Person Families | 0 (0.0%) | $0 |
| Total | 309 (100.0%) | $113,517 |
Family Income by Number of Earners in Copake Lake
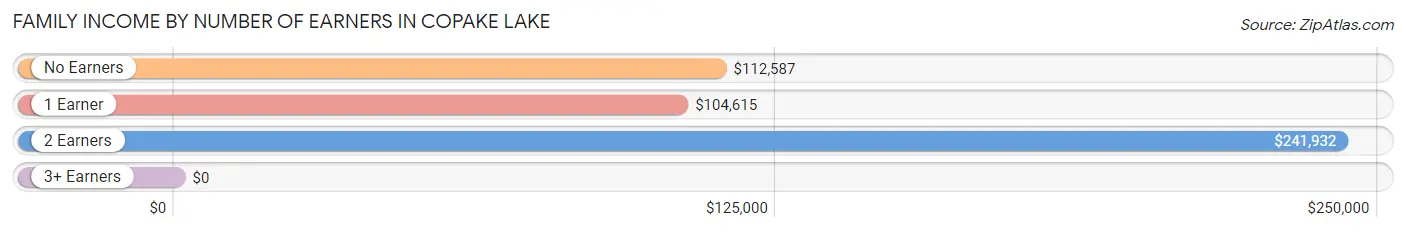
| Number of Earners | # Families | Median Income |
| No Earners | 83 (26.9%) | $112,587 |
| 1 Earner | 148 (47.9%) | $104,615 |
| 2 Earners | 71 (23.0%) | $241,932 |
| 3+ Earners | 7 (2.3%) | $0 |
| Total | 309 (100.0%) | $113,517 |
Household Income in Copake Lake
Household Income Brackets in Copake Lake
With 89 households falling in the category, the $100,000 to $149,999 income range is the most frequent in Copake Lake, accounting for 24.2% of all households.
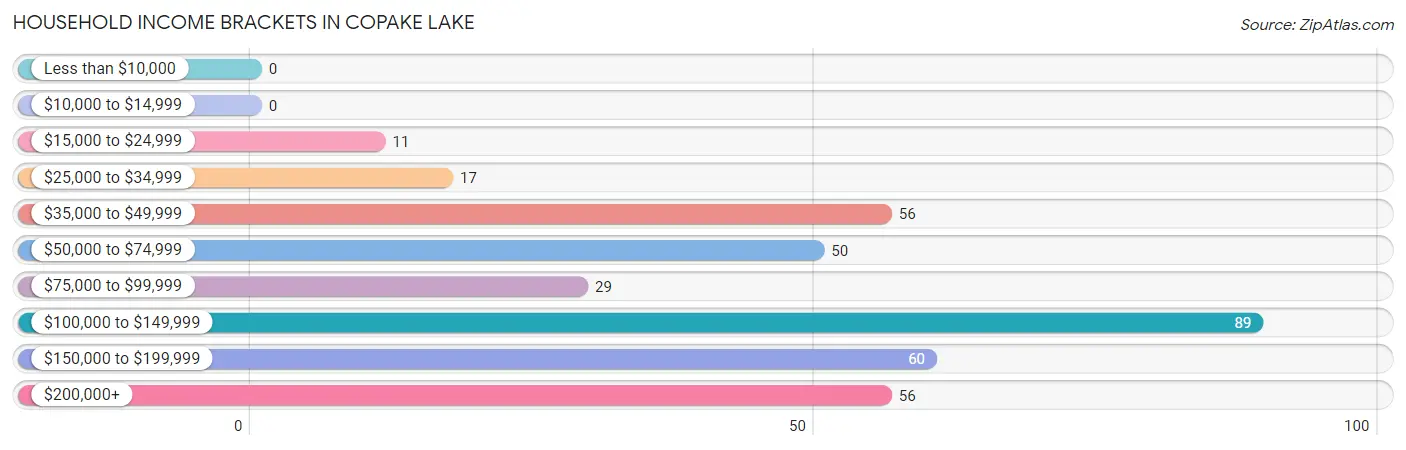
| Income Bracket | # Households | % Households |
| Less than $10,000 | 0 | 0.0% |
| $10,000 to $14,999 | 0 | 0.0% |
| $15,000 to $24,999 | 11 | 3.0% |
| $25,000 to $34,999 | 17 | 4.6% |
| $35,000 to $49,999 | 56 | 15.2% |
| $50,000 to $74,999 | 50 | 13.6% |
| $75,000 to $99,999 | 29 | 7.9% |
| $100,000 to $149,999 | 89 | 24.2% |
| $150,000 to $199,999 | 60 | 16.3% |
| $200,000+ | 56 | 15.2% |
Household Income by Householder Age in Copake Lake
The median household income in Copake Lake is $113,550, with the highest median household income of $186,106 found in the 25 to 44 years age bracket for the primary householder. A total of 49 households (13.3%) fall into this category.
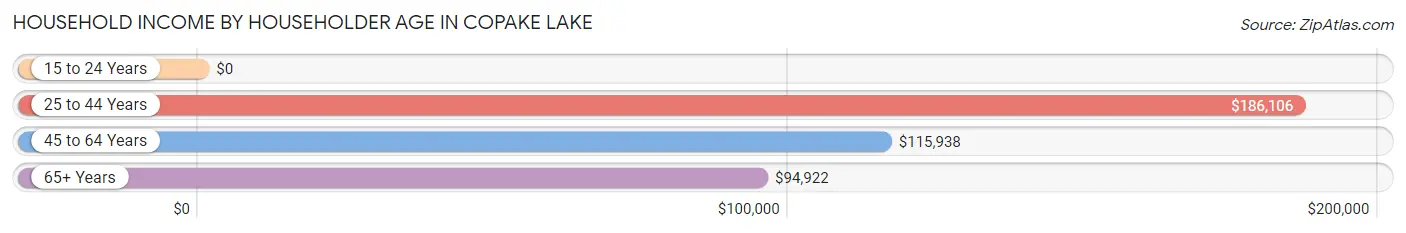
| Income Bracket | # Households | Median Income |
| 15 to 24 Years | 0 (0.0%) | $0 |
| 25 to 44 Years | 49 (13.3%) | $186,106 |
| 45 to 64 Years | 186 (50.5%) | $115,938 |
| 65+ Years | 133 (36.1%) | $94,922 |
| Total | 368 (100.0%) | $113,550 |
Poverty in Copake Lake
Income Below Poverty by Sex and Age in Copake Lake
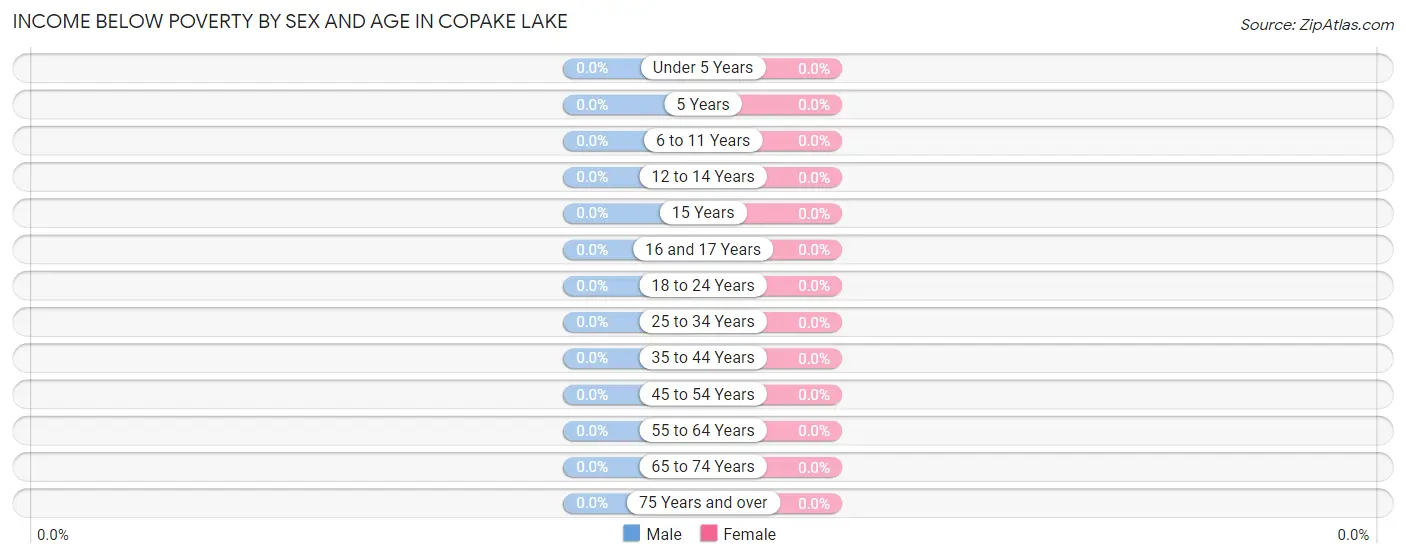
| Age Bracket | Male | Female |
| Under 5 Years | 0 (0.0%) | 0 (0.0%) |
| 5 Years | 0 (0.0%) | 0 (0.0%) |
| 6 to 11 Years | 0 (0.0%) | 0 (0.0%) |
| 12 to 14 Years | 0 (0.0%) | 0 (0.0%) |
| 15 Years | 0 (0.0%) | 0 (0.0%) |
| 16 and 17 Years | 0 (0.0%) | 0 (0.0%) |
| 18 to 24 Years | 0 (0.0%) | 0 (0.0%) |
| 25 to 34 Years | 0 (0.0%) | 0 (0.0%) |
| 35 to 44 Years | 0 (0.0%) | 0 (0.0%) |
| 45 to 54 Years | 0 (0.0%) | 0 (0.0%) |
| 55 to 64 Years | 0 (0.0%) | 0 (0.0%) |
| 65 to 74 Years | 0 (0.0%) | 0 (0.0%) |
| 75 Years and over | 0 (0.0%) | 0 (0.0%) |
| Total | 0 (0.0%) | 0 (0.0%) |
Income Above Poverty by Sex and Age in Copake Lake
According to the poverty statistics in Copake Lake, males aged 6 to 11 years and females aged 6 to 11 years are the age groups that are most secure financially, with 100.0% of males and 100.0% of females in these age groups living above the poverty line.
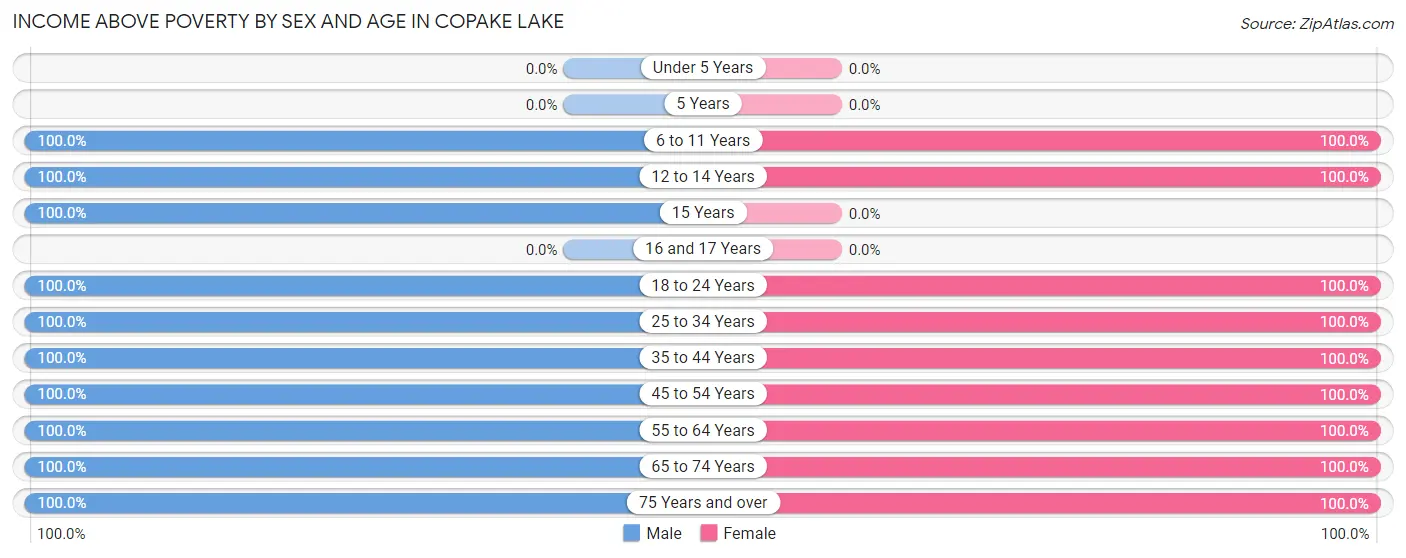
| Age Bracket | Male | Female |
| Under 5 Years | 0 (0.0%) | 0 (0.0%) |
| 5 Years | 0 (0.0%) | 0 (0.0%) |
| 6 to 11 Years | 15 (100.0%) | 23 (100.0%) |
| 12 to 14 Years | 8 (100.0%) | 32 (100.0%) |
| 15 Years | 27 (100.0%) | 0 (0.0%) |
| 16 and 17 Years | 0 (0.0%) | 0 (0.0%) |
| 18 to 24 Years | 16 (100.0%) | 16 (100.0%) |
| 25 to 34 Years | 33 (100.0%) | 9 (100.0%) |
| 35 to 44 Years | 26 (100.0%) | 42 (100.0%) |
| 45 to 54 Years | 53 (100.0%) | 41 (100.0%) |
| 55 to 64 Years | 140 (100.0%) | 99 (100.0%) |
| 65 to 74 Years | 61 (100.0%) | 64 (100.0%) |
| 75 Years and over | 56 (100.0%) | 56 (100.0%) |
| Total | 435 (100.0%) | 382 (100.0%) |
Income Below Poverty Among Married-Couple Families in Copake Lake
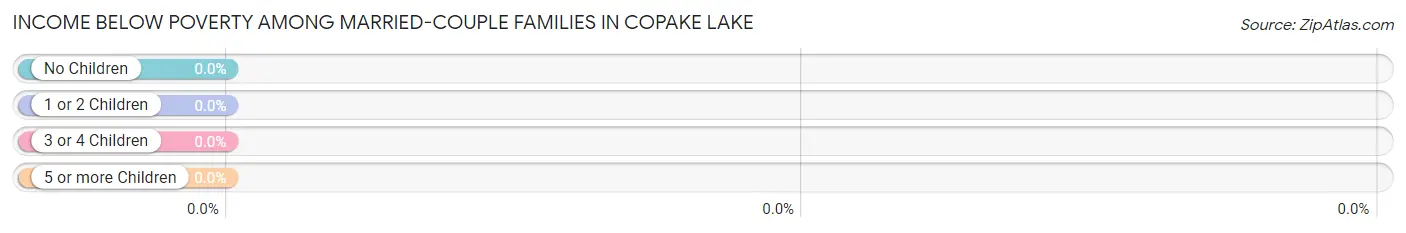
| Children | Above Poverty | Below Poverty |
| No Children | 207 (100.0%) | 0 (0.0%) |
| 1 or 2 Children | 18 (100.0%) | 0 (0.0%) |
| 3 or 4 Children | 0 (0.0%) | 0 (0.0%) |
| 5 or more Children | 0 (0.0%) | 0 (0.0%) |
| Total | 225 (100.0%) | 0 (0.0%) |
Income Below Poverty Among Single-Parent Households in Copake Lake
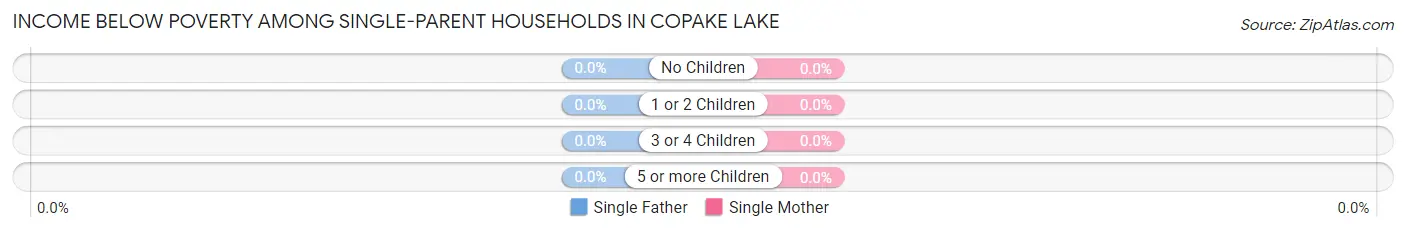
| Children | Single Father | Single Mother |
| No Children | 0 (0.0%) | 0 (0.0%) |
| 1 or 2 Children | 0 (0.0%) | 0 (0.0%) |
| 3 or 4 Children | 0 (0.0%) | 0 (0.0%) |
| 5 or more Children | 0 (0.0%) | 0 (0.0%) |
| Total | 0 (0.0%) | 0 (0.0%) |
Income Below Poverty Among Married-Couple vs Single-Parent Households in Copake Lake
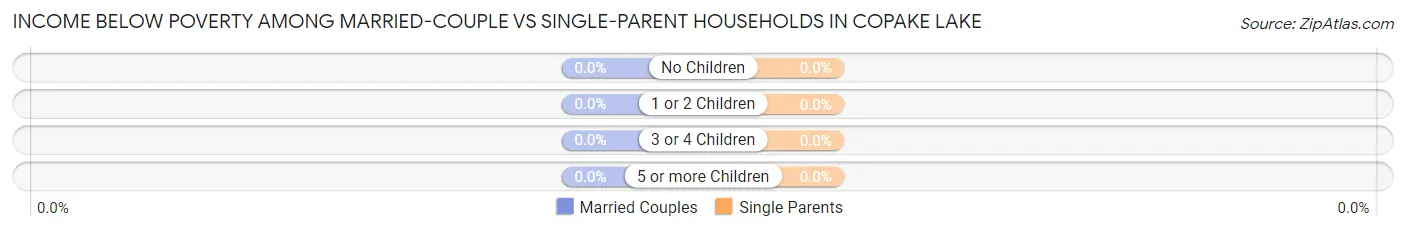
| Children | Married-Couple Families | Single-Parent Households |
| No Children | 0 (0.0%) | 0 (0.0%) |
| 1 or 2 Children | 0 (0.0%) | 0 (0.0%) |
| 3 or 4 Children | 0 (0.0%) | 0 (0.0%) |
| 5 or more Children | 0 (0.0%) | 0 (0.0%) |
| Total | 0 (0.0%) | 0 (0.0%) |
Employment Characteristics in Copake Lake
Employment by Class of Employer in Copake Lake
Among the 389 employed individuals in Copake Lake, private company employees (160 | 41.1%), not-for-profit organizations (95 | 24.4%), and local government employees (45 | 11.6%) make up the most common classes of employment.
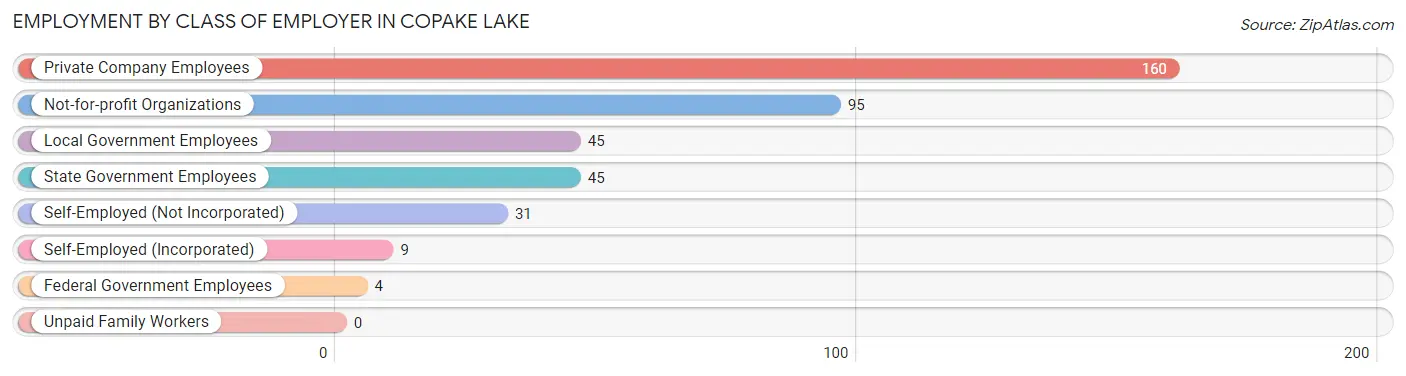
| Employer Class | # Employees | % Employees |
| Private Company Employees | 160 | 41.1% |
| Self-Employed (Incorporated) | 9 | 2.3% |
| Self-Employed (Not Incorporated) | 31 | 8.0% |
| Not-for-profit Organizations | 95 | 24.4% |
| Local Government Employees | 45 | 11.6% |
| State Government Employees | 45 | 11.6% |
| Federal Government Employees | 4 | 1.0% |
| Unpaid Family Workers | 0 | 0.0% |
| Total | 389 | 100.0% |
Employment Status by Age in Copake Lake
According to the labor force statistics for Copake Lake, out of the total population over 16 years of age (712), 55.9% or 398 individuals are in the labor force, with 2.3% or 9 of them unemployed. The age group with the highest labor force participation rate is 20 to 24 years, with 100.0% or 32 individuals in the labor force. Within the labor force, the 45 to 54 years age range has the highest percentage of unemployed individuals, with 10.2% or 9 of them being unemployed.
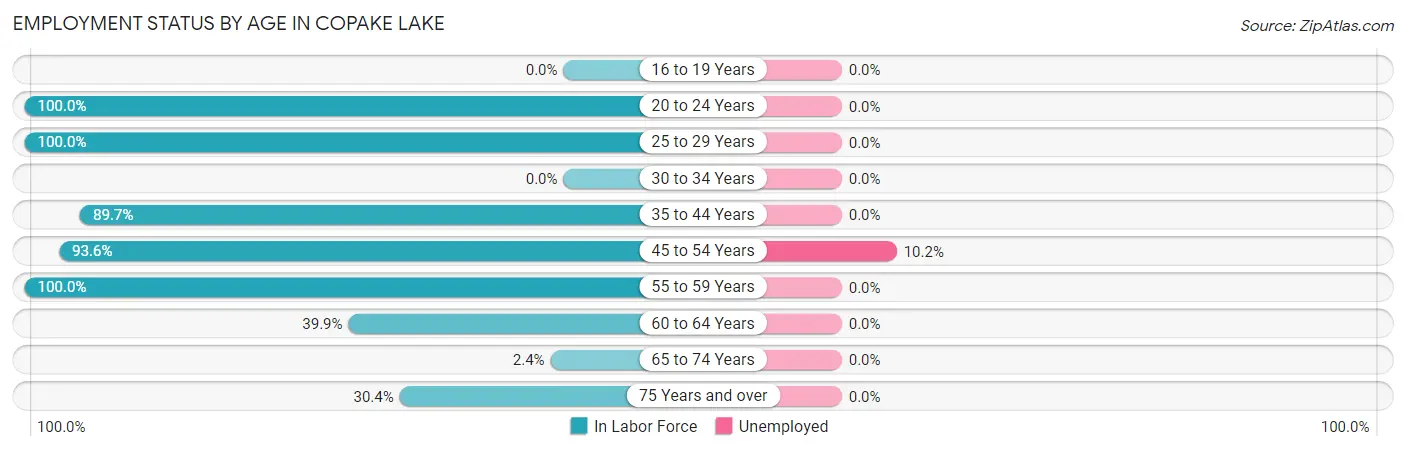
| Age Bracket | In Labor Force | Unemployed |
| 16 to 19 Years | 0 (0.0%) | 0 (0.0%) |
| 20 to 24 Years | 32 (100.0%) | 0 (0.0%) |
| 25 to 29 Years | 42 (100.0%) | 0 (0.0%) |
| 30 to 34 Years | 0 (0.0%) | 0 (0.0%) |
| 35 to 44 Years | 61 (89.7%) | 0 (0.0%) |
| 45 to 54 Years | 88 (93.6%) | 9 (10.2%) |
| 55 to 59 Years | 71 (100.0%) | 0 (0.0%) |
| 60 to 64 Years | 67 (39.9%) | 0 (0.0%) |
| 65 to 74 Years | 3 (2.4%) | 0 (0.0%) |
| 75 Years and over | 34 (30.4%) | 0 (0.0%) |
| Total | 398 (55.9%) | 9 (2.3%) |
Employment Status by Educational Attainment in Copake Lake
According to labor force statistics for Copake Lake, 74.3% of individuals (329) out of the total population between 25 and 64 years of age (443) are in the labor force, with 2.7% or 9 of them being unemployed. The group with the highest labor force participation rate are those with the educational attainment of college / associate degree, with 87.0% or 40 individuals in the labor force. Within the labor force, individuals with bachelor's degree or higher education have the highest percentage of unemployment, with 4.5% or 9 of them being unemployed.
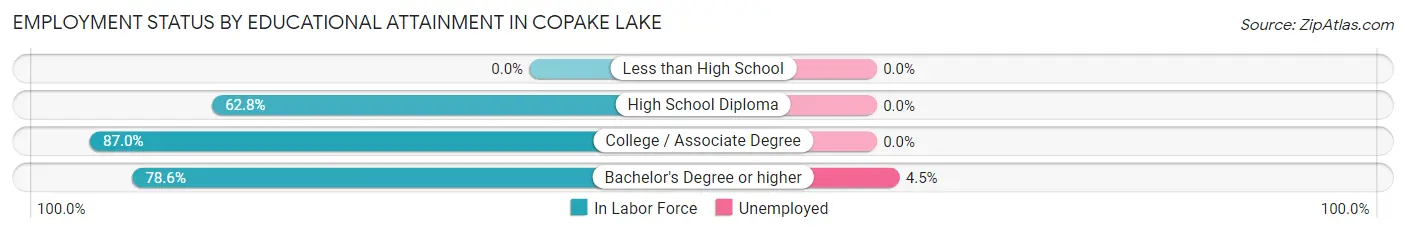
| Educational Attainment | In Labor Force | Unemployed |
| Less than High School | 0 (0.0%) | 0 (0.0%) |
| High School Diploma | 91 (62.8%) | 0 (0.0%) |
| College / Associate Degree | 40 (87.0%) | 0 (0.0%) |
| Bachelor's Degree or higher | 198 (78.6%) | 11 (4.5%) |
| Total | 329 (74.3%) | 12 (2.7%) |
Employment Occupations by Sex in Copake Lake
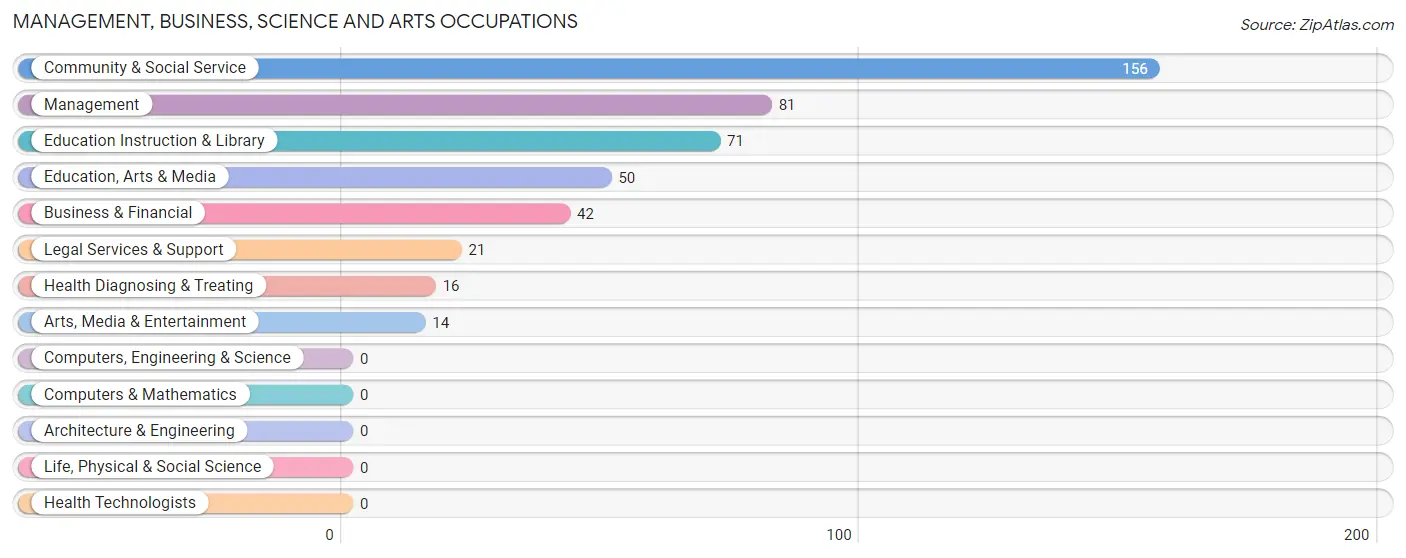
Management, Business, Science and Arts Occupations
The most common Management, Business, Science and Arts occupations in Copake Lake are Community & Social Service (156 | 40.1%), Management (81 | 20.8%), Education Instruction & Library (71 | 18.2%), Education, Arts & Media (50 | 12.9%), and Business & Financial (42 | 10.8%).
Management, Business, Science and Arts Occupations by Sex
Within the Management, Business, Science and Arts occupations in Copake Lake, the most male-oriented occupations are Legal Services & Support (100.0%), Business & Financial (64.3%), and Education, Arts & Media (60.0%), while the most female-oriented occupations are Health Diagnosing & Treating (100.0%), Education Instruction & Library (76.1%), and Community & Social Service (51.3%).
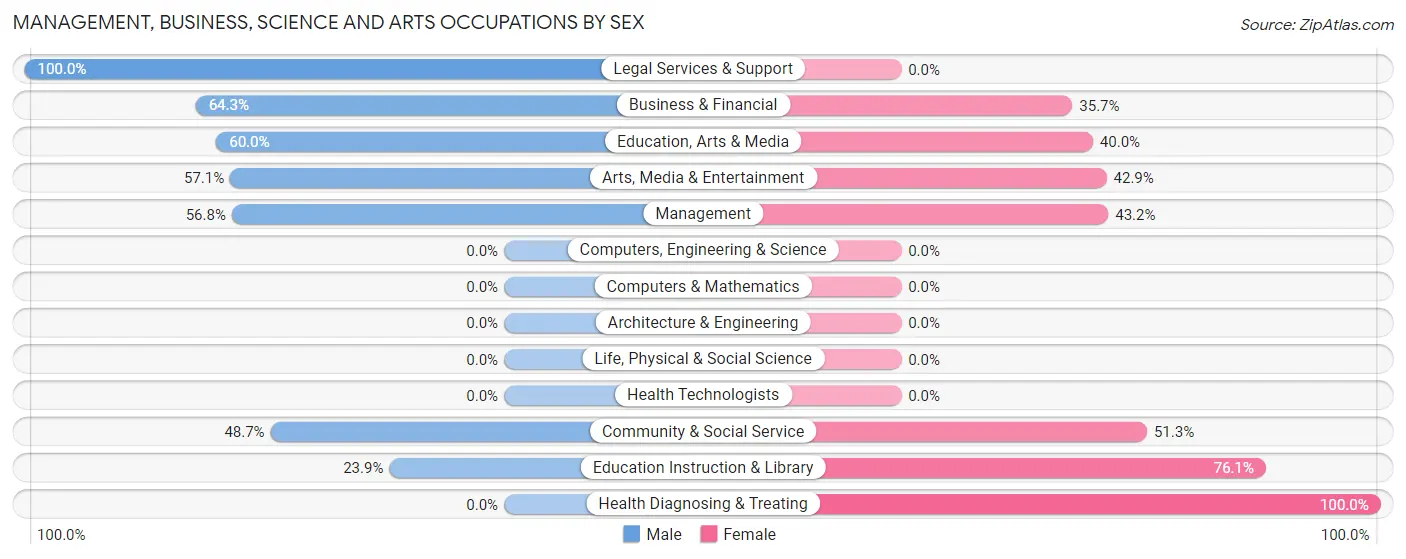
| Occupation | Male | Female |
| Management | 46 (56.8%) | 35 (43.2%) |
| Business & Financial | 27 (64.3%) | 15 (35.7%) |
| Computers, Engineering & Science | 0 (0.0%) | 0 (0.0%) |
| Computers & Mathematics | 0 (0.0%) | 0 (0.0%) |
| Architecture & Engineering | 0 (0.0%) | 0 (0.0%) |
| Life, Physical & Social Science | 0 (0.0%) | 0 (0.0%) |
| Community & Social Service | 76 (48.7%) | 80 (51.3%) |
| Education, Arts & Media | 30 (60.0%) | 20 (40.0%) |
| Legal Services & Support | 21 (100.0%) | 0 (0.0%) |
| Education Instruction & Library | 17 (23.9%) | 54 (76.1%) |
| Arts, Media & Entertainment | 8 (57.1%) | 6 (42.9%) |
| Health Diagnosing & Treating | 0 (0.0%) | 16 (100.0%) |
| Health Technologists | 0 (0.0%) | 0 (0.0%) |
| Total (Category) | 149 (50.5%) | 146 (49.5%) |
| Total (Overall) | 209 (53.7%) | 180 (46.3%) |
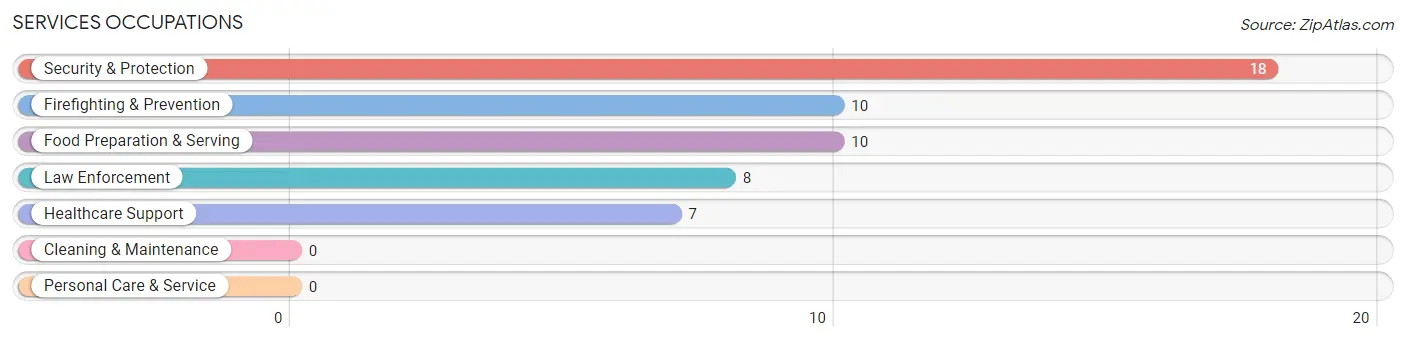
Services Occupations
The most common Services occupations in Copake Lake are Security & Protection (18 | 4.6%), Firefighting & Prevention (10 | 2.6%), Food Preparation & Serving (10 | 2.6%), Law Enforcement (8 | 2.1%), and Healthcare Support (7 | 1.8%).
Services Occupations by Sex
Within the Services occupations in Copake Lake, the most male-oriented occupations are Law Enforcement (100.0%), and Security & Protection (44.4%), while the most female-oriented occupations are Healthcare Support (100.0%), Firefighting & Prevention (100.0%), and Food Preparation & Serving (100.0%).
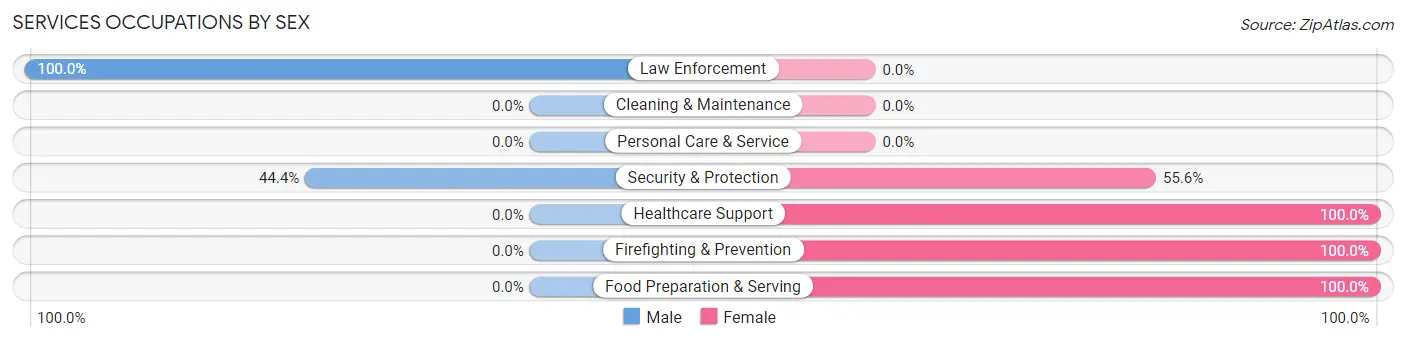
| Occupation | Male | Female |
| Healthcare Support | 0 (0.0%) | 7 (100.0%) |
| Security & Protection | 8 (44.4%) | 10 (55.6%) |
| Firefighting & Prevention | 0 (0.0%) | 10 (100.0%) |
| Law Enforcement | 8 (100.0%) | 0 (0.0%) |
| Food Preparation & Serving | 0 (0.0%) | 10 (100.0%) |
| Cleaning & Maintenance | 0 (0.0%) | 0 (0.0%) |
| Personal Care & Service | 0 (0.0%) | 0 (0.0%) |
| Total (Category) | 8 (22.9%) | 27 (77.1%) |
| Total (Overall) | 209 (53.7%) | 180 (46.3%) |
Sales and Office Occupations
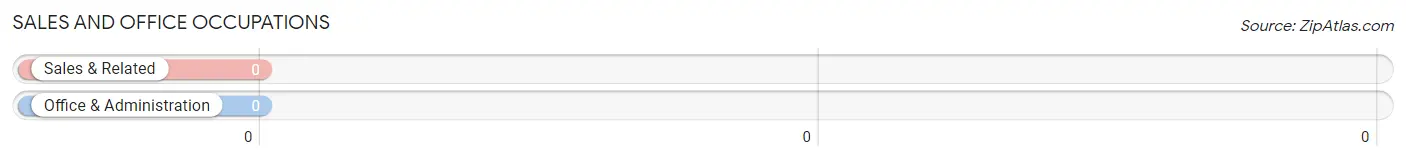
Sales and Office Occupations by Sex
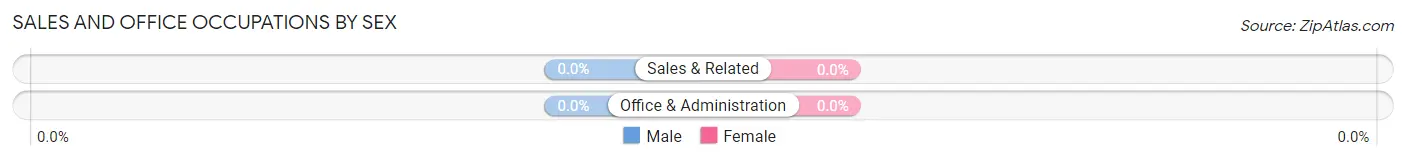
| Occupation | Male | Female |
| Sales & Related | 0 (0.0%) | 0 (0.0%) |
| Office & Administration | 0 (0.0%) | 0 (0.0%) |
| Total (Category) | 0 (0.0%) | 0 (0.0%) |
| Total (Overall) | 209 (53.7%) | 180 (46.3%) |
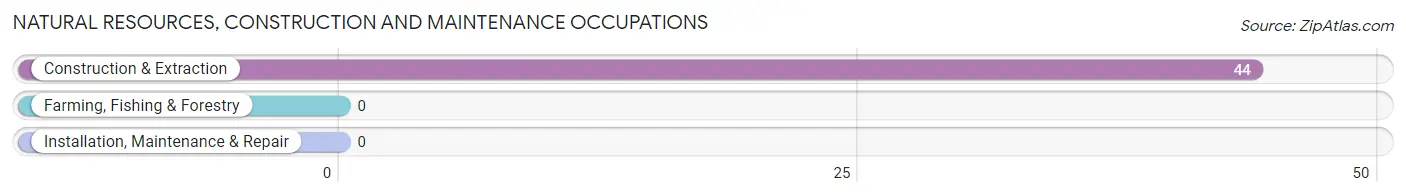
Natural Resources, Construction and Maintenance Occupations
The most common Natural Resources, Construction and Maintenance occupations in Copake Lake are , and Construction & Extraction (44 | 11.3%).
Natural Resources, Construction and Maintenance Occupations by Sex
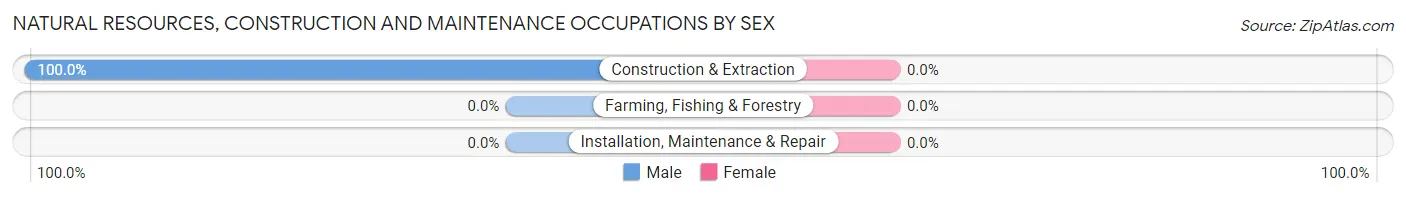
| Occupation | Male | Female |
| Farming, Fishing & Forestry | 0 (0.0%) | 0 (0.0%) |
| Construction & Extraction | 44 (100.0%) | 0 (0.0%) |
| Installation, Maintenance & Repair | 0 (0.0%) | 0 (0.0%) |
| Total (Category) | 44 (100.0%) | 0 (0.0%) |
| Total (Overall) | 209 (53.7%) | 180 (46.3%) |
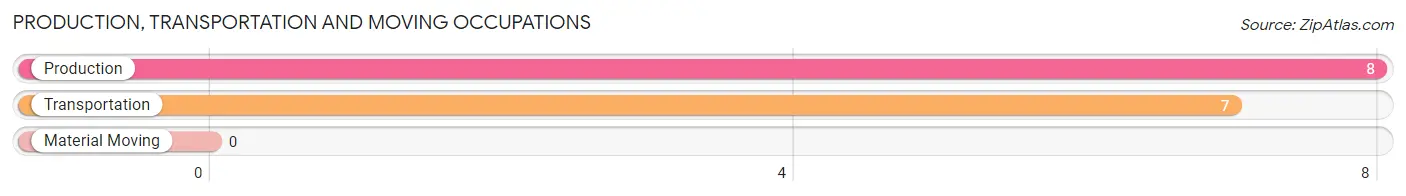
Production, Transportation and Moving Occupations
The most common Production, Transportation and Moving occupations in Copake Lake are Production (8 | 2.1%), and Transportation (7 | 1.8%).
Production, Transportation and Moving Occupations by Sex
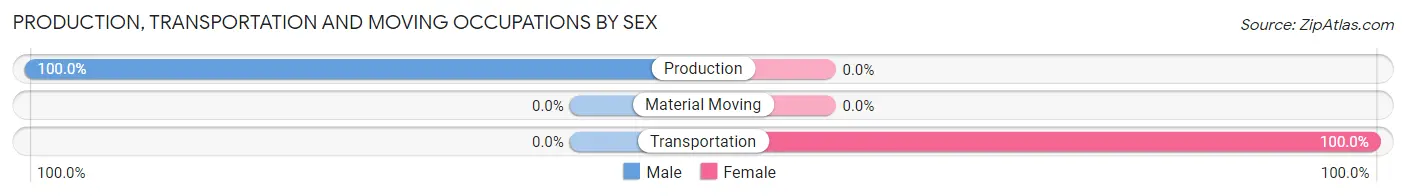
| Occupation | Male | Female |
| Production | 8 (100.0%) | 0 (0.0%) |
| Transportation | 0 (0.0%) | 7 (100.0%) |
| Material Moving | 0 (0.0%) | 0 (0.0%) |
| Total (Category) | 8 (53.3%) | 7 (46.7%) |
| Total (Overall) | 209 (53.7%) | 180 (46.3%) |
Employment Industries by Sex in Copake Lake
Employment Industries in Copake Lake
The major employment industries in Copake Lake include Educational Services (78 | 20.1%), Health Care & Social Assistance (56 | 14.4%), Construction (44 | 11.3%), Public Administration (39 | 10.0%), and Wholesale Trade (31 | 8.0%).
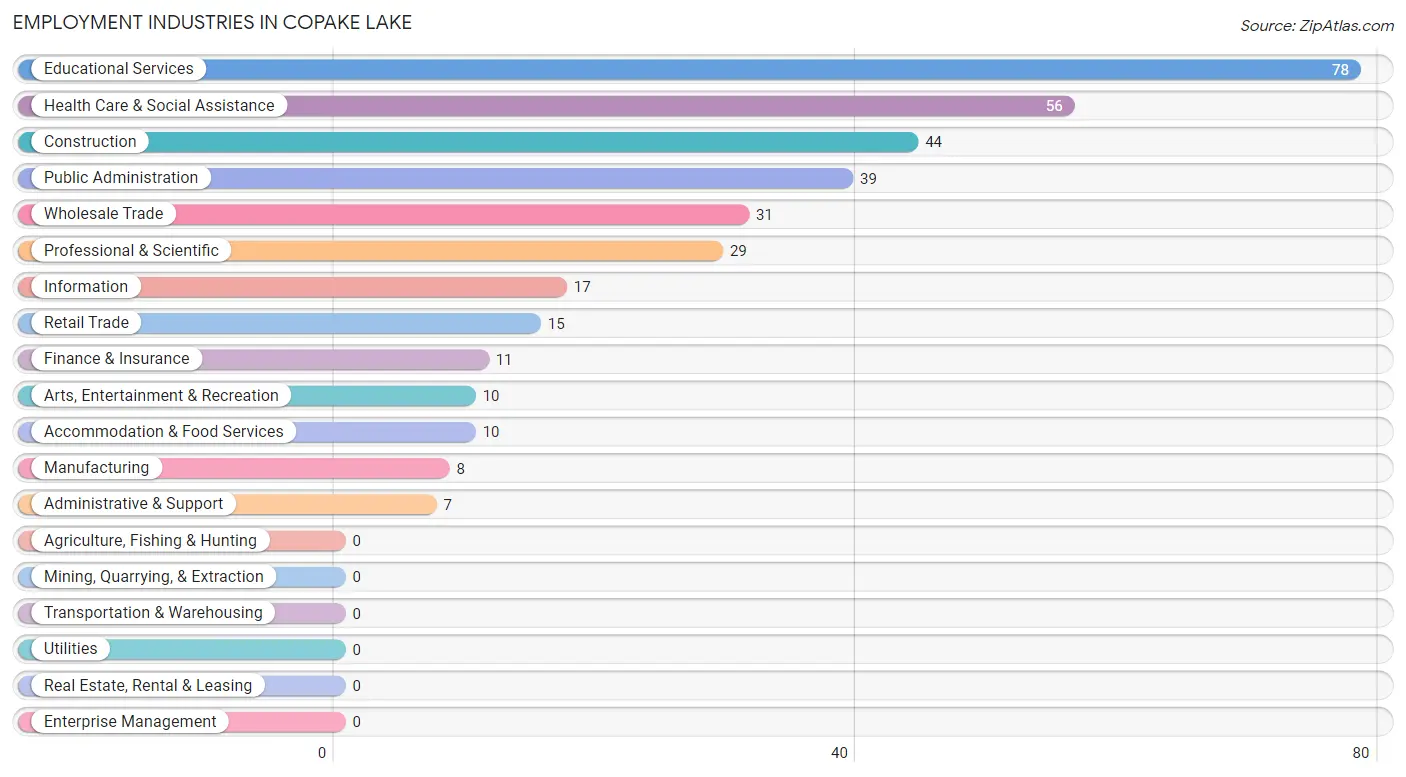
Employment Industries by Sex in Copake Lake
The Copake Lake industries that see more men than women are Construction (100.0%), Manufacturing (100.0%), and Wholesale Trade (100.0%), whereas the industries that tend to have a higher number of women are Retail Trade (100.0%), Administrative & Support (100.0%), and Arts, Entertainment & Recreation (100.0%).
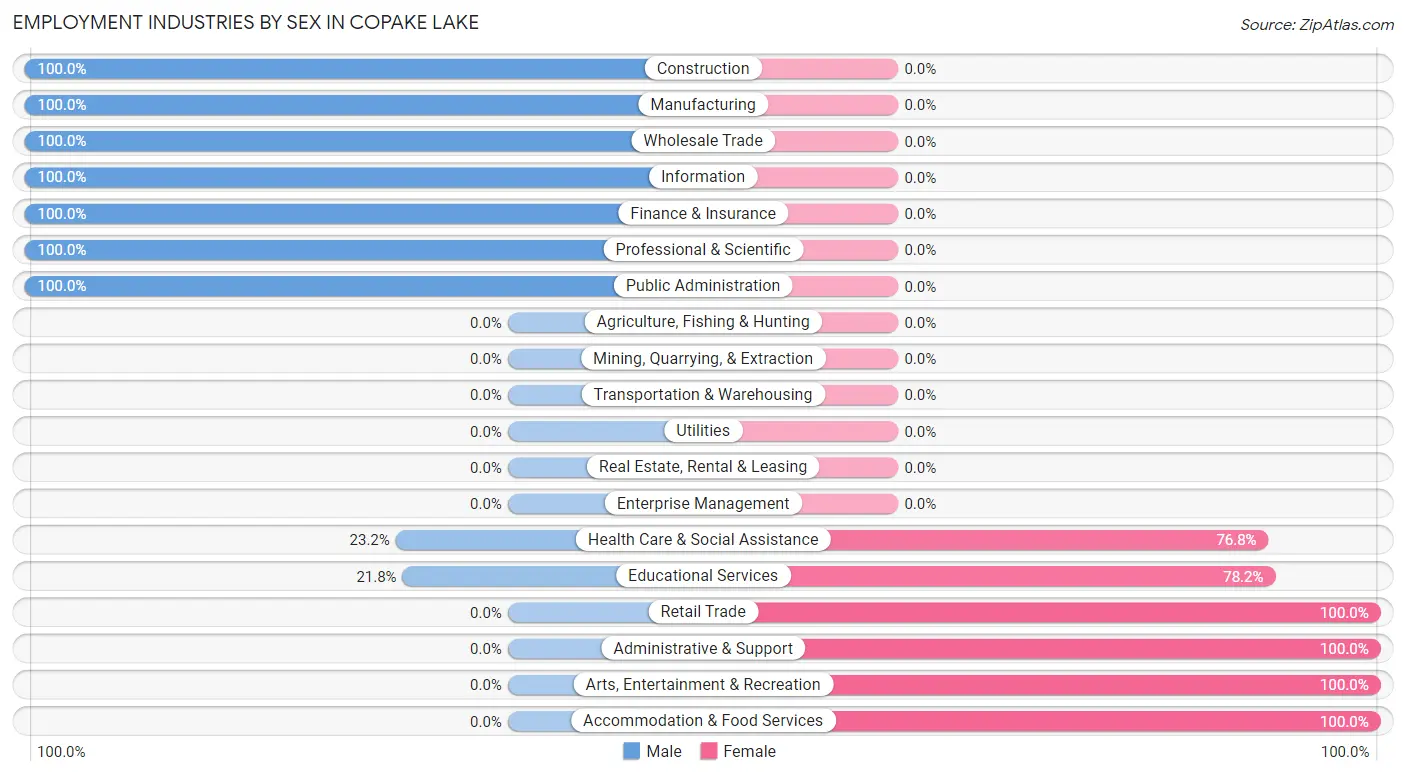
| Industry | Male | Female |
| Agriculture, Fishing & Hunting | 0 (0.0%) | 0 (0.0%) |
| Mining, Quarrying, & Extraction | 0 (0.0%) | 0 (0.0%) |
| Construction | 44 (100.0%) | 0 (0.0%) |
| Manufacturing | 8 (100.0%) | 0 (0.0%) |
| Wholesale Trade | 31 (100.0%) | 0 (0.0%) |
| Retail Trade | 0 (0.0%) | 15 (100.0%) |
| Transportation & Warehousing | 0 (0.0%) | 0 (0.0%) |
| Utilities | 0 (0.0%) | 0 (0.0%) |
| Information | 17 (100.0%) | 0 (0.0%) |
| Finance & Insurance | 11 (100.0%) | 0 (0.0%) |
| Real Estate, Rental & Leasing | 0 (0.0%) | 0 (0.0%) |
| Professional & Scientific | 29 (100.0%) | 0 (0.0%) |
| Enterprise Management | 0 (0.0%) | 0 (0.0%) |
| Administrative & Support | 0 (0.0%) | 7 (100.0%) |
| Educational Services | 17 (21.8%) | 61 (78.2%) |
| Health Care & Social Assistance | 13 (23.2%) | 43 (76.8%) |
| Arts, Entertainment & Recreation | 0 (0.0%) | 10 (100.0%) |
| Accommodation & Food Services | 0 (0.0%) | 10 (100.0%) |
| Public Administration | 39 (100.0%) | 0 (0.0%) |
| Total | 209 (53.7%) | 180 (46.3%) |
Education in Copake Lake
School Enrollment in Copake Lake
The most common levels of schooling among the 127 students in Copake Lake are middle school (81 | 63.8%), elementary school (15 | 11.8%), and graduate / professional (12 | 9.5%).
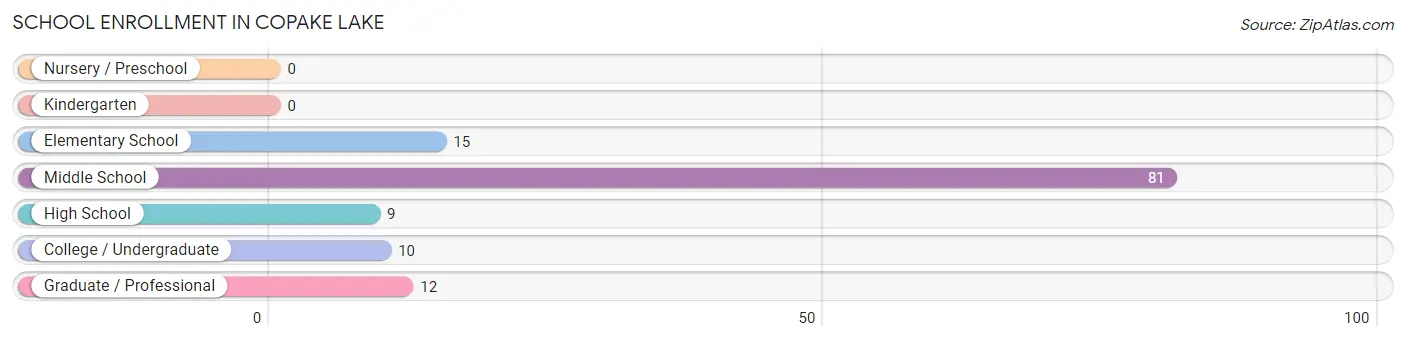
| School Level | # Students | % Students |
| Nursery / Preschool | 0 | 0.0% |
| Kindergarten | 0 | 0.0% |
| Elementary School | 15 | 11.8% |
| Middle School | 81 | 63.8% |
| High School | 9 | 7.1% |
| College / Undergraduate | 10 | 7.9% |
| Graduate / Professional | 12 | 9.5% |
| Total | 127 | 100.0% |
School Enrollment by Age by Funding Source in Copake Lake
Out of a total of 127 students who are enrolled in schools in Copake Lake, 9 (7.1%) attend a private institution, while the remaining 118 (92.9%) are enrolled in public schools. The age group of 5 to 9 year old has the highest likelihood of being enrolled in private schools, with 9 (100.0% in the age bracket) enrolled. Conversely, the age group of 10 to 14 year olds has the lowest likelihood of being enrolled in a private school, with 69 (100.0% in the age bracket) attending a public institution.
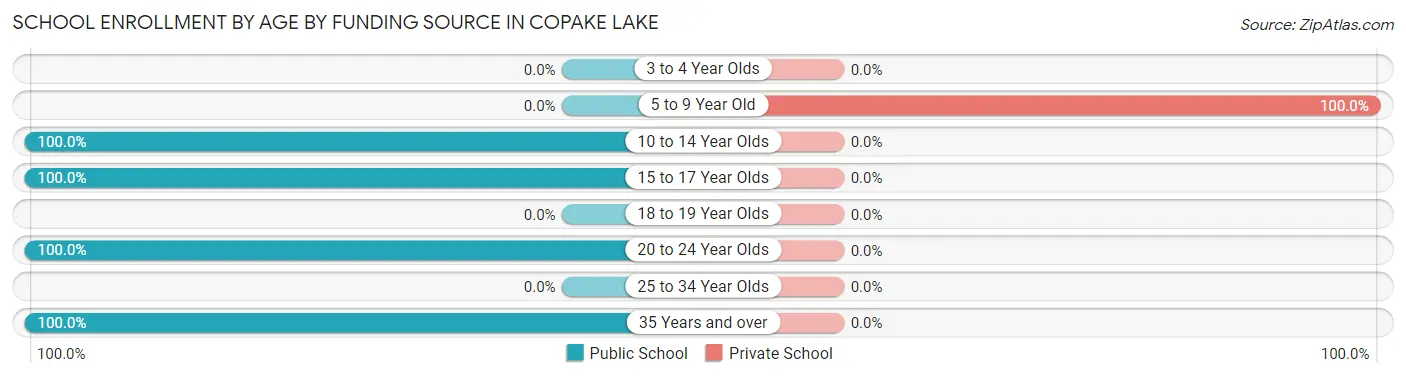
| Age Bracket | Public School | Private School |
| 3 to 4 Year Olds | 0 (0.0%) | 0 (0.0%) |
| 5 to 9 Year Old | 0 (0.0%) | 9 (100.0%) |
| 10 to 14 Year Olds | 69 (100.0%) | 0 (0.0%) |
| 15 to 17 Year Olds | 27 (100.0%) | 0 (0.0%) |
| 18 to 19 Year Olds | 0 (0.0%) | 0 (0.0%) |
| 20 to 24 Year Olds | 10 (100.0%) | 0 (0.0%) |
| 25 to 34 Year Olds | 0 (0.0%) | 0 (0.0%) |
| 35 Years and over | 12 (100.0%) | 0 (0.0%) |
| Total | 118 (92.9%) | 9 (7.1%) |
Educational Attainment by Field of Study in Copake Lake
Business (78 | 19.0%), communications (61 | 14.8%), science & technology (52 | 12.7%), education (52 | 12.7%), and arts & humanities (52 | 12.7%) are the most common fields of study among 411 individuals in Copake Lake who have obtained a bachelor's degree or higher.
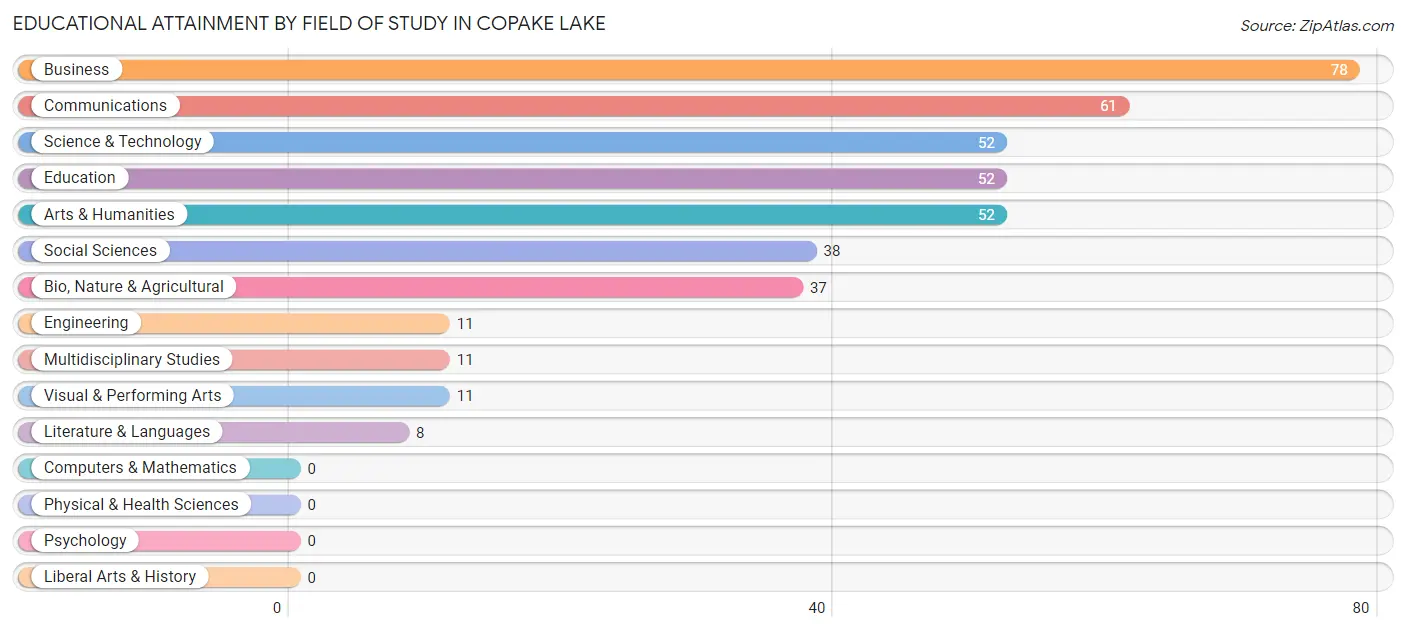
| Field of Study | # Graduates | % Graduates |
| Computers & Mathematics | 0 | 0.0% |
| Bio, Nature & Agricultural | 37 | 9.0% |
| Physical & Health Sciences | 0 | 0.0% |
| Psychology | 0 | 0.0% |
| Social Sciences | 38 | 9.2% |
| Engineering | 11 | 2.7% |
| Multidisciplinary Studies | 11 | 2.7% |
| Science & Technology | 52 | 12.7% |
| Business | 78 | 19.0% |
| Education | 52 | 12.7% |
| Literature & Languages | 8 | 1.9% |
| Liberal Arts & History | 0 | 0.0% |
| Visual & Performing Arts | 11 | 2.7% |
| Communications | 61 | 14.8% |
| Arts & Humanities | 52 | 12.7% |
| Total | 411 | 100.0% |
Transportation & Commute in Copake Lake
Vehicle Availability by Sex in Copake Lake
The most prevalent vehicle ownership categories in Copake Lake are males with 3 vehicles (75, accounting for 35.9%) and females with 3 vehicles (67, making up 41.7%).
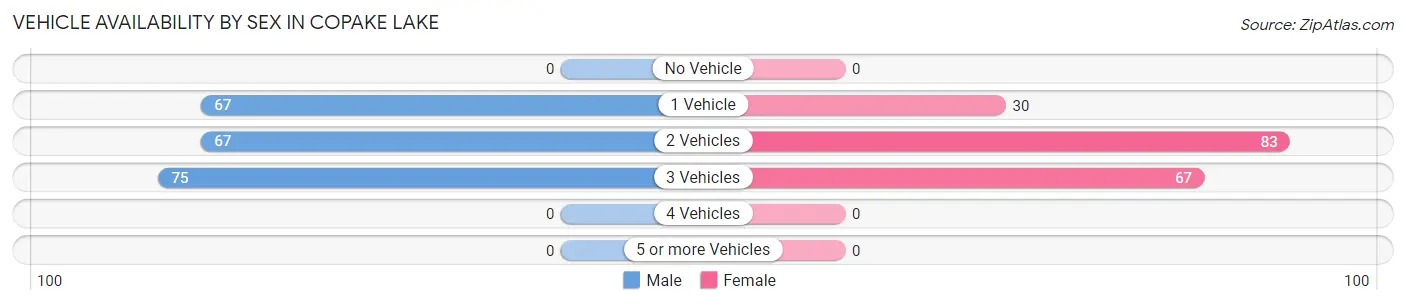
| Vehicles Available | Male | Female |
| No Vehicle | 0 (0.0%) | 0 (0.0%) |
| 1 Vehicle | 67 (32.1%) | 30 (16.7%) |
| 2 Vehicles | 67 (32.1%) | 83 (46.1%) |
| 3 Vehicles | 75 (35.9%) | 67 (37.2%) |
| 4 Vehicles | 0 (0.0%) | 0 (0.0%) |
| 5 or more Vehicles | 0 (0.0%) | 0 (0.0%) |
| Total | 209 (100.0%) | 180 (100.0%) |
Commute Time in Copake Lake
The most frequently occuring commute durations in Copake Lake are 45 to 59 minutes (82 commuters, 24.8%), 60 to 89 minutes (60 commuters, 18.2%), and 20 to 24 minutes (54 commuters, 16.4%).
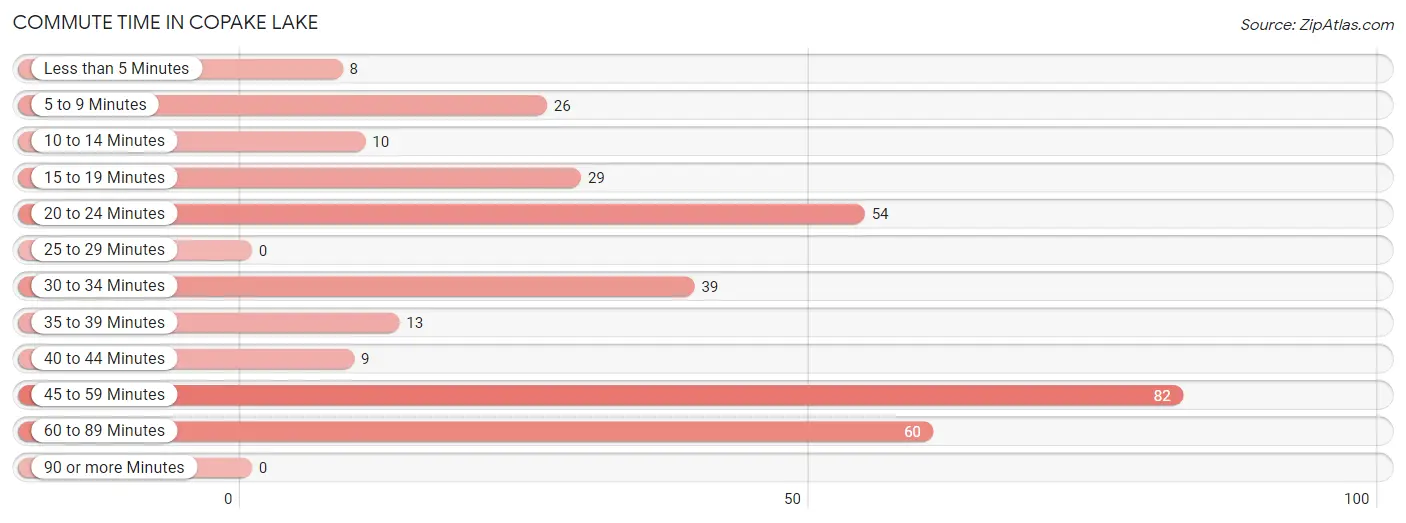
| Commute Time | # Commuters | % Commuters |
| Less than 5 Minutes | 8 | 2.4% |
| 5 to 9 Minutes | 26 | 7.9% |
| 10 to 14 Minutes | 10 | 3.0% |
| 15 to 19 Minutes | 29 | 8.8% |
| 20 to 24 Minutes | 54 | 16.4% |
| 25 to 29 Minutes | 0 | 0.0% |
| 30 to 34 Minutes | 39 | 11.8% |
| 35 to 39 Minutes | 13 | 3.9% |
| 40 to 44 Minutes | 9 | 2.7% |
| 45 to 59 Minutes | 82 | 24.8% |
| 60 to 89 Minutes | 60 | 18.2% |
| 90 or more Minutes | 0 | 0.0% |
Commute Time by Sex in Copake Lake
The most common commute times in Copake Lake are 20 to 24 minutes (44 commuters, 26.2%) for males and 45 to 59 minutes (42 commuters, 25.9%) for females.
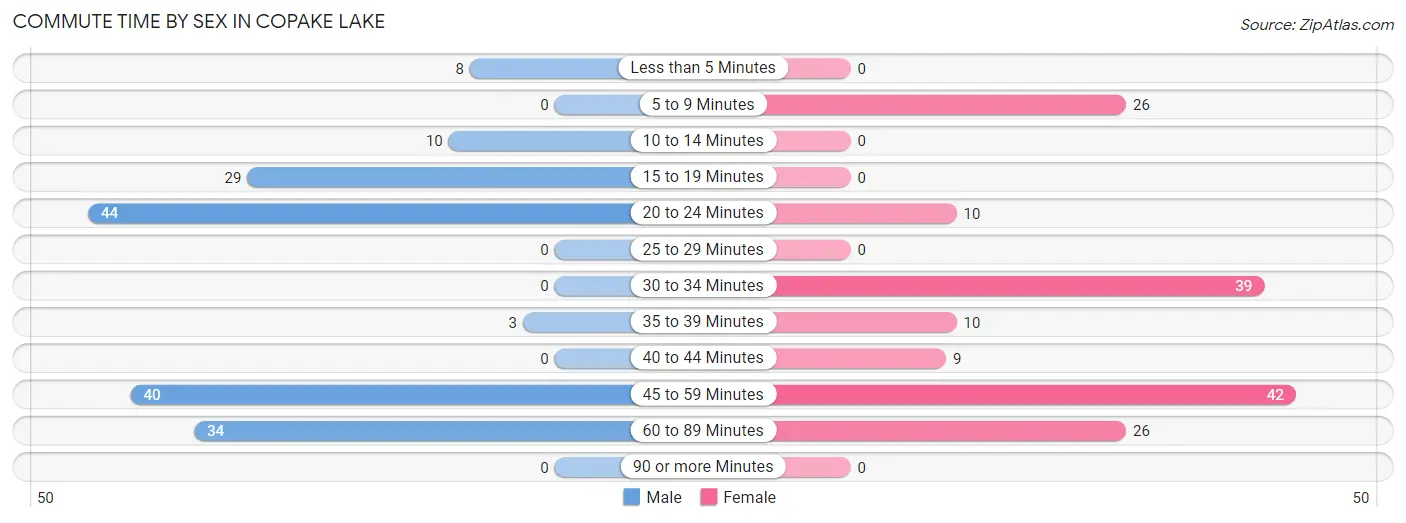
| Commute Time | Male | Female |
| Less than 5 Minutes | 8 (4.8%) | 0 (0.0%) |
| 5 to 9 Minutes | 0 (0.0%) | 26 (16.1%) |
| 10 to 14 Minutes | 10 (5.9%) | 0 (0.0%) |
| 15 to 19 Minutes | 29 (17.3%) | 0 (0.0%) |
| 20 to 24 Minutes | 44 (26.2%) | 10 (6.2%) |
| 25 to 29 Minutes | 0 (0.0%) | 0 (0.0%) |
| 30 to 34 Minutes | 0 (0.0%) | 39 (24.1%) |
| 35 to 39 Minutes | 3 (1.8%) | 10 (6.2%) |
| 40 to 44 Minutes | 0 (0.0%) | 9 (5.6%) |
| 45 to 59 Minutes | 40 (23.8%) | 42 (25.9%) |
| 60 to 89 Minutes | 34 (20.2%) | 26 (16.1%) |
| 90 or more Minutes | 0 (0.0%) | 0 (0.0%) |
Time of Departure to Work by Sex in Copake Lake
The most frequent times of departure to work in Copake Lake are 6:00 AM to 6:29 AM (31, 18.4%) for males and 6:30 AM to 6:59 AM (45, 27.8%) for females.
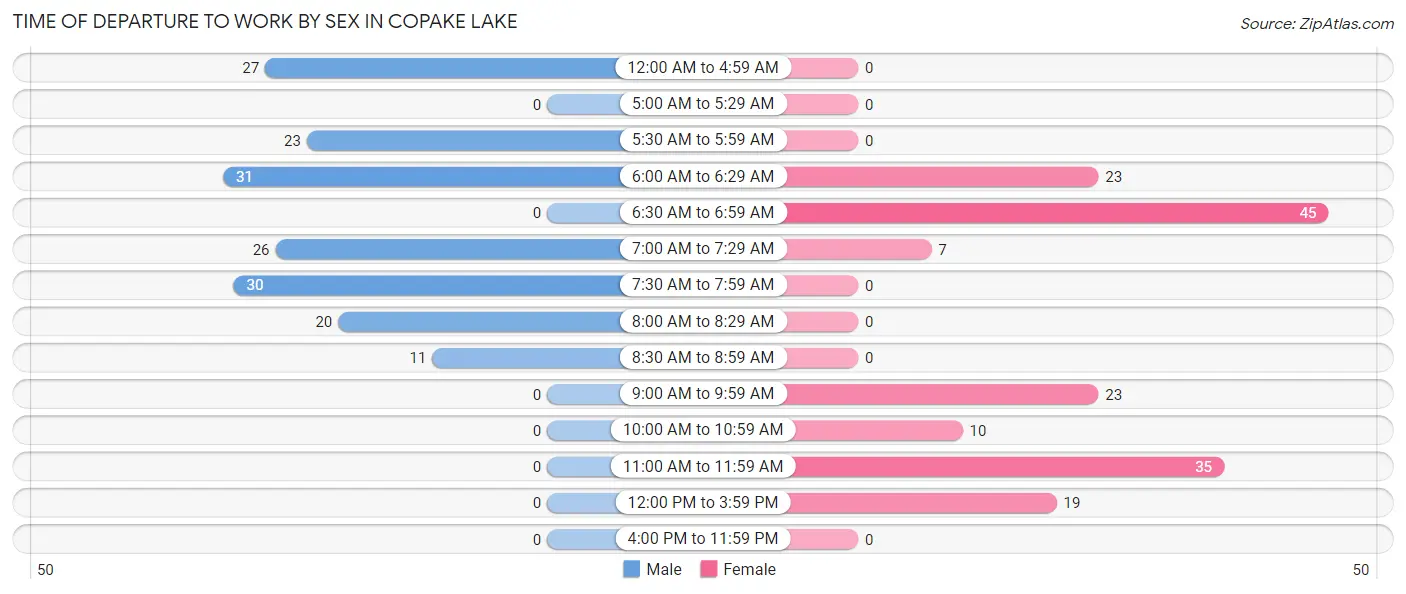
| Time of Departure | Male | Female |
| 12:00 AM to 4:59 AM | 27 (16.1%) | 0 (0.0%) |
| 5:00 AM to 5:29 AM | 0 (0.0%) | 0 (0.0%) |
| 5:30 AM to 5:59 AM | 23 (13.7%) | 0 (0.0%) |
| 6:00 AM to 6:29 AM | 31 (18.4%) | 23 (14.2%) |
| 6:30 AM to 6:59 AM | 0 (0.0%) | 45 (27.8%) |
| 7:00 AM to 7:29 AM | 26 (15.5%) | 7 (4.3%) |
| 7:30 AM to 7:59 AM | 30 (17.9%) | 0 (0.0%) |
| 8:00 AM to 8:29 AM | 20 (11.9%) | 0 (0.0%) |
| 8:30 AM to 8:59 AM | 11 (6.6%) | 0 (0.0%) |
| 9:00 AM to 9:59 AM | 0 (0.0%) | 23 (14.2%) |
| 10:00 AM to 10:59 AM | 0 (0.0%) | 10 (6.2%) |
| 11:00 AM to 11:59 AM | 0 (0.0%) | 35 (21.6%) |
| 12:00 PM to 3:59 PM | 0 (0.0%) | 19 (11.7%) |
| 4:00 PM to 11:59 PM | 0 (0.0%) | 0 (0.0%) |
| Total | 168 (100.0%) | 162 (100.0%) |
Housing Occupancy in Copake Lake
Occupancy by Ownership in Copake Lake
Of the total 368 dwellings in Copake Lake, owner-occupied units account for 331 (89.9%), while renter-occupied units make up 37 (10.1%).
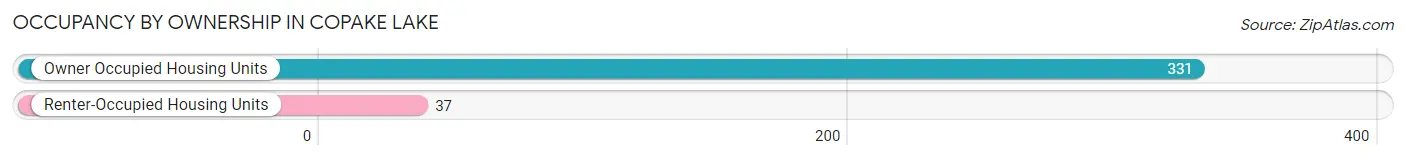
| Occupancy | # Housing Units | % Housing Units |
| Owner Occupied Housing Units | 331 | 89.9% |
| Renter-Occupied Housing Units | 37 | 10.1% |
| Total Occupied Housing Units | 368 | 100.0% |
Occupancy by Household Size in Copake Lake
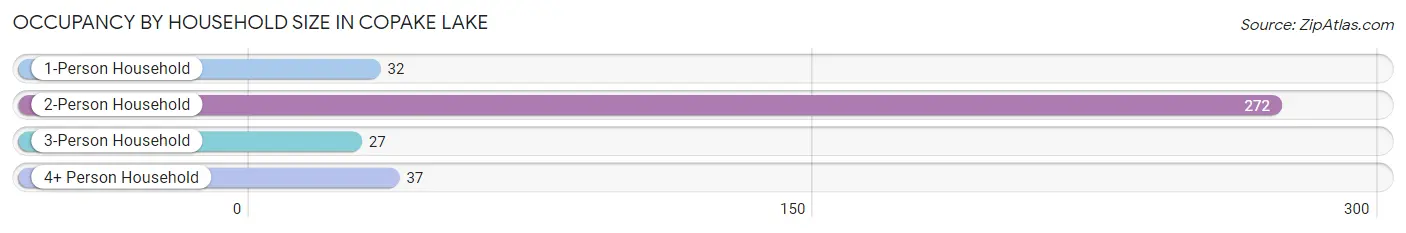
| Household Size | # Housing Units | % Housing Units |
| 1-Person Household | 32 | 8.7% |
| 2-Person Household | 272 | 73.9% |
| 3-Person Household | 27 | 7.3% |
| 4+ Person Household | 37 | 10.1% |
| Total Housing Units | 368 | 100.0% |
Occupancy by Ownership by Household Size in Copake Lake
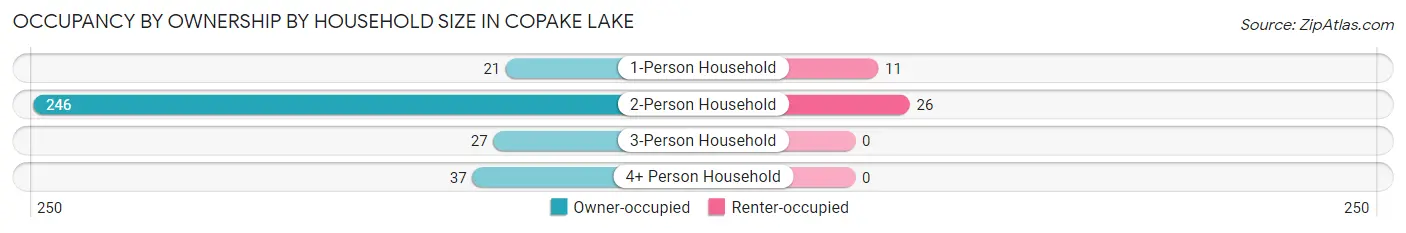
| Household Size | Owner-occupied | Renter-occupied |
| 1-Person Household | 21 (65.6%) | 11 (34.4%) |
| 2-Person Household | 246 (90.4%) | 26 (9.6%) |
| 3-Person Household | 27 (100.0%) | 0 (0.0%) |
| 4+ Person Household | 37 (100.0%) | 0 (0.0%) |
| Total Housing Units | 331 (89.9%) | 37 (10.1%) |
Occupancy by Educational Attainment in Copake Lake
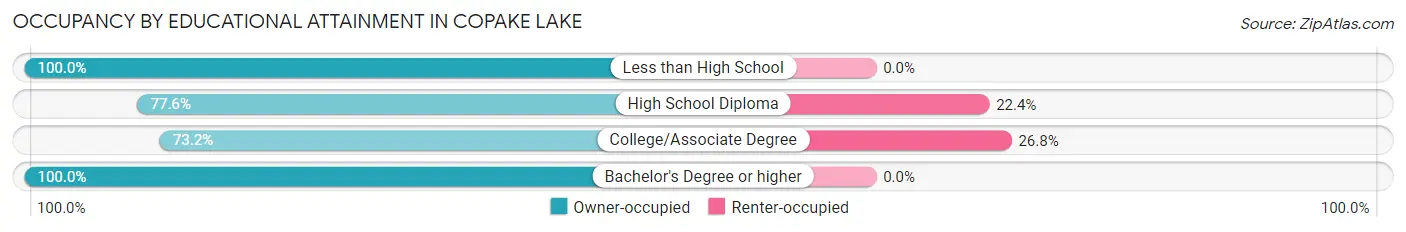
| Household Size | Owner-occupied | Renter-occupied |
| Less than High School | 16 (100.0%) | 0 (0.0%) |
| High School Diploma | 90 (77.6%) | 26 (22.4%) |
| College/Associate Degree | 30 (73.2%) | 11 (26.8%) |
| Bachelor's Degree or higher | 195 (100.0%) | 0 (0.0%) |
Occupancy by Age of Householder in Copake Lake
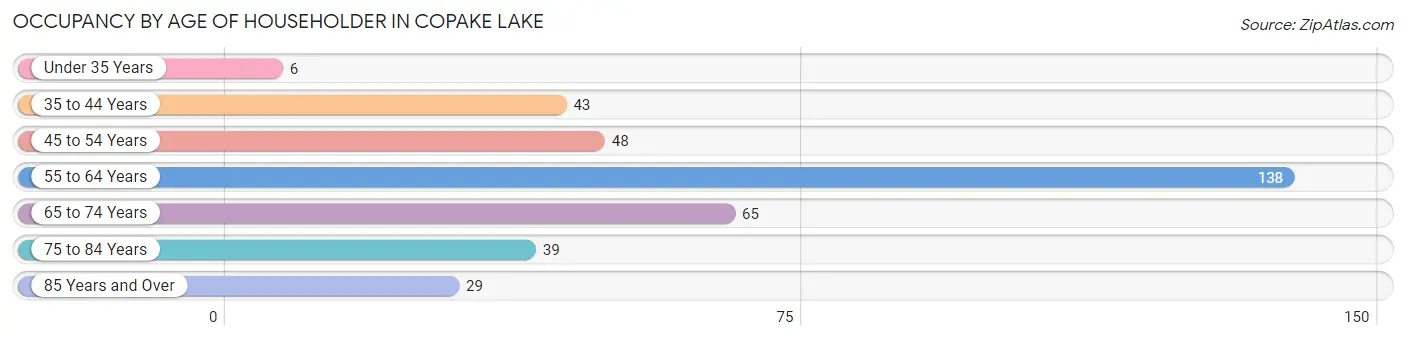
| Age Bracket | # Households | % Households |
| Under 35 Years | 6 | 1.6% |
| 35 to 44 Years | 43 | 11.7% |
| 45 to 54 Years | 48 | 13.0% |
| 55 to 64 Years | 138 | 37.5% |
| 65 to 74 Years | 65 | 17.7% |
| 75 to 84 Years | 39 | 10.6% |
| 85 Years and Over | 29 | 7.9% |
| Total | 368 | 100.0% |
Housing Finances in Copake Lake
Median Income by Occupancy in Copake Lake
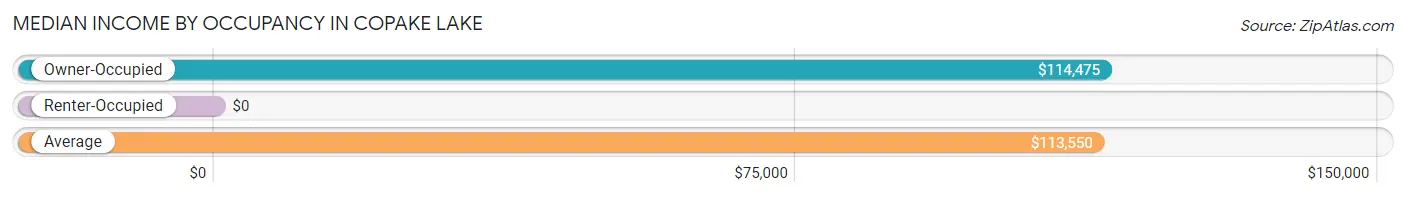
| Occupancy Type | # Households | Median Income |
| Owner-Occupied | 331 (89.9%) | $114,475 |
| Renter-Occupied | 37 (10.1%) | $0 |
| Average | 368 (100.0%) | $113,550 |
Occupancy by Householder Income Bracket in Copake Lake
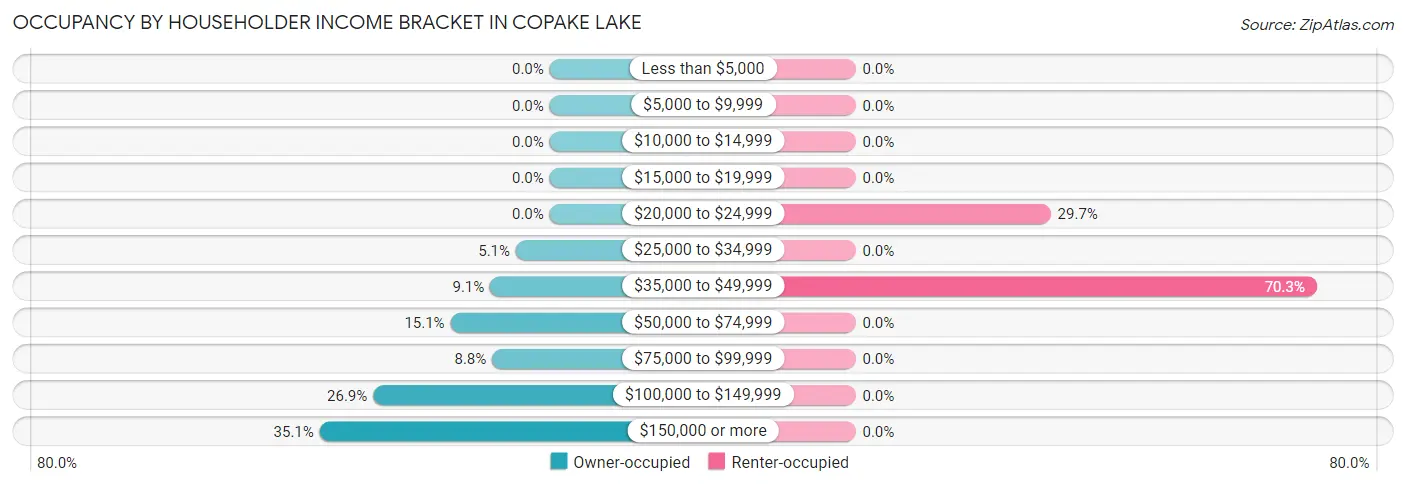
| Income Bracket | Owner-occupied | Renter-occupied |
| Less than $5,000 | 0 (0.0%) | 0 (0.0%) |
| $5,000 to $9,999 | 0 (0.0%) | 0 (0.0%) |
| $10,000 to $14,999 | 0 (0.0%) | 0 (0.0%) |
| $15,000 to $19,999 | 0 (0.0%) | 0 (0.0%) |
| $20,000 to $24,999 | 0 (0.0%) | 11 (29.7%) |
| $25,000 to $34,999 | 17 (5.1%) | 0 (0.0%) |
| $35,000 to $49,999 | 30 (9.1%) | 26 (70.3%) |
| $50,000 to $74,999 | 50 (15.1%) | 0 (0.0%) |
| $75,000 to $99,999 | 29 (8.8%) | 0 (0.0%) |
| $100,000 to $149,999 | 89 (26.9%) | 0 (0.0%) |
| $150,000 or more | 116 (35.0%) | 0 (0.0%) |
| Total | 331 (100.0%) | 37 (100.0%) |
Monthly Housing Cost Tiers in Copake Lake
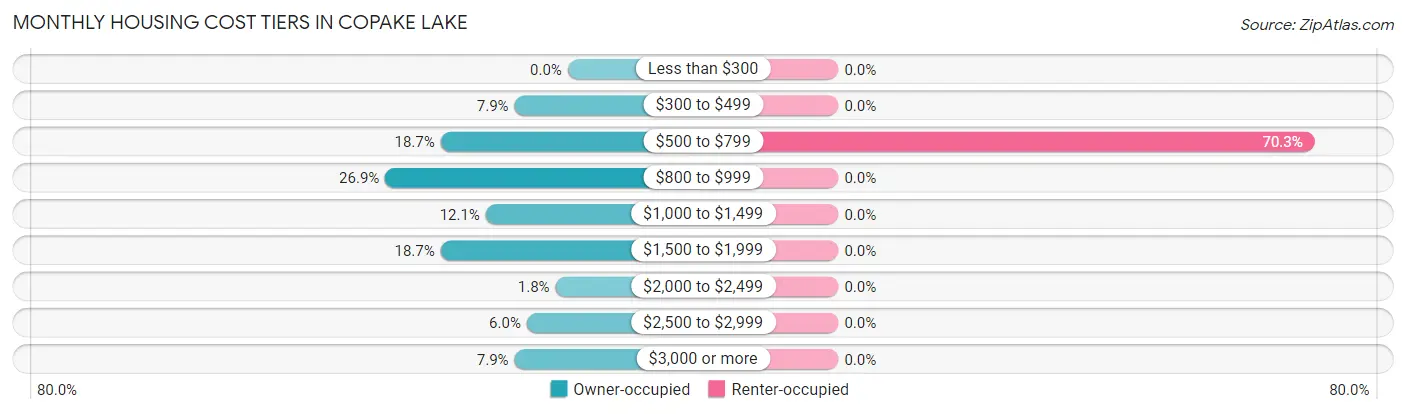
| Monthly Cost | Owner-occupied | Renter-occupied |
| Less than $300 | 0 (0.0%) | 0 (0.0%) |
| $300 to $499 | 26 (7.9%) | 0 (0.0%) |
| $500 to $799 | 62 (18.7%) | 26 (70.3%) |
| $800 to $999 | 89 (26.9%) | 0 (0.0%) |
| $1,000 to $1,499 | 40 (12.1%) | 0 (0.0%) |
| $1,500 to $1,999 | 62 (18.7%) | 0 (0.0%) |
| $2,000 to $2,499 | 6 (1.8%) | 0 (0.0%) |
| $2,500 to $2,999 | 20 (6.0%) | 0 (0.0%) |
| $3,000 or more | 26 (7.9%) | 0 (0.0%) |
| Total | 331 (100.0%) | 37 (100.0%) |
Physical Housing Characteristics in Copake Lake
Housing Structures in Copake Lake
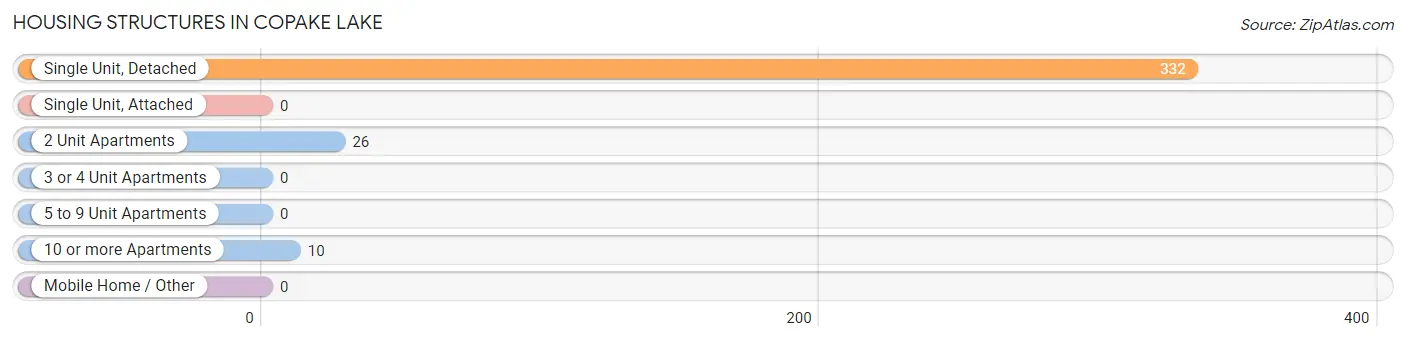
| Structure Type | # Housing Units | % Housing Units |
| Single Unit, Detached | 332 | 90.2% |
| Single Unit, Attached | 0 | 0.0% |
| 2 Unit Apartments | 26 | 7.1% |
| 3 or 4 Unit Apartments | 0 | 0.0% |
| 5 to 9 Unit Apartments | 0 | 0.0% |
| 10 or more Apartments | 10 | 2.7% |
| Mobile Home / Other | 0 | 0.0% |
| Total | 368 | 100.0% |
Housing Structures by Occupancy in Copake Lake
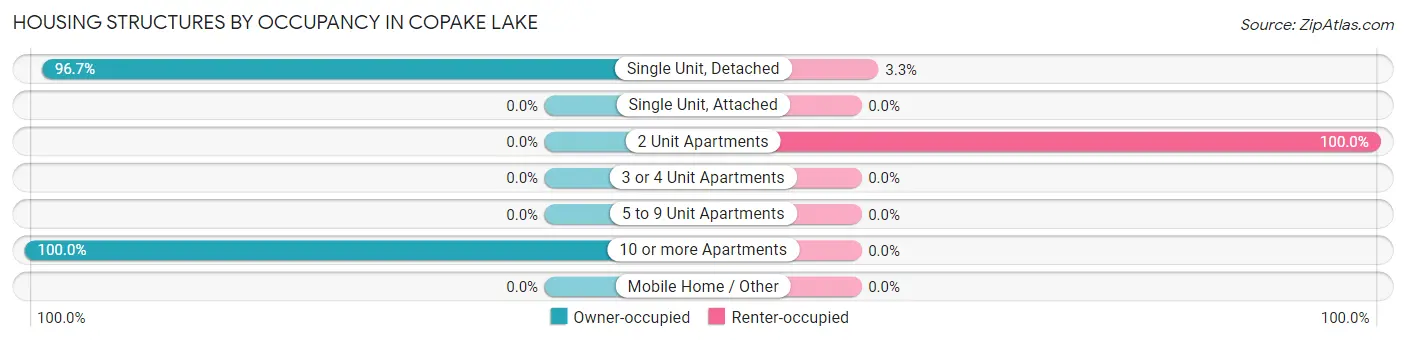
| Structure Type | Owner-occupied | Renter-occupied |
| Single Unit, Detached | 321 (96.7%) | 11 (3.3%) |
| Single Unit, Attached | 0 (0.0%) | 0 (0.0%) |
| 2 Unit Apartments | 0 (0.0%) | 26 (100.0%) |
| 3 or 4 Unit Apartments | 0 (0.0%) | 0 (0.0%) |
| 5 to 9 Unit Apartments | 0 (0.0%) | 0 (0.0%) |
| 10 or more Apartments | 10 (100.0%) | 0 (0.0%) |
| Mobile Home / Other | 0 (0.0%) | 0 (0.0%) |
| Total | 331 (89.9%) | 37 (10.1%) |
Housing Structures by Number of Rooms in Copake Lake
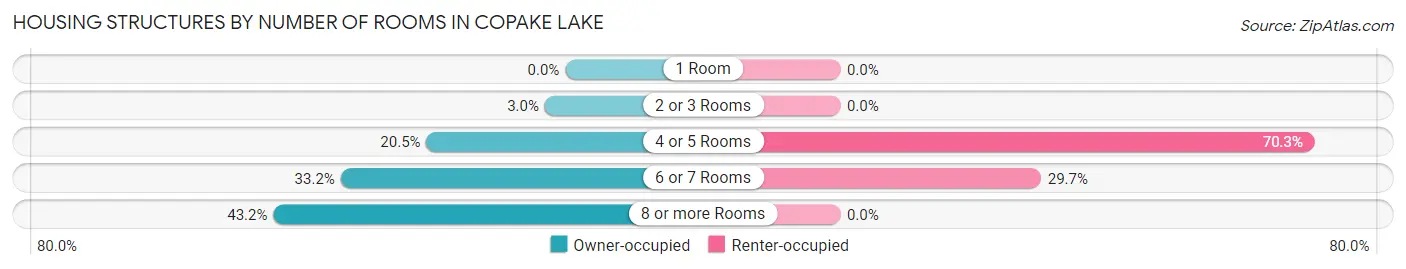
| Number of Rooms | Owner-occupied | Renter-occupied |
| 1 Room | 0 (0.0%) | 0 (0.0%) |
| 2 or 3 Rooms | 10 (3.0%) | 0 (0.0%) |
| 4 or 5 Rooms | 68 (20.5%) | 26 (70.3%) |
| 6 or 7 Rooms | 110 (33.2%) | 11 (29.7%) |
| 8 or more Rooms | 143 (43.2%) | 0 (0.0%) |
| Total | 331 (100.0%) | 37 (100.0%) |
Housing Structure by Heating Type in Copake Lake
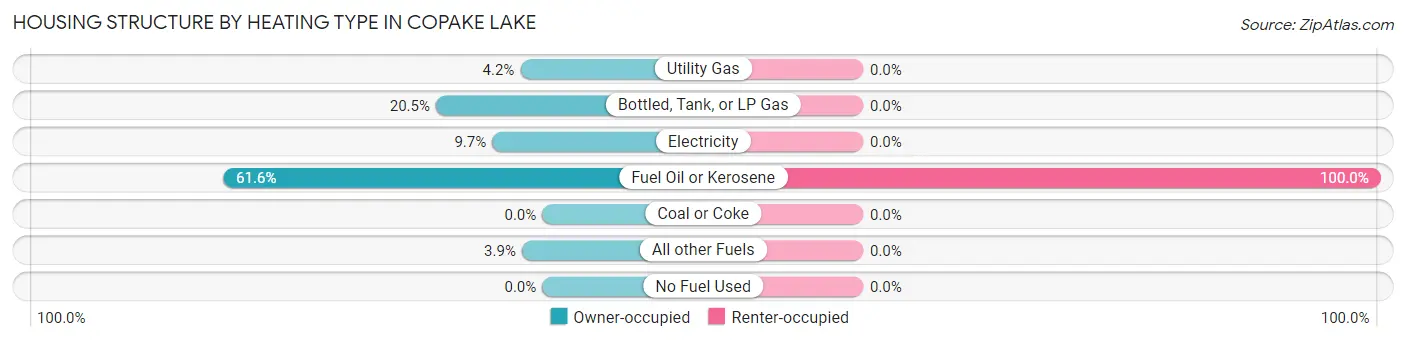
| Heating Type | Owner-occupied | Renter-occupied |
| Utility Gas | 14 (4.2%) | 0 (0.0%) |
| Bottled, Tank, or LP Gas | 68 (20.5%) | 0 (0.0%) |
| Electricity | 32 (9.7%) | 0 (0.0%) |
| Fuel Oil or Kerosene | 204 (61.6%) | 37 (100.0%) |
| Coal or Coke | 0 (0.0%) | 0 (0.0%) |
| All other Fuels | 13 (3.9%) | 0 (0.0%) |
| No Fuel Used | 0 (0.0%) | 0 (0.0%) |
| Total | 331 (100.0%) | 37 (100.0%) |
Household Vehicle Usage in Copake Lake
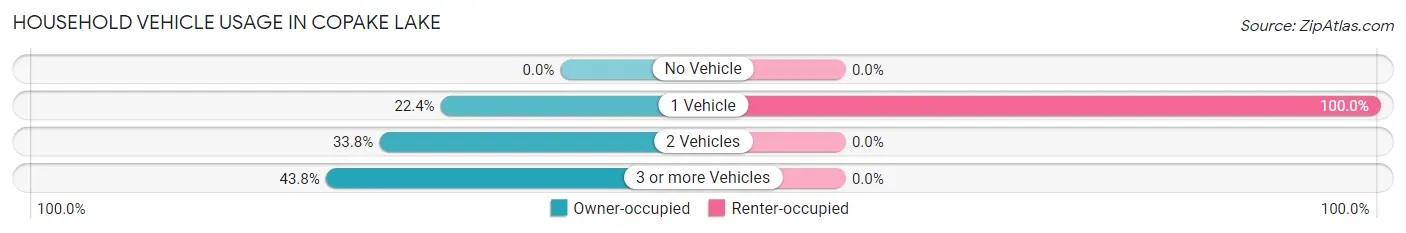
| Vehicles per Household | Owner-occupied | Renter-occupied |
| No Vehicle | 0 (0.0%) | 0 (0.0%) |
| 1 Vehicle | 74 (22.4%) | 37 (100.0%) |
| 2 Vehicles | 112 (33.8%) | 0 (0.0%) |
| 3 or more Vehicles | 145 (43.8%) | 0 (0.0%) |
| Total | 331 (100.0%) | 37 (100.0%) |
Real Estate & Mortgages in Copake Lake
Real Estate and Mortgage Overview in Copake Lake
| Characteristic | Without Mortgage | With Mortgage |
| Housing Units | 190 | 141 |
| Median Property Value | $720,900 | $196,600 |
| Median Household Income | $114,128 | $67 |
| Monthly Housing Costs | $900 | $16 |
| Real Estate Taxes | $8,464 | $19 |
Property Value by Mortgage Status in Copake Lake
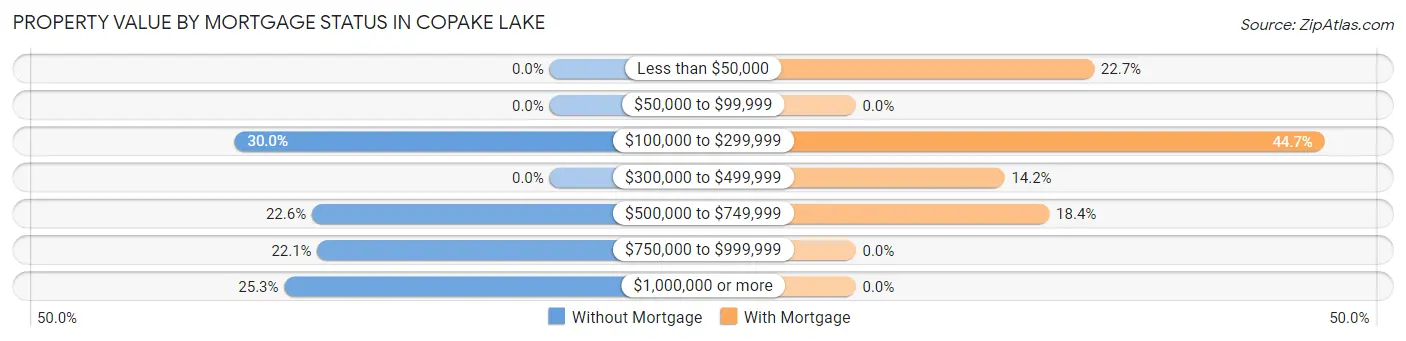
| Property Value | Without Mortgage | With Mortgage |
| Less than $50,000 | 0 (0.0%) | 32 (22.7%) |
| $50,000 to $99,999 | 0 (0.0%) | 0 (0.0%) |
| $100,000 to $299,999 | 57 (30.0%) | 63 (44.7%) |
| $300,000 to $499,999 | 0 (0.0%) | 20 (14.2%) |
| $500,000 to $749,999 | 43 (22.6%) | 26 (18.4%) |
| $750,000 to $999,999 | 42 (22.1%) | 0 (0.0%) |
| $1,000,000 or more | 48 (25.3%) | 0 (0.0%) |
| Total | 190 (100.0%) | 141 (100.0%) |
Household Income by Mortgage Status in Copake Lake
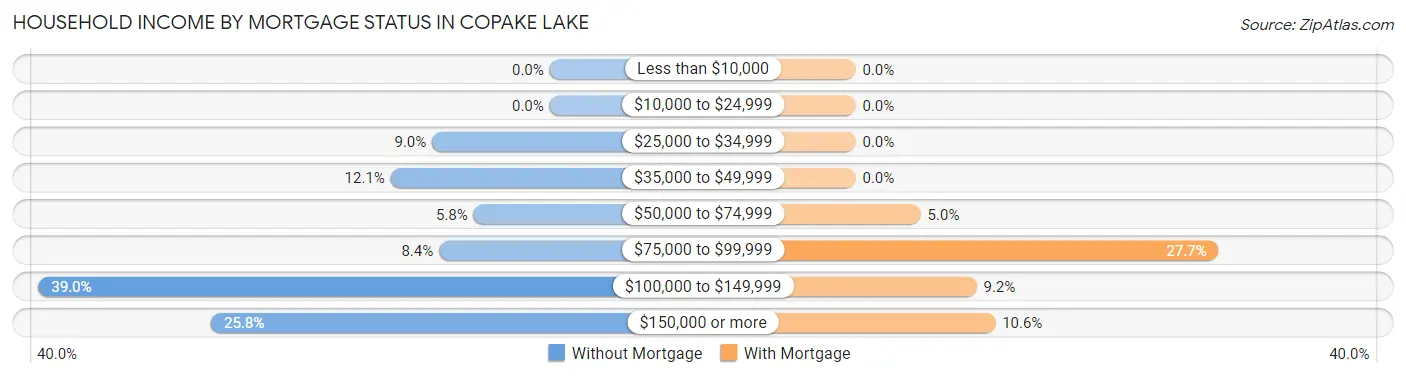
| Household Income | Without Mortgage | With Mortgage |
| Less than $10,000 | 0 (0.0%) | 0 (0.0%) |
| $10,000 to $24,999 | 0 (0.0%) | 0 (0.0%) |
| $25,000 to $34,999 | 17 (8.9%) | 0 (0.0%) |
| $35,000 to $49,999 | 23 (12.1%) | 0 (0.0%) |
| $50,000 to $74,999 | 11 (5.8%) | 7 (5.0%) |
| $75,000 to $99,999 | 16 (8.4%) | 39 (27.7%) |
| $100,000 to $149,999 | 74 (39.0%) | 13 (9.2%) |
| $150,000 or more | 49 (25.8%) | 15 (10.6%) |
| Total | 190 (100.0%) | 141 (100.0%) |
Property Value to Household Income Ratio in Copake Lake
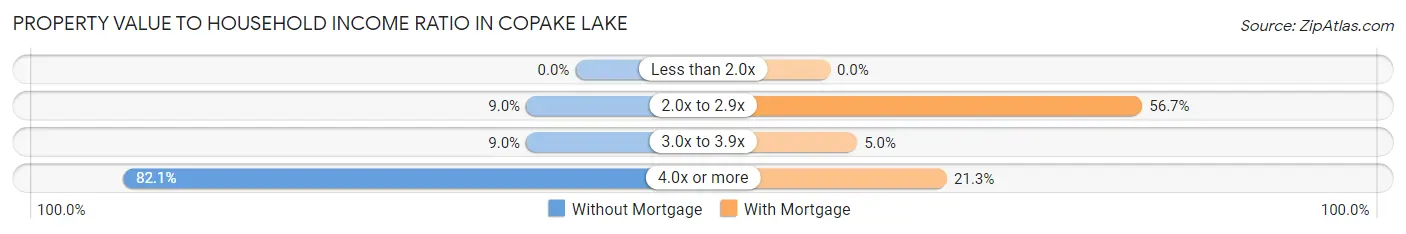
| Value-to-Income Ratio | Without Mortgage | With Mortgage |
| Less than 2.0x | 0 (0.0%) | 0 (0.0%) |
| 2.0x to 2.9x | 17 (8.9%) | 80 (56.7%) |
| 3.0x to 3.9x | 17 (8.9%) | 7 (5.0%) |
| 4.0x or more | 156 (82.1%) | 30 (21.3%) |
| Total | 190 (100.0%) | 141 (100.0%) |
Real Estate Taxes by Mortgage Status in Copake Lake
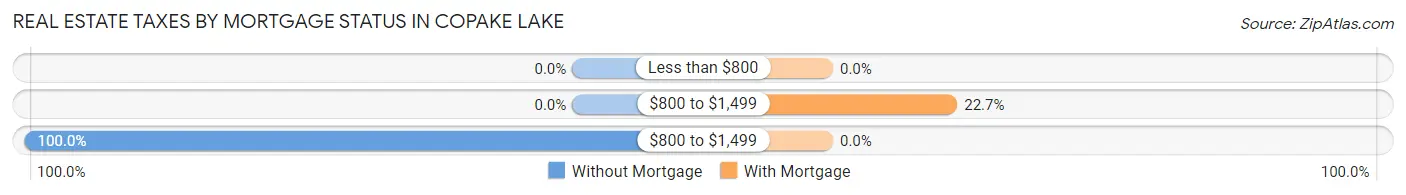
| Property Taxes | Without Mortgage | With Mortgage |
| Less than $800 | 0 (0.0%) | 0 (0.0%) |
| $800 to $1,499 | 0 (0.0%) | 32 (22.7%) |
| $800 to $1,499 | 190 (100.0%) | 0 (0.0%) |
| Total | 190 (100.0%) | 141 (100.0%) |
Health & Disability in Copake Lake
Health Insurance Coverage by Age in Copake Lake
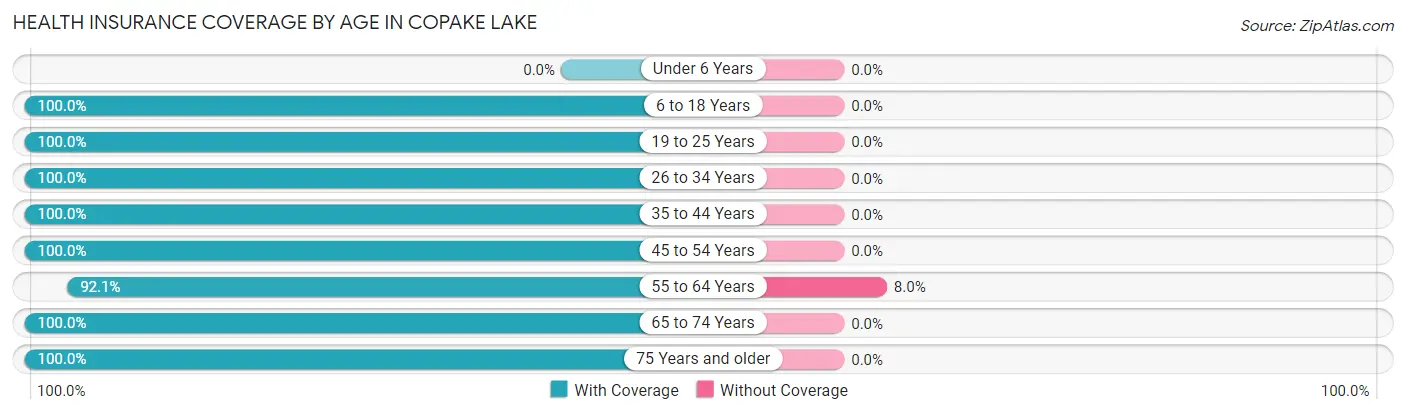
| Age Bracket | With Coverage | Without Coverage |
| Under 6 Years | 0 (0.0%) | 0 (0.0%) |
| 6 to 18 Years | 105 (100.0%) | 0 (0.0%) |
| 19 to 25 Years | 59 (100.0%) | 0 (0.0%) |
| 26 to 34 Years | 15 (100.0%) | 0 (0.0%) |
| 35 to 44 Years | 68 (100.0%) | 0 (0.0%) |
| 45 to 54 Years | 94 (100.0%) | 0 (0.0%) |
| 55 to 64 Years | 220 (92.0%) | 19 (8.0%) |
| 65 to 74 Years | 125 (100.0%) | 0 (0.0%) |
| 75 Years and older | 112 (100.0%) | 0 (0.0%) |
| Total | 798 (97.7%) | 19 (2.3%) |
Health Insurance Coverage by Citizenship Status in Copake Lake
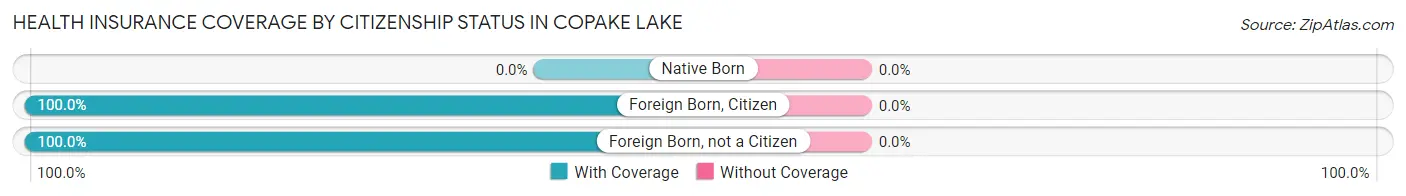
| Citizenship Status | With Coverage | Without Coverage |
| Native Born | 0 (0.0%) | 0 (0.0%) |
| Foreign Born, Citizen | 105 (100.0%) | 0 (0.0%) |
| Foreign Born, not a Citizen | 59 (100.0%) | 0 (0.0%) |
Health Insurance Coverage by Household Income in Copake Lake
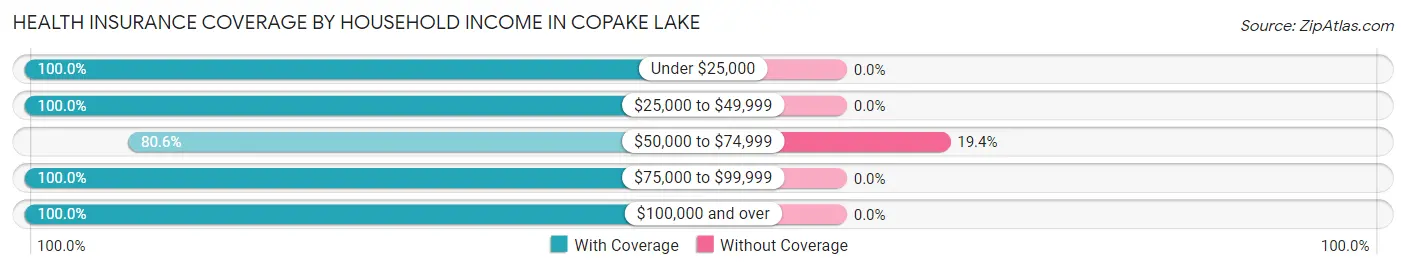
| Household Income | With Coverage | Without Coverage |
| Under $25,000 | 11 (100.0%) | 0 (0.0%) |
| $25,000 to $49,999 | 140 (100.0%) | 0 (0.0%) |
| $50,000 to $74,999 | 79 (80.6%) | 19 (19.4%) |
| $75,000 to $99,999 | 85 (100.0%) | 0 (0.0%) |
| $100,000 and over | 483 (100.0%) | 0 (0.0%) |
Public vs Private Health Insurance Coverage by Age in Copake Lake
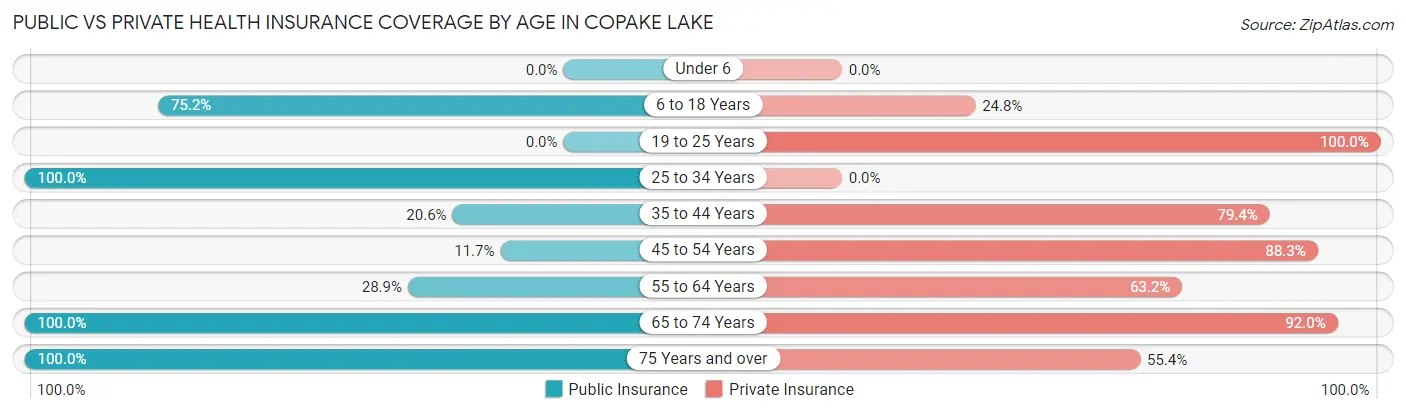
| Age Bracket | Public Insurance | Private Insurance |
| Under 6 | 0 (0.0%) | 0 (0.0%) |
| 6 to 18 Years | 79 (75.2%) | 26 (24.8%) |
| 19 to 25 Years | 0 (0.0%) | 59 (100.0%) |
| 25 to 34 Years | 15 (100.0%) | 0 (0.0%) |
| 35 to 44 Years | 14 (20.6%) | 54 (79.4%) |
| 45 to 54 Years | 11 (11.7%) | 83 (88.3%) |
| 55 to 64 Years | 69 (28.9%) | 151 (63.2%) |
| 65 to 74 Years | 125 (100.0%) | 115 (92.0%) |
| 75 Years and over | 112 (100.0%) | 62 (55.4%) |
| Total | 425 (52.0%) | 550 (67.3%) |
Disability Status by Sex by Age in Copake Lake
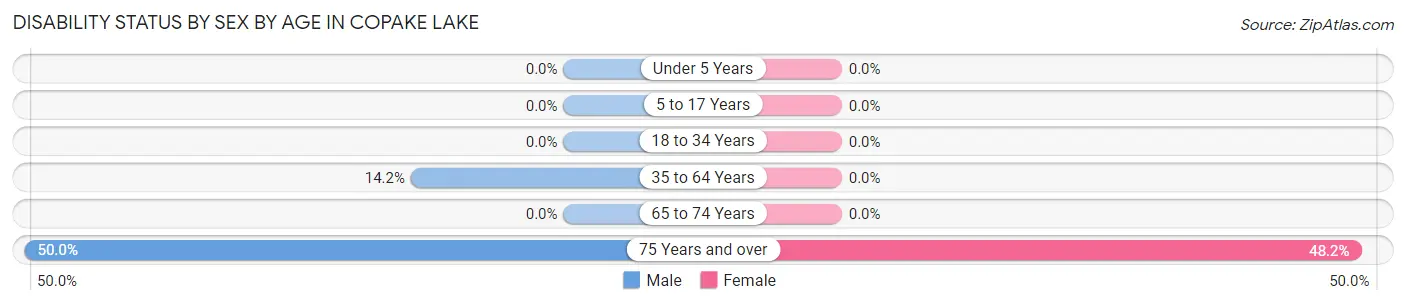
| Age Bracket | Male | Female |
| Under 5 Years | 0 (0.0%) | 0 (0.0%) |
| 5 to 17 Years | 0 (0.0%) | 0 (0.0%) |
| 18 to 34 Years | 0 (0.0%) | 0 (0.0%) |
| 35 to 64 Years | 31 (14.2%) | 0 (0.0%) |
| 65 to 74 Years | 0 (0.0%) | 0 (0.0%) |
| 75 Years and over | 28 (50.0%) | 27 (48.2%) |
Disability Class by Sex by Age in Copake Lake
Disability Class: Hearing Difficulty
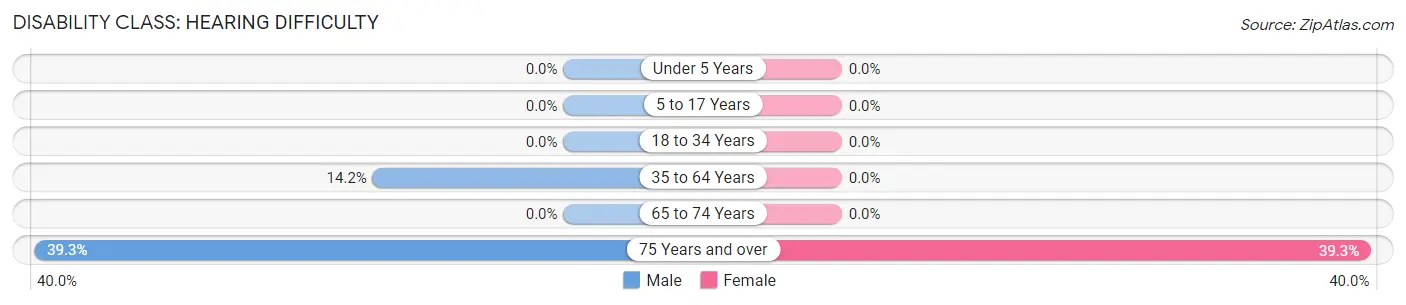
| Age Bracket | Male | Female |
| Under 5 Years | 0 (0.0%) | 0 (0.0%) |
| 5 to 17 Years | 0 (0.0%) | 0 (0.0%) |
| 18 to 34 Years | 0 (0.0%) | 0 (0.0%) |
| 35 to 64 Years | 31 (14.2%) | 0 (0.0%) |
| 65 to 74 Years | 0 (0.0%) | 0 (0.0%) |
| 75 Years and over | 22 (39.3%) | 22 (39.3%) |
Disability Class: Vision Difficulty
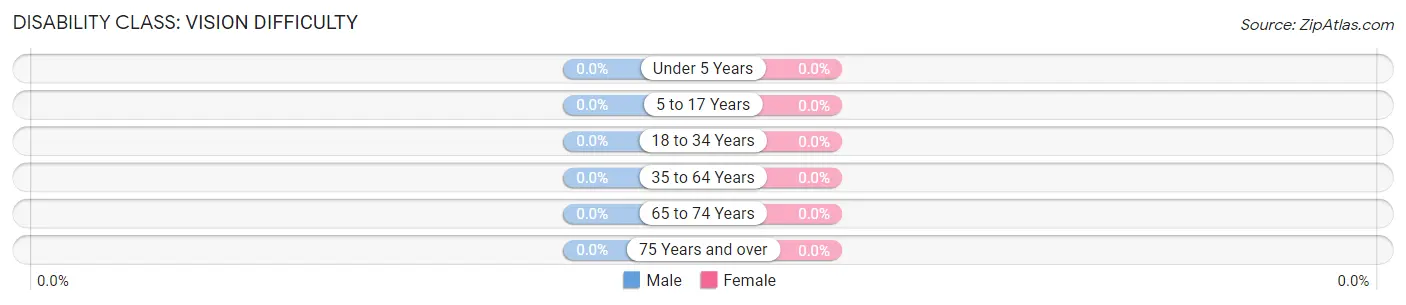
| Age Bracket | Male | Female |
| Under 5 Years | 0 (0.0%) | 0 (0.0%) |
| 5 to 17 Years | 0 (0.0%) | 0 (0.0%) |
| 18 to 34 Years | 0 (0.0%) | 0 (0.0%) |
| 35 to 64 Years | 0 (0.0%) | 0 (0.0%) |
| 65 to 74 Years | 0 (0.0%) | 0 (0.0%) |
| 75 Years and over | 0 (0.0%) | 0 (0.0%) |
Disability Class: Cognitive Difficulty
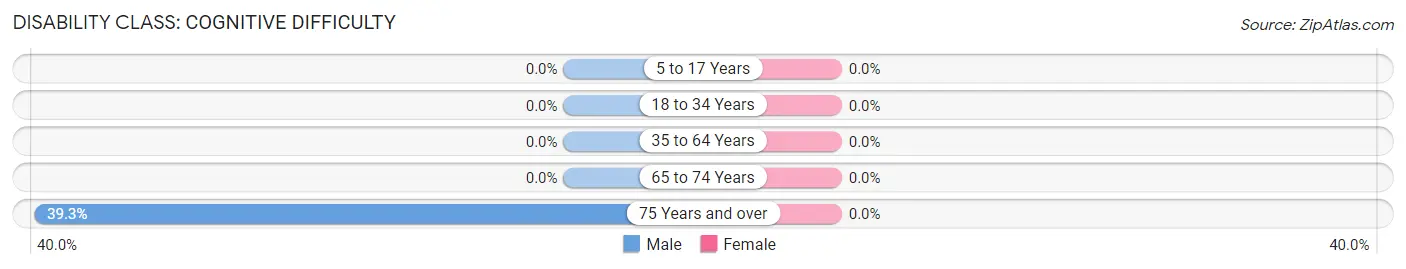
| Age Bracket | Male | Female |
| 5 to 17 Years | 0 (0.0%) | 0 (0.0%) |
| 18 to 34 Years | 0 (0.0%) | 0 (0.0%) |
| 35 to 64 Years | 0 (0.0%) | 0 (0.0%) |
| 65 to 74 Years | 0 (0.0%) | 0 (0.0%) |
| 75 Years and over | 22 (39.3%) | 0 (0.0%) |
Disability Class: Ambulatory Difficulty
| Age Bracket | Male | Female |
| 5 to 17 Years | 0 (0.0%) | 0 (0.0%) |
| 18 to 34 Years | 0 (0.0%) | 0 (0.0%) |
| 35 to 64 Years | 20 (9.1%) | 0 (0.0%) |
| 65 to 74 Years | 0 (0.0%) | 0 (0.0%) |
| 75 Years and over | 28 (50.0%) | 0 (0.0%) |
Disability Class: Self-Care Difficulty

| Age Bracket | Male | Female |
| 5 to 17 Years | 0 (0.0%) | 0 (0.0%) |
| 18 to 34 Years | 0 (0.0%) | 0 (0.0%) |
| 35 to 64 Years | 0 (0.0%) | 0 (0.0%) |
| 65 to 74 Years | 0 (0.0%) | 0 (0.0%) |
| 75 Years and over | 22 (39.3%) | 0 (0.0%) |
Technology Access in Copake Lake
Computing Device Access in Copake Lake
| Device Type | # Households | % Households |
| Desktop or Laptop | 302 | 82.1% |
| Smartphone | 323 | 87.8% |
| Tablet | 285 | 77.4% |
| No Computing Device | 17 | 4.6% |
| Total | 368 | 100.0% |
Internet Access in Copake Lake
| Internet Type | # Households | % Households |
| Dial-Up Internet | 0 | 0.0% |
| Broadband Home | 249 | 67.7% |
| Cellular Data Only | 42 | 11.4% |
| Satellite Internet | 12 | 3.3% |
| No Internet | 69 | 18.8% |
| Total | 368 | 100.0% |
Copake Lake Summary
Copake Lake is a small lake located in Columbia County, New York, United States. It is located in the town of Copake, and is the largest lake in the county. The lake is approximately 1.5 miles long and 0.5 miles wide, and has a maximum depth of approximately 30 feet.
Geography
Copake Lake is located in the town of Copake, in Columbia County, New York. It is located in the Taconic Mountains, and is surrounded by hills and mountains. The lake is approximately 1.5 miles long and 0.5 miles wide, and has a maximum depth of approximately 30 feet. The lake is fed by several small streams, including the Copake Creek, which flows into the lake from the north. The lake is drained by the Copake Outlet, which flows south into the Roeliff Jansen Kill.
The lake is surrounded by several small towns and villages, including Copake, Copake Falls, and Taconic. The lake is also close to the Massachusetts border, and is within easy driving distance of several major cities, including Albany, New York City, and Boston.
History
Copake Lake has been a popular recreational destination since the late 19th century. The lake was originally used for fishing and swimming, and was a popular spot for summer vacationers. In the early 20th century, the lake was developed as a resort area, with several hotels and resorts being built around the lake.
In the 1950s, the lake was developed as a residential area, with several homes being built around the lake. The lake is now a popular destination for fishing, swimming, boating, and other recreational activities.
Economy
The economy of Copake Lake is largely based on tourism and recreation. The lake is a popular destination for fishing, swimming, boating, and other recreational activities. The lake is also home to several resorts and hotels, which cater to tourists and vacationers.
The lake is also home to several businesses, including restaurants, marinas, and boat rental companies. The lake is also home to several small businesses, including bait and tackle shops, convenience stores, and gift shops.
Demographics
The population of Copake Lake is approximately 1,000 people. The population is largely white, with a small percentage of African Americans, Hispanics, and other ethnicities. The median household income is approximately $50,000, and the median home value is approximately $200,000.
The lake is home to several churches, including the Copake United Methodist Church, the Copake Presbyterian Church, and the Copake Baptist Church. The lake is also home to several schools, including the Copake Central School District, the Taconic Hills Central School District, and the Copake-Taconic Hills Elementary School.
Conclusion
Copake Lake is a small lake located in Columbia County, New York. The lake is a popular destination for fishing, swimming, boating, and other recreational activities. The lake is also home to several resorts and hotels, as well as several small businesses. The population of Copake Lake is approximately 1,000 people, and the median household income is approximately $50,000. The lake is home to several churches and schools, and is a popular destination for tourists and vacationers.
Common Questions
What is the Total Population of Copake Lake?
Total Population of Copake Lake is 817.
What is the Total Male Population of Copake Lake?
Total Male Population of Copake Lake is 435.
What is the Total Female Population of Copake Lake?
Total Female Population of Copake Lake is 382.
What is the Ratio of Males per 100 Females in Copake Lake?
There are 113.87 Males per 100 Females in Copake Lake.
What is the Ratio of Females per 100 Males in Copake Lake?
There are 87.82 Females per 100 Males in Copake Lake.
What is the Median Population Age in Copake Lake?
Median Population Age in Copake Lake is 59.9 Years.
What is the Average Family Size in Copake Lake
Average Family Size in Copake Lake is 2.2 People.
What is the Average Household Size in Copake Lake
Average Household Size in Copake Lake is 2.2 People.
What is Per Capita Income in Copake Lake?
Per Capita income in Copake Lake is $68,946.
What is the Median Family Income in Copake Lake?
Median Family Income in Copake Lake is $113,517.
What is the Median Household income in Copake Lake?
Median Household Income in Copake Lake is $113,550.
What is Inequality or Gini Index in Copake Lake?
Inequality or Gini Index in Copake Lake is 0.45.
How Large is the Labor Force in Copake Lake?
There are 398 People in the Labor Forcein in Copake Lake.
What is the Percentage of People in the Labor Force in Copake Lake?
55.9% of People are in the Labor Force in Copake Lake.
What is the Unemployment Rate in Copake Lake?
Unemployment Rate in Copake Lake is 2.3%.