Bronx County, NY
Bronx County Overview
1,443,229
TOTAL POPULATION
683,349
MALE POPULATION
759,880
FEMALE POPULATION
89.93
MALES / 100 FEMALES
111.20
FEMALES / 100 MALES
35.0
MEDIAN AGE
3.4
AVG FAMILY SIZE
2.6
AVG HOUSEHOLD SIZE
$25,845
PER CAPITA INCOME
$56,539
AVG FAMILY INCOME
$47,036
AVG HOUSEHOLD INCOME
16.2%
WAGE / INCOME GAP [ % ]
83.8¢/ $1
WAGE / INCOME GAP [ $ ]
$11,945
FAMILY INCOME DEFICIT
0.51
INEQUALITY / GINI INDEX
658,056
LABOR FORCE [ PEOPLE ]
58.4%
PERCENT IN LABOR FORCE
11.2%
UNEMPLOYMENT RATE
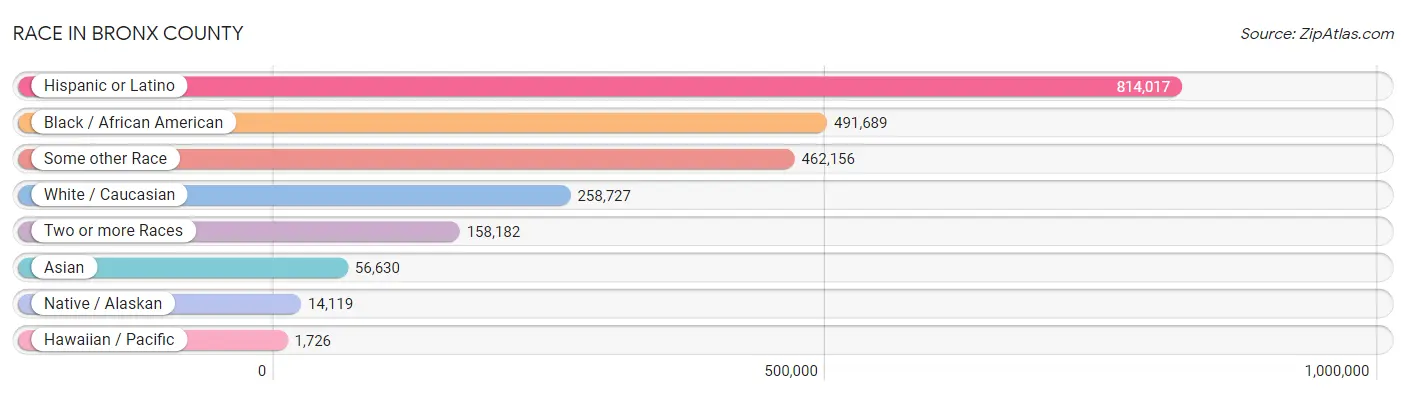
Race in Bronx County
The most populous races in Bronx County are Hispanic or Latino (814,017 | 56.4%), Black / African American (491,689 | 34.1%), and Some other Race (462,156 | 32.0%).
| Race | # Population | % Population |
| Asian | 56,630 | 3.9% |
| Black / African American | 491,689 | 34.1% |
| Hawaiian / Pacific | 1,726 | 0.1% |
| Hispanic or Latino | 814,017 | 56.4% |
| Native / Alaskan | 14,119 | 1.0% |
| White / Caucasian | 258,727 | 17.9% |
| Two or more Races | 158,182 | 11.0% |
| Some other Race | 462,156 | 32.0% |
| Total | 1,443,229 | 100.0% |
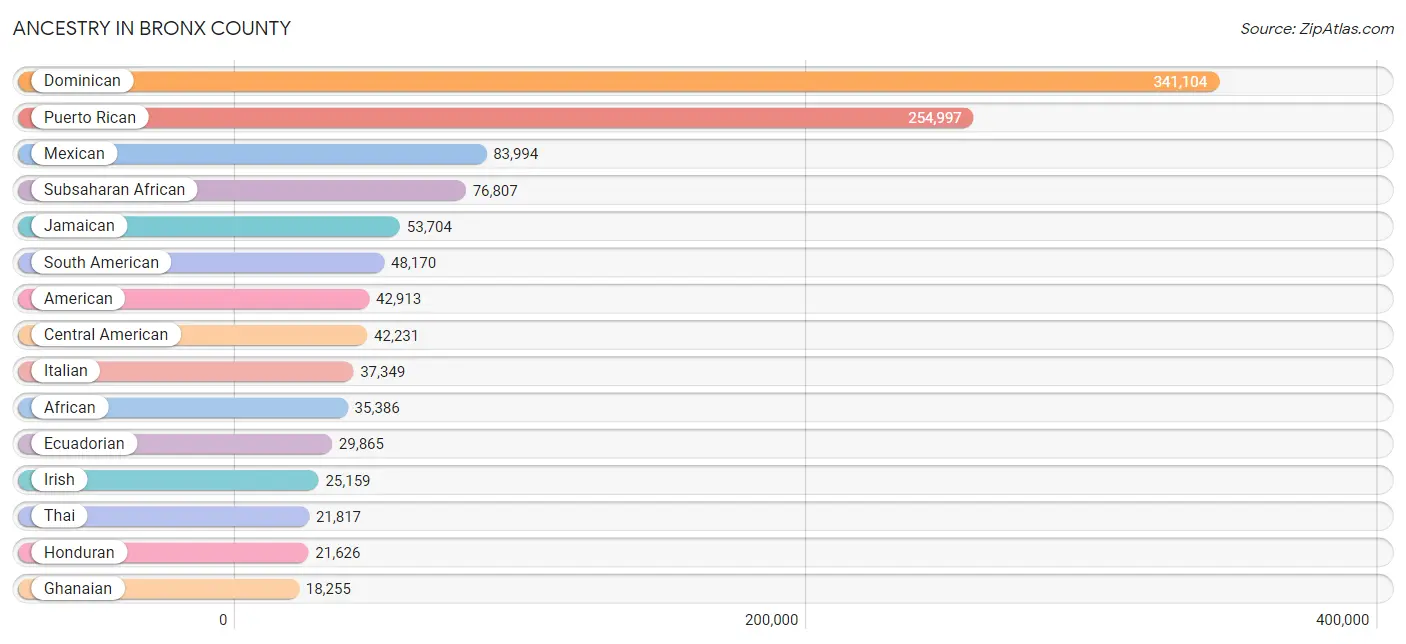
Ancestry in Bronx County
The most populous ancestries reported in Bronx County are Dominican (341,104 | 23.6%), Puerto Rican (254,997 | 17.7%), Mexican (83,994 | 5.8%), Subsaharan African (76,807 | 5.3%), and Jamaican (53,704 | 3.7%), together accounting for 56.2% of all Bronx County residents.
| Ancestry | # Population | % Population |
| Afghan | 28 | 0.0% |
| African | 35,386 | 2.5% |
| Alaska Native | 137 | 0.0% |
| Albanian | 9,845 | 0.7% |
| American | 42,913 | 3.0% |
| Apache | 33 | 0.0% |
| Arab | 8,781 | 0.6% |
| Argentinean | 1,078 | 0.1% |
| Armenian | 179 | 0.0% |
| Australian | 129 | 0.0% |
| Austrian | 1,060 | 0.1% |
| Bahamian | 125 | 0.0% |
| Bangladeshi | 27 | 0.0% |
| Barbadian | 2,553 | 0.2% |
| Basque | 25 | 0.0% |
| Belgian | 207 | 0.0% |
| Belizean | 1,735 | 0.1% |
| Bermudan | 196 | 0.0% |
| Bhutanese | 1,219 | 0.1% |
| Blackfeet | 772 | 0.1% |
| Bolivian | 298 | 0.0% |
| Brazilian | 586 | 0.0% |
| British | 1,285 | 0.1% |
| British West Indian | 8,582 | 0.6% |
| Bulgarian | 405 | 0.0% |
| Burmese | 2,319 | 0.2% |
| Cambodian | 54 | 0.0% |
| Canadian | 374 | 0.0% |
| Cape Verdean | 103 | 0.0% |
| Carpatho Rusyn | 7 | 0.0% |
| Celtic | 37 | 0.0% |
| Central American | 42,231 | 2.9% |
| Central American Indian | 9,453 | 0.6% |
| Cherokee | 1,723 | 0.1% |
| Chickasaw | 33 | 0.0% |
| Chilean | 972 | 0.1% |
| Chippewa | 17 | 0.0% |
| Choctaw | 44 | 0.0% |
| Colombian | 7,725 | 0.5% |
| Costa Rican | 973 | 0.1% |
| Cree | 1 | 0.0% |
| Creek | 30 | 0.0% |
| Croatian | 289 | 0.0% |
| Cuban | 9,418 | 0.6% |
| Cypriot | 9 | 0.0% |
| Czech | 639 | 0.0% |
| Czechoslovakian | 129 | 0.0% |
| Danish | 297 | 0.0% |
| Delaware | 25 | 0.0% |
| Dominican | 341,104 | 23.6% |
| Dutch | 807 | 0.1% |
| Dutch West Indian | 95 | 0.0% |
| Eastern European | 1,702 | 0.1% |
| Ecuadorian | 29,865 | 2.1% |
| Egyptian | 996 | 0.1% |
| English | 5,302 | 0.4% |
| Estonian | 35 | 0.0% |
| Ethiopian | 1,372 | 0.1% |
| European | 2,812 | 0.2% |
| Filipino | 243 | 0.0% |
| Finnish | 99 | 0.0% |
| French | 3,621 | 0.3% |
| French American Indian | 39 | 0.0% |
| French Canadian | 548 | 0.0% |
| German | 12,696 | 0.9% |
| Ghanaian | 18,255 | 1.3% |
| Greek | 3,494 | 0.2% |
| Guamanian / Chamorro | 112 | 0.0% |
| Guatemalan | 7,227 | 0.5% |
| Guyanese | 11,994 | 0.8% |
| Haitian | 5,571 | 0.4% |
| Honduran | 21,626 | 1.5% |
| Hungarian | 1,685 | 0.1% |
| Indian (Asian) | 8,084 | 0.6% |
| Indonesian | 23 | 0.0% |
| Inupiat | 50 | 0.0% |
| Iranian | 182 | 0.0% |
| Iraqi | 183 | 0.0% |
| Irish | 25,159 | 1.7% |
| Iroquois | 537 | 0.0% |
| Israeli | 331 | 0.0% |
| Italian | 37,349 | 2.6% |
| Jamaican | 53,704 | 3.7% |
| Japanese | 1,028 | 0.1% |
| Jordanian | 272 | 0.0% |
| Kenyan | 11 | 0.0% |
| Kiowa | 21 | 0.0% |
| Korean | 8,768 | 0.6% |
| Laotian | 115 | 0.0% |
| Latvian | 170 | 0.0% |
| Lebanese | 622 | 0.0% |
| Liberian | 820 | 0.1% |
| Lithuanian | 373 | 0.0% |
| Lumbee | 11 | 0.0% |
| Luxembourger | 17 | 0.0% |
| Macedonian | 432 | 0.0% |
| Malaysian | 372 | 0.0% |
| Maltese | 16 | 0.0% |
| Mexican | 83,994 | 5.8% |
| Mexican American Indian | 4,216 | 0.3% |
| Mongolian | 113 | 0.0% |
| Moroccan | 1,389 | 0.1% |
| Native Hawaiian | 839 | 0.1% |
| Navajo | 117 | 0.0% |
| New Zealander | 11 | 0.0% |
| Nicaraguan | 3,386 | 0.2% |
| Nigerian | 8,481 | 0.6% |
| Northern European | 38 | 0.0% |
| Norwegian | 611 | 0.0% |
| Pakistani | 432 | 0.0% |
| Palestinian | 197 | 0.0% |
| Panamanian | 2,278 | 0.2% |
| Paraguayan | 154 | 0.0% |
| Pennsylvania German | 24 | 0.0% |
| Peruvian | 5,538 | 0.4% |
| Polish | 4,572 | 0.3% |
| Portuguese | 856 | 0.1% |
| Pueblo | 18 | 0.0% |
| Puerto Rican | 254,997 | 17.7% |
| Romanian | 501 | 0.0% |
| Russian | 5,484 | 0.4% |
| Salvadoran | 6,501 | 0.4% |
| Samoan | 455 | 0.0% |
| Scandinavian | 105 | 0.0% |
| Scotch-Irish | 285 | 0.0% |
| Scottish | 1,248 | 0.1% |
| Seminole | 15 | 0.0% |
| Senegalese | 1,987 | 0.1% |
| Serbian | 101 | 0.0% |
| Shoshone | 82 | 0.0% |
| Sierra Leonean | 479 | 0.0% |
| Sioux | 204 | 0.0% |
| Slavic | 110 | 0.0% |
| Slovak | 241 | 0.0% |
| Slovene | 144 | 0.0% |
| Somali | 26 | 0.0% |
| South African | 87 | 0.0% |
| South American | 48,170 | 3.3% |
| South American Indian | 669 | 0.1% |
| Spaniard | 3,825 | 0.3% |
| Spanish | 2,085 | 0.1% |
| Spanish American | 255 | 0.0% |
| Spanish American Indian | 239 | 0.0% |
| Sri Lankan | 3,624 | 0.3% |
| Subsaharan African | 76,807 | 5.3% |
| Sudanese | 56 | 0.0% |
| Swedish | 803 | 0.1% |
| Swiss | 219 | 0.0% |
| Syrian | 269 | 0.0% |
| Thai | 21,817 | 1.5% |
| Tongan | 47 | 0.0% |
| Trinidadian and Tobagonian | 5,332 | 0.4% |
| Turkish | 461 | 0.0% |
| U.S. Virgin Islander | 1,599 | 0.1% |
| Ugandan | 76 | 0.0% |
| Ukrainian | 1,524 | 0.1% |
| Uruguayan | 86 | 0.0% |
| Venezuelan | 2,157 | 0.2% |
| Vietnamese | 12,443 | 0.9% |
| Welsh | 319 | 0.0% |
| West Indian | 12,678 | 0.9% |
| Yugoslavian | 270 | 0.0% |
| Zimbabwean | 18 | 0.0% | View All 163 Rows |
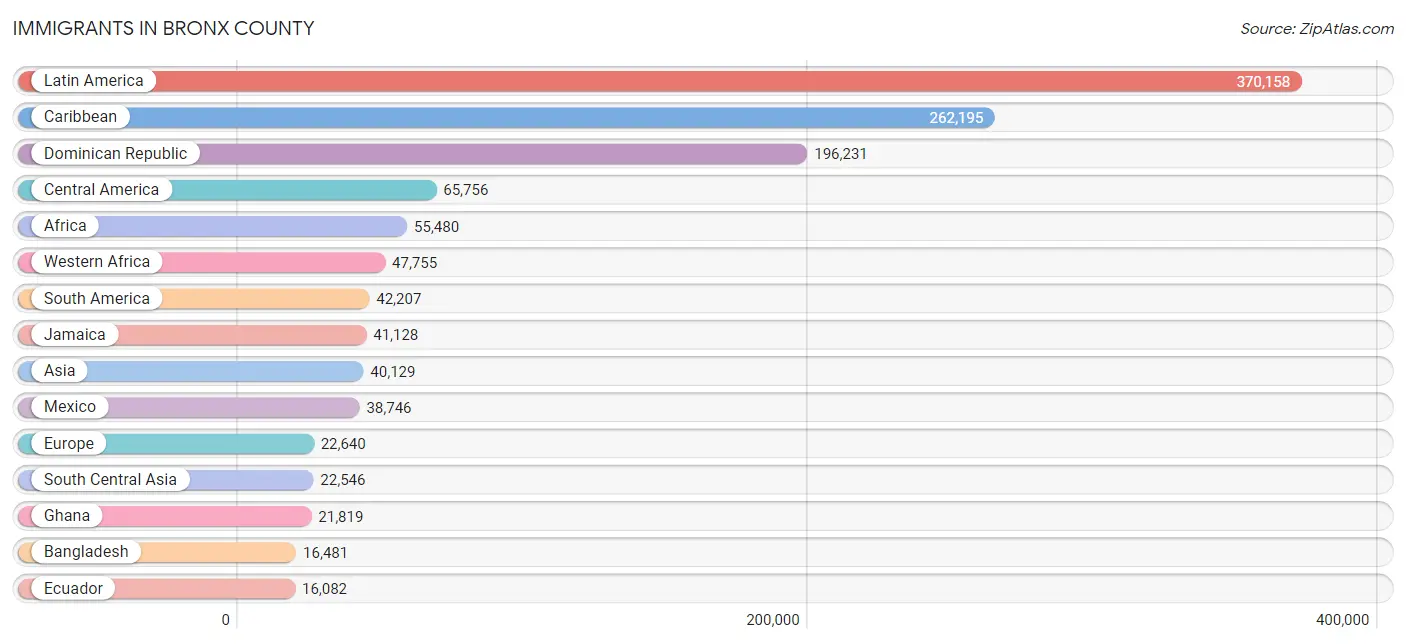
Immigrants in Bronx County
The most numerous immigrant groups reported in Bronx County came from Latin America (370,158 | 25.7%), Caribbean (262,195 | 18.2%), Dominican Republic (196,231 | 13.6%), Central America (65,756 | 4.6%), and Africa (55,480 | 3.8%), together accounting for 65.8% of all Bronx County residents.
| Immigration Origin | # Population | % Population |
| Afghanistan | 9 | 0.0% |
| Africa | 55,480 | 3.8% |
| Albania | 4,498 | 0.3% |
| Argentina | 912 | 0.1% |
| Asia | 40,129 | 2.8% |
| Australia | 168 | 0.0% |
| Austria | 51 | 0.0% |
| Bahamas | 69 | 0.0% |
| Bangladesh | 16,481 | 1.1% |
| Barbados | 1,709 | 0.1% |
| Belarus | 159 | 0.0% |
| Belgium | 262 | 0.0% |
| Belize | 1,491 | 0.1% |
| Bolivia | 228 | 0.0% |
| Bosnia and Herzegovina | 77 | 0.0% |
| Brazil | 542 | 0.0% |
| Bulgaria | 365 | 0.0% |
| Cambodia | 491 | 0.0% |
| Cameroon | 396 | 0.0% |
| Canada | 1,088 | 0.1% |
| Caribbean | 262,195 | 18.2% |
| Central America | 65,756 | 4.6% |
| Chile | 635 | 0.0% |
| China | 4,066 | 0.3% |
| Colombia | 4,851 | 0.3% |
| Congo | 213 | 0.0% |
| Costa Rica | 437 | 0.0% |
| Croatia | 58 | 0.0% |
| Cuba | 2,667 | 0.2% |
| Czechoslovakia | 106 | 0.0% |
| Dominica | 2,746 | 0.2% |
| Dominican Republic | 196,231 | 13.6% |
| Eastern Africa | 1,976 | 0.1% |
| Eastern Asia | 5,543 | 0.4% |
| Eastern Europe | 11,918 | 0.8% |
| Ecuador | 16,082 | 1.1% |
| Egypt | 437 | 0.0% |
| El Salvador | 3,705 | 0.3% |
| England | 1,122 | 0.1% |
| Eritrea | 111 | 0.0% |
| Ethiopia | 1,068 | 0.1% |
| Europe | 22,640 | 1.6% |
| France | 553 | 0.0% |
| Germany | 556 | 0.0% |
| Ghana | 21,819 | 1.5% |
| Greece | 1,111 | 0.1% |
| Grenada | 1,132 | 0.1% |
| Guatemala | 4,660 | 0.3% |
| Guyana | 12,927 | 0.9% |
| Haiti | 2,631 | 0.2% |
| Honduras | 13,514 | 0.9% |
| Hong Kong | 314 | 0.0% |
| Hungary | 173 | 0.0% |
| India | 2,587 | 0.2% |
| Indonesia | 70 | 0.0% |
| Iran | 582 | 0.0% |
| Iraq | 151 | 0.0% |
| Ireland | 1,917 | 0.1% |
| Israel | 212 | 0.0% |
| Italy | 3,381 | 0.2% |
| Jamaica | 41,128 | 2.9% |
| Japan | 285 | 0.0% |
| Jordan | 248 | 0.0% |
| Kazakhstan | 33 | 0.0% |
| Kenya | 93 | 0.0% |
| Korea | 1,177 | 0.1% |
| Kuwait | 28 | 0.0% |
| Laos | 252 | 0.0% |
| Latin America | 370,158 | 25.7% |
| Latvia | 76 | 0.0% |
| Lebanon | 74 | 0.0% |
| Liberia | 562 | 0.0% |
| Lithuania | 58 | 0.0% |
| Malaysia | 102 | 0.0% |
| Mexico | 38,746 | 2.7% |
| Middle Africa | 934 | 0.1% |
| Moldova | 11 | 0.0% |
| Morocco | 747 | 0.1% |
| Nepal | 59 | 0.0% |
| Netherlands | 124 | 0.0% |
| Nicaragua | 2,045 | 0.1% |
| Nigeria | 7,090 | 0.5% |
| North Macedonia | 89 | 0.0% |
| Northern Africa | 1,450 | 0.1% |
| Northern Europe | 3,681 | 0.3% |
| Oceania | 168 | 0.0% |
| Pakistan | 2,316 | 0.2% |
| Panama | 1,158 | 0.1% |
| Peru | 3,910 | 0.3% |
| Philippines | 4,634 | 0.3% |
| Poland | 432 | 0.0% |
| Portugal | 143 | 0.0% |
| Romania | 364 | 0.0% |
| Russia | 1,564 | 0.1% |
| Saudi Arabia | 184 | 0.0% |
| Scotland | 61 | 0.0% |
| Senegal | 2,690 | 0.2% |
| Serbia | 168 | 0.0% |
| Sierra Leone | 1,052 | 0.1% |
| Singapore | 34 | 0.0% |
| Somalia | 53 | 0.0% |
| South Africa | 181 | 0.0% |
| South America | 42,207 | 2.9% |
| South Central Asia | 22,546 | 1.6% |
| South Eastern Asia | 8,383 | 0.6% |
| Southern Europe | 5,163 | 0.4% |
| Spain | 528 | 0.0% |
| Sri Lanka | 202 | 0.0% |
| St. Vincent and the Grenadines | 246 | 0.0% |
| Sudan | 83 | 0.0% |
| Sweden | 72 | 0.0% |
| Switzerland | 79 | 0.0% |
| Syria | 141 | 0.0% |
| Taiwan | 218 | 0.0% |
| Thailand | 420 | 0.0% |
| Trinidad and Tobago | 4,652 | 0.3% |
| Turkey | 210 | 0.0% |
| Uganda | 21 | 0.0% |
| Ukraine | 1,031 | 0.1% |
| Uruguay | 27 | 0.0% |
| Uzbekistan | 80 | 0.0% |
| Venezuela | 1,623 | 0.1% |
| Vietnam | 2,253 | 0.2% |
| West Indies | 483 | 0.0% |
| Western Africa | 47,755 | 3.3% |
| Western Asia | 3,586 | 0.3% |
| Western Europe | 1,625 | 0.1% |
| Yemen | 2,044 | 0.1% |
| Zaire | 97 | 0.0% | View All 129 Rows |
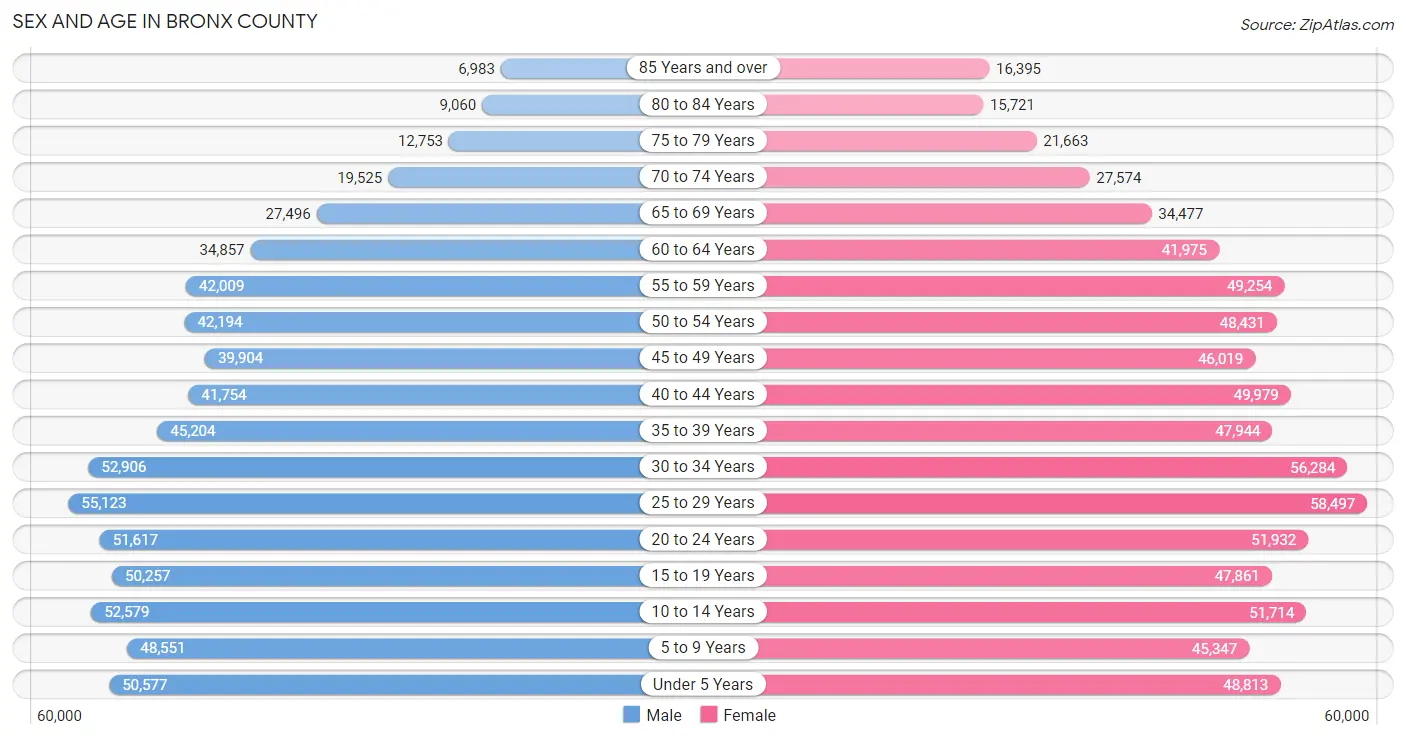
Sex and Age in Bronx County
Sex and Age in Bronx County
The most populous age groups in Bronx County are 25 to 29 Years (55,123 | 8.1%) for men and 25 to 29 Years (58,497 | 7.7%) for women.
| Age Bracket | Male | Female |
| Under 5 Years | 50,577 (7.4%) | 48,813 (6.4%) |
| 5 to 9 Years | 48,551 (7.1%) | 45,347 (6.0%) |
| 10 to 14 Years | 52,579 (7.7%) | 51,714 (6.8%) |
| 15 to 19 Years | 50,257 (7.3%) | 47,861 (6.3%) |
| 20 to 24 Years | 51,617 (7.5%) | 51,932 (6.8%) |
| 25 to 29 Years | 55,123 (8.1%) | 58,497 (7.7%) |
| 30 to 34 Years | 52,906 (7.7%) | 56,284 (7.4%) |
| 35 to 39 Years | 45,204 (6.6%) | 47,944 (6.3%) |
| 40 to 44 Years | 41,754 (6.1%) | 49,979 (6.6%) |
| 45 to 49 Years | 39,904 (5.8%) | 46,019 (6.1%) |
| 50 to 54 Years | 42,194 (6.2%) | 48,431 (6.4%) |
| 55 to 59 Years | 42,009 (6.1%) | 49,254 (6.5%) |
| 60 to 64 Years | 34,857 (5.1%) | 41,975 (5.5%) |
| 65 to 69 Years | 27,496 (4.0%) | 34,477 (4.5%) |
| 70 to 74 Years | 19,525 (2.9%) | 27,574 (3.6%) |
| 75 to 79 Years | 12,753 (1.9%) | 21,663 (2.9%) |
| 80 to 84 Years | 9,060 (1.3%) | 15,721 (2.1%) |
| 85 Years and over | 6,983 (1.0%) | 16,395 (2.2%) |
| Total | 683,349 (100.0%) | 759,880 (100.0%) |
Families and Households in Bronx County
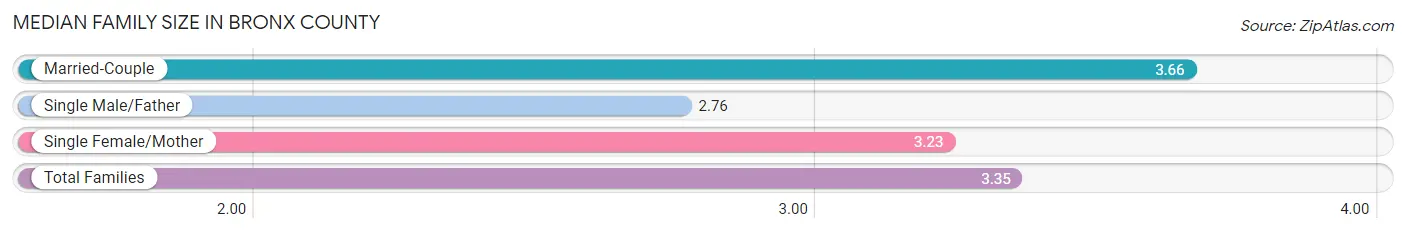
Median Family Size in Bronx County
The median family size in Bronx County is 3.35 persons per family, with married-couple families (141,475 | 42.4%) accounting for the largest median family size of 3.66 persons per family. On the other hand, single male/father families (41,957 | 12.6%) represent the smallest median family size with 2.76 persons per family.
| Family Type | # Families | Family Size |
| Married-Couple | 141,475 (42.4%) | 3.66 |
| Single Male/Father | 41,957 (12.6%) | 2.76 |
| Single Female/Mother | 150,139 (45.0%) | 3.23 |
| Total Families | 333,571 (100.0%) | 3.35 |
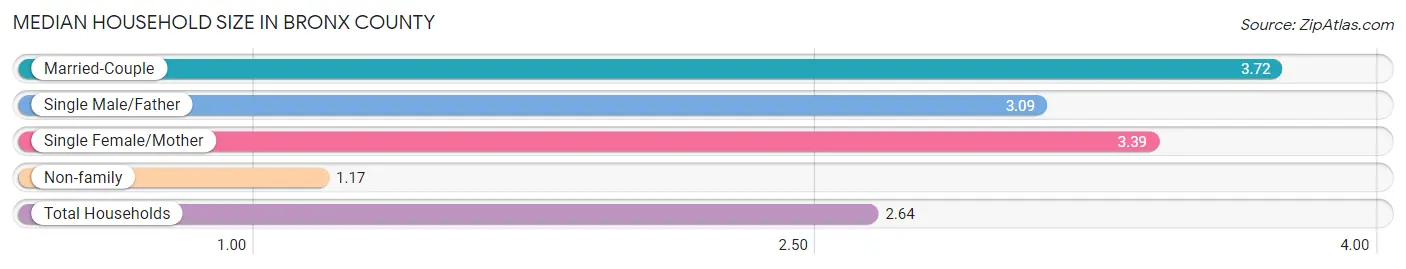
Median Household Size in Bronx County
The median household size in Bronx County is 2.64 persons per household, with married-couple households (141,475 | 26.9%) accounting for the largest median household size of 3.72 persons per household. non-family households (191,816 | 36.5%) represent the smallest median household size with 1.17 persons per household.
| Household Type | # Households | Household Size |
| Married-Couple | 141,475 (26.9%) | 3.72 |
| Single Male/Father | 41,957 (8.0%) | 3.09 |
| Single Female/Mother | 150,139 (28.6%) | 3.39 |
| Non-family | 191,816 (36.5%) | 1.17 |
| Total Households | 525,387 (100.0%) | 2.64 |
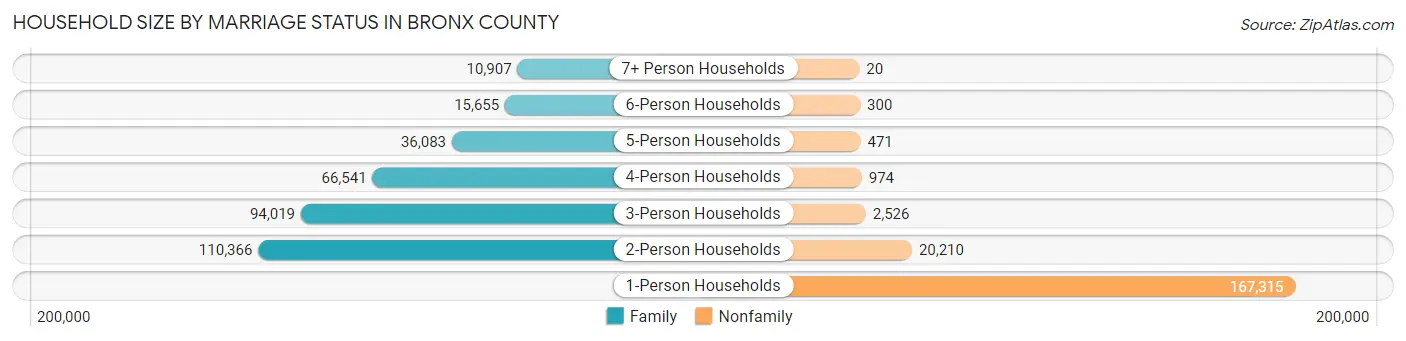
Household Size by Marriage Status in Bronx County
Out of a total of 525,387 households in Bronx County, 333,571 (63.5%) are family households, while 191,816 (36.5%) are nonfamily households. The most numerous type of family households are 2-person households, comprising 110,366, and the most common type of nonfamily households are 1-person households, comprising 167,315.
| Household Size | Family Households | Nonfamily Households |
| 1-Person Households | - | 167,315 (31.9%) |
| 2-Person Households | 110,366 (21.0%) | 20,210 (3.8%) |
| 3-Person Households | 94,019 (17.9%) | 2,526 (0.5%) |
| 4-Person Households | 66,541 (12.7%) | 974 (0.2%) |
| 5-Person Households | 36,083 (6.9%) | 471 (0.1%) |
| 6-Person Households | 15,655 (3.0%) | 300 (0.1%) |
| 7+ Person Households | 10,907 (2.1%) | 20 (0.0%) |
| Total | 333,571 (63.5%) | 191,816 (36.5%) |
Female Fertility in Bronx County
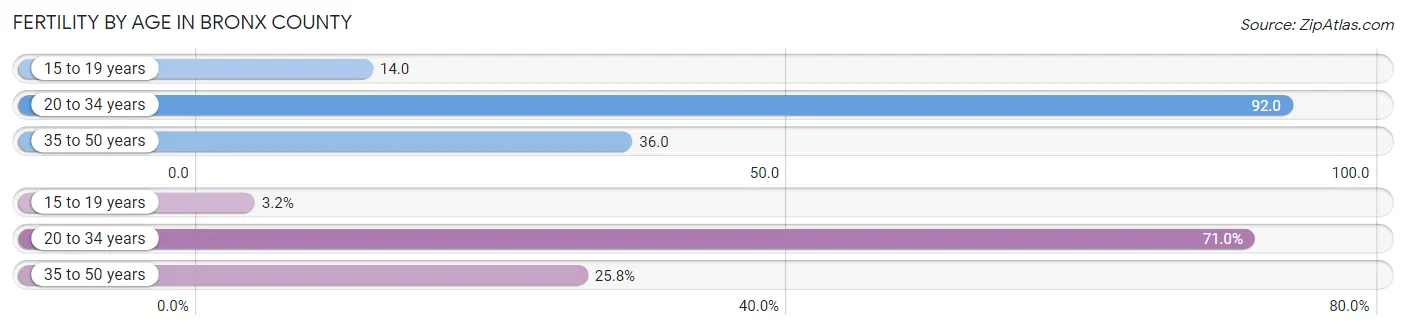
Fertility by Age in Bronx County
Average fertility rate in Bronx County is 59.0 births per 1,000 women. Women in the age bracket of 20 to 34 years have the highest fertility rate with 92.0 births per 1,000 women. Women in the age bracket of 20 to 34 years acount for 71.0% of all women with births.
| Age Bracket | Women with Births | Births / 1,000 Women |
| 15 to 19 years | 686 (3.2%) | 14.0 |
| 20 to 34 years | 15,315 (71.0%) | 92.0 |
| 35 to 50 years | 5,558 (25.8%) | 36.0 |
| Total | 21,559 (100.0%) | 59.0 |
Fertility by Age by Marriage Status in Bronx County
48.5% of women with births (21,559) in Bronx County are married. The highest percentage of unmarried women with births falls into 15 to 19 years age bracket with 89.8% of them unmarried at the time of birth, while the lowest percentage of unmarried women with births belong to 35 to 50 years age bracket with 35.3% of them unmarried.
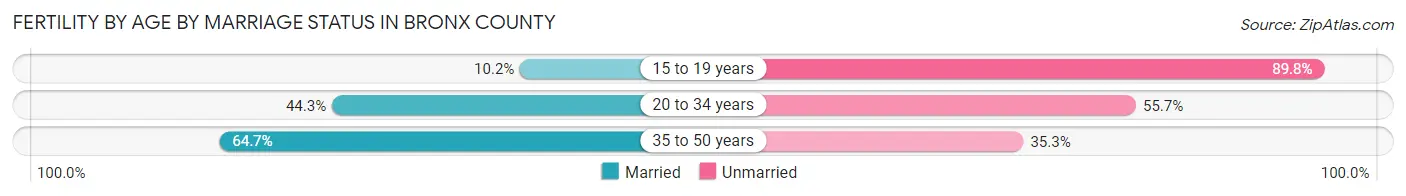
| Age Bracket | Married | Unmarried |
| 15 to 19 years | 70 (10.2%) | 616 (89.8%) |
| 20 to 34 years | 6,785 (44.3%) | 8,530 (55.7%) |
| 35 to 50 years | 3,596 (64.7%) | 1,962 (35.3%) |
| Total | 10,456 (48.5%) | 11,103 (51.5%) |
Fertility by Education in Bronx County
Average fertility rate in Bronx County is 59.0 births per 1,000 women. Women with the education attainment of graduate degree have the highest fertility rate of 75.0 births per 1,000 women, while women with the education attainment of less than high school have the lowest fertility at 54.0 births per 1,000 women. Women with the education attainment of college or associate's degree represent 28.2% of all women with births.
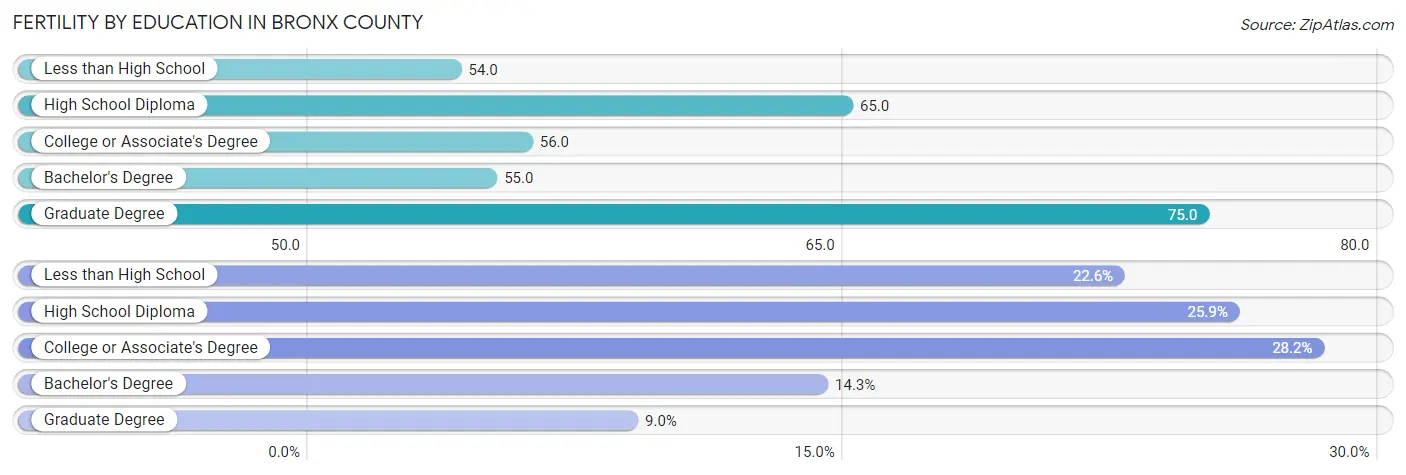
| Educational Attainment | Women with Births | Births / 1,000 Women |
| Less than High School | 4,881 (22.6%) | 54.0 |
| High School Diploma | 5,575 (25.9%) | 65.0 |
| College or Associate's Degree | 6,089 (28.2%) | 56.0 |
| Bachelor's Degree | 3,083 (14.3%) | 55.0 |
| Graduate Degree | 1,931 (9.0%) | 75.0 |
| Total | 21,559 (100.0%) | 59.0 |
Fertility by Education by Marriage Status in Bronx County
51.5% of women with births in Bronx County are unmarried. Women with the educational attainment of graduate degree are most likely to be married with 79.2% of them married at childbirth, while women with the educational attainment of less than high school are least likely to be married with 64.8% of them unmarried at childbirth.
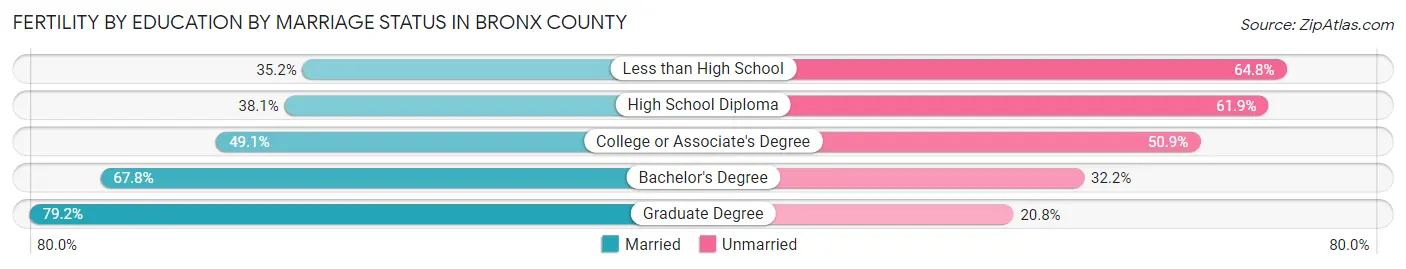
| Educational Attainment | Married | Unmarried |
| Less than High School | 1,718 (35.2%) | 3,163 (64.8%) |
| High School Diploma | 2,124 (38.1%) | 3,451 (61.9%) |
| College or Associate's Degree | 2,990 (49.1%) | 3,099 (50.9%) |
| Bachelor's Degree | 2,090 (67.8%) | 993 (32.2%) |
| Graduate Degree | 1,529 (79.2%) | 402 (20.8%) |
| Total | 10,456 (48.5%) | 11,103 (51.5%) |
Income in Bronx County
Income Overview in Bronx County
Per Capita Income in Bronx County is $25,845, while median incomes of families and households are $56,539 and $47,036 respectively.
| Characteristic | Number | Measure |
| Per Capita Income | 1,443,229 | $25,845 |
| Median Family Income | 333,571 | $56,539 |
| Mean Family Income | 333,571 | $78,285 |
| Median Household Income | 525,387 | $47,036 |
| Mean Household Income | 525,387 | $69,157 |
| Income Deficit | 333,571 | $11,945 |
| Wage / Income Gap (%) | 1,443,229 | 16.23% |
| Wage / Income Gap ($) | 1,443,229 | 83.77¢ per $1 |
| Gini / Inequality Index | 1,443,229 | 0.51 |
Earnings by Sex in Bronx County
Average Earnings in Bronx County are $34,581, $37,608 for men and $31,504 for women, a difference of 16.2%.
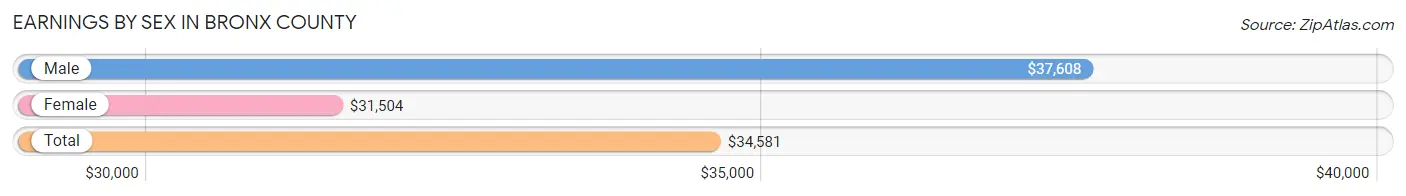
| Sex | Number | Average Earnings |
| Male | 326,173 (49.6%) | $37,608 |
| Female | 331,409 (50.4%) | $31,504 |
| Total | 657,582 (100.0%) | $34,581 |
Earnings by Sex by Income Bracket in Bronx County
The most common earnings brackets in Bronx County are $75,000 to $99,999 for men (30,373 | 9.3%) and $25,000 to $29,999 for women (24,527 | 7.4%).
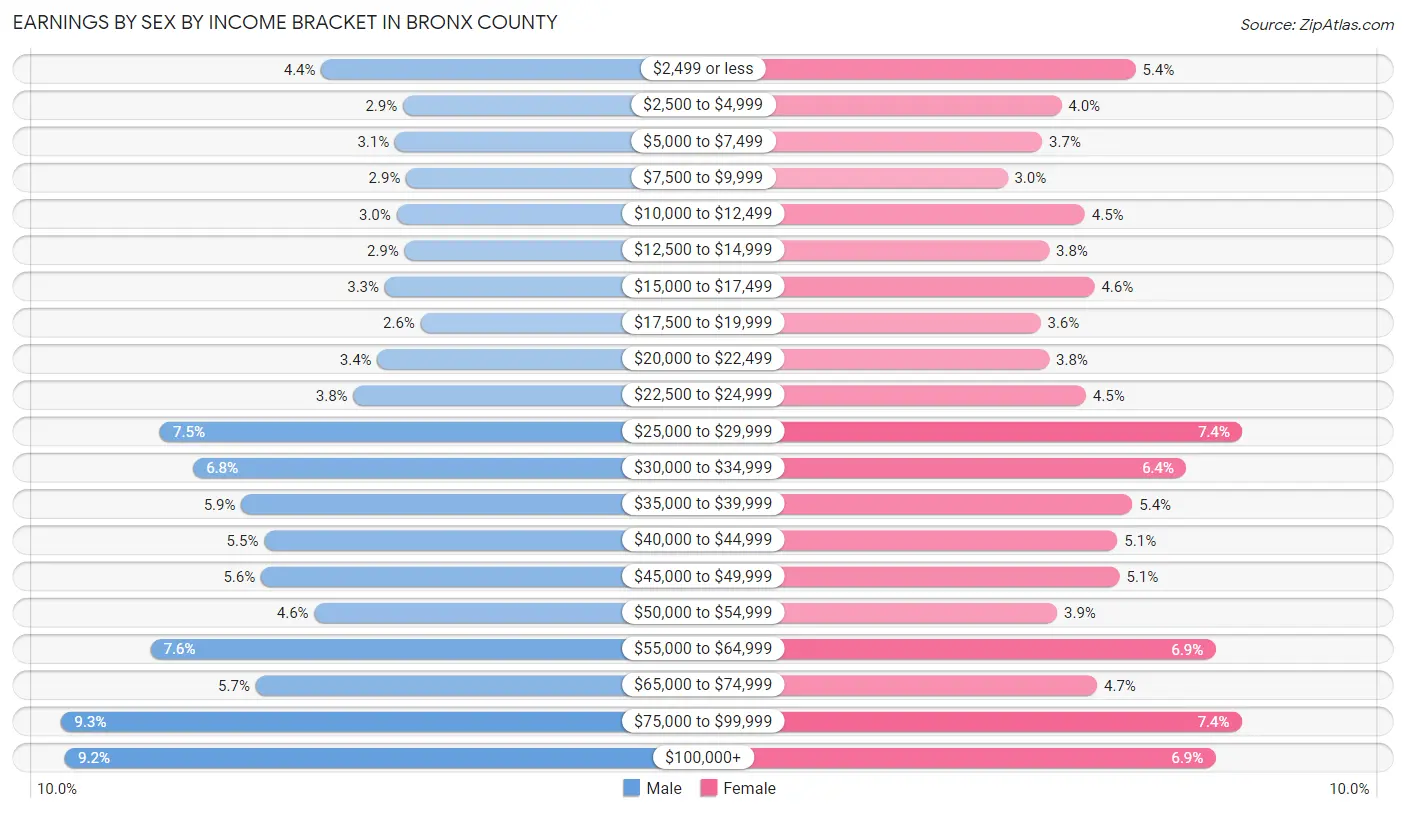
| Income | Male | Female |
| $2,499 or less | 14,484 (4.4%) | 17,929 (5.4%) |
| $2,500 to $4,999 | 9,505 (2.9%) | 13,314 (4.0%) |
| $5,000 to $7,499 | 9,991 (3.1%) | 12,144 (3.7%) |
| $7,500 to $9,999 | 9,301 (2.9%) | 9,973 (3.0%) |
| $10,000 to $12,499 | 9,878 (3.0%) | 14,767 (4.5%) |
| $12,500 to $14,999 | 9,406 (2.9%) | 12,548 (3.8%) |
| $15,000 to $17,499 | 10,615 (3.3%) | 15,385 (4.6%) |
| $17,500 to $19,999 | 8,406 (2.6%) | 12,027 (3.6%) |
| $20,000 to $22,499 | 11,067 (3.4%) | 12,568 (3.8%) |
| $22,500 to $24,999 | 12,527 (3.8%) | 14,843 (4.5%) |
| $25,000 to $29,999 | 24,322 (7.5%) | 24,527 (7.4%) |
| $30,000 to $34,999 | 22,306 (6.8%) | 21,035 (6.4%) |
| $35,000 to $39,999 | 19,376 (5.9%) | 17,745 (5.3%) |
| $40,000 to $44,999 | 17,963 (5.5%) | 16,818 (5.1%) |
| $45,000 to $49,999 | 18,182 (5.6%) | 16,940 (5.1%) |
| $50,000 to $54,999 | 14,907 (4.6%) | 13,073 (3.9%) |
| $55,000 to $64,999 | 24,916 (7.6%) | 22,871 (6.9%) |
| $65,000 to $74,999 | 18,503 (5.7%) | 15,554 (4.7%) |
| $75,000 to $99,999 | 30,373 (9.3%) | 24,495 (7.4%) |
| $100,000+ | 30,145 (9.2%) | 22,853 (6.9%) |
| Total | 326,173 (100.0%) | 331,409 (100.0%) |
Earnings by Sex by Educational Attainment in Bronx County
Average earnings in Bronx County are $42,073 for men and $35,545 for women, a difference of 15.5%. Men with an educational attainment of graduate degree enjoy the highest average annual earnings of $73,276, while those with less than high school education earn the least with $30,980. Women with an educational attainment of graduate degree earn the most with the average annual earnings of $75,388, while those with less than high school education have the smallest earnings of $21,112.
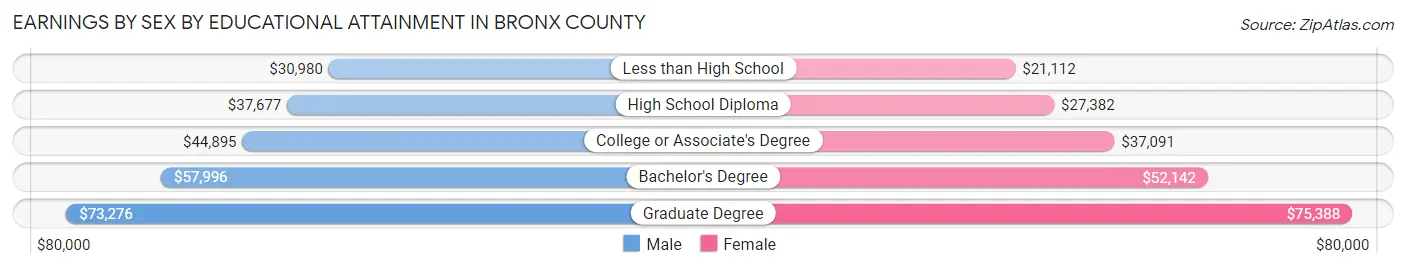
| Educational Attainment | Male Income | Female Income |
| Less than High School | $30,980 | $21,112 |
| High School Diploma | $37,677 | $27,382 |
| College or Associate's Degree | $44,895 | $37,091 |
| Bachelor's Degree | $57,996 | $52,142 |
| Graduate Degree | $73,276 | $75,388 |
| Total | $42,073 | $35,545 |
Family Income in Bronx County
Family Income Brackets in Bronx County
According to the Bronx County family income data, there are 58,708 families falling into the $50,000 to $74,999 income range, which is the most common income bracket and makes up 17.6% of all families. Conversely, the $10,000 to $14,999 income bracket is the least frequent group with only 17,679 families (5.3%) belonging to this category.
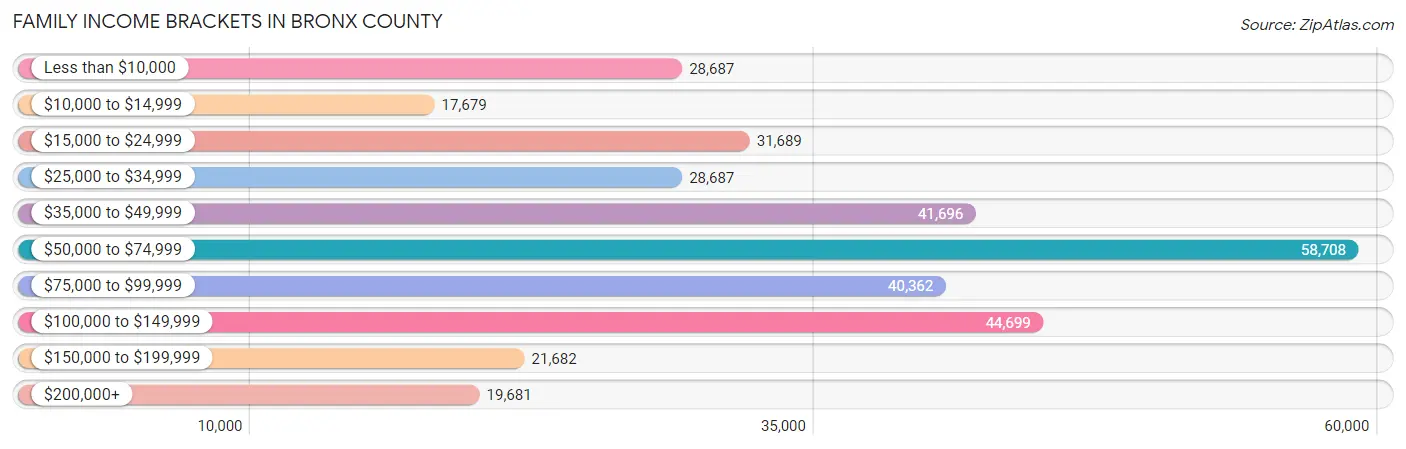
| Income Bracket | # Families | % Families |
| Less than $10,000 | 28,687 | 8.6% |
| $10,000 to $14,999 | 17,679 | 5.3% |
| $15,000 to $24,999 | 31,689 | 9.5% |
| $25,000 to $34,999 | 28,687 | 8.6% |
| $35,000 to $49,999 | 41,696 | 12.5% |
| $50,000 to $74,999 | 58,708 | 17.6% |
| $75,000 to $99,999 | 40,362 | 12.1% |
| $100,000 to $149,999 | 44,699 | 13.4% |
| $150,000 to $199,999 | 21,682 | 6.5% |
| $200,000+ | 19,681 | 5.9% |
Family Income by Famaliy Size in Bronx County
7+ person families (8,689 | 2.6%) account for the highest median family income in Bronx County with $97,341 per family, while 2-person families (124,510 | 37.3%) have the highest median income of $24,354 per family member.
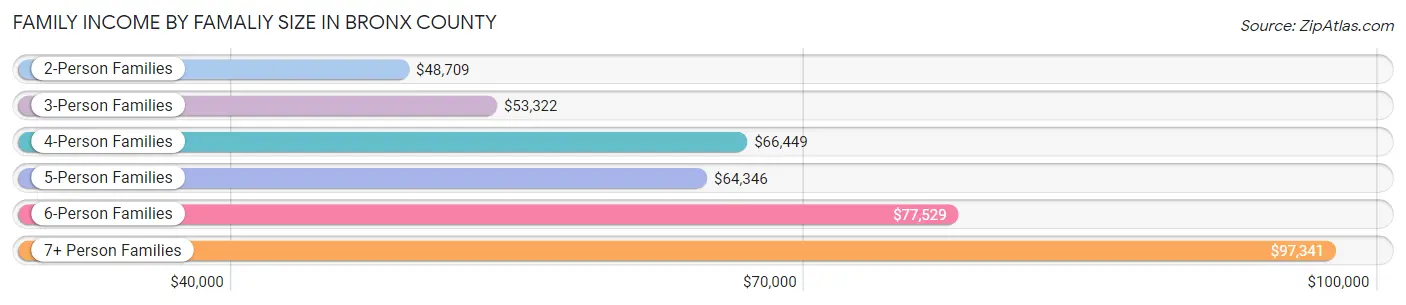
| Income Bracket | # Families | Median Income |
| 2-Person Families | 124,510 (37.3%) | $48,709 |
| 3-Person Families | 94,235 (28.2%) | $53,322 |
| 4-Person Families | 60,553 (18.1%) | $66,449 |
| 5-Person Families | 32,415 (9.7%) | $64,346 |
| 6-Person Families | 13,169 (4.0%) | $77,529 |
| 7+ Person Families | 8,689 (2.6%) | $97,341 |
| Total | 333,571 (100.0%) | $56,539 |
Family Income by Number of Earners in Bronx County
The median family income in Bronx County is $56,539, with families comprising 3+ earners (43,065) having the highest median family income of $120,835, while families with no earners (51,194) have the lowest median family income of $14,875, accounting for 12.9% and 15.3% of families, respectively.
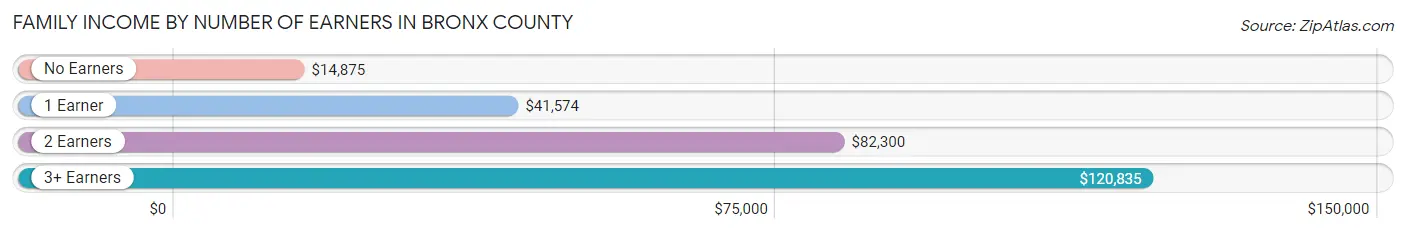
| Number of Earners | # Families | Median Income |
| No Earners | 51,194 (15.3%) | $14,875 |
| 1 Earner | 131,767 (39.5%) | $41,574 |
| 2 Earners | 107,545 (32.2%) | $82,300 |
| 3+ Earners | 43,065 (12.9%) | $120,835 |
| Total | 333,571 (100.0%) | $56,539 |
Household Income in Bronx County
Household Income Brackets in Bronx County
With 81,435 households falling in the category, the $50,000 to $74,999 income range is the most frequent in Bronx County, accounting for 15.5% of all households. In contrast, only 25,219 households (4.8%) fall into the $200,000+ income bracket, making it the least populous group.
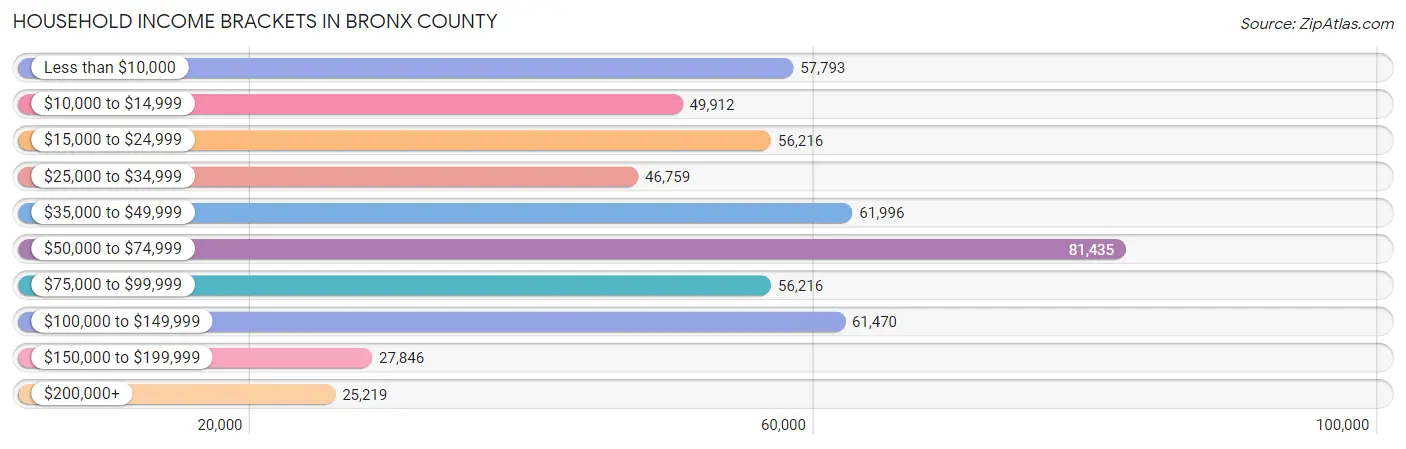
| Income Bracket | # Households | % Households |
| Less than $10,000 | 57,793 | 11.0% |
| $10,000 to $14,999 | 49,912 | 9.5% |
| $15,000 to $24,999 | 56,216 | 10.7% |
| $25,000 to $34,999 | 46,759 | 8.9% |
| $35,000 to $49,999 | 61,996 | 11.8% |
| $50,000 to $74,999 | 81,435 | 15.5% |
| $75,000 to $99,999 | 56,216 | 10.7% |
| $100,000 to $149,999 | 61,470 | 11.7% |
| $150,000 to $199,999 | 27,846 | 5.3% |
| $200,000+ | 25,219 | 4.8% |
Household Income by Householder Age in Bronx County
The median household income in Bronx County is $47,036, with the highest median household income of $53,897 found in the 25 to 44 years age bracket for the primary householder. A total of 179,359 households (34.1%) fall into this category. Meanwhile, the 65+ years age bracket for the primary householder has the lowest median household income of $30,915, with 123,730 households (23.5%) in this group.
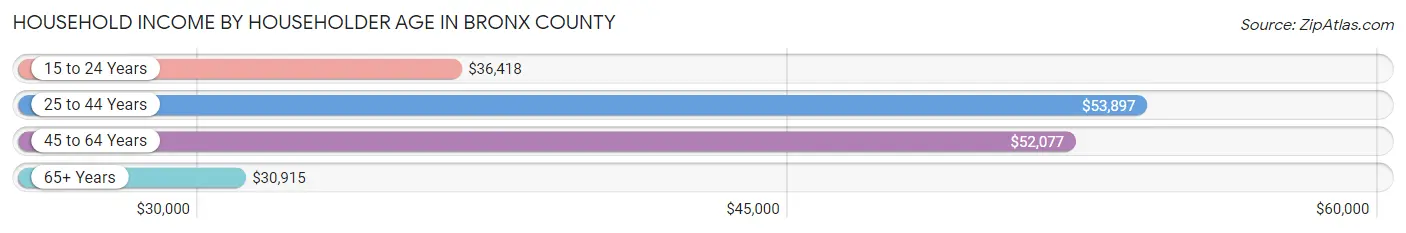
| Income Bracket | # Households | Median Income |
| 15 to 24 Years | 11,435 (2.2%) | $36,418 |
| 25 to 44 Years | 179,359 (34.1%) | $53,897 |
| 45 to 64 Years | 210,863 (40.1%) | $52,077 |
| 65+ Years | 123,730 (23.5%) | $30,915 |
| Total | 525,387 (100.0%) | $47,036 |
Poverty in Bronx County
Income Below Poverty by Sex and Age in Bronx County
With 24.8% poverty level for males and 28.8% for females among the residents of Bronx County, 5 year old males and under 5 year old females are the most vulnerable to poverty, with 3,744 males (39.6%) and 17,435 females (36.8%) in their respective age groups living below the poverty level.
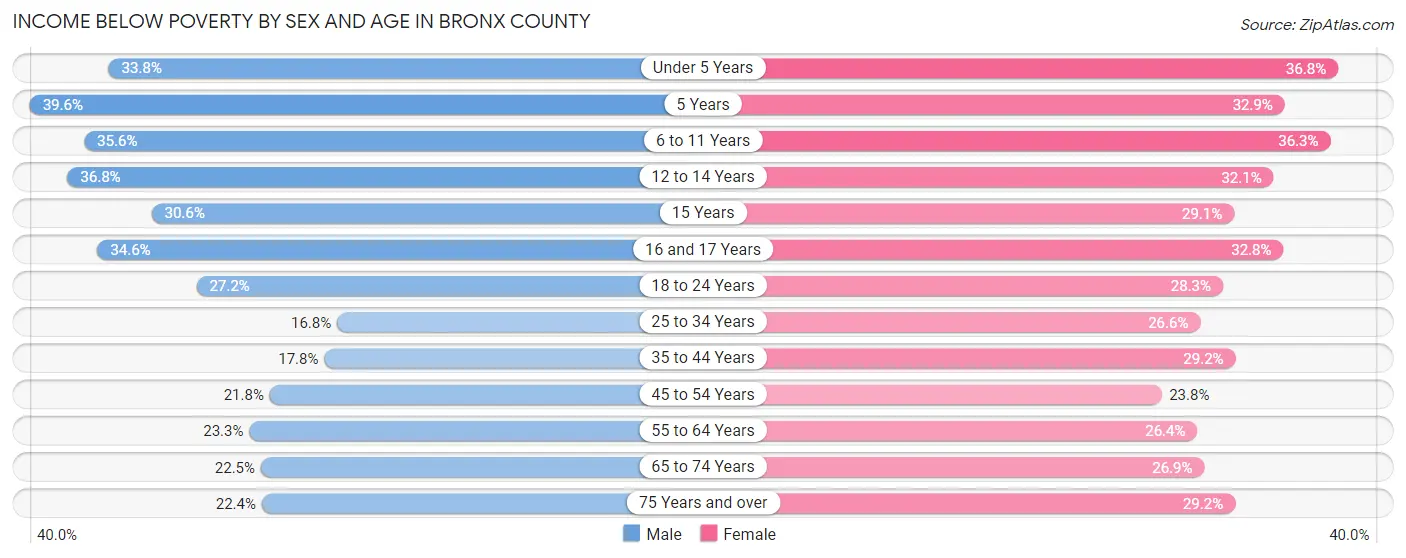
| Age Bracket | Male | Female |
| Under 5 Years | 16,468 (33.8%) | 17,435 (36.8%) |
| 5 Years | 3,744 (39.6%) | 2,769 (32.9%) |
| 6 to 11 Years | 20,482 (35.6%) | 20,479 (36.3%) |
| 12 to 14 Years | 11,702 (36.8%) | 9,522 (32.1%) |
| 15 Years | 3,174 (30.6%) | 2,449 (29.1%) |
| 16 and 17 Years | 6,643 (34.6%) | 6,559 (32.8%) |
| 18 to 24 Years | 18,513 (27.2%) | 19,279 (28.3%) |
| 25 to 34 Years | 17,866 (16.8%) | 30,475 (26.6%) |
| 35 to 44 Years | 15,151 (17.7%) | 28,537 (29.2%) |
| 45 to 54 Years | 17,644 (21.8%) | 22,395 (23.8%) |
| 55 to 64 Years | 17,620 (23.3%) | 23,914 (26.4%) |
| 65 to 74 Years | 10,190 (22.5%) | 16,354 (26.9%) |
| 75 Years and over | 6,014 (22.4%) | 14,547 (29.2%) |
| Total | 165,211 (24.8%) | 214,714 (28.8%) |
Income Above Poverty by Sex and Age in Bronx County
According to the poverty statistics in Bronx County, males aged 25 to 34 years and females aged 45 to 54 years are the age groups that are most secure financially, with 83.2% of males and 76.2% of females in these age groups living above the poverty line.
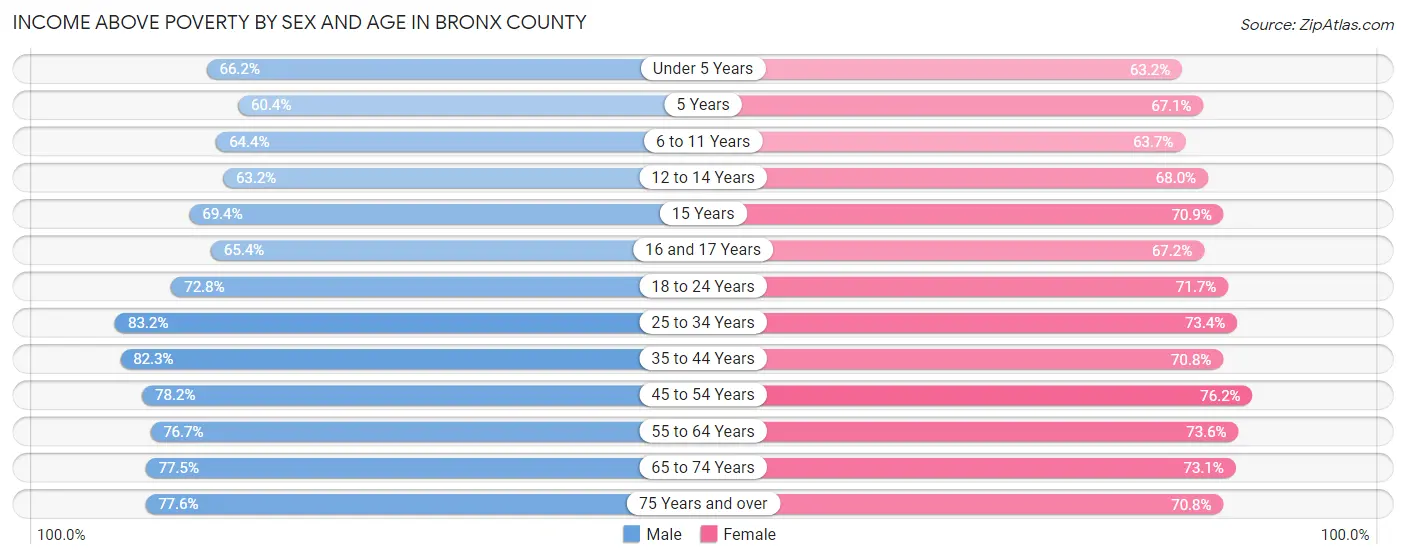
| Age Bracket | Male | Female |
| Under 5 Years | 32,299 (66.2%) | 29,892 (63.2%) |
| 5 Years | 5,705 (60.4%) | 5,652 (67.1%) |
| 6 to 11 Years | 37,079 (64.4%) | 35,986 (63.7%) |
| 12 to 14 Years | 20,083 (63.2%) | 20,186 (67.9%) |
| 15 Years | 7,208 (69.4%) | 5,961 (70.9%) |
| 16 and 17 Years | 12,562 (65.4%) | 13,448 (67.2%) |
| 18 to 24 Years | 49,447 (72.8%) | 48,865 (71.7%) |
| 25 to 34 Years | 88,483 (83.2%) | 84,069 (73.4%) |
| 35 to 44 Years | 70,187 (82.3%) | 69,125 (70.8%) |
| 45 to 54 Years | 63,298 (78.2%) | 71,760 (76.2%) |
| 55 to 64 Years | 57,938 (76.7%) | 66,688 (73.6%) |
| 65 to 74 Years | 35,182 (77.5%) | 44,417 (73.1%) |
| 75 Years and over | 20,844 (77.6%) | 35,285 (70.8%) |
| Total | 500,315 (75.2%) | 531,334 (71.2%) |
Income Below Poverty Among Married-Couple Families in Bronx County
The poverty statistics for married-couple families in Bronx County show that 11.9% or 16,878 of the total 141,475 families live below the poverty line. Families with 5 or more children have the highest poverty rate of 44.0%, comprising of 362 families. On the other hand, families with no children have the lowest poverty rate of 9.2%, which includes 6,593 families.
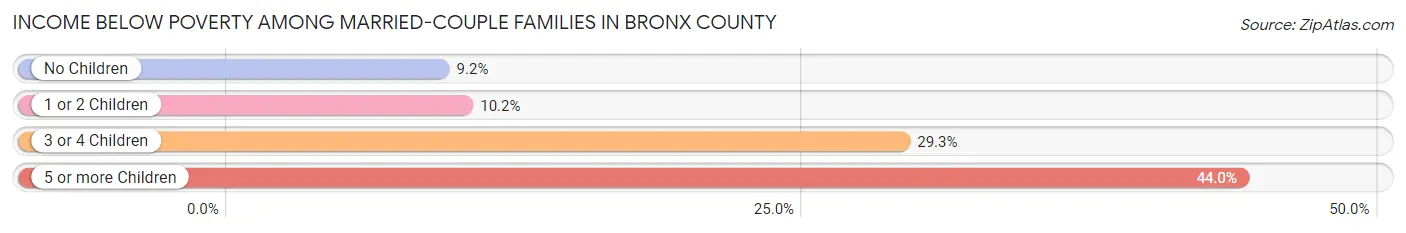
| Children | Above Poverty | Below Poverty |
| No Children | 65,024 (90.8%) | 6,593 (9.2%) |
| 1 or 2 Children | 48,507 (89.8%) | 5,536 (10.2%) |
| 3 or 4 Children | 10,605 (70.7%) | 4,387 (29.3%) |
| 5 or more Children | 461 (56.0%) | 362 (44.0%) |
| Total | 124,597 (88.1%) | 16,878 (11.9%) |
Income Below Poverty Among Single-Parent Households in Bronx County
According to the poverty data in Bronx County, 18.0% or 7,572 single-father households and 33.8% or 50,709 single-mother households are living below the poverty line. Among single-father households, those with 5 or more children have the highest poverty rate, with 96 households (51.3%) experiencing poverty. Likewise, among single-mother households, those with 5 or more children have the highest poverty rate, with 966 households (84.2%) falling below the poverty line.
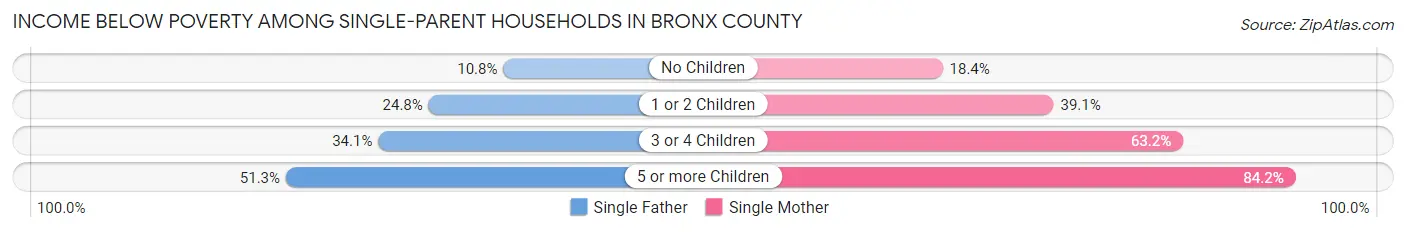
| Children | Single Father | Single Mother |
| No Children | 2,416 (10.8%) | 10,763 (18.4%) |
| 1 or 2 Children | 4,185 (24.7%) | 29,656 (39.1%) |
| 3 or 4 Children | 875 (34.1%) | 9,324 (63.2%) |
| 5 or more Children | 96 (51.3%) | 966 (84.2%) |
| Total | 7,572 (18.0%) | 50,709 (33.8%) |
Income Below Poverty Among Married-Couple vs Single-Parent Households in Bronx County
The poverty data for Bronx County shows that 16,878 of the married-couple family households (11.9%) and 58,281 of the single-parent households (30.3%) are living below the poverty level. Within the married-couple family households, those with 5 or more children have the highest poverty rate, with 362 households (44.0%) falling below the poverty line. Among the single-parent households, those with 5 or more children have the highest poverty rate, with 1,062 household (79.5%) living below poverty.
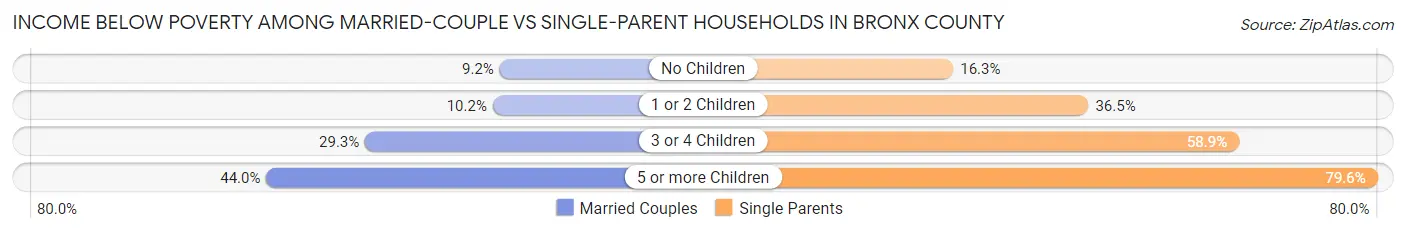
| Children | Married-Couple Families | Single-Parent Households |
| No Children | 6,593 (9.2%) | 13,179 (16.3%) |
| 1 or 2 Children | 5,536 (10.2%) | 33,841 (36.5%) |
| 3 or 4 Children | 4,387 (29.3%) | 10,199 (58.9%) |
| 5 or more Children | 362 (44.0%) | 1,062 (79.5%) |
| Total | 16,878 (11.9%) | 58,281 (30.3%) |
Employment Characteristics in Bronx County
Employment by Class of Employer in Bronx County
Among the 564,284 employed individuals in Bronx County, private company employees (374,171 | 66.3%), not-for-profit organizations (66,020 | 11.7%), and local government employees (61,101 | 10.8%) make up the most common classes of employment.
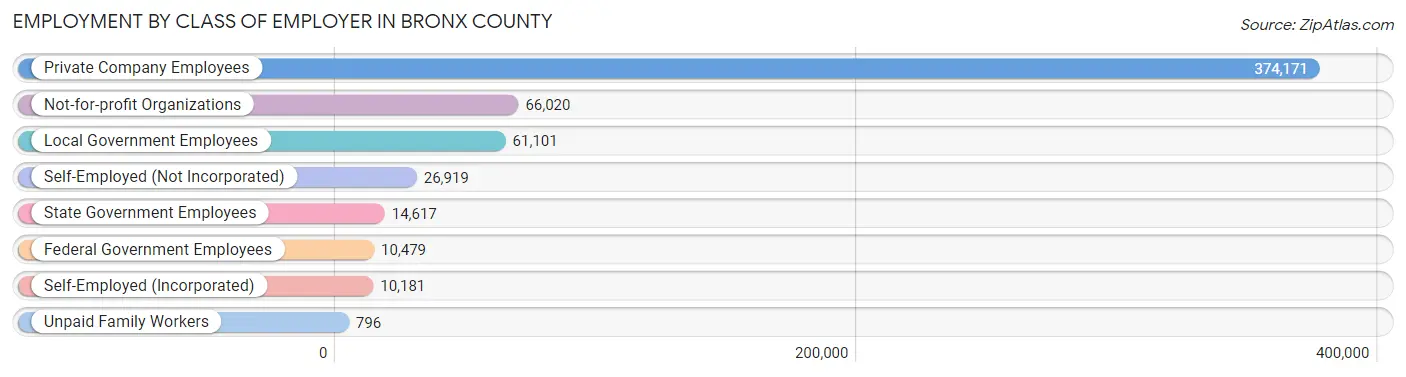
| Employer Class | # Employees | % Employees |
| Private Company Employees | 374,171 | 66.3% |
| Self-Employed (Incorporated) | 10,181 | 1.8% |
| Self-Employed (Not Incorporated) | 26,919 | 4.8% |
| Not-for-profit Organizations | 66,020 | 11.7% |
| Local Government Employees | 61,101 | 10.8% |
| State Government Employees | 14,617 | 2.6% |
| Federal Government Employees | 10,479 | 1.9% |
| Unpaid Family Workers | 796 | 0.1% |
| Total | 564,284 | 100.0% |
Employment Status by Age in Bronx County
According to the labor force statistics for Bronx County, out of the total population over 16 years of age (1,126,809), 58.4% or 658,056 individuals are in the labor force, with 11.2% or 73,702 of them unemployed. The age group with the highest labor force participation rate is 30 to 34 years, with 78.9% or 86,151 individuals in the labor force. Within the labor force, the 16 to 19 years age range has the highest percentage of unemployed individuals, with 34.7% or 5,970 of them being unemployed.
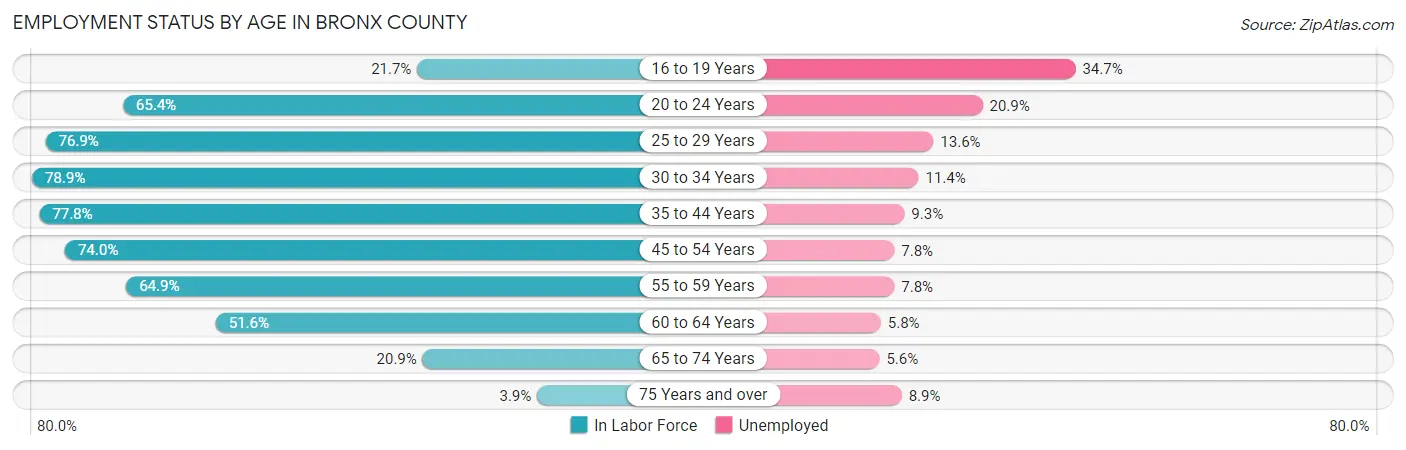
| Age Bracket | In Labor Force | Unemployed |
| 16 to 19 Years | 17,204 (21.7%) | 5,970 (34.7%) |
| 20 to 24 Years | 67,721 (65.4%) | 14,154 (20.9%) |
| 25 to 29 Years | 87,374 (76.9%) | 11,883 (13.6%) |
| 30 to 34 Years | 86,151 (78.9%) | 9,821 (11.4%) |
| 35 to 44 Years | 143,837 (77.8%) | 13,377 (9.3%) |
| 45 to 54 Years | 130,646 (74.0%) | 10,190 (7.8%) |
| 55 to 59 Years | 59,230 (64.9%) | 4,620 (7.8%) |
| 60 to 64 Years | 39,645 (51.6%) | 2,299 (5.8%) |
| 65 to 74 Years | 22,796 (20.9%) | 1,277 (5.6%) |
| 75 Years and over | 3,220 (3.9%) | 287 (8.9%) |
| Total | 658,056 (58.4%) | 73,702 (11.2%) |
Employment Status by Educational Attainment in Bronx County
According to labor force statistics for Bronx County, 72.7% of individuals (546,947) out of the total population between 25 and 64 years of age (752,334) are in the labor force, with 9.5% or 51,960 of them being unemployed. The group with the highest labor force participation rate are those with the educational attainment of bachelor's degree or higher, with 86.3% or 143,868 individuals in the labor force. Within the labor force, individuals with less than high school education have the highest percentage of unemployment, with 13.5% or 13,318 of them being unemployed.
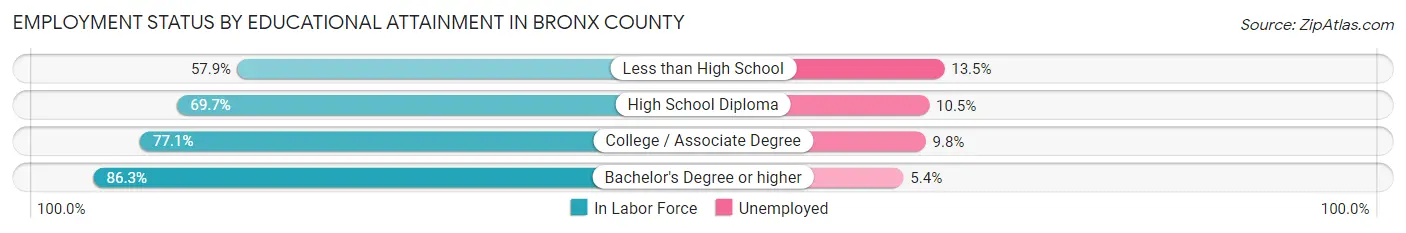
| Educational Attainment | In Labor Force | Unemployed |
| Less than High School | 98,652 (57.9%) | 23,002 (13.5%) |
| High School Diploma | 148,059 (69.7%) | 22,304 (10.5%) |
| College / Associate Degree | 156,375 (77.1%) | 19,876 (9.8%) |
| Bachelor's Degree or higher | 143,868 (86.3%) | 9,002 (5.4%) |
| Total | 546,947 (72.7%) | 71,472 (9.5%) |
Employment Occupations by Sex in Bronx County
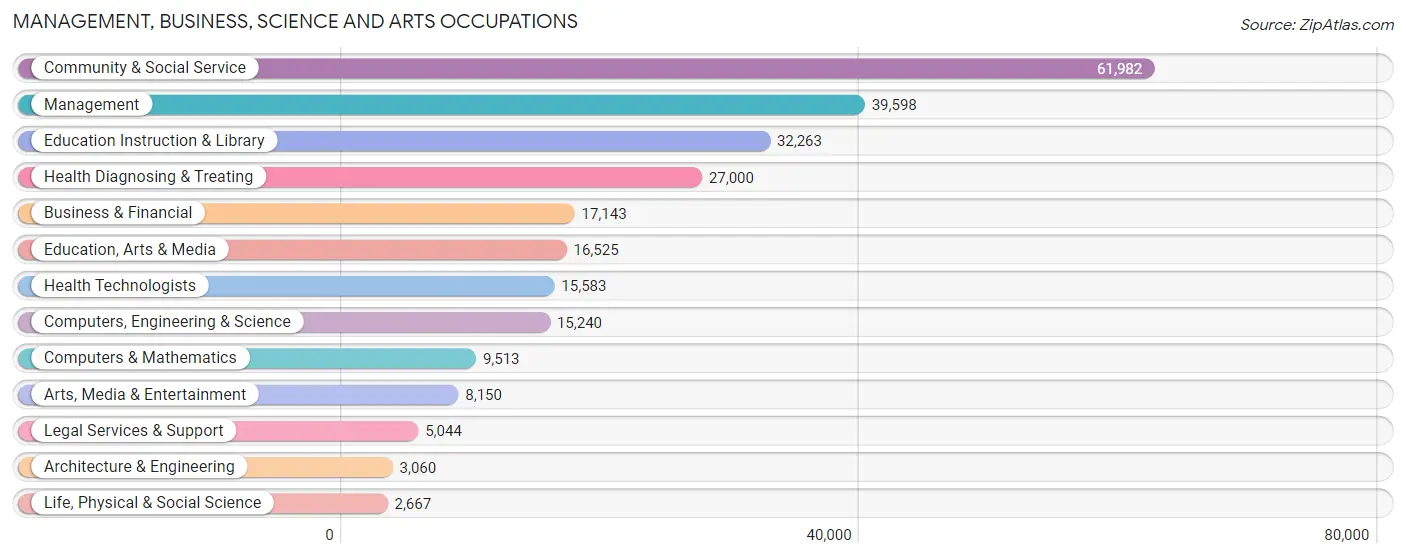
Management, Business, Science and Arts Occupations
The most common Management, Business, Science and Arts occupations in Bronx County are Community & Social Service (61,982 | 10.6%), Management (39,598 | 6.8%), Education Instruction & Library (32,263 | 5.5%), Health Diagnosing & Treating (27,000 | 4.6%), and Business & Financial (17,143 | 2.9%).
Management, Business, Science and Arts Occupations by Sex
Within the Management, Business, Science and Arts occupations in Bronx County, the most male-oriented occupations are Architecture & Engineering (80.9%), Computers & Mathematics (72.7%), and Computers, Engineering & Science (70.5%), while the most female-oriented occupations are Health Technologists (74.9%), Education Instruction & Library (74.2%), and Health Diagnosing & Treating (70.9%).
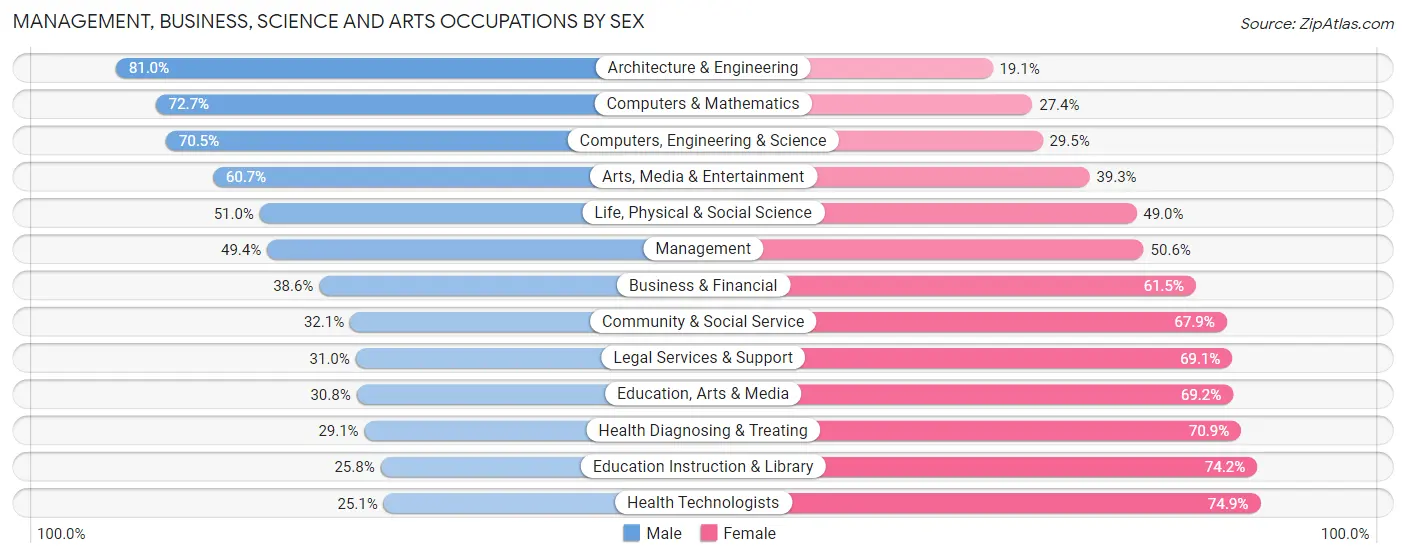
| Occupation | Male | Female |
| Management | 19,569 (49.4%) | 20,029 (50.6%) |
| Business & Financial | 6,608 (38.6%) | 10,535 (61.5%) |
| Computers, Engineering & Science | 10,747 (70.5%) | 4,493 (29.5%) |
| Computers & Mathematics | 6,911 (72.7%) | 2,602 (27.4%) |
| Architecture & Engineering | 2,477 (80.9%) | 583 (19.1%) |
| Life, Physical & Social Science | 1,359 (51.0%) | 1,308 (49.0%) |
| Community & Social Service | 19,907 (32.1%) | 42,075 (67.9%) |
| Education, Arts & Media | 5,085 (30.8%) | 11,440 (69.2%) |
| Legal Services & Support | 1,561 (30.9%) | 3,483 (69.1%) |
| Education Instruction & Library | 8,312 (25.8%) | 23,951 (74.2%) |
| Arts, Media & Entertainment | 4,949 (60.7%) | 3,201 (39.3%) |
| Health Diagnosing & Treating | 7,861 (29.1%) | 19,139 (70.9%) |
| Health Technologists | 3,914 (25.1%) | 11,669 (74.9%) |
| Total (Category) | 64,692 (40.2%) | 96,271 (59.8%) |
| Total (Overall) | 289,843 (49.7%) | 293,609 (50.3%) |
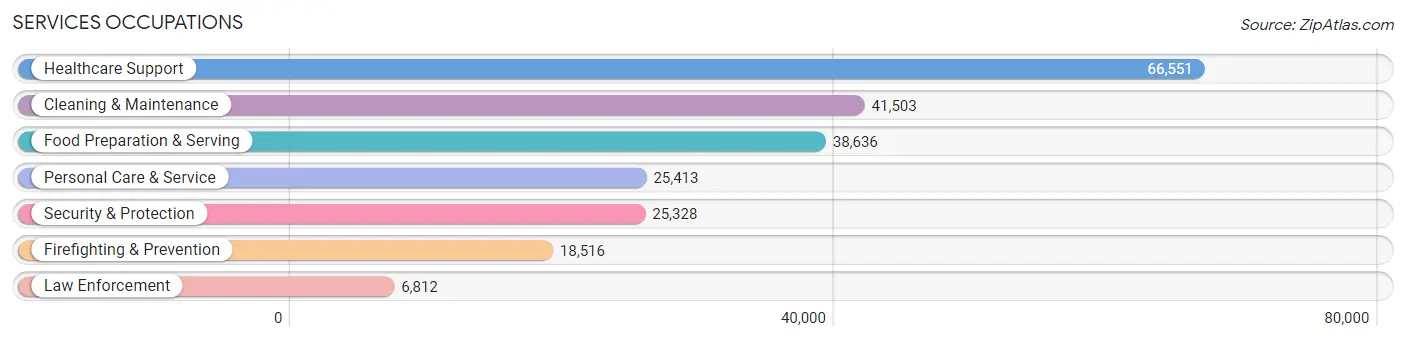
Services Occupations
The most common Services occupations in Bronx County are Healthcare Support (66,551 | 11.4%), Cleaning & Maintenance (41,503 | 7.1%), Food Preparation & Serving (38,636 | 6.6%), Personal Care & Service (25,413 | 4.4%), and Security & Protection (25,328 | 4.3%).
Services Occupations by Sex
Within the Services occupations in Bronx County, the most male-oriented occupations are Firefighting & Prevention (72.6%), Security & Protection (71.5%), and Law Enforcement (68.8%), while the most female-oriented occupations are Healthcare Support (88.0%), Personal Care & Service (67.5%), and Cleaning & Maintenance (37.2%).
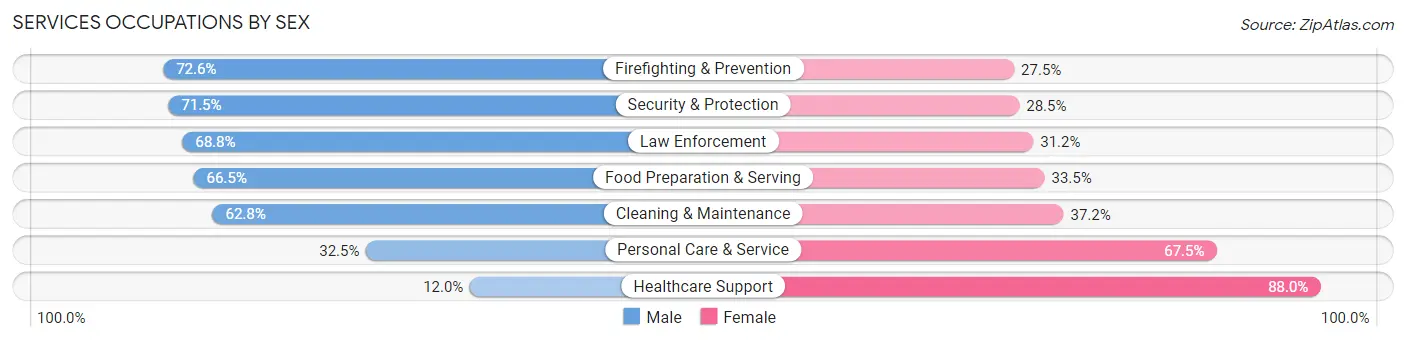
| Occupation | Male | Female |
| Healthcare Support | 7,958 (12.0%) | 58,593 (88.0%) |
| Security & Protection | 18,118 (71.5%) | 7,210 (28.5%) |
| Firefighting & Prevention | 13,434 (72.6%) | 5,082 (27.5%) |
| Law Enforcement | 4,684 (68.8%) | 2,128 (31.2%) |
| Food Preparation & Serving | 25,710 (66.5%) | 12,926 (33.5%) |
| Cleaning & Maintenance | 26,053 (62.8%) | 15,450 (37.2%) |
| Personal Care & Service | 8,267 (32.5%) | 17,146 (67.5%) |
| Total (Category) | 86,106 (43.6%) | 111,325 (56.4%) |
| Total (Overall) | 289,843 (49.7%) | 293,609 (50.3%) |
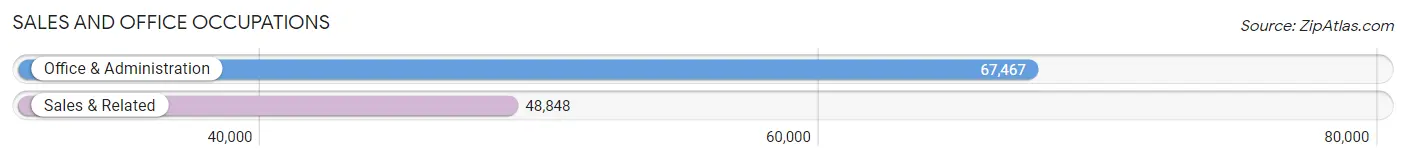
Sales and Office Occupations
The most common Sales and Office occupations in Bronx County are Office & Administration (67,467 | 11.6%), and Sales & Related (48,848 | 8.4%).
Sales and Office Occupations by Sex
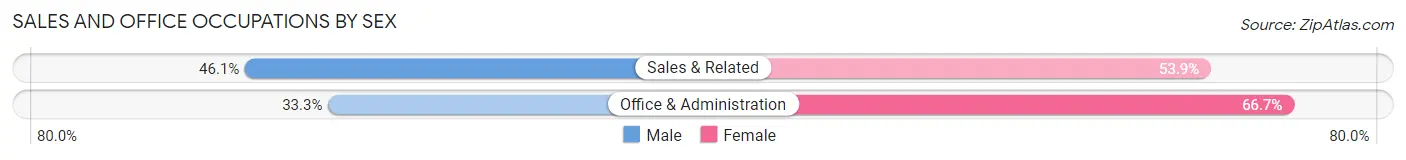
| Occupation | Male | Female |
| Sales & Related | 22,505 (46.1%) | 26,343 (53.9%) |
| Office & Administration | 22,463 (33.3%) | 45,004 (66.7%) |
| Total (Category) | 44,968 (38.7%) | 71,347 (61.3%) |
| Total (Overall) | 289,843 (49.7%) | 293,609 (50.3%) |
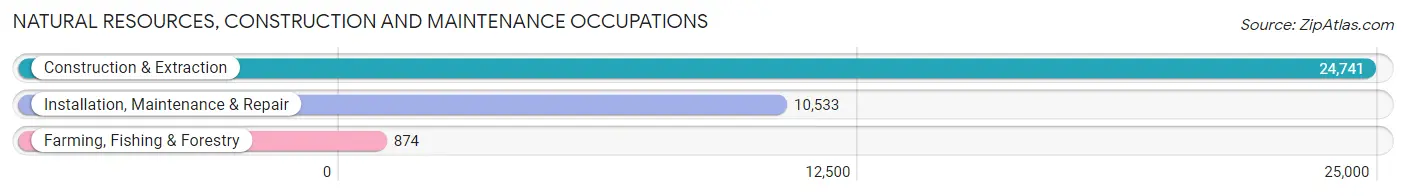
Natural Resources, Construction and Maintenance Occupations
The most common Natural Resources, Construction and Maintenance occupations in Bronx County are Construction & Extraction (24,741 | 4.2%), Installation, Maintenance & Repair (10,533 | 1.8%), and Farming, Fishing & Forestry (874 | 0.2%).
Natural Resources, Construction and Maintenance Occupations by Sex
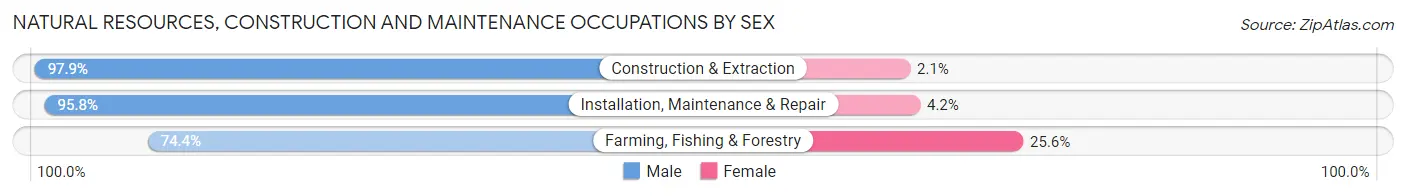
| Occupation | Male | Female |
| Farming, Fishing & Forestry | 650 (74.4%) | 224 (25.6%) |
| Construction & Extraction | 24,219 (97.9%) | 522 (2.1%) |
| Installation, Maintenance & Repair | 10,093 (95.8%) | 440 (4.2%) |
| Total (Category) | 34,962 (96.7%) | 1,186 (3.3%) |
| Total (Overall) | 289,843 (49.7%) | 293,609 (50.3%) |
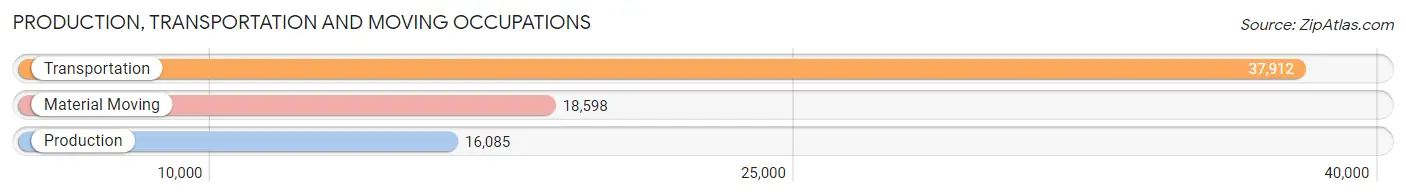
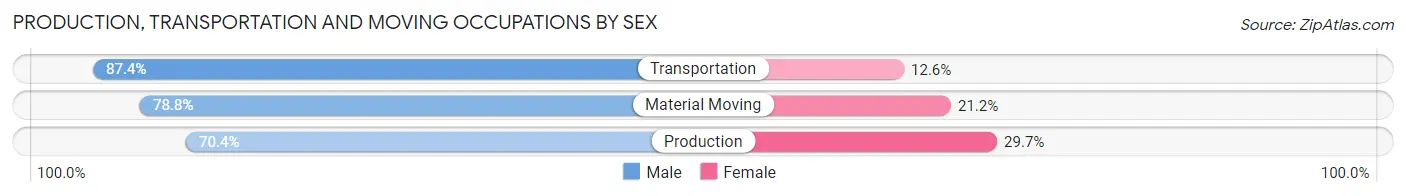
Production, Transportation and Moving Occupations
The most common Production, Transportation and Moving occupations in Bronx County are Transportation (37,912 | 6.5%), Material Moving (18,598 | 3.2%), and Production (16,085 | 2.8%).
Production, Transportation and Moving Occupations by Sex
| Occupation | Male | Female |
| Production | 11,315 (70.4%) | 4,770 (29.6%) |
| Transportation | 33,142 (87.4%) | 4,770 (12.6%) |
| Material Moving | 14,658 (78.8%) | 3,940 (21.2%) |
| Total (Category) | 59,115 (81.4%) | 13,480 (18.6%) |
| Total (Overall) | 289,843 (49.7%) | 293,609 (50.3%) |
Employment Industries by Sex in Bronx County
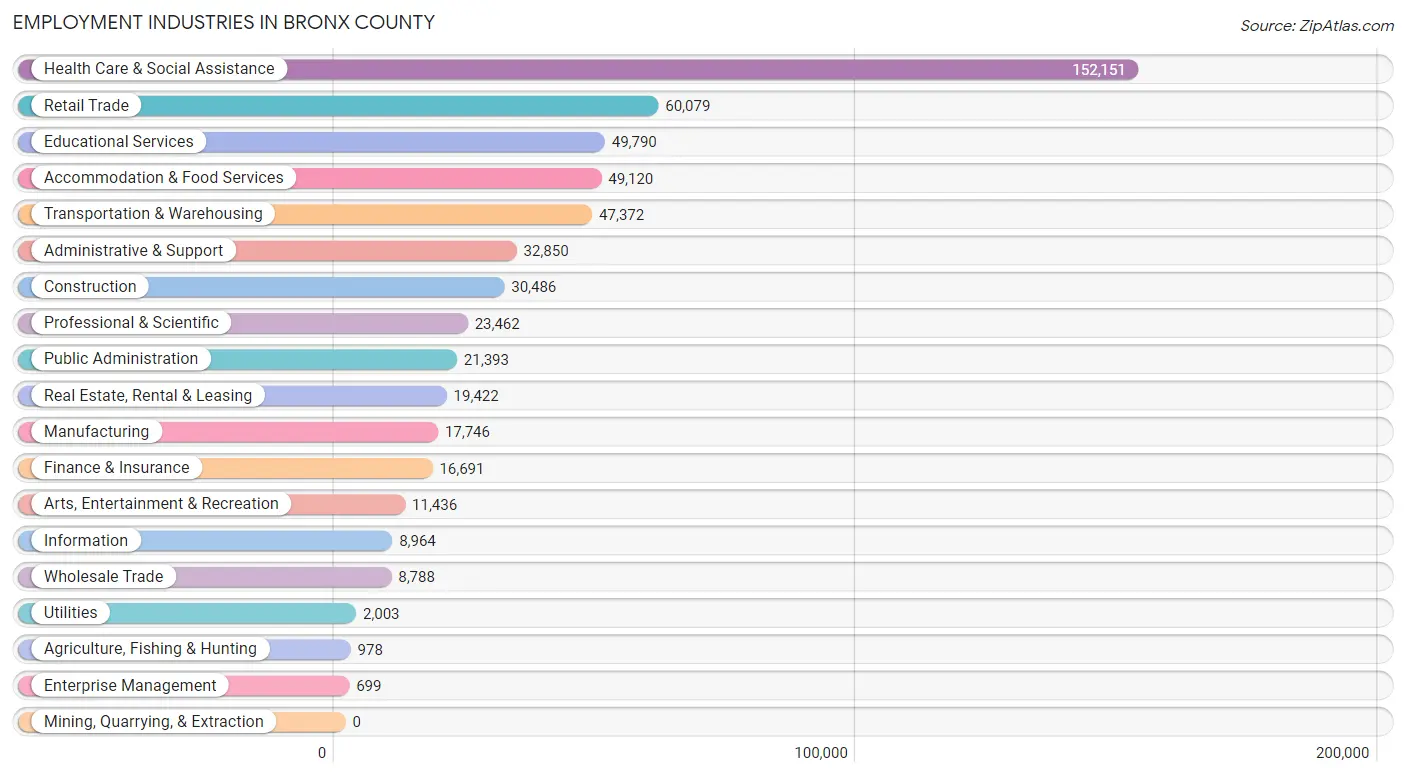
Employment Industries in Bronx County
The major employment industries in Bronx County include Health Care & Social Assistance (152,151 | 26.1%), Retail Trade (60,079 | 10.3%), Educational Services (49,790 | 8.5%), Accommodation & Food Services (49,120 | 8.4%), and Transportation & Warehousing (47,372 | 8.1%).
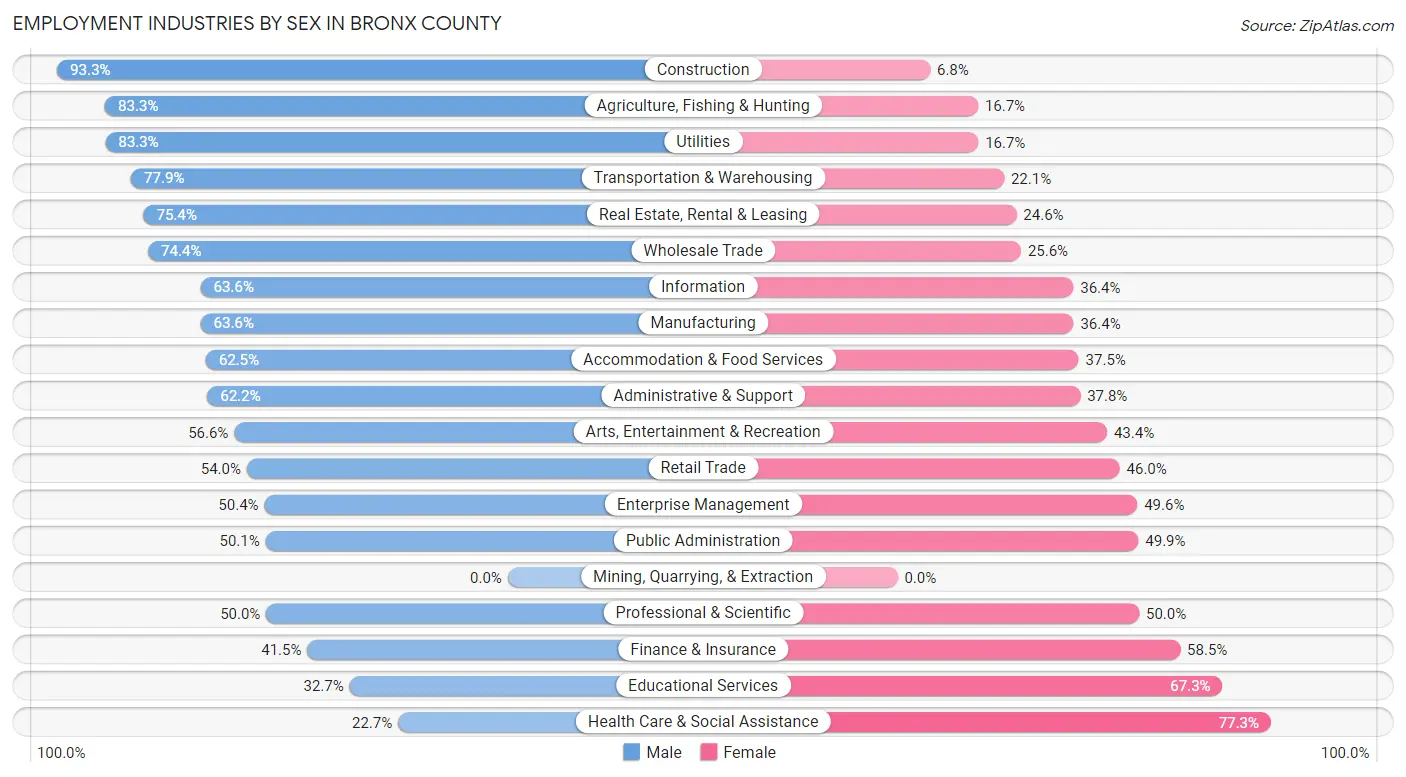
Employment Industries by Sex in Bronx County
The Bronx County industries that see more men than women are Construction (93.2%), Agriculture, Fishing & Hunting (83.3%), and Utilities (83.3%), whereas the industries that tend to have a higher number of women are Health Care & Social Assistance (77.3%), Educational Services (67.3%), and Finance & Insurance (58.5%).
| Industry | Male | Female |
| Agriculture, Fishing & Hunting | 815 (83.3%) | 163 (16.7%) |
| Mining, Quarrying, & Extraction | 0 (0.0%) | 0 (0.0%) |
| Construction | 28,428 (93.2%) | 2,058 (6.8%) |
| Manufacturing | 11,280 (63.6%) | 6,466 (36.4%) |
| Wholesale Trade | 6,541 (74.4%) | 2,247 (25.6%) |
| Retail Trade | 32,449 (54.0%) | 27,630 (46.0%) |
| Transportation & Warehousing | 36,920 (77.9%) | 10,452 (22.1%) |
| Utilities | 1,668 (83.3%) | 335 (16.7%) |
| Information | 5,700 (63.6%) | 3,264 (36.4%) |
| Finance & Insurance | 6,924 (41.5%) | 9,767 (58.5%) |
| Real Estate, Rental & Leasing | 14,638 (75.4%) | 4,784 (24.6%) |
| Professional & Scientific | 11,729 (50.0%) | 11,733 (50.0%) |
| Enterprise Management | 352 (50.4%) | 347 (49.6%) |
| Administrative & Support | 20,424 (62.2%) | 12,426 (37.8%) |
| Educational Services | 16,302 (32.7%) | 33,488 (67.3%) |
| Health Care & Social Assistance | 34,559 (22.7%) | 117,592 (77.3%) |
| Arts, Entertainment & Recreation | 6,475 (56.6%) | 4,961 (43.4%) |
| Accommodation & Food Services | 30,693 (62.5%) | 18,427 (37.5%) |
| Public Administration | 10,725 (50.1%) | 10,668 (49.9%) |
| Total | 289,843 (49.7%) | 293,609 (50.3%) |
Education in Bronx County
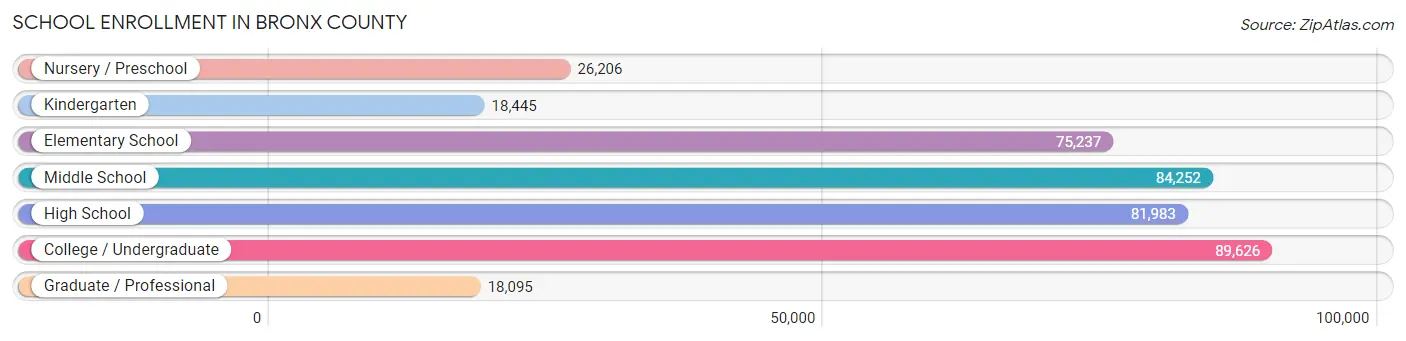
School Enrollment in Bronx County
The most common levels of schooling among the 393,844 students in Bronx County are college / undergraduate (89,626 | 22.8%), middle school (84,252 | 21.4%), and high school (81,983 | 20.8%).
| School Level | # Students | % Students |
| Nursery / Preschool | 26,206 | 6.7% |
| Kindergarten | 18,445 | 4.7% |
| Elementary School | 75,237 | 19.1% |
| Middle School | 84,252 | 21.4% |
| High School | 81,983 | 20.8% |
| College / Undergraduate | 89,626 | 22.8% |
| Graduate / Professional | 18,095 | 4.6% |
| Total | 393,844 | 100.0% |
School Enrollment by Age by Funding Source in Bronx County
Out of a total of 393,844 students who are enrolled in schools in Bronx County, 66,560 (16.9%) attend a private institution, while the remaining 327,284 (83.1%) are enrolled in public schools. The age group of 35 years and over has the highest likelihood of being enrolled in private schools, with 7,436 (34.6% in the age bracket) enrolled. Conversely, the age group of 5 to 9 year old has the lowest likelihood of being enrolled in a private school, with 81,353 (90.8% in the age bracket) attending a public institution.
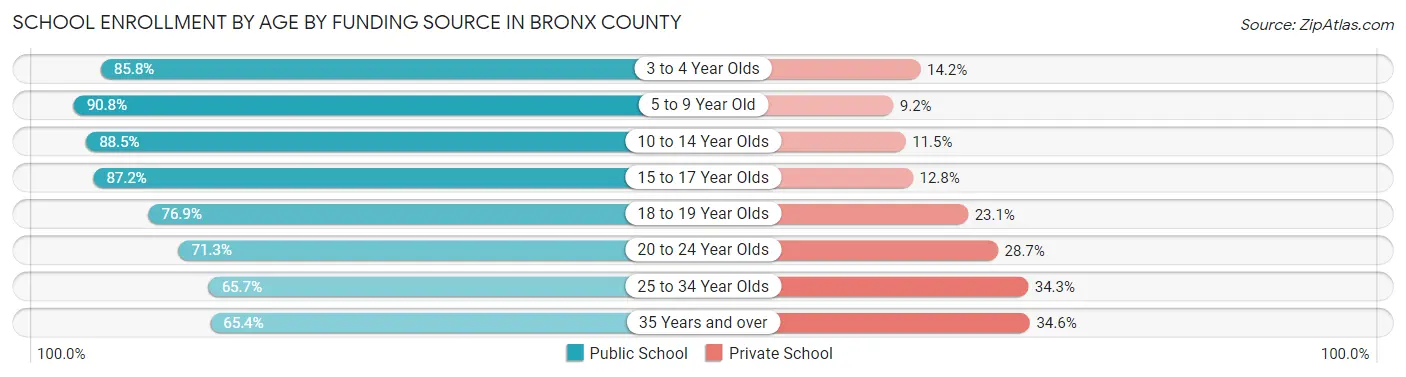
| Age Bracket | Public School | Private School |
| 3 to 4 Year Olds | 21,495 (85.8%) | 3,563 (14.2%) |
| 5 to 9 Year Old | 81,353 (90.8%) | 8,205 (9.2%) |
| 10 to 14 Year Olds | 89,219 (88.5%) | 11,576 (11.5%) |
| 15 to 17 Year Olds | 48,754 (87.2%) | 7,176 (12.8%) |
| 18 to 19 Year Olds | 23,829 (76.9%) | 7,158 (23.1%) |
| 20 to 24 Year Olds | 30,641 (71.3%) | 12,316 (28.7%) |
| 25 to 34 Year Olds | 17,786 (65.7%) | 9,286 (34.3%) |
| 35 Years and over | 14,051 (65.4%) | 7,436 (34.6%) |
| Total | 327,284 (83.1%) | 66,560 (16.9%) |
Educational Attainment by Field of Study in Bronx County
Business (40,640 | 18.9%), social sciences (23,670 | 11.0%), science & technology (23,241 | 10.8%), education (21,213 | 9.9%), and arts & humanities (18,165 | 8.5%) are the most common fields of study among 214,974 individuals in Bronx County who have obtained a bachelor's degree or higher.
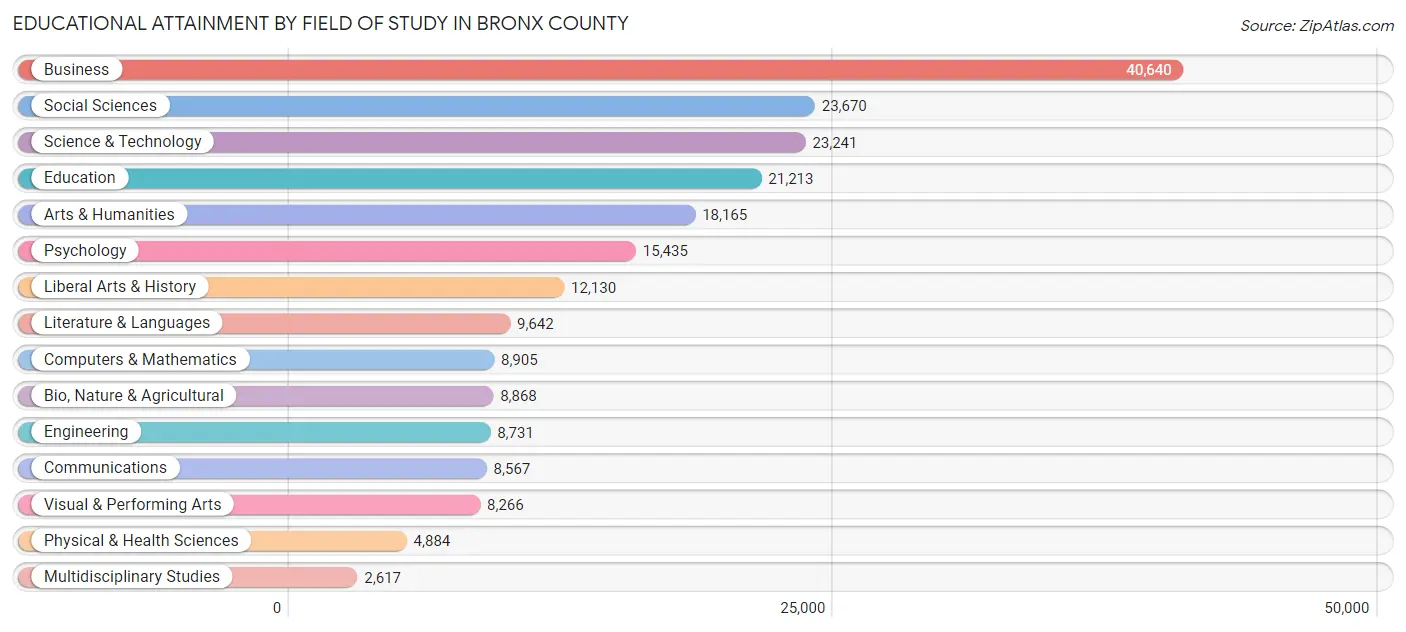
| Field of Study | # Graduates | % Graduates |
| Computers & Mathematics | 8,905 | 4.1% |
| Bio, Nature & Agricultural | 8,868 | 4.1% |
| Physical & Health Sciences | 4,884 | 2.3% |
| Psychology | 15,435 | 7.2% |
| Social Sciences | 23,670 | 11.0% |
| Engineering | 8,731 | 4.1% |
| Multidisciplinary Studies | 2,617 | 1.2% |
| Science & Technology | 23,241 | 10.8% |
| Business | 40,640 | 18.9% |
| Education | 21,213 | 9.9% |
| Literature & Languages | 9,642 | 4.5% |
| Liberal Arts & History | 12,130 | 5.6% |
| Visual & Performing Arts | 8,266 | 3.8% |
| Communications | 8,567 | 4.0% |
| Arts & Humanities | 18,165 | 8.5% |
| Total | 214,974 | 100.0% |
Transportation & Commute in Bronx County
Vehicle Availability by Sex in Bronx County
The most prevalent vehicle ownership categories in Bronx County are males with no vehicle (122,701, accounting for 43.9%) and females with no vehicle (137,979, making up 44.2%).
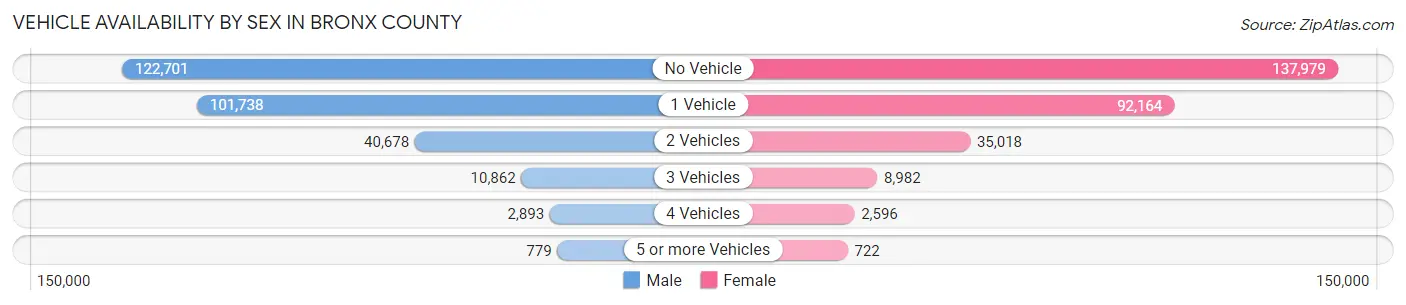
| Vehicles Available | Male | Female |
| No Vehicle | 122,701 (43.9%) | 137,979 (49.7%) |
| 1 Vehicle | 101,738 (36.4%) | 92,164 (33.2%) |
| 2 Vehicles | 40,678 (14.5%) | 35,018 (12.6%) |
| 3 Vehicles | 10,862 (3.9%) | 8,982 (3.2%) |
| 4 Vehicles | 2,893 (1.0%) | 2,596 (0.9%) |
| 5 or more Vehicles | 779 (0.3%) | 722 (0.3%) |
| Total | 279,651 (100.0%) | 277,461 (100.0%) |
Commute Time in Bronx County
The most frequently occuring commute durations in Bronx County are 60 to 89 minutes (127,872 commuters, 24.3%), 45 to 59 minutes (88,279 commuters, 16.8%), and 30 to 34 minutes (72,144 commuters, 13.7%).
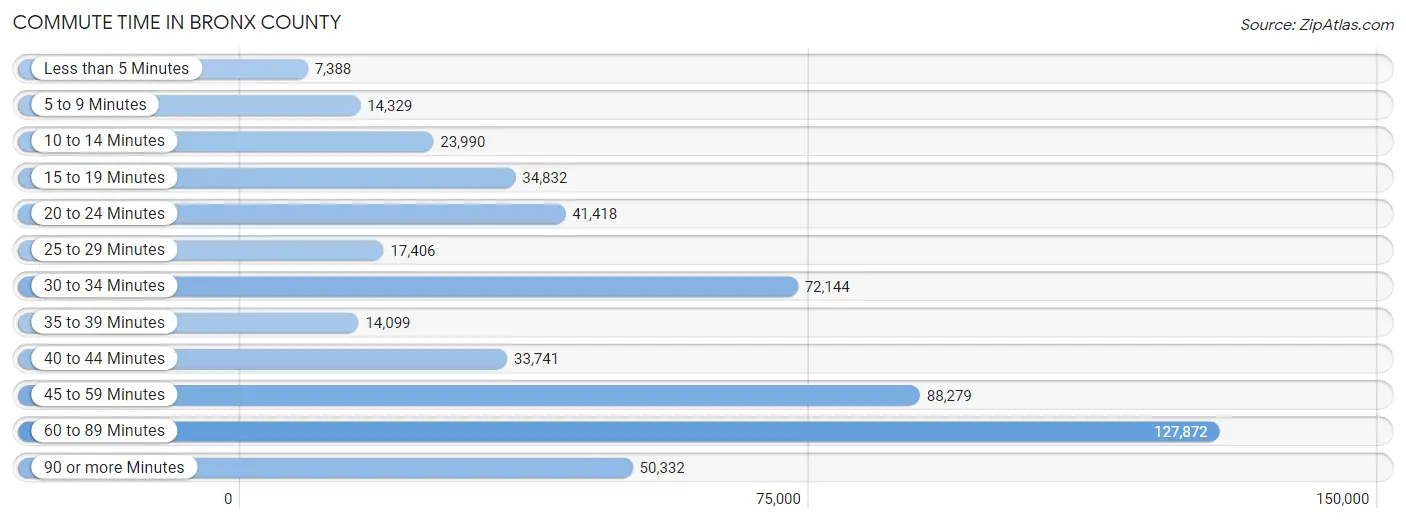
| Commute Time | # Commuters | % Commuters |
| Less than 5 Minutes | 7,388 | 1.4% |
| 5 to 9 Minutes | 14,329 | 2.7% |
| 10 to 14 Minutes | 23,990 | 4.6% |
| 15 to 19 Minutes | 34,832 | 6.6% |
| 20 to 24 Minutes | 41,418 | 7.9% |
| 25 to 29 Minutes | 17,406 | 3.3% |
| 30 to 34 Minutes | 72,144 | 13.7% |
| 35 to 39 Minutes | 14,099 | 2.7% |
| 40 to 44 Minutes | 33,741 | 6.4% |
| 45 to 59 Minutes | 88,279 | 16.8% |
| 60 to 89 Minutes | 127,872 | 24.3% |
| 90 or more Minutes | 50,332 | 9.6% |
Commute Time by Sex in Bronx County
The most common commute times in Bronx County are 60 to 89 minutes (66,380 commuters, 24.9%) for males and 60 to 89 minutes (61,492 commuters, 23.7%) for females.
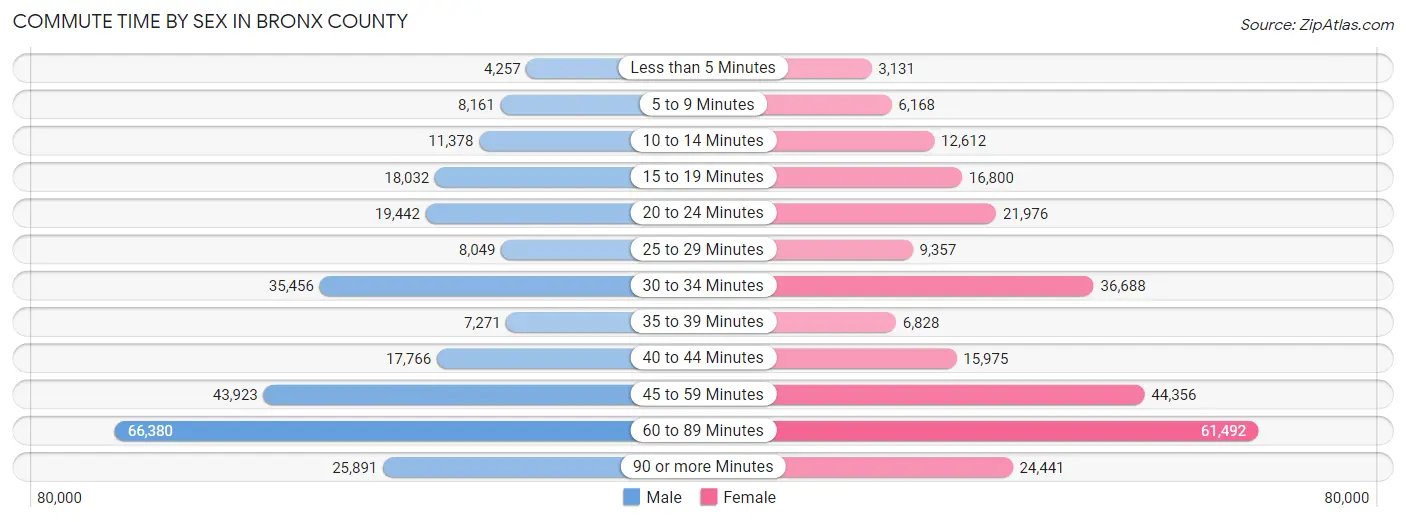
| Commute Time | Male | Female |
| Less than 5 Minutes | 4,257 (1.6%) | 3,131 (1.2%) |
| 5 to 9 Minutes | 8,161 (3.1%) | 6,168 (2.4%) |
| 10 to 14 Minutes | 11,378 (4.3%) | 12,612 (4.9%) |
| 15 to 19 Minutes | 18,032 (6.8%) | 16,800 (6.5%) |
| 20 to 24 Minutes | 19,442 (7.3%) | 21,976 (8.5%) |
| 25 to 29 Minutes | 8,049 (3.0%) | 9,357 (3.6%) |
| 30 to 34 Minutes | 35,456 (13.3%) | 36,688 (14.1%) |
| 35 to 39 Minutes | 7,271 (2.7%) | 6,828 (2.6%) |
| 40 to 44 Minutes | 17,766 (6.7%) | 15,975 (6.1%) |
| 45 to 59 Minutes | 43,923 (16.5%) | 44,356 (17.1%) |
| 60 to 89 Minutes | 66,380 (24.9%) | 61,492 (23.7%) |
| 90 or more Minutes | 25,891 (9.7%) | 24,441 (9.4%) |
Time of Departure to Work by Sex in Bronx County
The most frequent times of departure to work in Bronx County are 7:00 AM to 7:29 AM (37,288, 14.0%) for males and 8:00 AM to 8:29 AM (43,830, 16.9%) for females.
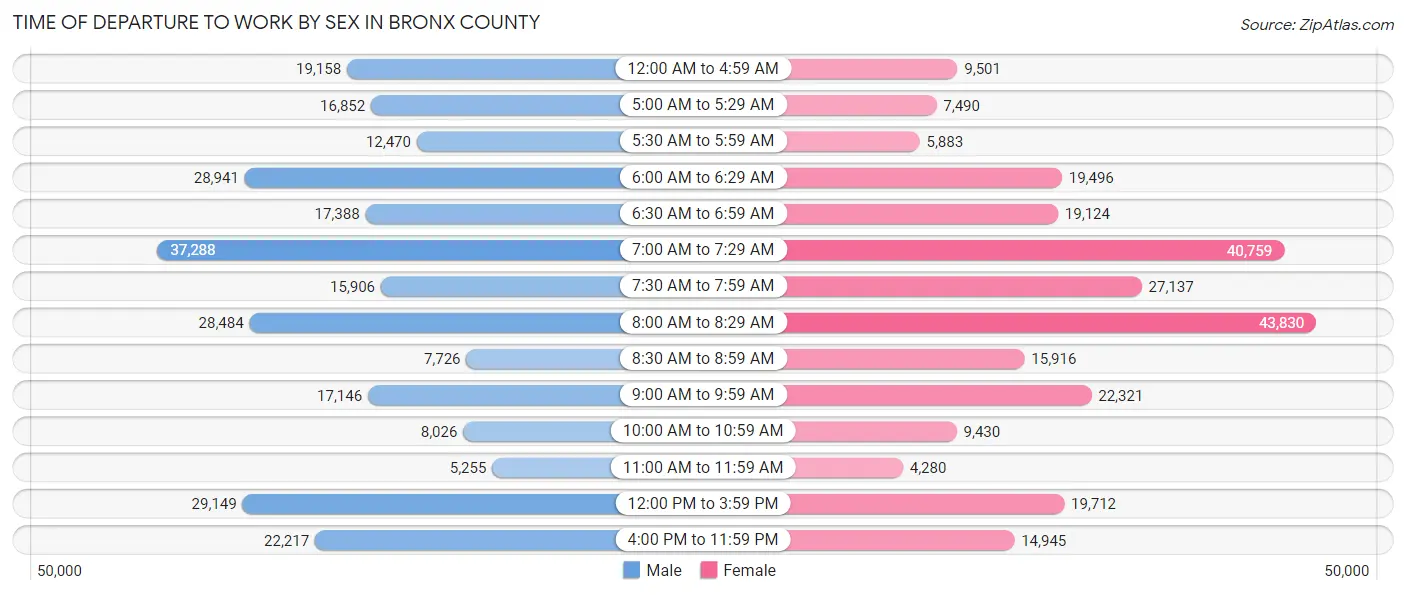
| Time of Departure | Male | Female |
| 12:00 AM to 4:59 AM | 19,158 (7.2%) | 9,501 (3.7%) |
| 5:00 AM to 5:29 AM | 16,852 (6.3%) | 7,490 (2.9%) |
| 5:30 AM to 5:59 AM | 12,470 (4.7%) | 5,883 (2.3%) |
| 6:00 AM to 6:29 AM | 28,941 (10.9%) | 19,496 (7.5%) |
| 6:30 AM to 6:59 AM | 17,388 (6.5%) | 19,124 (7.4%) |
| 7:00 AM to 7:29 AM | 37,288 (14.0%) | 40,759 (15.7%) |
| 7:30 AM to 7:59 AM | 15,906 (6.0%) | 27,137 (10.4%) |
| 8:00 AM to 8:29 AM | 28,484 (10.7%) | 43,830 (16.9%) |
| 8:30 AM to 8:59 AM | 7,726 (2.9%) | 15,916 (6.1%) |
| 9:00 AM to 9:59 AM | 17,146 (6.5%) | 22,321 (8.6%) |
| 10:00 AM to 10:59 AM | 8,026 (3.0%) | 9,430 (3.6%) |
| 11:00 AM to 11:59 AM | 5,255 (2.0%) | 4,280 (1.7%) |
| 12:00 PM to 3:59 PM | 29,149 (11.0%) | 19,712 (7.6%) |
| 4:00 PM to 11:59 PM | 22,217 (8.4%) | 14,945 (5.8%) |
| Total | 266,006 (100.0%) | 259,824 (100.0%) |
Housing Occupancy in Bronx County
Occupancy by Ownership in Bronx County
Of the total 525,387 dwellings in Bronx County, owner-occupied units account for 104,887 (20.0%), while renter-occupied units make up 420,500 (80.0%).
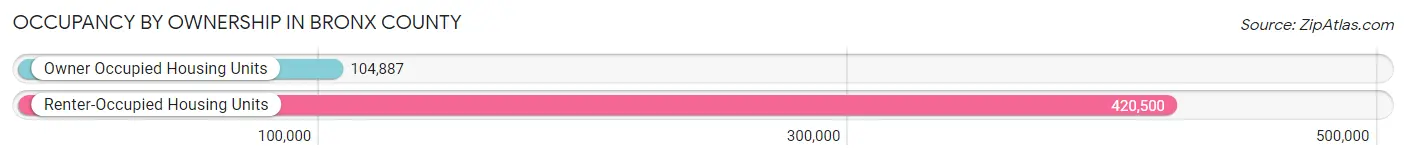
| Occupancy | # Housing Units | % Housing Units |
| Owner Occupied Housing Units | 104,887 | 20.0% |
| Renter-Occupied Housing Units | 420,500 | 80.0% |
| Total Occupied Housing Units | 525,387 | 100.0% |
Occupancy by Household Size in Bronx County
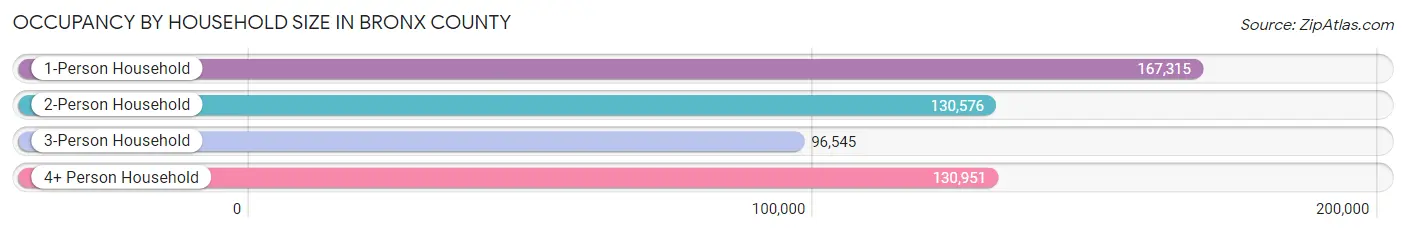
| Household Size | # Housing Units | % Housing Units |
| 1-Person Household | 167,315 | 31.9% |
| 2-Person Household | 130,576 | 24.8% |
| 3-Person Household | 96,545 | 18.4% |
| 4+ Person Household | 130,951 | 24.9% |
| Total Housing Units | 525,387 | 100.0% |
Occupancy by Ownership by Household Size in Bronx County
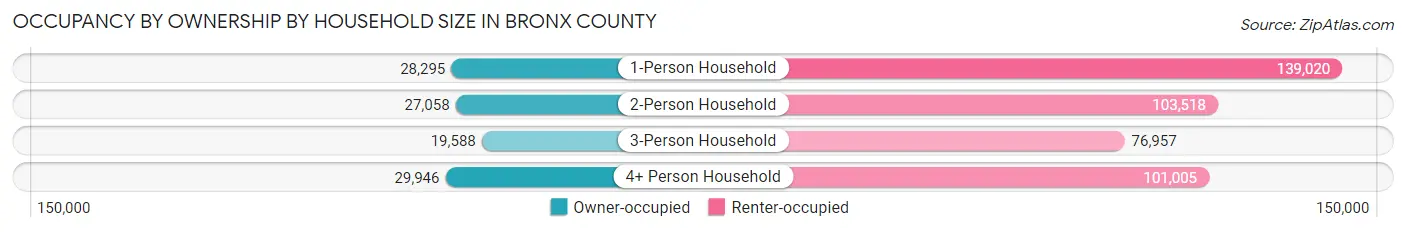
| Household Size | Owner-occupied | Renter-occupied |
| 1-Person Household | 28,295 (16.9%) | 139,020 (83.1%) |
| 2-Person Household | 27,058 (20.7%) | 103,518 (79.3%) |
| 3-Person Household | 19,588 (20.3%) | 76,957 (79.7%) |
| 4+ Person Household | 29,946 (22.9%) | 101,005 (77.1%) |
| Total Housing Units | 104,887 (20.0%) | 420,500 (80.0%) |
Occupancy by Educational Attainment in Bronx County
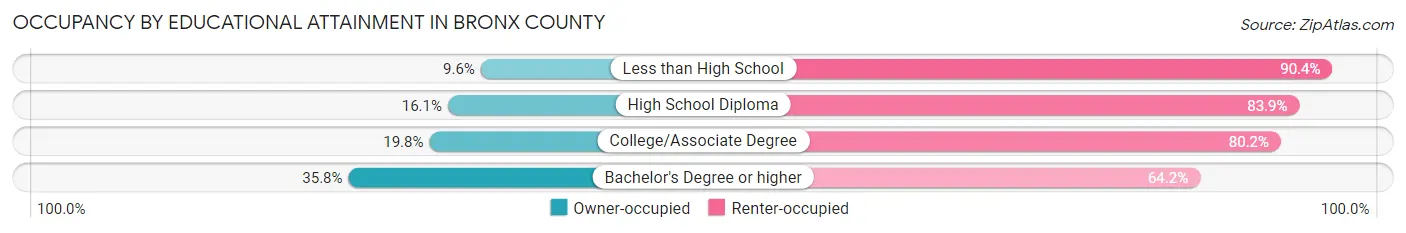
| Household Size | Owner-occupied | Renter-occupied |
| Less than High School | 12,194 (9.6%) | 115,049 (90.4%) |
| High School Diploma | 21,983 (16.1%) | 114,530 (83.9%) |
| College/Associate Degree | 28,318 (19.8%) | 114,937 (80.2%) |
| Bachelor's Degree or higher | 42,392 (35.8%) | 75,984 (64.2%) |
Occupancy by Age of Householder in Bronx County
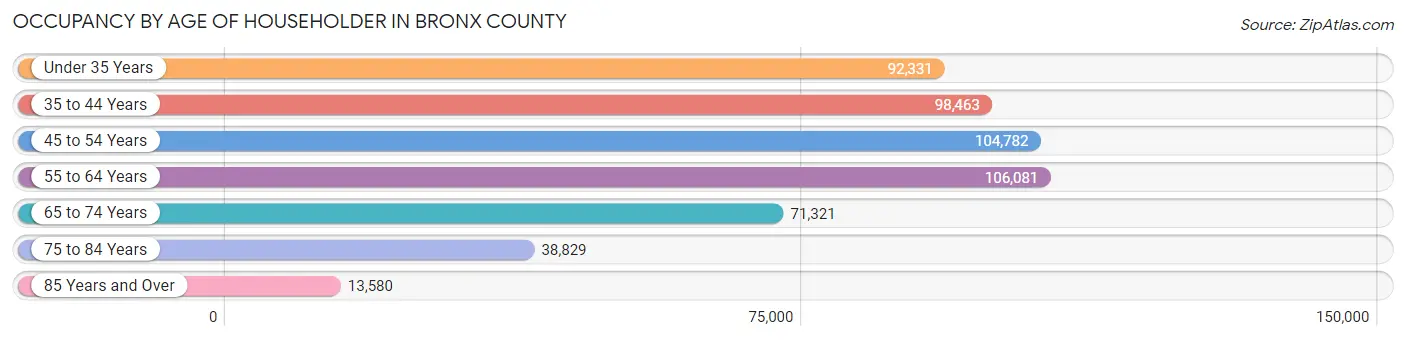
| Age Bracket | # Households | % Households |
| Under 35 Years | 92,331 | 17.6% |
| 35 to 44 Years | 98,463 | 18.7% |
| 45 to 54 Years | 104,782 | 19.9% |
| 55 to 64 Years | 106,081 | 20.2% |
| 65 to 74 Years | 71,321 | 13.6% |
| 75 to 84 Years | 38,829 | 7.4% |
| 85 Years and Over | 13,580 | 2.6% |
| Total | 525,387 | 100.0% |
Housing Finances in Bronx County
Median Income by Occupancy in Bronx County
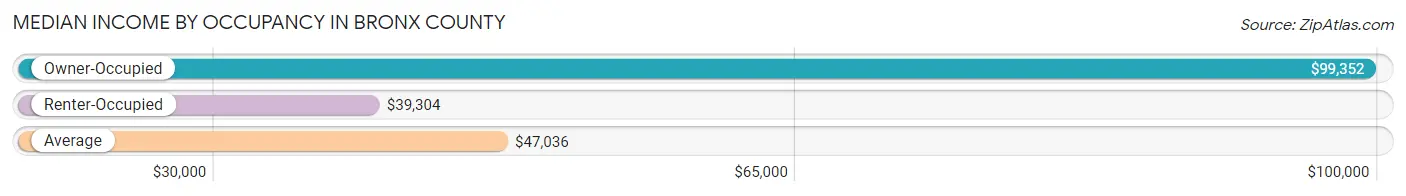
| Occupancy Type | # Households | Median Income |
| Owner-Occupied | 104,887 (20.0%) | $99,352 |
| Renter-Occupied | 420,500 (80.0%) | $39,304 |
| Average | 525,387 (100.0%) | $47,036 |
Occupancy by Householder Income Bracket in Bronx County
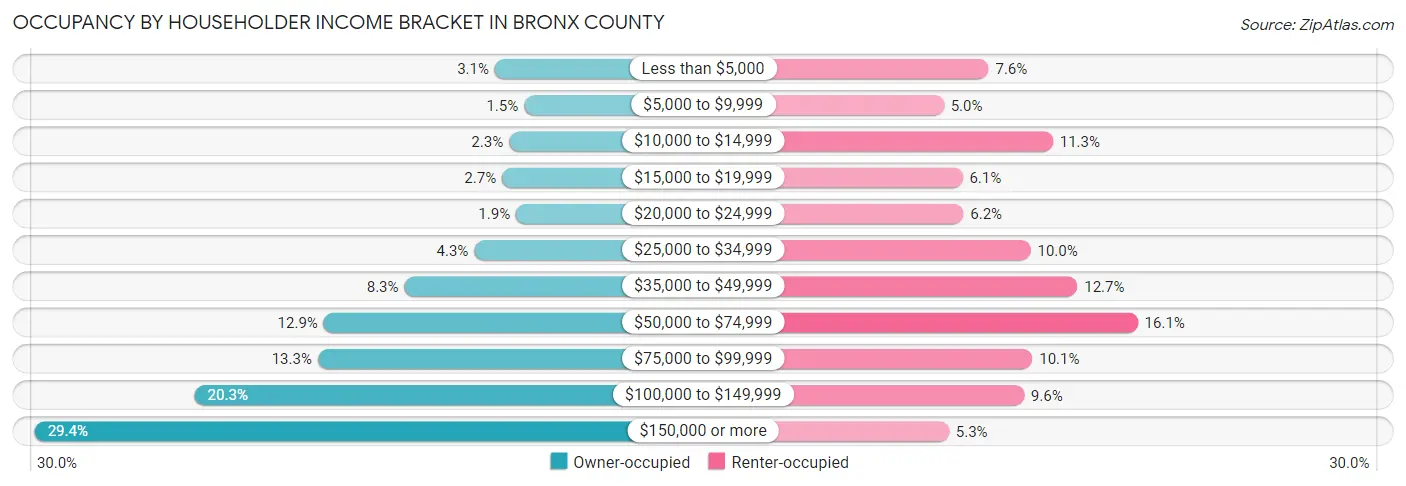
| Income Bracket | Owner-occupied | Renter-occupied |
| Less than $5,000 | 3,278 (3.1%) | 31,958 (7.6%) |
| $5,000 to $9,999 | 1,532 (1.5%) | 21,200 (5.0%) |
| $10,000 to $14,999 | 2,434 (2.3%) | 47,377 (11.3%) |
| $15,000 to $19,999 | 2,851 (2.7%) | 25,676 (6.1%) |
| $20,000 to $24,999 | 2,012 (1.9%) | 25,896 (6.2%) |
| $25,000 to $34,999 | 4,517 (4.3%) | 42,032 (10.0%) |
| $35,000 to $49,999 | 8,701 (8.3%) | 53,297 (12.7%) |
| $50,000 to $74,999 | 13,543 (12.9%) | 67,765 (16.1%) |
| $75,000 to $99,999 | 13,894 (13.3%) | 42,463 (10.1%) |
| $100,000 to $149,999 | 21,269 (20.3%) | 40,443 (9.6%) |
| $150,000 or more | 30,856 (29.4%) | 22,393 (5.3%) |
| Total | 104,887 (100.0%) | 420,500 (100.0%) |
Monthly Housing Cost Tiers in Bronx County
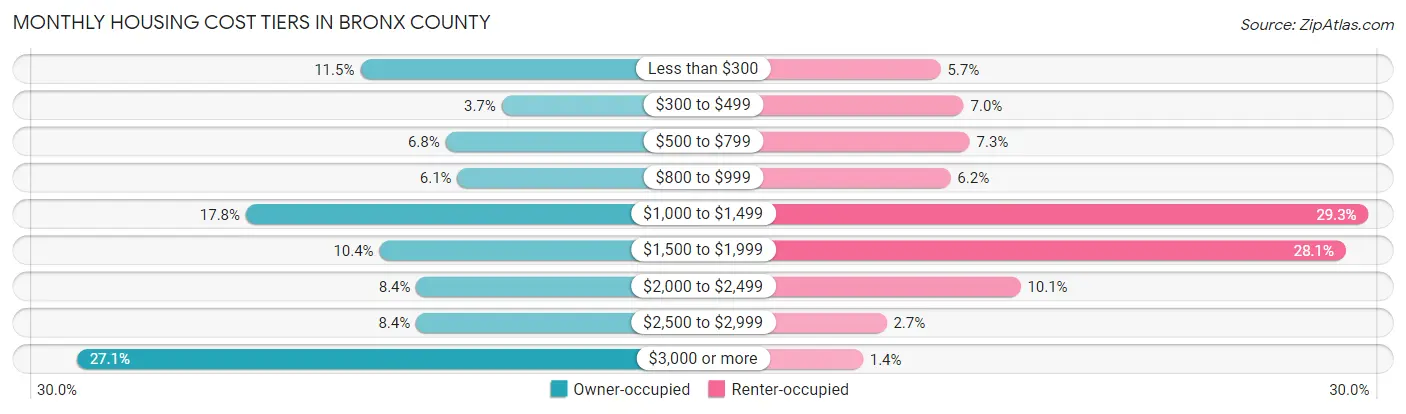
| Monthly Cost | Owner-occupied | Renter-occupied |
| Less than $300 | 12,023 (11.5%) | 23,920 (5.7%) |
| $300 to $499 | 3,832 (3.6%) | 29,291 (7.0%) |
| $500 to $799 | 7,085 (6.8%) | 30,692 (7.3%) |
| $800 to $999 | 6,390 (6.1%) | 26,255 (6.2%) |
| $1,000 to $1,499 | 18,650 (17.8%) | 123,344 (29.3%) |
| $1,500 to $1,999 | 10,907 (10.4%) | 118,094 (28.1%) |
| $2,000 to $2,499 | 8,773 (8.4%) | 42,494 (10.1%) |
| $2,500 to $2,999 | 8,786 (8.4%) | 11,382 (2.7%) |
| $3,000 or more | 28,441 (27.1%) | 5,876 (1.4%) |
| Total | 104,887 (100.0%) | 420,500 (100.0%) |
Physical Housing Characteristics in Bronx County
Housing Structures in Bronx County
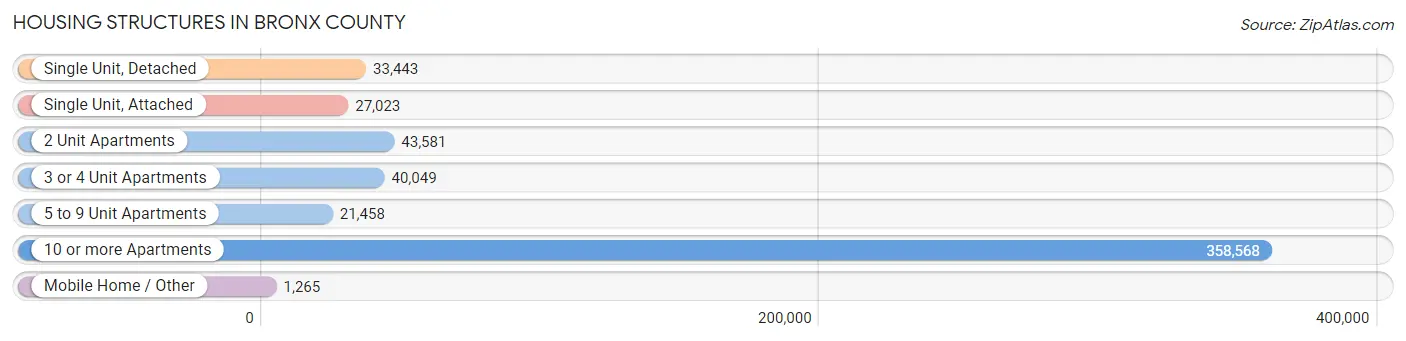
| Structure Type | # Housing Units | % Housing Units |
| Single Unit, Detached | 33,443 | 6.4% |
| Single Unit, Attached | 27,023 | 5.1% |
| 2 Unit Apartments | 43,581 | 8.3% |
| 3 or 4 Unit Apartments | 40,049 | 7.6% |
| 5 to 9 Unit Apartments | 21,458 | 4.1% |
| 10 or more Apartments | 358,568 | 68.2% |
| Mobile Home / Other | 1,265 | 0.2% |
| Total | 525,387 | 100.0% |
Housing Structures by Occupancy in Bronx County
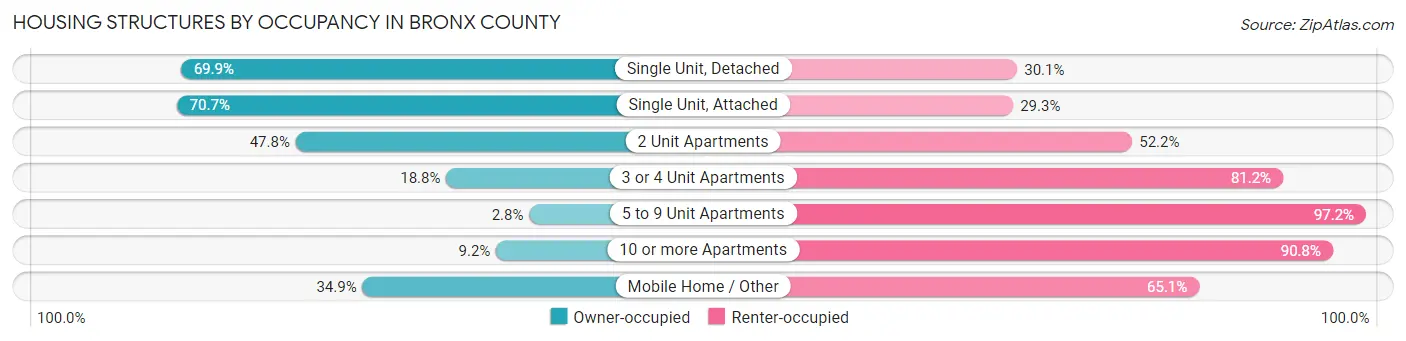
| Structure Type | Owner-occupied | Renter-occupied |
| Single Unit, Detached | 23,391 (69.9%) | 10,052 (30.1%) |
| Single Unit, Attached | 19,112 (70.7%) | 7,911 (29.3%) |
| 2 Unit Apartments | 20,831 (47.8%) | 22,750 (52.2%) |
| 3 or 4 Unit Apartments | 7,531 (18.8%) | 32,518 (81.2%) |
| 5 to 9 Unit Apartments | 606 (2.8%) | 20,852 (97.2%) |
| 10 or more Apartments | 32,974 (9.2%) | 325,594 (90.8%) |
| Mobile Home / Other | 442 (34.9%) | 823 (65.1%) |
| Total | 104,887 (20.0%) | 420,500 (80.0%) |
Housing Structures by Number of Rooms in Bronx County
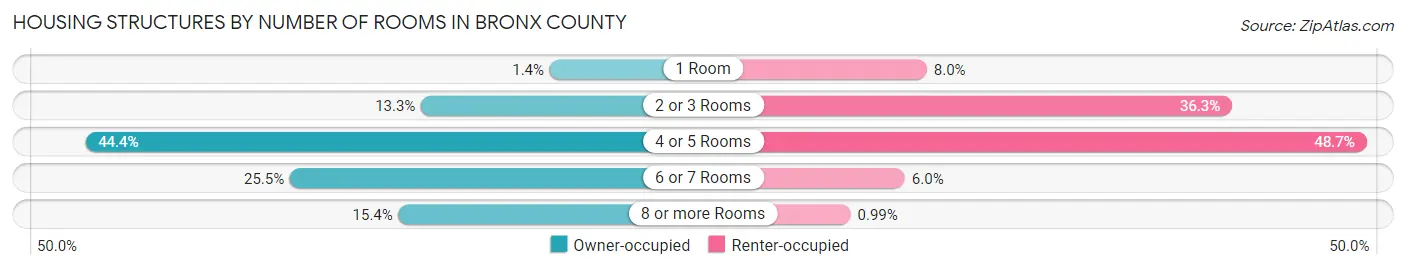
| Number of Rooms | Owner-occupied | Renter-occupied |
| 1 Room | 1,490 (1.4%) | 33,797 (8.0%) |
| 2 or 3 Rooms | 13,976 (13.3%) | 152,461 (36.3%) |
| 4 or 5 Rooms | 46,555 (44.4%) | 204,782 (48.7%) |
| 6 or 7 Rooms | 26,698 (25.5%) | 25,287 (6.0%) |
| 8 or more Rooms | 16,168 (15.4%) | 4,173 (1.0%) |
| Total | 104,887 (100.0%) | 420,500 (100.0%) |
Housing Structure by Heating Type in Bronx County
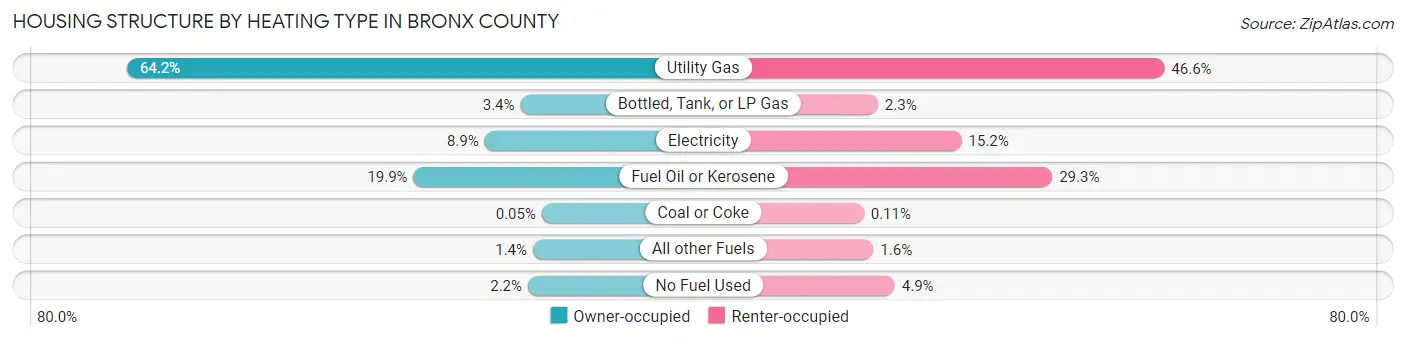
| Heating Type | Owner-occupied | Renter-occupied |
| Utility Gas | 67,303 (64.2%) | 195,907 (46.6%) |
| Bottled, Tank, or LP Gas | 3,522 (3.4%) | 9,670 (2.3%) |
| Electricity | 9,334 (8.9%) | 64,095 (15.2%) |
| Fuel Oil or Kerosene | 20,863 (19.9%) | 123,016 (29.2%) |
| Coal or Coke | 52 (0.1%) | 443 (0.1%) |
| All other Fuels | 1,505 (1.4%) | 6,730 (1.6%) |
| No Fuel Used | 2,308 (2.2%) | 20,639 (4.9%) |
| Total | 104,887 (100.0%) | 420,500 (100.0%) |
Household Vehicle Usage in Bronx County
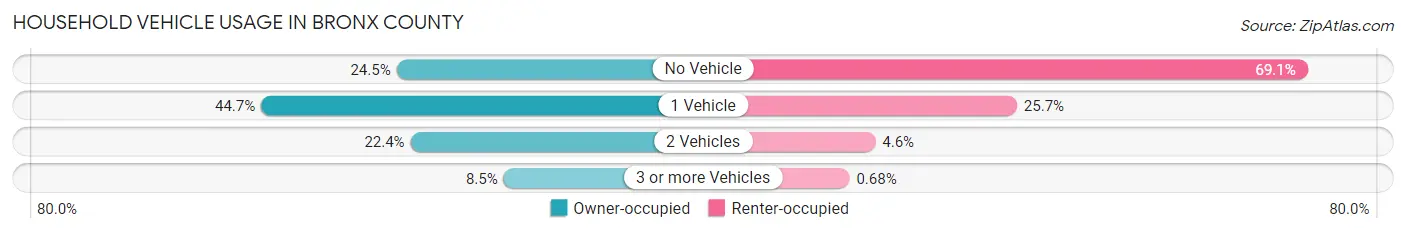
| Vehicles per Household | Owner-occupied | Renter-occupied |
| No Vehicle | 25,658 (24.5%) | 290,507 (69.1%) |
| 1 Vehicle | 46,873 (44.7%) | 108,030 (25.7%) |
| 2 Vehicles | 23,467 (22.4%) | 19,120 (4.5%) |
| 3 or more Vehicles | 8,889 (8.5%) | 2,843 (0.7%) |
| Total | 104,887 (100.0%) | 420,500 (100.0%) |
Real Estate & Mortgages in Bronx County
Real Estate and Mortgage Overview in Bronx County
| Characteristic | Without Mortgage | With Mortgage |
| Housing Units | 45,421 | 59,466 |
| Median Property Value | $384,900 | $559,500 |
| Median Household Income | $77,537 | $21,322 |
| Monthly Housing Costs | $949 | $28,124 |
| Real Estate Taxes | $4,574 | $6,870 |
Property Value by Mortgage Status in Bronx County
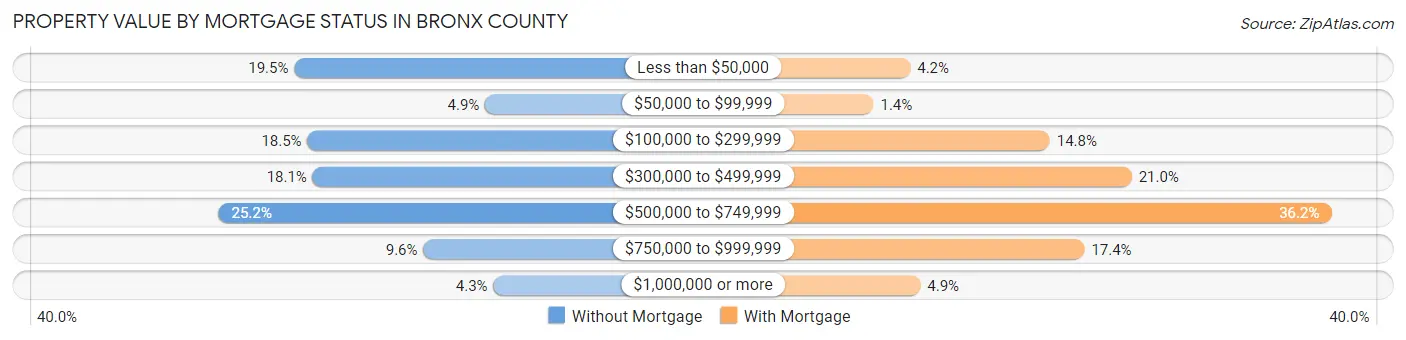
| Property Value | Without Mortgage | With Mortgage |
| Less than $50,000 | 8,836 (19.5%) | 2,478 (4.2%) |
| $50,000 to $99,999 | 2,232 (4.9%) | 815 (1.4%) |
| $100,000 to $299,999 | 8,382 (18.4%) | 8,802 (14.8%) |
| $300,000 to $499,999 | 8,200 (18.0%) | 12,511 (21.0%) |
| $500,000 to $749,999 | 11,455 (25.2%) | 21,550 (36.2%) |
| $750,000 to $999,999 | 4,370 (9.6%) | 10,373 (17.4%) |
| $1,000,000 or more | 1,946 (4.3%) | 2,937 (4.9%) |
| Total | 45,421 (100.0%) | 59,466 (100.0%) |
Household Income by Mortgage Status in Bronx County
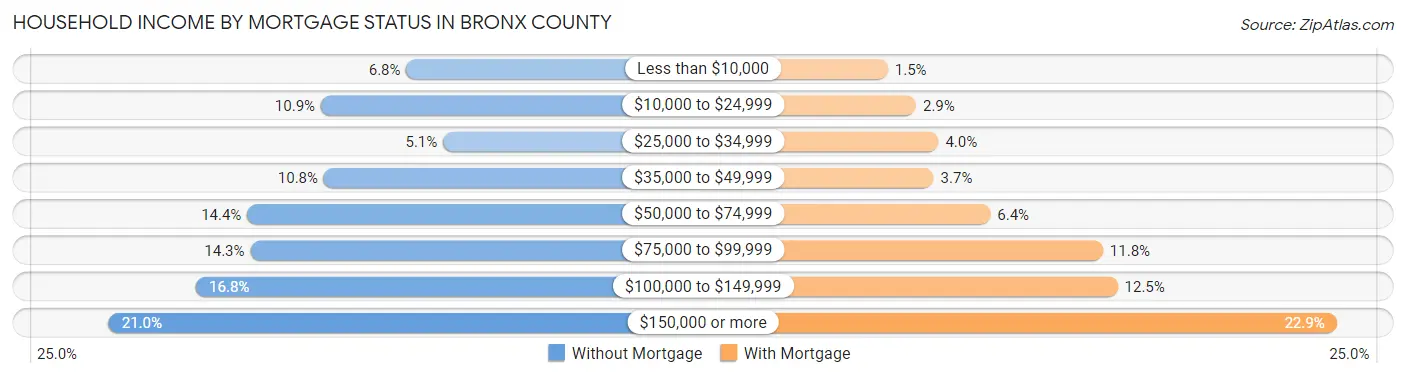
| Household Income | Without Mortgage | With Mortgage |
| Less than $10,000 | 3,097 (6.8%) | 913 (1.5%) |
| $10,000 to $24,999 | 4,947 (10.9%) | 1,713 (2.9%) |
| $25,000 to $34,999 | 2,302 (5.1%) | 2,350 (4.0%) |
| $35,000 to $49,999 | 4,884 (10.7%) | 2,215 (3.7%) |
| $50,000 to $74,999 | 6,540 (14.4%) | 3,817 (6.4%) |
| $75,000 to $99,999 | 6,471 (14.2%) | 7,003 (11.8%) |
| $100,000 to $149,999 | 7,646 (16.8%) | 7,423 (12.5%) |
| $150,000 or more | 9,534 (21.0%) | 13,623 (22.9%) |
| Total | 45,421 (100.0%) | 59,466 (100.0%) |
Property Value to Household Income Ratio in Bronx County
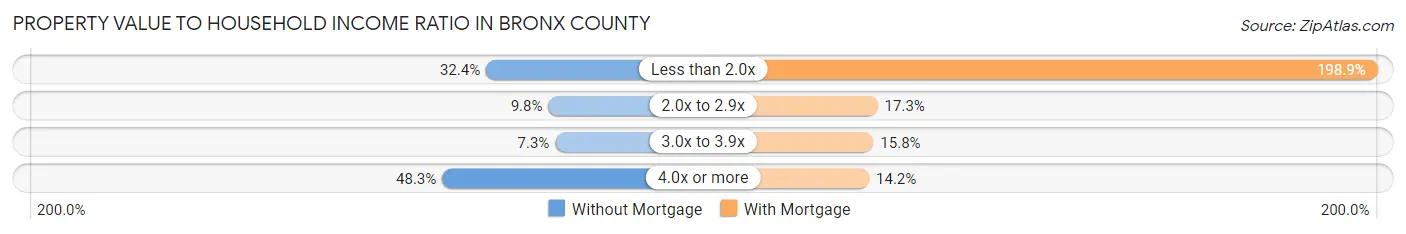
| Value-to-Income Ratio | Without Mortgage | With Mortgage |
| Less than 2.0x | 14,727 (32.4%) | 118,300 (198.9%) |
| 2.0x to 2.9x | 4,438 (9.8%) | 10,310 (17.3%) |
| 3.0x to 3.9x | 3,301 (7.3%) | 9,388 (15.8%) |
| 4.0x or more | 21,957 (48.3%) | 8,465 (14.2%) |
| Total | 45,421 (100.0%) | 59,466 (100.0%) |
Real Estate Taxes by Mortgage Status in Bronx County
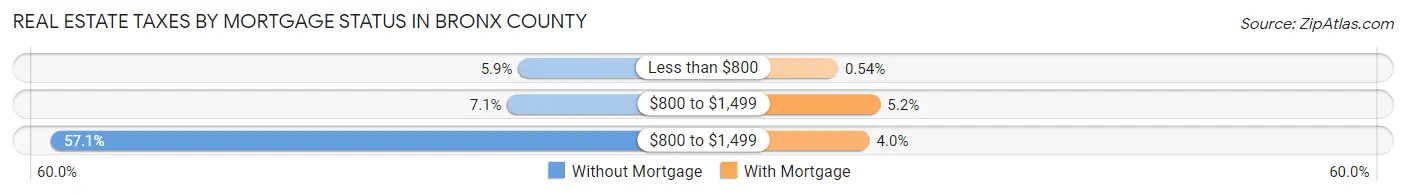
| Property Taxes | Without Mortgage | With Mortgage |
| Less than $800 | 2,679 (5.9%) | 320 (0.5%) |
| $800 to $1,499 | 3,219 (7.1%) | 3,084 (5.2%) |
| $800 to $1,499 | 25,935 (57.1%) | 2,387 (4.0%) |
| Total | 45,421 (100.0%) | 59,466 (100.0%) |
Health & Disability in Bronx County
Health Insurance Coverage by Age in Bronx County
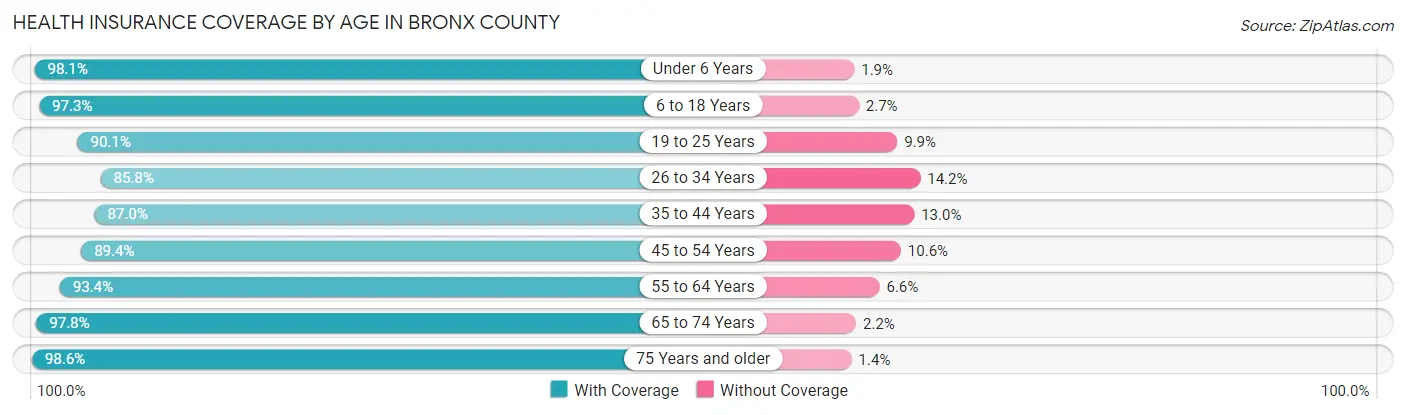
| Age Bracket | With Coverage | Without Coverage |
| Under 6 Years | 115,346 (98.1%) | 2,181 (1.9%) |
| 6 to 18 Years | 249,973 (97.3%) | 6,955 (2.7%) |
| 19 to 25 Years | 131,568 (90.1%) | 14,431 (9.9%) |
| 26 to 34 Years | 169,934 (85.8%) | 28,046 (14.2%) |
| 35 to 44 Years | 159,009 (87.0%) | 23,839 (13.0%) |
| 45 to 54 Years | 156,569 (89.4%) | 18,492 (10.6%) |
| 55 to 64 Years | 155,236 (93.4%) | 10,924 (6.6%) |
| 65 to 74 Years | 103,811 (97.8%) | 2,332 (2.2%) |
| 75 Years and older | 75,639 (98.6%) | 1,051 (1.4%) |
| Total | 1,317,085 (92.4%) | 108,251 (7.6%) |
Health Insurance Coverage by Citizenship Status in Bronx County
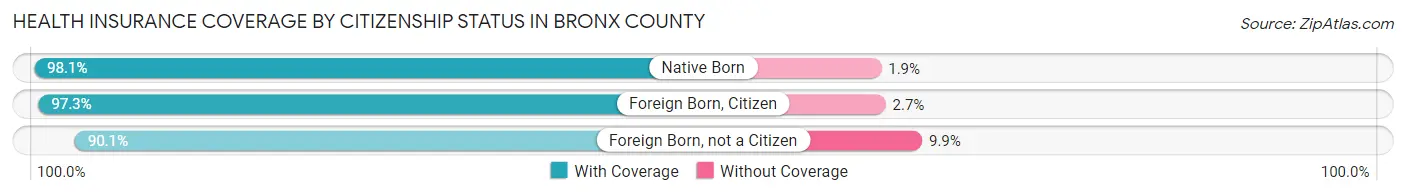
| Citizenship Status | With Coverage | Without Coverage |
| Native Born | 115,346 (98.1%) | 2,181 (1.9%) |
| Foreign Born, Citizen | 249,973 (97.3%) | 6,955 (2.7%) |
| Foreign Born, not a Citizen | 131,568 (90.1%) | 14,431 (9.9%) |
Health Insurance Coverage by Household Income in Bronx County
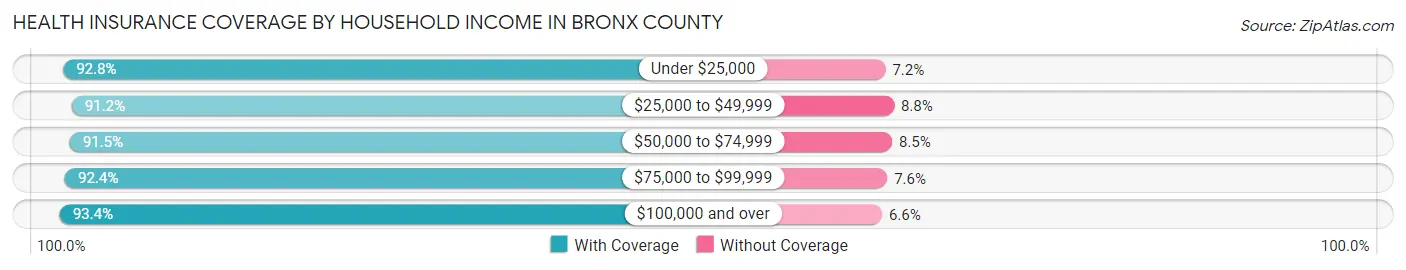
| Household Income | With Coverage | Without Coverage |
| Under $25,000 | 306,948 (92.8%) | 23,940 (7.2%) |
| $25,000 to $49,999 | 246,455 (91.2%) | 23,908 (8.8%) |
| $50,000 to $74,999 | 203,438 (91.5%) | 18,839 (8.5%) |
| $75,000 to $99,999 | 153,173 (92.4%) | 12,558 (7.6%) |
| $100,000 and over | 372,980 (93.4%) | 26,328 (6.6%) |
Public vs Private Health Insurance Coverage by Age in Bronx County
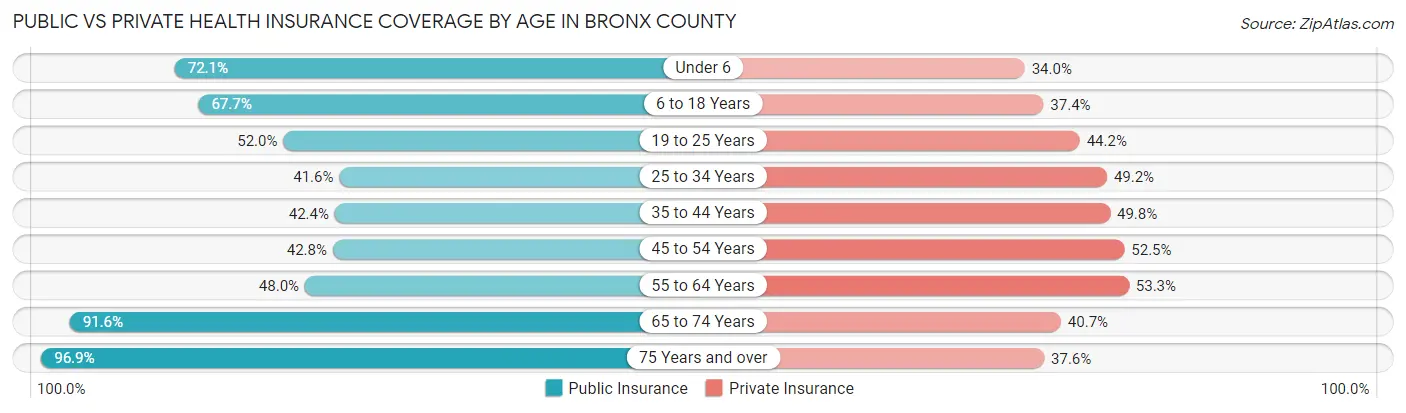
| Age Bracket | Public Insurance | Private Insurance |
| Under 6 | 84,765 (72.1%) | 39,918 (34.0%) |
| 6 to 18 Years | 173,999 (67.7%) | 96,148 (37.4%) |
| 19 to 25 Years | 75,884 (52.0%) | 64,492 (44.2%) |
| 25 to 34 Years | 82,331 (41.6%) | 97,453 (49.2%) |
| 35 to 44 Years | 77,564 (42.4%) | 91,045 (49.8%) |
| 45 to 54 Years | 74,914 (42.8%) | 91,815 (52.4%) |
| 55 to 64 Years | 79,711 (48.0%) | 88,537 (53.3%) |
| 65 to 74 Years | 97,226 (91.6%) | 43,169 (40.7%) |
| 75 Years and over | 74,308 (96.9%) | 28,799 (37.6%) |
| Total | 820,702 (57.6%) | 641,376 (45.0%) |
Disability Status by Sex by Age in Bronx County
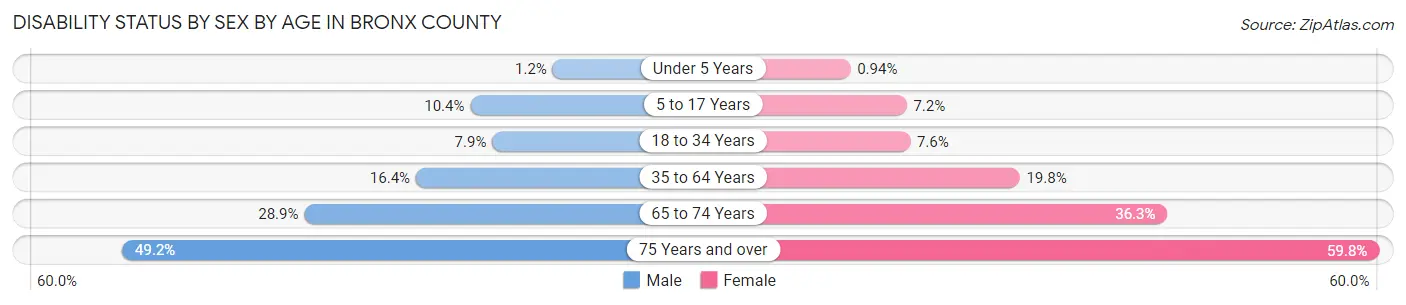
| Age Bracket | Male | Female |
| Under 5 Years | 604 (1.2%) | 457 (0.9%) |
| 5 to 17 Years | 13,539 (10.4%) | 9,032 (7.2%) |
| 18 to 34 Years | 14,029 (7.9%) | 14,095 (7.6%) |
| 35 to 64 Years | 39,691 (16.4%) | 55,898 (19.8%) |
| 65 to 74 Years | 13,090 (28.8%) | 22,027 (36.2%) |
| 75 Years and over | 13,204 (49.2%) | 29,818 (59.8%) |
Disability Class by Sex by Age in Bronx County
Disability Class: Hearing Difficulty
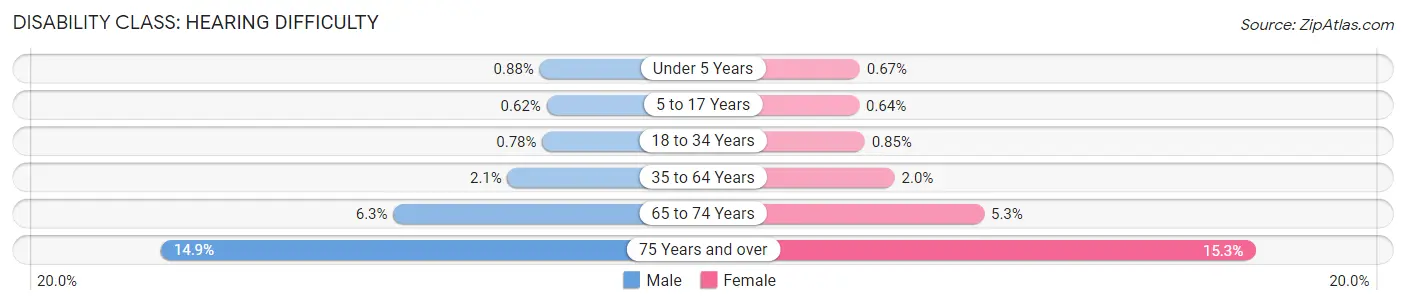
| Age Bracket | Male | Female |
| Under 5 Years | 444 (0.9%) | 327 (0.7%) |
| 5 to 17 Years | 814 (0.6%) | 801 (0.6%) |
| 18 to 34 Years | 1,377 (0.8%) | 1,581 (0.9%) |
| 35 to 64 Years | 5,000 (2.1%) | 5,546 (2.0%) |
| 65 to 74 Years | 2,863 (6.3%) | 3,209 (5.3%) |
| 75 Years and over | 4,012 (14.9%) | 7,644 (15.3%) |
Disability Class: Vision Difficulty
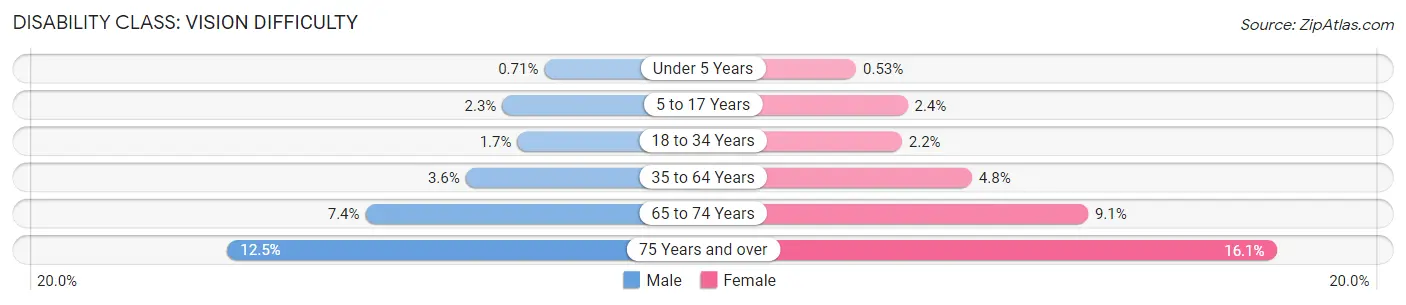
| Age Bracket | Male | Female |
| Under 5 Years | 357 (0.7%) | 258 (0.5%) |
| 5 to 17 Years | 2,967 (2.3%) | 3,056 (2.4%) |
| 18 to 34 Years | 3,028 (1.7%) | 4,147 (2.2%) |
| 35 to 64 Years | 8,774 (3.6%) | 13,642 (4.8%) |
| 65 to 74 Years | 3,337 (7.3%) | 5,557 (9.1%) |
| 75 Years and over | 3,348 (12.5%) | 8,039 (16.1%) |
Disability Class: Cognitive Difficulty
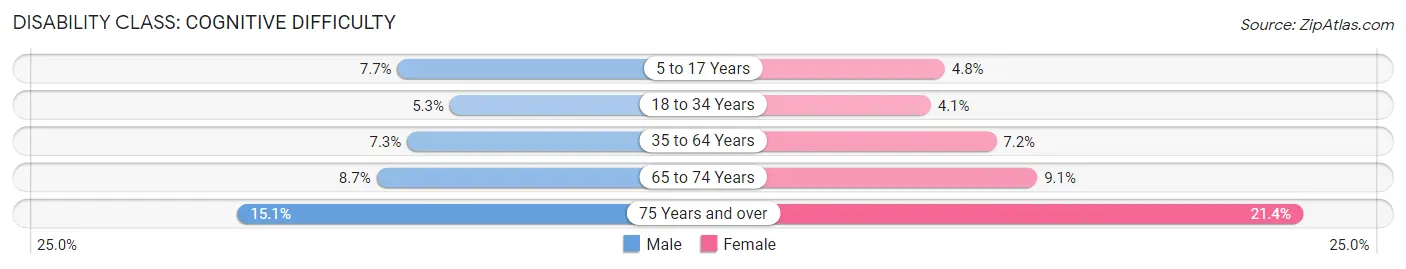
| Age Bracket | Male | Female |
| 5 to 17 Years | 10,058 (7.7%) | 5,997 (4.8%) |
| 18 to 34 Years | 9,338 (5.3%) | 7,678 (4.1%) |
| 35 to 64 Years | 17,516 (7.2%) | 20,251 (7.2%) |
| 65 to 74 Years | 3,932 (8.7%) | 5,513 (9.1%) |
| 75 Years and over | 4,062 (15.1%) | 10,661 (21.4%) |
Disability Class: Ambulatory Difficulty
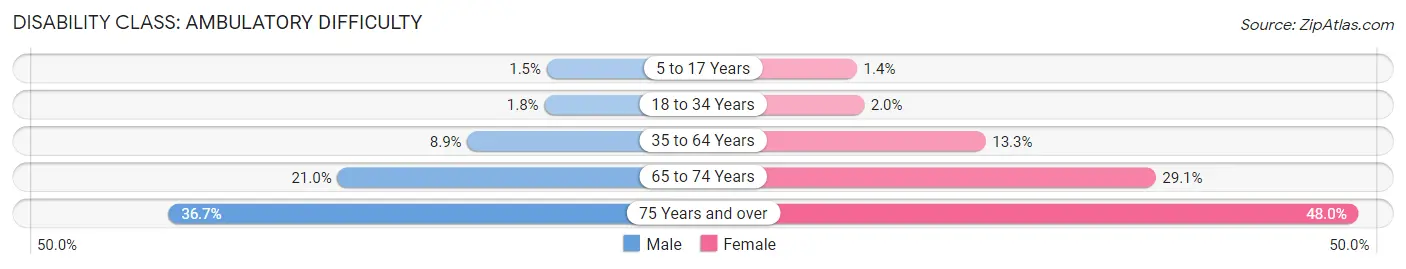
| Age Bracket | Male | Female |
| 5 to 17 Years | 1,998 (1.5%) | 1,733 (1.4%) |
| 18 to 34 Years | 3,126 (1.8%) | 3,781 (2.0%) |
| 35 to 64 Years | 21,517 (8.9%) | 37,613 (13.3%) |
| 65 to 74 Years | 9,512 (21.0%) | 17,683 (29.1%) |
| 75 Years and over | 9,847 (36.7%) | 23,895 (47.9%) |
Disability Class: Self-Care Difficulty
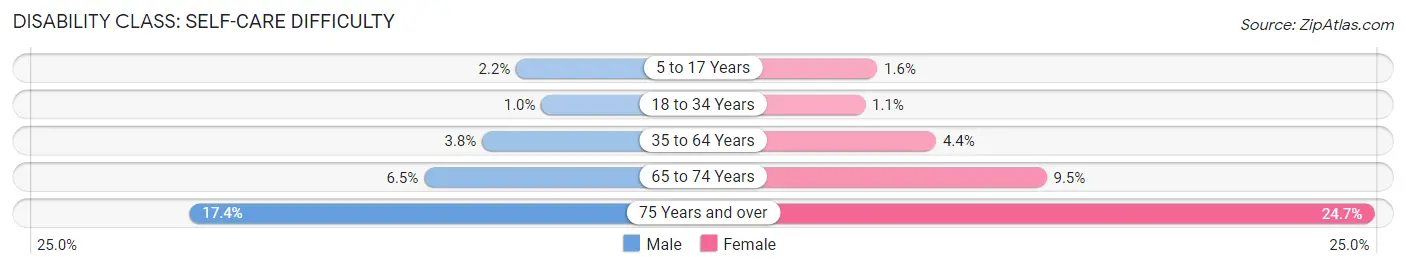
| Age Bracket | Male | Female |
| 5 to 17 Years | 2,856 (2.2%) | 2,056 (1.6%) |
| 18 to 34 Years | 1,803 (1.0%) | 2,004 (1.1%) |
| 35 to 64 Years | 9,121 (3.8%) | 12,336 (4.4%) |
| 65 to 74 Years | 2,930 (6.5%) | 5,771 (9.5%) |
| 75 Years and over | 4,660 (17.3%) | 12,307 (24.7%) |
Technology Access in Bronx County
Computing Device Access in Bronx County
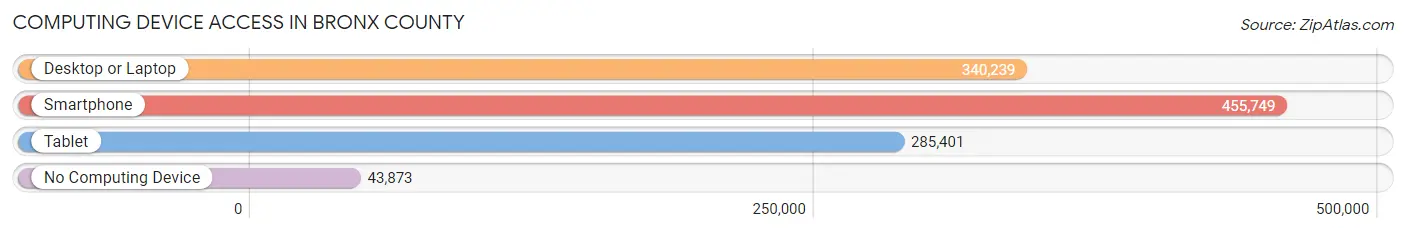
| Device Type | # Households | % Households |
| Desktop or Laptop | 340,239 | 64.8% |
| Smartphone | 455,749 | 86.8% |
| Tablet | 285,401 | 54.3% |
| No Computing Device | 43,873 | 8.4% |
| Total | 525,387 | 100.0% |
Internet Access in Bronx County
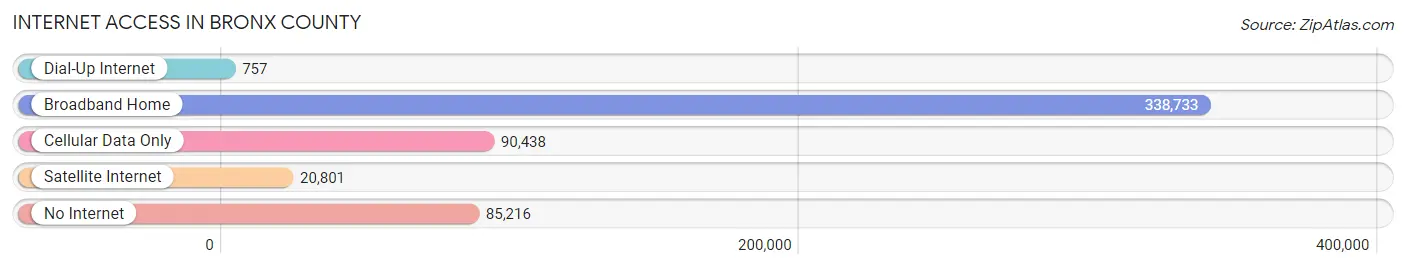
| Internet Type | # Households | % Households |
| Dial-Up Internet | 757 | 0.1% |
| Broadband Home | 338,733 | 64.5% |
| Cellular Data Only | 90,438 | 17.2% |
| Satellite Internet | 20,801 | 4.0% |
| No Internet | 85,216 | 16.2% |
| Total | 525,387 | 100.0% |
Bronx County Summary
Bronx County, NY is located in the southeastern part of New York State and is part of the five boroughs of New York City. It is the northernmost of the five boroughs and is the only one located on the mainland. Bronx County is the fourth most populous county in New York State and the third most densely populated county in the United States.
History
The Bronx was originally inhabited by the Lenape Native Americans. The first European settlers arrived in 1639 and the area was named after the Swedish sea captain Jonas Bronck. The area was part of Westchester County until 1874 when it became part of New York City. The Bronx was the site of the first subway line in the United States, which opened in 1904. The Bronx was also the site of the first major league baseball stadium, which opened in 1923.
The Bronx experienced a period of rapid growth in the early 20th century, with the population increasing from 200,000 in 1900 to 1.2 million in 1930. This growth was largely due to the influx of immigrants from Europe, particularly from Italy and Ireland. The Bronx also experienced a period of decline in the mid-20th century, with the population dropping from 1.2 million in 1930 to 1 million in 1970. This decline was largely due to the out-migration of middle-class residents to the suburbs.
Geography
The Bronx is located in the southeastern part of New York State and is bordered by Westchester County to the north, the Hudson River to the east, Long Island Sound to the south, and the East River to the west. The Bronx is divided into four distinct areas: the South Bronx, the North Bronx, the East Bronx, and the West Bronx. The South Bronx is the most densely populated area and is home to many of the borough’s poorest neighborhoods. The North Bronx is the least densely populated area and is home to many of the borough’s wealthier neighborhoods. The East Bronx is home to the Bronx Zoo and the New York Botanical Garden. The West Bronx is home to the Bronx River and the New York Yankees’ home stadium, Yankee Stadium.
Economy
The Bronx has a diverse economy, with a mix of manufacturing, retail, and service industries. The borough is home to several major employers, including Montefiore Medical Center, the New York City Department of Education, and the New York City Police Department. The Bronx is also home to several major retail centers, including the Bronx Terminal Market and the Bronx Mall.
The Bronx has a large manufacturing sector, with major employers including the Ford Motor Company, PepsiCo, and the New York Times. The borough is also home to several major healthcare providers, including Montefiore Medical Center, Jacobi Medical Center, and Bronx-Lebanon Hospital Center.
Demographics
As of the 2010 census, the population of Bronx County was 1,385,108. The population is racially and ethnically diverse, with the largest racial/ethnic groups being Hispanic (50.6%), African American (25.8%), and White (17.9%). The median household income in the Bronx is $34,922, which is lower than the median household income for New York City as a whole ($50,711). The poverty rate in the Bronx is 28.6%, which is higher than the poverty rate for New York City as a whole (20.9%).
Conclusion
Bronx County, NY is a diverse and vibrant county located in the southeastern part of New York State. It is the fourth most populous county in New York State and the third most densely populated county in the United States. The Bronx has a diverse economy, with a mix of manufacturing, retail, and service industries. The population of Bronx County is racially and ethnically diverse, with the largest racial/ethnic groups being Hispanic, African American, and White. The median household income in the Bronx is lower than the median household income for New York City as a whole, and the poverty rate in the Bronx is higher than the poverty rate for New York City as a whole.
Common Questions
What is the Total Population of Bronx County?
Total Population of Bronx County is 1,443,229.
What is the Total Male Population of Bronx County?
Total Male Population of Bronx County is 683,349.
What is the Total Female Population of Bronx County?
Total Female Population of Bronx County is 759,880.
What is the Ratio of Males per 100 Females in Bronx County?
There are 89.93 Males per 100 Females in Bronx County.
What is the Ratio of Females per 100 Males in Bronx County?
There are 111.20 Females per 100 Males in Bronx County.
What is the Median Population Age in Bronx County?
Median Population Age in Bronx County is 35.0 Years.
What is the Average Family Size in Bronx County
Average Family Size in Bronx County is 3.4 People.
What is the Average Household Size in Bronx County
Average Household Size in Bronx County is 2.6 People.
What is Per Capita Income in Bronx County?
Per Capita income in Bronx County is $25,845.
What is the Median Family Income in Bronx County?
Median Family Income in Bronx County is $56,539.
What is the Median Household income in Bronx County?
Median Household Income in Bronx County is $47,036.
What is Income or Wage Gap in Bronx County?
Income or Wage Gap in Bronx County is 16.2%.
Women in Bronx County earn 83.8 cents for every dollar earned by a man.
What is Family Income Deficit in Bronx County?
Family Income Deficit in Bronx County is $11,945.
Families that are below poverty line in Bronx County earn $11,945 less on average than the poverty threshold level.
What is Inequality or Gini Index in Bronx County?
Inequality or Gini Index in Bronx County is 0.51.
How Large is the Labor Force in Bronx County?
There are 658,056 People in the Labor Forcein in Bronx County.
What is the Percentage of People in the Labor Force in Bronx County?
58.4% of People are in the Labor Force in Bronx County.
What is the Unemployment Rate in Bronx County?
Unemployment Rate in Bronx County is 11.2%.