Clyde, NJ
Clyde Map
Clyde Overview
76
TOTAL POPULATION
35
MALE POPULATION
41
FEMALE POPULATION
85.37
MALES / 100 FEMALES
117.14
FEMALES / 100 MALES
69.5
MEDIAN AGE
2.1
AVG FAMILY SIZE
1.9
AVG HOUSEHOLD SIZE
$54,029
PER CAPITA INCOME
$98,846
AVG FAMILY INCOME
$99,423
AVG HOUSEHOLD INCOME
0.07
INEQUALITY / GINI INDEX
11
LABOR FORCE [ PEOPLE ]
14.5%
PERCENT IN LABOR FORCE
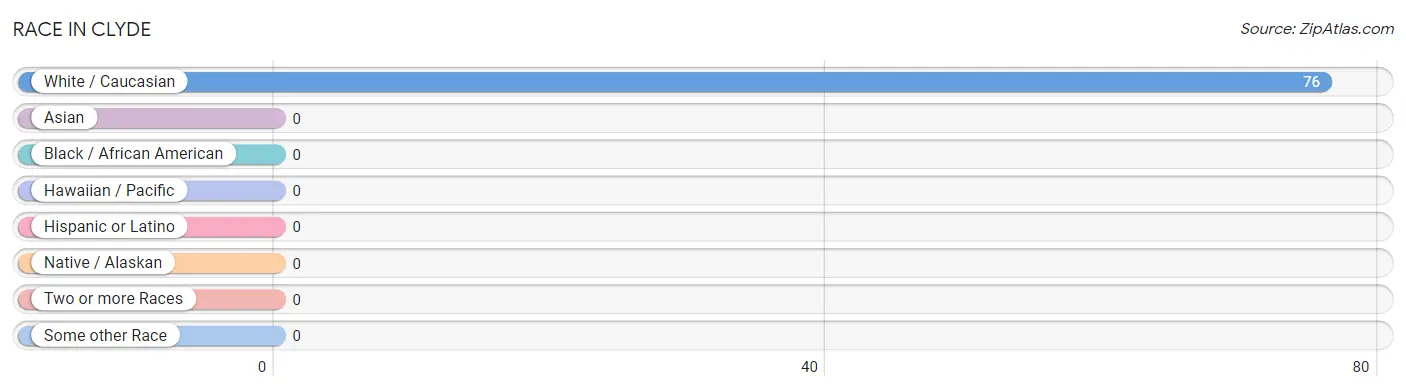
Race in Clyde
The most populous races in Clyde are , and White / Caucasian (76 | 100.0%).
| Race | # Population | % Population |
| Asian | 0 | 0.0% |
| Black / African American | 0 | 0.0% |
| Hawaiian / Pacific | 0 | 0.0% |
| Hispanic or Latino | 0 | 0.0% |
| Native / Alaskan | 0 | 0.0% |
| White / Caucasian | 76 | 100.0% |
| Two or more Races | 0 | 0.0% |
| Some other Race | 0 | 0.0% |
| Total | 76 | 100.0% |
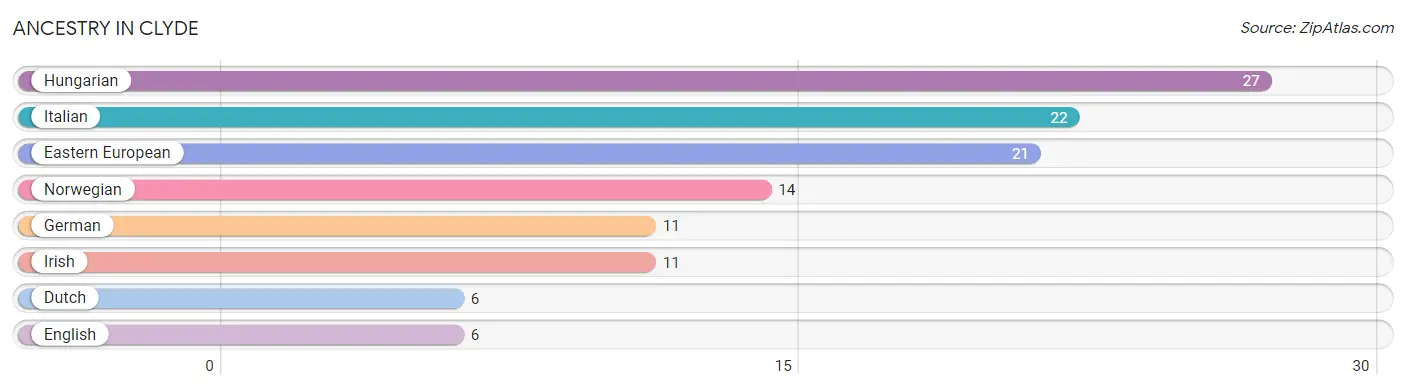
Ancestry in Clyde
The most populous ancestries reported in Clyde are Hungarian (27 | 35.5%), Italian (22 | 28.9%), Eastern European (21 | 27.6%), Norwegian (14 | 18.4%), and German (11 | 14.5%), together accounting for 125.0% of all Clyde residents.
| Ancestry | # Population | % Population |
| Dutch | 6 | 7.9% |
| Eastern European | 21 | 27.6% |
| English | 6 | 7.9% |
| German | 11 | 14.5% |
| Hungarian | 27 | 35.5% |
| Irish | 11 | 14.5% |
| Italian | 22 | 28.9% |
| Norwegian | 14 | 18.4% | View All 8 Rows |
Immigrants in Clyde

| Immigration Origin | # Population | % Population | View All 0 Rows |
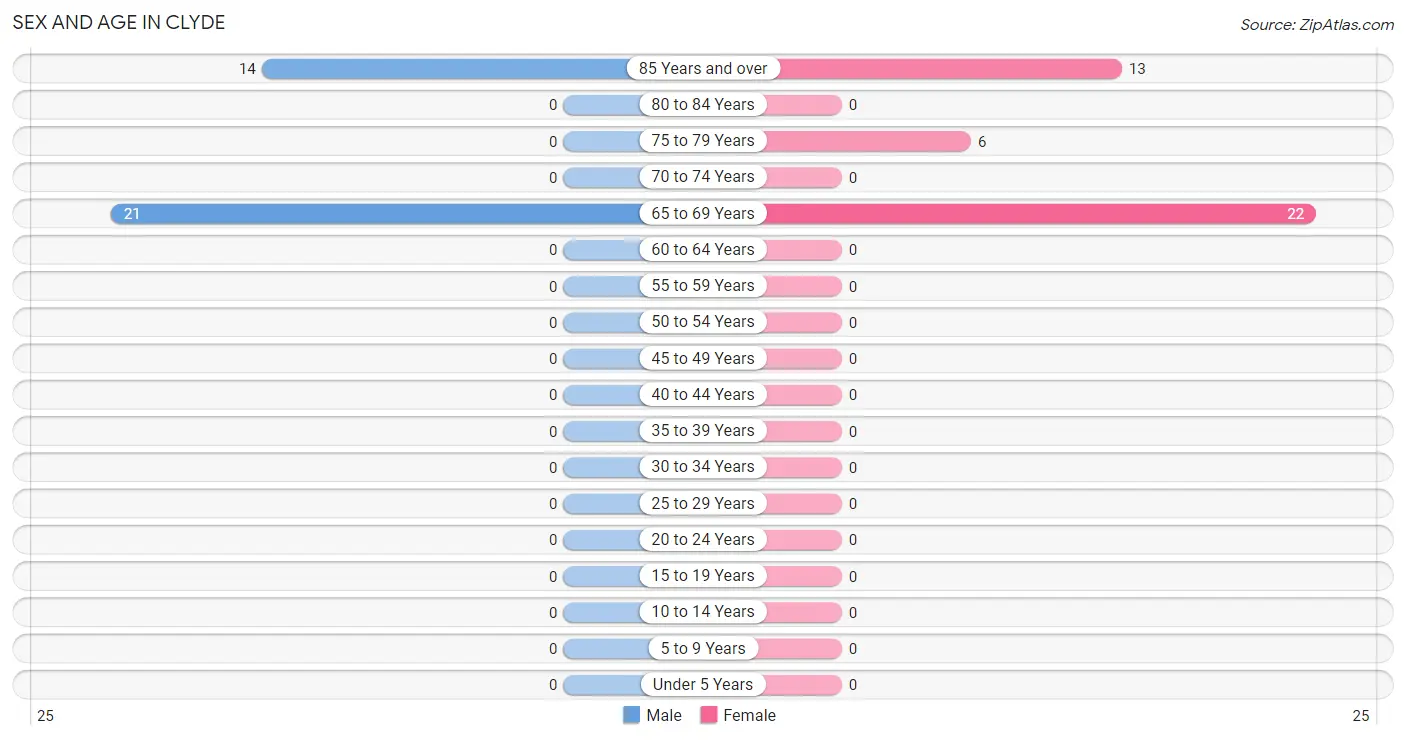
Sex and Age in Clyde
Sex and Age in Clyde
The most populous age groups in Clyde are 65 to 69 Years (21 | 60.0%) for men and 65 to 69 Years (22 | 53.7%) for women.
| Age Bracket | Male | Female |
| Under 5 Years | 0 (0.0%) | 0 (0.0%) |
| 5 to 9 Years | 0 (0.0%) | 0 (0.0%) |
| 10 to 14 Years | 0 (0.0%) | 0 (0.0%) |
| 15 to 19 Years | 0 (0.0%) | 0 (0.0%) |
| 20 to 24 Years | 0 (0.0%) | 0 (0.0%) |
| 25 to 29 Years | 0 (0.0%) | 0 (0.0%) |
| 30 to 34 Years | 0 (0.0%) | 0 (0.0%) |
| 35 to 39 Years | 0 (0.0%) | 0 (0.0%) |
| 40 to 44 Years | 0 (0.0%) | 0 (0.0%) |
| 45 to 49 Years | 0 (0.0%) | 0 (0.0%) |
| 50 to 54 Years | 0 (0.0%) | 0 (0.0%) |
| 55 to 59 Years | 0 (0.0%) | 0 (0.0%) |
| 60 to 64 Years | 0 (0.0%) | 0 (0.0%) |
| 65 to 69 Years | 21 (60.0%) | 22 (53.7%) |
| 70 to 74 Years | 0 (0.0%) | 0 (0.0%) |
| 75 to 79 Years | 0 (0.0%) | 6 (14.6%) |
| 80 to 84 Years | 0 (0.0%) | 0 (0.0%) |
| 85 Years and over | 14 (40.0%) | 13 (31.7%) |
| Total | 35 (100.0%) | 41 (100.0%) |
Families and Households in Clyde
Median Family Size in Clyde
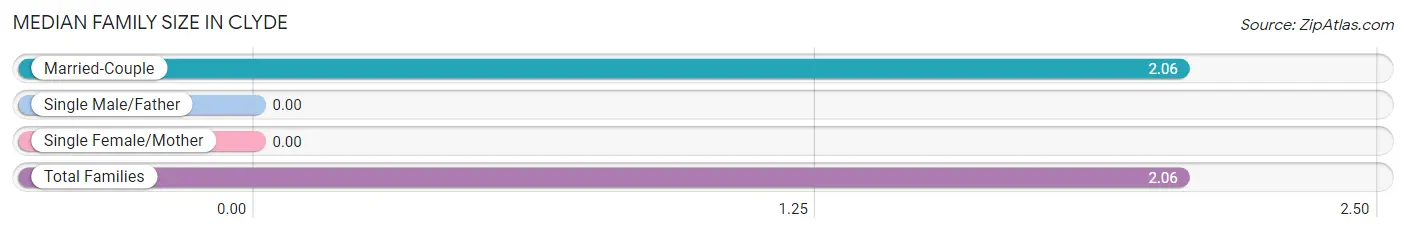
| Family Type | # Families | Family Size |
| Married-Couple | 34 (100.0%) | 2.06 |
| Single Male/Father | 0 (0.0%) | - |
| Single Female/Mother | 0 (0.0%) | - |
| Total Families | 34 (100.0%) | 2.06 |
Median Household Size in Clyde
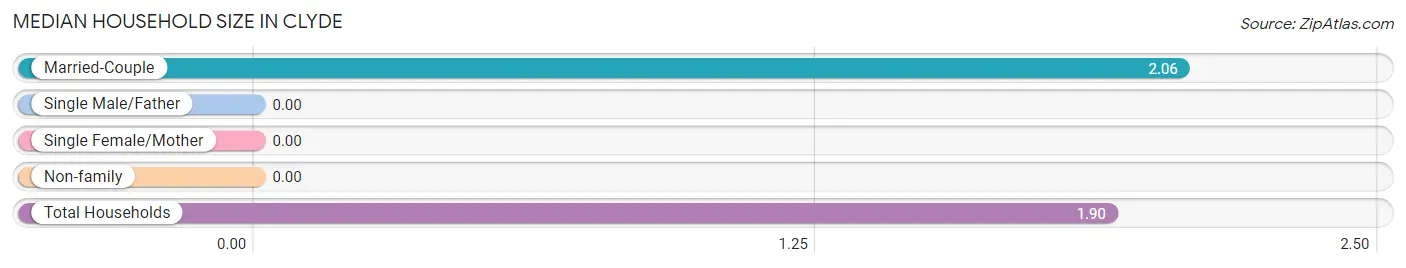
| Household Type | # Households | Household Size |
| Married-Couple | 34 (85.0%) | 2.06 |
| Single Male/Father | 0 (0.0%) | - |
| Single Female/Mother | 0 (0.0%) | - |
| Non-family | 6 (15.0%) | - |
| Total Households | 40 (100.0%) | 1.90 |
Household Size by Marriage Status in Clyde
Out of a total of 40 households in Clyde, 34 (85.0%) are family households, while 6 (15.0%) are nonfamily households. The most numerous type of family households are 2-person households, comprising 34, and the most common type of nonfamily households are 1-person households, comprising 6.
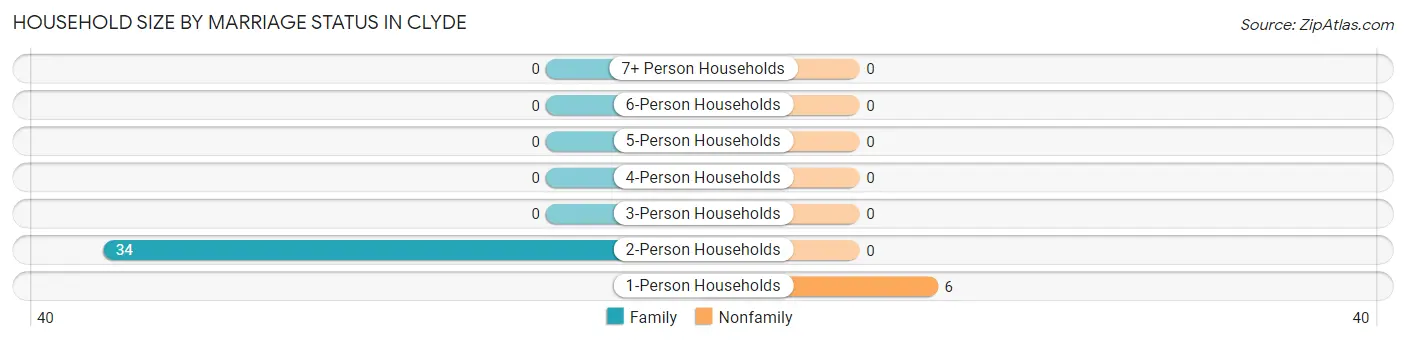
| Household Size | Family Households | Nonfamily Households |
| 1-Person Households | - | 6 (15.0%) |
| 2-Person Households | 34 (85.0%) | 0 (0.0%) |
| 3-Person Households | 0 (0.0%) | 0 (0.0%) |
| 4-Person Households | 0 (0.0%) | 0 (0.0%) |
| 5-Person Households | 0 (0.0%) | 0 (0.0%) |
| 6-Person Households | 0 (0.0%) | 0 (0.0%) |
| 7+ Person Households | 0 (0.0%) | 0 (0.0%) |
| Total | 34 (85.0%) | 6 (15.0%) |
Female Fertility in Clyde
Fertility by Age in Clyde
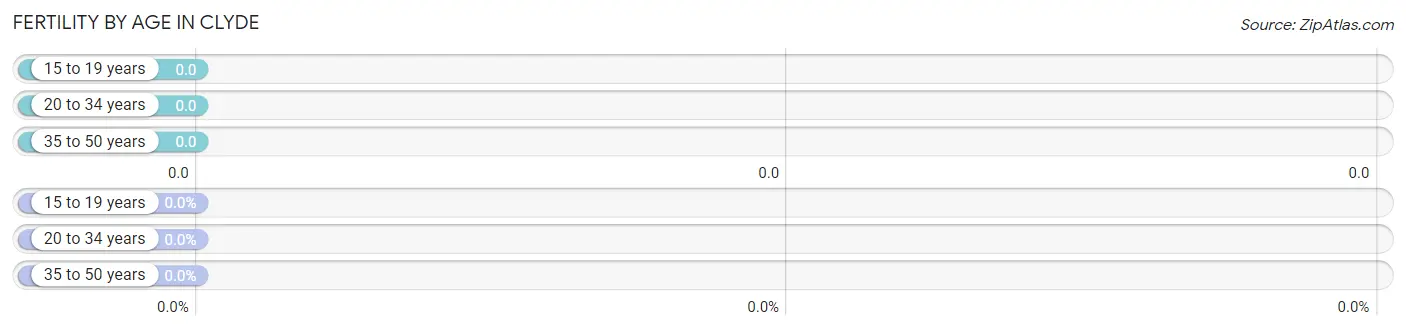
| Age Bracket | Women with Births | Births / 1,000 Women |
| 15 to 19 years | 0 (0.0%) | 0.0 |
| 20 to 34 years | 0 (0.0%) | 0.0 |
| 35 to 50 years | 0 (0.0%) | 0.0 |
| Total | 0 (0.0%) | 0.0 |
Fertility by Age by Marriage Status in Clyde
| Age Bracket | Married | Unmarried |
| 15 to 19 years | 0 (0.0%) | 0 (0.0%) |
| 20 to 34 years | 0 (0.0%) | 0 (0.0%) |
| 35 to 50 years | 0 (0.0%) | 0 (0.0%) |
| Total | 0 (0.0%) | 0 (0.0%) |
Fertility by Education in Clyde
| Educational Attainment | Women with Births | Births / 1,000 Women |
| Less than High School | 0 (0.0%) | 0.0 |
| High School Diploma | 0 (0.0%) | 0.0 |
| College or Associate's Degree | 0 (0.0%) | 0.0 |
| Bachelor's Degree | 0 (0.0%) | 0.0 |
| Graduate Degree | 0 (0.0%) | 0.0 |
| Total | 0 (0.0%) | 0.0 |
Fertility by Education by Marriage Status in Clyde
| Educational Attainment | Married | Unmarried |
| Less than High School | 0 (0.0%) | 0 (0.0%) |
| High School Diploma | 0 (0.0%) | 0 (0.0%) |
| College or Associate's Degree | 0 (0.0%) | 0 (0.0%) |
| Bachelor's Degree | 0 (0.0%) | 0 (0.0%) |
| Graduate Degree | 0 (0.0%) | 0 (0.0%) |
| Total | 0 (0.0%) | 0 (0.0%) |
Income in Clyde
Income Overview in Clyde
Per Capita Income in Clyde is $54,029, while median incomes of families and households are $98,846 and $99,423 respectively.
| Characteristic | Number | Measure |
| Per Capita Income | 76 | $54,029 |
| Median Family Income | 34 | $98,846 |
| Mean Family Income | 34 | $100,741 |
| Median Household Income | 40 | $99,423 |
| Mean Household Income | 40 | $101,298 |
| Income Deficit | 34 | $0 |
| Wage / Income Gap (%) | 76 | 0.00% |
| Wage / Income Gap ($) | 76 | 100.00¢ per $1 |
| Gini / Inequality Index | 76 | 0.07 |
Earnings by Sex in Clyde
| Sex | Number | Average Earnings |
| Male | 0 (0.0%) | $0 |
| Female | 11 (100.0%) | $0 |
| Total | 11 (100.0%) | $0 |
Earnings by Sex by Income Bracket in Clyde
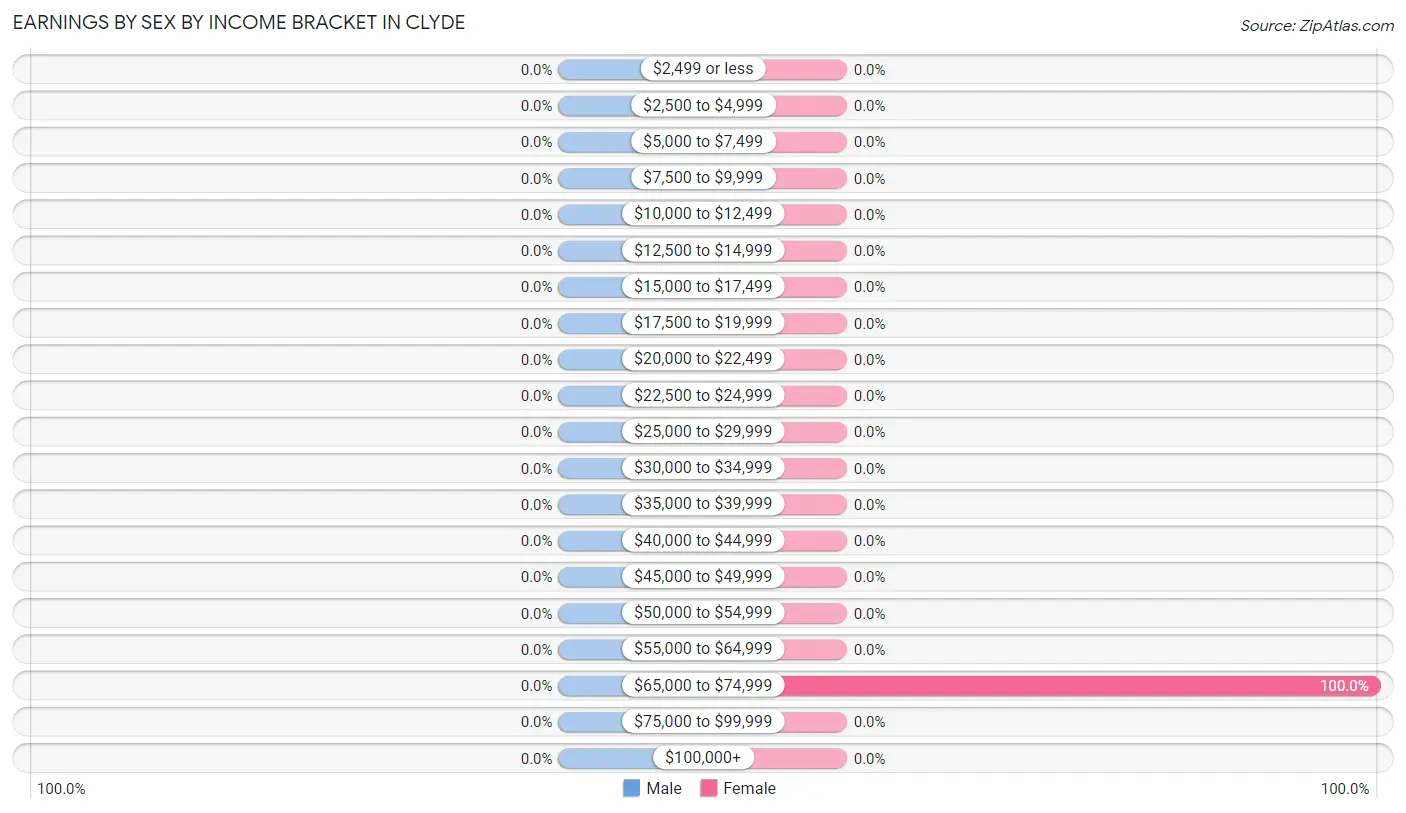
| Income | Male | Female |
| $2,499 or less | 0 (0.0%) | 0 (0.0%) |
| $2,500 to $4,999 | 0 (0.0%) | 0 (0.0%) |
| $5,000 to $7,499 | 0 (0.0%) | 0 (0.0%) |
| $7,500 to $9,999 | 0 (0.0%) | 0 (0.0%) |
| $10,000 to $12,499 | 0 (0.0%) | 0 (0.0%) |
| $12,500 to $14,999 | 0 (0.0%) | 0 (0.0%) |
| $15,000 to $17,499 | 0 (0.0%) | 0 (0.0%) |
| $17,500 to $19,999 | 0 (0.0%) | 0 (0.0%) |
| $20,000 to $22,499 | 0 (0.0%) | 0 (0.0%) |
| $22,500 to $24,999 | 0 (0.0%) | 0 (0.0%) |
| $25,000 to $29,999 | 0 (0.0%) | 0 (0.0%) |
| $30,000 to $34,999 | 0 (0.0%) | 0 (0.0%) |
| $35,000 to $39,999 | 0 (0.0%) | 0 (0.0%) |
| $40,000 to $44,999 | 0 (0.0%) | 0 (0.0%) |
| $45,000 to $49,999 | 0 (0.0%) | 0 (0.0%) |
| $50,000 to $54,999 | 0 (0.0%) | 0 (0.0%) |
| $55,000 to $64,999 | 0 (0.0%) | 0 (0.0%) |
| $65,000 to $74,999 | 0 (0.0%) | 11 (100.0%) |
| $75,000 to $99,999 | 0 (0.0%) | 0 (0.0%) |
| $100,000+ | 0 (0.0%) | 0 (0.0%) |
| Total | 0 (0.0%) | 11 (100.0%) |
Earnings by Sex by Educational Attainment in Clyde
| Educational Attainment | Male Income | Female Income |
| Less than High School | - | - |
| High School Diploma | - | - |
| College or Associate's Degree | - | - |
| Bachelor's Degree | - | - |
| Graduate Degree | - | - |
| Total | - | - |
Family Income in Clyde
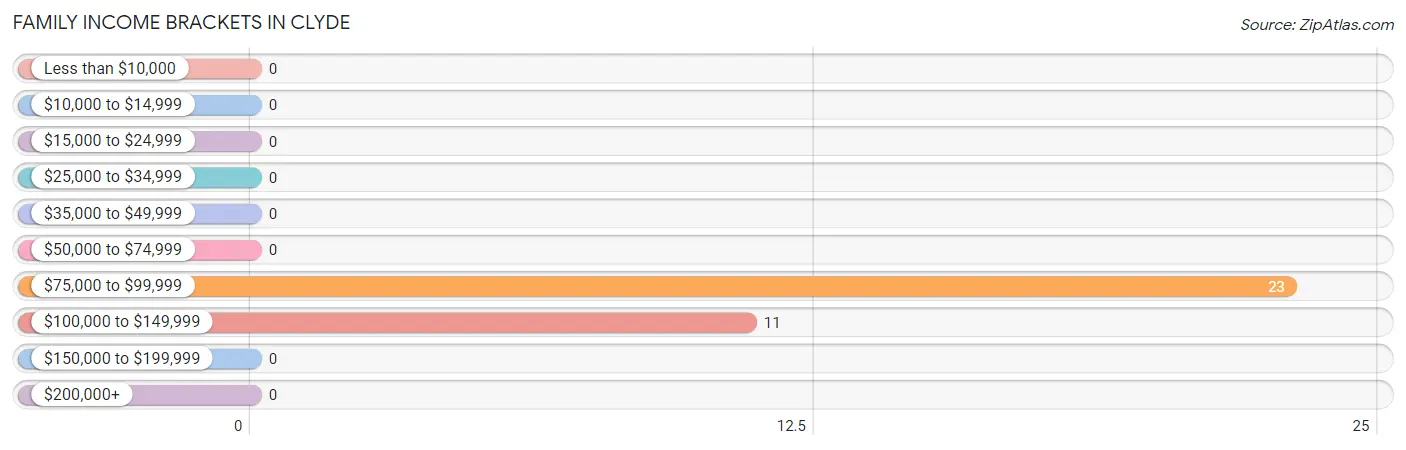
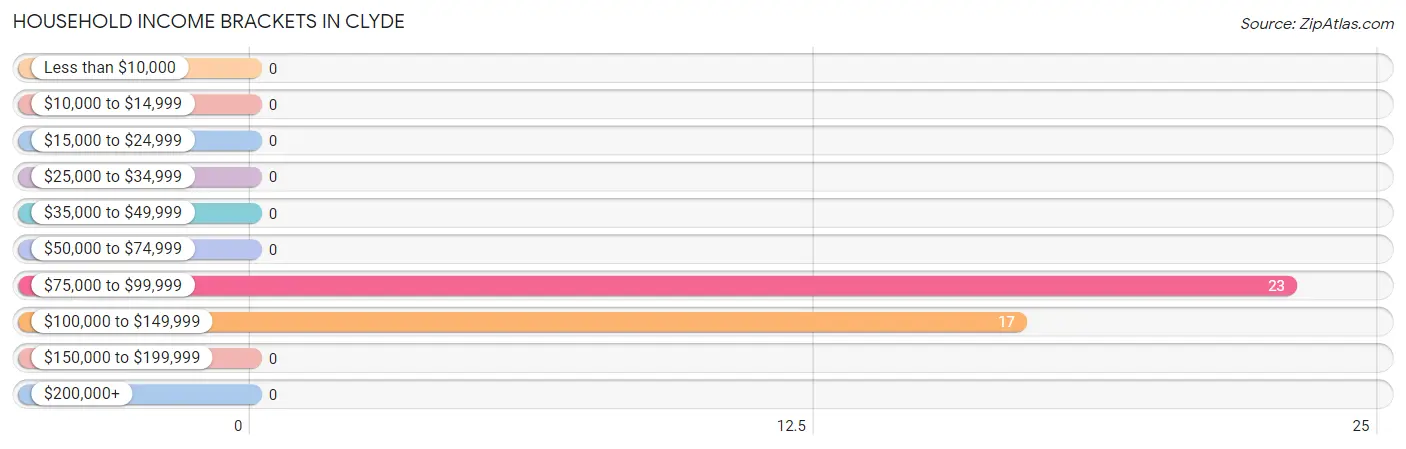
Family Income Brackets in Clyde
According to the Clyde family income data, there are 23 families falling into the $75,000 to $99,999 income range, which is the most common income bracket and makes up 67.6% of all families.
| Income Bracket | # Families | % Families |
| Less than $10,000 | 0 | 0.0% |
| $10,000 to $14,999 | 0 | 0.0% |
| $15,000 to $24,999 | 0 | 0.0% |
| $25,000 to $34,999 | 0 | 0.0% |
| $35,000 to $49,999 | 0 | 0.0% |
| $50,000 to $74,999 | 0 | 0.0% |
| $75,000 to $99,999 | 23 | 67.6% |
| $100,000 to $149,999 | 11 | 32.4% |
| $150,000 to $199,999 | 0 | 0.0% |
| $200,000+ | 0 | 0.0% |
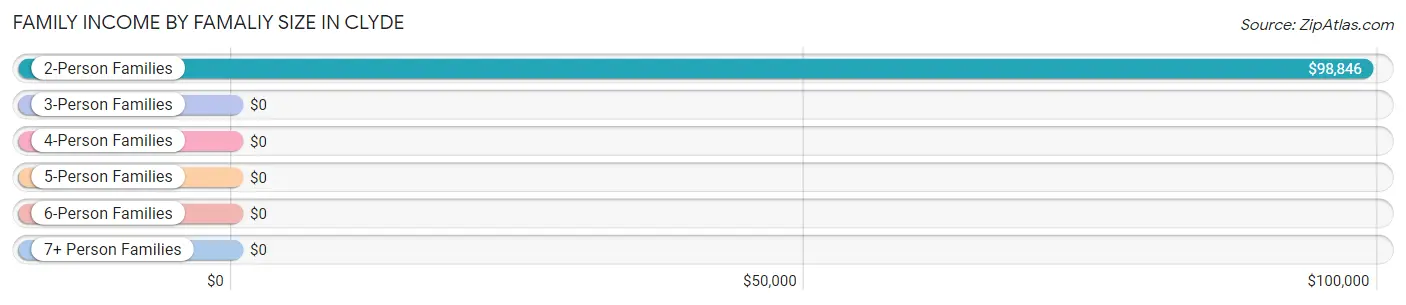
Family Income by Famaliy Size in Clyde
2-person families (34 | 100.0%) account for the highest median family income in Clyde with $98,846 per family, while 2-person families (34 | 100.0%) have the highest median income of $49,423 per family member.
| Income Bracket | # Families | Median Income |
| 2-Person Families | 34 (100.0%) | $98,846 |
| 3-Person Families | 0 (0.0%) | $0 |
| 4-Person Families | 0 (0.0%) | $0 |
| 5-Person Families | 0 (0.0%) | $0 |
| 6-Person Families | 0 (0.0%) | $0 |
| 7+ Person Families | 0 (0.0%) | $0 |
| Total | 34 (100.0%) | $98,846 |
Family Income by Number of Earners in Clyde
| Number of Earners | # Families | Median Income |
| No Earners | 23 (67.6%) | $0 |
| 1 Earner | 11 (32.4%) | $0 |
| 2 Earners | 0 (0.0%) | $0 |
| 3+ Earners | 0 (0.0%) | $0 |
| Total | 34 (100.0%) | $98,846 |
Household Income in Clyde
Household Income Brackets in Clyde
With 23 households falling in the category, the $75,000 to $99,999 income range is the most frequent in Clyde, accounting for 57.5% of all households.
| Income Bracket | # Households | % Households |
| Less than $10,000 | 0 | 0.0% |
| $10,000 to $14,999 | 0 | 0.0% |
| $15,000 to $24,999 | 0 | 0.0% |
| $25,000 to $34,999 | 0 | 0.0% |
| $35,000 to $49,999 | 0 | 0.0% |
| $50,000 to $74,999 | 0 | 0.0% |
| $75,000 to $99,999 | 23 | 57.5% |
| $100,000 to $149,999 | 17 | 42.5% |
| $150,000 to $199,999 | 0 | 0.0% |
| $200,000+ | 0 | 0.0% |
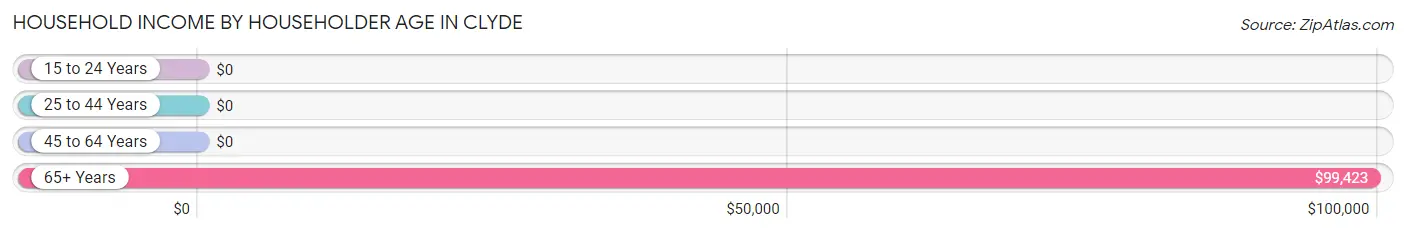
Household Income by Householder Age in Clyde
The median household income in Clyde is $99,423, with the highest median household income of $99,423 found in the 65+ years age bracket for the primary householder. A total of 40 households (100.0%) fall into this category.
| Income Bracket | # Households | Median Income |
| 15 to 24 Years | 0 (0.0%) | $0 |
| 25 to 44 Years | 0 (0.0%) | $0 |
| 45 to 64 Years | 0 (0.0%) | $0 |
| 65+ Years | 40 (100.0%) | $99,423 |
| Total | 40 (100.0%) | $99,423 |
Poverty in Clyde
Income Below Poverty by Sex and Age in Clyde
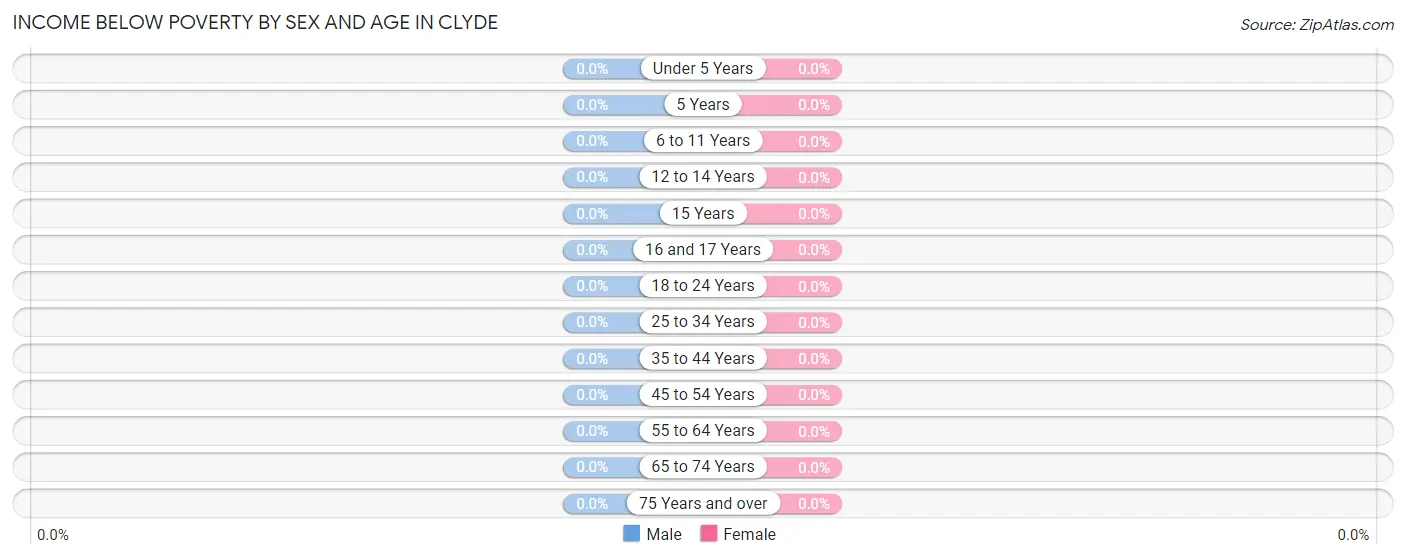
| Age Bracket | Male | Female |
| Under 5 Years | 0 (0.0%) | 0 (0.0%) |
| 5 Years | 0 (0.0%) | 0 (0.0%) |
| 6 to 11 Years | 0 (0.0%) | 0 (0.0%) |
| 12 to 14 Years | 0 (0.0%) | 0 (0.0%) |
| 15 Years | 0 (0.0%) | 0 (0.0%) |
| 16 and 17 Years | 0 (0.0%) | 0 (0.0%) |
| 18 to 24 Years | 0 (0.0%) | 0 (0.0%) |
| 25 to 34 Years | 0 (0.0%) | 0 (0.0%) |
| 35 to 44 Years | 0 (0.0%) | 0 (0.0%) |
| 45 to 54 Years | 0 (0.0%) | 0 (0.0%) |
| 55 to 64 Years | 0 (0.0%) | 0 (0.0%) |
| 65 to 74 Years | 0 (0.0%) | 0 (0.0%) |
| 75 Years and over | 0 (0.0%) | 0 (0.0%) |
| Total | 0 (0.0%) | 0 (0.0%) |
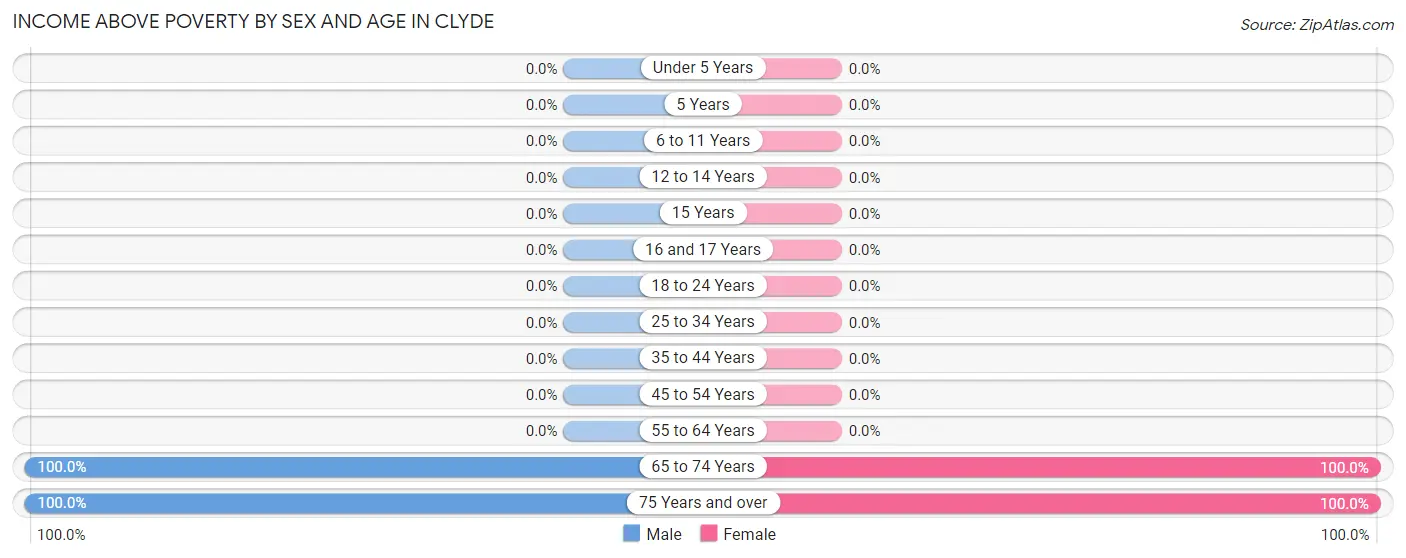
Income Above Poverty by Sex and Age in Clyde
According to the poverty statistics in Clyde, males aged 65 to 74 years and females aged 65 to 74 years are the age groups that are most secure financially, with 100.0% of males and 100.0% of females in these age groups living above the poverty line.
| Age Bracket | Male | Female |
| Under 5 Years | 0 (0.0%) | 0 (0.0%) |
| 5 Years | 0 (0.0%) | 0 (0.0%) |
| 6 to 11 Years | 0 (0.0%) | 0 (0.0%) |
| 12 to 14 Years | 0 (0.0%) | 0 (0.0%) |
| 15 Years | 0 (0.0%) | 0 (0.0%) |
| 16 and 17 Years | 0 (0.0%) | 0 (0.0%) |
| 18 to 24 Years | 0 (0.0%) | 0 (0.0%) |
| 25 to 34 Years | 0 (0.0%) | 0 (0.0%) |
| 35 to 44 Years | 0 (0.0%) | 0 (0.0%) |
| 45 to 54 Years | 0 (0.0%) | 0 (0.0%) |
| 55 to 64 Years | 0 (0.0%) | 0 (0.0%) |
| 65 to 74 Years | 21 (100.0%) | 22 (100.0%) |
| 75 Years and over | 14 (100.0%) | 19 (100.0%) |
| Total | 35 (100.0%) | 41 (100.0%) |
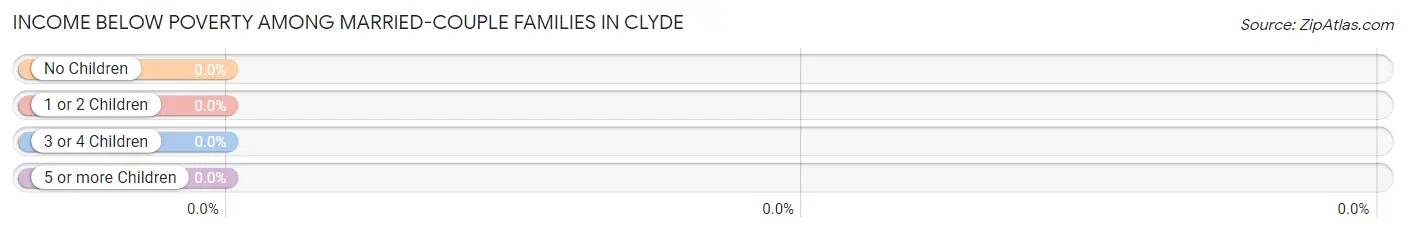
Income Below Poverty Among Married-Couple Families in Clyde
| Children | Above Poverty | Below Poverty |
| No Children | 34 (100.0%) | 0 (0.0%) |
| 1 or 2 Children | 0 (0.0%) | 0 (0.0%) |
| 3 or 4 Children | 0 (0.0%) | 0 (0.0%) |
| 5 or more Children | 0 (0.0%) | 0 (0.0%) |
| Total | 34 (100.0%) | 0 (0.0%) |
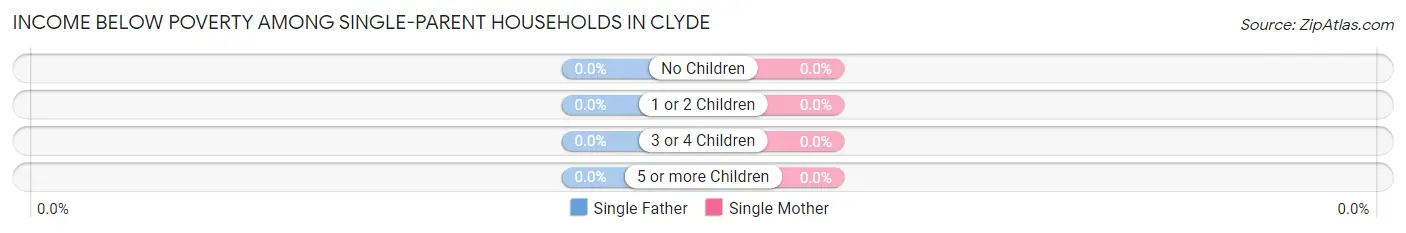
Income Below Poverty Among Single-Parent Households in Clyde
| Children | Single Father | Single Mother |
| No Children | 0 (0.0%) | 0 (0.0%) |
| 1 or 2 Children | 0 (0.0%) | 0 (0.0%) |
| 3 or 4 Children | 0 (0.0%) | 0 (0.0%) |
| 5 or more Children | 0 (0.0%) | 0 (0.0%) |
| Total | 0 (0.0%) | 0 (0.0%) |
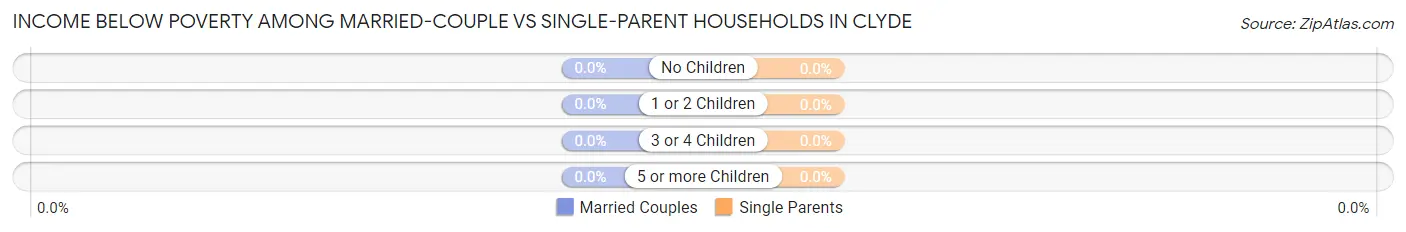
Income Below Poverty Among Married-Couple vs Single-Parent Households in Clyde
| Children | Married-Couple Families | Single-Parent Households |
| No Children | 0 (0.0%) | 0 (0.0%) |
| 1 or 2 Children | 0 (0.0%) | 0 (0.0%) |
| 3 or 4 Children | 0 (0.0%) | 0 (0.0%) |
| 5 or more Children | 0 (0.0%) | 0 (0.0%) |
| Total | 0 (0.0%) | 0 (0.0%) |
Employment Characteristics in Clyde
Employment by Class of Employer in Clyde
Among the 11 employed individuals in Clyde, , and not-for-profit organizations (11 | 100.0%) make up the most common classes of employment.
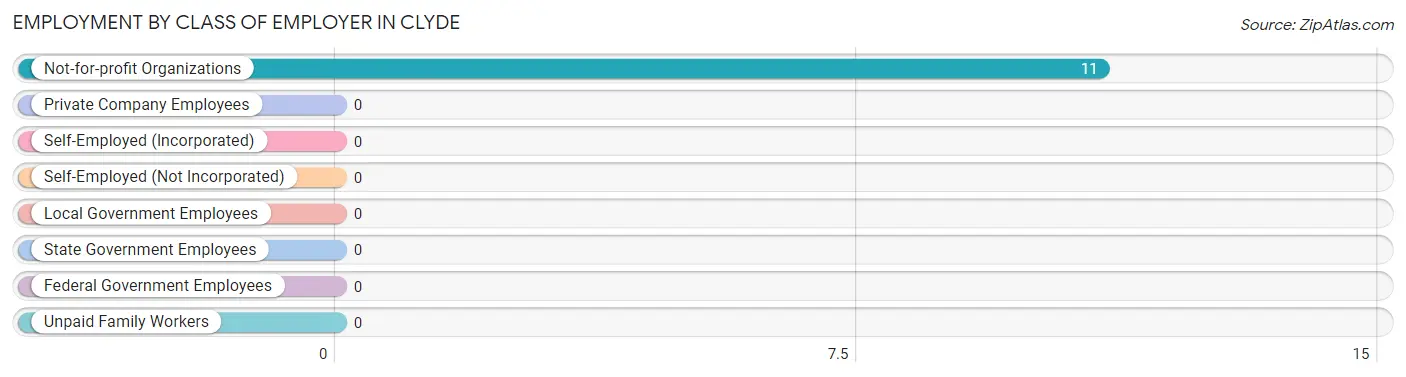
| Employer Class | # Employees | % Employees |
| Private Company Employees | 0 | 0.0% |
| Self-Employed (Incorporated) | 0 | 0.0% |
| Self-Employed (Not Incorporated) | 0 | 0.0% |
| Not-for-profit Organizations | 11 | 100.0% |
| Local Government Employees | 0 | 0.0% |
| State Government Employees | 0 | 0.0% |
| Federal Government Employees | 0 | 0.0% |
| Unpaid Family Workers | 0 | 0.0% |
| Total | 11 | 100.0% |
Employment Status by Age in Clyde
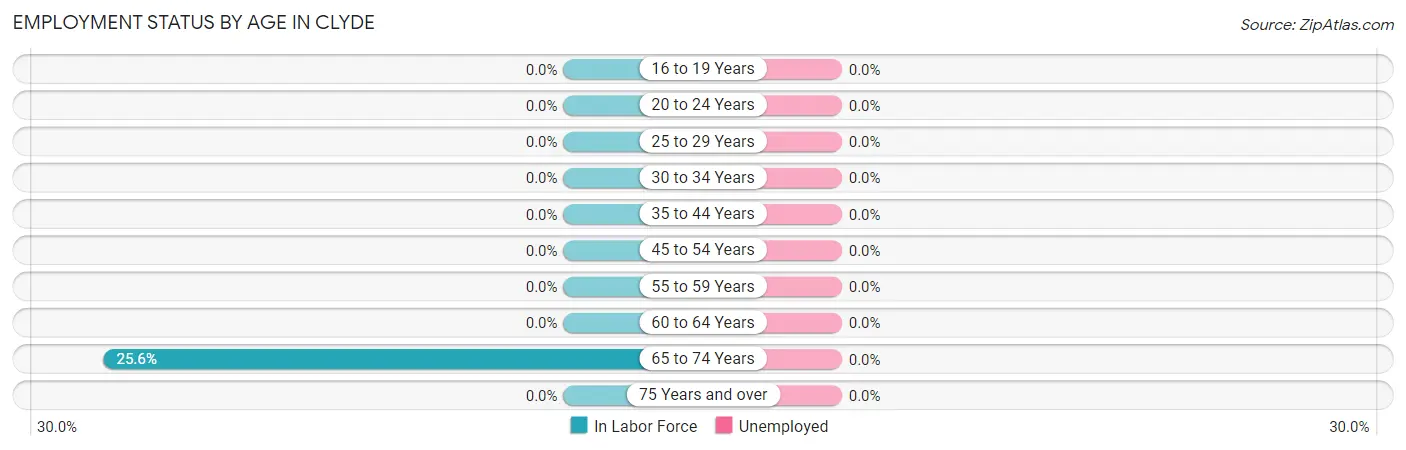
| Age Bracket | In Labor Force | Unemployed |
| 16 to 19 Years | 0 (0.0%) | 0 (0.0%) |
| 20 to 24 Years | 0 (0.0%) | 0 (0.0%) |
| 25 to 29 Years | 0 (0.0%) | 0 (0.0%) |
| 30 to 34 Years | 0 (0.0%) | 0 (0.0%) |
| 35 to 44 Years | 0 (0.0%) | 0 (0.0%) |
| 45 to 54 Years | 0 (0.0%) | 0 (0.0%) |
| 55 to 59 Years | 0 (0.0%) | 0 (0.0%) |
| 60 to 64 Years | 0 (0.0%) | 0 (0.0%) |
| 65 to 74 Years | 11 (25.6%) | 0 (0.0%) |
| 75 Years and over | 0 (0.0%) | 0 (0.0%) |
| Total | 11 (14.5%) | 0 (0.0%) |
Employment Status by Educational Attainment in Clyde
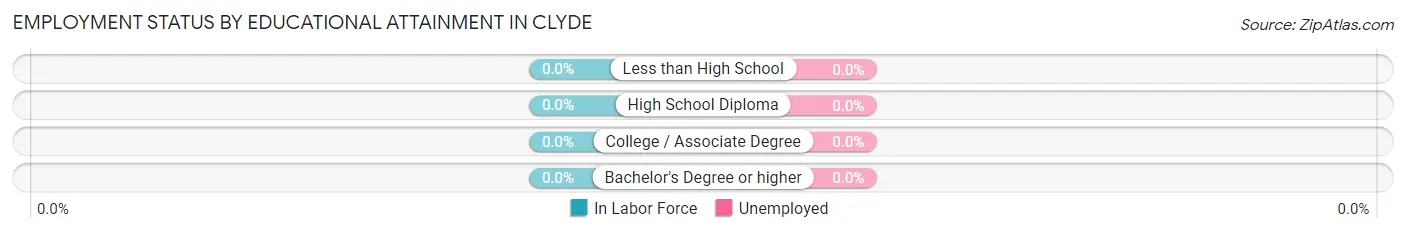
| Educational Attainment | In Labor Force | Unemployed |
| Less than High School | 0 (0.0%) | 0 (0.0%) |
| High School Diploma | 0 (0.0%) | 0 (0.0%) |
| College / Associate Degree | 0 (0.0%) | 0 (0.0%) |
| Bachelor's Degree or higher | 0 (0.0%) | 0 (0.0%) |
| Total | 0 (0.0%) | 0 (0.0%) |
Employment Occupations by Sex in Clyde
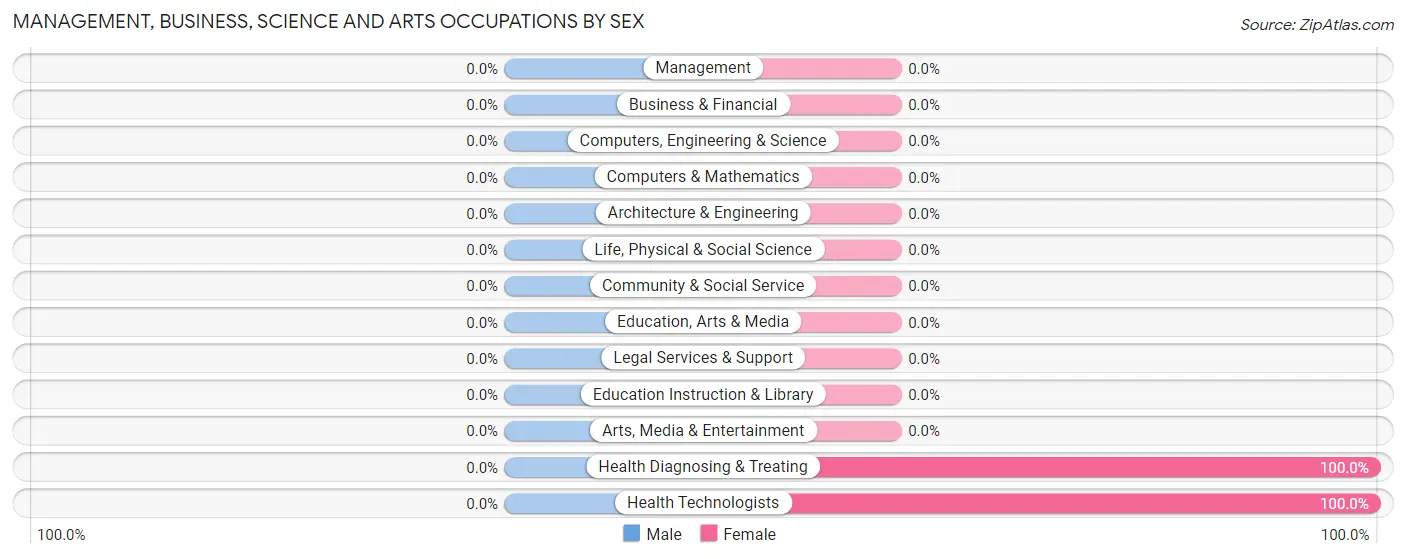
Management, Business, Science and Arts Occupations
The most common Management, Business, Science and Arts occupations in Clyde are Health Diagnosing & Treating (11 | 100.0%), and Health Technologists (11 | 100.0%).
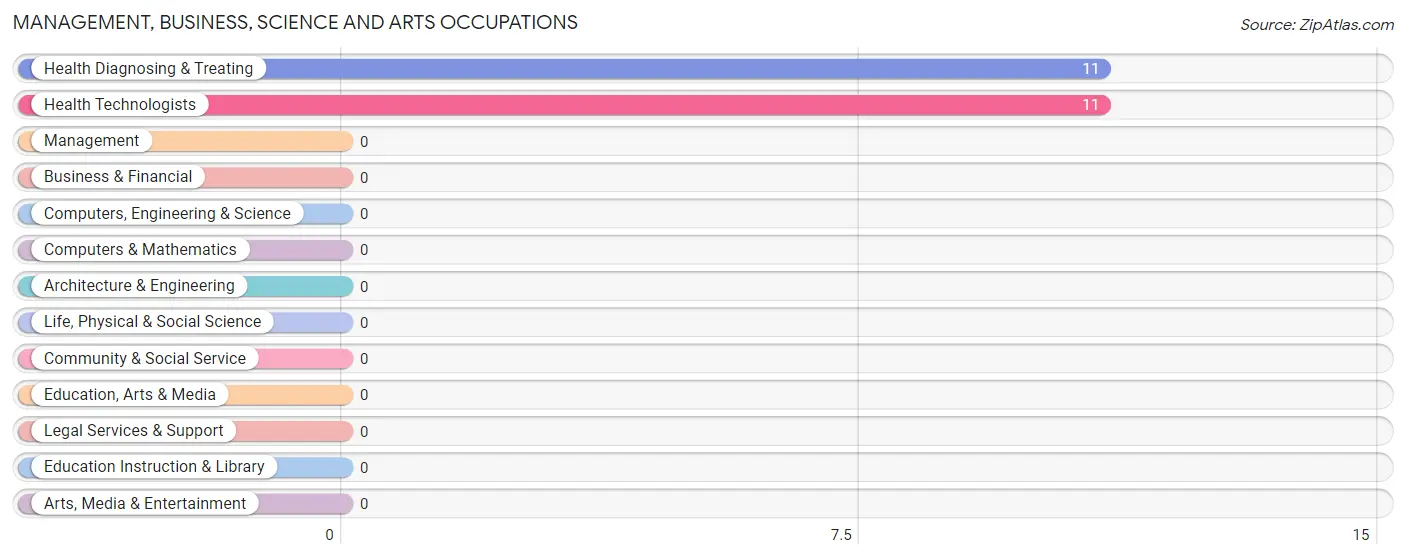
Management, Business, Science and Arts Occupations by Sex
| Occupation | Male | Female |
| Management | 0 (0.0%) | 0 (0.0%) |
| Business & Financial | 0 (0.0%) | 0 (0.0%) |
| Computers, Engineering & Science | 0 (0.0%) | 0 (0.0%) |
| Computers & Mathematics | 0 (0.0%) | 0 (0.0%) |
| Architecture & Engineering | 0 (0.0%) | 0 (0.0%) |
| Life, Physical & Social Science | 0 (0.0%) | 0 (0.0%) |
| Community & Social Service | 0 (0.0%) | 0 (0.0%) |
| Education, Arts & Media | 0 (0.0%) | 0 (0.0%) |
| Legal Services & Support | 0 (0.0%) | 0 (0.0%) |
| Education Instruction & Library | 0 (0.0%) | 0 (0.0%) |
| Arts, Media & Entertainment | 0 (0.0%) | 0 (0.0%) |
| Health Diagnosing & Treating | 0 (0.0%) | 11 (100.0%) |
| Health Technologists | 0 (0.0%) | 11 (100.0%) |
| Total (Category) | 0 (0.0%) | 11 (100.0%) |
| Total (Overall) | 0 (0.0%) | 11 (100.0%) |
Services Occupations
Services Occupations by Sex
| Occupation | Male | Female |
| Healthcare Support | 0 (0.0%) | 0 (0.0%) |
| Security & Protection | 0 (0.0%) | 0 (0.0%) |
| Firefighting & Prevention | 0 (0.0%) | 0 (0.0%) |
| Law Enforcement | 0 (0.0%) | 0 (0.0%) |
| Food Preparation & Serving | 0 (0.0%) | 0 (0.0%) |
| Cleaning & Maintenance | 0 (0.0%) | 0 (0.0%) |
| Personal Care & Service | 0 (0.0%) | 0 (0.0%) |
| Total (Category) | 0 (0.0%) | 0 (0.0%) |
| Total (Overall) | 0 (0.0%) | 11 (100.0%) |
Sales and Office Occupations
Sales and Office Occupations by Sex
| Occupation | Male | Female |
| Sales & Related | 0 (0.0%) | 0 (0.0%) |
| Office & Administration | 0 (0.0%) | 0 (0.0%) |
| Total (Category) | 0 (0.0%) | 0 (0.0%) |
| Total (Overall) | 0 (0.0%) | 11 (100.0%) |
Natural Resources, Construction and Maintenance Occupations
Natural Resources, Construction and Maintenance Occupations by Sex
| Occupation | Male | Female |
| Farming, Fishing & Forestry | 0 (0.0%) | 0 (0.0%) |
| Construction & Extraction | 0 (0.0%) | 0 (0.0%) |
| Installation, Maintenance & Repair | 0 (0.0%) | 0 (0.0%) |
| Total (Category) | 0 (0.0%) | 0 (0.0%) |
| Total (Overall) | 0 (0.0%) | 11 (100.0%) |
Production, Transportation and Moving Occupations
Production, Transportation and Moving Occupations by Sex
| Occupation | Male | Female |
| Production | 0 (0.0%) | 0 (0.0%) |
| Transportation | 0 (0.0%) | 0 (0.0%) |
| Material Moving | 0 (0.0%) | 0 (0.0%) |
| Total (Category) | 0 (0.0%) | 0 (0.0%) |
| Total (Overall) | 0 (0.0%) | 11 (100.0%) |
Employment Industries by Sex in Clyde
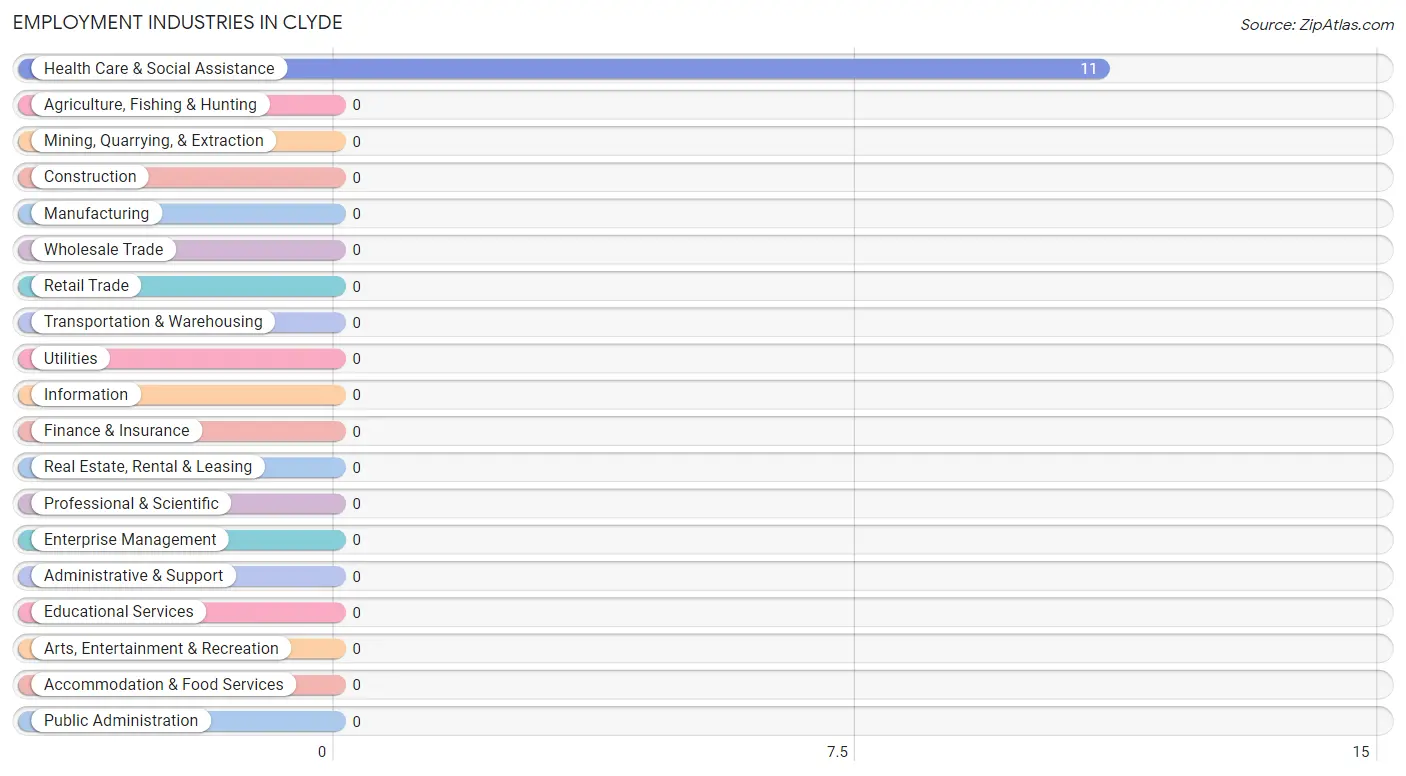
Employment Industries in Clyde
The major employment industries in Clyde include , and Health Care & Social Assistance (11 | 100.0%).
Employment Industries by Sex in Clyde
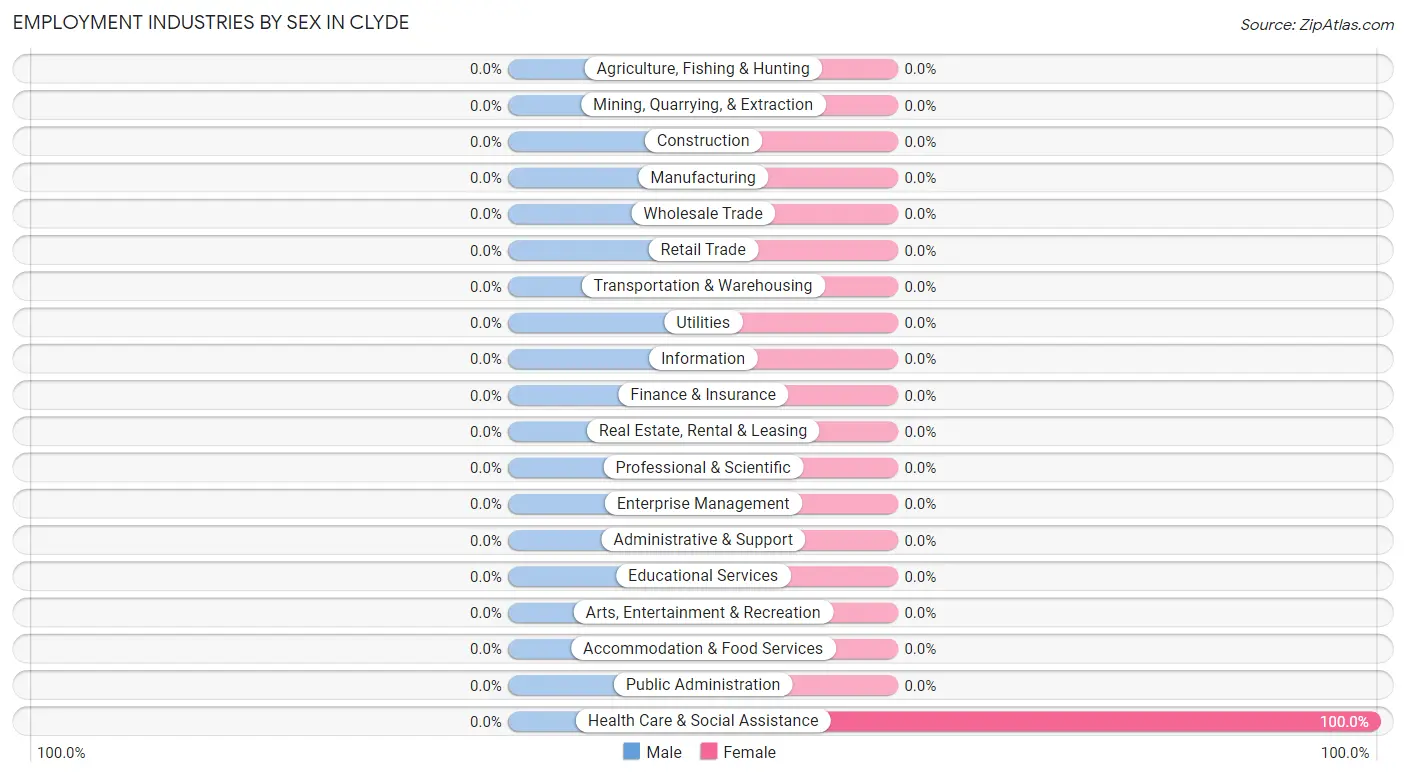
| Industry | Male | Female |
| Agriculture, Fishing & Hunting | 0 (0.0%) | 0 (0.0%) |
| Mining, Quarrying, & Extraction | 0 (0.0%) | 0 (0.0%) |
| Construction | 0 (0.0%) | 0 (0.0%) |
| Manufacturing | 0 (0.0%) | 0 (0.0%) |
| Wholesale Trade | 0 (0.0%) | 0 (0.0%) |
| Retail Trade | 0 (0.0%) | 0 (0.0%) |
| Transportation & Warehousing | 0 (0.0%) | 0 (0.0%) |
| Utilities | 0 (0.0%) | 0 (0.0%) |
| Information | 0 (0.0%) | 0 (0.0%) |
| Finance & Insurance | 0 (0.0%) | 0 (0.0%) |
| Real Estate, Rental & Leasing | 0 (0.0%) | 0 (0.0%) |
| Professional & Scientific | 0 (0.0%) | 0 (0.0%) |
| Enterprise Management | 0 (0.0%) | 0 (0.0%) |
| Administrative & Support | 0 (0.0%) | 0 (0.0%) |
| Educational Services | 0 (0.0%) | 0 (0.0%) |
| Health Care & Social Assistance | 0 (0.0%) | 11 (100.0%) |
| Arts, Entertainment & Recreation | 0 (0.0%) | 0 (0.0%) |
| Accommodation & Food Services | 0 (0.0%) | 0 (0.0%) |
| Public Administration | 0 (0.0%) | 0 (0.0%) |
| Total | 0 (0.0%) | 11 (100.0%) |
Education in Clyde
School Enrollment in Clyde
| School Level | # Students | % Students |
| Nursery / Preschool | 0 | 0.0% |
| Kindergarten | 0 | 0.0% |
| Elementary School | 0 | 0.0% |
| Middle School | 0 | 0.0% |
| High School | 0 | 0.0% |
| College / Undergraduate | 0 | 0.0% |
| Graduate / Professional | 0 | 0.0% |
| Total | 0 | 0.0% |
School Enrollment by Age by Funding Source in Clyde
| Age Bracket | Public School | Private School |
| 3 to 4 Year Olds | 0 (0.0%) | 0 (0.0%) |
| 5 to 9 Year Old | 0 (0.0%) | 0 (0.0%) |
| 10 to 14 Year Olds | 0 (0.0%) | 0 (0.0%) |
| 15 to 17 Year Olds | 0 (0.0%) | 0 (0.0%) |
| 18 to 19 Year Olds | 0 (0.0%) | 0 (0.0%) |
| 20 to 24 Year Olds | 0 (0.0%) | 0 (0.0%) |
| 25 to 34 Year Olds | 0 (0.0%) | 0 (0.0%) |
| 35 Years and over | 0 (0.0%) | 0 (0.0%) |
| Total | 0 (0.0%) | 0 (0.0%) |
Educational Attainment by Field of Study in Clyde
Computers & mathematics (11 | 34.4%), business (11 | 34.4%), and psychology (10 | 31.2%) are the most common fields of study among 32 individuals in Clyde who have obtained a bachelor's degree or higher.
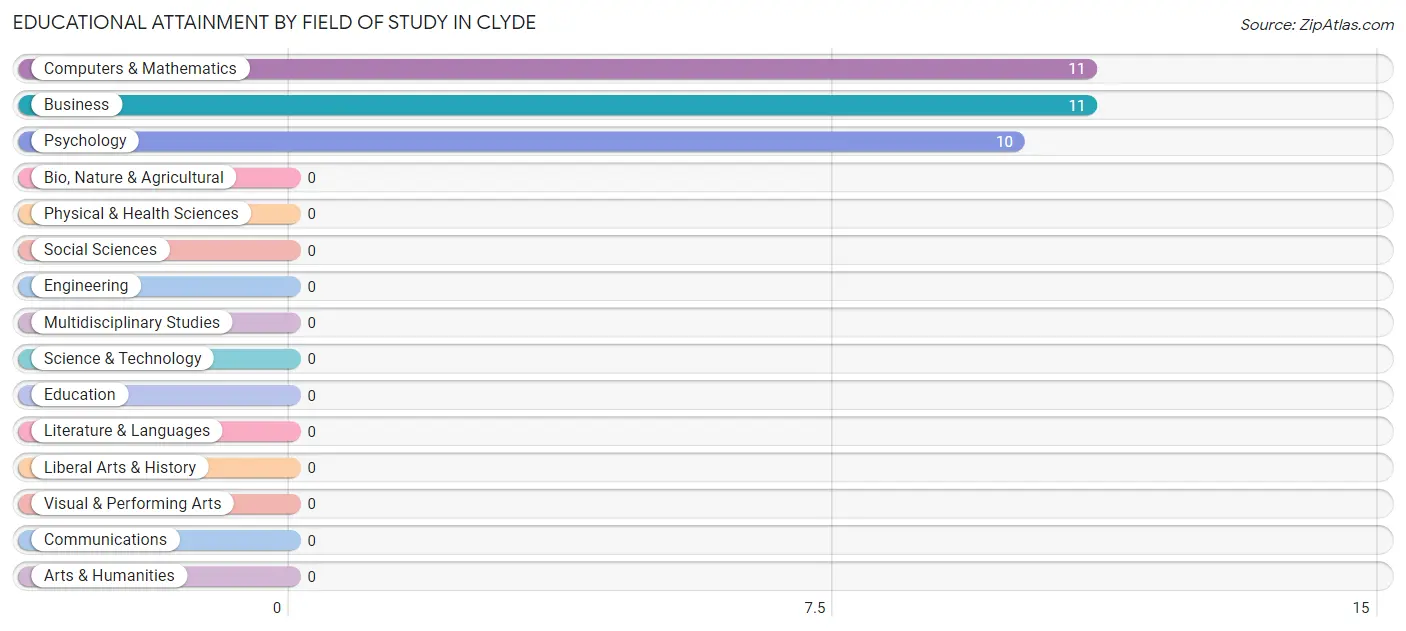
| Field of Study | # Graduates | % Graduates |
| Computers & Mathematics | 11 | 34.4% |
| Bio, Nature & Agricultural | 0 | 0.0% |
| Physical & Health Sciences | 0 | 0.0% |
| Psychology | 10 | 31.2% |
| Social Sciences | 0 | 0.0% |
| Engineering | 0 | 0.0% |
| Multidisciplinary Studies | 0 | 0.0% |
| Science & Technology | 0 | 0.0% |
| Business | 11 | 34.4% |
| Education | 0 | 0.0% |
| Literature & Languages | 0 | 0.0% |
| Liberal Arts & History | 0 | 0.0% |
| Visual & Performing Arts | 0 | 0.0% |
| Communications | 0 | 0.0% |
| Arts & Humanities | 0 | 0.0% |
| Total | 32 | 100.0% |
Transportation & Commute in Clyde
Vehicle Availability by Sex in Clyde
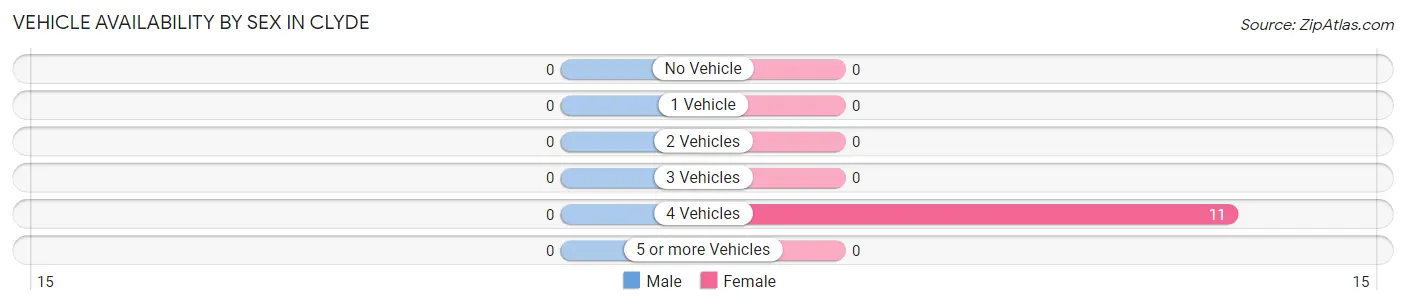
| Vehicles Available | Male | Female |
| No Vehicle | 0 (0.0%) | 0 (0.0%) |
| 1 Vehicle | 0 (0.0%) | 0 (0.0%) |
| 2 Vehicles | 0 (0.0%) | 0 (0.0%) |
| 3 Vehicles | 0 (0.0%) | 0 (0.0%) |
| 4 Vehicles | 0 (0.0%) | 11 (100.0%) |
| 5 or more Vehicles | 0 (0.0%) | 0 (0.0%) |
| Total | 0 (0.0%) | 11 (100.0%) |
Commute Time in Clyde
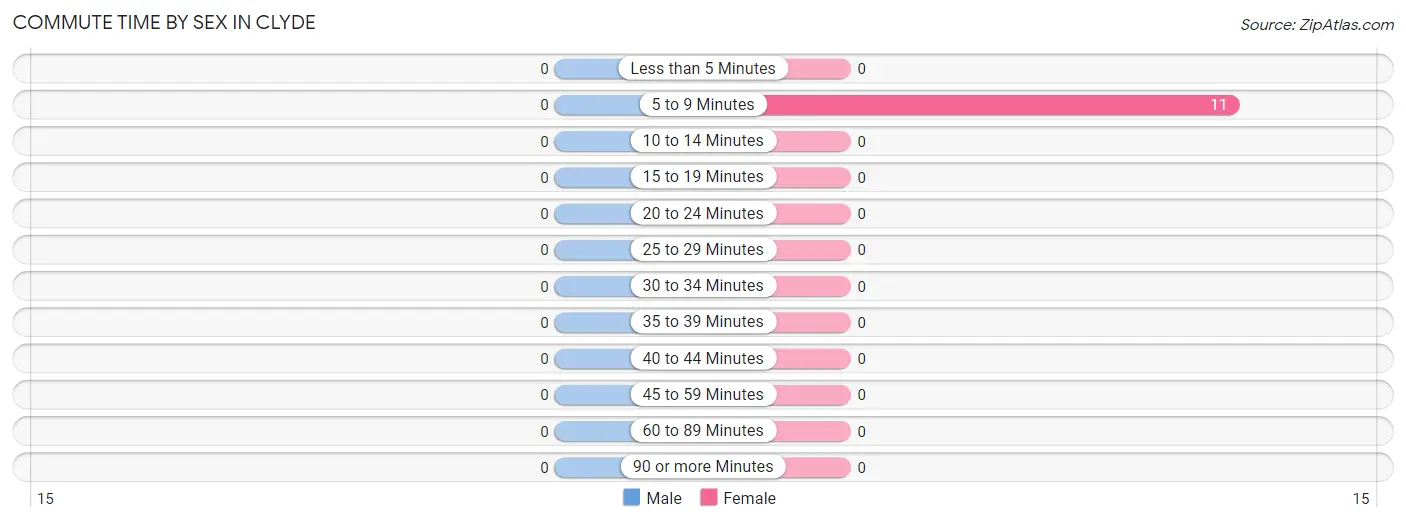
The most frequently occuring commute durations in Clyde are 5 to 9 minutes (11 commuters, 100.0%), less than 5 minutes (0 commuters, 0.0%), and 10 to 14 minutes (0 commuters, 0.0%).
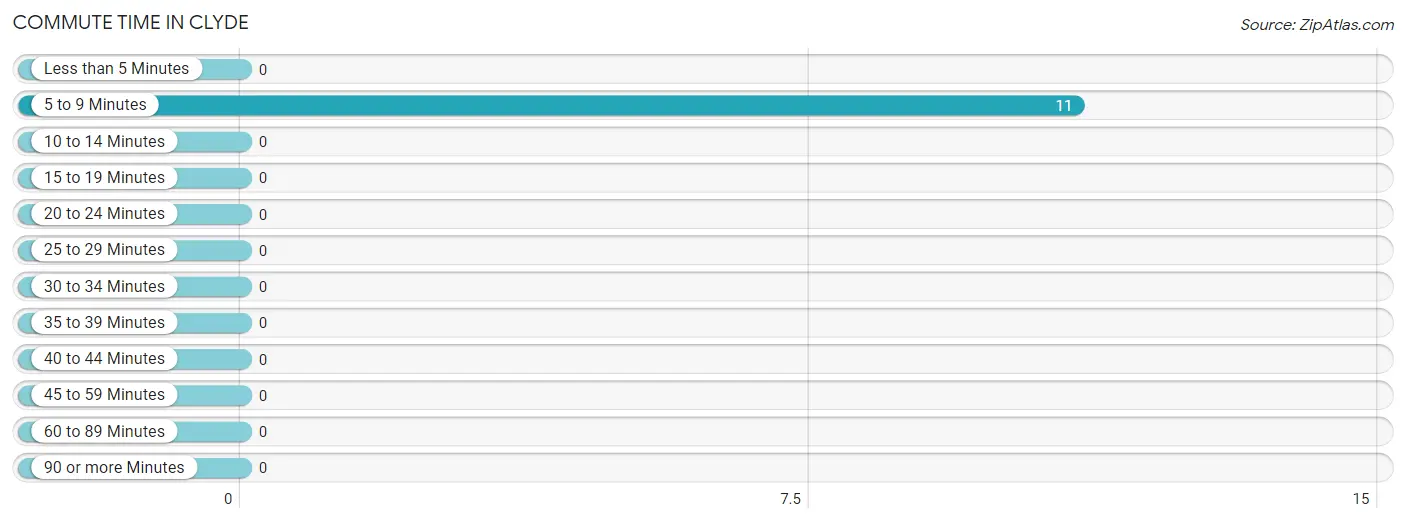
| Commute Time | # Commuters | % Commuters |
| Less than 5 Minutes | 0 | 0.0% |
| 5 to 9 Minutes | 11 | 100.0% |
| 10 to 14 Minutes | 0 | 0.0% |
| 15 to 19 Minutes | 0 | 0.0% |
| 20 to 24 Minutes | 0 | 0.0% |
| 25 to 29 Minutes | 0 | 0.0% |
| 30 to 34 Minutes | 0 | 0.0% |
| 35 to 39 Minutes | 0 | 0.0% |
| 40 to 44 Minutes | 0 | 0.0% |
| 45 to 59 Minutes | 0 | 0.0% |
| 60 to 89 Minutes | 0 | 0.0% |
| 90 or more Minutes | 0 | 0.0% |
Commute Time by Sex in Clyde
| Commute Time | Male | Female |
| Less than 5 Minutes | 0 (0.0%) | 0 (0.0%) |
| 5 to 9 Minutes | 0 (0.0%) | 11 (100.0%) |
| 10 to 14 Minutes | 0 (0.0%) | 0 (0.0%) |
| 15 to 19 Minutes | 0 (0.0%) | 0 (0.0%) |
| 20 to 24 Minutes | 0 (0.0%) | 0 (0.0%) |
| 25 to 29 Minutes | 0 (0.0%) | 0 (0.0%) |
| 30 to 34 Minutes | 0 (0.0%) | 0 (0.0%) |
| 35 to 39 Minutes | 0 (0.0%) | 0 (0.0%) |
| 40 to 44 Minutes | 0 (0.0%) | 0 (0.0%) |
| 45 to 59 Minutes | 0 (0.0%) | 0 (0.0%) |
| 60 to 89 Minutes | 0 (0.0%) | 0 (0.0%) |
| 90 or more Minutes | 0 (0.0%) | 0 (0.0%) |
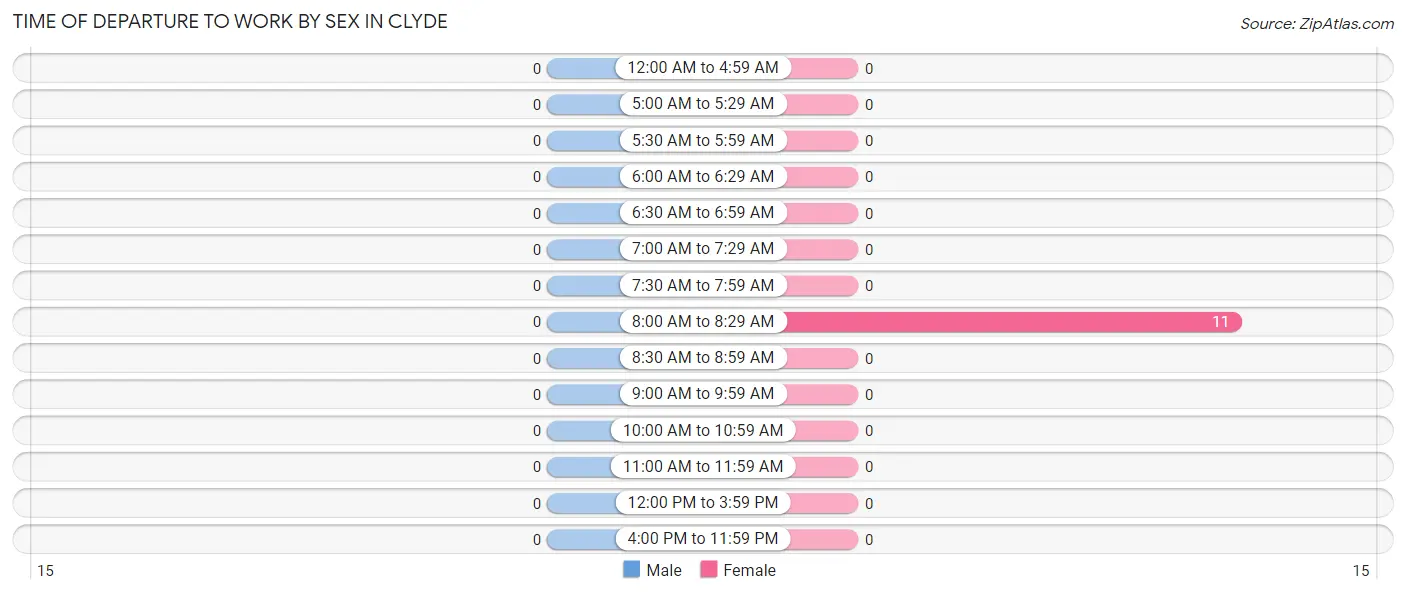
Time of Departure to Work by Sex in Clyde
| Time of Departure | Male | Female |
| 12:00 AM to 4:59 AM | 0 (0.0%) | 0 (0.0%) |
| 5:00 AM to 5:29 AM | 0 (0.0%) | 0 (0.0%) |
| 5:30 AM to 5:59 AM | 0 (0.0%) | 0 (0.0%) |
| 6:00 AM to 6:29 AM | 0 (0.0%) | 0 (0.0%) |
| 6:30 AM to 6:59 AM | 0 (0.0%) | 0 (0.0%) |
| 7:00 AM to 7:29 AM | 0 (0.0%) | 0 (0.0%) |
| 7:30 AM to 7:59 AM | 0 (0.0%) | 0 (0.0%) |
| 8:00 AM to 8:29 AM | 0 (0.0%) | 11 (100.0%) |
| 8:30 AM to 8:59 AM | 0 (0.0%) | 0 (0.0%) |
| 9:00 AM to 9:59 AM | 0 (0.0%) | 0 (0.0%) |
| 10:00 AM to 10:59 AM | 0 (0.0%) | 0 (0.0%) |
| 11:00 AM to 11:59 AM | 0 (0.0%) | 0 (0.0%) |
| 12:00 PM to 3:59 PM | 0 (0.0%) | 0 (0.0%) |
| 4:00 PM to 11:59 PM | 0 (0.0%) | 0 (0.0%) |
| Total | 0 (0.0%) | 11 (100.0%) |
Housing Occupancy in Clyde
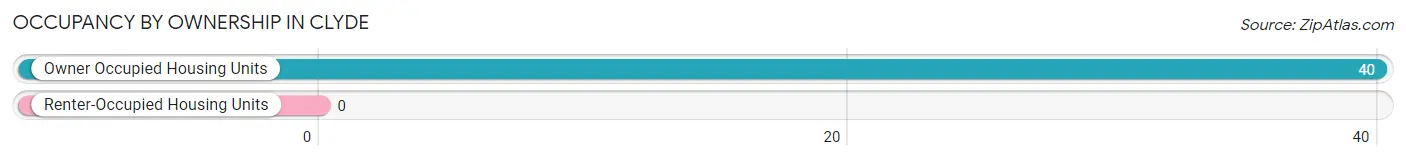
Occupancy by Ownership in Clyde
Of the total 40 dwellings in Clyde, owner-occupied units account for 40 (100.0%), while renter-occupied units make up 0 (0.0%).
| Occupancy | # Housing Units | % Housing Units |
| Owner Occupied Housing Units | 40 | 100.0% |
| Renter-Occupied Housing Units | 0 | 0.0% |
| Total Occupied Housing Units | 40 | 100.0% |
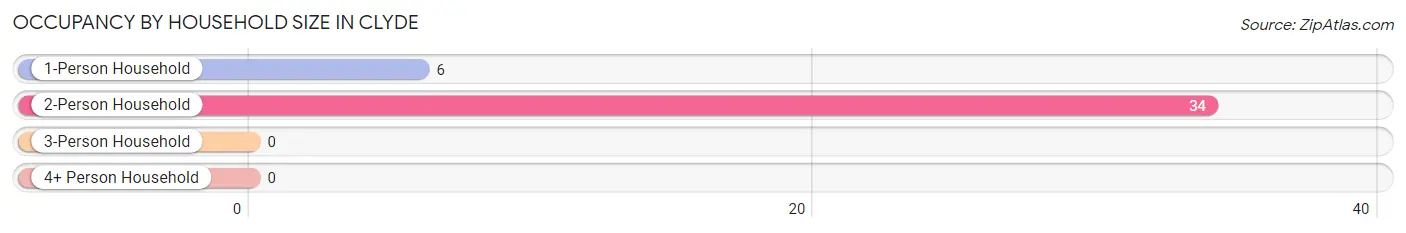
Occupancy by Household Size in Clyde
| Household Size | # Housing Units | % Housing Units |
| 1-Person Household | 6 | 15.0% |
| 2-Person Household | 34 | 85.0% |
| 3-Person Household | 0 | 0.0% |
| 4+ Person Household | 0 | 0.0% |
| Total Housing Units | 40 | 100.0% |
Occupancy by Ownership by Household Size in Clyde
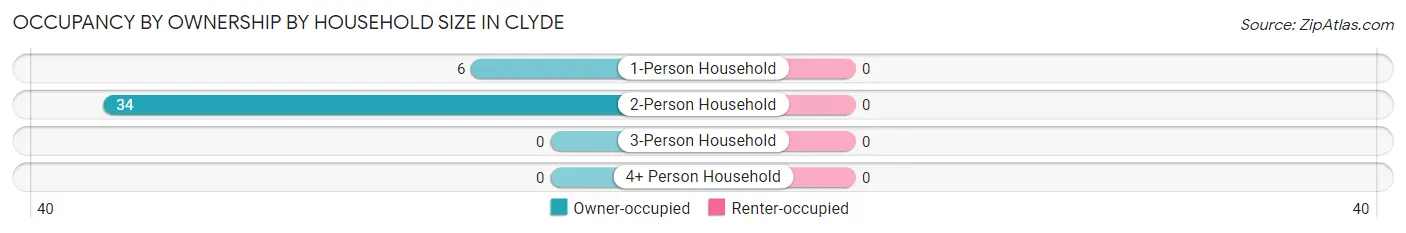
| Household Size | Owner-occupied | Renter-occupied |
| 1-Person Household | 6 (100.0%) | 0 (0.0%) |
| 2-Person Household | 34 (100.0%) | 0 (0.0%) |
| 3-Person Household | 0 (0.0%) | 0 (0.0%) |
| 4+ Person Household | 0 (0.0%) | 0 (0.0%) |
| Total Housing Units | 40 (100.0%) | 0 (0.0%) |
Occupancy by Educational Attainment in Clyde
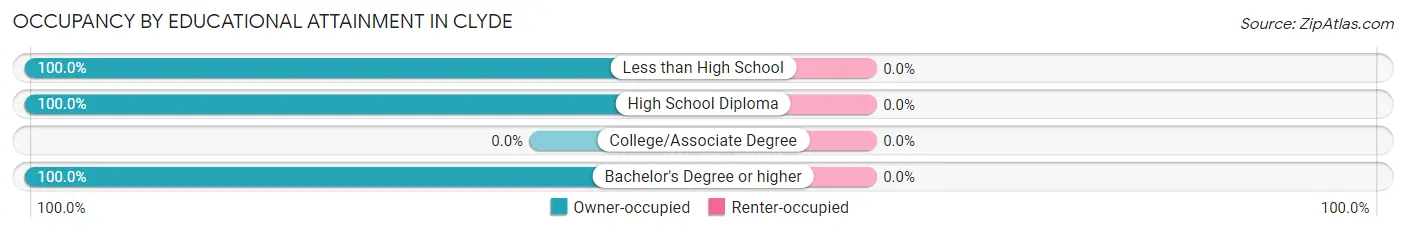
| Household Size | Owner-occupied | Renter-occupied |
| Less than High School | 13 (100.0%) | 0 (0.0%) |
| High School Diploma | 6 (100.0%) | 0 (0.0%) |
| College/Associate Degree | 0 (0.0%) | 0 (0.0%) |
| Bachelor's Degree or higher | 21 (100.0%) | 0 (0.0%) |
Occupancy by Age of Householder in Clyde
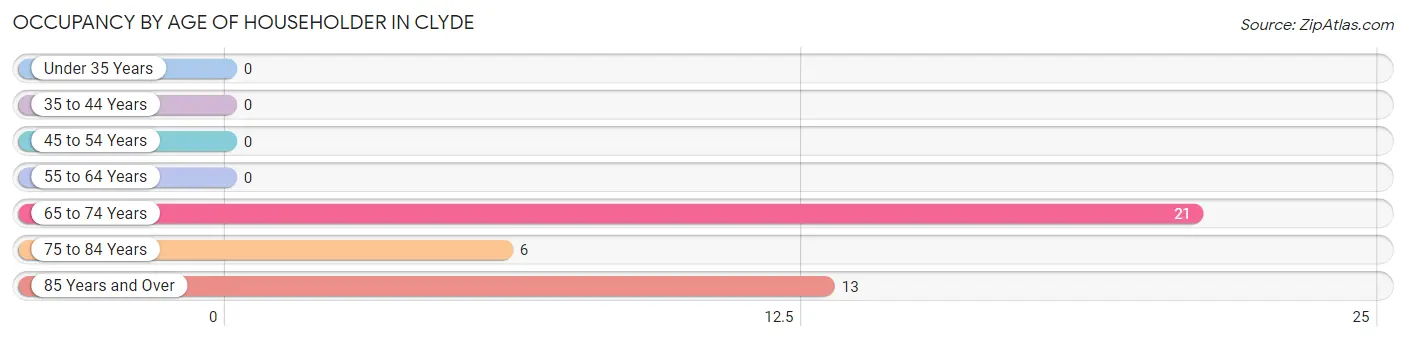
| Age Bracket | # Households | % Households |
| Under 35 Years | 0 | 0.0% |
| 35 to 44 Years | 0 | 0.0% |
| 45 to 54 Years | 0 | 0.0% |
| 55 to 64 Years | 0 | 0.0% |
| 65 to 74 Years | 21 | 52.5% |
| 75 to 84 Years | 6 | 15.0% |
| 85 Years and Over | 13 | 32.5% |
| Total | 40 | 100.0% |
Housing Finances in Clyde
Median Income by Occupancy in Clyde
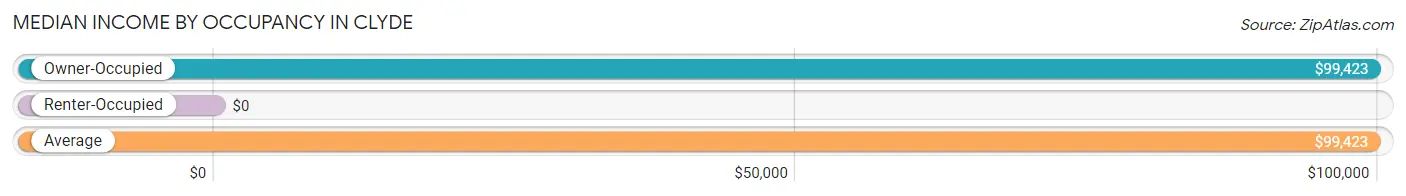
| Occupancy Type | # Households | Median Income |
| Owner-Occupied | 40 (100.0%) | $99,423 |
| Renter-Occupied | 0 (0.0%) | $0 |
| Average | 40 (100.0%) | $99,423 |
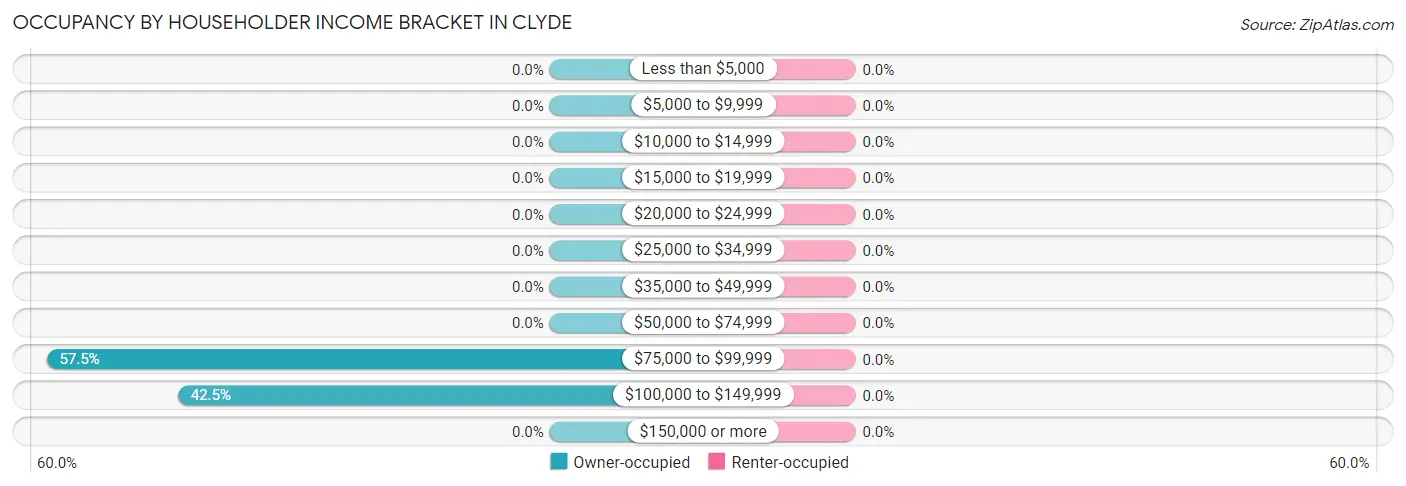
Occupancy by Householder Income Bracket in Clyde
| Income Bracket | Owner-occupied | Renter-occupied |
| Less than $5,000 | 0 (0.0%) | 0 (0.0%) |
| $5,000 to $9,999 | 0 (0.0%) | 0 (0.0%) |
| $10,000 to $14,999 | 0 (0.0%) | 0 (0.0%) |
| $15,000 to $19,999 | 0 (0.0%) | 0 (0.0%) |
| $20,000 to $24,999 | 0 (0.0%) | 0 (0.0%) |
| $25,000 to $34,999 | 0 (0.0%) | 0 (0.0%) |
| $35,000 to $49,999 | 0 (0.0%) | 0 (0.0%) |
| $50,000 to $74,999 | 0 (0.0%) | 0 (0.0%) |
| $75,000 to $99,999 | 23 (57.5%) | 0 (0.0%) |
| $100,000 to $149,999 | 17 (42.5%) | 0 (0.0%) |
| $150,000 or more | 0 (0.0%) | 0 (0.0%) |
| Total | 40 (100.0%) | 0 (0.0%) |
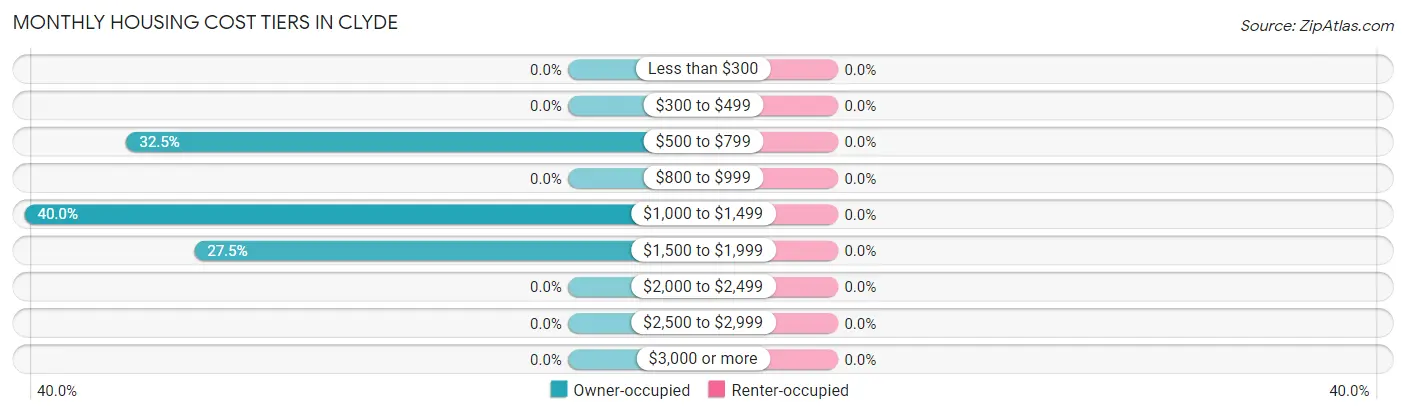
Monthly Housing Cost Tiers in Clyde
| Monthly Cost | Owner-occupied | Renter-occupied |
| Less than $300 | 0 (0.0%) | 0 (0.0%) |
| $300 to $499 | 0 (0.0%) | 0 (0.0%) |
| $500 to $799 | 13 (32.5%) | 0 (0.0%) |
| $800 to $999 | 0 (0.0%) | 0 (0.0%) |
| $1,000 to $1,499 | 16 (40.0%) | 0 (0.0%) |
| $1,500 to $1,999 | 11 (27.5%) | 0 (0.0%) |
| $2,000 to $2,499 | 0 (0.0%) | 0 (0.0%) |
| $2,500 to $2,999 | 0 (0.0%) | 0 (0.0%) |
| $3,000 or more | 0 (0.0%) | 0 (0.0%) |
| Total | 40 (100.0%) | 0 (0.0%) |
Physical Housing Characteristics in Clyde
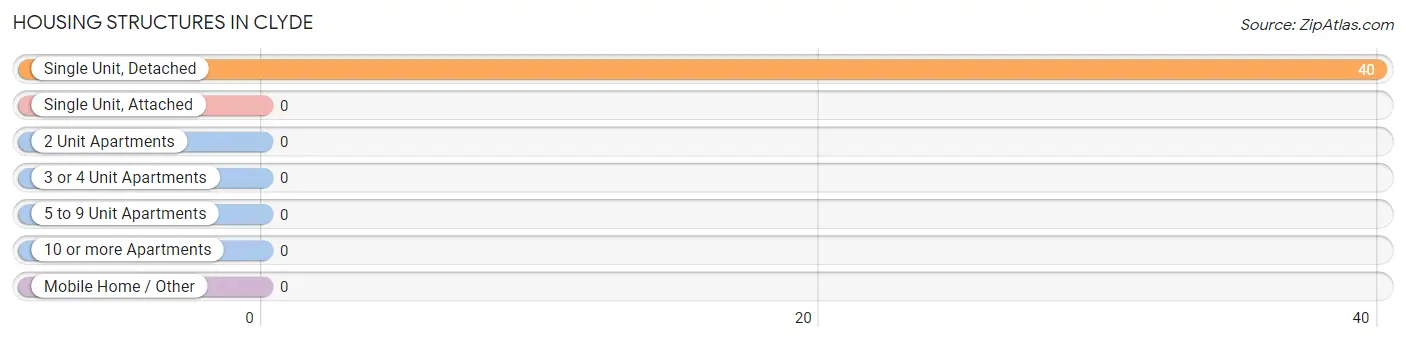
Housing Structures in Clyde
| Structure Type | # Housing Units | % Housing Units |
| Single Unit, Detached | 40 | 100.0% |
| Single Unit, Attached | 0 | 0.0% |
| 2 Unit Apartments | 0 | 0.0% |
| 3 or 4 Unit Apartments | 0 | 0.0% |
| 5 to 9 Unit Apartments | 0 | 0.0% |
| 10 or more Apartments | 0 | 0.0% |
| Mobile Home / Other | 0 | 0.0% |
| Total | 40 | 100.0% |
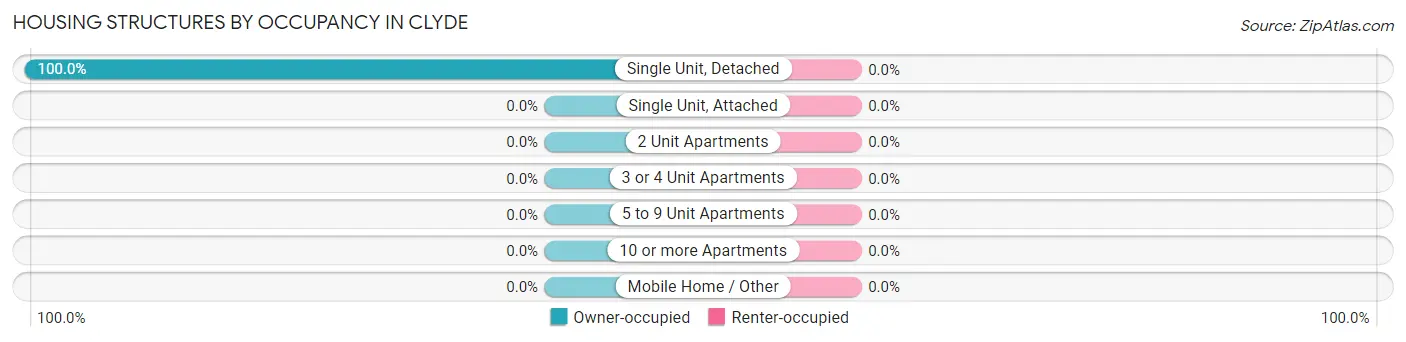
Housing Structures by Occupancy in Clyde
| Structure Type | Owner-occupied | Renter-occupied |
| Single Unit, Detached | 40 (100.0%) | 0 (0.0%) |
| Single Unit, Attached | 0 (0.0%) | 0 (0.0%) |
| 2 Unit Apartments | 0 (0.0%) | 0 (0.0%) |
| 3 or 4 Unit Apartments | 0 (0.0%) | 0 (0.0%) |
| 5 to 9 Unit Apartments | 0 (0.0%) | 0 (0.0%) |
| 10 or more Apartments | 0 (0.0%) | 0 (0.0%) |
| Mobile Home / Other | 0 (0.0%) | 0 (0.0%) |
| Total | 40 (100.0%) | 0 (0.0%) |
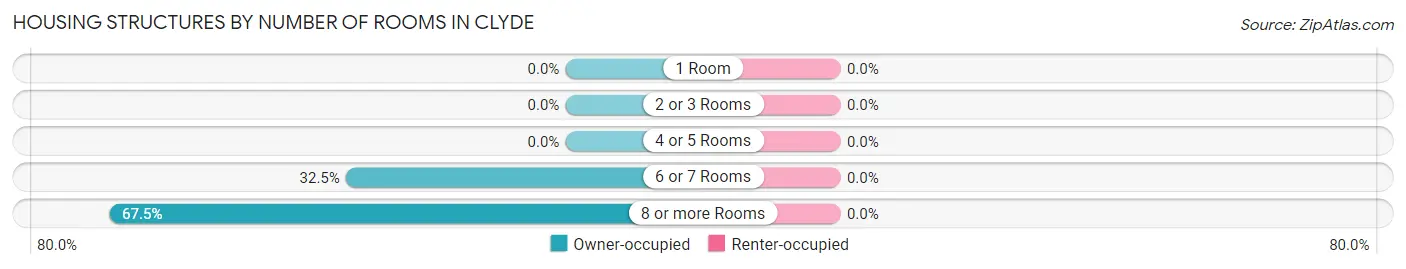
Housing Structures by Number of Rooms in Clyde
| Number of Rooms | Owner-occupied | Renter-occupied |
| 1 Room | 0 (0.0%) | 0 (0.0%) |
| 2 or 3 Rooms | 0 (0.0%) | 0 (0.0%) |
| 4 or 5 Rooms | 0 (0.0%) | 0 (0.0%) |
| 6 or 7 Rooms | 13 (32.5%) | 0 (0.0%) |
| 8 or more Rooms | 27 (67.5%) | 0 (0.0%) |
| Total | 40 (100.0%) | 0 (0.0%) |
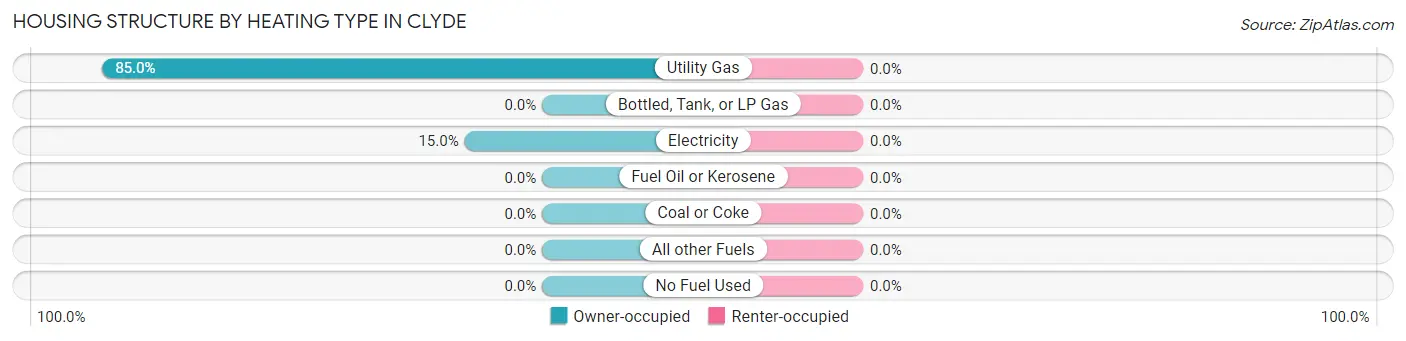
Housing Structure by Heating Type in Clyde
| Heating Type | Owner-occupied | Renter-occupied |
| Utility Gas | 34 (85.0%) | 0 (0.0%) |
| Bottled, Tank, or LP Gas | 0 (0.0%) | 0 (0.0%) |
| Electricity | 6 (15.0%) | 0 (0.0%) |
| Fuel Oil or Kerosene | 0 (0.0%) | 0 (0.0%) |
| Coal or Coke | 0 (0.0%) | 0 (0.0%) |
| All other Fuels | 0 (0.0%) | 0 (0.0%) |
| No Fuel Used | 0 (0.0%) | 0 (0.0%) |
| Total | 40 (100.0%) | 0 (0.0%) |
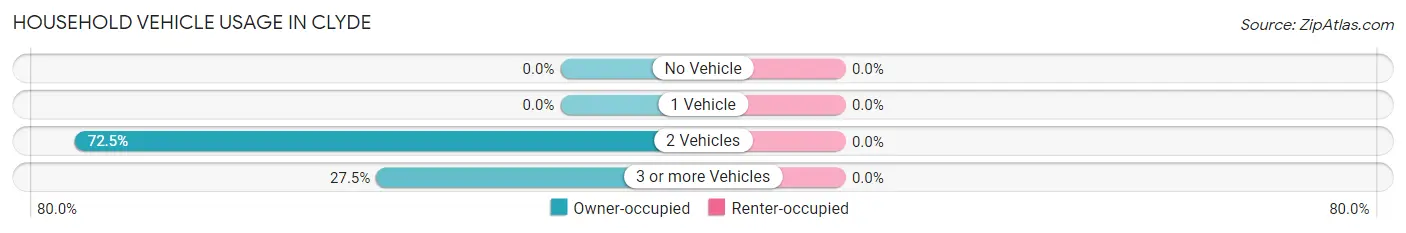
Household Vehicle Usage in Clyde
| Vehicles per Household | Owner-occupied | Renter-occupied |
| No Vehicle | 0 (0.0%) | 0 (0.0%) |
| 1 Vehicle | 0 (0.0%) | 0 (0.0%) |
| 2 Vehicles | 29 (72.5%) | 0 (0.0%) |
| 3 or more Vehicles | 11 (27.5%) | 0 (0.0%) |
| Total | 40 (100.0%) | 0 (0.0%) |
Real Estate & Mortgages in Clyde
Real Estate and Mortgage Overview in Clyde
| Characteristic | Without Mortgage | With Mortgage |
| Housing Units | 40 | 0 |
| Median Property Value | $433,300 | $0 |
| Median Household Income | $99,423 | $0 |
| Monthly Housing Costs | $1,270 | $0 |
| Real Estate Taxes | $9,250 | $0 |
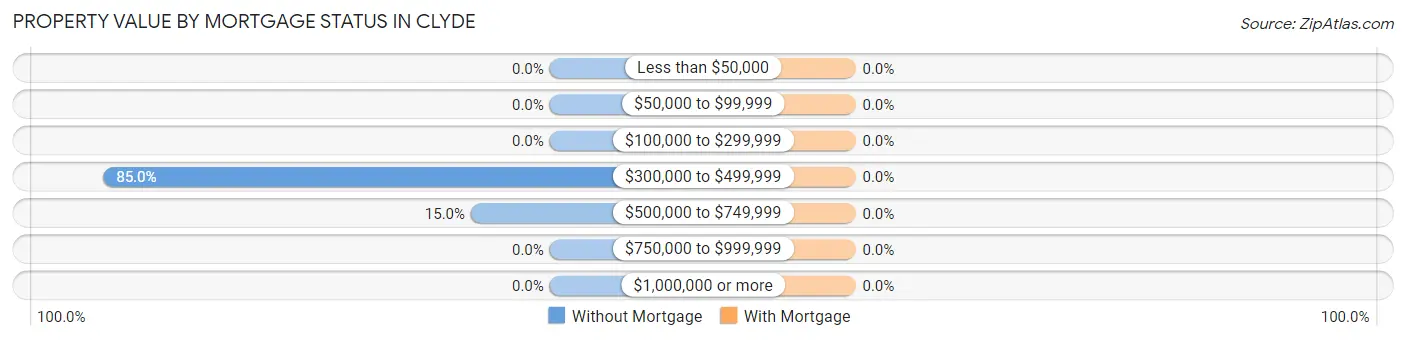
Property Value by Mortgage Status in Clyde
| Property Value | Without Mortgage | With Mortgage |
| Less than $50,000 | 0 (0.0%) | 0 (0.0%) |
| $50,000 to $99,999 | 0 (0.0%) | 0 (0.0%) |
| $100,000 to $299,999 | 0 (0.0%) | 0 (0.0%) |
| $300,000 to $499,999 | 34 (85.0%) | 0 (0.0%) |
| $500,000 to $749,999 | 6 (15.0%) | 0 (0.0%) |
| $750,000 to $999,999 | 0 (0.0%) | 0 (0.0%) |
| $1,000,000 or more | 0 (0.0%) | 0 (0.0%) |
| Total | 40 (100.0%) | 0 (0.0%) |
Household Income by Mortgage Status in Clyde
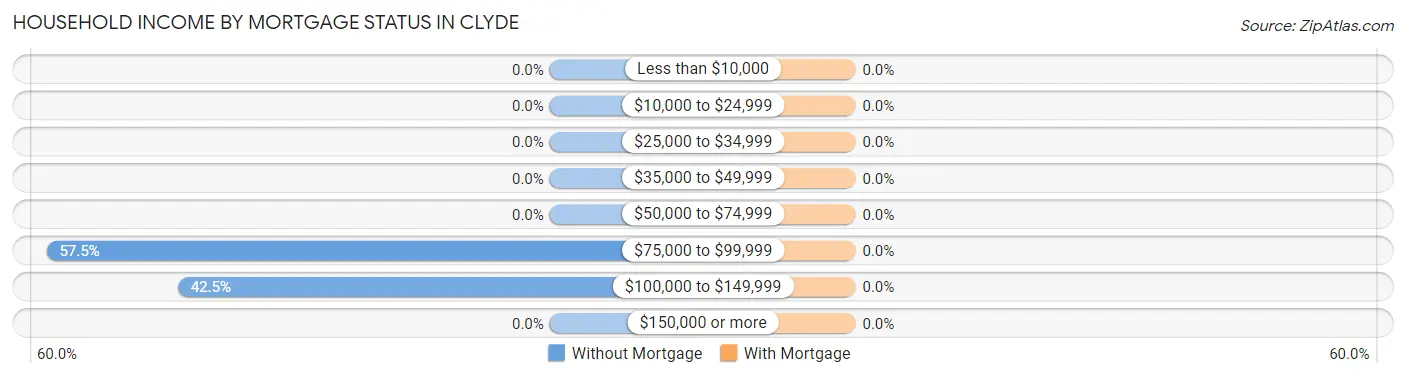
| Household Income | Without Mortgage | With Mortgage |
| Less than $10,000 | 0 (0.0%) | 0 (0.0%) |
| $10,000 to $24,999 | 0 (0.0%) | 0 (0.0%) |
| $25,000 to $34,999 | 0 (0.0%) | 0 (0.0%) |
| $35,000 to $49,999 | 0 (0.0%) | 0 (0.0%) |
| $50,000 to $74,999 | 0 (0.0%) | 0 (0.0%) |
| $75,000 to $99,999 | 23 (57.5%) | 0 (0.0%) |
| $100,000 to $149,999 | 17 (42.5%) | 0 (0.0%) |
| $150,000 or more | 0 (0.0%) | 0 (0.0%) |
| Total | 40 (100.0%) | 0 (0.0%) |
Property Value to Household Income Ratio in Clyde
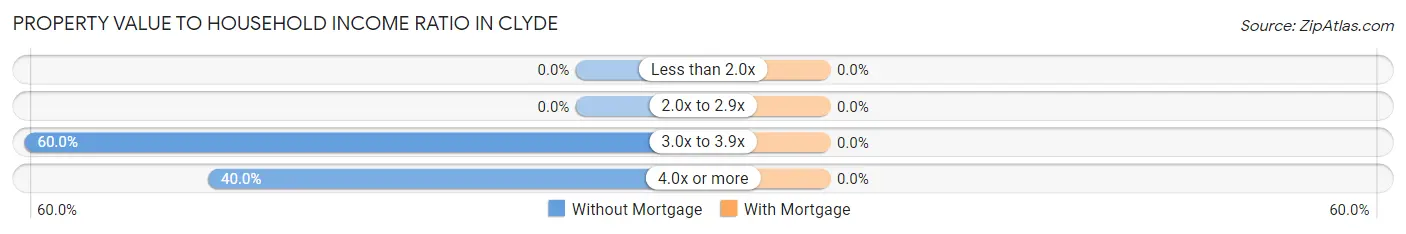
| Value-to-Income Ratio | Without Mortgage | With Mortgage |
| Less than 2.0x | 0 (0.0%) | 0 (0.0%) |
| 2.0x to 2.9x | 0 (0.0%) | 0 (0.0%) |
| 3.0x to 3.9x | 24 (60.0%) | 0 (0.0%) |
| 4.0x or more | 16 (40.0%) | 0 (0.0%) |
| Total | 40 (100.0%) | 0 (0.0%) |
Real Estate Taxes by Mortgage Status in Clyde
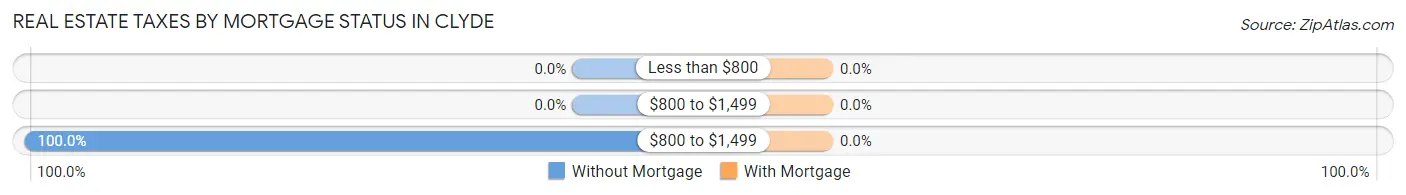
| Property Taxes | Without Mortgage | With Mortgage |
| Less than $800 | 0 (0.0%) | 0 (0.0%) |
| $800 to $1,499 | 0 (0.0%) | 0 (0.0%) |
| $800 to $1,499 | 40 (100.0%) | 0 (0.0%) |
| Total | 40 (100.0%) | 0 (0.0%) |
Health & Disability in Clyde
Health Insurance Coverage by Age in Clyde
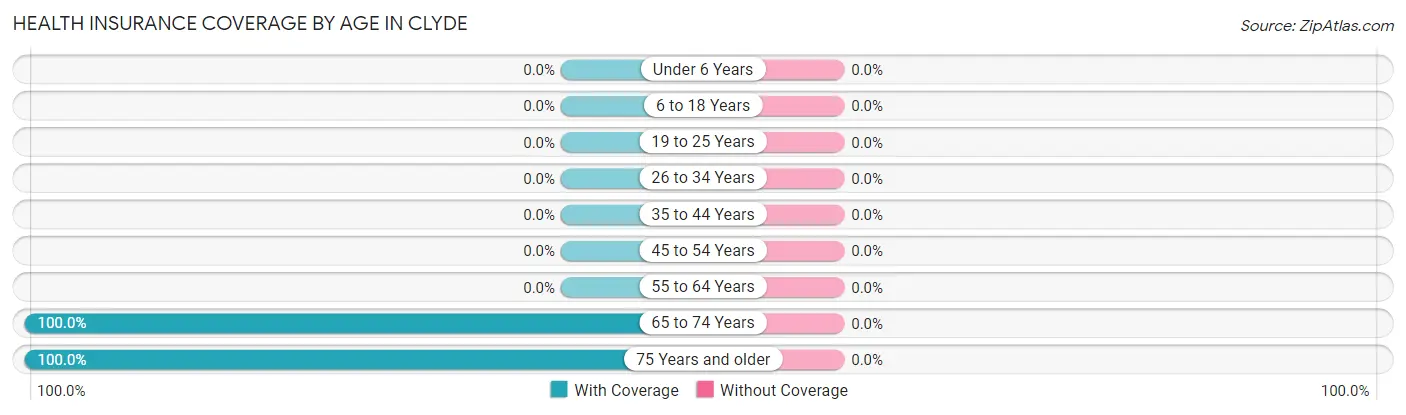
| Age Bracket | With Coverage | Without Coverage |
| Under 6 Years | 0 (0.0%) | 0 (0.0%) |
| 6 to 18 Years | 0 (0.0%) | 0 (0.0%) |
| 19 to 25 Years | 0 (0.0%) | 0 (0.0%) |
| 26 to 34 Years | 0 (0.0%) | 0 (0.0%) |
| 35 to 44 Years | 0 (0.0%) | 0 (0.0%) |
| 45 to 54 Years | 0 (0.0%) | 0 (0.0%) |
| 55 to 64 Years | 0 (0.0%) | 0 (0.0%) |
| 65 to 74 Years | 43 (100.0%) | 0 (0.0%) |
| 75 Years and older | 33 (100.0%) | 0 (0.0%) |
| Total | 76 (100.0%) | 0 (0.0%) |
Health Insurance Coverage by Citizenship Status in Clyde
| Citizenship Status | With Coverage | Without Coverage |
| Native Born | 0 (0.0%) | 0 (0.0%) |
| Foreign Born, Citizen | 0 (0.0%) | 0 (0.0%) |
| Foreign Born, not a Citizen | 0 (0.0%) | 0 (0.0%) |
Health Insurance Coverage by Household Income in Clyde
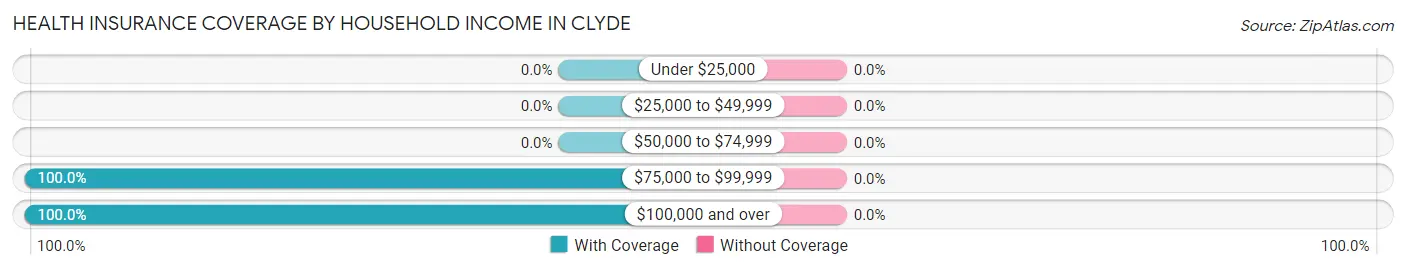
| Household Income | With Coverage | Without Coverage |
| Under $25,000 | 0 (0.0%) | 0 (0.0%) |
| $25,000 to $49,999 | 0 (0.0%) | 0 (0.0%) |
| $50,000 to $74,999 | 0 (0.0%) | 0 (0.0%) |
| $75,000 to $99,999 | 48 (100.0%) | 0 (0.0%) |
| $100,000 and over | 28 (100.0%) | 0 (0.0%) |
Public vs Private Health Insurance Coverage by Age in Clyde
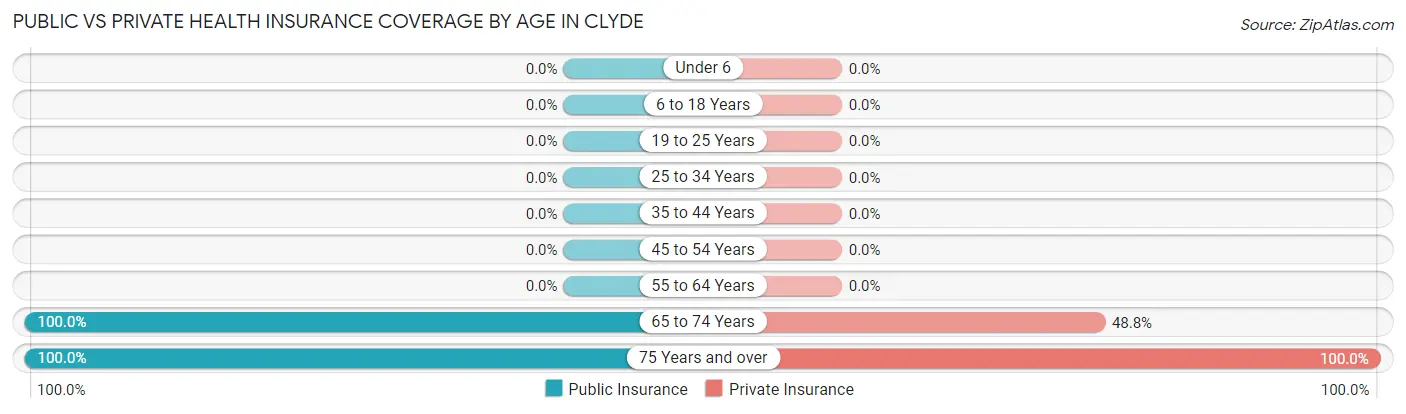
| Age Bracket | Public Insurance | Private Insurance |
| Under 6 | 0 (0.0%) | 0 (0.0%) |
| 6 to 18 Years | 0 (0.0%) | 0 (0.0%) |
| 19 to 25 Years | 0 (0.0%) | 0 (0.0%) |
| 25 to 34 Years | 0 (0.0%) | 0 (0.0%) |
| 35 to 44 Years | 0 (0.0%) | 0 (0.0%) |
| 45 to 54 Years | 0 (0.0%) | 0 (0.0%) |
| 55 to 64 Years | 0 (0.0%) | 0 (0.0%) |
| 65 to 74 Years | 43 (100.0%) | 21 (48.8%) |
| 75 Years and over | 33 (100.0%) | 33 (100.0%) |
| Total | 76 (100.0%) | 54 (71.1%) |
Disability Status by Sex by Age in Clyde
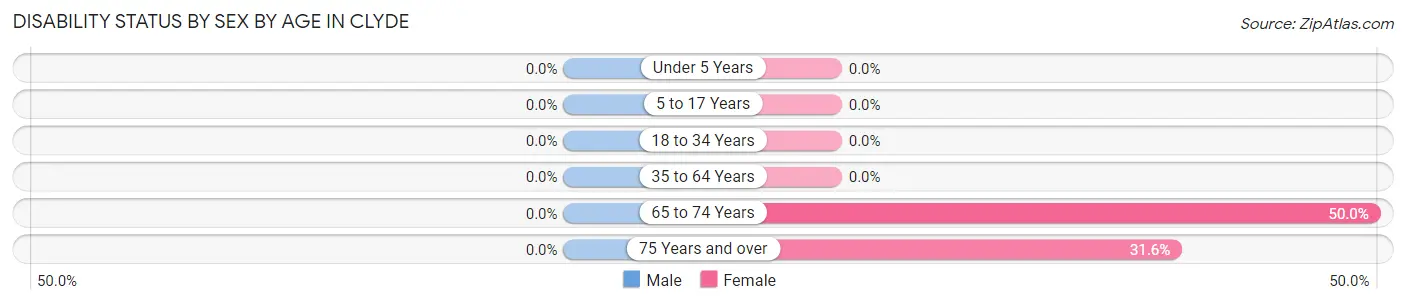
| Age Bracket | Male | Female |
| Under 5 Years | 0 (0.0%) | 0 (0.0%) |
| 5 to 17 Years | 0 (0.0%) | 0 (0.0%) |
| 18 to 34 Years | 0 (0.0%) | 0 (0.0%) |
| 35 to 64 Years | 0 (0.0%) | 0 (0.0%) |
| 65 to 74 Years | 0 (0.0%) | 11 (50.0%) |
| 75 Years and over | 0 (0.0%) | 6 (31.6%) |
Disability Class by Sex by Age in Clyde
Disability Class: Hearing Difficulty
| Age Bracket | Male | Female |
| Under 5 Years | 0 (0.0%) | 0 (0.0%) |
| 5 to 17 Years | 0 (0.0%) | 0 (0.0%) |
| 18 to 34 Years | 0 (0.0%) | 0 (0.0%) |
| 35 to 64 Years | 0 (0.0%) | 0 (0.0%) |
| 65 to 74 Years | 0 (0.0%) | 0 (0.0%) |
| 75 Years and over | 0 (0.0%) | 0 (0.0%) |
Disability Class: Vision Difficulty
| Age Bracket | Male | Female |
| Under 5 Years | 0 (0.0%) | 0 (0.0%) |
| 5 to 17 Years | 0 (0.0%) | 0 (0.0%) |
| 18 to 34 Years | 0 (0.0%) | 0 (0.0%) |
| 35 to 64 Years | 0 (0.0%) | 0 (0.0%) |
| 65 to 74 Years | 0 (0.0%) | 0 (0.0%) |
| 75 Years and over | 0 (0.0%) | 0 (0.0%) |
Disability Class: Cognitive Difficulty
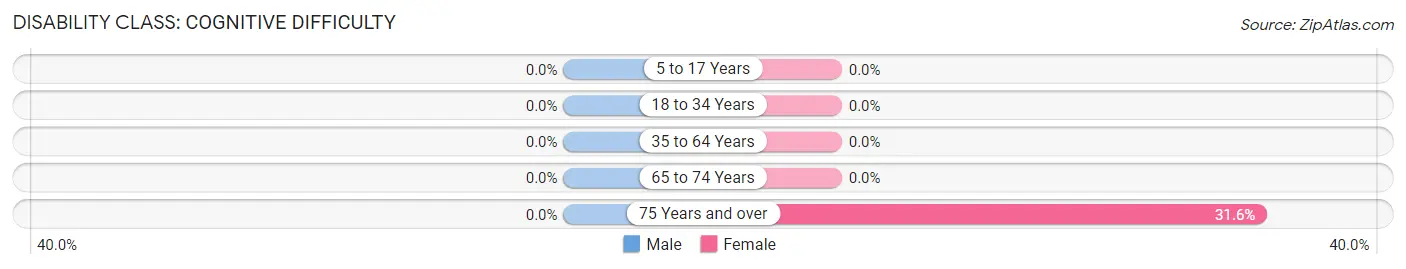
| Age Bracket | Male | Female |
| 5 to 17 Years | 0 (0.0%) | 0 (0.0%) |
| 18 to 34 Years | 0 (0.0%) | 0 (0.0%) |
| 35 to 64 Years | 0 (0.0%) | 0 (0.0%) |
| 65 to 74 Years | 0 (0.0%) | 0 (0.0%) |
| 75 Years and over | 0 (0.0%) | 6 (31.6%) |
Disability Class: Ambulatory Difficulty
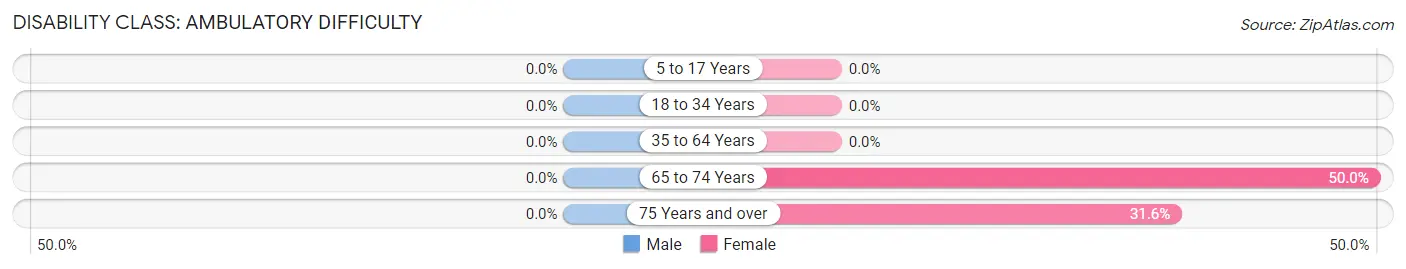
| Age Bracket | Male | Female |
| 5 to 17 Years | 0 (0.0%) | 0 (0.0%) |
| 18 to 34 Years | 0 (0.0%) | 0 (0.0%) |
| 35 to 64 Years | 0 (0.0%) | 0 (0.0%) |
| 65 to 74 Years | 0 (0.0%) | 11 (50.0%) |
| 75 Years and over | 0 (0.0%) | 6 (31.6%) |
Disability Class: Self-Care Difficulty
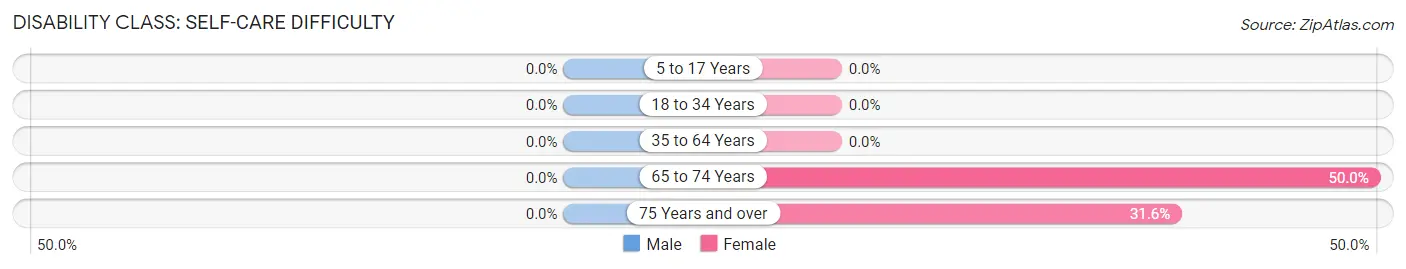
| Age Bracket | Male | Female |
| 5 to 17 Years | 0 (0.0%) | 0 (0.0%) |
| 18 to 34 Years | 0 (0.0%) | 0 (0.0%) |
| 35 to 64 Years | 0 (0.0%) | 0 (0.0%) |
| 65 to 74 Years | 0 (0.0%) | 11 (50.0%) |
| 75 Years and over | 0 (0.0%) | 6 (31.6%) |
Technology Access in Clyde
Computing Device Access in Clyde
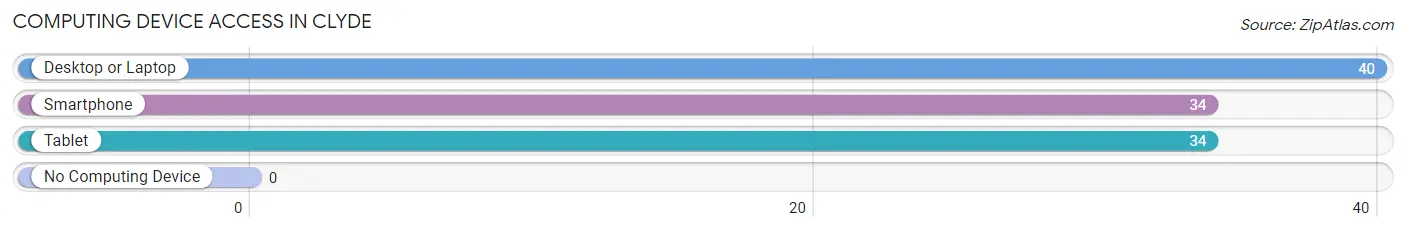
| Device Type | # Households | % Households |
| Desktop or Laptop | 40 | 100.0% |
| Smartphone | 34 | 85.0% |
| Tablet | 34 | 85.0% |
| No Computing Device | 0 | 0.0% |
| Total | 40 | 100.0% |
Internet Access in Clyde
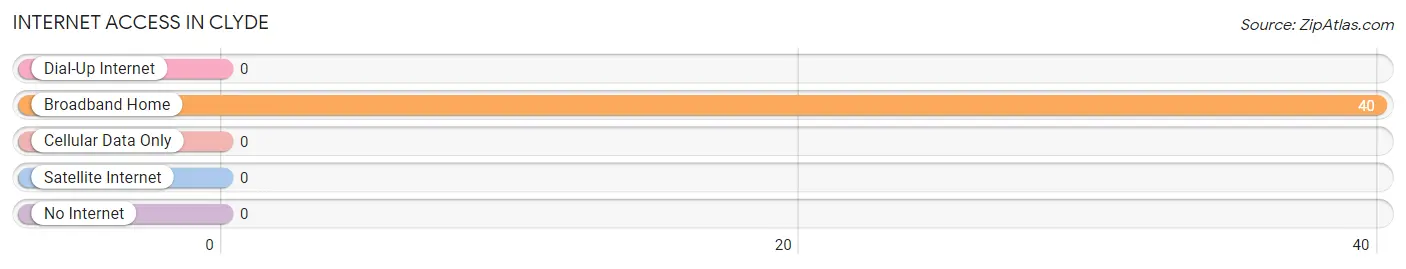
| Internet Type | # Households | % Households |
| Dial-Up Internet | 0 | 0.0% |
| Broadband Home | 40 | 100.0% |
| Cellular Data Only | 0 | 0.0% |
| Satellite Internet | 0 | 0.0% |
| No Internet | 0 | 0.0% |
| Total | 40 | 100.0% |
Clyde Summary
Clyde is a small borough located in Hunterdon County, New Jersey. It is situated in the northwest corner of the county, and is bordered by the townships of Alexandria, Bethlehem, and Franklin. The borough was incorporated in 1904, and is home to a population of approximately 1,000 people.
Geography
Clyde is located at 40°37'25" North, 75°02'45" West (40.623861, -75.045862). According to the United States Census Bureau, the borough has a total area of 0.7 square miles (1.8 km2), all of which is land.
The borough is located in the northwest corner of Hunterdon County, and is bordered by the townships of Alexandria, Bethlehem, and Franklin. The Musconetcong River forms the western boundary of the borough.
Economy
Clyde is a small, rural community with a limited economy. The majority of the borough’s residents are employed in the service sector, with a few employed in the manufacturing and retail industries. The borough does not have any major employers, but there are several small businesses located in the area.
Demographics
As of the 2010 United States Census, there were 1,006 people, 393 households, and 279 families residing in the borough. The population density was 1,427.1 people per square mile (550.3/km2). There were 412 housing units at an average density of 583.3 per square mile (225.3/km2). The racial makeup of the borough was 97.2% White, 0.7% African American, 0.2% Native American, 0.4% Asian, 0.2% from other races, and 1.3% from two or more races. Hispanic or Latino of any race were 2.2% of the population.
There were 393 households, out of which 33.2% had children under the age of 18 living with them, 57.2% were married couples living together, 9.3% had a female householder with no husband present, and 28.7% were non-families. 24.1% of all households were made up of individuals, and 10.7% had someone living alone who was 65 years of age or older. The average household size was 2.55 and the average family size was 3.04.
In the borough, the population was spread out, with 24.7% under the age of 18, 6.3% from 18 to 24, 28.2% from 25 to 44, 27.2% from 45 to 64, and 13.6% who were 65 years of age or older. The median age was 39 years. For every 100 females, there were 97.2 males. For every 100 females age 18 and over, there were 94.2 males.
The median income for a household in the borough was $62,500, and the median income for a family was $71,250. Males had a median income of $50,000 versus $37,500 for females. The per capita income for the borough was $27,917. About 4.2% of families and 5.2% of the population were below the poverty line, including 6.3% of those under age 18 and 4.2% of those age 65 or over.
Common Questions
What is the Total Population of Clyde?
Total Population of Clyde is 76.
What is the Total Male Population of Clyde?
Total Male Population of Clyde is 35.
What is the Total Female Population of Clyde?
Total Female Population of Clyde is 41.
What is the Ratio of Males per 100 Females in Clyde?
There are 85.37 Males per 100 Females in Clyde.
What is the Ratio of Females per 100 Males in Clyde?
There are 117.14 Females per 100 Males in Clyde.
What is the Median Population Age in Clyde?
Median Population Age in Clyde is 69.5 Years.
What is the Average Family Size in Clyde
Average Family Size in Clyde is 2.1 People.
What is the Average Household Size in Clyde
Average Household Size in Clyde is 1.9 People.
What is Per Capita Income in Clyde?
Per Capita income in Clyde is $54,029.
What is the Median Family Income in Clyde?
Median Family Income in Clyde is $98,846.
What is the Median Household income in Clyde?
Median Household Income in Clyde is $99,423.
What is Inequality or Gini Index in Clyde?
Inequality or Gini Index in Clyde is 0.07.
How Large is the Labor Force in Clyde?
There are 11 People in the Labor Forcein in Clyde.
What is the Percentage of People in the Labor Force in Clyde?
14.5% of People are in the Labor Force in Clyde.