Bridgeville, NJ
Bridgeville Map
Bridgeville Overview
257
TOTAL POPULATION
129
MALE POPULATION
128
FEMALE POPULATION
100.78
MALES / 100 FEMALES
99.22
FEMALES / 100 MALES
36.0
MEDIAN AGE
2.5
AVG FAMILY SIZE
2.4
AVG HOUSEHOLD SIZE
$42,057
PER CAPITA INCOME
$102,656
AVG FAMILY INCOME
$103,281
AVG HOUSEHOLD INCOME
0.18
INEQUALITY / GINI INDEX
158
LABOR FORCE [ PEOPLE ]
78.2%
PERCENT IN LABOR FORCE
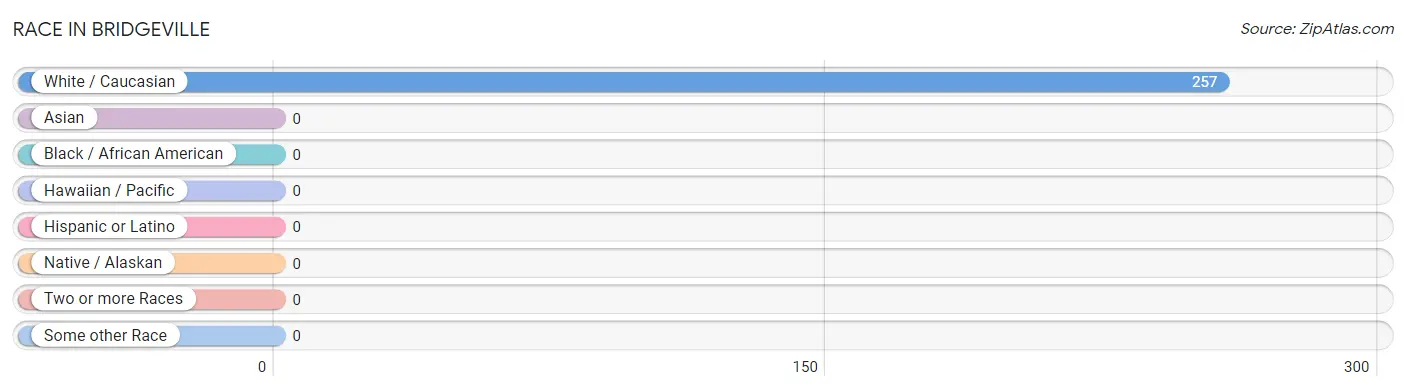
Race in Bridgeville
The most populous races in Bridgeville are , and White / Caucasian (257 | 100.0%).
| Race | # Population | % Population |
| Asian | 0 | 0.0% |
| Black / African American | 0 | 0.0% |
| Hawaiian / Pacific | 0 | 0.0% |
| Hispanic or Latino | 0 | 0.0% |
| Native / Alaskan | 0 | 0.0% |
| White / Caucasian | 257 | 100.0% |
| Two or more Races | 0 | 0.0% |
| Some other Race | 0 | 0.0% |
| Total | 257 | 100.0% |
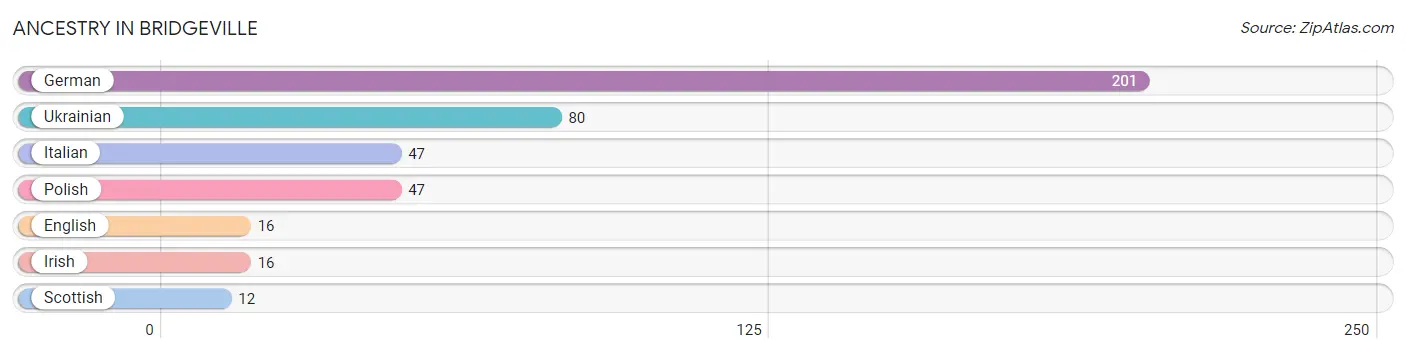
Ancestry in Bridgeville
The most populous ancestries reported in Bridgeville are German (201 | 78.2%), Ukrainian (80 | 31.1%), Italian (47 | 18.3%), Polish (47 | 18.3%), and English (16 | 6.2%), together accounting for 152.2% of all Bridgeville residents.
| Ancestry | # Population | % Population |
| English | 16 | 6.2% |
| German | 201 | 78.2% |
| Irish | 16 | 6.2% |
| Italian | 47 | 18.3% |
| Polish | 47 | 18.3% |
| Scottish | 12 | 4.7% |
| Ukrainian | 80 | 31.1% | View All 7 Rows |
Immigrants in Bridgeville

| Immigration Origin | # Population | % Population | View All 0 Rows |
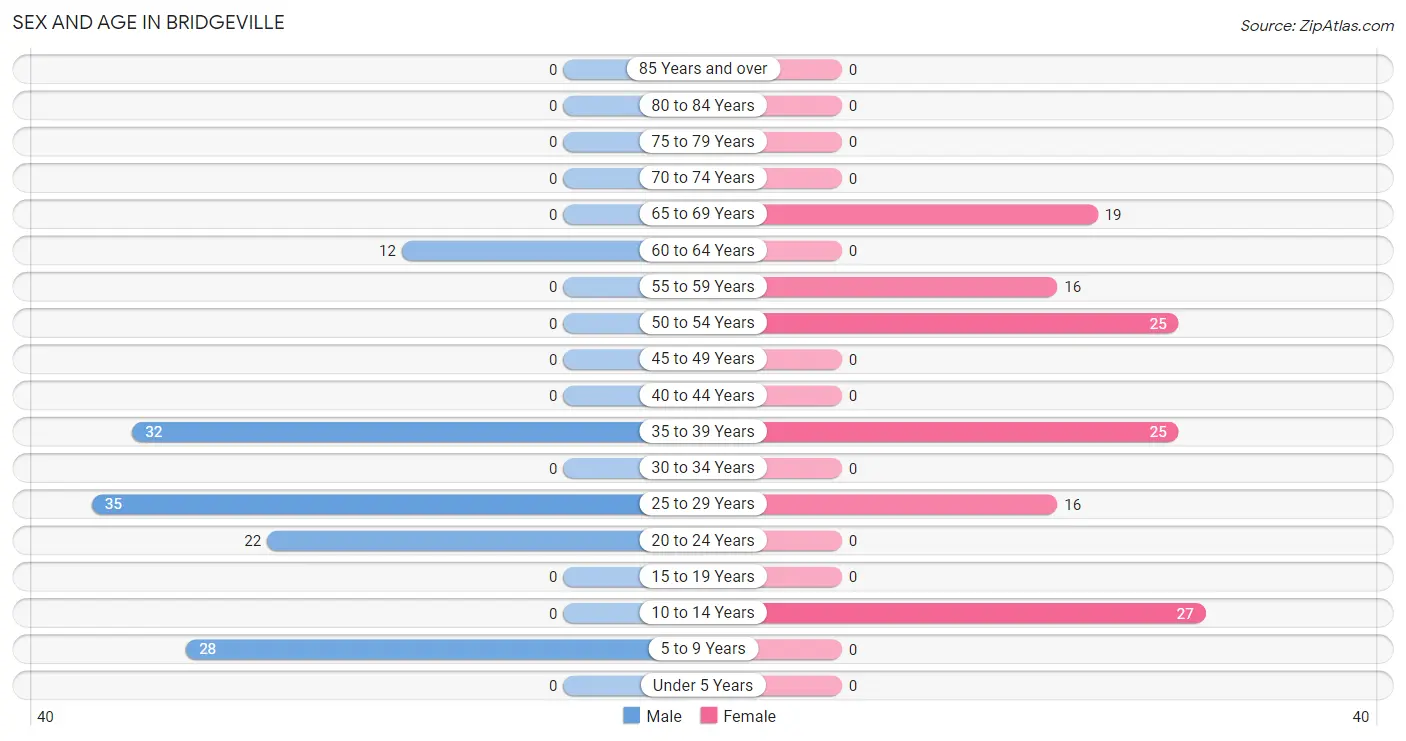
Sex and Age in Bridgeville
Sex and Age in Bridgeville
The most populous age groups in Bridgeville are 25 to 29 Years (35 | 27.1%) for men and 10 to 14 Years (27 | 21.1%) for women.
| Age Bracket | Male | Female |
| Under 5 Years | 0 (0.0%) | 0 (0.0%) |
| 5 to 9 Years | 28 (21.7%) | 0 (0.0%) |
| 10 to 14 Years | 0 (0.0%) | 27 (21.1%) |
| 15 to 19 Years | 0 (0.0%) | 0 (0.0%) |
| 20 to 24 Years | 22 (17.1%) | 0 (0.0%) |
| 25 to 29 Years | 35 (27.1%) | 16 (12.5%) |
| 30 to 34 Years | 0 (0.0%) | 0 (0.0%) |
| 35 to 39 Years | 32 (24.8%) | 25 (19.5%) |
| 40 to 44 Years | 0 (0.0%) | 0 (0.0%) |
| 45 to 49 Years | 0 (0.0%) | 0 (0.0%) |
| 50 to 54 Years | 0 (0.0%) | 25 (19.5%) |
| 55 to 59 Years | 0 (0.0%) | 16 (12.5%) |
| 60 to 64 Years | 12 (9.3%) | 0 (0.0%) |
| 65 to 69 Years | 0 (0.0%) | 19 (14.8%) |
| 70 to 74 Years | 0 (0.0%) | 0 (0.0%) |
| 75 to 79 Years | 0 (0.0%) | 0 (0.0%) |
| 80 to 84 Years | 0 (0.0%) | 0 (0.0%) |
| 85 Years and over | 0 (0.0%) | 0 (0.0%) |
| Total | 129 (100.0%) | 128 (100.0%) |
Families and Households in Bridgeville
Median Family Size in Bridgeville
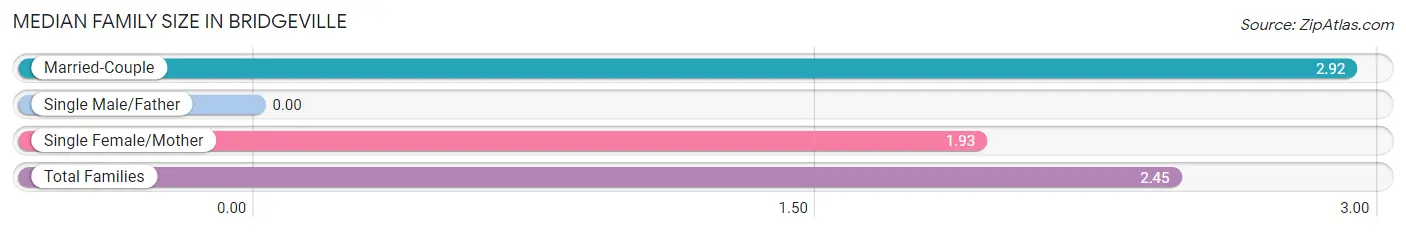
| Family Type | # Families | Family Size |
| Married-Couple | 48 (52.2%) | 2.92 |
| Single Male/Father | 0 (0.0%) | - |
| Single Female/Mother | 44 (47.8%) | 1.93 |
| Total Families | 92 (100.0%) | 2.45 |
Median Household Size in Bridgeville
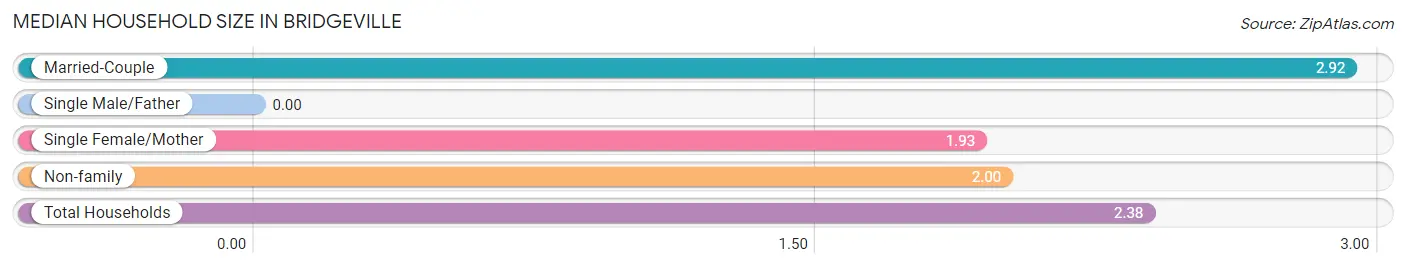
| Household Type | # Households | Household Size |
| Married-Couple | 48 (44.4%) | 2.92 |
| Single Male/Father | 0 (0.0%) | - |
| Single Female/Mother | 44 (40.7%) | 1.93 |
| Non-family | 16 (14.8%) | 2.00 |
| Total Households | 108 (100.0%) | 2.38 |
Household Size by Marriage Status in Bridgeville
Out of a total of 108 households in Bridgeville, 92 (85.2%) are family households, while 16 (14.8%) are nonfamily households. The most numerous type of family households are 2-person households, comprising 60, and the most common type of nonfamily households are 2-person households, comprising 16.
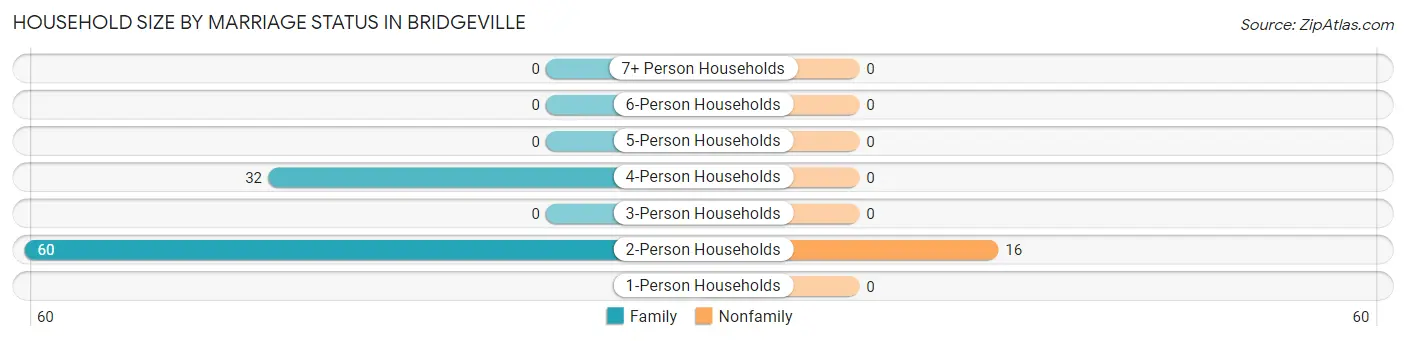
| Household Size | Family Households | Nonfamily Households |
| 1-Person Households | - | 0 (0.0%) |
| 2-Person Households | 60 (55.6%) | 16 (14.8%) |
| 3-Person Households | 0 (0.0%) | 0 (0.0%) |
| 4-Person Households | 32 (29.6%) | 0 (0.0%) |
| 5-Person Households | 0 (0.0%) | 0 (0.0%) |
| 6-Person Households | 0 (0.0%) | 0 (0.0%) |
| 7+ Person Households | 0 (0.0%) | 0 (0.0%) |
| Total | 92 (85.2%) | 16 (14.8%) |
Female Fertility in Bridgeville
Fertility by Age in Bridgeville
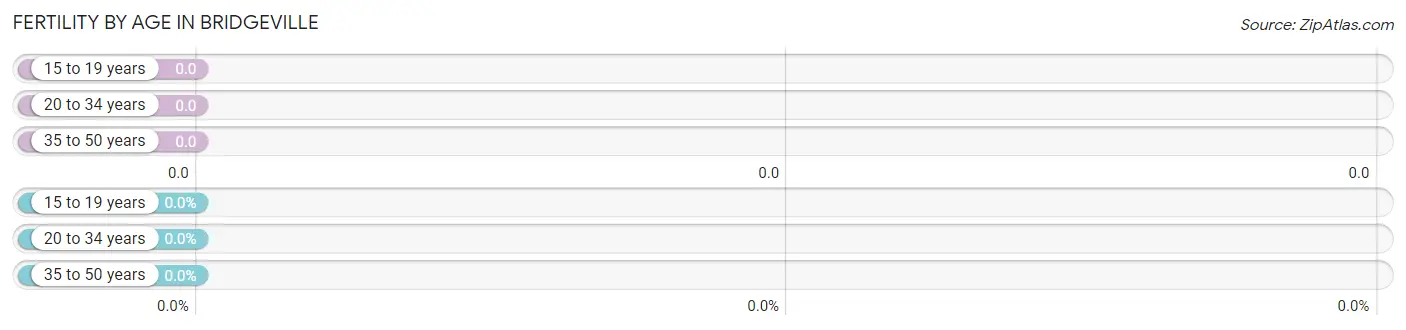
| Age Bracket | Women with Births | Births / 1,000 Women |
| 15 to 19 years | 0 (0.0%) | 0.0 |
| 20 to 34 years | 0 (0.0%) | 0.0 |
| 35 to 50 years | 0 (0.0%) | 0.0 |
| Total | 0 (0.0%) | 0.0 |
Fertility by Age by Marriage Status in Bridgeville
| Age Bracket | Married | Unmarried |
| 15 to 19 years | 0 (0.0%) | 0 (0.0%) |
| 20 to 34 years | 0 (0.0%) | 0 (0.0%) |
| 35 to 50 years | 0 (0.0%) | 0 (0.0%) |
| Total | 0 (0.0%) | 0 (0.0%) |
Fertility by Education in Bridgeville
| Educational Attainment | Women with Births | Births / 1,000 Women |
| Less than High School | 0 (0.0%) | 0.0 |
| High School Diploma | 0 (0.0%) | 0.0 |
| College or Associate's Degree | 0 (0.0%) | 0.0 |
| Bachelor's Degree | 0 (0.0%) | 0.0 |
| Graduate Degree | 0 (0.0%) | 0.0 |
| Total | 0 (0.0%) | 0.0 |
Fertility by Education by Marriage Status in Bridgeville
| Educational Attainment | Married | Unmarried |
| Less than High School | 0 (0.0%) | 0 (0.0%) |
| High School Diploma | 0 (0.0%) | 0 (0.0%) |
| College or Associate's Degree | 0 (0.0%) | 0 (0.0%) |
| Bachelor's Degree | 0 (0.0%) | 0 (0.0%) |
| Graduate Degree | 0 (0.0%) | 0 (0.0%) |
| Total | 0 (0.0%) | 0 (0.0%) |
Income in Bridgeville
Income Overview in Bridgeville
Per Capita Income in Bridgeville is $42,057, while median incomes of families and households are $102,656 and $103,281 respectively.
| Characteristic | Number | Measure |
| Per Capita Income | 257 | $42,057 |
| Median Family Income | 92 | $102,656 |
| Mean Family Income | 92 | $91,026 |
| Median Household Income | 108 | $103,281 |
| Mean Household Income | 108 | $102,484 |
| Income Deficit | 92 | $0 |
| Wage / Income Gap (%) | 257 | 0.00% |
| Wage / Income Gap ($) | 257 | 100.00¢ per $1 |
| Gini / Inequality Index | 257 | 0.18 |
Earnings by Sex in Bridgeville
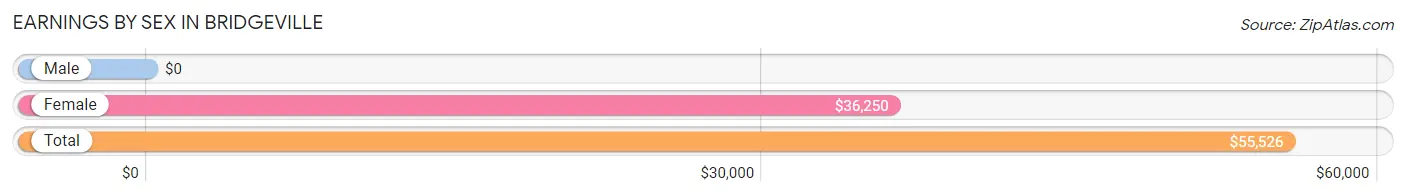
| Sex | Number | Average Earnings |
| Male | 101 (63.9%) | $0 |
| Female | 57 (36.1%) | $36,250 |
| Total | 158 (100.0%) | $55,526 |
Earnings by Sex by Income Bracket in Bridgeville
The most common earnings brackets in Bridgeville are $100,000+ for men (48 | 47.5%) and $35,000 to $39,999 for women (25 | 43.9%).
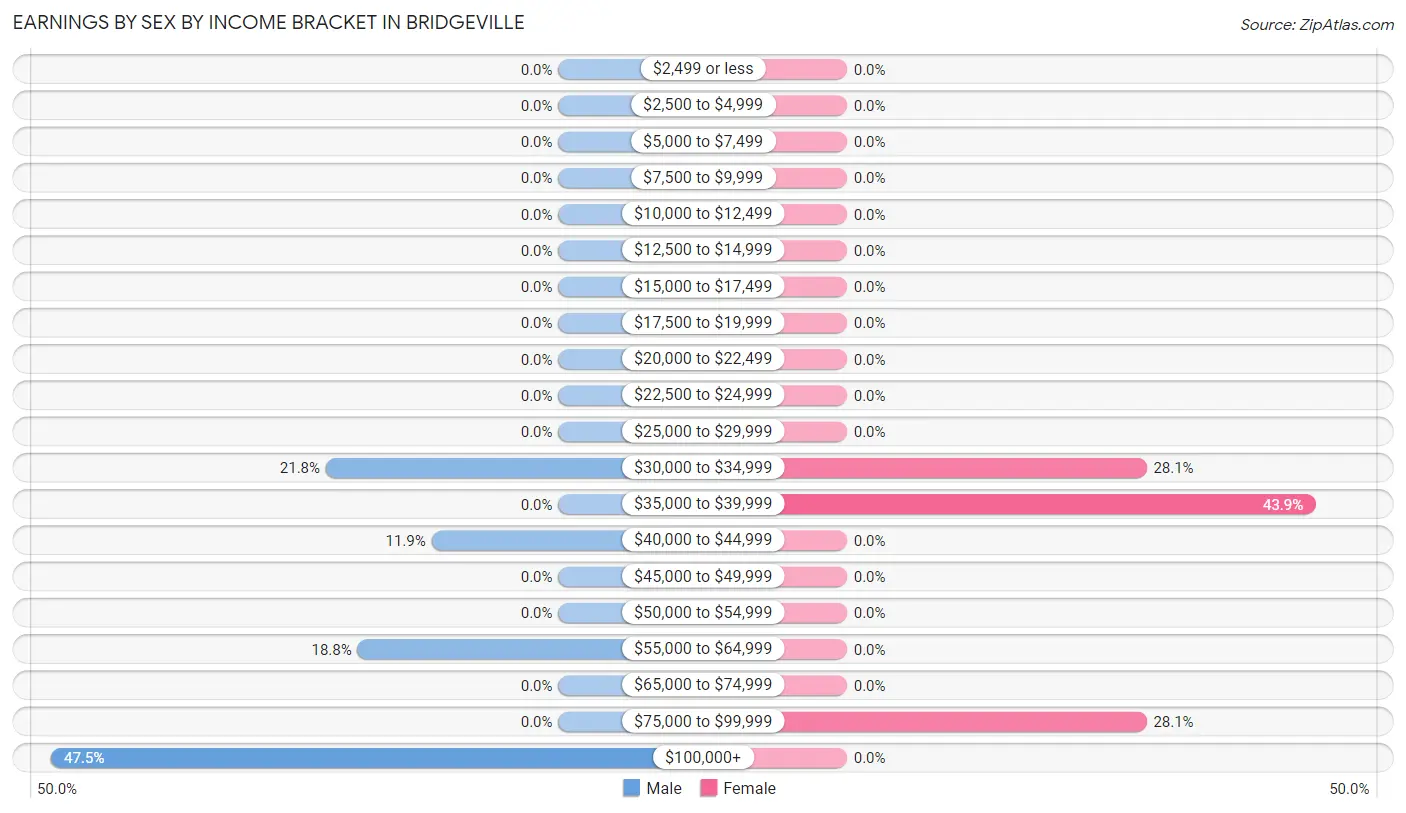
| Income | Male | Female |
| $2,499 or less | 0 (0.0%) | 0 (0.0%) |
| $2,500 to $4,999 | 0 (0.0%) | 0 (0.0%) |
| $5,000 to $7,499 | 0 (0.0%) | 0 (0.0%) |
| $7,500 to $9,999 | 0 (0.0%) | 0 (0.0%) |
| $10,000 to $12,499 | 0 (0.0%) | 0 (0.0%) |
| $12,500 to $14,999 | 0 (0.0%) | 0 (0.0%) |
| $15,000 to $17,499 | 0 (0.0%) | 0 (0.0%) |
| $17,500 to $19,999 | 0 (0.0%) | 0 (0.0%) |
| $20,000 to $22,499 | 0 (0.0%) | 0 (0.0%) |
| $22,500 to $24,999 | 0 (0.0%) | 0 (0.0%) |
| $25,000 to $29,999 | 0 (0.0%) | 0 (0.0%) |
| $30,000 to $34,999 | 22 (21.8%) | 16 (28.1%) |
| $35,000 to $39,999 | 0 (0.0%) | 25 (43.9%) |
| $40,000 to $44,999 | 12 (11.9%) | 0 (0.0%) |
| $45,000 to $49,999 | 0 (0.0%) | 0 (0.0%) |
| $50,000 to $54,999 | 0 (0.0%) | 0 (0.0%) |
| $55,000 to $64,999 | 19 (18.8%) | 0 (0.0%) |
| $65,000 to $74,999 | 0 (0.0%) | 0 (0.0%) |
| $75,000 to $99,999 | 0 (0.0%) | 16 (28.1%) |
| $100,000+ | 48 (47.5%) | 0 (0.0%) |
| Total | 101 (100.0%) | 57 (100.0%) |
Earnings by Sex by Educational Attainment in Bridgeville
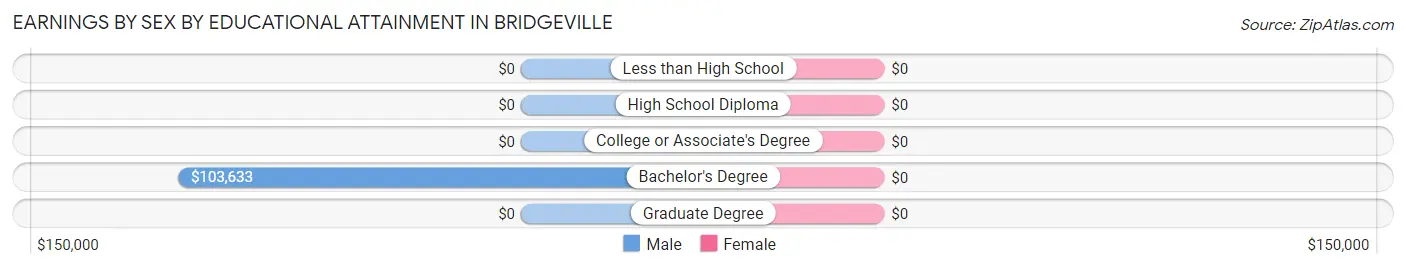
| Educational Attainment | Male Income | Female Income |
| Less than High School | - | - |
| High School Diploma | - | - |
| College or Associate's Degree | - | - |
| Bachelor's Degree | $103,633 | $0 |
| Graduate Degree | - | - |
| Total | $103,164 | $36,250 |
Family Income in Bridgeville
Family Income Brackets in Bridgeville
According to the Bridgeville family income data, there are 48 families falling into the $100,000 to $149,999 income range, which is the most common income bracket and makes up 52.2% of all families.
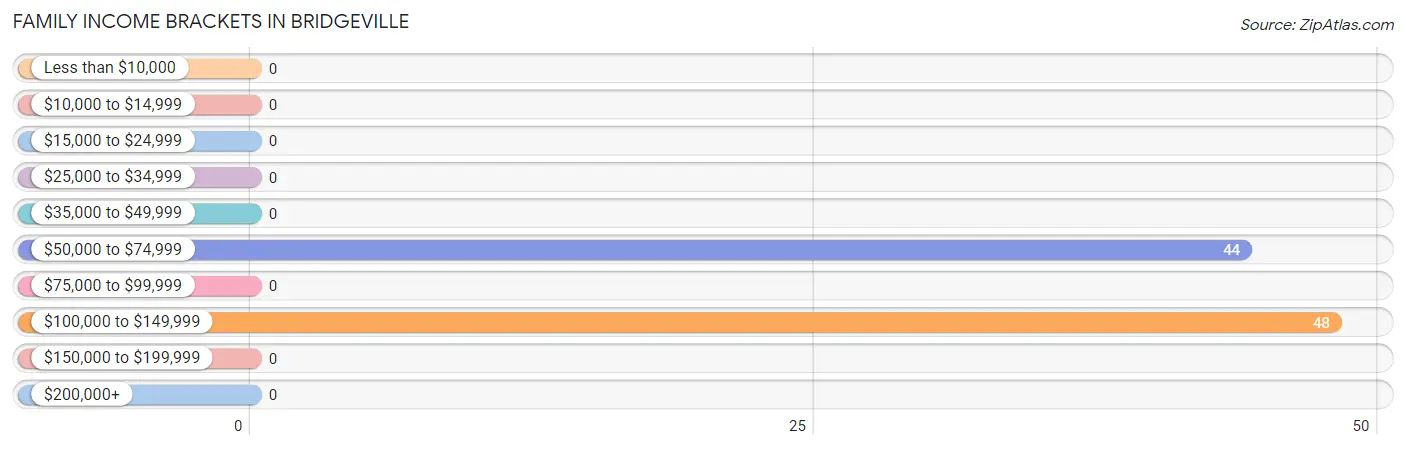
| Income Bracket | # Families | % Families |
| Less than $10,000 | 0 | 0.0% |
| $10,000 to $14,999 | 0 | 0.0% |
| $15,000 to $24,999 | 0 | 0.0% |
| $25,000 to $34,999 | 0 | 0.0% |
| $35,000 to $49,999 | 0 | 0.0% |
| $50,000 to $74,999 | 44 | 47.8% |
| $75,000 to $99,999 | 0 | 0.0% |
| $100,000 to $149,999 | 48 | 52.2% |
| $150,000 to $199,999 | 0 | 0.0% |
| $200,000+ | 0 | 0.0% |
Family Income by Famaliy Size in Bridgeville
2-person families (60 | 65.2%) account for the highest median family income in Bridgeville with $70,658 per family, while 2-person families (60 | 65.2%) have the highest median income of $35,329 per family member.
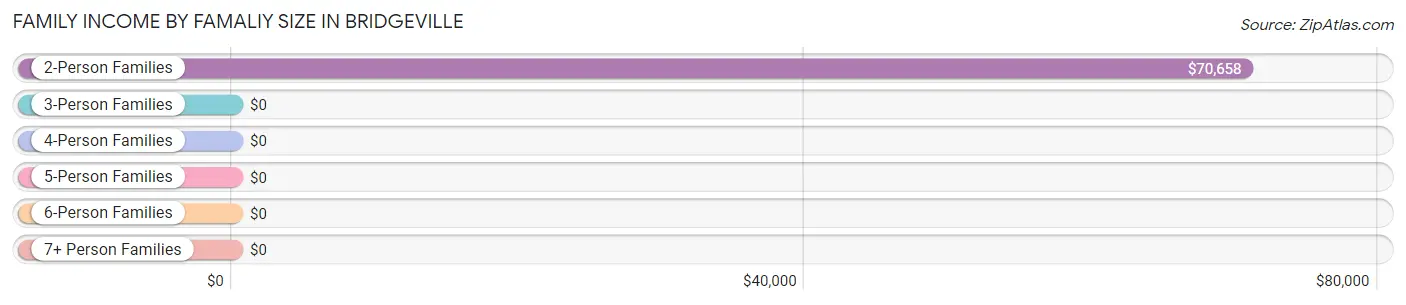
| Income Bracket | # Families | Median Income |
| 2-Person Families | 60 (65.2%) | $70,658 |
| 3-Person Families | 0 (0.0%) | $0 |
| 4-Person Families | 32 (34.8%) | $0 |
| 5-Person Families | 0 (0.0%) | $0 |
| 6-Person Families | 0 (0.0%) | $0 |
| 7+ Person Families | 0 (0.0%) | $0 |
| Total | 92 (100.0%) | $102,656 |
Family Income by Number of Earners in Bridgeville
| Number of Earners | # Families | Median Income |
| No Earners | 0 (0.0%) | $0 |
| 1 Earner | 51 (55.4%) | $0 |
| 2 Earners | 41 (44.6%) | $0 |
| 3+ Earners | 0 (0.0%) | $0 |
| Total | 92 (100.0%) | $102,656 |
Household Income in Bridgeville
Household Income Brackets in Bridgeville
With 48 households falling in the category, the $100,000 to $149,999 income range is the most frequent in Bridgeville, accounting for 44.4% of all households.
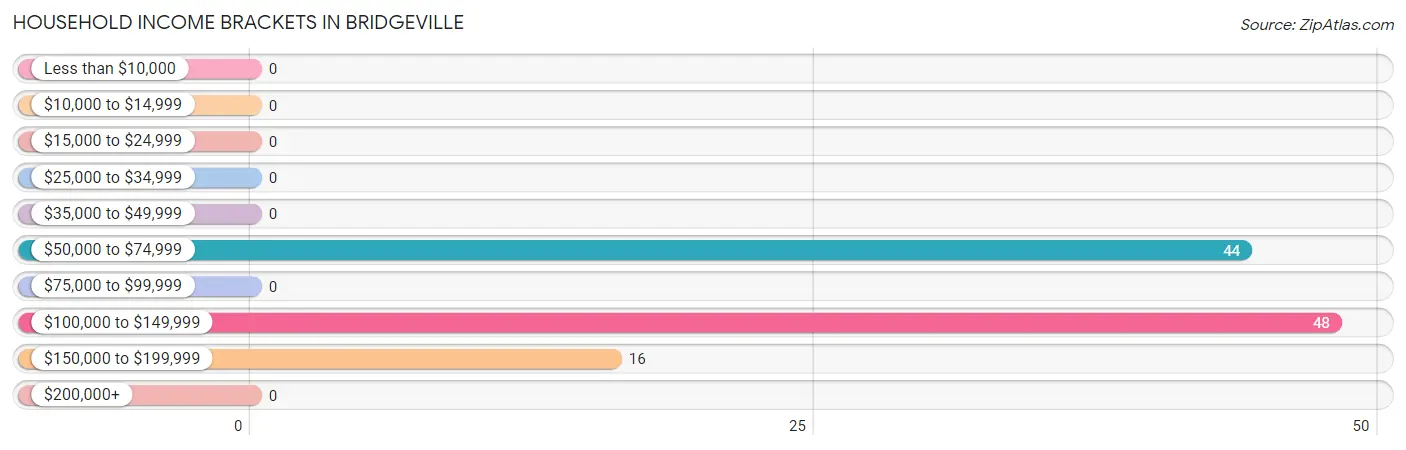
| Income Bracket | # Households | % Households |
| Less than $10,000 | 0 | 0.0% |
| $10,000 to $14,999 | 0 | 0.0% |
| $15,000 to $24,999 | 0 | 0.0% |
| $25,000 to $34,999 | 0 | 0.0% |
| $35,000 to $49,999 | 0 | 0.0% |
| $50,000 to $74,999 | 44 | 40.7% |
| $75,000 to $99,999 | 0 | 0.0% |
| $100,000 to $149,999 | 48 | 44.4% |
| $150,000 to $199,999 | 16 | 14.8% |
| $200,000+ | 0 | 0.0% |
Household Income by Householder Age in Bridgeville
| Income Bracket | # Households | Median Income |
| 15 to 24 Years | 0 (0.0%) | $0 |
| 25 to 44 Years | 48 (44.4%) | $0 |
| 45 to 64 Years | 41 (38.0%) | $0 |
| 65+ Years | 19 (17.6%) | $0 |
| Total | 108 (100.0%) | $103,281 |
Poverty in Bridgeville
Income Below Poverty by Sex and Age in Bridgeville
| Age Bracket | Male | Female |
| Under 5 Years | 0 (0.0%) | 0 (0.0%) |
| 5 Years | 0 (0.0%) | 0 (0.0%) |
| 6 to 11 Years | 0 (0.0%) | 0 (0.0%) |
| 12 to 14 Years | 0 (0.0%) | 0 (0.0%) |
| 15 Years | 0 (0.0%) | 0 (0.0%) |
| 16 and 17 Years | 0 (0.0%) | 0 (0.0%) |
| 18 to 24 Years | 0 (0.0%) | 0 (0.0%) |
| 25 to 34 Years | 0 (0.0%) | 0 (0.0%) |
| 35 to 44 Years | 0 (0.0%) | 0 (0.0%) |
| 45 to 54 Years | 0 (0.0%) | 0 (0.0%) |
| 55 to 64 Years | 0 (0.0%) | 0 (0.0%) |
| 65 to 74 Years | 0 (0.0%) | 0 (0.0%) |
| 75 Years and over | 0 (0.0%) | 0 (0.0%) |
| Total | 0 (0.0%) | 0 (0.0%) |
Income Above Poverty by Sex and Age in Bridgeville
According to the poverty statistics in Bridgeville, males aged 6 to 11 years and females aged 12 to 14 years are the age groups that are most secure financially, with 100.0% of males and 100.0% of females in these age groups living above the poverty line.
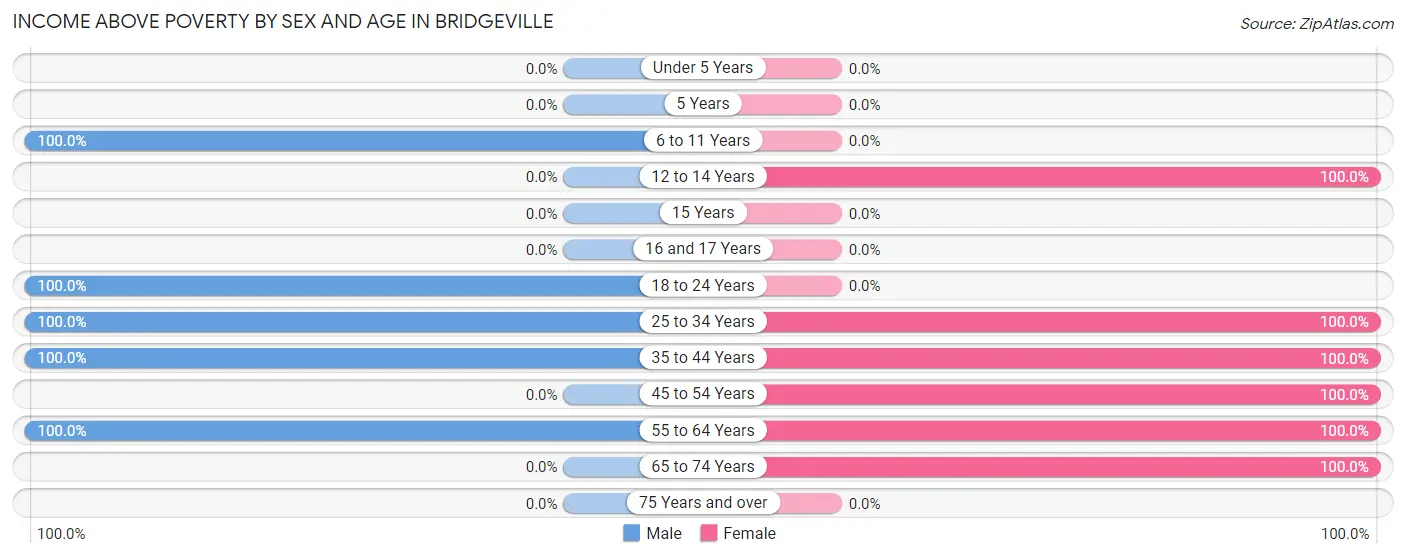
| Age Bracket | Male | Female |
| Under 5 Years | 0 (0.0%) | 0 (0.0%) |
| 5 Years | 0 (0.0%) | 0 (0.0%) |
| 6 to 11 Years | 28 (100.0%) | 0 (0.0%) |
| 12 to 14 Years | 0 (0.0%) | 27 (100.0%) |
| 15 Years | 0 (0.0%) | 0 (0.0%) |
| 16 and 17 Years | 0 (0.0%) | 0 (0.0%) |
| 18 to 24 Years | 22 (100.0%) | 0 (0.0%) |
| 25 to 34 Years | 35 (100.0%) | 16 (100.0%) |
| 35 to 44 Years | 32 (100.0%) | 25 (100.0%) |
| 45 to 54 Years | 0 (0.0%) | 25 (100.0%) |
| 55 to 64 Years | 12 (100.0%) | 16 (100.0%) |
| 65 to 74 Years | 0 (0.0%) | 19 (100.0%) |
| 75 Years and over | 0 (0.0%) | 0 (0.0%) |
| Total | 129 (100.0%) | 128 (100.0%) |
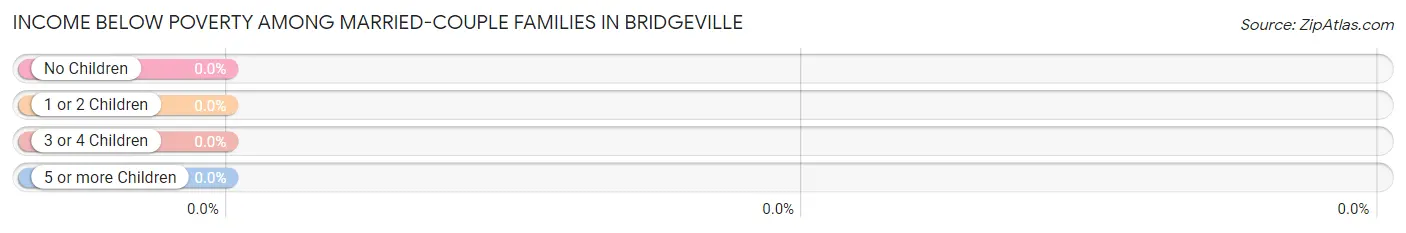
Income Below Poverty Among Married-Couple Families in Bridgeville
| Children | Above Poverty | Below Poverty |
| No Children | 16 (100.0%) | 0 (0.0%) |
| 1 or 2 Children | 32 (100.0%) | 0 (0.0%) |
| 3 or 4 Children | 0 (0.0%) | 0 (0.0%) |
| 5 or more Children | 0 (0.0%) | 0 (0.0%) |
| Total | 48 (100.0%) | 0 (0.0%) |
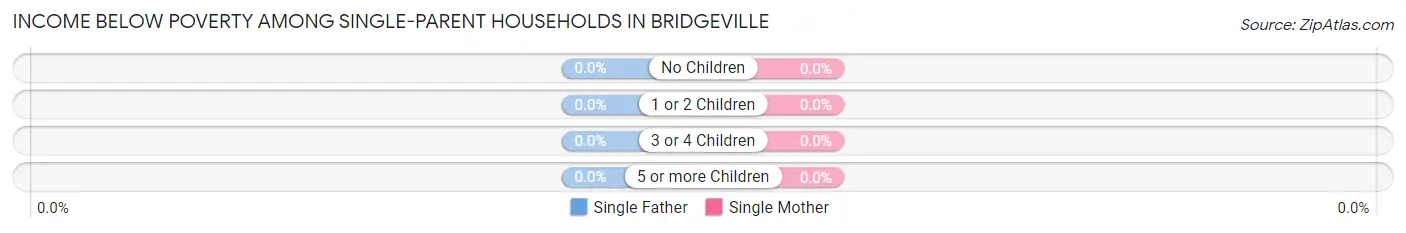
Income Below Poverty Among Single-Parent Households in Bridgeville
| Children | Single Father | Single Mother |
| No Children | 0 (0.0%) | 0 (0.0%) |
| 1 or 2 Children | 0 (0.0%) | 0 (0.0%) |
| 3 or 4 Children | 0 (0.0%) | 0 (0.0%) |
| 5 or more Children | 0 (0.0%) | 0 (0.0%) |
| Total | 0 (0.0%) | 0 (0.0%) |
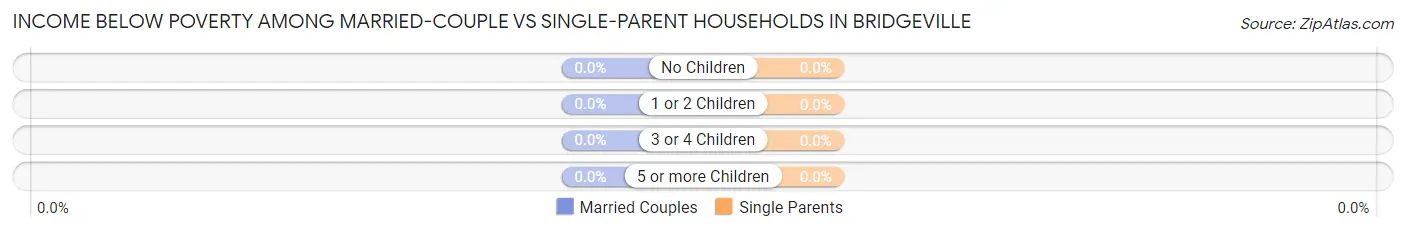
Income Below Poverty Among Married-Couple vs Single-Parent Households in Bridgeville
| Children | Married-Couple Families | Single-Parent Households |
| No Children | 0 (0.0%) | 0 (0.0%) |
| 1 or 2 Children | 0 (0.0%) | 0 (0.0%) |
| 3 or 4 Children | 0 (0.0%) | 0 (0.0%) |
| 5 or more Children | 0 (0.0%) | 0 (0.0%) |
| Total | 0 (0.0%) | 0 (0.0%) |
Employment Characteristics in Bridgeville
Employment by Class of Employer in Bridgeville
Among the 158 employed individuals in Bridgeville, private company employees (111 | 70.3%), state government employees (19 | 12.0%), and not-for-profit organizations (16 | 10.1%) make up the most common classes of employment.
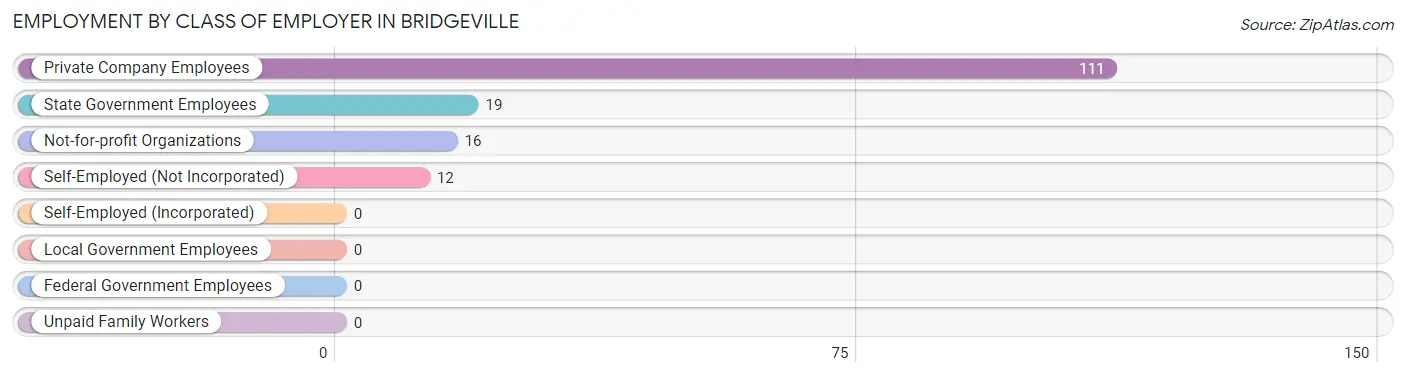
| Employer Class | # Employees | % Employees |
| Private Company Employees | 111 | 70.3% |
| Self-Employed (Incorporated) | 0 | 0.0% |
| Self-Employed (Not Incorporated) | 12 | 7.6% |
| Not-for-profit Organizations | 16 | 10.1% |
| Local Government Employees | 0 | 0.0% |
| State Government Employees | 19 | 12.0% |
| Federal Government Employees | 0 | 0.0% |
| Unpaid Family Workers | 0 | 0.0% |
| Total | 158 | 100.0% |
Employment Status by Age in Bridgeville
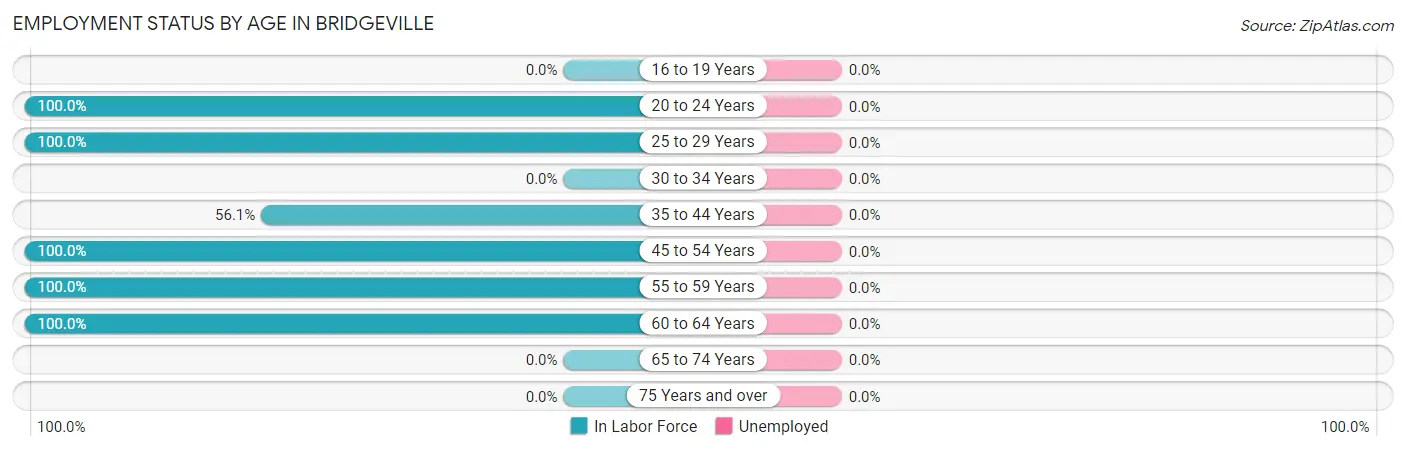
| Age Bracket | In Labor Force | Unemployed |
| 16 to 19 Years | 0 (0.0%) | 0 (0.0%) |
| 20 to 24 Years | 22 (100.0%) | 0 (0.0%) |
| 25 to 29 Years | 51 (100.0%) | 0 (0.0%) |
| 30 to 34 Years | 0 (0.0%) | 0 (0.0%) |
| 35 to 44 Years | 32 (56.1%) | 0 (0.0%) |
| 45 to 54 Years | 25 (100.0%) | 0 (0.0%) |
| 55 to 59 Years | 16 (100.0%) | 0 (0.0%) |
| 60 to 64 Years | 12 (100.0%) | 0 (0.0%) |
| 65 to 74 Years | 0 (0.0%) | 0 (0.0%) |
| 75 Years and over | 0 (0.0%) | 0 (0.0%) |
| Total | 158 (78.2%) | 0 (0.0%) |
Employment Status by Educational Attainment in Bridgeville
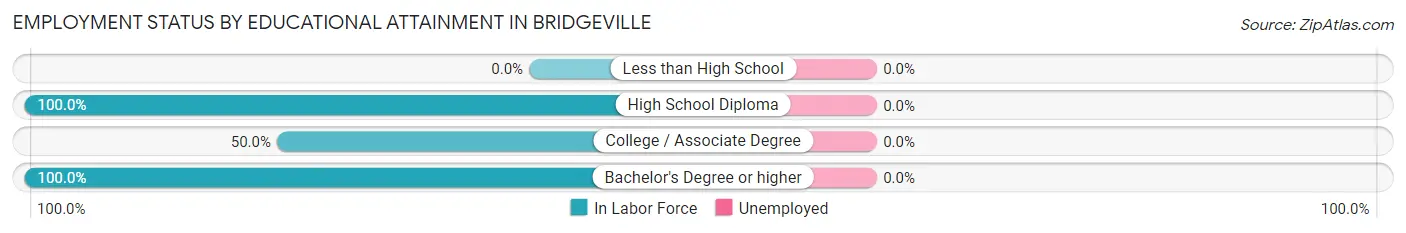
| Educational Attainment | In Labor Force | Unemployed |
| Less than High School | 0 (0.0%) | 0 (0.0%) |
| High School Diploma | 44 (100.0%) | 0 (0.0%) |
| College / Associate Degree | 25 (50.0%) | 0 (0.0%) |
| Bachelor's Degree or higher | 67 (100.0%) | 0 (0.0%) |
| Total | 136 (84.5%) | 0 (0.0%) |
Employment Occupations by Sex in Bridgeville
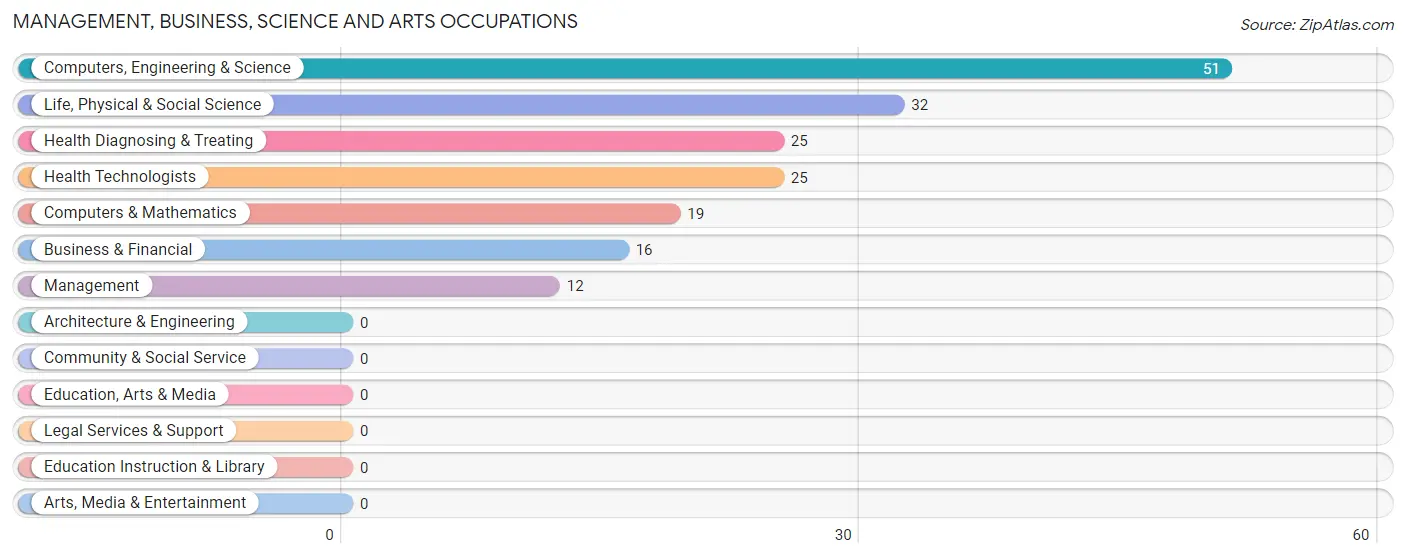
Management, Business, Science and Arts Occupations
The most common Management, Business, Science and Arts occupations in Bridgeville are Computers, Engineering & Science (51 | 32.3%), Life, Physical & Social Science (32 | 20.3%), Health Diagnosing & Treating (25 | 15.8%), Health Technologists (25 | 15.8%), and Computers & Mathematics (19 | 12.0%).
Management, Business, Science and Arts Occupations by Sex
Within the Management, Business, Science and Arts occupations in Bridgeville, the most male-oriented occupations are Management (100.0%), Business & Financial (100.0%), and Computers, Engineering & Science (100.0%), while the most female-oriented occupations are Health Diagnosing & Treating (100.0%), and Health Technologists (100.0%).
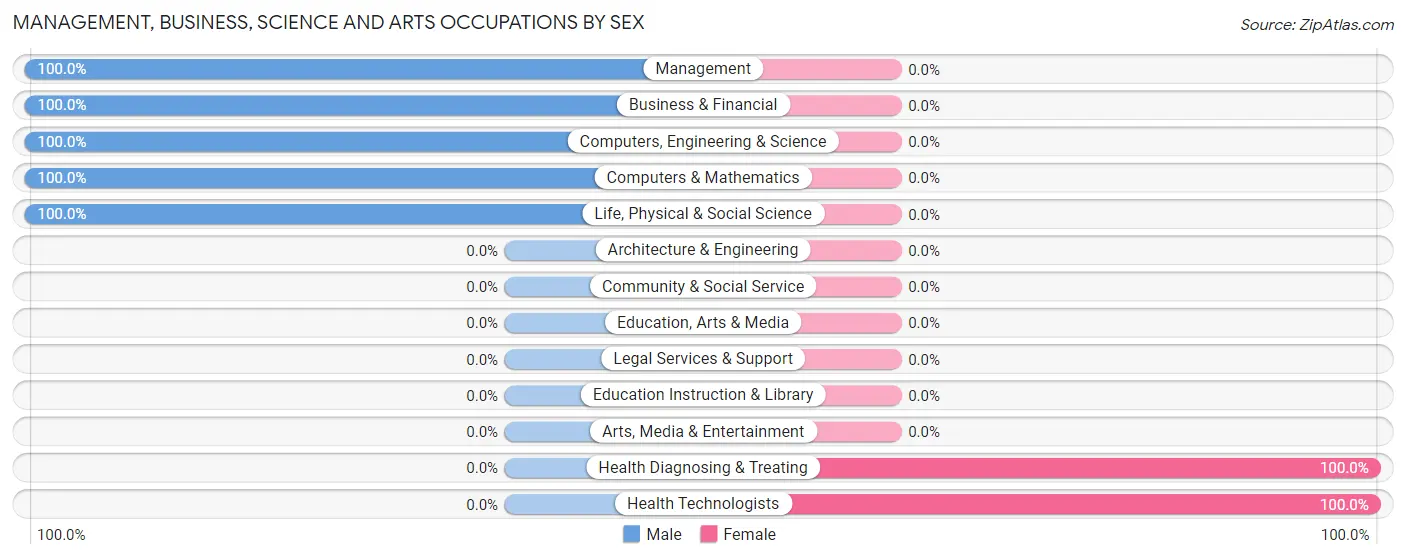
| Occupation | Male | Female |
| Management | 12 (100.0%) | 0 (0.0%) |
| Business & Financial | 16 (100.0%) | 0 (0.0%) |
| Computers, Engineering & Science | 51 (100.0%) | 0 (0.0%) |
| Computers & Mathematics | 19 (100.0%) | 0 (0.0%) |
| Architecture & Engineering | 0 (0.0%) | 0 (0.0%) |
| Life, Physical & Social Science | 32 (100.0%) | 0 (0.0%) |
| Community & Social Service | 0 (0.0%) | 0 (0.0%) |
| Education, Arts & Media | 0 (0.0%) | 0 (0.0%) |
| Legal Services & Support | 0 (0.0%) | 0 (0.0%) |
| Education Instruction & Library | 0 (0.0%) | 0 (0.0%) |
| Arts, Media & Entertainment | 0 (0.0%) | 0 (0.0%) |
| Health Diagnosing & Treating | 0 (0.0%) | 25 (100.0%) |
| Health Technologists | 0 (0.0%) | 25 (100.0%) |
| Total (Category) | 79 (76.0%) | 25 (24.0%) |
| Total (Overall) | 101 (63.9%) | 57 (36.1%) |
Services Occupations
Services Occupations by Sex
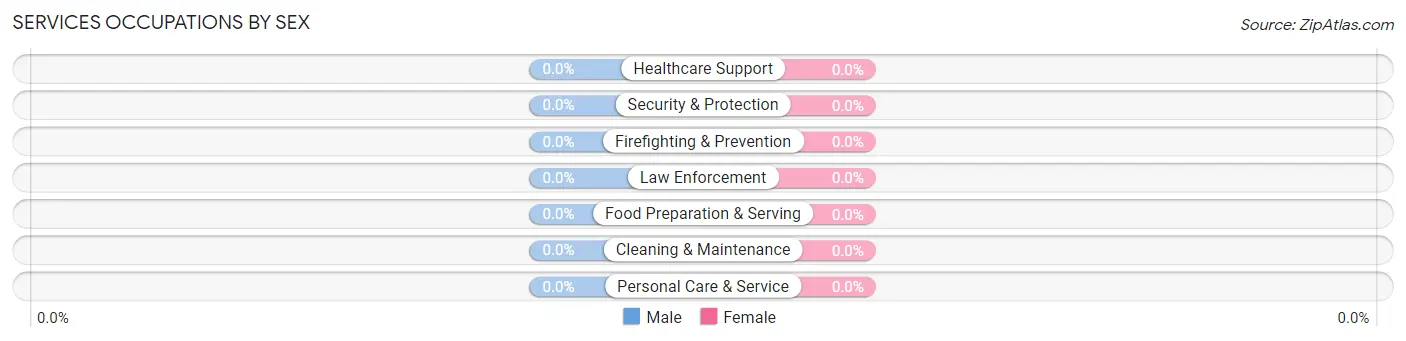
| Occupation | Male | Female |
| Healthcare Support | 0 (0.0%) | 0 (0.0%) |
| Security & Protection | 0 (0.0%) | 0 (0.0%) |
| Firefighting & Prevention | 0 (0.0%) | 0 (0.0%) |
| Law Enforcement | 0 (0.0%) | 0 (0.0%) |
| Food Preparation & Serving | 0 (0.0%) | 0 (0.0%) |
| Cleaning & Maintenance | 0 (0.0%) | 0 (0.0%) |
| Personal Care & Service | 0 (0.0%) | 0 (0.0%) |
| Total (Category) | 0 (0.0%) | 0 (0.0%) |
| Total (Overall) | 101 (63.9%) | 57 (36.1%) |
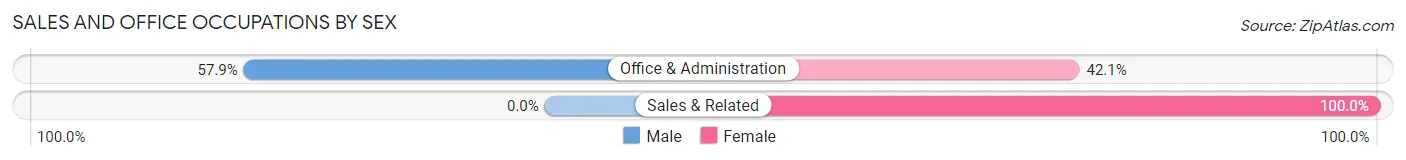
Sales and Office Occupations
The most common Sales and Office occupations in Bridgeville are Office & Administration (38 | 24.0%), and Sales & Related (16 | 10.1%).
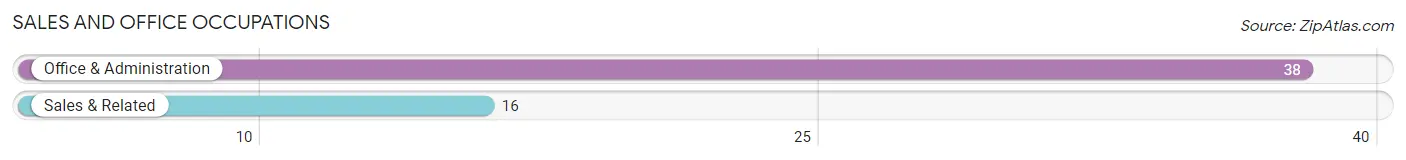
Sales and Office Occupations by Sex
| Occupation | Male | Female |
| Sales & Related | 0 (0.0%) | 16 (100.0%) |
| Office & Administration | 22 (57.9%) | 16 (42.1%) |
| Total (Category) | 22 (40.7%) | 32 (59.3%) |
| Total (Overall) | 101 (63.9%) | 57 (36.1%) |
Natural Resources, Construction and Maintenance Occupations
Natural Resources, Construction and Maintenance Occupations by Sex
| Occupation | Male | Female |
| Farming, Fishing & Forestry | 0 (0.0%) | 0 (0.0%) |
| Construction & Extraction | 0 (0.0%) | 0 (0.0%) |
| Installation, Maintenance & Repair | 0 (0.0%) | 0 (0.0%) |
| Total (Category) | 0 (0.0%) | 0 (0.0%) |
| Total (Overall) | 101 (63.9%) | 57 (36.1%) |
Production, Transportation and Moving Occupations
Production, Transportation and Moving Occupations by Sex
| Occupation | Male | Female |
| Production | 0 (0.0%) | 0 (0.0%) |
| Transportation | 0 (0.0%) | 0 (0.0%) |
| Material Moving | 0 (0.0%) | 0 (0.0%) |
| Total (Category) | 0 (0.0%) | 0 (0.0%) |
| Total (Overall) | 101 (63.9%) | 57 (36.1%) |
Employment Industries by Sex in Bridgeville
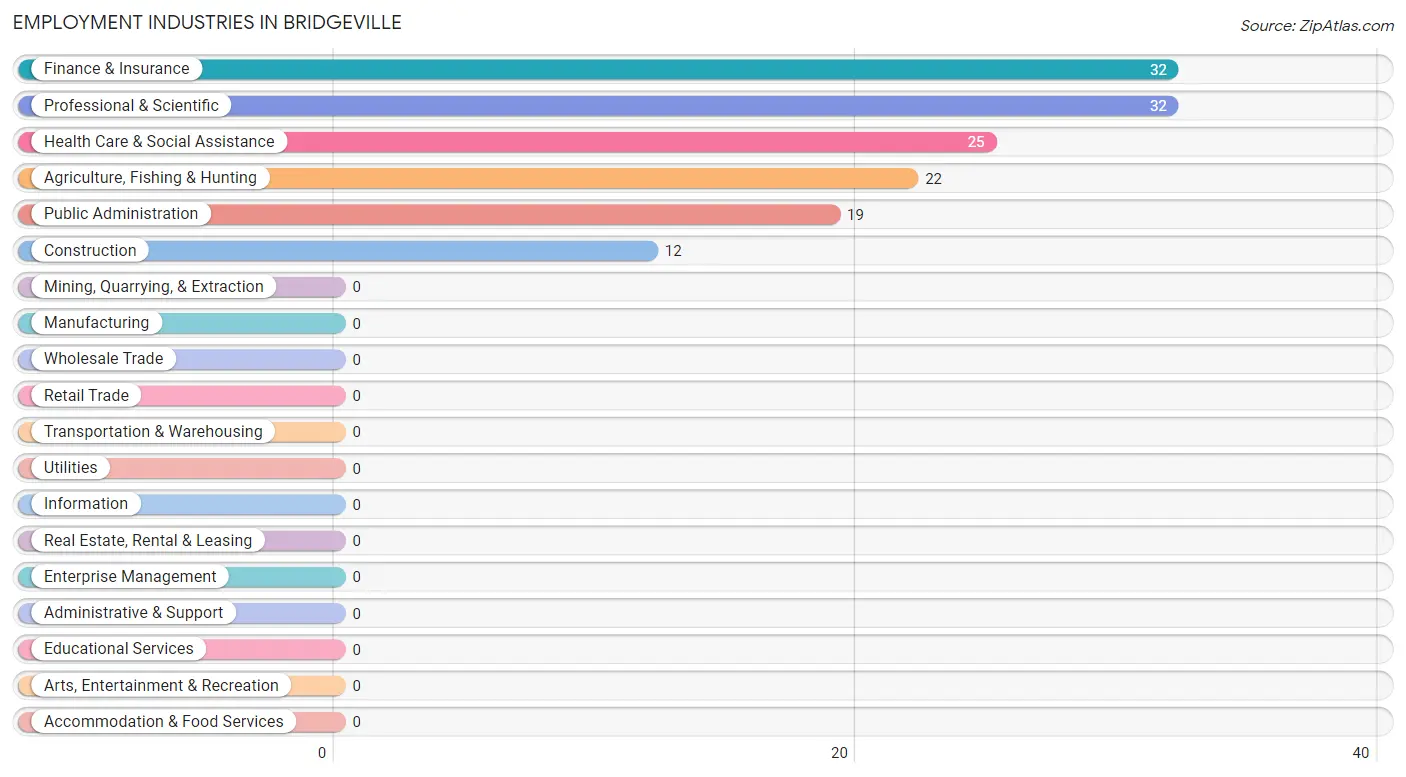
Employment Industries in Bridgeville
The major employment industries in Bridgeville include Finance & Insurance (32 | 20.3%), Professional & Scientific (32 | 20.3%), Health Care & Social Assistance (25 | 15.8%), Agriculture, Fishing & Hunting (22 | 13.9%), and Public Administration (19 | 12.0%).
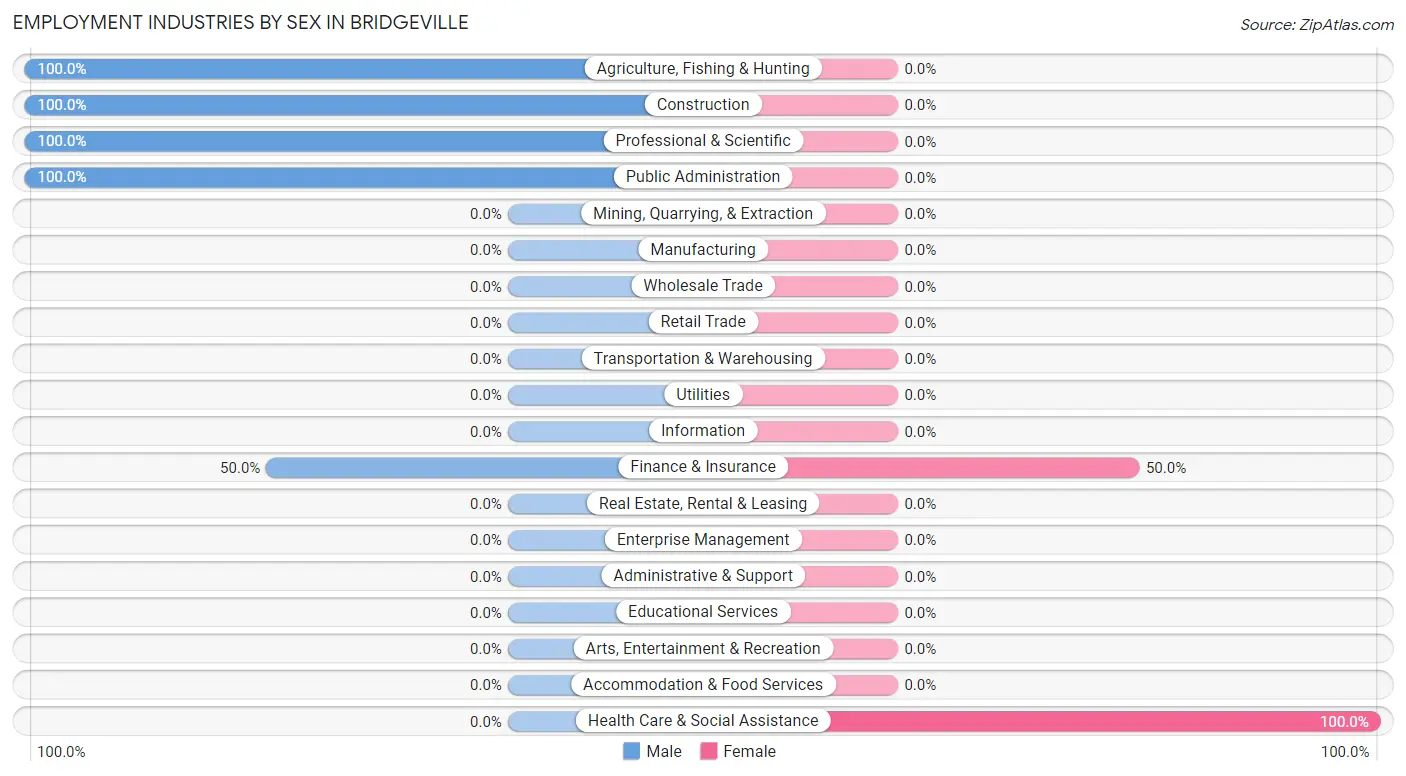
Employment Industries by Sex in Bridgeville
The Bridgeville industries that see more men than women are Agriculture, Fishing & Hunting (100.0%), Construction (100.0%), and Professional & Scientific (100.0%), whereas the industries that tend to have a higher number of women are Health Care & Social Assistance (100.0%), and Finance & Insurance (50.0%).
| Industry | Male | Female |
| Agriculture, Fishing & Hunting | 22 (100.0%) | 0 (0.0%) |
| Mining, Quarrying, & Extraction | 0 (0.0%) | 0 (0.0%) |
| Construction | 12 (100.0%) | 0 (0.0%) |
| Manufacturing | 0 (0.0%) | 0 (0.0%) |
| Wholesale Trade | 0 (0.0%) | 0 (0.0%) |
| Retail Trade | 0 (0.0%) | 0 (0.0%) |
| Transportation & Warehousing | 0 (0.0%) | 0 (0.0%) |
| Utilities | 0 (0.0%) | 0 (0.0%) |
| Information | 0 (0.0%) | 0 (0.0%) |
| Finance & Insurance | 16 (50.0%) | 16 (50.0%) |
| Real Estate, Rental & Leasing | 0 (0.0%) | 0 (0.0%) |
| Professional & Scientific | 32 (100.0%) | 0 (0.0%) |
| Enterprise Management | 0 (0.0%) | 0 (0.0%) |
| Administrative & Support | 0 (0.0%) | 0 (0.0%) |
| Educational Services | 0 (0.0%) | 0 (0.0%) |
| Health Care & Social Assistance | 0 (0.0%) | 25 (100.0%) |
| Arts, Entertainment & Recreation | 0 (0.0%) | 0 (0.0%) |
| Accommodation & Food Services | 0 (0.0%) | 0 (0.0%) |
| Public Administration | 19 (100.0%) | 0 (0.0%) |
| Total | 101 (63.9%) | 57 (36.1%) |
Education in Bridgeville
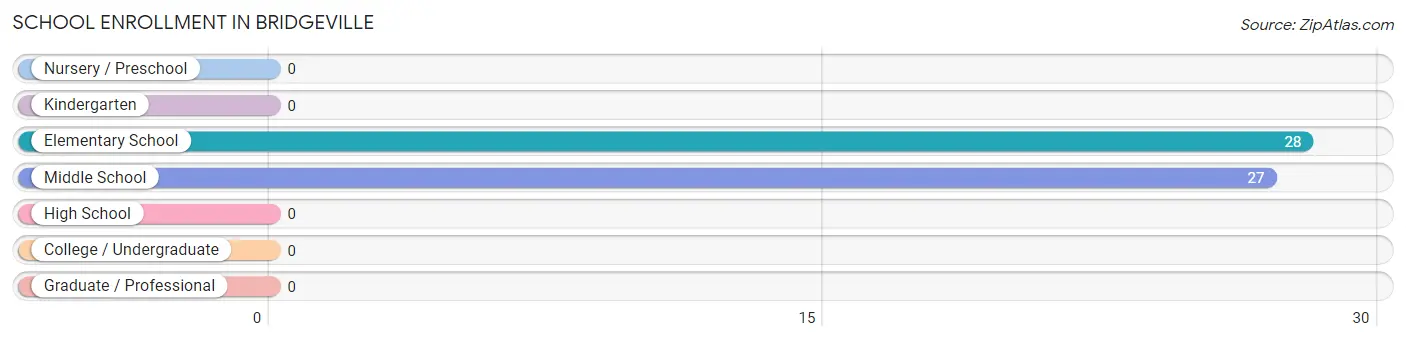
School Enrollment in Bridgeville
The most common levels of schooling among the 55 students in Bridgeville are elementary school (28 | 50.9%), and middle school (27 | 49.1%).
| School Level | # Students | % Students |
| Nursery / Preschool | 0 | 0.0% |
| Kindergarten | 0 | 0.0% |
| Elementary School | 28 | 50.9% |
| Middle School | 27 | 49.1% |
| High School | 0 | 0.0% |
| College / Undergraduate | 0 | 0.0% |
| Graduate / Professional | 0 | 0.0% |
| Total | 55 | 100.0% |
School Enrollment by Age by Funding Source in Bridgeville
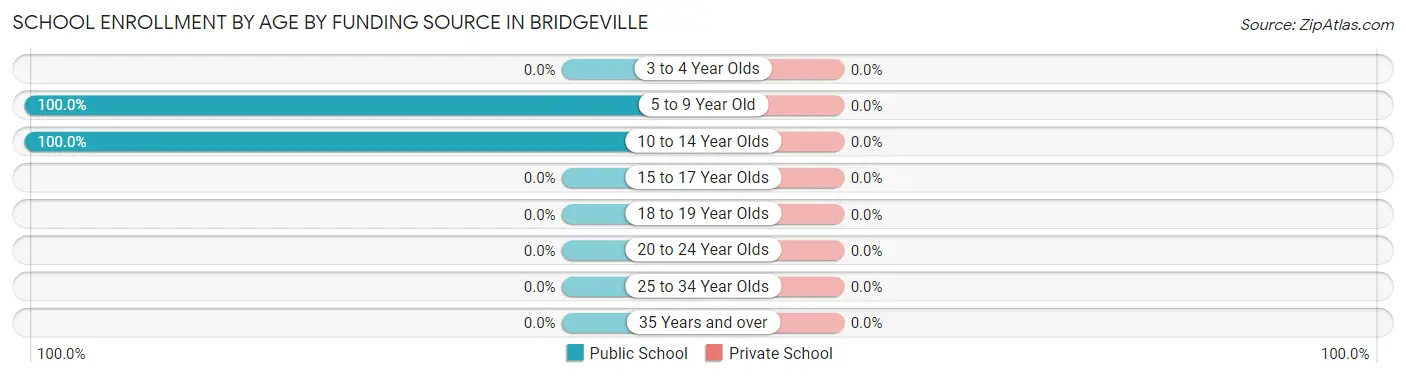
| Age Bracket | Public School | Private School |
| 3 to 4 Year Olds | 0 (0.0%) | 0 (0.0%) |
| 5 to 9 Year Old | 28 (100.0%) | 0 (0.0%) |
| 10 to 14 Year Olds | 27 (100.0%) | 0 (0.0%) |
| 15 to 17 Year Olds | 0 (0.0%) | 0 (0.0%) |
| 18 to 19 Year Olds | 0 (0.0%) | 0 (0.0%) |
| 20 to 24 Year Olds | 0 (0.0%) | 0 (0.0%) |
| 25 to 34 Year Olds | 0 (0.0%) | 0 (0.0%) |
| 35 Years and over | 0 (0.0%) | 0 (0.0%) |
| Total | 55 (100.0%) | 0 (0.0%) |
Educational Attainment by Field of Study in Bridgeville
Science & technology (32 | 47.8%), engineering (19 | 28.4%), and bio, nature & agricultural (16 | 23.9%) are the most common fields of study among 67 individuals in Bridgeville who have obtained a bachelor's degree or higher.
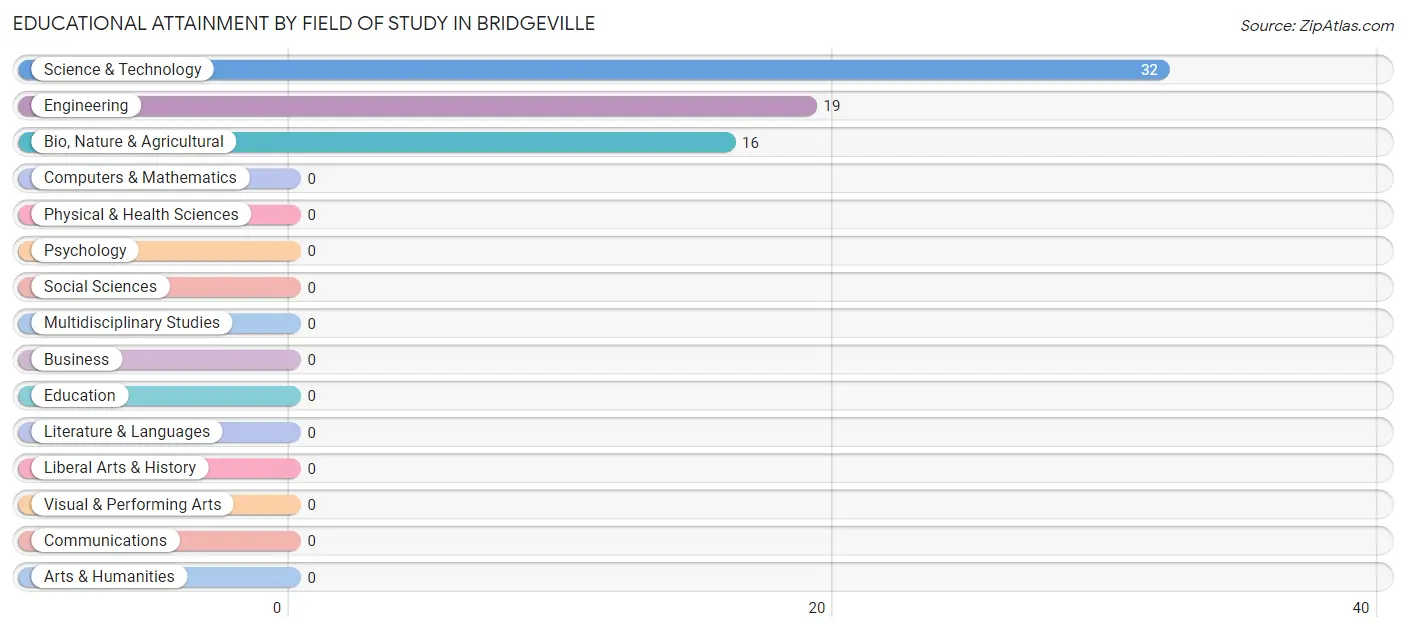
| Field of Study | # Graduates | % Graduates |
| Computers & Mathematics | 0 | 0.0% |
| Bio, Nature & Agricultural | 16 | 23.9% |
| Physical & Health Sciences | 0 | 0.0% |
| Psychology | 0 | 0.0% |
| Social Sciences | 0 | 0.0% |
| Engineering | 19 | 28.4% |
| Multidisciplinary Studies | 0 | 0.0% |
| Science & Technology | 32 | 47.8% |
| Business | 0 | 0.0% |
| Education | 0 | 0.0% |
| Literature & Languages | 0 | 0.0% |
| Liberal Arts & History | 0 | 0.0% |
| Visual & Performing Arts | 0 | 0.0% |
| Communications | 0 | 0.0% |
| Arts & Humanities | 0 | 0.0% |
| Total | 67 | 100.0% |
Transportation & Commute in Bridgeville
Vehicle Availability by Sex in Bridgeville
The most prevalent vehicle ownership categories in Bridgeville are males with 2 vehicles (66, accounting for 65.3%) and females with 2 vehicles (41, making up 115.8%).
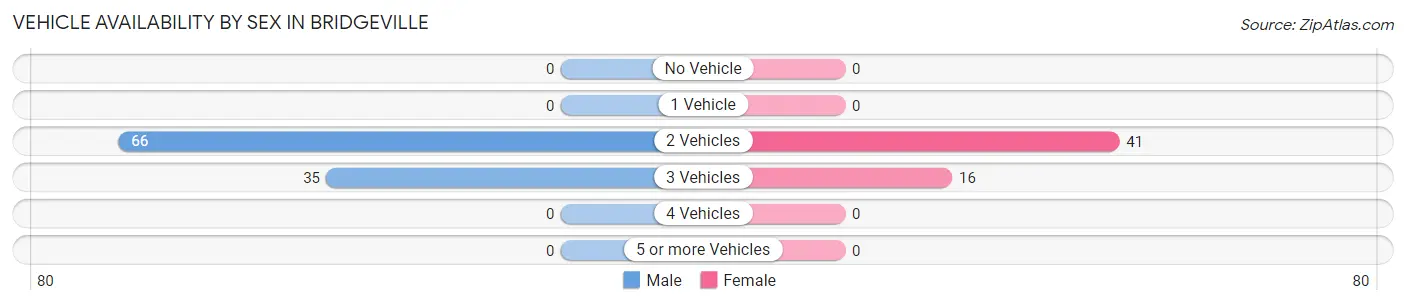
| Vehicles Available | Male | Female |
| No Vehicle | 0 (0.0%) | 0 (0.0%) |
| 1 Vehicle | 0 (0.0%) | 0 (0.0%) |
| 2 Vehicles | 66 (65.3%) | 41 (71.9%) |
| 3 Vehicles | 35 (34.6%) | 16 (28.1%) |
| 4 Vehicles | 0 (0.0%) | 0 (0.0%) |
| 5 or more Vehicles | 0 (0.0%) | 0 (0.0%) |
| Total | 101 (100.0%) | 57 (100.0%) |
Commute Time in Bridgeville
The most frequently occuring commute durations in Bridgeville are 30 to 34 minutes (48 commuters, 33.8%), 15 to 19 minutes (31 commuters, 21.8%), and 90 or more minutes (25 commuters, 17.6%).
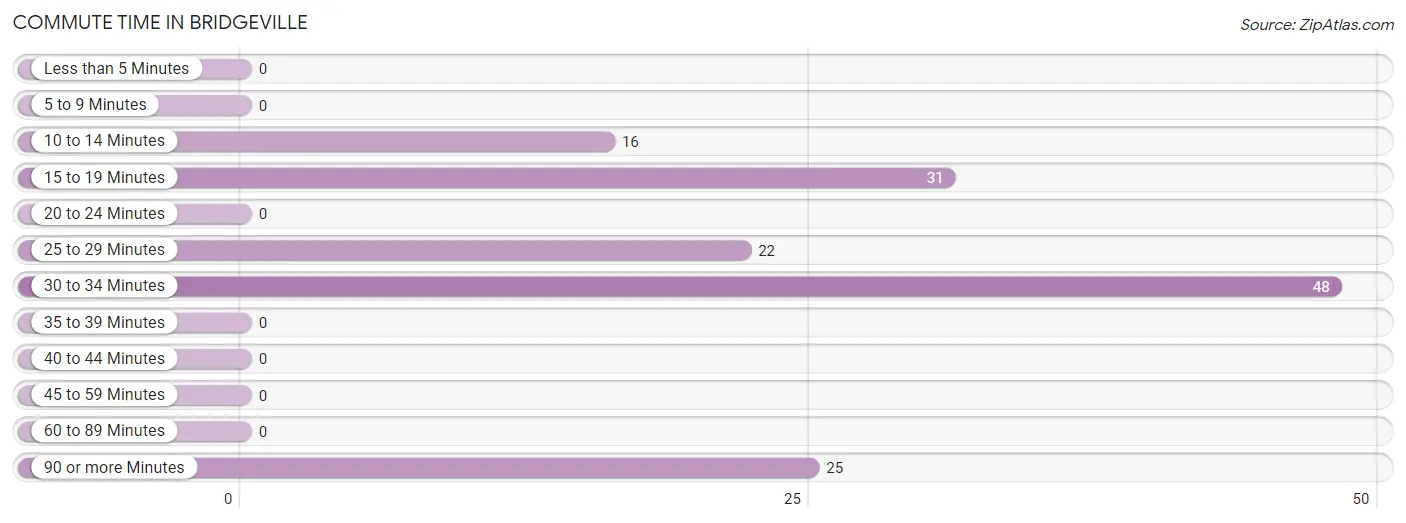
| Commute Time | # Commuters | % Commuters |
| Less than 5 Minutes | 0 | 0.0% |
| 5 to 9 Minutes | 0 | 0.0% |
| 10 to 14 Minutes | 16 | 11.3% |
| 15 to 19 Minutes | 31 | 21.8% |
| 20 to 24 Minutes | 0 | 0.0% |
| 25 to 29 Minutes | 22 | 15.5% |
| 30 to 34 Minutes | 48 | 33.8% |
| 35 to 39 Minutes | 0 | 0.0% |
| 40 to 44 Minutes | 0 | 0.0% |
| 45 to 59 Minutes | 0 | 0.0% |
| 60 to 89 Minutes | 0 | 0.0% |
| 90 or more Minutes | 25 | 17.6% |
Commute Time by Sex in Bridgeville
The most common commute times in Bridgeville are 30 to 34 minutes (48 commuters, 47.5%) for males and 90 or more minutes (25 commuters, 61.0%) for females.
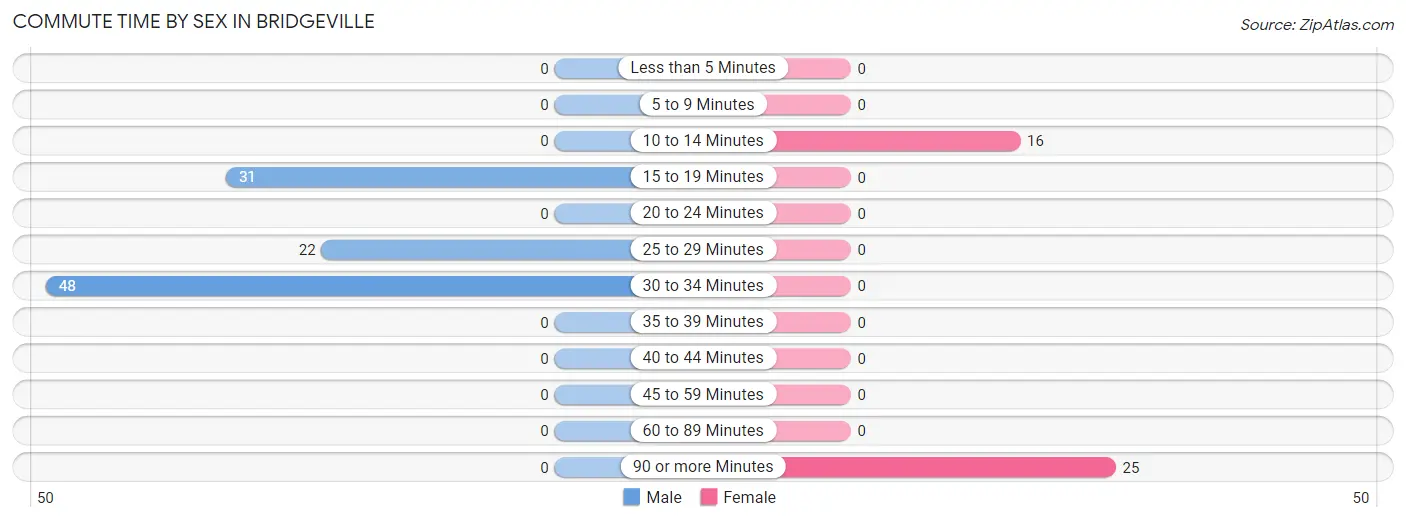
| Commute Time | Male | Female |
| Less than 5 Minutes | 0 (0.0%) | 0 (0.0%) |
| 5 to 9 Minutes | 0 (0.0%) | 0 (0.0%) |
| 10 to 14 Minutes | 0 (0.0%) | 16 (39.0%) |
| 15 to 19 Minutes | 31 (30.7%) | 0 (0.0%) |
| 20 to 24 Minutes | 0 (0.0%) | 0 (0.0%) |
| 25 to 29 Minutes | 22 (21.8%) | 0 (0.0%) |
| 30 to 34 Minutes | 48 (47.5%) | 0 (0.0%) |
| 35 to 39 Minutes | 0 (0.0%) | 0 (0.0%) |
| 40 to 44 Minutes | 0 (0.0%) | 0 (0.0%) |
| 45 to 59 Minutes | 0 (0.0%) | 0 (0.0%) |
| 60 to 89 Minutes | 0 (0.0%) | 0 (0.0%) |
| 90 or more Minutes | 0 (0.0%) | 25 (61.0%) |
Time of Departure to Work by Sex in Bridgeville
The most frequent times of departure to work in Bridgeville are 8:30 AM to 8:59 AM (32, 31.7%) for males and 7:30 AM to 7:59 AM (25, 61.0%) for females.
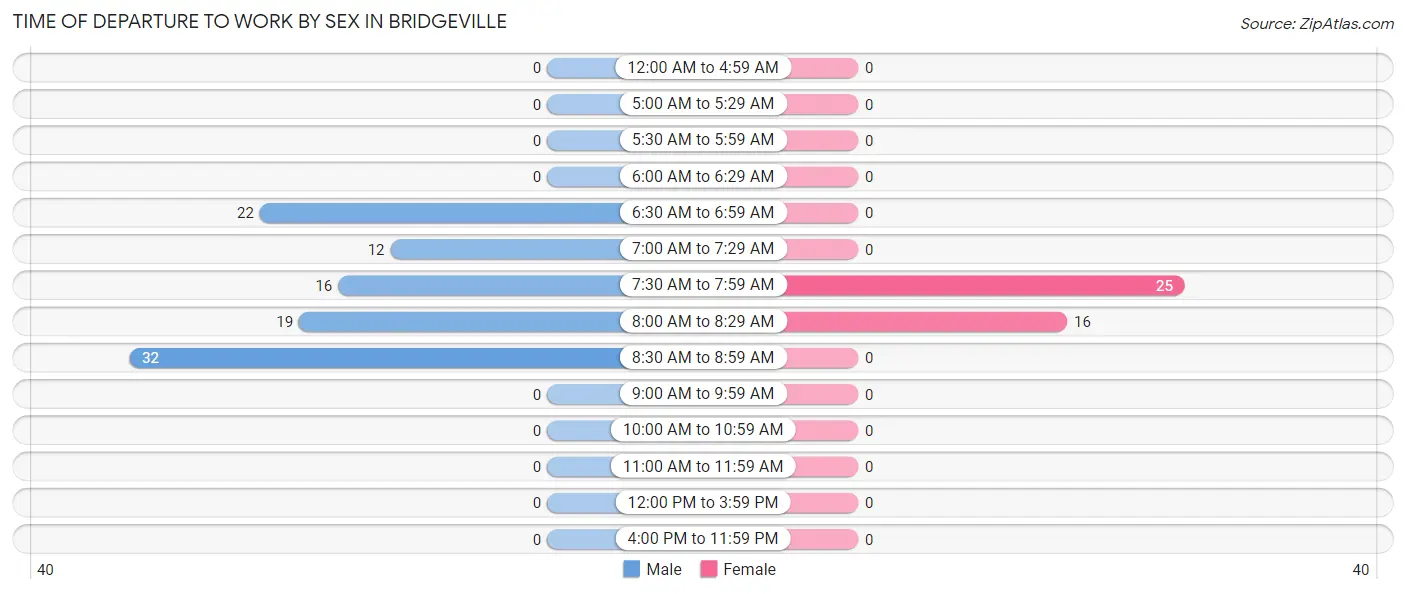
| Time of Departure | Male | Female |
| 12:00 AM to 4:59 AM | 0 (0.0%) | 0 (0.0%) |
| 5:00 AM to 5:29 AM | 0 (0.0%) | 0 (0.0%) |
| 5:30 AM to 5:59 AM | 0 (0.0%) | 0 (0.0%) |
| 6:00 AM to 6:29 AM | 0 (0.0%) | 0 (0.0%) |
| 6:30 AM to 6:59 AM | 22 (21.8%) | 0 (0.0%) |
| 7:00 AM to 7:29 AM | 12 (11.9%) | 0 (0.0%) |
| 7:30 AM to 7:59 AM | 16 (15.8%) | 25 (61.0%) |
| 8:00 AM to 8:29 AM | 19 (18.8%) | 16 (39.0%) |
| 8:30 AM to 8:59 AM | 32 (31.7%) | 0 (0.0%) |
| 9:00 AM to 9:59 AM | 0 (0.0%) | 0 (0.0%) |
| 10:00 AM to 10:59 AM | 0 (0.0%) | 0 (0.0%) |
| 11:00 AM to 11:59 AM | 0 (0.0%) | 0 (0.0%) |
| 12:00 PM to 3:59 PM | 0 (0.0%) | 0 (0.0%) |
| 4:00 PM to 11:59 PM | 0 (0.0%) | 0 (0.0%) |
| Total | 101 (100.0%) | 41 (100.0%) |
Housing Occupancy in Bridgeville
Occupancy by Ownership in Bridgeville
Of the total 108 dwellings in Bridgeville, owner-occupied units account for 83 (76.8%), while renter-occupied units make up 25 (23.2%).
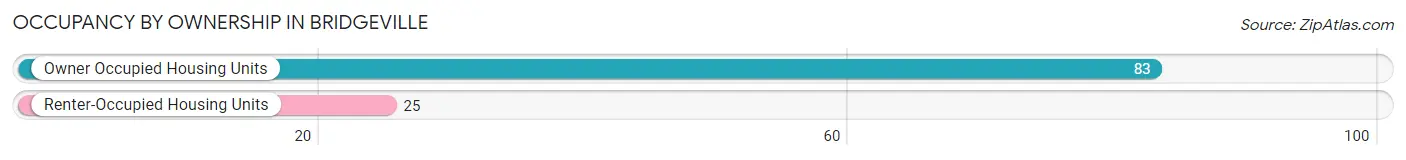
| Occupancy | # Housing Units | % Housing Units |
| Owner Occupied Housing Units | 83 | 76.8% |
| Renter-Occupied Housing Units | 25 | 23.2% |
| Total Occupied Housing Units | 108 | 100.0% |
Occupancy by Household Size in Bridgeville
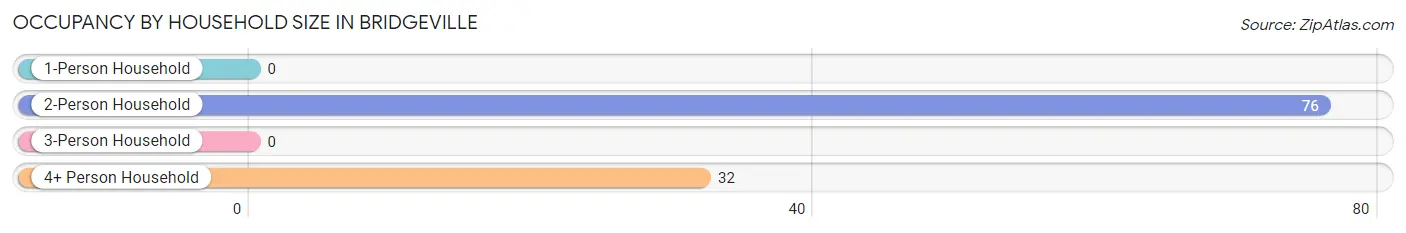
| Household Size | # Housing Units | % Housing Units |
| 1-Person Household | 0 | 0.0% |
| 2-Person Household | 76 | 70.4% |
| 3-Person Household | 0 | 0.0% |
| 4+ Person Household | 32 | 29.6% |
| Total Housing Units | 108 | 100.0% |
Occupancy by Ownership by Household Size in Bridgeville
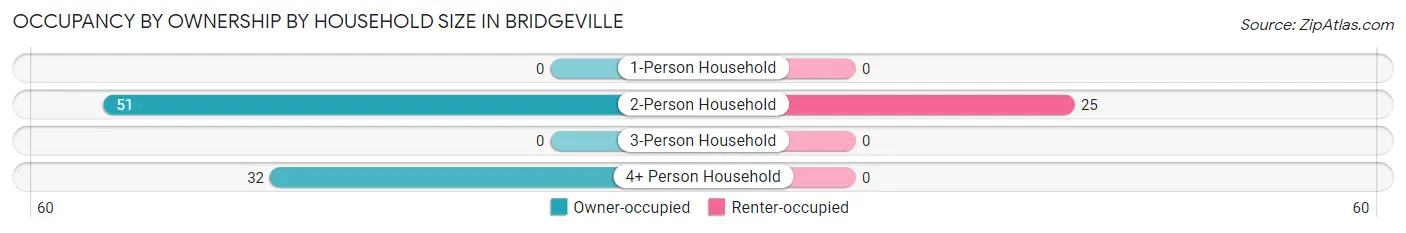
| Household Size | Owner-occupied | Renter-occupied |
| 1-Person Household | 0 (0.0%) | 0 (0.0%) |
| 2-Person Household | 51 (67.1%) | 25 (32.9%) |
| 3-Person Household | 0 (0.0%) | 0 (0.0%) |
| 4+ Person Household | 32 (100.0%) | 0 (0.0%) |
| Total Housing Units | 83 (76.8%) | 25 (23.2%) |
Occupancy by Educational Attainment in Bridgeville
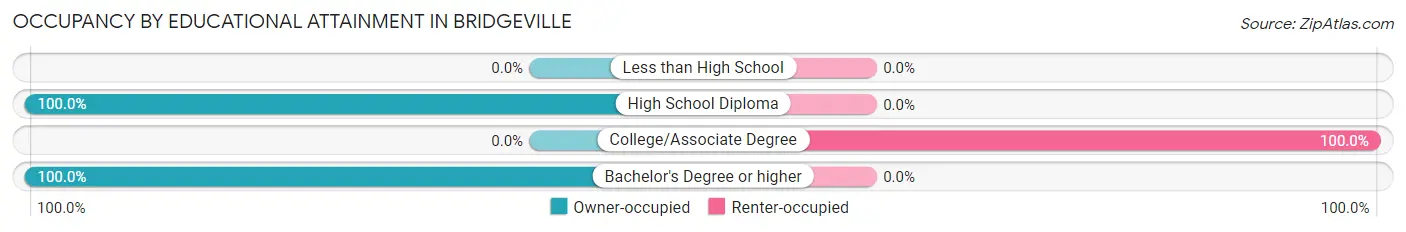
| Household Size | Owner-occupied | Renter-occupied |
| Less than High School | 0 (0.0%) | 0 (0.0%) |
| High School Diploma | 35 (100.0%) | 0 (0.0%) |
| College/Associate Degree | 0 (0.0%) | 25 (100.0%) |
| Bachelor's Degree or higher | 48 (100.0%) | 0 (0.0%) |
Occupancy by Age of Householder in Bridgeville
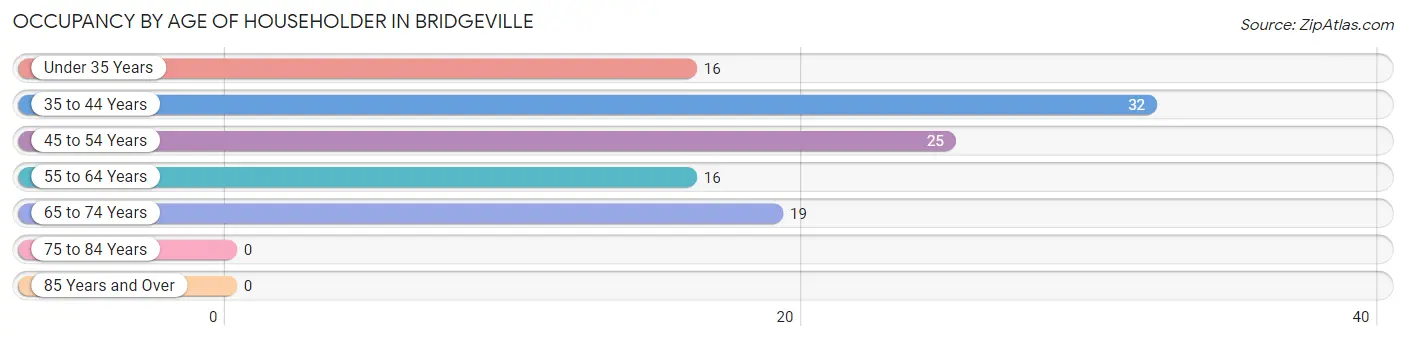
| Age Bracket | # Households | % Households |
| Under 35 Years | 16 | 14.8% |
| 35 to 44 Years | 32 | 29.6% |
| 45 to 54 Years | 25 | 23.2% |
| 55 to 64 Years | 16 | 14.8% |
| 65 to 74 Years | 19 | 17.6% |
| 75 to 84 Years | 0 | 0.0% |
| 85 Years and Over | 0 | 0.0% |
| Total | 108 | 100.0% |
Housing Finances in Bridgeville
Median Income by Occupancy in Bridgeville
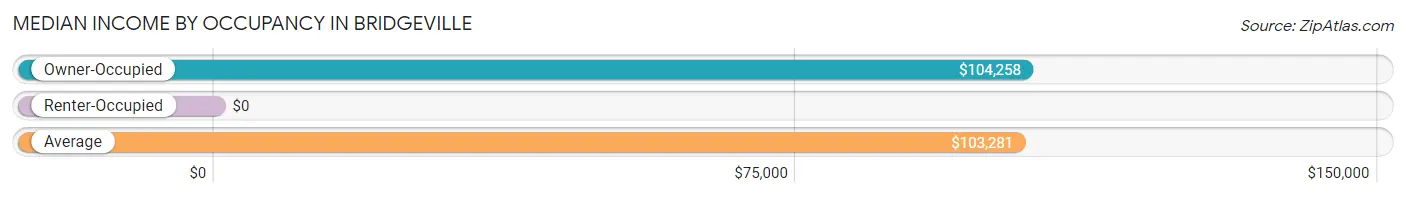
| Occupancy Type | # Households | Median Income |
| Owner-Occupied | 83 (76.8%) | $104,258 |
| Renter-Occupied | 25 (23.2%) | $0 |
| Average | 108 (100.0%) | $103,281 |
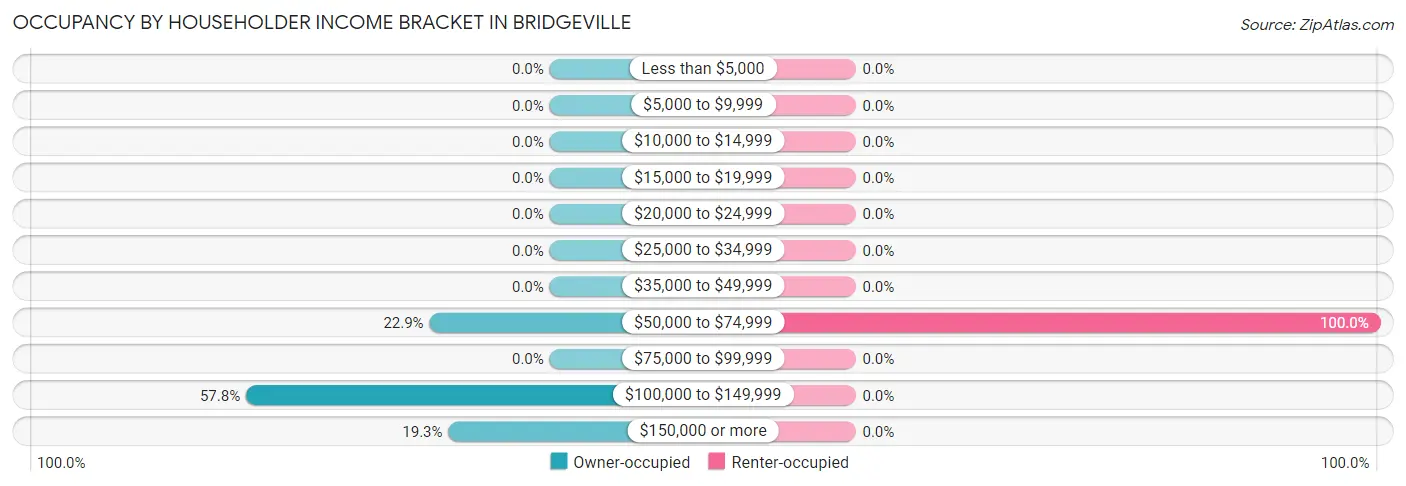
Occupancy by Householder Income Bracket in Bridgeville
| Income Bracket | Owner-occupied | Renter-occupied |
| Less than $5,000 | 0 (0.0%) | 0 (0.0%) |
| $5,000 to $9,999 | 0 (0.0%) | 0 (0.0%) |
| $10,000 to $14,999 | 0 (0.0%) | 0 (0.0%) |
| $15,000 to $19,999 | 0 (0.0%) | 0 (0.0%) |
| $20,000 to $24,999 | 0 (0.0%) | 0 (0.0%) |
| $25,000 to $34,999 | 0 (0.0%) | 0 (0.0%) |
| $35,000 to $49,999 | 0 (0.0%) | 0 (0.0%) |
| $50,000 to $74,999 | 19 (22.9%) | 25 (100.0%) |
| $75,000 to $99,999 | 0 (0.0%) | 0 (0.0%) |
| $100,000 to $149,999 | 48 (57.8%) | 0 (0.0%) |
| $150,000 or more | 16 (19.3%) | 0 (0.0%) |
| Total | 83 (100.0%) | 25 (100.0%) |
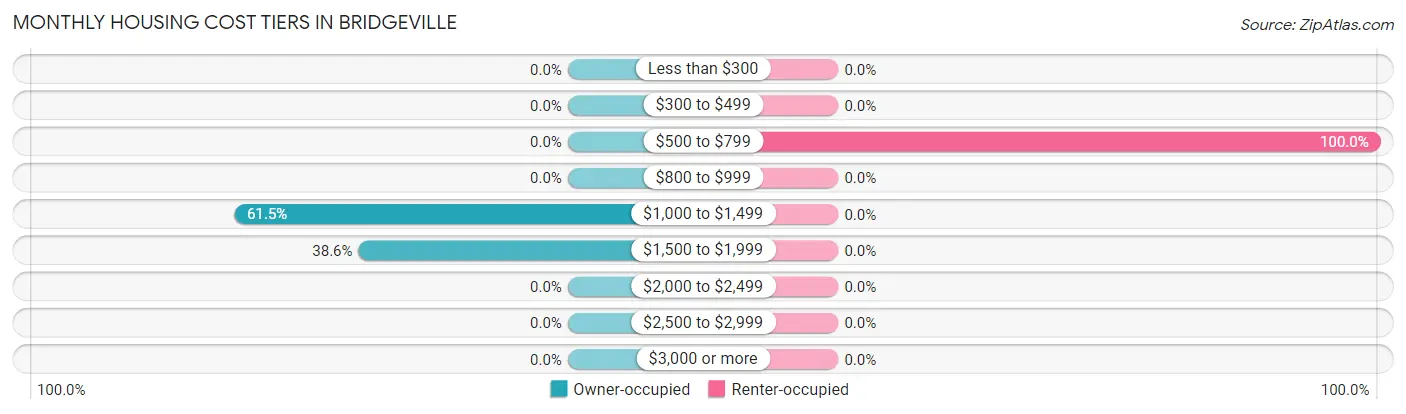
Monthly Housing Cost Tiers in Bridgeville
| Monthly Cost | Owner-occupied | Renter-occupied |
| Less than $300 | 0 (0.0%) | 0 (0.0%) |
| $300 to $499 | 0 (0.0%) | 0 (0.0%) |
| $500 to $799 | 0 (0.0%) | 25 (100.0%) |
| $800 to $999 | 0 (0.0%) | 0 (0.0%) |
| $1,000 to $1,499 | 51 (61.5%) | 0 (0.0%) |
| $1,500 to $1,999 | 32 (38.6%) | 0 (0.0%) |
| $2,000 to $2,499 | 0 (0.0%) | 0 (0.0%) |
| $2,500 to $2,999 | 0 (0.0%) | 0 (0.0%) |
| $3,000 or more | 0 (0.0%) | 0 (0.0%) |
| Total | 83 (100.0%) | 25 (100.0%) |
Physical Housing Characteristics in Bridgeville
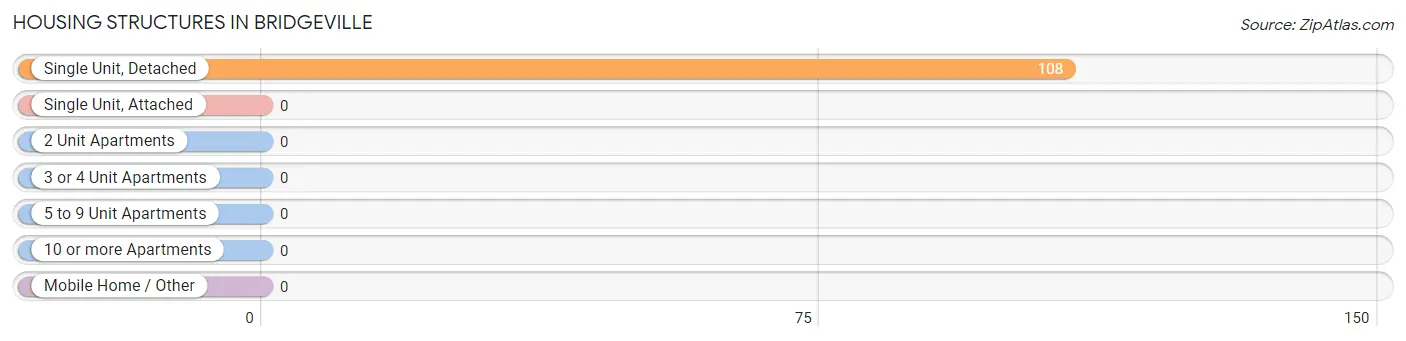
Housing Structures in Bridgeville
| Structure Type | # Housing Units | % Housing Units |
| Single Unit, Detached | 108 | 100.0% |
| Single Unit, Attached | 0 | 0.0% |
| 2 Unit Apartments | 0 | 0.0% |
| 3 or 4 Unit Apartments | 0 | 0.0% |
| 5 to 9 Unit Apartments | 0 | 0.0% |
| 10 or more Apartments | 0 | 0.0% |
| Mobile Home / Other | 0 | 0.0% |
| Total | 108 | 100.0% |
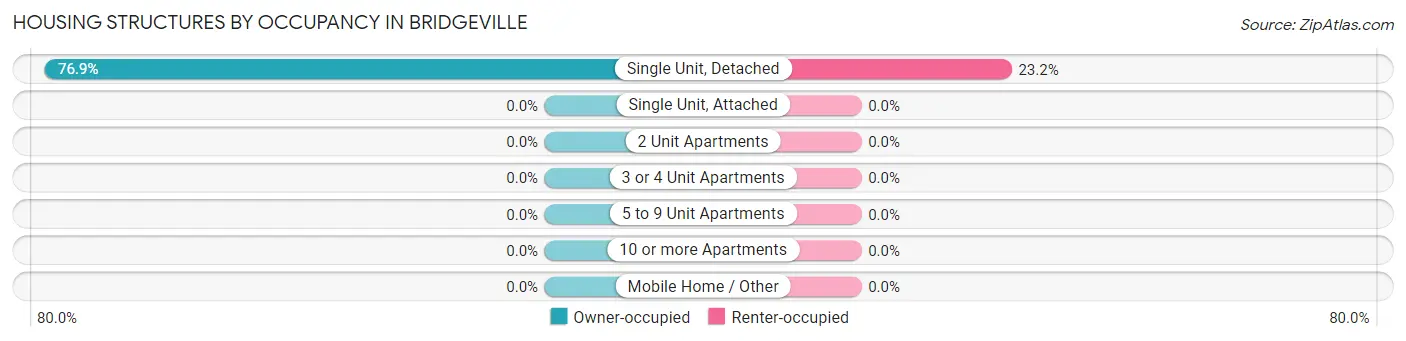
Housing Structures by Occupancy in Bridgeville
| Structure Type | Owner-occupied | Renter-occupied |
| Single Unit, Detached | 83 (76.8%) | 25 (23.2%) |
| Single Unit, Attached | 0 (0.0%) | 0 (0.0%) |
| 2 Unit Apartments | 0 (0.0%) | 0 (0.0%) |
| 3 or 4 Unit Apartments | 0 (0.0%) | 0 (0.0%) |
| 5 to 9 Unit Apartments | 0 (0.0%) | 0 (0.0%) |
| 10 or more Apartments | 0 (0.0%) | 0 (0.0%) |
| Mobile Home / Other | 0 (0.0%) | 0 (0.0%) |
| Total | 83 (76.8%) | 25 (23.2%) |
Housing Structures by Number of Rooms in Bridgeville
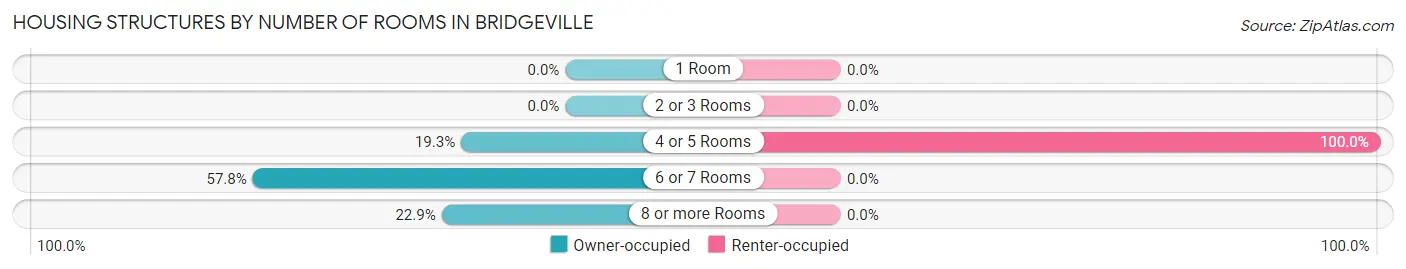
| Number of Rooms | Owner-occupied | Renter-occupied |
| 1 Room | 0 (0.0%) | 0 (0.0%) |
| 2 or 3 Rooms | 0 (0.0%) | 0 (0.0%) |
| 4 or 5 Rooms | 16 (19.3%) | 25 (100.0%) |
| 6 or 7 Rooms | 48 (57.8%) | 0 (0.0%) |
| 8 or more Rooms | 19 (22.9%) | 0 (0.0%) |
| Total | 83 (100.0%) | 25 (100.0%) |
Housing Structure by Heating Type in Bridgeville
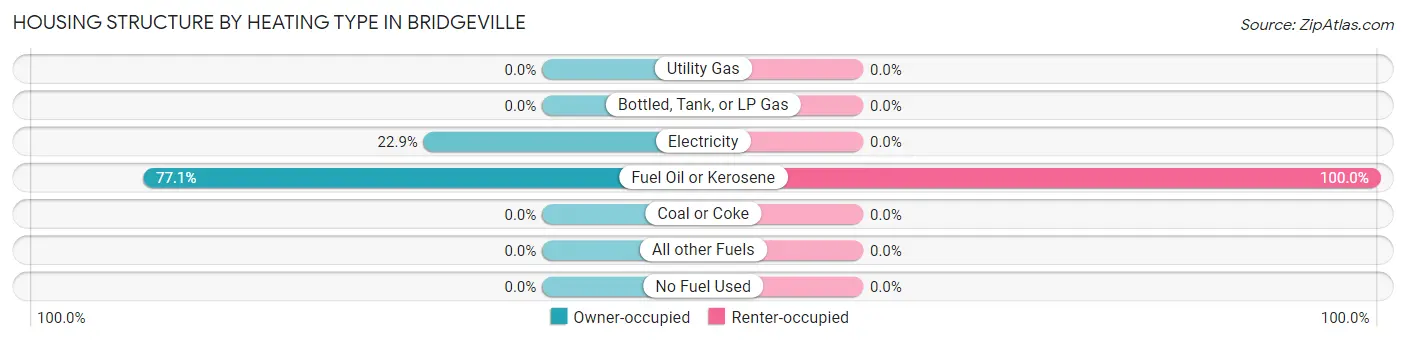
| Heating Type | Owner-occupied | Renter-occupied |
| Utility Gas | 0 (0.0%) | 0 (0.0%) |
| Bottled, Tank, or LP Gas | 0 (0.0%) | 0 (0.0%) |
| Electricity | 19 (22.9%) | 0 (0.0%) |
| Fuel Oil or Kerosene | 64 (77.1%) | 25 (100.0%) |
| Coal or Coke | 0 (0.0%) | 0 (0.0%) |
| All other Fuels | 0 (0.0%) | 0 (0.0%) |
| No Fuel Used | 0 (0.0%) | 0 (0.0%) |
| Total | 83 (100.0%) | 25 (100.0%) |
Household Vehicle Usage in Bridgeville
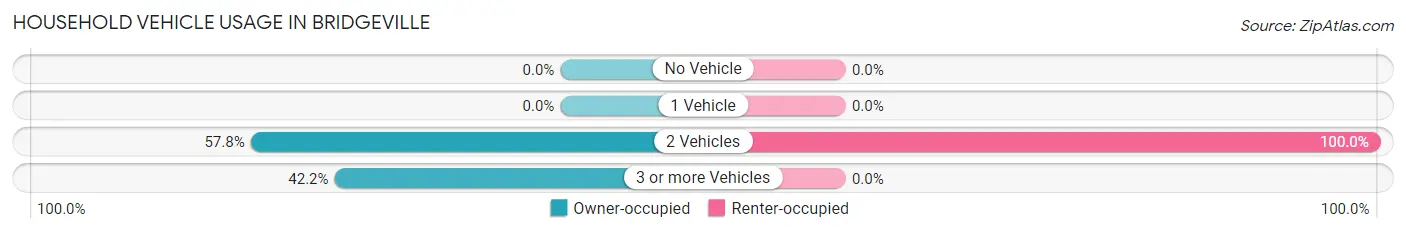
| Vehicles per Household | Owner-occupied | Renter-occupied |
| No Vehicle | 0 (0.0%) | 0 (0.0%) |
| 1 Vehicle | 0 (0.0%) | 0 (0.0%) |
| 2 Vehicles | 48 (57.8%) | 25 (100.0%) |
| 3 or more Vehicles | 35 (42.2%) | 0 (0.0%) |
| Total | 83 (100.0%) | 25 (100.0%) |
Real Estate & Mortgages in Bridgeville
Real Estate and Mortgage Overview in Bridgeville
| Characteristic | Without Mortgage | With Mortgage |
| Housing Units | 19 | 64 |
| Median Property Value | - | - |
| Median Household Income | - | - |
| Monthly Housing Costs | - | - |
| Real Estate Taxes | - | - |
Property Value by Mortgage Status in Bridgeville
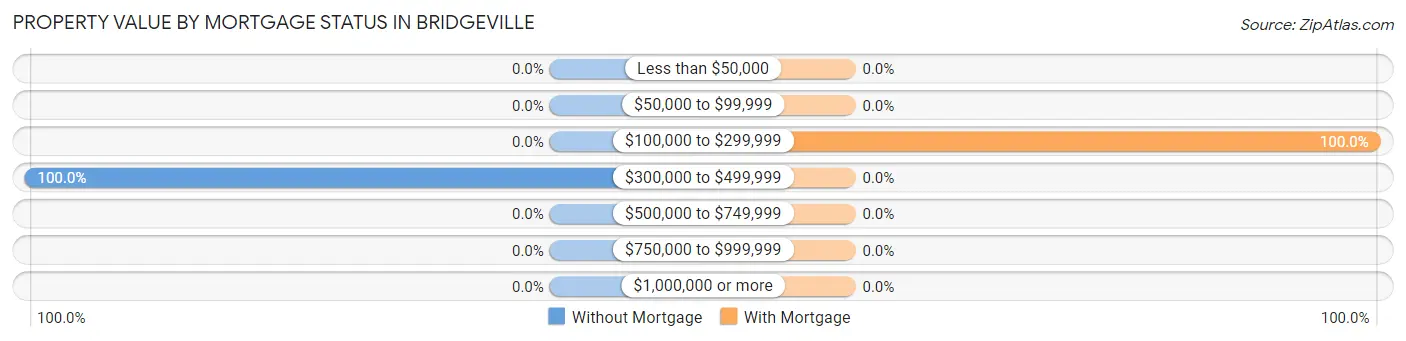
| Property Value | Without Mortgage | With Mortgage |
| Less than $50,000 | 0 (0.0%) | 0 (0.0%) |
| $50,000 to $99,999 | 0 (0.0%) | 0 (0.0%) |
| $100,000 to $299,999 | 0 (0.0%) | 64 (100.0%) |
| $300,000 to $499,999 | 19 (100.0%) | 0 (0.0%) |
| $500,000 to $749,999 | 0 (0.0%) | 0 (0.0%) |
| $750,000 to $999,999 | 0 (0.0%) | 0 (0.0%) |
| $1,000,000 or more | 0 (0.0%) | 0 (0.0%) |
| Total | 19 (100.0%) | 64 (100.0%) |
Household Income by Mortgage Status in Bridgeville
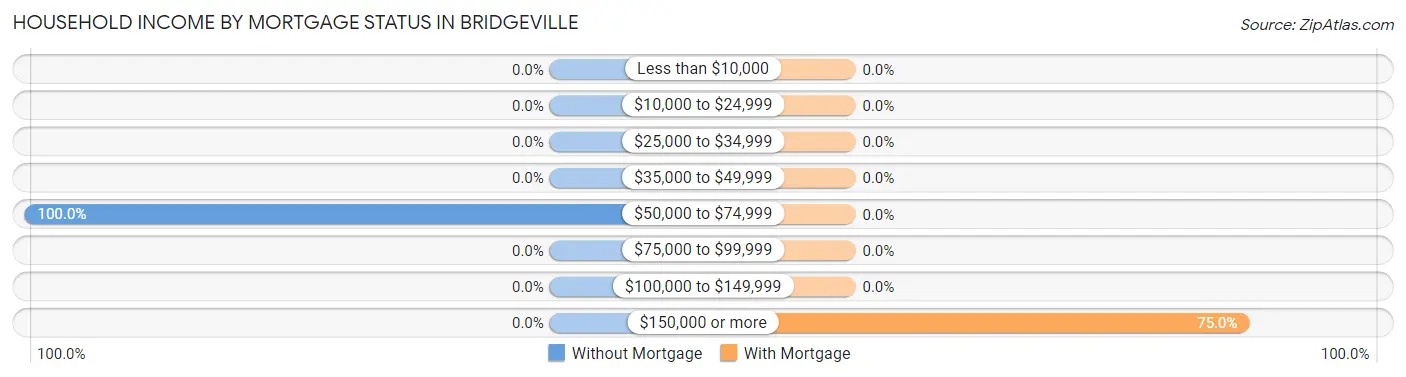
| Household Income | Without Mortgage | With Mortgage |
| Less than $10,000 | 0 (0.0%) | 0 (0.0%) |
| $10,000 to $24,999 | 0 (0.0%) | 0 (0.0%) |
| $25,000 to $34,999 | 0 (0.0%) | 0 (0.0%) |
| $35,000 to $49,999 | 0 (0.0%) | 0 (0.0%) |
| $50,000 to $74,999 | 19 (100.0%) | 0 (0.0%) |
| $75,000 to $99,999 | 0 (0.0%) | 0 (0.0%) |
| $100,000 to $149,999 | 0 (0.0%) | 0 (0.0%) |
| $150,000 or more | 0 (0.0%) | 48 (75.0%) |
| Total | 19 (100.0%) | 64 (100.0%) |
Property Value to Household Income Ratio in Bridgeville
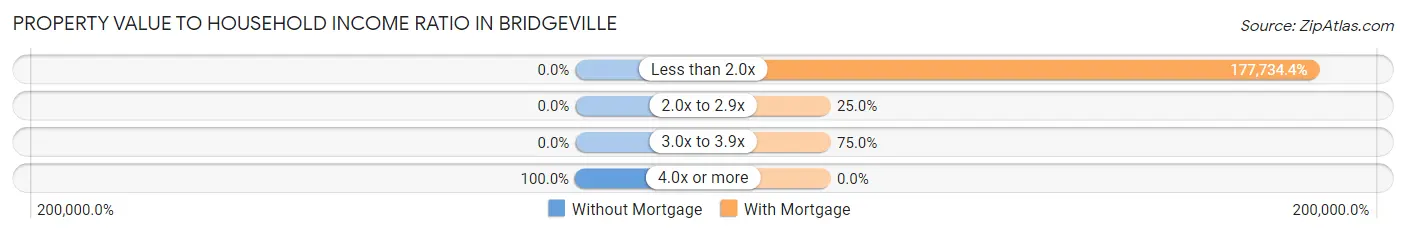
| Value-to-Income Ratio | Without Mortgage | With Mortgage |
| Less than 2.0x | 0 (0.0%) | 113,750 (177,734.4%) |
| 2.0x to 2.9x | 0 (0.0%) | 16 (25.0%) |
| 3.0x to 3.9x | 0 (0.0%) | 48 (75.0%) |
| 4.0x or more | 19 (100.0%) | 0 (0.0%) |
| Total | 19 (100.0%) | 64 (100.0%) |
Real Estate Taxes by Mortgage Status in Bridgeville
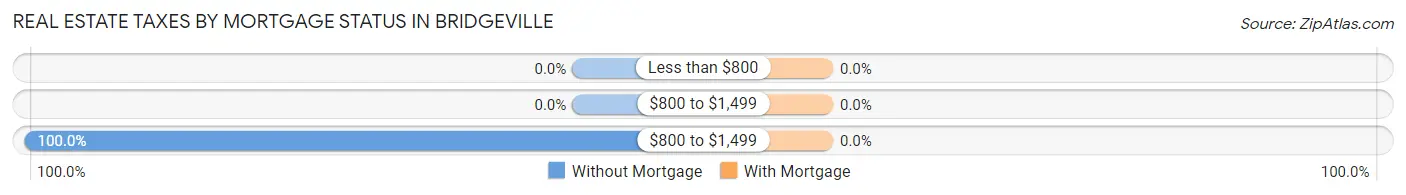
| Property Taxes | Without Mortgage | With Mortgage |
| Less than $800 | 0 (0.0%) | 0 (0.0%) |
| $800 to $1,499 | 0 (0.0%) | 0 (0.0%) |
| $800 to $1,499 | 19 (100.0%) | 0 (0.0%) |
| Total | 19 (100.0%) | 64 (100.0%) |
Health & Disability in Bridgeville
Health Insurance Coverage by Age in Bridgeville
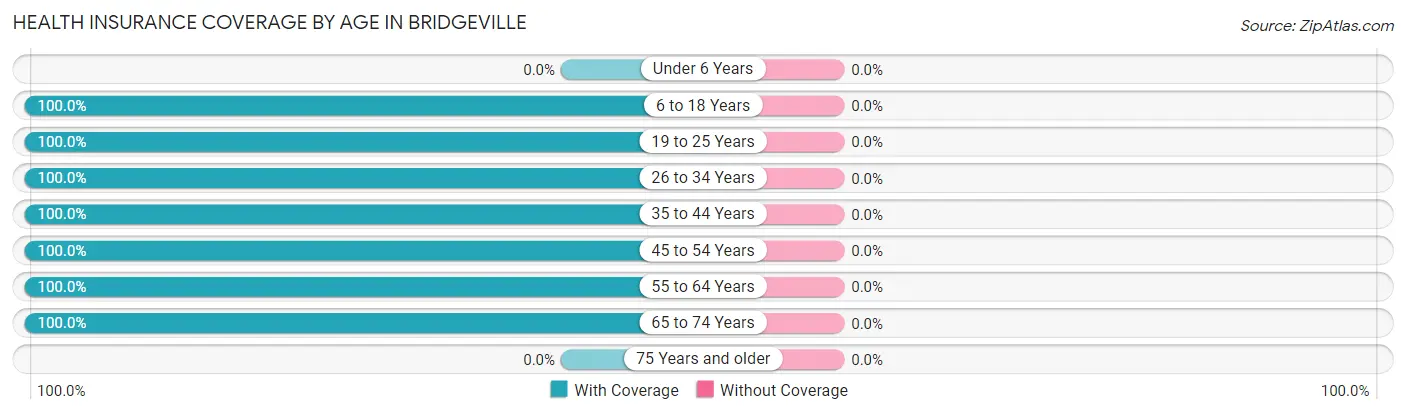
| Age Bracket | With Coverage | Without Coverage |
| Under 6 Years | 0 (0.0%) | 0 (0.0%) |
| 6 to 18 Years | 55 (100.0%) | 0 (0.0%) |
| 19 to 25 Years | 22 (100.0%) | 0 (0.0%) |
| 26 to 34 Years | 51 (100.0%) | 0 (0.0%) |
| 35 to 44 Years | 57 (100.0%) | 0 (0.0%) |
| 45 to 54 Years | 25 (100.0%) | 0 (0.0%) |
| 55 to 64 Years | 28 (100.0%) | 0 (0.0%) |
| 65 to 74 Years | 19 (100.0%) | 0 (0.0%) |
| 75 Years and older | 0 (0.0%) | 0 (0.0%) |
| Total | 257 (100.0%) | 0 (0.0%) |
Health Insurance Coverage by Citizenship Status in Bridgeville
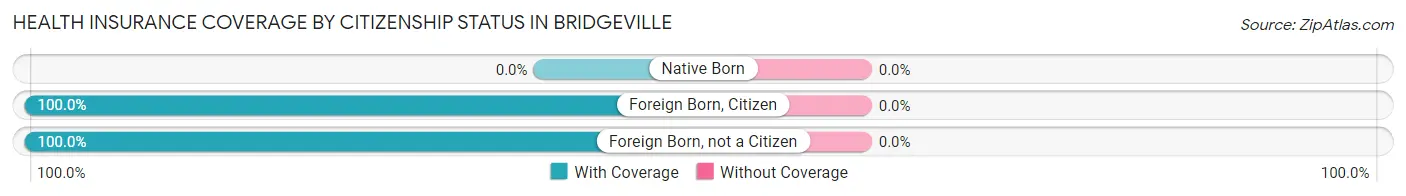
| Citizenship Status | With Coverage | Without Coverage |
| Native Born | 0 (0.0%) | 0 (0.0%) |
| Foreign Born, Citizen | 55 (100.0%) | 0 (0.0%) |
| Foreign Born, not a Citizen | 22 (100.0%) | 0 (0.0%) |
Health Insurance Coverage by Household Income in Bridgeville
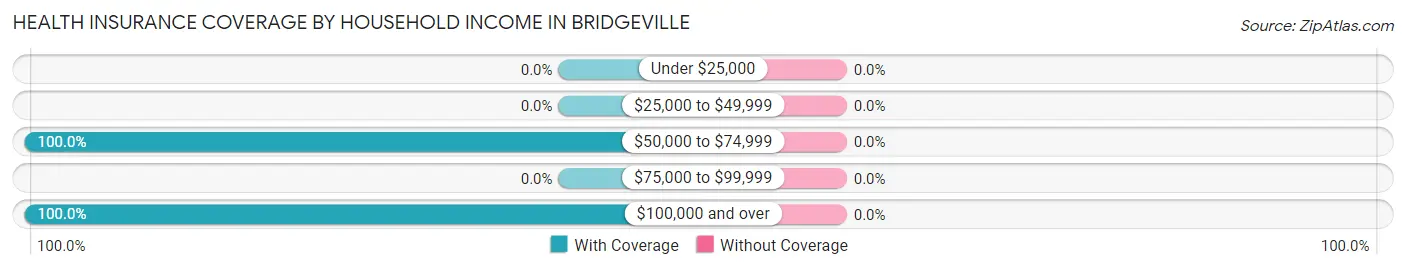
| Household Income | With Coverage | Without Coverage |
| Under $25,000 | 0 (0.0%) | 0 (0.0%) |
| $25,000 to $49,999 | 0 (0.0%) | 0 (0.0%) |
| $50,000 to $74,999 | 85 (100.0%) | 0 (0.0%) |
| $75,000 to $99,999 | 0 (0.0%) | 0 (0.0%) |
| $100,000 and over | 172 (100.0%) | 0 (0.0%) |
Public vs Private Health Insurance Coverage by Age in Bridgeville
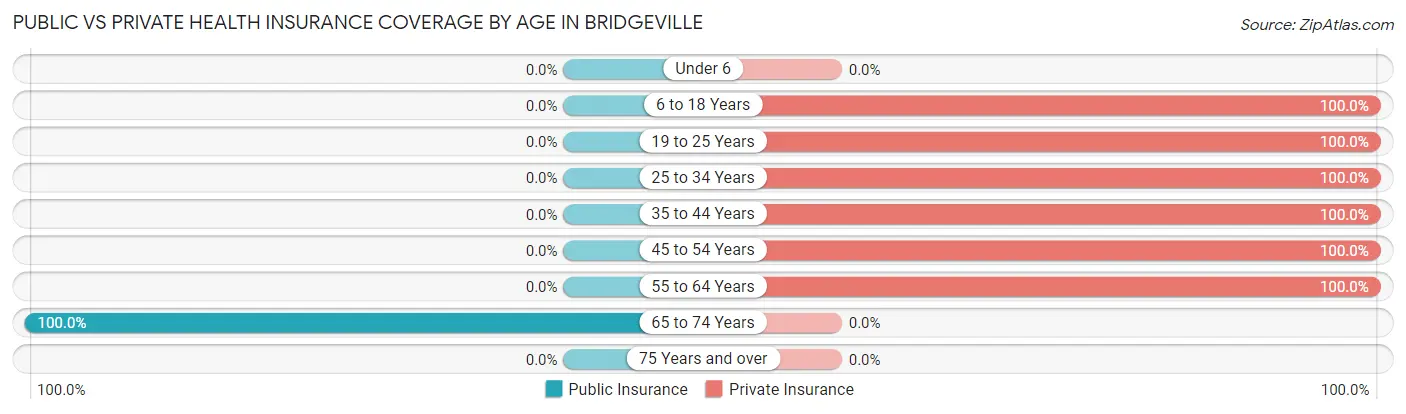
| Age Bracket | Public Insurance | Private Insurance |
| Under 6 | 0 (0.0%) | 0 (0.0%) |
| 6 to 18 Years | 0 (0.0%) | 55 (100.0%) |
| 19 to 25 Years | 0 (0.0%) | 22 (100.0%) |
| 25 to 34 Years | 0 (0.0%) | 51 (100.0%) |
| 35 to 44 Years | 0 (0.0%) | 57 (100.0%) |
| 45 to 54 Years | 0 (0.0%) | 25 (100.0%) |
| 55 to 64 Years | 0 (0.0%) | 28 (100.0%) |
| 65 to 74 Years | 19 (100.0%) | 0 (0.0%) |
| 75 Years and over | 0 (0.0%) | 0 (0.0%) |
| Total | 19 (7.4%) | 238 (92.6%) |
Disability Status by Sex by Age in Bridgeville
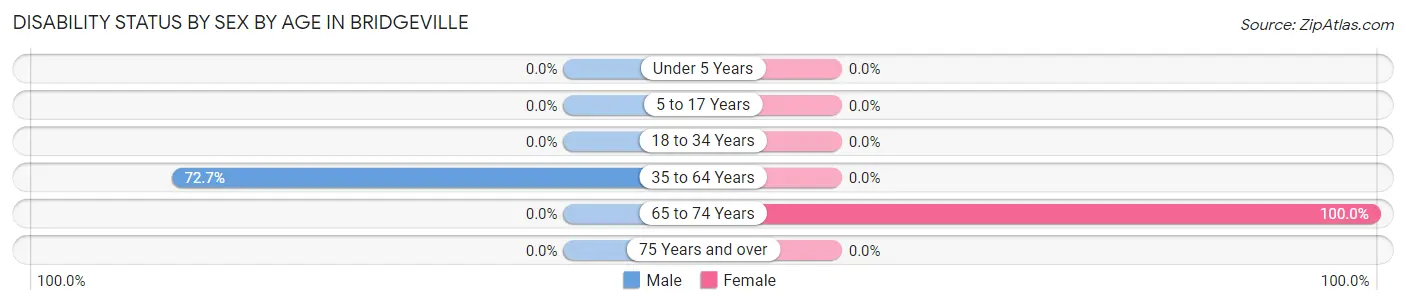
| Age Bracket | Male | Female |
| Under 5 Years | 0 (0.0%) | 0 (0.0%) |
| 5 to 17 Years | 0 (0.0%) | 0 (0.0%) |
| 18 to 34 Years | 0 (0.0%) | 0 (0.0%) |
| 35 to 64 Years | 32 (72.7%) | 0 (0.0%) |
| 65 to 74 Years | 0 (0.0%) | 19 (100.0%) |
| 75 Years and over | 0 (0.0%) | 0 (0.0%) |
Disability Class by Sex by Age in Bridgeville
Disability Class: Hearing Difficulty
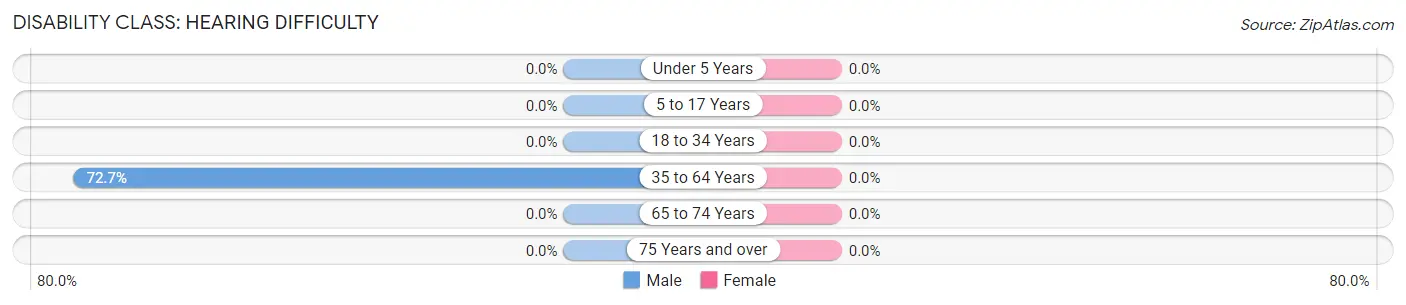
| Age Bracket | Male | Female |
| Under 5 Years | 0 (0.0%) | 0 (0.0%) |
| 5 to 17 Years | 0 (0.0%) | 0 (0.0%) |
| 18 to 34 Years | 0 (0.0%) | 0 (0.0%) |
| 35 to 64 Years | 32 (72.7%) | 0 (0.0%) |
| 65 to 74 Years | 0 (0.0%) | 0 (0.0%) |
| 75 Years and over | 0 (0.0%) | 0 (0.0%) |
Disability Class: Vision Difficulty
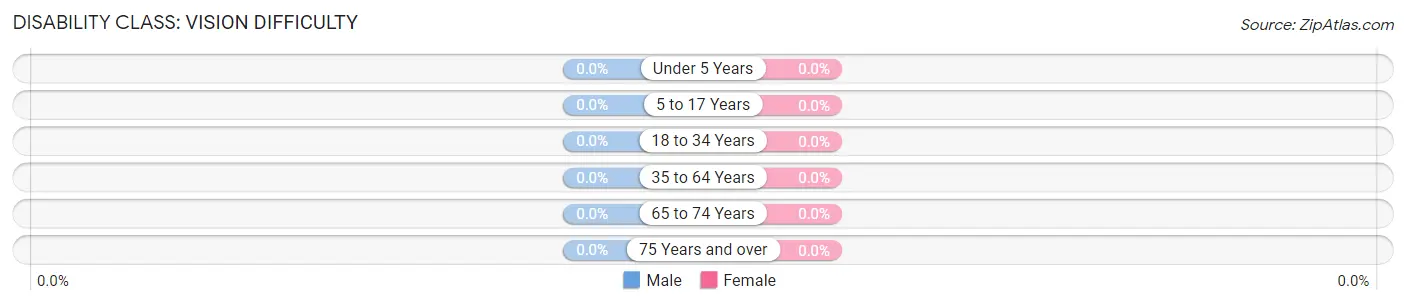
| Age Bracket | Male | Female |
| Under 5 Years | 0 (0.0%) | 0 (0.0%) |
| 5 to 17 Years | 0 (0.0%) | 0 (0.0%) |
| 18 to 34 Years | 0 (0.0%) | 0 (0.0%) |
| 35 to 64 Years | 0 (0.0%) | 0 (0.0%) |
| 65 to 74 Years | 0 (0.0%) | 0 (0.0%) |
| 75 Years and over | 0 (0.0%) | 0 (0.0%) |
Disability Class: Cognitive Difficulty
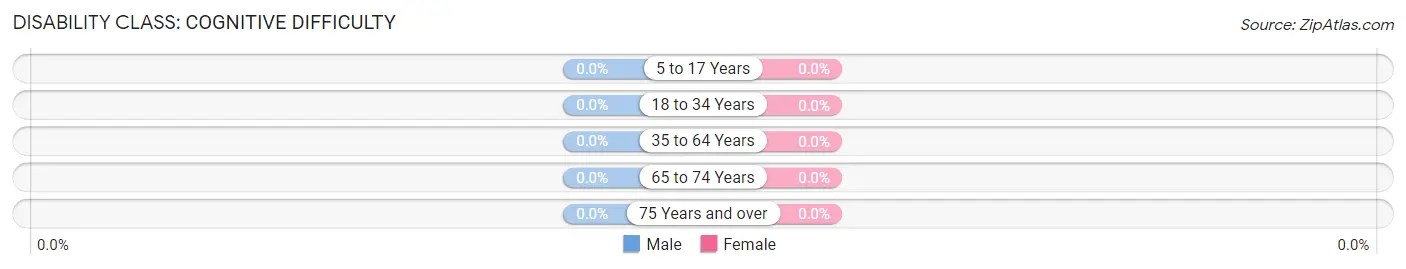
| Age Bracket | Male | Female |
| 5 to 17 Years | 0 (0.0%) | 0 (0.0%) |
| 18 to 34 Years | 0 (0.0%) | 0 (0.0%) |
| 35 to 64 Years | 0 (0.0%) | 0 (0.0%) |
| 65 to 74 Years | 0 (0.0%) | 0 (0.0%) |
| 75 Years and over | 0 (0.0%) | 0 (0.0%) |
Disability Class: Ambulatory Difficulty
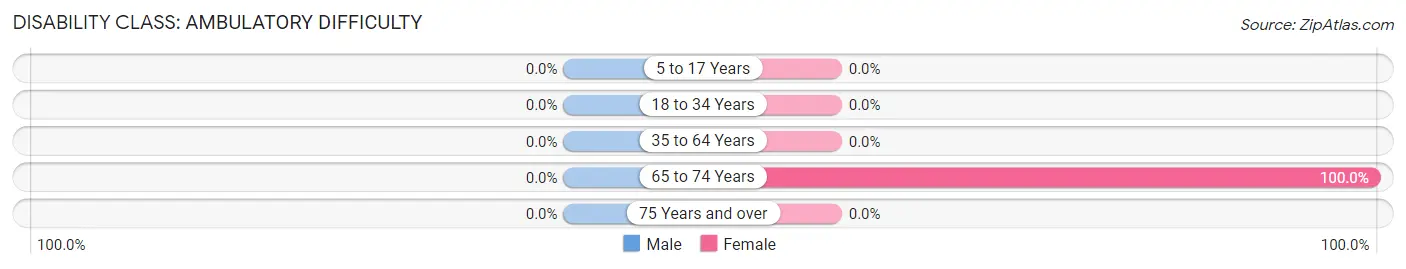
| Age Bracket | Male | Female |
| 5 to 17 Years | 0 (0.0%) | 0 (0.0%) |
| 18 to 34 Years | 0 (0.0%) | 0 (0.0%) |
| 35 to 64 Years | 0 (0.0%) | 0 (0.0%) |
| 65 to 74 Years | 0 (0.0%) | 19 (100.0%) |
| 75 Years and over | 0 (0.0%) | 0 (0.0%) |
Disability Class: Self-Care Difficulty
| Age Bracket | Male | Female |
| 5 to 17 Years | 0 (0.0%) | 0 (0.0%) |
| 18 to 34 Years | 0 (0.0%) | 0 (0.0%) |
| 35 to 64 Years | 0 (0.0%) | 0 (0.0%) |
| 65 to 74 Years | 0 (0.0%) | 0 (0.0%) |
| 75 Years and over | 0 (0.0%) | 0 (0.0%) |
Technology Access in Bridgeville
Computing Device Access in Bridgeville
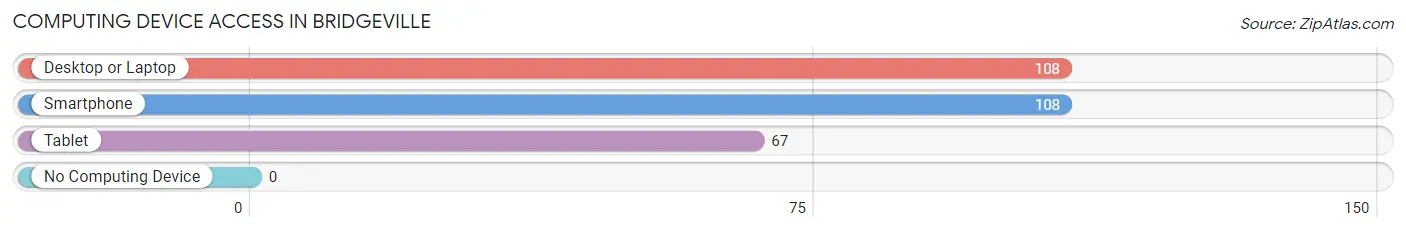
| Device Type | # Households | % Households |
| Desktop or Laptop | 108 | 100.0% |
| Smartphone | 108 | 100.0% |
| Tablet | 67 | 62.0% |
| No Computing Device | 0 | 0.0% |
| Total | 108 | 100.0% |
Internet Access in Bridgeville
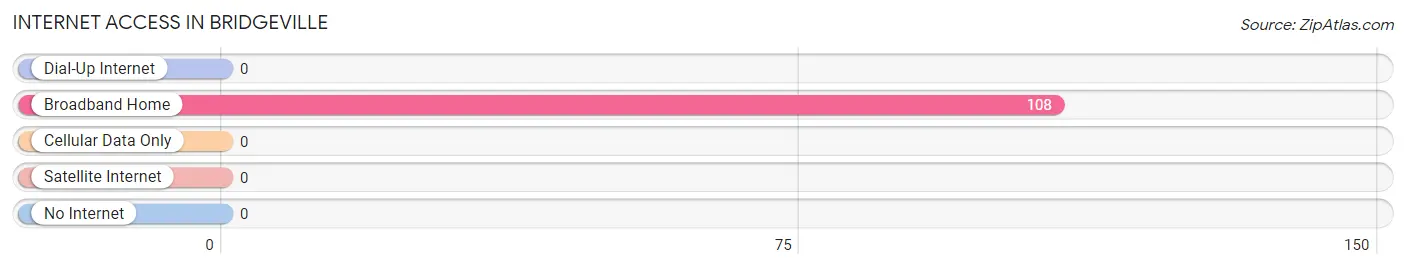
| Internet Type | # Households | % Households |
| Dial-Up Internet | 0 | 0.0% |
| Broadband Home | 108 | 100.0% |
| Cellular Data Only | 0 | 0.0% |
| Satellite Internet | 0 | 0.0% |
| No Internet | 0 | 0.0% |
| Total | 108 | 100.0% |
Bridgeville Summary
Bridgeville is a small unincorporated community located in Salem County, New Jersey. It is situated in the southwestern corner of the county, near the Delaware River. The community is bordered by Alloway Township to the north, Mannington Township to the east, and Pennsville Township to the south. The population of Bridgeville was estimated to be 1,845 in 2019.
History
Bridgeville was first settled in the late 1700s by a group of Quakers from Pennsylvania. The community was originally known as “Bridge Town” due to its location near a bridge that crossed the Salem River. The bridge was built in 1790 and was the first bridge to span the river. The bridge was destroyed by a flood in 1841, but was rebuilt in 1845.
The community was officially incorporated as Bridgeville in 1845. The town was named after the bridge that crossed the river. The town grew rapidly in the late 1800s and early 1900s, with the construction of several mills and factories. The town was also home to a number of churches, schools, and other businesses.
Geography
Bridgeville is located in southwestern Salem County, near the Delaware River. The community is bordered by Alloway Township to the north, Mannington Township to the east, and Pennsville Township to the south. The town is situated on the Salem River, which flows into the Delaware River. The town is located approximately 10 miles south of Salem, the county seat.
The town has a total area of 1.2 square miles, all of which is land. The town is mostly flat, with some rolling hills in the northern part of town. The town is located in the Atlantic Coastal Plain, and is part of the Delaware Valley region.
Economy
The economy of Bridgeville is largely based on agriculture and manufacturing. The town is home to several farms, which produce a variety of crops, including corn, soybeans, and wheat. The town is also home to several factories, which produce a variety of products, including paper products, furniture, and clothing.
The town is also home to several small businesses, including restaurants, stores, and other services. The town is also home to a number of churches, schools, and other organizations.
Demographics
The population of Bridgeville was estimated to be 1,845 in 2019. The town has a population density of 1,521 people per square mile. The median age of the population is 43.7 years, and the median household income is $60,945.
The town is predominantly white, with a population that is 94.3% white, 2.2% African American, 1.2% Hispanic or Latino, and 1.2% Asian. The town is also home to a small population of Native Americans, at 0.2%.
The town is served by the Salem County School District, which includes two elementary schools, one middle school, and one high school. The town is also home to a number of churches, including the Bridgeville United Methodist Church, the Bridgeville Presbyterian Church, and the Bridgeville Baptist Church.
Common Questions
What is the Total Population of Bridgeville?
Total Population of Bridgeville is 257.
What is the Total Male Population of Bridgeville?
Total Male Population of Bridgeville is 129.
What is the Total Female Population of Bridgeville?
Total Female Population of Bridgeville is 128.
What is the Ratio of Males per 100 Females in Bridgeville?
There are 100.78 Males per 100 Females in Bridgeville.
What is the Ratio of Females per 100 Males in Bridgeville?
There are 99.22 Females per 100 Males in Bridgeville.
What is the Median Population Age in Bridgeville?
Median Population Age in Bridgeville is 36.0 Years.
What is the Average Family Size in Bridgeville
Average Family Size in Bridgeville is 2.5 People.
What is the Average Household Size in Bridgeville
Average Household Size in Bridgeville is 2.4 People.
What is Per Capita Income in Bridgeville?
Per Capita income in Bridgeville is $42,057.
What is the Median Family Income in Bridgeville?
Median Family Income in Bridgeville is $102,656.
What is the Median Household income in Bridgeville?
Median Household Income in Bridgeville is $103,281.
What is Inequality or Gini Index in Bridgeville?
Inequality or Gini Index in Bridgeville is 0.18.
How Large is the Labor Force in Bridgeville?
There are 158 People in the Labor Forcein in Bridgeville.
What is the Percentage of People in the Labor Force in Bridgeville?
78.2% of People are in the Labor Force in Bridgeville.