Burleigh, NJ
Burleigh Map
Burleigh Overview
331
TOTAL POPULATION
110
MALE POPULATION
221
FEMALE POPULATION
49.77
MALES / 100 FEMALES
200.91
FEMALES / 100 MALES
64.3
MEDIAN AGE
1.9
AVG FAMILY SIZE
1.7
AVG HOUSEHOLD SIZE
$54,756
PER CAPITA INCOME
$121,917
AVG FAMILY INCOME
$111,641
AVG HOUSEHOLD INCOME
43.5%
WAGE / INCOME GAP [ % ]
56.5¢/ $1
WAGE / INCOME GAP [ $ ]
0.41
INEQUALITY / GINI INDEX
145
LABOR FORCE [ PEOPLE ]
45.9%
PERCENT IN LABOR FORCE
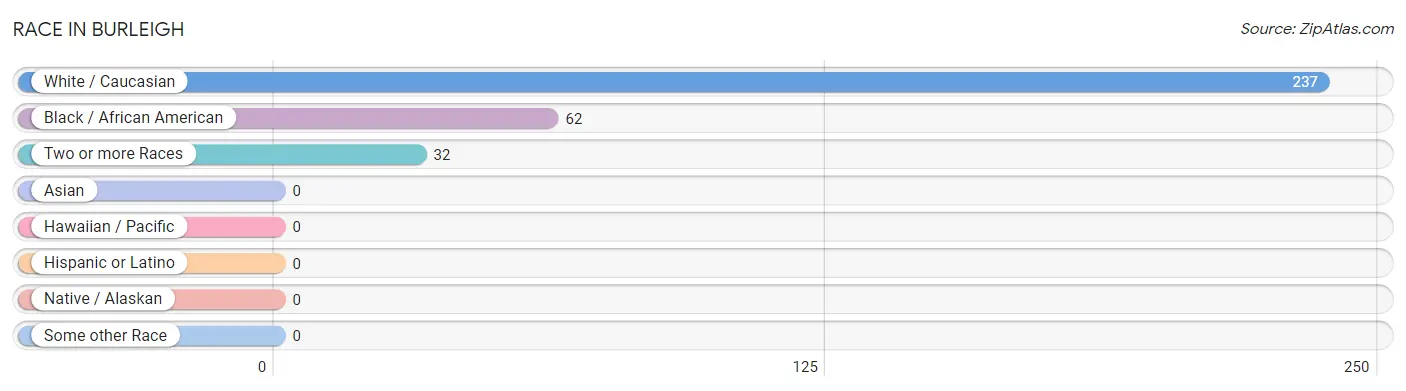
Race in Burleigh
The most populous races in Burleigh are White / Caucasian (237 | 71.6%), Black / African American (62 | 18.7%), and Two or more Races (32 | 9.7%).
| Race | # Population | % Population |
| Asian | 0 | 0.0% |
| Black / African American | 62 | 18.7% |
| Hawaiian / Pacific | 0 | 0.0% |
| Hispanic or Latino | 0 | 0.0% |
| Native / Alaskan | 0 | 0.0% |
| White / Caucasian | 237 | 71.6% |
| Two or more Races | 32 | 9.7% |
| Some other Race | 0 | 0.0% |
| Total | 331 | 100.0% |
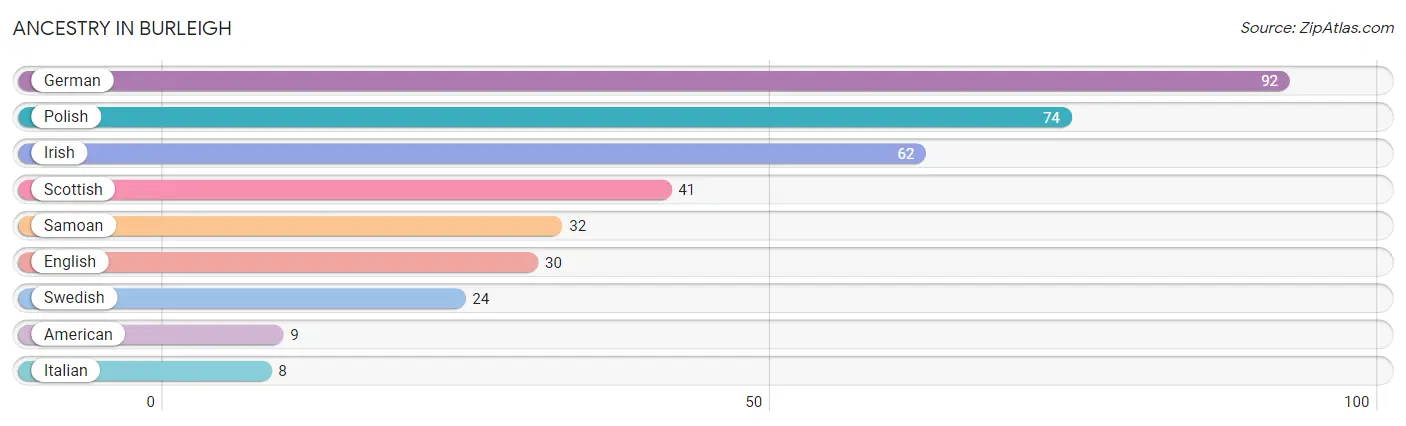
Ancestry in Burleigh
The most populous ancestries reported in Burleigh are German (92 | 27.8%), Polish (74 | 22.4%), Irish (62 | 18.7%), Scottish (41 | 12.4%), and Samoan (32 | 9.7%), together accounting for 90.9% of all Burleigh residents.
| Ancestry | # Population | % Population |
| American | 9 | 2.7% |
| English | 30 | 9.1% |
| German | 92 | 27.8% |
| Irish | 62 | 18.7% |
| Italian | 8 | 2.4% |
| Polish | 74 | 22.4% |
| Samoan | 32 | 9.7% |
| Scottish | 41 | 12.4% |
| Swedish | 24 | 7.2% | View All 9 Rows |
Immigrants in Burleigh
The most numerous immigrant groups reported in Burleigh came from , and Oceania (32 | 9.7%), together accounting for 9.7% of all Burleigh residents.

| Immigration Origin | # Population | % Population |
| Oceania | 32 | 9.7% | View All 1 Rows |
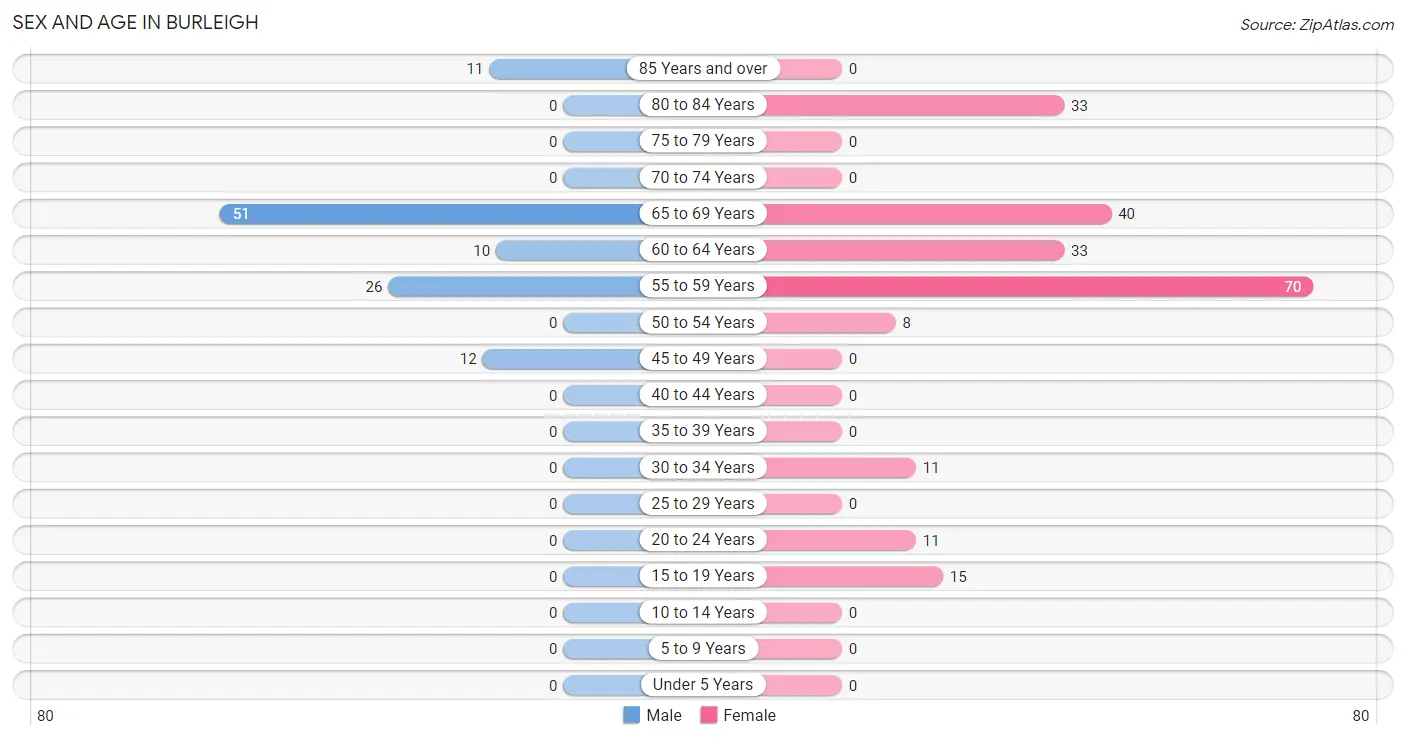
Sex and Age in Burleigh
Sex and Age in Burleigh
The most populous age groups in Burleigh are 65 to 69 Years (51 | 46.4%) for men and 55 to 59 Years (70 | 31.7%) for women.
| Age Bracket | Male | Female |
| Under 5 Years | 0 (0.0%) | 0 (0.0%) |
| 5 to 9 Years | 0 (0.0%) | 0 (0.0%) |
| 10 to 14 Years | 0 (0.0%) | 0 (0.0%) |
| 15 to 19 Years | 0 (0.0%) | 15 (6.8%) |
| 20 to 24 Years | 0 (0.0%) | 11 (5.0%) |
| 25 to 29 Years | 0 (0.0%) | 0 (0.0%) |
| 30 to 34 Years | 0 (0.0%) | 11 (5.0%) |
| 35 to 39 Years | 0 (0.0%) | 0 (0.0%) |
| 40 to 44 Years | 0 (0.0%) | 0 (0.0%) |
| 45 to 49 Years | 12 (10.9%) | 0 (0.0%) |
| 50 to 54 Years | 0 (0.0%) | 8 (3.6%) |
| 55 to 59 Years | 26 (23.6%) | 70 (31.7%) |
| 60 to 64 Years | 10 (9.1%) | 33 (14.9%) |
| 65 to 69 Years | 51 (46.4%) | 40 (18.1%) |
| 70 to 74 Years | 0 (0.0%) | 0 (0.0%) |
| 75 to 79 Years | 0 (0.0%) | 0 (0.0%) |
| 80 to 84 Years | 0 (0.0%) | 33 (14.9%) |
| 85 Years and over | 11 (10.0%) | 0 (0.0%) |
| Total | 110 (100.0%) | 221 (100.0%) |
Families and Households in Burleigh
Median Family Size in Burleigh
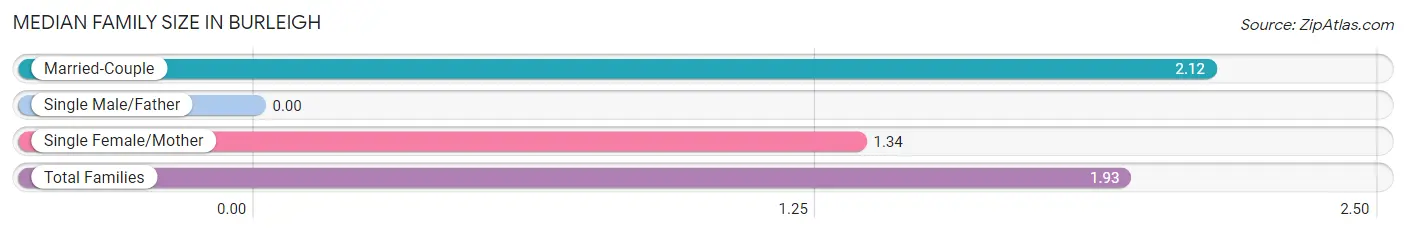
| Family Type | # Families | Family Size |
| Married-Couple | 100 (75.8%) | 2.12 |
| Single Male/Father | 0 (0.0%) | - |
| Single Female/Mother | 32 (24.2%) | 1.34 |
| Total Families | 132 (100.0%) | 1.93 |
Median Household Size in Burleigh
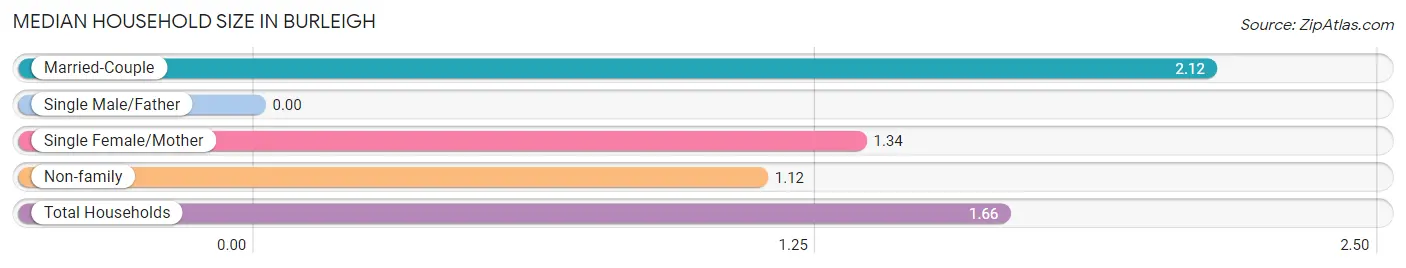
| Household Type | # Households | Household Size |
| Married-Couple | 100 (50.0%) | 2.12 |
| Single Male/Father | 0 (0.0%) | - |
| Single Female/Mother | 32 (16.0%) | 1.34 |
| Non-family | 68 (34.0%) | 1.12 |
| Total Households | 200 (100.0%) | 1.66 |
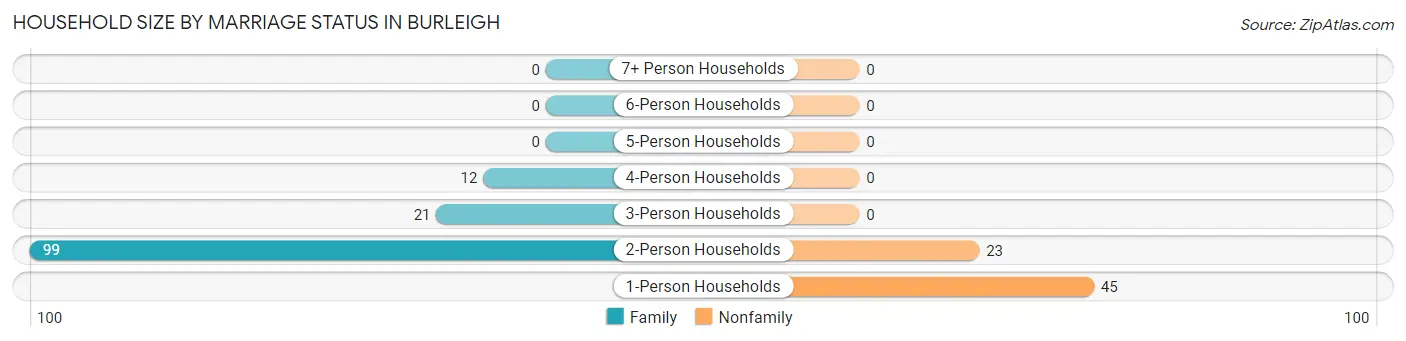
Household Size by Marriage Status in Burleigh
Out of a total of 200 households in Burleigh, 132 (66.0%) are family households, while 68 (34.0%) are nonfamily households. The most numerous type of family households are 2-person households, comprising 99, and the most common type of nonfamily households are 1-person households, comprising 45.
| Household Size | Family Households | Nonfamily Households |
| 1-Person Households | - | 45 (22.5%) |
| 2-Person Households | 99 (49.5%) | 23 (11.5%) |
| 3-Person Households | 21 (10.5%) | 0 (0.0%) |
| 4-Person Households | 12 (6.0%) | 0 (0.0%) |
| 5-Person Households | 0 (0.0%) | 0 (0.0%) |
| 6-Person Households | 0 (0.0%) | 0 (0.0%) |
| 7+ Person Households | 0 (0.0%) | 0 (0.0%) |
| Total | 132 (66.0%) | 68 (34.0%) |
Female Fertility in Burleigh
Fertility by Age in Burleigh
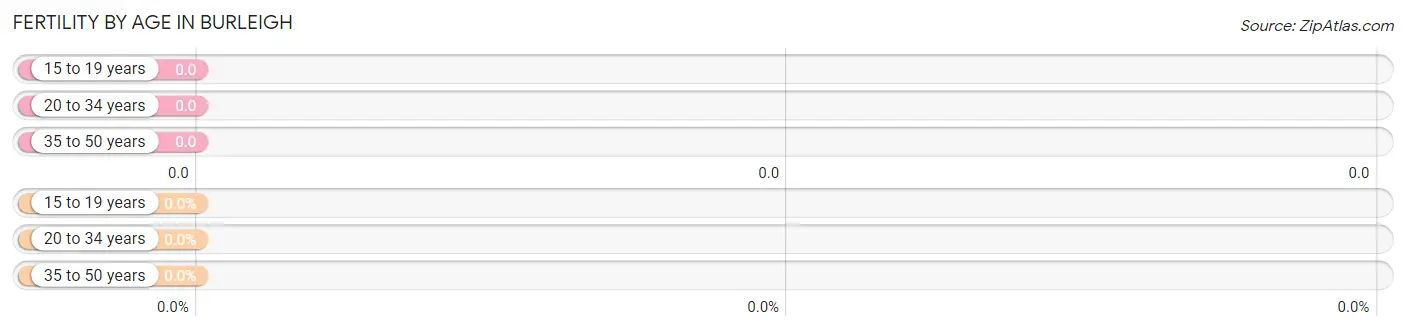
| Age Bracket | Women with Births | Births / 1,000 Women |
| 15 to 19 years | 0 (0.0%) | 0.0 |
| 20 to 34 years | 0 (0.0%) | 0.0 |
| 35 to 50 years | 0 (0.0%) | 0.0 |
| Total | 0 (0.0%) | 0.0 |
Fertility by Age by Marriage Status in Burleigh
| Age Bracket | Married | Unmarried |
| 15 to 19 years | 0 (0.0%) | 0 (0.0%) |
| 20 to 34 years | 0 (0.0%) | 0 (0.0%) |
| 35 to 50 years | 0 (0.0%) | 0 (0.0%) |
| Total | 0 (0.0%) | 0 (0.0%) |
Fertility by Education in Burleigh
| Educational Attainment | Women with Births | Births / 1,000 Women |
| Less than High School | 0 (0.0%) | 0.0 |
| High School Diploma | 0 (0.0%) | 0.0 |
| College or Associate's Degree | 0 (0.0%) | 0.0 |
| Bachelor's Degree | 0 (0.0%) | 0.0 |
| Graduate Degree | 0 (0.0%) | 0.0 |
| Total | 0 (0.0%) | 0.0 |
Fertility by Education by Marriage Status in Burleigh
| Educational Attainment | Married | Unmarried |
| Less than High School | 0 (0.0%) | 0 (0.0%) |
| High School Diploma | 0 (0.0%) | 0 (0.0%) |
| College or Associate's Degree | 0 (0.0%) | 0 (0.0%) |
| Bachelor's Degree | 0 (0.0%) | 0 (0.0%) |
| Graduate Degree | 0 (0.0%) | 0 (0.0%) |
| Total | 0 (0.0%) | 0 (0.0%) |
Income in Burleigh
Income Overview in Burleigh
Per Capita Income in Burleigh is $54,756, while median incomes of families and households are $121,917 and $111,641 respectively.
| Characteristic | Number | Measure |
| Per Capita Income | 331 | $54,756 |
| Median Family Income | 132 | $121,917 |
| Mean Family Income | 132 | $143,298 |
| Median Household Income | 200 | $111,641 |
| Mean Household Income | 200 | $104,871 |
| Income Deficit | 132 | $0 |
| Wage / Income Gap (%) | 331 | 43.45% |
| Wage / Income Gap ($) | 331 | 56.55¢ per $1 |
| Gini / Inequality Index | 331 | 0.41 |
Earnings by Sex in Burleigh
Average Earnings in Burleigh are $92,381, $160,417 for men and $90,714 for women, a difference of 43.4%.
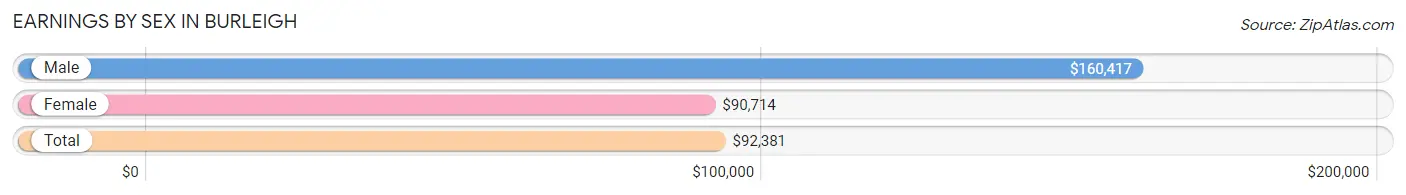
| Sex | Number | Average Earnings |
| Male | 48 (28.6%) | $160,417 |
| Female | 120 (71.4%) | $90,714 |
| Total | 168 (100.0%) | $92,381 |
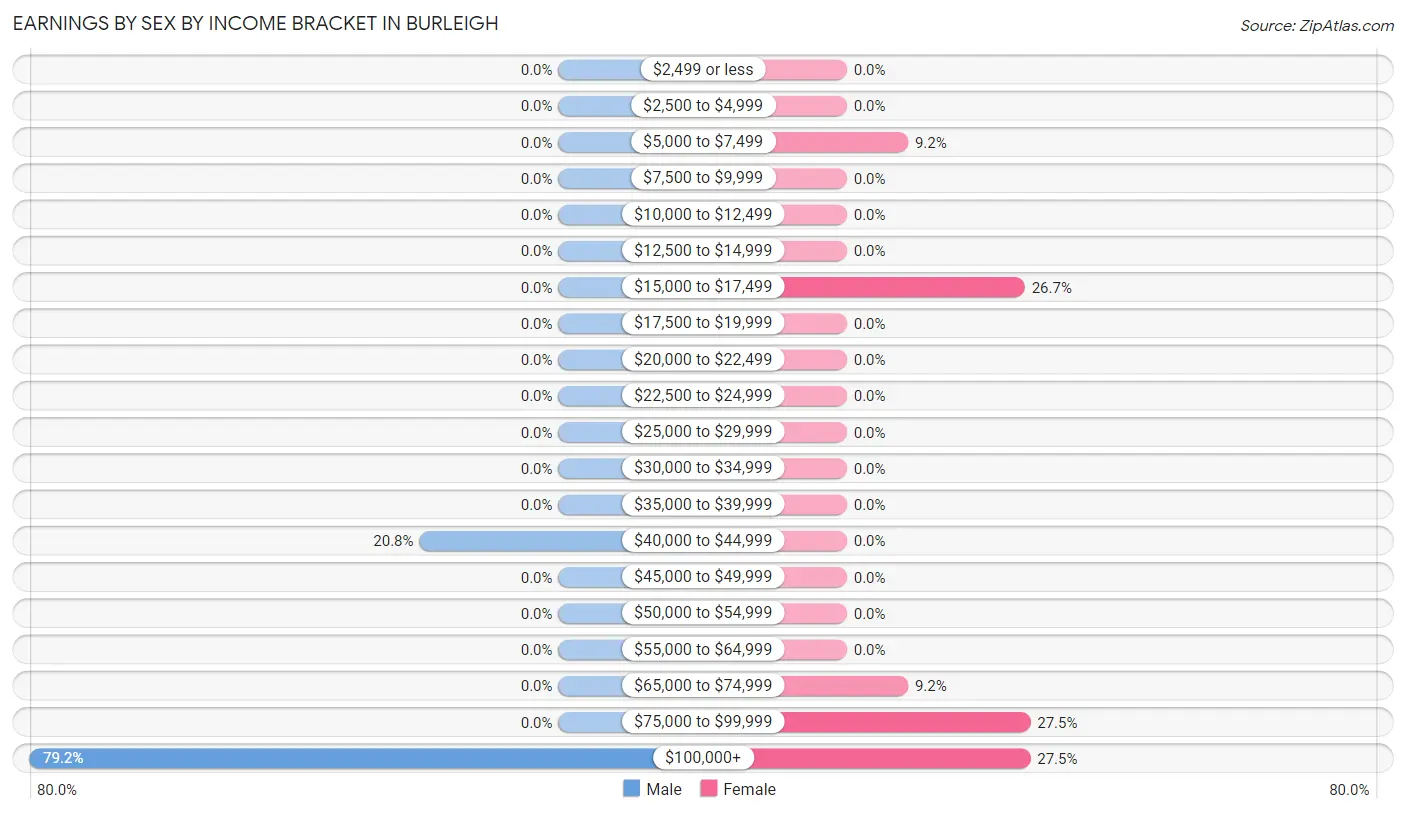
Earnings by Sex by Income Bracket in Burleigh
The most common earnings brackets in Burleigh are $100,000+ for men (38 | 79.2%) and $75,000 to $99,999 for women (33 | 27.5%).
| Income | Male | Female |
| $2,499 or less | 0 (0.0%) | 0 (0.0%) |
| $2,500 to $4,999 | 0 (0.0%) | 0 (0.0%) |
| $5,000 to $7,499 | 0 (0.0%) | 11 (9.2%) |
| $7,500 to $9,999 | 0 (0.0%) | 0 (0.0%) |
| $10,000 to $12,499 | 0 (0.0%) | 0 (0.0%) |
| $12,500 to $14,999 | 0 (0.0%) | 0 (0.0%) |
| $15,000 to $17,499 | 0 (0.0%) | 32 (26.7%) |
| $17,500 to $19,999 | 0 (0.0%) | 0 (0.0%) |
| $20,000 to $22,499 | 0 (0.0%) | 0 (0.0%) |
| $22,500 to $24,999 | 0 (0.0%) | 0 (0.0%) |
| $25,000 to $29,999 | 0 (0.0%) | 0 (0.0%) |
| $30,000 to $34,999 | 0 (0.0%) | 0 (0.0%) |
| $35,000 to $39,999 | 0 (0.0%) | 0 (0.0%) |
| $40,000 to $44,999 | 10 (20.8%) | 0 (0.0%) |
| $45,000 to $49,999 | 0 (0.0%) | 0 (0.0%) |
| $50,000 to $54,999 | 0 (0.0%) | 0 (0.0%) |
| $55,000 to $64,999 | 0 (0.0%) | 0 (0.0%) |
| $65,000 to $74,999 | 0 (0.0%) | 11 (9.2%) |
| $75,000 to $99,999 | 0 (0.0%) | 33 (27.5%) |
| $100,000+ | 38 (79.2%) | 33 (27.5%) |
| Total | 48 (100.0%) | 120 (100.0%) |
Earnings by Sex by Educational Attainment in Burleigh
| Educational Attainment | Male Income | Female Income |
| Less than High School | - | - |
| High School Diploma | - | - |
| College or Associate's Degree | - | - |
| Bachelor's Degree | - | - |
| Graduate Degree | - | - |
| Total | $160,417 | $91,369 |
Family Income in Burleigh
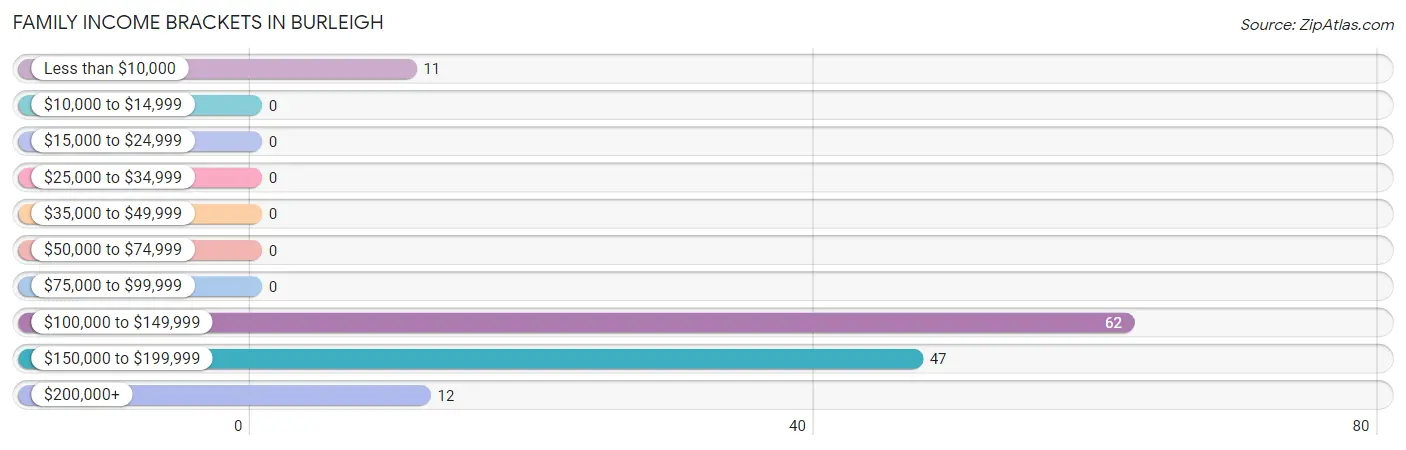
Family Income Brackets in Burleigh
According to the Burleigh family income data, there are 62 families falling into the $100,000 to $149,999 income range, which is the most common income bracket and makes up 47.0% of all families.
| Income Bracket | # Families | % Families |
| Less than $10,000 | 11 | 8.3% |
| $10,000 to $14,999 | 0 | 0.0% |
| $15,000 to $24,999 | 0 | 0.0% |
| $25,000 to $34,999 | 0 | 0.0% |
| $35,000 to $49,999 | 0 | 0.0% |
| $50,000 to $74,999 | 0 | 0.0% |
| $75,000 to $99,999 | 0 | 0.0% |
| $100,000 to $149,999 | 62 | 47.0% |
| $150,000 to $199,999 | 47 | 35.6% |
| $200,000+ | 12 | 9.1% |
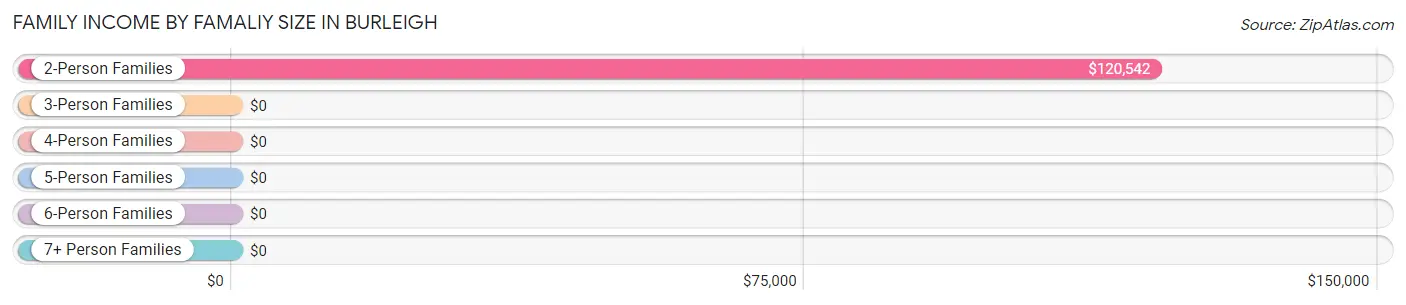
Family Income by Famaliy Size in Burleigh
2-person families (99 | 75.0%) account for the highest median family income in Burleigh with $120,542 per family, while 2-person families (99 | 75.0%) have the highest median income of $60,271 per family member.
| Income Bracket | # Families | Median Income |
| 2-Person Families | 99 (75.0%) | $120,542 |
| 3-Person Families | 21 (15.9%) | $0 |
| 4-Person Families | 12 (9.1%) | $0 |
| 5-Person Families | 0 (0.0%) | $0 |
| 6-Person Families | 0 (0.0%) | $0 |
| 7+ Person Families | 0 (0.0%) | $0 |
| Total | 132 (100.0%) | $121,917 |
Family Income by Number of Earners in Burleigh
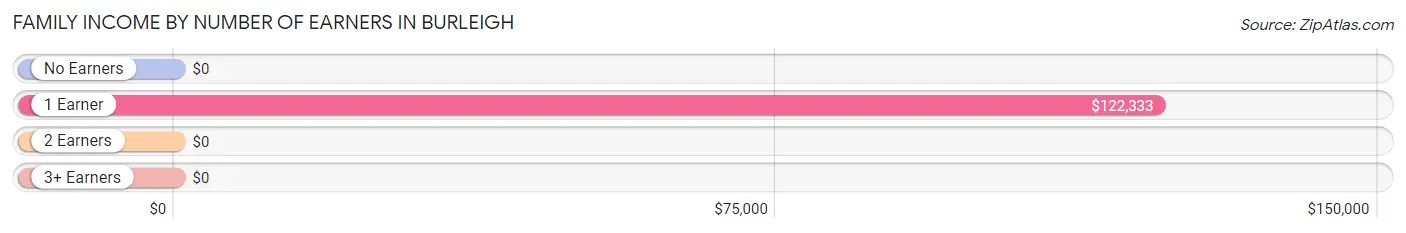
| Number of Earners | # Families | Median Income |
| No Earners | 11 (8.3%) | $0 |
| 1 Earner | 56 (42.4%) | $122,333 |
| 2 Earners | 44 (33.3%) | $0 |
| 3+ Earners | 21 (15.9%) | $0 |
| Total | 132 (100.0%) | $121,917 |
Household Income in Burleigh
Household Income Brackets in Burleigh
With 62 households falling in the category, the $100,000 to $149,999 income range is the most frequent in Burleigh, accounting for 31.0% of all households.
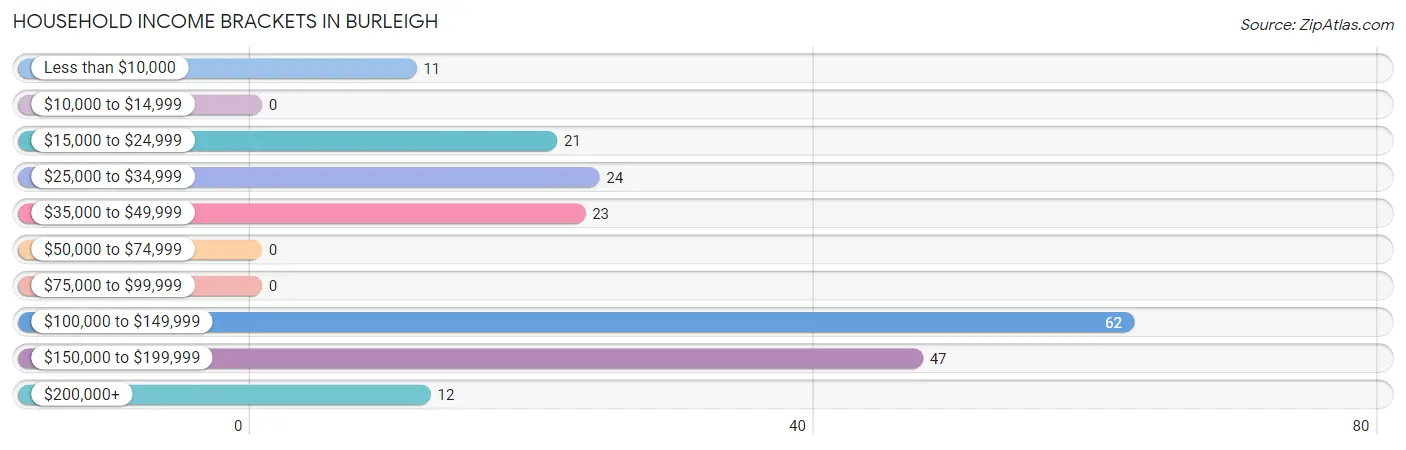
| Income Bracket | # Households | % Households |
| Less than $10,000 | 11 | 5.5% |
| $10,000 to $14,999 | 0 | 0.0% |
| $15,000 to $24,999 | 21 | 10.5% |
| $25,000 to $34,999 | 24 | 12.0% |
| $35,000 to $49,999 | 23 | 11.5% |
| $50,000 to $74,999 | 0 | 0.0% |
| $75,000 to $99,999 | 0 | 0.0% |
| $100,000 to $149,999 | 62 | 31.0% |
| $150,000 to $199,999 | 47 | 23.5% |
| $200,000+ | 12 | 6.0% |
Household Income by Householder Age in Burleigh
The median household income in Burleigh is $111,641, with the highest median household income of $165,714 found in the 45 to 64 years age bracket for the primary householder. A total of 82 households (41.0%) fall into this category.
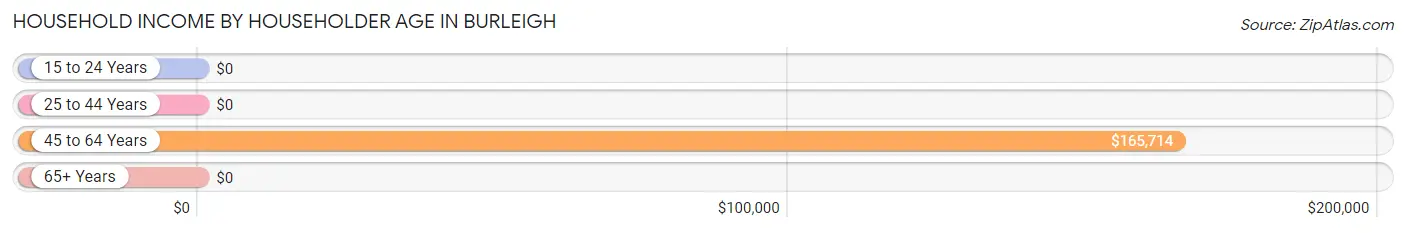
| Income Bracket | # Households | Median Income |
| 15 to 24 Years | 0 (0.0%) | $0 |
| 25 to 44 Years | 0 (0.0%) | $0 |
| 45 to 64 Years | 82 (41.0%) | $165,714 |
| 65+ Years | 118 (59.0%) | $0 |
| Total | 200 (100.0%) | $111,641 |
Poverty in Burleigh
Income Below Poverty by Sex and Age in Burleigh
With 10.0% poverty level for males and 14.5% for females among the residents of Burleigh, 75 year old and over males and 75 year old and over females are the most vulnerable to poverty, with 11 males (100.0%) and 9 females (27.3%) in their respective age groups living below the poverty level.
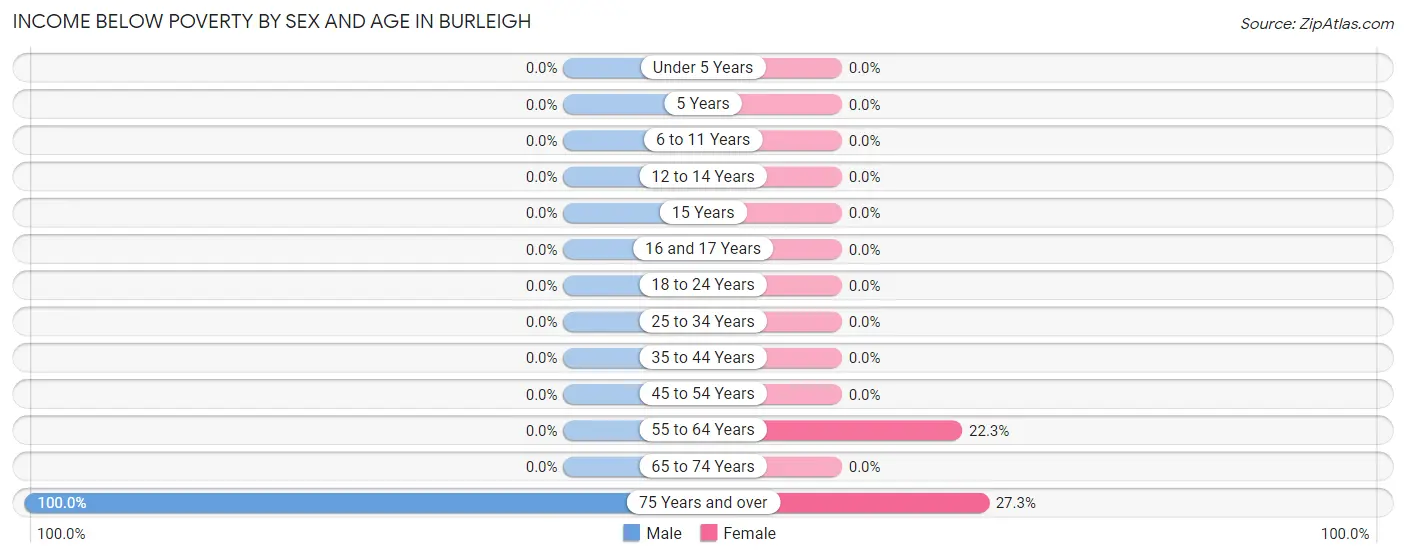
| Age Bracket | Male | Female |
| Under 5 Years | 0 (0.0%) | 0 (0.0%) |
| 5 Years | 0 (0.0%) | 0 (0.0%) |
| 6 to 11 Years | 0 (0.0%) | 0 (0.0%) |
| 12 to 14 Years | 0 (0.0%) | 0 (0.0%) |
| 15 Years | 0 (0.0%) | 0 (0.0%) |
| 16 and 17 Years | 0 (0.0%) | 0 (0.0%) |
| 18 to 24 Years | 0 (0.0%) | 0 (0.0%) |
| 25 to 34 Years | 0 (0.0%) | 0 (0.0%) |
| 35 to 44 Years | 0 (0.0%) | 0 (0.0%) |
| 45 to 54 Years | 0 (0.0%) | 0 (0.0%) |
| 55 to 64 Years | 0 (0.0%) | 23 (22.3%) |
| 65 to 74 Years | 0 (0.0%) | 0 (0.0%) |
| 75 Years and over | 11 (100.0%) | 9 (27.3%) |
| Total | 11 (10.0%) | 32 (14.5%) |
Income Above Poverty by Sex and Age in Burleigh
According to the poverty statistics in Burleigh, males aged 45 to 54 years and females aged 15 years are the age groups that are most secure financially, with 100.0% of males and 100.0% of females in these age groups living above the poverty line.
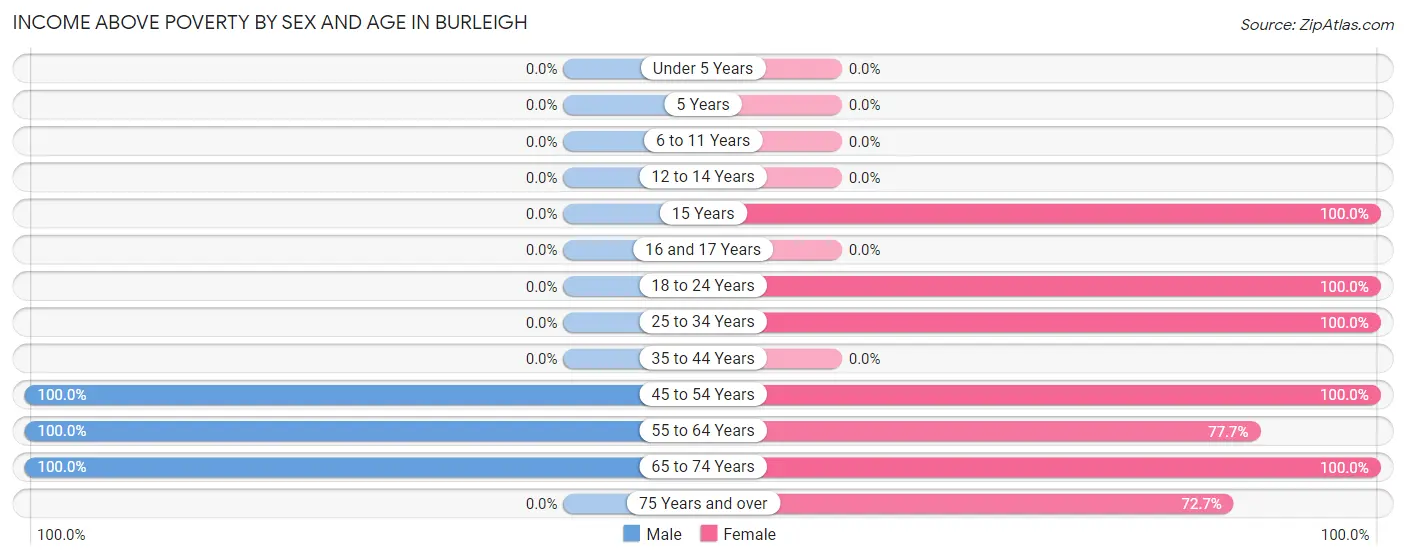
| Age Bracket | Male | Female |
| Under 5 Years | 0 (0.0%) | 0 (0.0%) |
| 5 Years | 0 (0.0%) | 0 (0.0%) |
| 6 to 11 Years | 0 (0.0%) | 0 (0.0%) |
| 12 to 14 Years | 0 (0.0%) | 0 (0.0%) |
| 15 Years | 0 (0.0%) | 15 (100.0%) |
| 16 and 17 Years | 0 (0.0%) | 0 (0.0%) |
| 18 to 24 Years | 0 (0.0%) | 11 (100.0%) |
| 25 to 34 Years | 0 (0.0%) | 11 (100.0%) |
| 35 to 44 Years | 0 (0.0%) | 0 (0.0%) |
| 45 to 54 Years | 12 (100.0%) | 8 (100.0%) |
| 55 to 64 Years | 36 (100.0%) | 80 (77.7%) |
| 65 to 74 Years | 51 (100.0%) | 40 (100.0%) |
| 75 Years and over | 0 (0.0%) | 24 (72.7%) |
| Total | 99 (90.0%) | 189 (85.5%) |
Income Below Poverty Among Married-Couple Families in Burleigh
The poverty statistics for married-couple families in Burleigh show that 11.0% or 11 of the total 100 families live below the poverty line. Families with no children have the highest poverty rate of 12.5%, comprising of 11 families. On the other hand, families with 1 or 2 children have the lowest poverty rate of 0.0%, which includes 0 families.
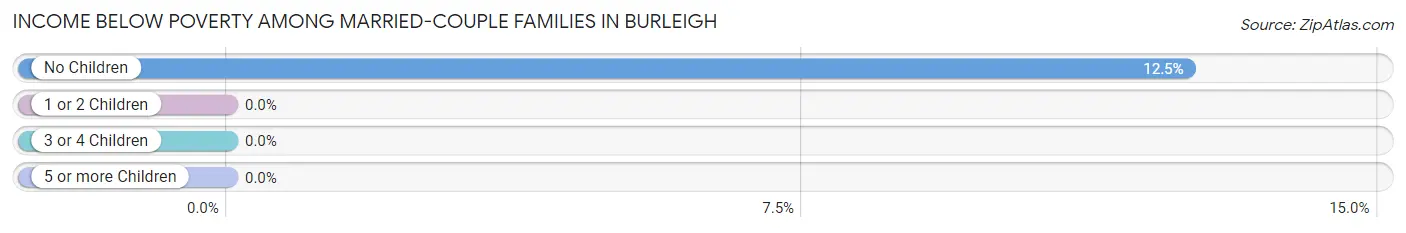
| Children | Above Poverty | Below Poverty |
| No Children | 77 (87.5%) | 11 (12.5%) |
| 1 or 2 Children | 12 (100.0%) | 0 (0.0%) |
| 3 or 4 Children | 0 (0.0%) | 0 (0.0%) |
| 5 or more Children | 0 (0.0%) | 0 (0.0%) |
| Total | 89 (89.0%) | 11 (11.0%) |
Income Below Poverty Among Single-Parent Households in Burleigh
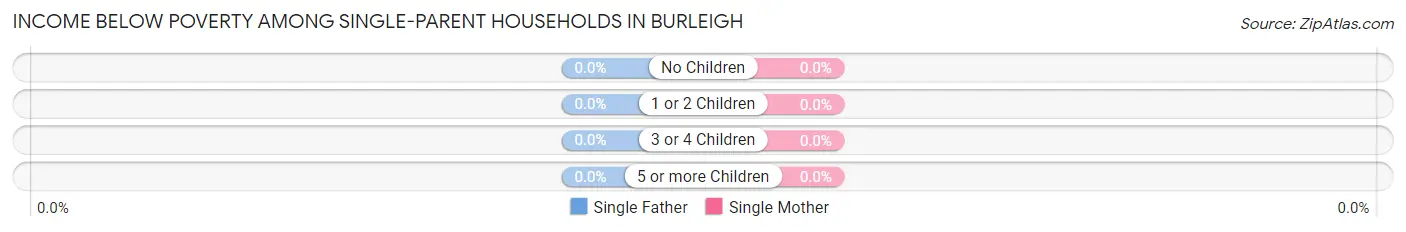
| Children | Single Father | Single Mother |
| No Children | 0 (0.0%) | 0 (0.0%) |
| 1 or 2 Children | 0 (0.0%) | 0 (0.0%) |
| 3 or 4 Children | 0 (0.0%) | 0 (0.0%) |
| 5 or more Children | 0 (0.0%) | 0 (0.0%) |
| Total | 0 (0.0%) | 0 (0.0%) |
Income Below Poverty Among Married-Couple vs Single-Parent Households in Burleigh
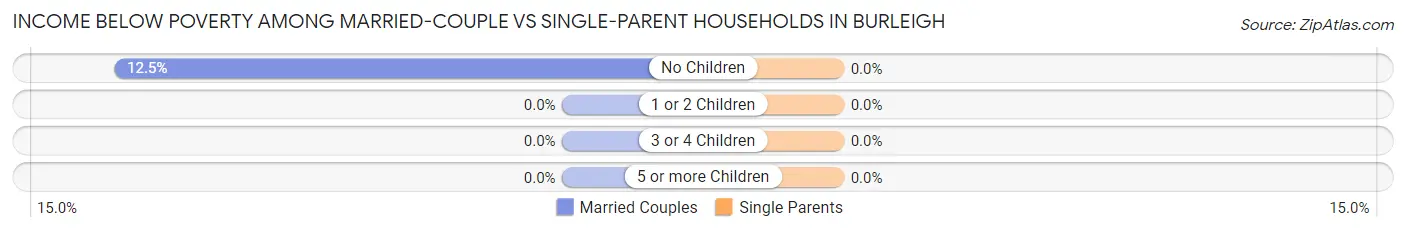
| Children | Married-Couple Families | Single-Parent Households |
| No Children | 11 (12.5%) | 0 (0.0%) |
| 1 or 2 Children | 0 (0.0%) | 0 (0.0%) |
| 3 or 4 Children | 0 (0.0%) | 0 (0.0%) |
| 5 or more Children | 0 (0.0%) | 0 (0.0%) |
| Total | 11 (11.0%) | 0 (0.0%) |
Employment Characteristics in Burleigh
Employment by Class of Employer in Burleigh
Among the 145 employed individuals in Burleigh, private company employees (112 | 77.2%), local government employees (21 | 14.5%), and not-for-profit organizations (12 | 8.3%) make up the most common classes of employment.
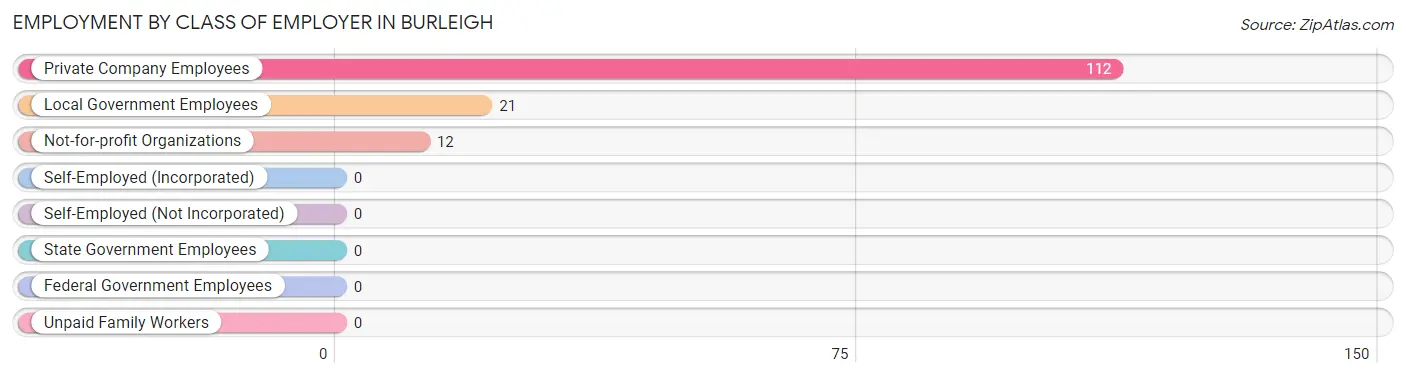
| Employer Class | # Employees | % Employees |
| Private Company Employees | 112 | 77.2% |
| Self-Employed (Incorporated) | 0 | 0.0% |
| Self-Employed (Not Incorporated) | 0 | 0.0% |
| Not-for-profit Organizations | 12 | 8.3% |
| Local Government Employees | 21 | 14.5% |
| State Government Employees | 0 | 0.0% |
| Federal Government Employees | 0 | 0.0% |
| Unpaid Family Workers | 0 | 0.0% |
| Total | 145 | 100.0% |
Employment Status by Age in Burleigh
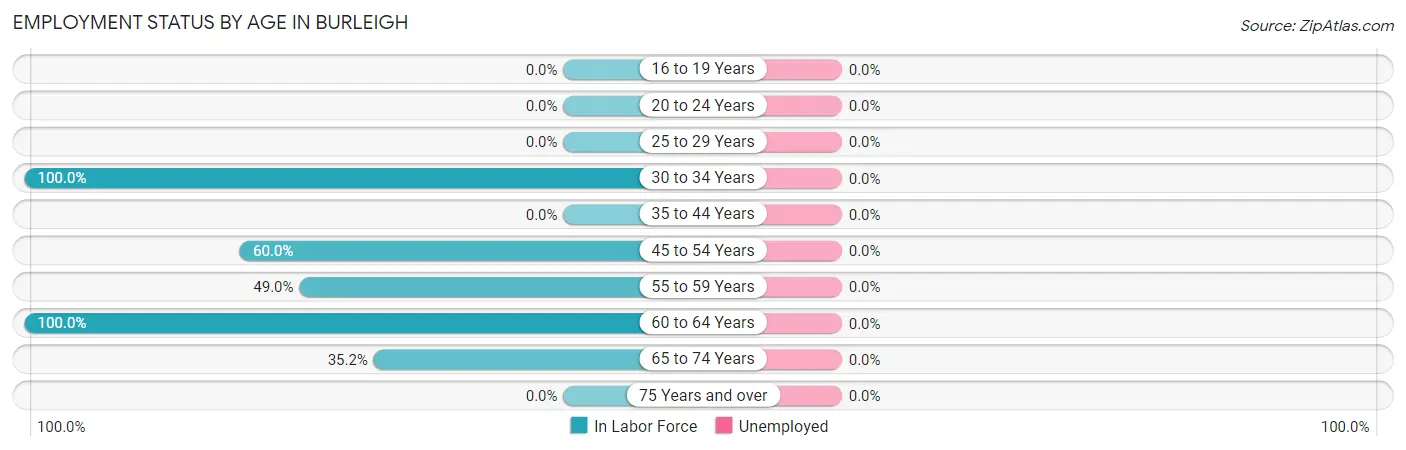
| Age Bracket | In Labor Force | Unemployed |
| 16 to 19 Years | 0 (0.0%) | 0 (0.0%) |
| 20 to 24 Years | 0 (0.0%) | 0 (0.0%) |
| 25 to 29 Years | 0 (0.0%) | 0 (0.0%) |
| 30 to 34 Years | 11 (100.0%) | 0 (0.0%) |
| 35 to 44 Years | 0 (0.0%) | 0 (0.0%) |
| 45 to 54 Years | 12 (60.0%) | 0 (0.0%) |
| 55 to 59 Years | 47 (49.0%) | 0 (0.0%) |
| 60 to 64 Years | 43 (100.0%) | 0 (0.0%) |
| 65 to 74 Years | 32 (35.2%) | 0 (0.0%) |
| 75 Years and over | 0 (0.0%) | 0 (0.0%) |
| Total | 145 (45.9%) | 0 (0.0%) |
Employment Status by Educational Attainment in Burleigh
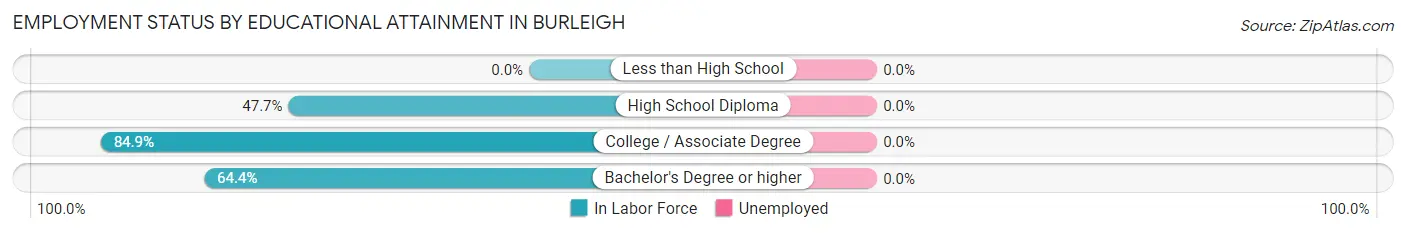
| Educational Attainment | In Labor Force | Unemployed |
| Less than High School | 0 (0.0%) | 0 (0.0%) |
| High School Diploma | 21 (47.7%) | 0 (0.0%) |
| College / Associate Degree | 45 (84.9%) | 0 (0.0%) |
| Bachelor's Degree or higher | 47 (64.4%) | 0 (0.0%) |
| Total | 113 (66.5%) | 0 (0.0%) |
Employment Occupations by Sex in Burleigh
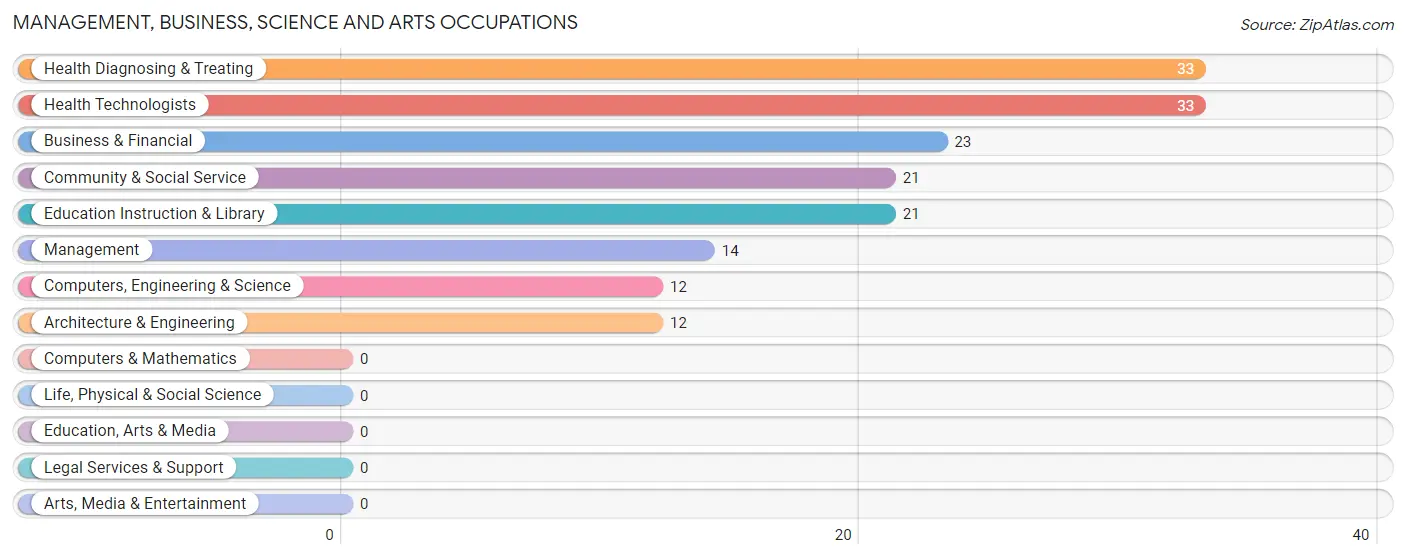
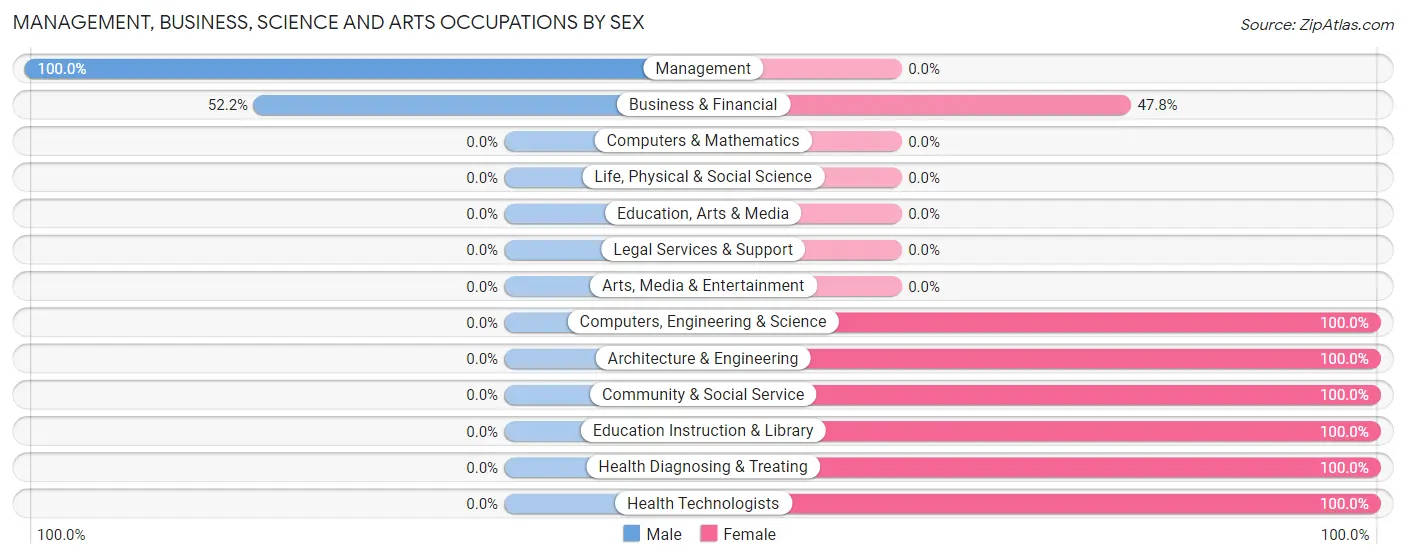
Management, Business, Science and Arts Occupations
The most common Management, Business, Science and Arts occupations in Burleigh are Health Diagnosing & Treating (33 | 22.8%), Health Technologists (33 | 22.8%), Business & Financial (23 | 15.9%), Community & Social Service (21 | 14.5%), and Education Instruction & Library (21 | 14.5%).
Management, Business, Science and Arts Occupations by Sex
Within the Management, Business, Science and Arts occupations in Burleigh, the most male-oriented occupations are Management (100.0%), and Business & Financial (52.2%), while the most female-oriented occupations are Computers, Engineering & Science (100.0%), Architecture & Engineering (100.0%), and Community & Social Service (100.0%).
| Occupation | Male | Female |
| Management | 14 (100.0%) | 0 (0.0%) |
| Business & Financial | 12 (52.2%) | 11 (47.8%) |
| Computers, Engineering & Science | 0 (0.0%) | 12 (100.0%) |
| Computers & Mathematics | 0 (0.0%) | 0 (0.0%) |
| Architecture & Engineering | 0 (0.0%) | 12 (100.0%) |
| Life, Physical & Social Science | 0 (0.0%) | 0 (0.0%) |
| Community & Social Service | 0 (0.0%) | 21 (100.0%) |
| Education, Arts & Media | 0 (0.0%) | 0 (0.0%) |
| Legal Services & Support | 0 (0.0%) | 0 (0.0%) |
| Education Instruction & Library | 0 (0.0%) | 21 (100.0%) |
| Arts, Media & Entertainment | 0 (0.0%) | 0 (0.0%) |
| Health Diagnosing & Treating | 0 (0.0%) | 33 (100.0%) |
| Health Technologists | 0 (0.0%) | 33 (100.0%) |
| Total (Category) | 26 (25.2%) | 77 (74.8%) |
| Total (Overall) | 36 (24.8%) | 109 (75.2%) |
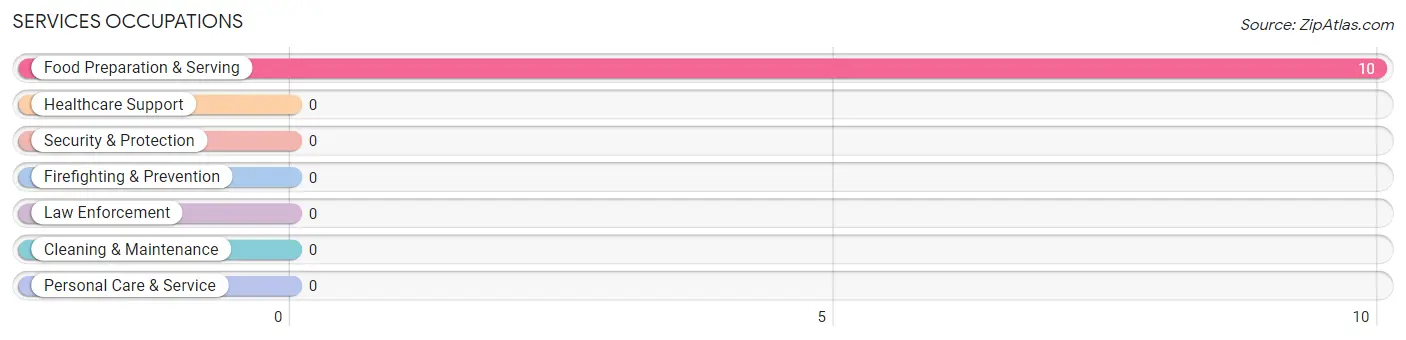
Services Occupations
The most common Services occupations in Burleigh are , and Food Preparation & Serving (10 | 6.9%).
Services Occupations by Sex
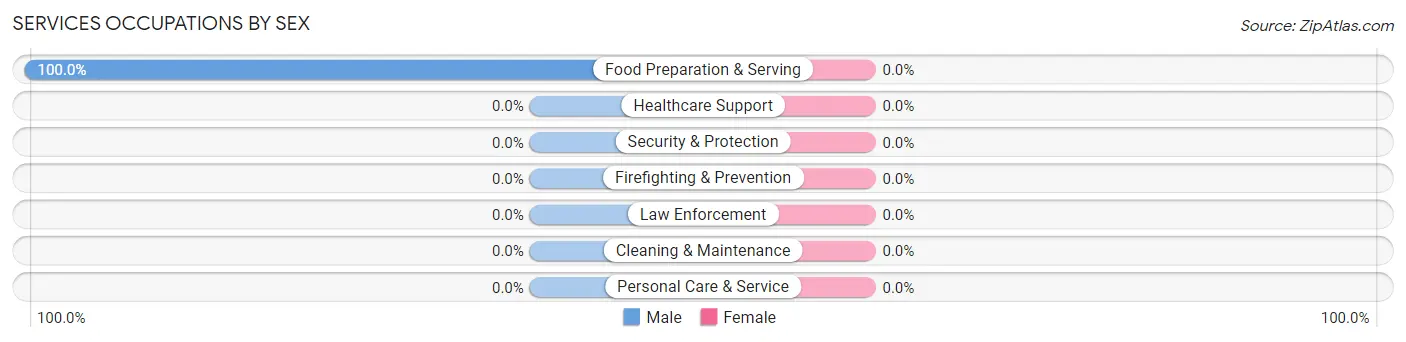
| Occupation | Male | Female |
| Healthcare Support | 0 (0.0%) | 0 (0.0%) |
| Security & Protection | 0 (0.0%) | 0 (0.0%) |
| Firefighting & Prevention | 0 (0.0%) | 0 (0.0%) |
| Law Enforcement | 0 (0.0%) | 0 (0.0%) |
| Food Preparation & Serving | 10 (100.0%) | 0 (0.0%) |
| Cleaning & Maintenance | 0 (0.0%) | 0 (0.0%) |
| Personal Care & Service | 0 (0.0%) | 0 (0.0%) |
| Total (Category) | 10 (100.0%) | 0 (0.0%) |
| Total (Overall) | 36 (24.8%) | 109 (75.2%) |
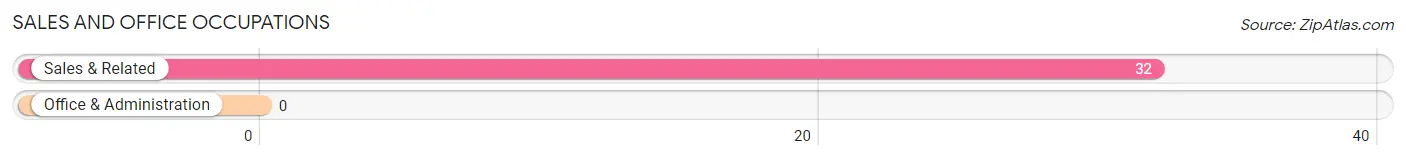
Sales and Office Occupations
The most common Sales and Office occupations in Burleigh are , and Sales & Related (32 | 22.1%).
Sales and Office Occupations by Sex
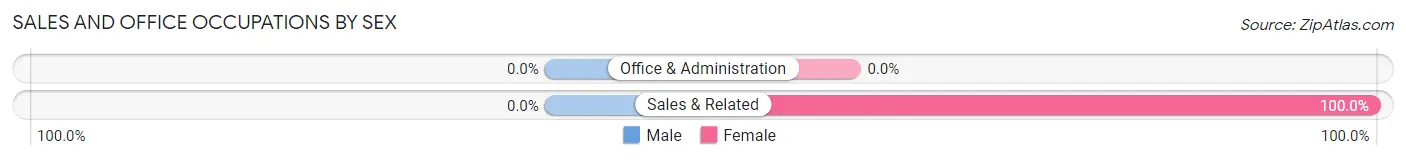
| Occupation | Male | Female |
| Sales & Related | 0 (0.0%) | 32 (100.0%) |
| Office & Administration | 0 (0.0%) | 0 (0.0%) |
| Total (Category) | 0 (0.0%) | 32 (100.0%) |
| Total (Overall) | 36 (24.8%) | 109 (75.2%) |
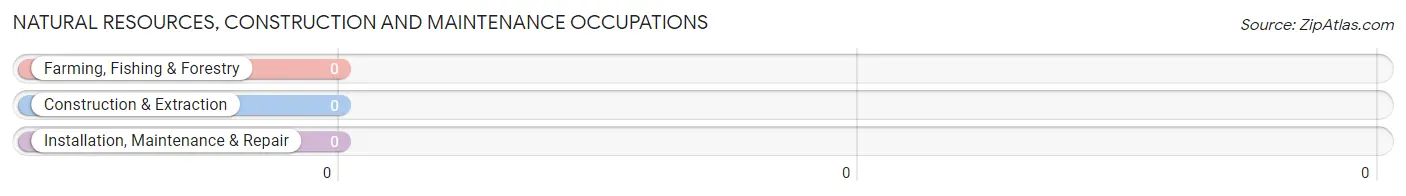
Natural Resources, Construction and Maintenance Occupations
Natural Resources, Construction and Maintenance Occupations by Sex
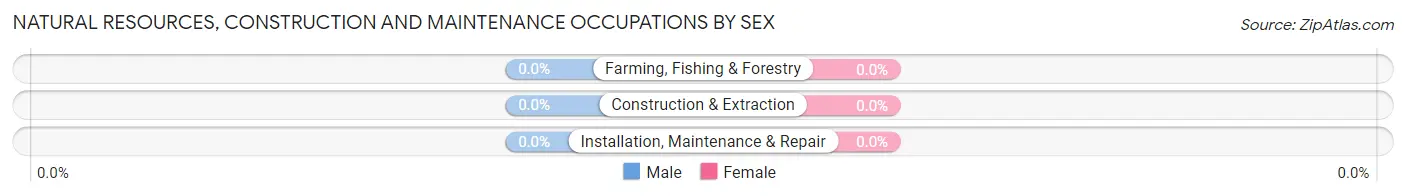
| Occupation | Male | Female |
| Farming, Fishing & Forestry | 0 (0.0%) | 0 (0.0%) |
| Construction & Extraction | 0 (0.0%) | 0 (0.0%) |
| Installation, Maintenance & Repair | 0 (0.0%) | 0 (0.0%) |
| Total (Category) | 0 (0.0%) | 0 (0.0%) |
| Total (Overall) | 36 (24.8%) | 109 (75.2%) |
Production, Transportation and Moving Occupations
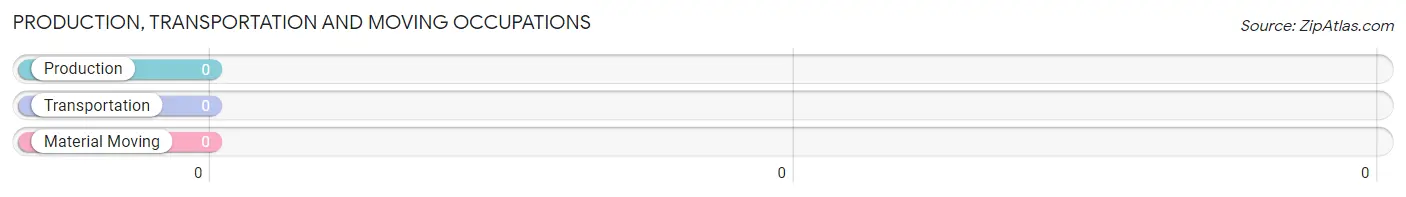
Production, Transportation and Moving Occupations by Sex
| Occupation | Male | Female |
| Production | 0 (0.0%) | 0 (0.0%) |
| Transportation | 0 (0.0%) | 0 (0.0%) |
| Material Moving | 0 (0.0%) | 0 (0.0%) |
| Total (Category) | 0 (0.0%) | 0 (0.0%) |
| Total (Overall) | 36 (24.8%) | 109 (75.2%) |
Employment Industries by Sex in Burleigh
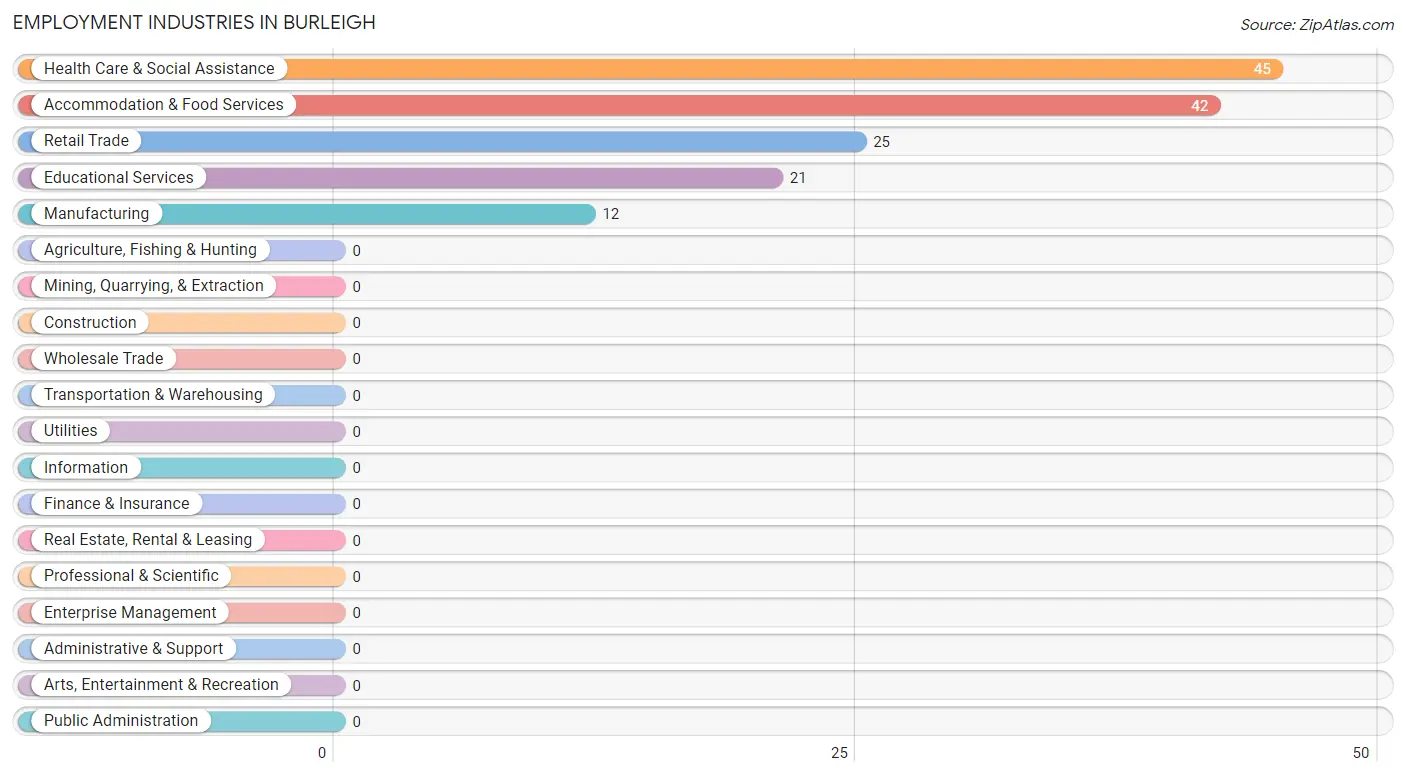
Employment Industries in Burleigh
The major employment industries in Burleigh include Health Care & Social Assistance (45 | 31.0%), Accommodation & Food Services (42 | 29.0%), Retail Trade (25 | 17.2%), Educational Services (21 | 14.5%), and Manufacturing (12 | 8.3%).
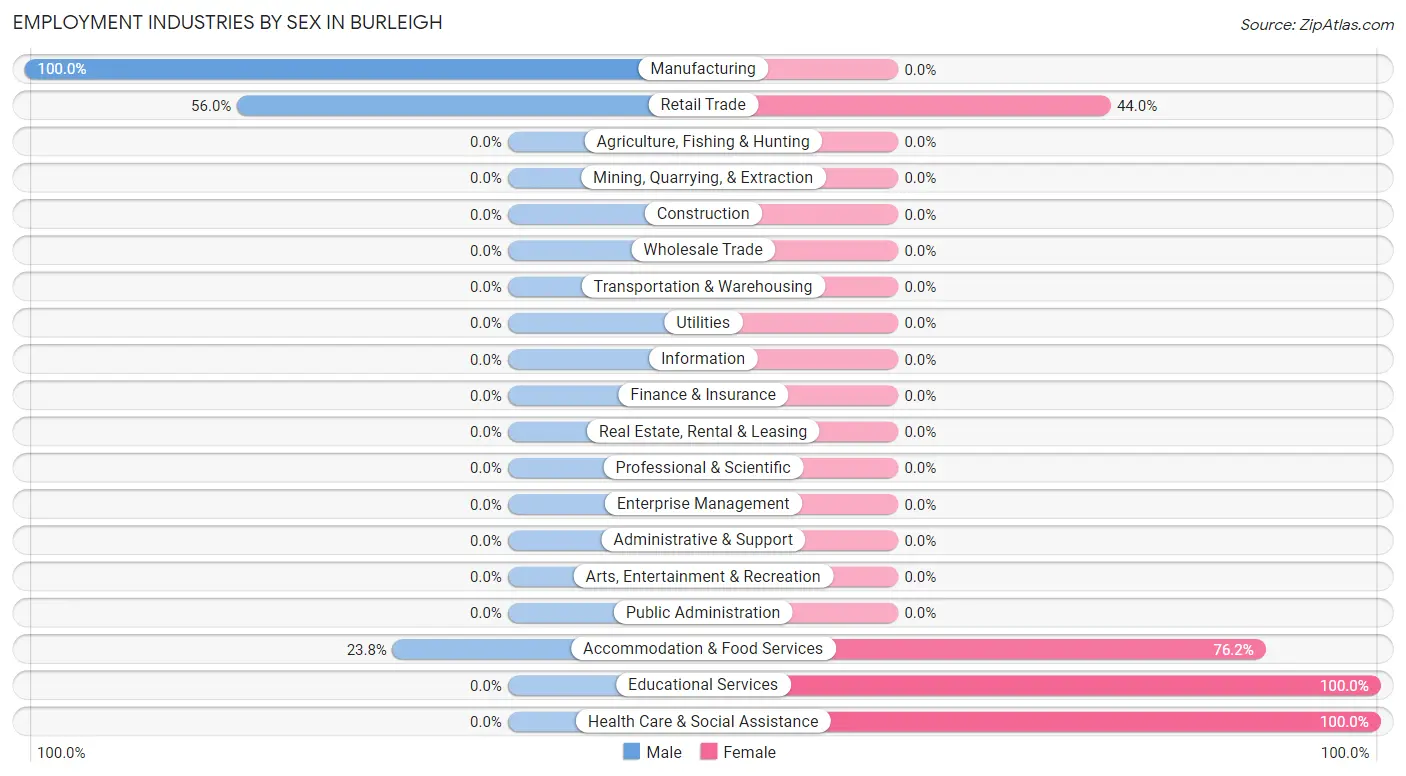
Employment Industries by Sex in Burleigh
The Burleigh industries that see more men than women are Manufacturing (100.0%), Retail Trade (56.0%), and Accommodation & Food Services (23.8%), whereas the industries that tend to have a higher number of women are Educational Services (100.0%), Health Care & Social Assistance (100.0%), and Accommodation & Food Services (76.2%).
| Industry | Male | Female |
| Agriculture, Fishing & Hunting | 0 (0.0%) | 0 (0.0%) |
| Mining, Quarrying, & Extraction | 0 (0.0%) | 0 (0.0%) |
| Construction | 0 (0.0%) | 0 (0.0%) |
| Manufacturing | 12 (100.0%) | 0 (0.0%) |
| Wholesale Trade | 0 (0.0%) | 0 (0.0%) |
| Retail Trade | 14 (56.0%) | 11 (44.0%) |
| Transportation & Warehousing | 0 (0.0%) | 0 (0.0%) |
| Utilities | 0 (0.0%) | 0 (0.0%) |
| Information | 0 (0.0%) | 0 (0.0%) |
| Finance & Insurance | 0 (0.0%) | 0 (0.0%) |
| Real Estate, Rental & Leasing | 0 (0.0%) | 0 (0.0%) |
| Professional & Scientific | 0 (0.0%) | 0 (0.0%) |
| Enterprise Management | 0 (0.0%) | 0 (0.0%) |
| Administrative & Support | 0 (0.0%) | 0 (0.0%) |
| Educational Services | 0 (0.0%) | 21 (100.0%) |
| Health Care & Social Assistance | 0 (0.0%) | 45 (100.0%) |
| Arts, Entertainment & Recreation | 0 (0.0%) | 0 (0.0%) |
| Accommodation & Food Services | 10 (23.8%) | 32 (76.2%) |
| Public Administration | 0 (0.0%) | 0 (0.0%) |
| Total | 36 (24.8%) | 109 (75.2%) |
Education in Burleigh
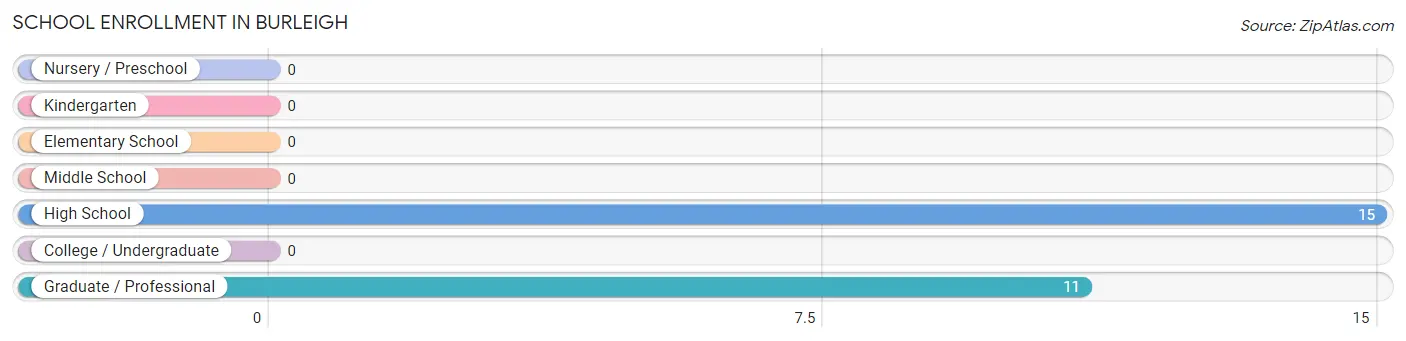
School Enrollment in Burleigh
The most common levels of schooling among the 26 students in Burleigh are high school (15 | 57.7%), and graduate / professional (11 | 42.3%).
| School Level | # Students | % Students |
| Nursery / Preschool | 0 | 0.0% |
| Kindergarten | 0 | 0.0% |
| Elementary School | 0 | 0.0% |
| Middle School | 0 | 0.0% |
| High School | 15 | 57.7% |
| College / Undergraduate | 0 | 0.0% |
| Graduate / Professional | 11 | 42.3% |
| Total | 26 | 100.0% |
School Enrollment by Age by Funding Source in Burleigh
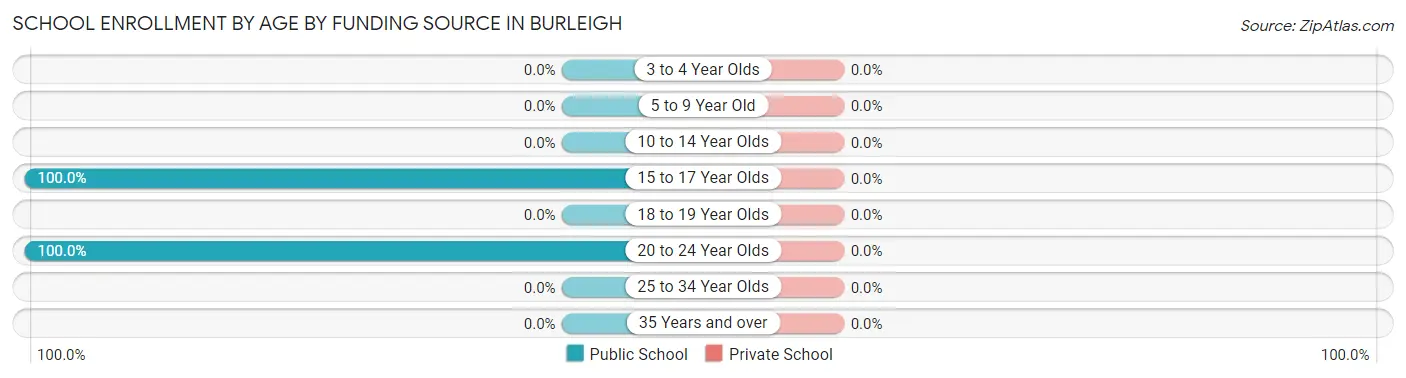
| Age Bracket | Public School | Private School |
| 3 to 4 Year Olds | 0 (0.0%) | 0 (0.0%) |
| 5 to 9 Year Old | 0 (0.0%) | 0 (0.0%) |
| 10 to 14 Year Olds | 0 (0.0%) | 0 (0.0%) |
| 15 to 17 Year Olds | 15 (100.0%) | 0 (0.0%) |
| 18 to 19 Year Olds | 0 (0.0%) | 0 (0.0%) |
| 20 to 24 Year Olds | 11 (100.0%) | 0 (0.0%) |
| 25 to 34 Year Olds | 0 (0.0%) | 0 (0.0%) |
| 35 Years and over | 0 (0.0%) | 0 (0.0%) |
| Total | 26 (100.0%) | 0 (0.0%) |
Educational Attainment by Field of Study in Burleigh
Education (21 | 28.8%), physical & health sciences (14 | 19.2%), business (14 | 19.2%), psychology (12 | 16.4%), and social sciences (12 | 16.4%) are the most common fields of study among 73 individuals in Burleigh who have obtained a bachelor's degree or higher.
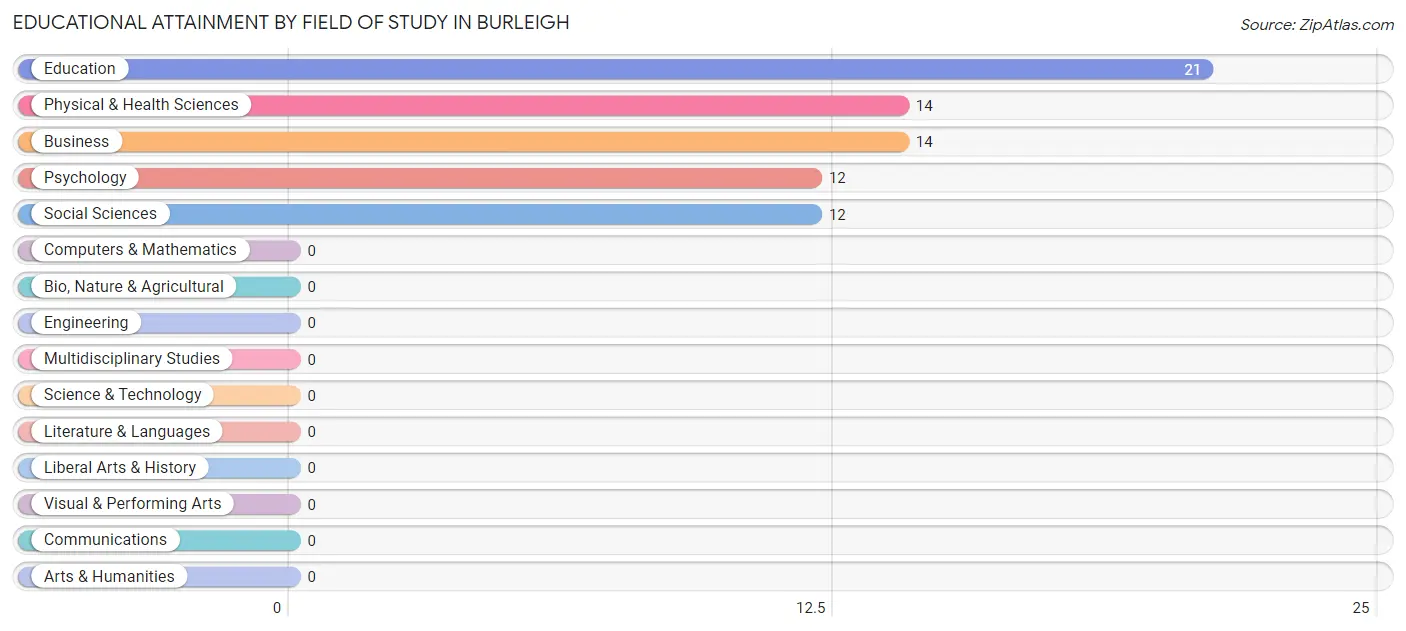
| Field of Study | # Graduates | % Graduates |
| Computers & Mathematics | 0 | 0.0% |
| Bio, Nature & Agricultural | 0 | 0.0% |
| Physical & Health Sciences | 14 | 19.2% |
| Psychology | 12 | 16.4% |
| Social Sciences | 12 | 16.4% |
| Engineering | 0 | 0.0% |
| Multidisciplinary Studies | 0 | 0.0% |
| Science & Technology | 0 | 0.0% |
| Business | 14 | 19.2% |
| Education | 21 | 28.8% |
| Literature & Languages | 0 | 0.0% |
| Liberal Arts & History | 0 | 0.0% |
| Visual & Performing Arts | 0 | 0.0% |
| Communications | 0 | 0.0% |
| Arts & Humanities | 0 | 0.0% |
| Total | 73 | 100.0% |
Transportation & Commute in Burleigh
Vehicle Availability by Sex in Burleigh
The most prevalent vehicle ownership categories in Burleigh are males with 2 vehicles (26, accounting for 72.2%) and females with 2 vehicles (88, making up 23.8%).
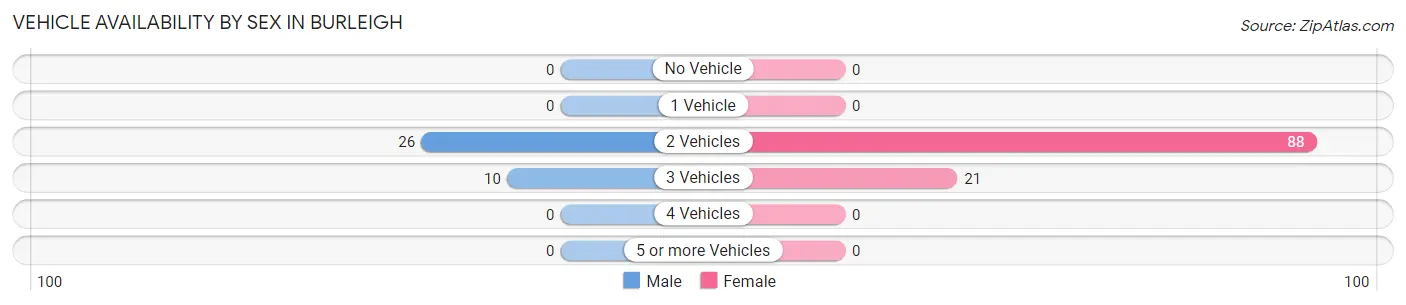
| Vehicles Available | Male | Female |
| No Vehicle | 0 (0.0%) | 0 (0.0%) |
| 1 Vehicle | 0 (0.0%) | 0 (0.0%) |
| 2 Vehicles | 26 (72.2%) | 88 (80.7%) |
| 3 Vehicles | 10 (27.8%) | 21 (19.3%) |
| 4 Vehicles | 0 (0.0%) | 0 (0.0%) |
| 5 or more Vehicles | 0 (0.0%) | 0 (0.0%) |
| Total | 36 (100.0%) | 109 (100.0%) |
Commute Time in Burleigh
The most frequently occuring commute durations in Burleigh are 5 to 9 minutes (76 commuters, 52.4%), 15 to 19 minutes (21 commuters, 14.5%), and 90 or more minutes (14 commuters, 9.7%).
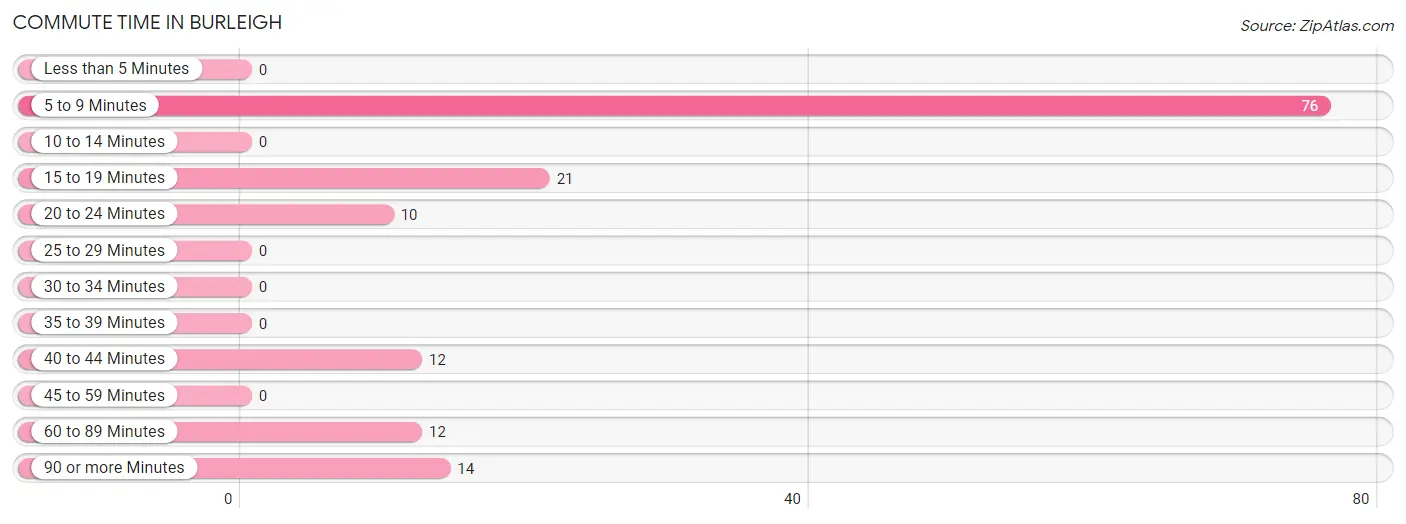
| Commute Time | # Commuters | % Commuters |
| Less than 5 Minutes | 0 | 0.0% |
| 5 to 9 Minutes | 76 | 52.4% |
| 10 to 14 Minutes | 0 | 0.0% |
| 15 to 19 Minutes | 21 | 14.5% |
| 20 to 24 Minutes | 10 | 6.9% |
| 25 to 29 Minutes | 0 | 0.0% |
| 30 to 34 Minutes | 0 | 0.0% |
| 35 to 39 Minutes | 0 | 0.0% |
| 40 to 44 Minutes | 12 | 8.3% |
| 45 to 59 Minutes | 0 | 0.0% |
| 60 to 89 Minutes | 12 | 8.3% |
| 90 or more Minutes | 14 | 9.7% |
Commute Time by Sex in Burleigh
The most common commute times in Burleigh are 90 or more minutes (14 commuters, 38.9%) for males and 5 to 9 minutes (76 commuters, 69.7%) for females.
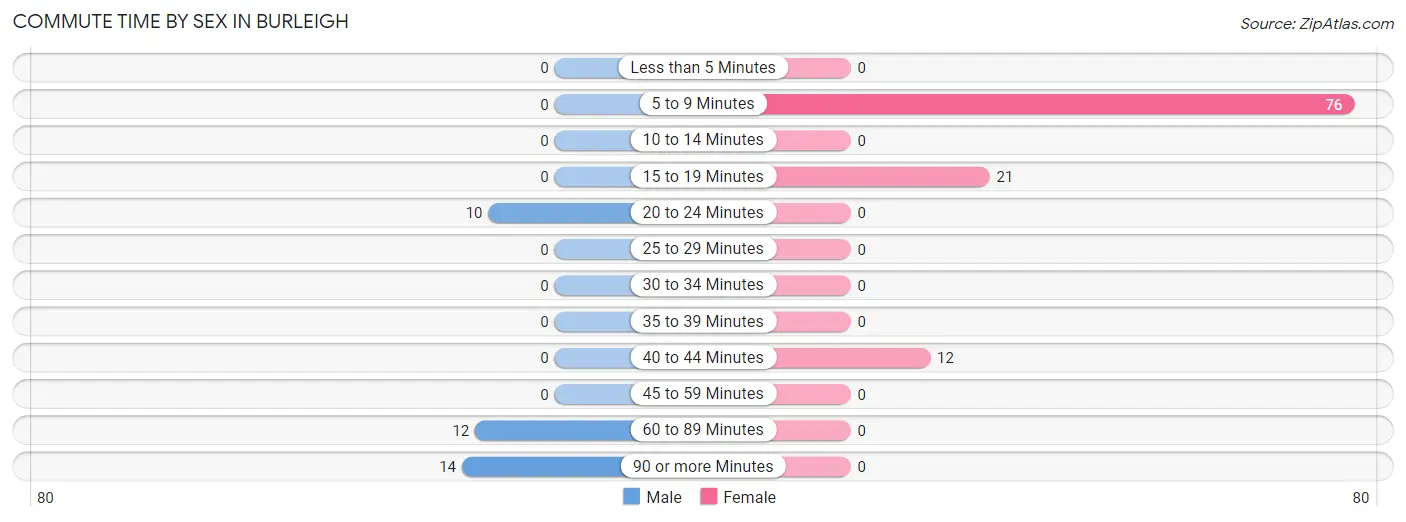
| Commute Time | Male | Female |
| Less than 5 Minutes | 0 (0.0%) | 0 (0.0%) |
| 5 to 9 Minutes | 0 (0.0%) | 76 (69.7%) |
| 10 to 14 Minutes | 0 (0.0%) | 0 (0.0%) |
| 15 to 19 Minutes | 0 (0.0%) | 21 (19.3%) |
| 20 to 24 Minutes | 10 (27.8%) | 0 (0.0%) |
| 25 to 29 Minutes | 0 (0.0%) | 0 (0.0%) |
| 30 to 34 Minutes | 0 (0.0%) | 0 (0.0%) |
| 35 to 39 Minutes | 0 (0.0%) | 0 (0.0%) |
| 40 to 44 Minutes | 0 (0.0%) | 12 (11.0%) |
| 45 to 59 Minutes | 0 (0.0%) | 0 (0.0%) |
| 60 to 89 Minutes | 12 (33.3%) | 0 (0.0%) |
| 90 or more Minutes | 14 (38.9%) | 0 (0.0%) |
Time of Departure to Work by Sex in Burleigh
The most frequent times of departure to work in Burleigh are 8:00 AM to 8:29 AM (14, 38.9%) for males and 6:30 AM to 6:59 AM (54, 49.5%) for females.
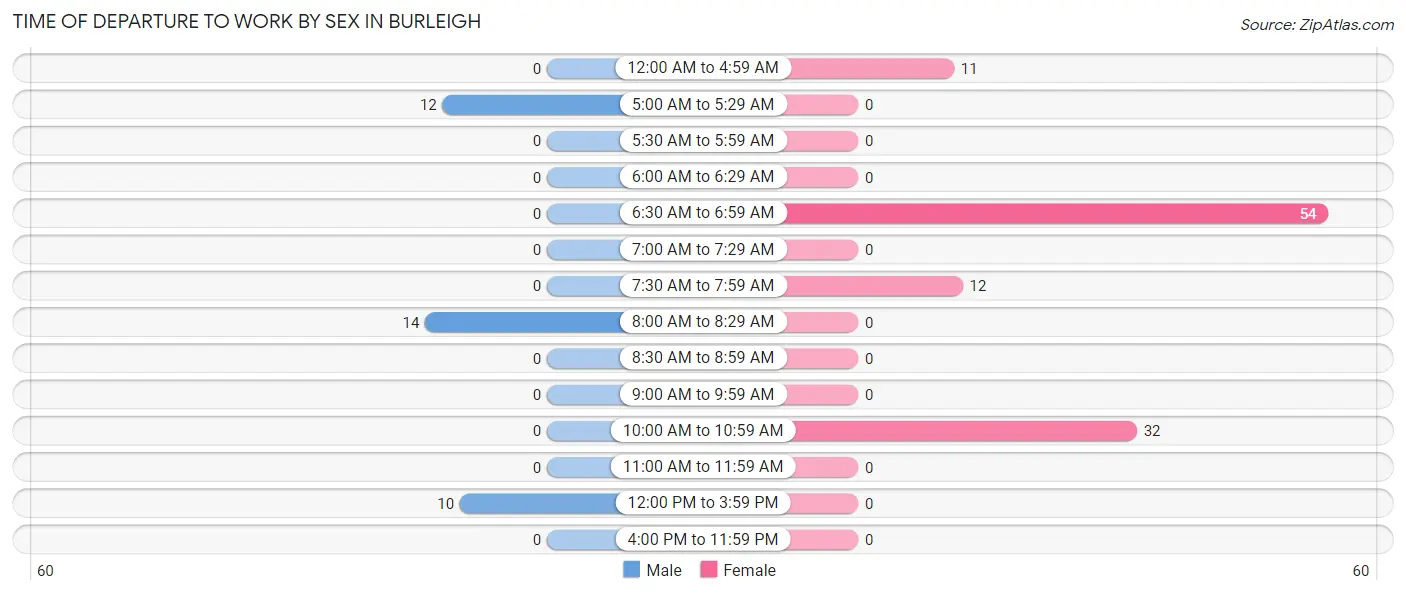
| Time of Departure | Male | Female |
| 12:00 AM to 4:59 AM | 0 (0.0%) | 11 (10.1%) |
| 5:00 AM to 5:29 AM | 12 (33.3%) | 0 (0.0%) |
| 5:30 AM to 5:59 AM | 0 (0.0%) | 0 (0.0%) |
| 6:00 AM to 6:29 AM | 0 (0.0%) | 0 (0.0%) |
| 6:30 AM to 6:59 AM | 0 (0.0%) | 54 (49.5%) |
| 7:00 AM to 7:29 AM | 0 (0.0%) | 0 (0.0%) |
| 7:30 AM to 7:59 AM | 0 (0.0%) | 12 (11.0%) |
| 8:00 AM to 8:29 AM | 14 (38.9%) | 0 (0.0%) |
| 8:30 AM to 8:59 AM | 0 (0.0%) | 0 (0.0%) |
| 9:00 AM to 9:59 AM | 0 (0.0%) | 0 (0.0%) |
| 10:00 AM to 10:59 AM | 0 (0.0%) | 32 (29.4%) |
| 11:00 AM to 11:59 AM | 0 (0.0%) | 0 (0.0%) |
| 12:00 PM to 3:59 PM | 10 (27.8%) | 0 (0.0%) |
| 4:00 PM to 11:59 PM | 0 (0.0%) | 0 (0.0%) |
| Total | 36 (100.0%) | 109 (100.0%) |
Housing Occupancy in Burleigh
Occupancy by Ownership in Burleigh
Of the total 200 dwellings in Burleigh, owner-occupied units account for 200 (100.0%), while renter-occupied units make up 0 (0.0%).
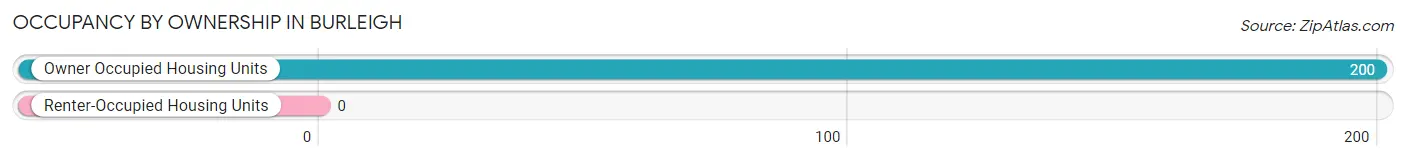
| Occupancy | # Housing Units | % Housing Units |
| Owner Occupied Housing Units | 200 | 100.0% |
| Renter-Occupied Housing Units | 0 | 0.0% |
| Total Occupied Housing Units | 200 | 100.0% |
Occupancy by Household Size in Burleigh
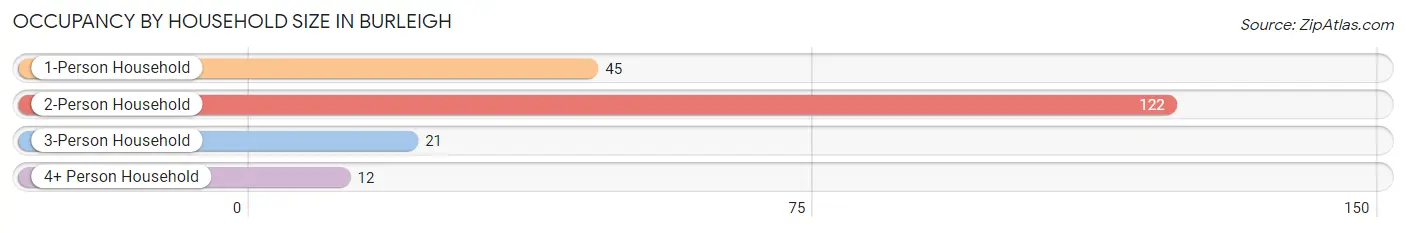
| Household Size | # Housing Units | % Housing Units |
| 1-Person Household | 45 | 22.5% |
| 2-Person Household | 122 | 61.0% |
| 3-Person Household | 21 | 10.5% |
| 4+ Person Household | 12 | 6.0% |
| Total Housing Units | 200 | 100.0% |
Occupancy by Ownership by Household Size in Burleigh
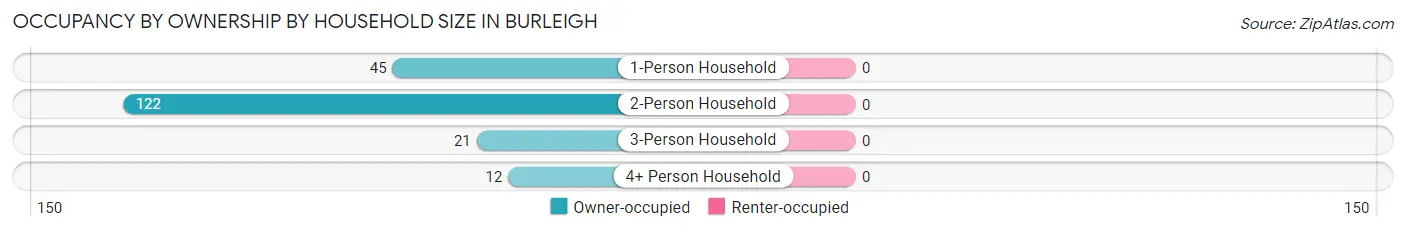
| Household Size | Owner-occupied | Renter-occupied |
| 1-Person Household | 45 (100.0%) | 0 (0.0%) |
| 2-Person Household | 122 (100.0%) | 0 (0.0%) |
| 3-Person Household | 21 (100.0%) | 0 (0.0%) |
| 4+ Person Household | 12 (100.0%) | 0 (0.0%) |
| Total Housing Units | 200 (100.0%) | 0 (0.0%) |
Occupancy by Educational Attainment in Burleigh
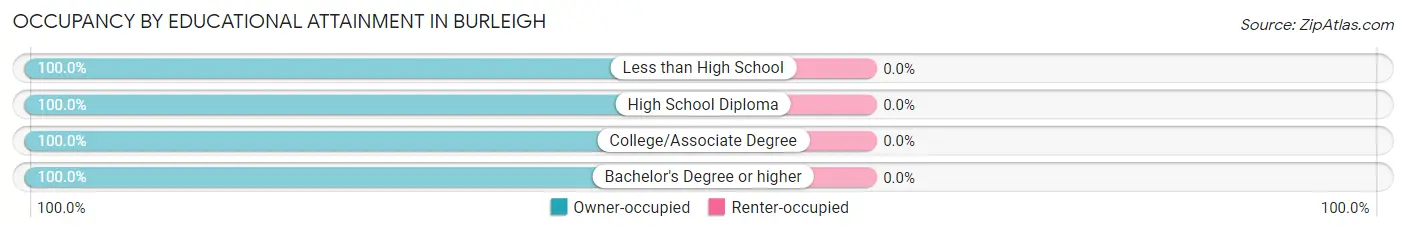
| Household Size | Owner-occupied | Renter-occupied |
| Less than High School | 21 (100.0%) | 0 (0.0%) |
| High School Diploma | 88 (100.0%) | 0 (0.0%) |
| College/Associate Degree | 44 (100.0%) | 0 (0.0%) |
| Bachelor's Degree or higher | 47 (100.0%) | 0 (0.0%) |
Occupancy by Age of Householder in Burleigh
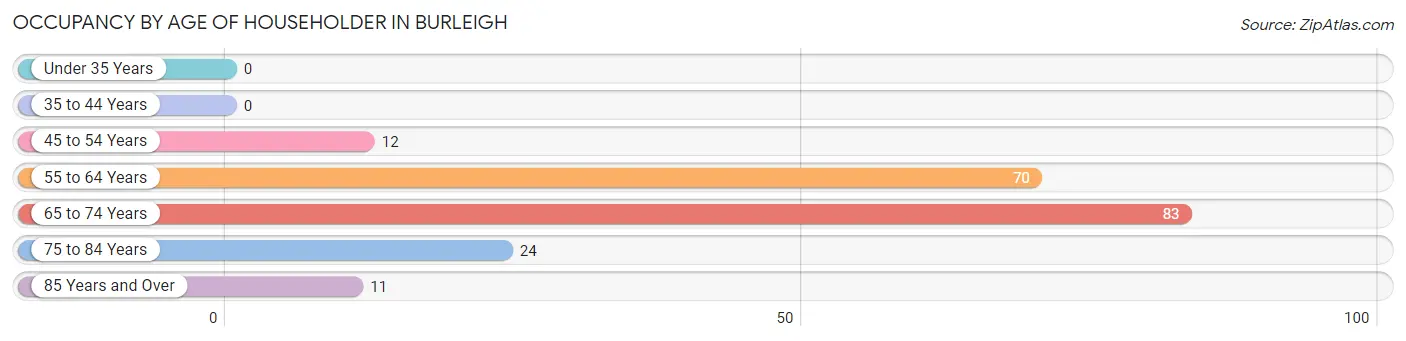
| Age Bracket | # Households | % Households |
| Under 35 Years | 0 | 0.0% |
| 35 to 44 Years | 0 | 0.0% |
| 45 to 54 Years | 12 | 6.0% |
| 55 to 64 Years | 70 | 35.0% |
| 65 to 74 Years | 83 | 41.5% |
| 75 to 84 Years | 24 | 12.0% |
| 85 Years and Over | 11 | 5.5% |
| Total | 200 | 100.0% |
Housing Finances in Burleigh
Median Income by Occupancy in Burleigh
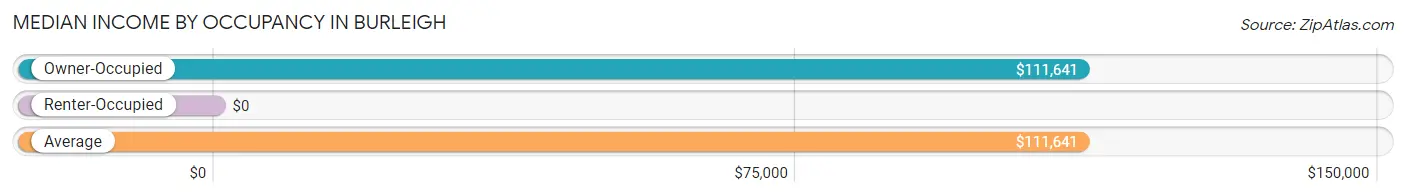
| Occupancy Type | # Households | Median Income |
| Owner-Occupied | 200 (100.0%) | $111,641 |
| Renter-Occupied | 0 (0.0%) | $0 |
| Average | 200 (100.0%) | $111,641 |
Occupancy by Householder Income Bracket in Burleigh
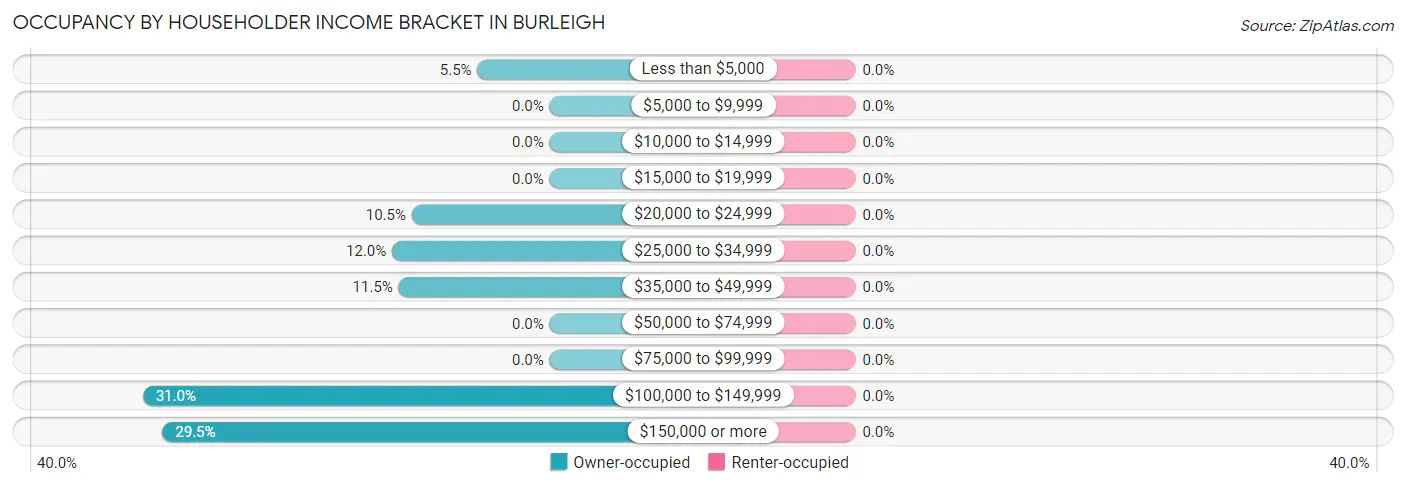
| Income Bracket | Owner-occupied | Renter-occupied |
| Less than $5,000 | 11 (5.5%) | 0 (0.0%) |
| $5,000 to $9,999 | 0 (0.0%) | 0 (0.0%) |
| $10,000 to $14,999 | 0 (0.0%) | 0 (0.0%) |
| $15,000 to $19,999 | 0 (0.0%) | 0 (0.0%) |
| $20,000 to $24,999 | 21 (10.5%) | 0 (0.0%) |
| $25,000 to $34,999 | 24 (12.0%) | 0 (0.0%) |
| $35,000 to $49,999 | 23 (11.5%) | 0 (0.0%) |
| $50,000 to $74,999 | 0 (0.0%) | 0 (0.0%) |
| $75,000 to $99,999 | 0 (0.0%) | 0 (0.0%) |
| $100,000 to $149,999 | 62 (31.0%) | 0 (0.0%) |
| $150,000 or more | 59 (29.5%) | 0 (0.0%) |
| Total | 200 (100.0%) | 0 (0.0%) |
Monthly Housing Cost Tiers in Burleigh
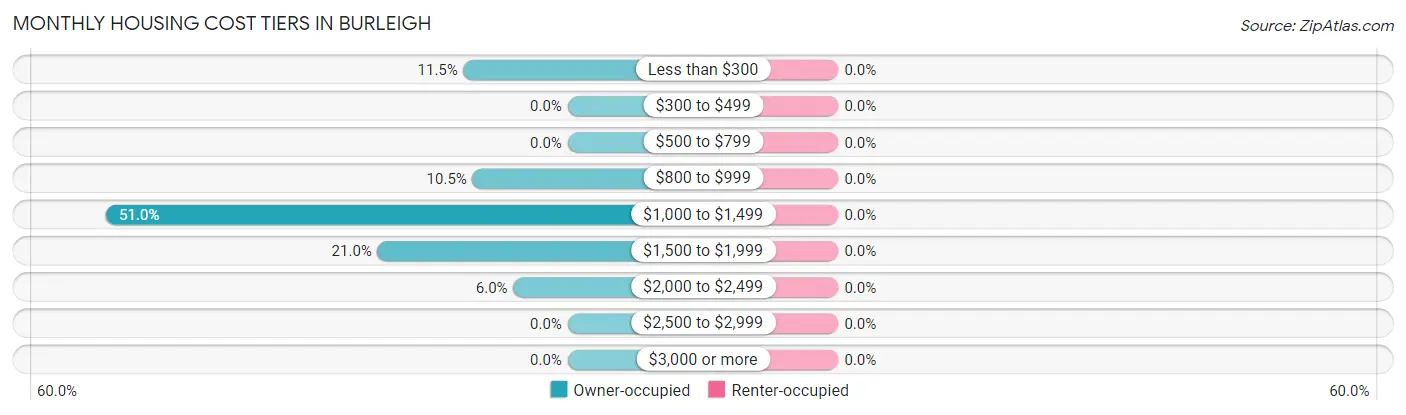
| Monthly Cost | Owner-occupied | Renter-occupied |
| Less than $300 | 23 (11.5%) | 0 (0.0%) |
| $300 to $499 | 0 (0.0%) | 0 (0.0%) |
| $500 to $799 | 0 (0.0%) | 0 (0.0%) |
| $800 to $999 | 21 (10.5%) | 0 (0.0%) |
| $1,000 to $1,499 | 102 (51.0%) | 0 (0.0%) |
| $1,500 to $1,999 | 42 (21.0%) | 0 (0.0%) |
| $2,000 to $2,499 | 12 (6.0%) | 0 (0.0%) |
| $2,500 to $2,999 | 0 (0.0%) | 0 (0.0%) |
| $3,000 or more | 0 (0.0%) | 0 (0.0%) |
| Total | 200 (100.0%) | 0 (0.0%) |
Physical Housing Characteristics in Burleigh
Housing Structures in Burleigh
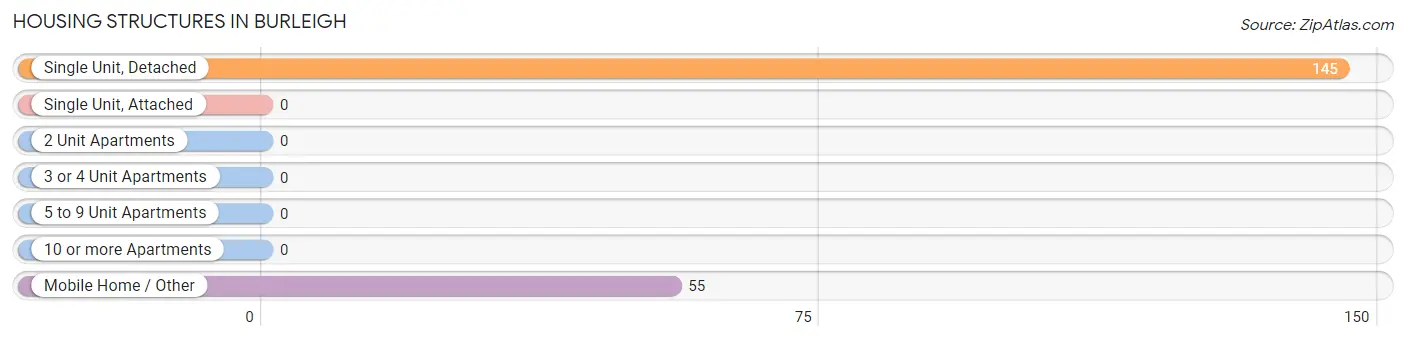
| Structure Type | # Housing Units | % Housing Units |
| Single Unit, Detached | 145 | 72.5% |
| Single Unit, Attached | 0 | 0.0% |
| 2 Unit Apartments | 0 | 0.0% |
| 3 or 4 Unit Apartments | 0 | 0.0% |
| 5 to 9 Unit Apartments | 0 | 0.0% |
| 10 or more Apartments | 0 | 0.0% |
| Mobile Home / Other | 55 | 27.5% |
| Total | 200 | 100.0% |
Housing Structures by Occupancy in Burleigh
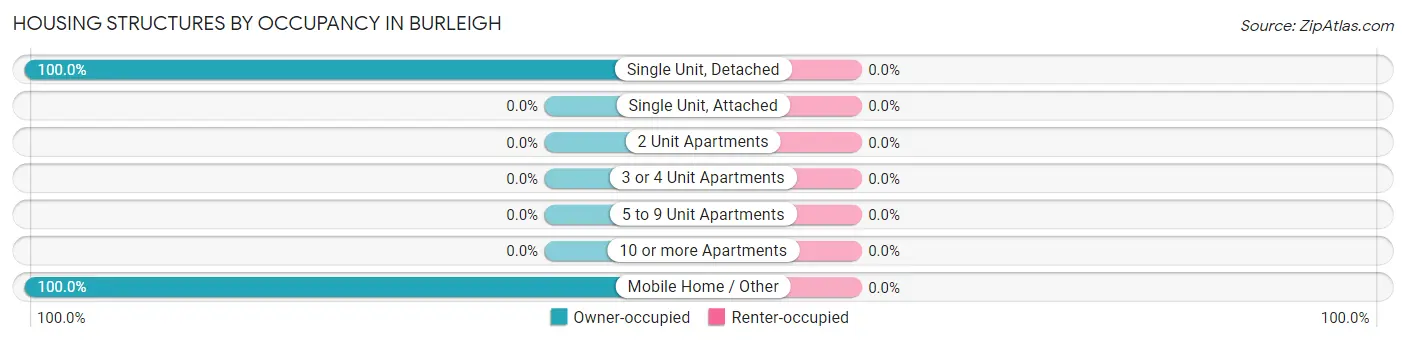
| Structure Type | Owner-occupied | Renter-occupied |
| Single Unit, Detached | 145 (100.0%) | 0 (0.0%) |
| Single Unit, Attached | 0 (0.0%) | 0 (0.0%) |
| 2 Unit Apartments | 0 (0.0%) | 0 (0.0%) |
| 3 or 4 Unit Apartments | 0 (0.0%) | 0 (0.0%) |
| 5 to 9 Unit Apartments | 0 (0.0%) | 0 (0.0%) |
| 10 or more Apartments | 0 (0.0%) | 0 (0.0%) |
| Mobile Home / Other | 55 (100.0%) | 0 (0.0%) |
| Total | 200 (100.0%) | 0 (0.0%) |
Housing Structures by Number of Rooms in Burleigh
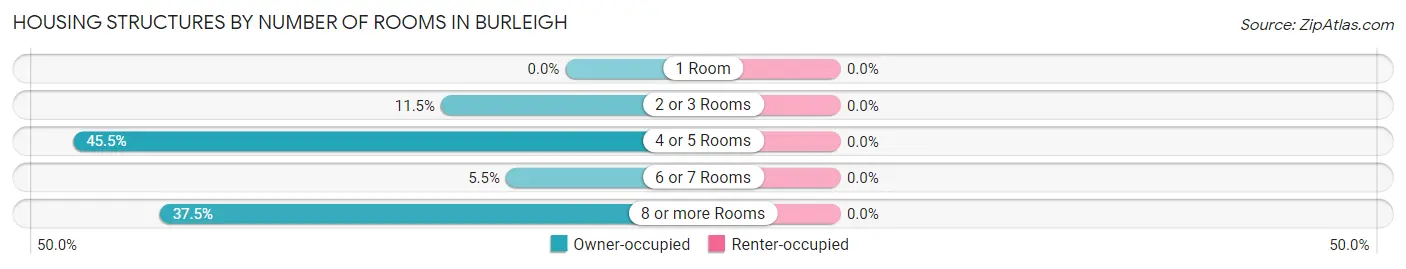
| Number of Rooms | Owner-occupied | Renter-occupied |
| 1 Room | 0 (0.0%) | 0 (0.0%) |
| 2 or 3 Rooms | 23 (11.5%) | 0 (0.0%) |
| 4 or 5 Rooms | 91 (45.5%) | 0 (0.0%) |
| 6 or 7 Rooms | 11 (5.5%) | 0 (0.0%) |
| 8 or more Rooms | 75 (37.5%) | 0 (0.0%) |
| Total | 200 (100.0%) | 0 (0.0%) |
Housing Structure by Heating Type in Burleigh
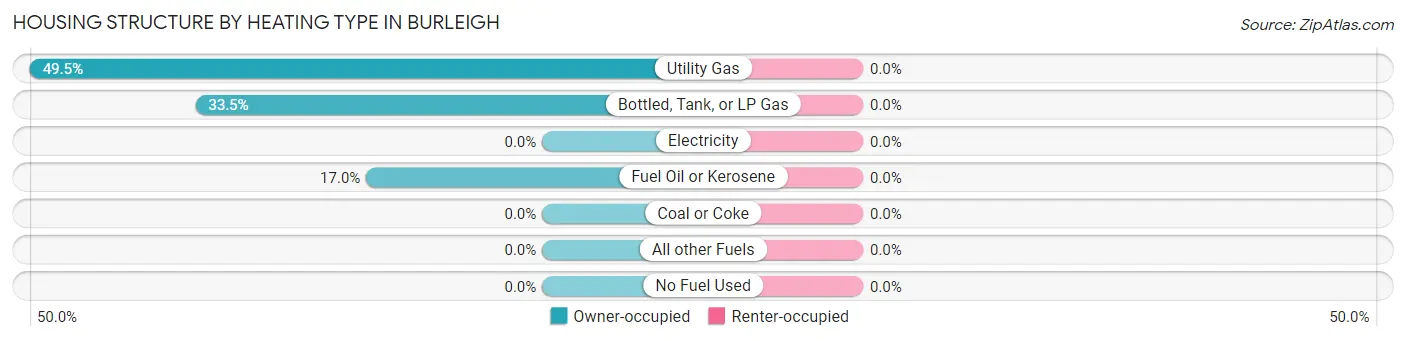
| Heating Type | Owner-occupied | Renter-occupied |
| Utility Gas | 99 (49.5%) | 0 (0.0%) |
| Bottled, Tank, or LP Gas | 67 (33.5%) | 0 (0.0%) |
| Electricity | 0 (0.0%) | 0 (0.0%) |
| Fuel Oil or Kerosene | 34 (17.0%) | 0 (0.0%) |
| Coal or Coke | 0 (0.0%) | 0 (0.0%) |
| All other Fuels | 0 (0.0%) | 0 (0.0%) |
| No Fuel Used | 0 (0.0%) | 0 (0.0%) |
| Total | 200 (100.0%) | 0 (0.0%) |
Household Vehicle Usage in Burleigh
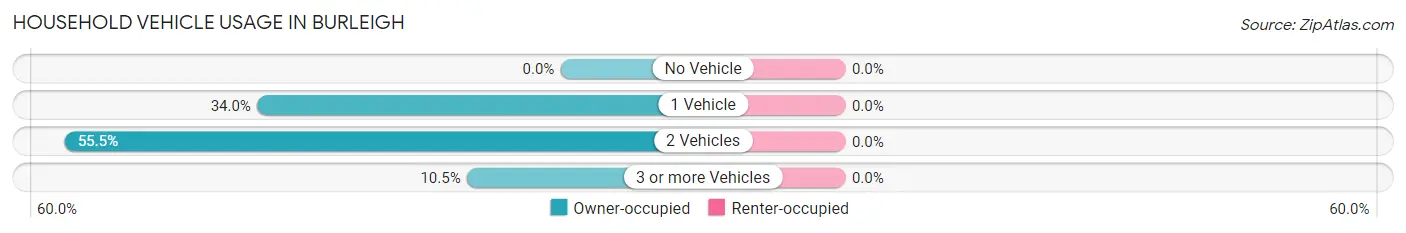
| Vehicles per Household | Owner-occupied | Renter-occupied |
| No Vehicle | 0 (0.0%) | 0 (0.0%) |
| 1 Vehicle | 68 (34.0%) | 0 (0.0%) |
| 2 Vehicles | 111 (55.5%) | 0 (0.0%) |
| 3 or more Vehicles | 21 (10.5%) | 0 (0.0%) |
| Total | 200 (100.0%) | 0 (0.0%) |
Real Estate & Mortgages in Burleigh
Real Estate and Mortgage Overview in Burleigh
| Characteristic | Without Mortgage | With Mortgage |
| Housing Units | 125 | 75 |
| Median Property Value | - | - |
| Median Household Income | - | - |
| Monthly Housing Costs | $1,043 | $0 |
| Real Estate Taxes | $3,778 | $0 |
Property Value by Mortgage Status in Burleigh
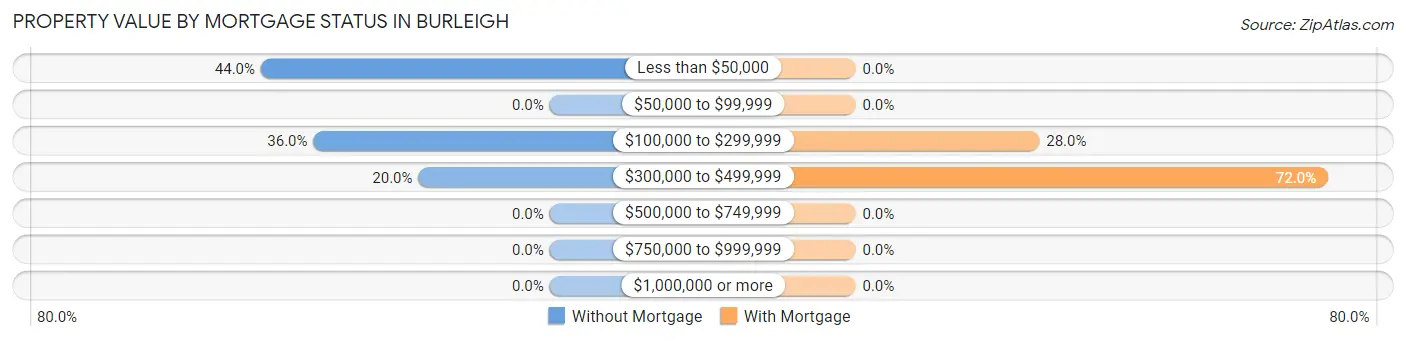
| Property Value | Without Mortgage | With Mortgage |
| Less than $50,000 | 55 (44.0%) | 0 (0.0%) |
| $50,000 to $99,999 | 0 (0.0%) | 0 (0.0%) |
| $100,000 to $299,999 | 45 (36.0%) | 21 (28.0%) |
| $300,000 to $499,999 | 25 (20.0%) | 54 (72.0%) |
| $500,000 to $749,999 | 0 (0.0%) | 0 (0.0%) |
| $750,000 to $999,999 | 0 (0.0%) | 0 (0.0%) |
| $1,000,000 or more | 0 (0.0%) | 0 (0.0%) |
| Total | 125 (100.0%) | 75 (100.0%) |
Household Income by Mortgage Status in Burleigh
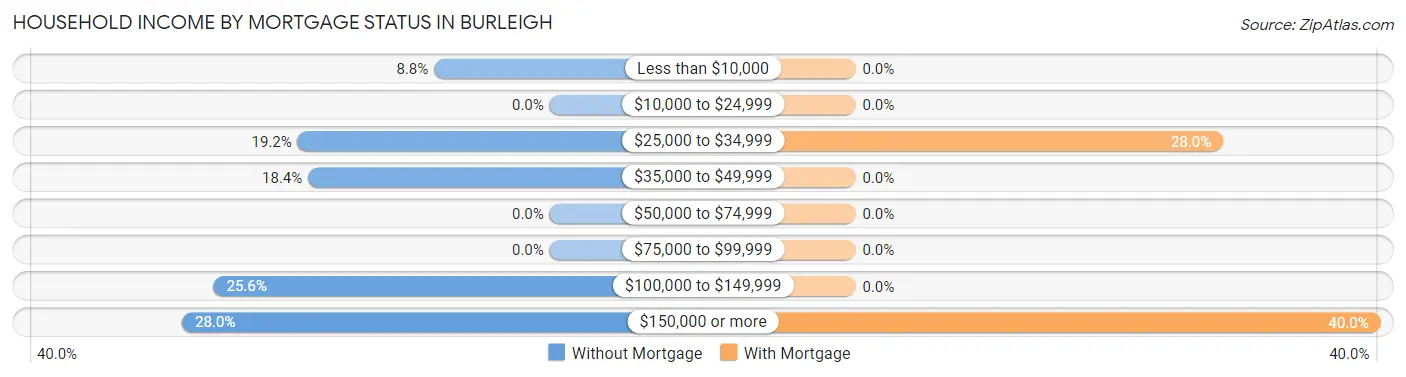
| Household Income | Without Mortgage | With Mortgage |
| Less than $10,000 | 11 (8.8%) | 0 (0.0%) |
| $10,000 to $24,999 | 0 (0.0%) | 0 (0.0%) |
| $25,000 to $34,999 | 24 (19.2%) | 21 (28.0%) |
| $35,000 to $49,999 | 23 (18.4%) | 0 (0.0%) |
| $50,000 to $74,999 | 0 (0.0%) | 0 (0.0%) |
| $75,000 to $99,999 | 0 (0.0%) | 0 (0.0%) |
| $100,000 to $149,999 | 32 (25.6%) | 0 (0.0%) |
| $150,000 or more | 35 (28.0%) | 30 (40.0%) |
| Total | 125 (100.0%) | 75 (100.0%) |
Property Value to Household Income Ratio in Burleigh
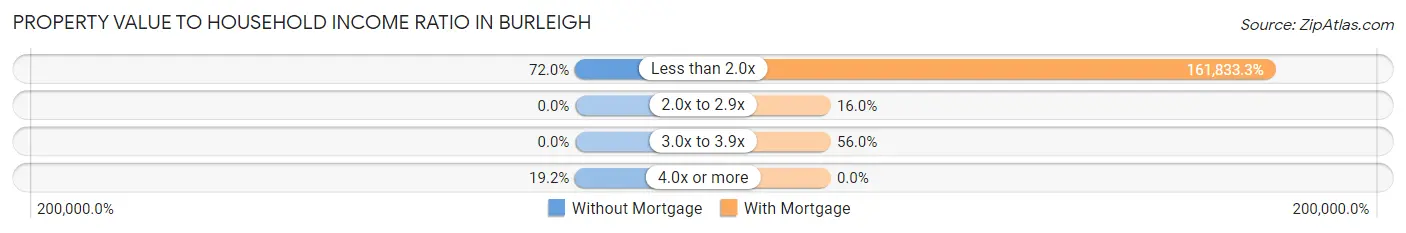
| Value-to-Income Ratio | Without Mortgage | With Mortgage |
| Less than 2.0x | 90 (72.0%) | 121,375 (161,833.3%) |
| 2.0x to 2.9x | 0 (0.0%) | 12 (16.0%) |
| 3.0x to 3.9x | 0 (0.0%) | 42 (56.0%) |
| 4.0x or more | 24 (19.2%) | 0 (0.0%) |
| Total | 125 (100.0%) | 75 (100.0%) |
Real Estate Taxes by Mortgage Status in Burleigh
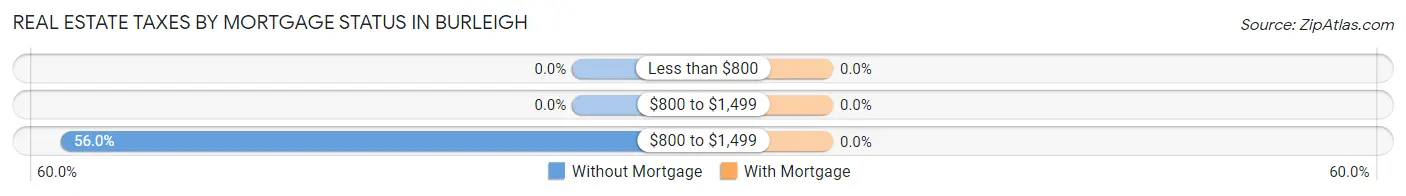
| Property Taxes | Without Mortgage | With Mortgage |
| Less than $800 | 0 (0.0%) | 0 (0.0%) |
| $800 to $1,499 | 0 (0.0%) | 0 (0.0%) |
| $800 to $1,499 | 70 (56.0%) | 0 (0.0%) |
| Total | 125 (100.0%) | 75 (100.0%) |
Health & Disability in Burleigh
Health Insurance Coverage by Age in Burleigh
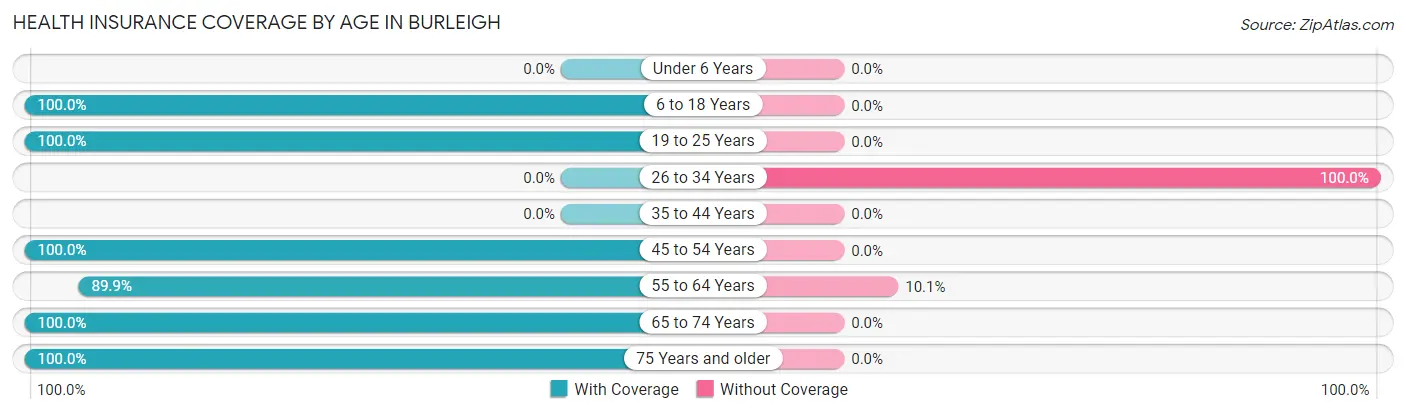
| Age Bracket | With Coverage | Without Coverage |
| Under 6 Years | 0 (0.0%) | 0 (0.0%) |
| 6 to 18 Years | 15 (100.0%) | 0 (0.0%) |
| 19 to 25 Years | 11 (100.0%) | 0 (0.0%) |
| 26 to 34 Years | 0 (0.0%) | 11 (100.0%) |
| 35 to 44 Years | 0 (0.0%) | 0 (0.0%) |
| 45 to 54 Years | 20 (100.0%) | 0 (0.0%) |
| 55 to 64 Years | 125 (89.9%) | 14 (10.1%) |
| 65 to 74 Years | 91 (100.0%) | 0 (0.0%) |
| 75 Years and older | 44 (100.0%) | 0 (0.0%) |
| Total | 306 (92.4%) | 25 (7.5%) |
Health Insurance Coverage by Citizenship Status in Burleigh
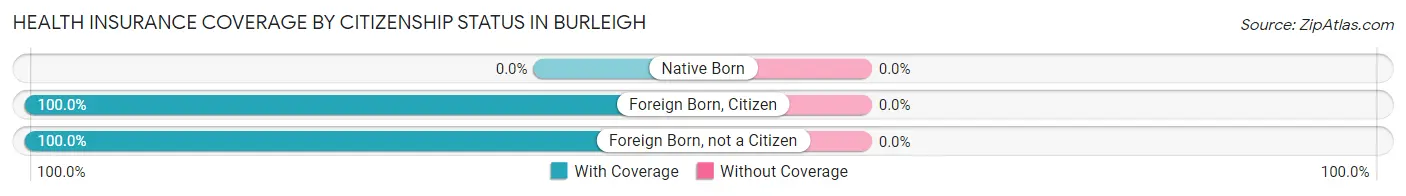
| Citizenship Status | With Coverage | Without Coverage |
| Native Born | 0 (0.0%) | 0 (0.0%) |
| Foreign Born, Citizen | 15 (100.0%) | 0 (0.0%) |
| Foreign Born, not a Citizen | 11 (100.0%) | 0 (0.0%) |
Health Insurance Coverage by Household Income in Burleigh
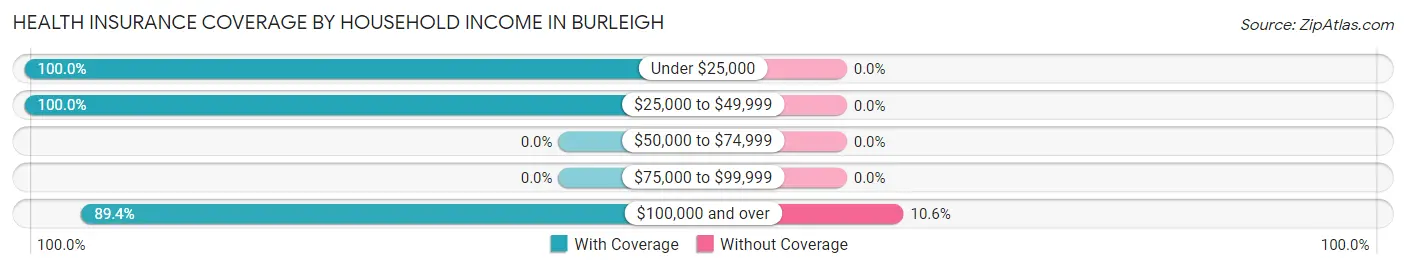
| Household Income | With Coverage | Without Coverage |
| Under $25,000 | 41 (100.0%) | 0 (0.0%) |
| $25,000 to $49,999 | 55 (100.0%) | 0 (0.0%) |
| $50,000 to $74,999 | 0 (0.0%) | 0 (0.0%) |
| $75,000 to $99,999 | 0 (0.0%) | 0 (0.0%) |
| $100,000 and over | 210 (89.4%) | 25 (10.6%) |
Public vs Private Health Insurance Coverage by Age in Burleigh
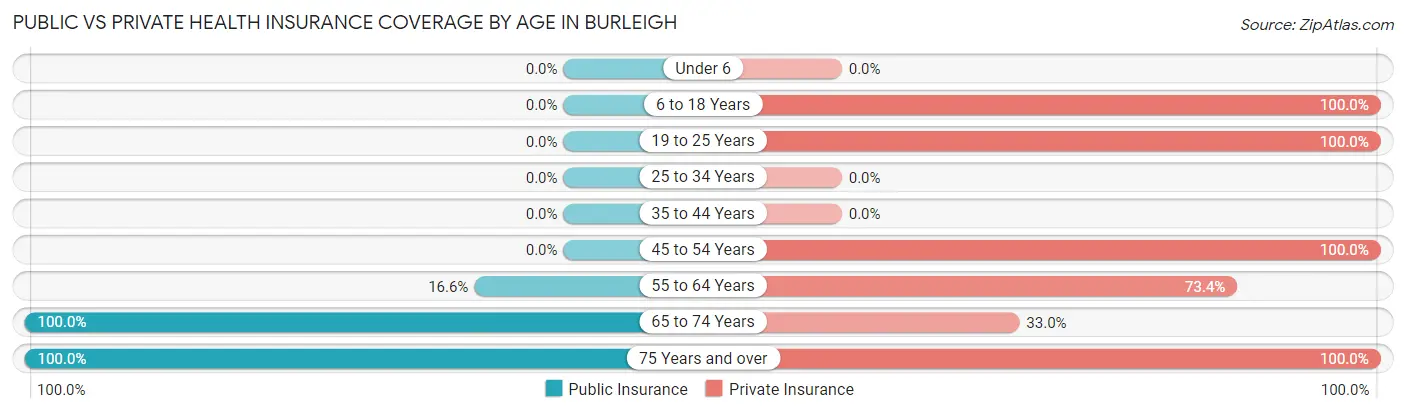
| Age Bracket | Public Insurance | Private Insurance |
| Under 6 | 0 (0.0%) | 0 (0.0%) |
| 6 to 18 Years | 0 (0.0%) | 15 (100.0%) |
| 19 to 25 Years | 0 (0.0%) | 11 (100.0%) |
| 25 to 34 Years | 0 (0.0%) | 0 (0.0%) |
| 35 to 44 Years | 0 (0.0%) | 0 (0.0%) |
| 45 to 54 Years | 0 (0.0%) | 20 (100.0%) |
| 55 to 64 Years | 23 (16.6%) | 102 (73.4%) |
| 65 to 74 Years | 91 (100.0%) | 30 (33.0%) |
| 75 Years and over | 44 (100.0%) | 44 (100.0%) |
| Total | 158 (47.7%) | 222 (67.1%) |
Disability Status by Sex by Age in Burleigh
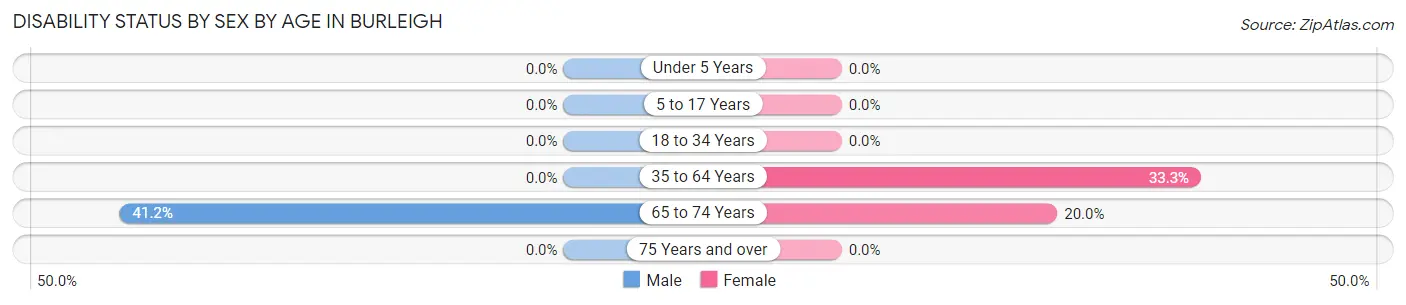
| Age Bracket | Male | Female |
| Under 5 Years | 0 (0.0%) | 0 (0.0%) |
| 5 to 17 Years | 0 (0.0%) | 0 (0.0%) |
| 18 to 34 Years | 0 (0.0%) | 0 (0.0%) |
| 35 to 64 Years | 0 (0.0%) | 37 (33.3%) |
| 65 to 74 Years | 21 (41.2%) | 8 (20.0%) |
| 75 Years and over | 0 (0.0%) | 0 (0.0%) |
Disability Class by Sex by Age in Burleigh
Disability Class: Hearing Difficulty
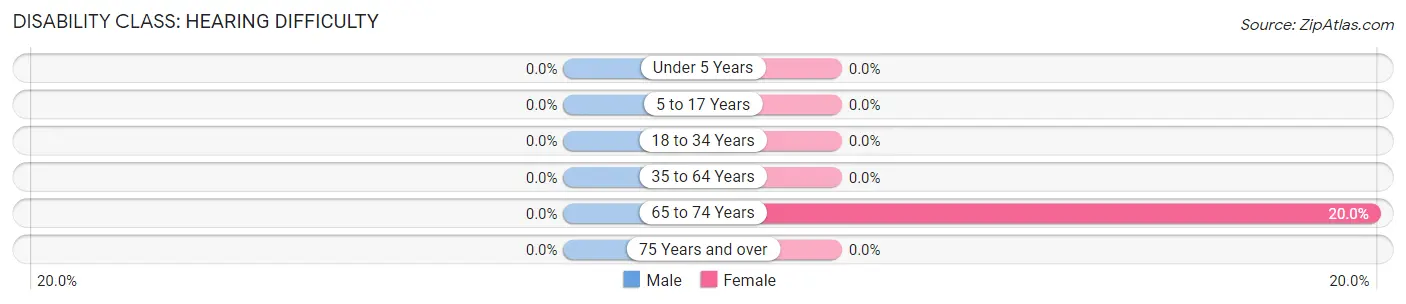
| Age Bracket | Male | Female |
| Under 5 Years | 0 (0.0%) | 0 (0.0%) |
| 5 to 17 Years | 0 (0.0%) | 0 (0.0%) |
| 18 to 34 Years | 0 (0.0%) | 0 (0.0%) |
| 35 to 64 Years | 0 (0.0%) | 0 (0.0%) |
| 65 to 74 Years | 0 (0.0%) | 8 (20.0%) |
| 75 Years and over | 0 (0.0%) | 0 (0.0%) |
Disability Class: Vision Difficulty
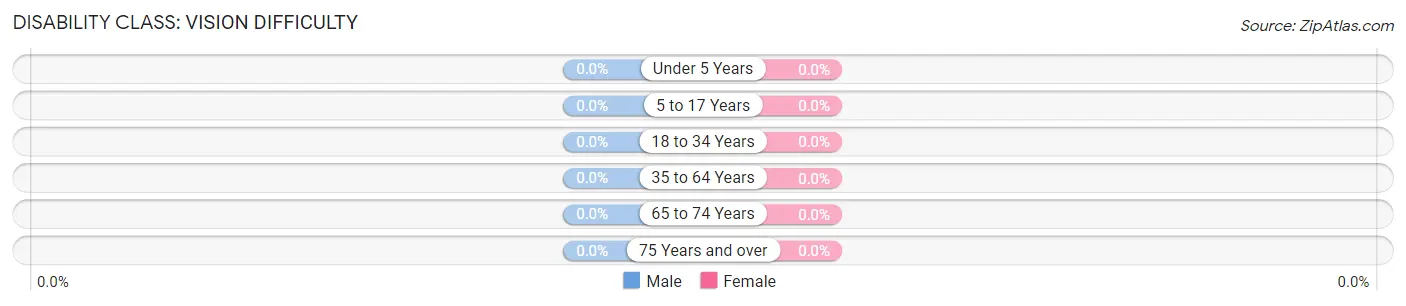
| Age Bracket | Male | Female |
| Under 5 Years | 0 (0.0%) | 0 (0.0%) |
| 5 to 17 Years | 0 (0.0%) | 0 (0.0%) |
| 18 to 34 Years | 0 (0.0%) | 0 (0.0%) |
| 35 to 64 Years | 0 (0.0%) | 0 (0.0%) |
| 65 to 74 Years | 0 (0.0%) | 0 (0.0%) |
| 75 Years and over | 0 (0.0%) | 0 (0.0%) |
Disability Class: Cognitive Difficulty
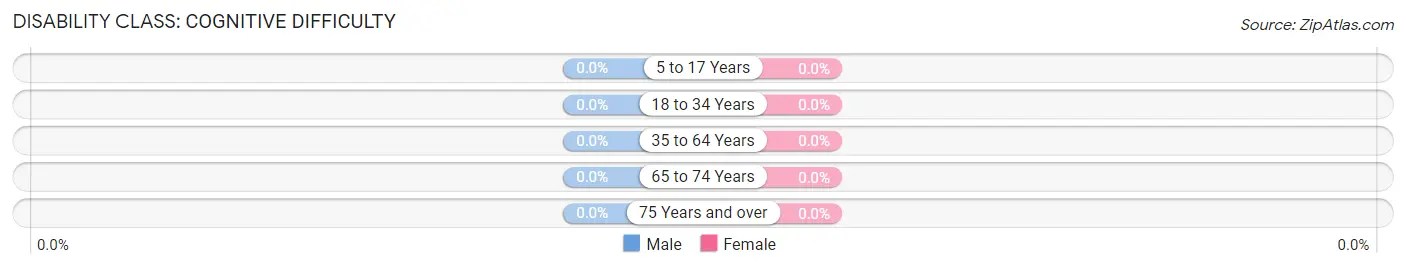
| Age Bracket | Male | Female |
| 5 to 17 Years | 0 (0.0%) | 0 (0.0%) |
| 18 to 34 Years | 0 (0.0%) | 0 (0.0%) |
| 35 to 64 Years | 0 (0.0%) | 0 (0.0%) |
| 65 to 74 Years | 0 (0.0%) | 0 (0.0%) |
| 75 Years and over | 0 (0.0%) | 0 (0.0%) |
Disability Class: Ambulatory Difficulty
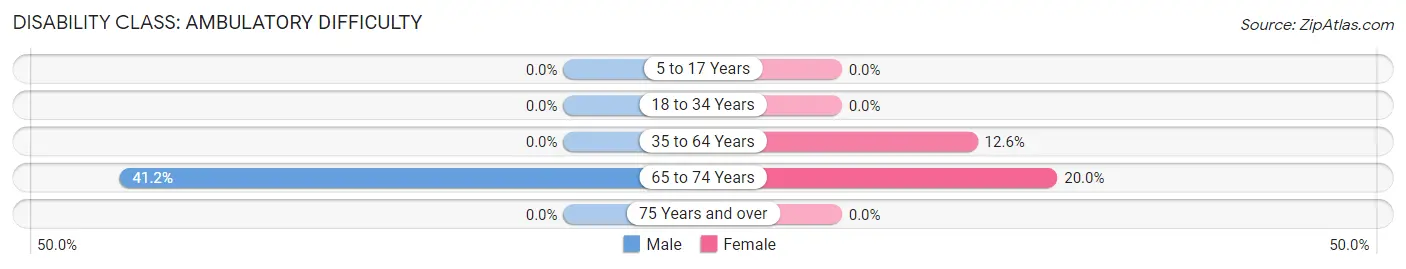
| Age Bracket | Male | Female |
| 5 to 17 Years | 0 (0.0%) | 0 (0.0%) |
| 18 to 34 Years | 0 (0.0%) | 0 (0.0%) |
| 35 to 64 Years | 0 (0.0%) | 14 (12.6%) |
| 65 to 74 Years | 21 (41.2%) | 8 (20.0%) |
| 75 Years and over | 0 (0.0%) | 0 (0.0%) |
Disability Class: Self-Care Difficulty
| Age Bracket | Male | Female |
| 5 to 17 Years | 0 (0.0%) | 0 (0.0%) |
| 18 to 34 Years | 0 (0.0%) | 0 (0.0%) |
| 35 to 64 Years | 0 (0.0%) | 0 (0.0%) |
| 65 to 74 Years | 0 (0.0%) | 0 (0.0%) |
| 75 Years and over | 0 (0.0%) | 0 (0.0%) |
Technology Access in Burleigh
Computing Device Access in Burleigh
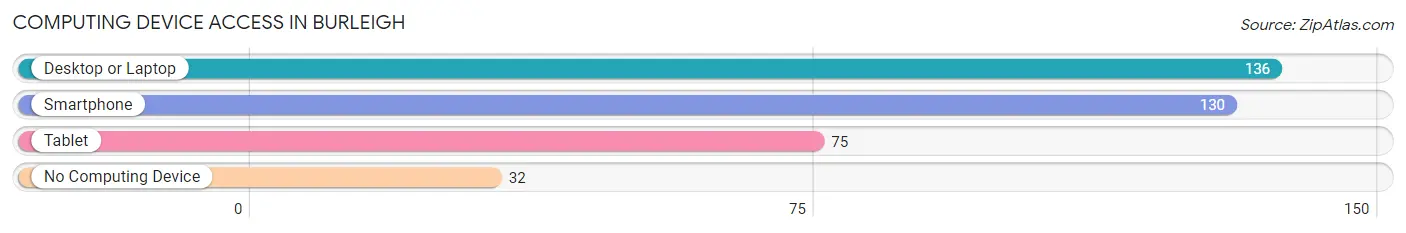
| Device Type | # Households | % Households |
| Desktop or Laptop | 136 | 68.0% |
| Smartphone | 130 | 65.0% |
| Tablet | 75 | 37.5% |
| No Computing Device | 32 | 16.0% |
| Total | 200 | 100.0% |
Internet Access in Burleigh
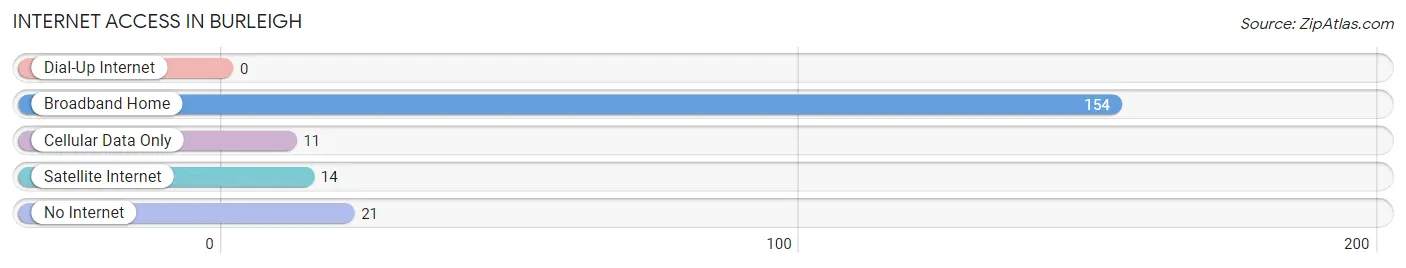
| Internet Type | # Households | % Households |
| Dial-Up Internet | 0 | 0.0% |
| Broadband Home | 154 | 77.0% |
| Cellular Data Only | 11 | 5.5% |
| Satellite Internet | 14 | 7.0% |
| No Internet | 21 | 10.5% |
| Total | 200 | 100.0% |
Burleigh Summary
Burleigh, NJ is a small borough located in Monmouth County, New Jersey. It is situated on the banks of the Navesink River, and is part of the larger Bayshore region. The borough has a population of approximately 1,500 people, and is home to a variety of businesses, including a marina, a golf course, and a number of restaurants.
History
Burleigh was originally part of Middletown Township, and was known as “Burleigh’s Corner”. The area was first settled in the late 1600s, and was home to a number of farms and small businesses. In 1871, the area was incorporated as the Borough of Burleigh. The borough was named after the Burleigh family, who were prominent landowners in the area.
Geography
Burleigh is located in Monmouth County, New Jersey. It is situated on the banks of the Navesink River, and is part of the larger Bayshore region. The borough is bordered by Middletown Township to the north, Hazlet Township to the east, and the Atlantic Ocean to the south. The borough covers an area of approximately 1.2 square miles, and is home to a variety of businesses, including a marina, a golf course, and a number of restaurants.
Economy
Burleigh’s economy is largely based on tourism and recreation. The borough is home to a number of businesses, including a marina, a golf course, and a number of restaurants. The marina is a popular destination for boaters, and the golf course is a popular destination for golfers. The borough also has a number of small businesses, including a variety of shops and restaurants.
Demographics
As of the 2010 census, Burleigh had a population of 1,500 people. The racial makeup of the borough was 94.7% White, 1.3% African American, 0.7% Asian, and 3.3% from other races. The median household income was $68,750, and the median family income was $76,250. The per capita income was $30,945.
Conclusion
Burleigh, NJ is a small borough located in Monmouth County, New Jersey. It is situated on the banks of the Navesink River, and is part of the larger Bayshore region. The borough has a population of approximately 1,500 people, and is home to a variety of businesses, including a marina, a golf course, and a number of restaurants. The economy of Burleigh is largely based on tourism and recreation, and the borough is home to a number of small businesses. The racial makeup of the borough is 94.7% White, 1.3% African American, 0.7% Asian, and 3.3% from other races. The median household income was $68,750, and the median family income was $76,250.
Common Questions
What is the Total Population of Burleigh?
Total Population of Burleigh is 331.
What is the Total Male Population of Burleigh?
Total Male Population of Burleigh is 110.
What is the Total Female Population of Burleigh?
Total Female Population of Burleigh is 221.
What is the Ratio of Males per 100 Females in Burleigh?
There are 49.77 Males per 100 Females in Burleigh.
What is the Ratio of Females per 100 Males in Burleigh?
There are 200.91 Females per 100 Males in Burleigh.
What is the Median Population Age in Burleigh?
Median Population Age in Burleigh is 64.3 Years.
What is the Average Family Size in Burleigh
Average Family Size in Burleigh is 1.9 People.
What is the Average Household Size in Burleigh
Average Household Size in Burleigh is 1.7 People.
What is Per Capita Income in Burleigh?
Per Capita income in Burleigh is $54,756.
What is the Median Family Income in Burleigh?
Median Family Income in Burleigh is $121,917.
What is the Median Household income in Burleigh?
Median Household Income in Burleigh is $111,641.
What is Income or Wage Gap in Burleigh?
Income or Wage Gap in Burleigh is 43.5%.
Women in Burleigh earn 56.5 cents for every dollar earned by a man.
What is Inequality or Gini Index in Burleigh?
Inequality or Gini Index in Burleigh is 0.41.
How Large is the Labor Force in Burleigh?
There are 145 People in the Labor Forcein in Burleigh.
What is the Percentage of People in the Labor Force in Burleigh?
45.9% of People are in the Labor Force in Burleigh.