Cities with the Lowest Percentage of Single Mothers in Colorado
RELATED REPORTS & OPTIONS
Fewest Single Mothers
Colorado
Compare Cities
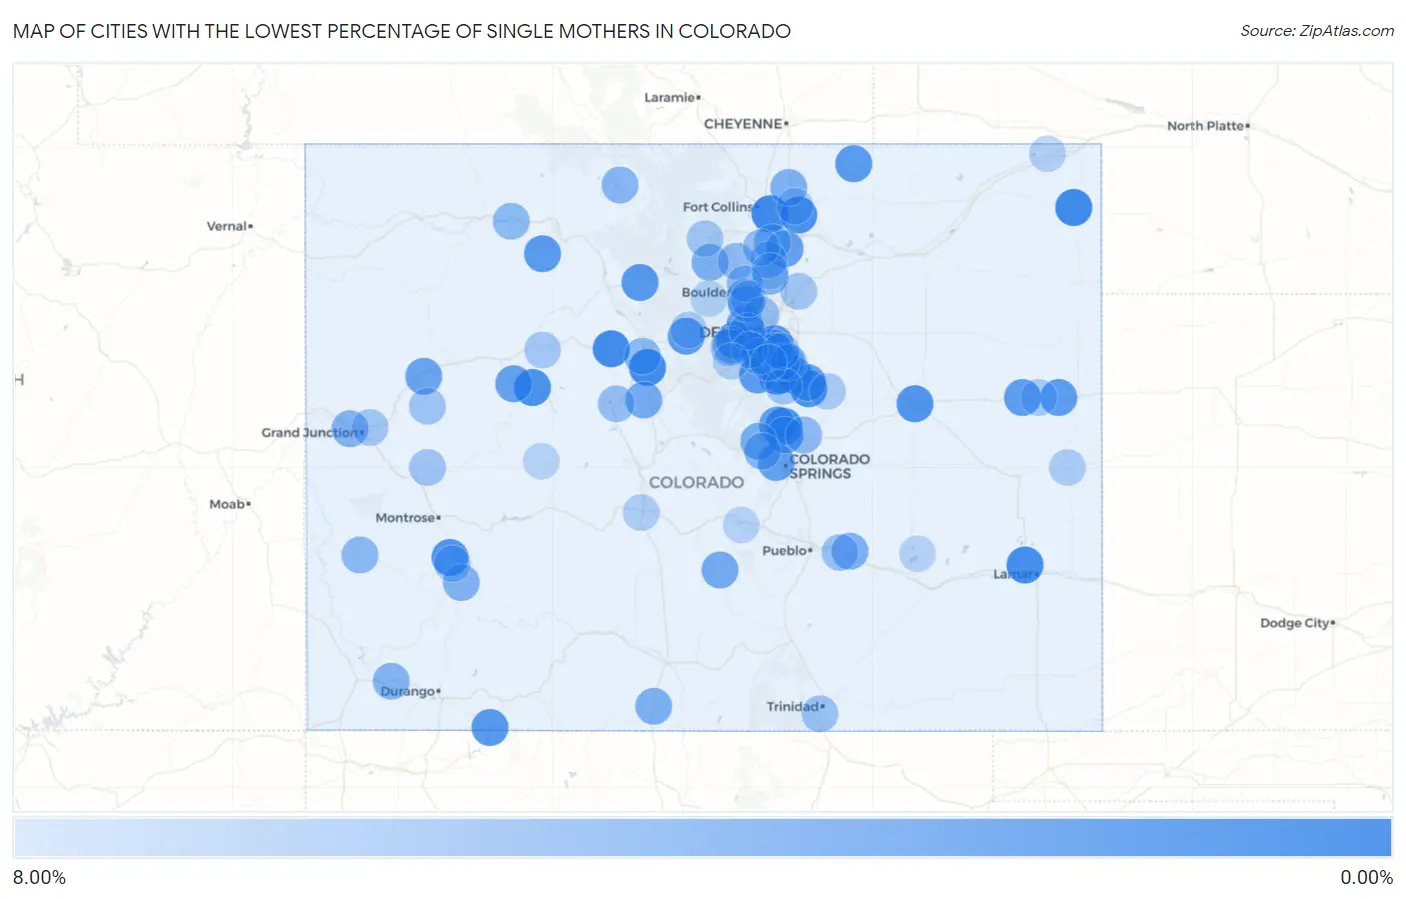
Map of Cities with the Lowest Percentage of Single Mothers in Colorado
8.00%
0.00%
Cities with the Lowest Percentage of Single Mothers in Colorado
| City | % Single Mothers | vs State | vs National | |
| 1. | Columbine Valley | 0.48% | 8.95%(-8.47)#1 | 11.49%(-11.0)#26 |
| 2. | Castle Pines Village | 0.79% | 8.95%(-8.16)#2 | 11.49%(-10.7)#126 |
| 3. | Timnath | 0.82% | 8.95%(-8.13)#3 | 11.49%(-10.7)#137 |
| 4. | Holyoke | 0.90% | 8.95%(-8.05)#4 | 11.49%(-10.6)#161 |
| 5. | Breckenridge | 0.93% | 8.95%(-8.02)#5 | 11.49%(-10.6)#172 |
| 6. | Vail | 0.98% | 8.95%(-7.97)#6 | 11.49%(-10.5)#204 |
| 7. | Wiley | 1.01% | 8.95%(-7.94)#7 | 11.49%(-10.5)#221 |
| 8. | Eaton | 1.19% | 8.95%(-7.76)#8 | 11.49%(-10.3)#314 |
| 9. | Basalt | 1.22% | 8.95%(-7.73)#9 | 11.49%(-10.3)#344 |
| 10. | Woodmoor | 1.30% | 8.95%(-7.65)#10 | 11.49%(-10.2)#391 |
| 11. | The Pinery | 1.31% | 8.95%(-7.64)#11 | 11.49%(-10.2)#399 |
| 12. | Elizabeth | 1.44% | 8.95%(-7.51)#12 | 11.49%(-10.1)#475 |
| 13. | Loghill Village | 1.50% | 8.95%(-7.45)#13 | 11.49%(-9.98)#517 |
| 14. | Limon | 1.58% | 8.95%(-7.37)#14 | 11.49%(-9.90)#583 |
| 15. | Genesee | 1.72% | 8.95%(-7.23)#15 | 11.49%(-9.76)#707 |
| 16. | Hot Sulphur Springs | 1.92% | 8.95%(-7.03)#16 | 11.49%(-9.56)#846 |
| 17. | Arboles | 1.92% | 8.95%(-7.03)#17 | 11.49%(-9.56)#848 |
| 18. | Oak Creek | 1.98% | 8.95%(-6.97)#18 | 11.49%(-9.51)#906 |
| 19. | Holly Hills | 2.00% | 8.95%(-6.95)#19 | 11.49%(-9.49)#924 |
| 20. | Grover | 2.00% | 8.95%(-6.95)#20 | 11.49%(-9.49)#932 |
| 21. | Bow Mar | 2.04% | 8.95%(-6.91)#21 | 11.49%(-9.45)#965 |
| 22. | Roxborough Park | 2.06% | 8.95%(-6.89)#22 | 11.49%(-9.43)#989 |
| 23. | Bethune | 2.08% | 8.95%(-6.87)#23 | 11.49%(-9.40)#1,011 |
| 24. | Vona | 2.13% | 8.95%(-6.82)#24 | 11.49%(-9.36)#1,052 |
| 25. | Georgetown | 2.14% | 8.95%(-6.81)#25 | 11.49%(-9.35)#1,056 |
| 26. | Palmer Lake | 2.32% | 8.95%(-6.63)#26 | 11.49%(-9.17)#1,217 |
| 27. | Stepping Stone | 2.39% | 8.95%(-6.56)#27 | 11.49%(-9.10)#1,282 |
| 28. | Manitou Springs | 2.42% | 8.95%(-6.53)#28 | 11.49%(-9.07)#1,308 |
| 29. | Milliken | 2.44% | 8.95%(-6.51)#29 | 11.49%(-9.05)#1,341 |
| 30. | Fairmount | 2.47% | 8.95%(-6.48)#30 | 11.49%(-9.01)#1,370 |
| 31. | Carbondale | 2.54% | 8.95%(-6.41)#31 | 11.49%(-8.95)#1,423 |
| 32. | Ponderosa Park | 2.55% | 8.95%(-6.40)#32 | 11.49%(-8.94)#1,434 |
| 33. | Cherry Hills Village | 2.57% | 8.95%(-6.38)#33 | 11.49%(-8.91)#1,459 |
| 34. | Gleneagle | 2.70% | 8.95%(-6.25)#34 | 11.49%(-8.79)#1,567 |
| 35. | Meridian | 2.74% | 8.95%(-6.21)#35 | 11.49%(-8.75)#1,622 |
| 36. | Battlement Mesa | 2.75% | 8.95%(-6.20)#36 | 11.49%(-8.73)#1,629 |
| 37. | Silver Cliff | 3.05% | 8.95%(-5.90)#37 | 11.49%(-8.43)#1,970 |
| 38. | Paragon Estates | 3.17% | 8.95%(-5.78)#38 | 11.49%(-8.32)#2,072 |
| 39. | Alma | 3.19% | 8.95%(-5.76)#39 | 11.49%(-8.30)#2,096 |
| 40. | Woodland Park | 3.48% | 8.95%(-5.47)#40 | 11.49%(-8.01)#2,398 |
| 41. | Romeo | 3.57% | 8.95%(-5.38)#41 | 11.49%(-7.92)#2,495 |
| 42. | Nunn | 3.64% | 8.95%(-5.31)#42 | 11.49%(-7.85)#2,565 |
| 43. | Boone | 3.64% | 8.95%(-5.31)#43 | 11.49%(-7.85)#2,568 |
| 44. | Frederick | 3.67% | 8.95%(-5.28)#44 | 11.49%(-7.82)#2,597 |
| 45. | Kittredge | 3.72% | 8.95%(-5.23)#45 | 11.49%(-7.77)#2,658 |
| 46. | Allenspark | 3.73% | 8.95%(-5.22)#46 | 11.49%(-7.76)#2,665 |
| 47. | Redlands | 3.74% | 8.95%(-5.21)#47 | 11.49%(-7.75)#2,673 |
| 48. | Ouray | 3.77% | 8.95%(-5.18)#48 | 11.49%(-7.71)#2,711 |
| 49. | Superior | 3.83% | 8.95%(-5.12)#49 | 11.49%(-7.66)#2,761 |
| 50. | Mancos | 3.87% | 8.95%(-5.08)#50 | 11.49%(-7.61)#2,828 |
| 51. | Sterling Ranch | 3.95% | 8.95%(-4.99)#51 | 11.49%(-7.53)#2,930 |
| 52. | Walden | 4.00% | 8.95%(-4.95)#52 | 11.49%(-7.49)#2,975 |
| 53. | Green Mountain Falls | 4.03% | 8.95%(-4.92)#53 | 11.49%(-7.46)#3,025 |
| 54. | Johnstown | 4.09% | 8.95%(-4.86)#54 | 11.49%(-7.39)#3,110 |
| 55. | Naturita | 4.12% | 8.95%(-4.83)#55 | 11.49%(-7.36)#3,145 |
| 56. | Frisco | 4.22% | 8.95%(-4.73)#56 | 11.49%(-7.27)#3,251 |
| 57. | Hayden | 4.24% | 8.95%(-4.71)#57 | 11.49%(-7.25)#3,265 |
| 58. | Black Forest | 4.38% | 8.95%(-4.57)#58 | 11.49%(-7.11)#3,440 |
| 59. | Castle Pines | 4.40% | 8.95%(-4.55)#59 | 11.49%(-7.09)#3,466 |
| 60. | Grand View Estates | 4.42% | 8.95%(-4.52)#60 | 11.49%(-7.06)#3,487 |
| 61. | Lyons | 4.43% | 8.95%(-4.52)#61 | 11.49%(-7.06)#3,490 |
| 62. | Sierra Ridge | 4.44% | 8.95%(-4.51)#62 | 11.49%(-7.05)#3,501 |
| 63. | Mead | 4.47% | 8.95%(-4.48)#63 | 11.49%(-7.02)#3,535 |
| 64. | Lone Tree | 4.62% | 8.95%(-4.33)#64 | 11.49%(-6.87)#3,719 |
| 65. | Berthoud | 4.64% | 8.95%(-4.31)#65 | 11.49%(-6.85)#3,740 |
| 66. | Greenwood Village | 4.66% | 8.95%(-4.29)#66 | 11.49%(-6.83)#3,763 |
| 67. | Leadville North | 4.68% | 8.95%(-4.27)#67 | 11.49%(-6.80)#3,801 |
| 68. | Gunbarrel | 4.73% | 8.95%(-4.22)#68 | 11.49%(-6.76)#3,855 |
| 69. | Shaw Heights | 4.74% | 8.95%(-4.21)#69 | 11.49%(-6.75)#3,875 |
| 70. | Avondale | 4.76% | 8.95%(-4.19)#70 | 11.49%(-6.73)#3,905 |
| 71. | Starkville | 4.88% | 8.95%(-4.07)#71 | 11.49%(-6.61)#4,048 |
| 72. | Evergreen | 4.94% | 8.95%(-4.01)#72 | 11.49%(-6.55)#4,121 |
| 73. | Columbine | 4.96% | 8.95%(-3.99)#73 | 11.49%(-6.52)#4,139 |
| 74. | Collbran | 5.06% | 8.95%(-3.89)#74 | 11.49%(-6.42)#4,266 |
| 75. | Applewood | 5.10% | 8.95%(-3.85)#75 | 11.49%(-6.38)#4,317 |
| 76. | Orchard City | 5.11% | 8.95%(-3.84)#76 | 11.49%(-6.38)#4,319 |
| 77. | Lochbuie | 5.19% | 8.95%(-3.76)#77 | 11.49%(-6.30)#4,403 |
| 78. | Stonegate | 5.27% | 8.95%(-3.68)#78 | 11.49%(-6.22)#4,511 |
| 79. | Fruitvale | 5.28% | 8.95%(-3.67)#79 | 11.49%(-6.21)#4,522 |
| 80. | Estes Park | 5.29% | 8.95%(-3.66)#80 | 11.49%(-6.20)#4,528 |
| 81. | Castle Rock | 5.29% | 8.95%(-3.66)#81 | 11.49%(-6.20)#4,533 |
| 82. | Gypsum | 5.31% | 8.95%(-3.64)#82 | 11.49%(-6.18)#4,545 |
| 83. | Ridgway | 5.32% | 8.95%(-3.63)#83 | 11.49%(-6.17)#4,555 |
| 84. | Stratton | 5.43% | 8.95%(-3.51)#84 | 11.49%(-6.05)#4,705 |
| 85. | Cherry Creek | 5.44% | 8.95%(-3.51)#85 | 11.49%(-6.05)#4,710 |
| 86. | Dakota Ridge | 5.47% | 8.95%(-3.48)#86 | 11.49%(-6.02)#4,730 |
| 87. | Empire | 5.49% | 8.95%(-3.46)#87 | 11.49%(-5.99)#4,769 |
| 88. | Kiowa | 5.51% | 8.95%(-3.44)#88 | 11.49%(-5.98)#4,794 |
| 89. | Cheyenne Wells | 5.60% | 8.95%(-3.35)#89 | 11.49%(-5.89)#4,905 |
| 90. | Ault | 5.69% | 8.95%(-3.26)#90 | 11.49%(-5.79)#5,014 |
| 91. | Poncha Springs | 5.76% | 8.95%(-3.19)#91 | 11.49%(-5.73)#5,086 |
| 92. | Aspen Park | 5.88% | 8.95%(-3.07)#92 | 11.49%(-5.60)#5,252 |
| 93. | Sedgwick | 5.88% | 8.95%(-3.07)#93 | 11.49%(-5.60)#5,274 |
| 94. | Louisville | 5.92% | 8.95%(-3.03)#94 | 11.49%(-5.56)#5,317 |
| 95. | Nederland | 5.97% | 8.95%(-2.98)#95 | 11.49%(-5.52)#5,365 |
| 96. | Lincoln Park | 5.98% | 8.95%(-2.97)#96 | 11.49%(-5.51)#5,384 |
| 97. | Crested Butte | 6.02% | 8.95%(-2.93)#97 | 11.49%(-5.47)#5,421 |
| 98. | Highlands Ranch | 6.03% | 8.95%(-2.92)#98 | 11.49%(-5.45)#5,444 |
| 99. | Firestone | 6.05% | 8.95%(-2.90)#99 | 11.49%(-5.43)#5,475 |
| 100. | Sugar City | 6.10% | 8.95%(-2.85)#100 | 11.49%(-5.39)#5,534 |
Common Questions
What are the Top 10 Cities with the Lowest Percentage of Single Mothers in Colorado?
Top 10 Cities with the Lowest Percentage of Single Mothers in Colorado are:
#1
0.48%
#2
0.79%
#3
0.82%
#4
0.90%
#5
0.93%
#6
0.98%
#7
1.01%
#8
1.19%
#9
1.22%
#10
1.30%
What city has the Lowest Percentage of Single Mothers in Colorado?
Columbine Valley has the Lowest Percentage of Single Mothers in Colorado with 0.48%.
What is the Percentage of Single Mothers in the State of Colorado?
Percentage of Single Mothers in Colorado is 8.95%.
What is the Percentage of Single Mothers in the United States?
Percentage of Single Mothers in the United States is 11.49%.