Cities with the Most Immigrants from Bahamas in Florida
RELATED REPORTS & OPTIONS
Bahamas
Florida
Compare Cities
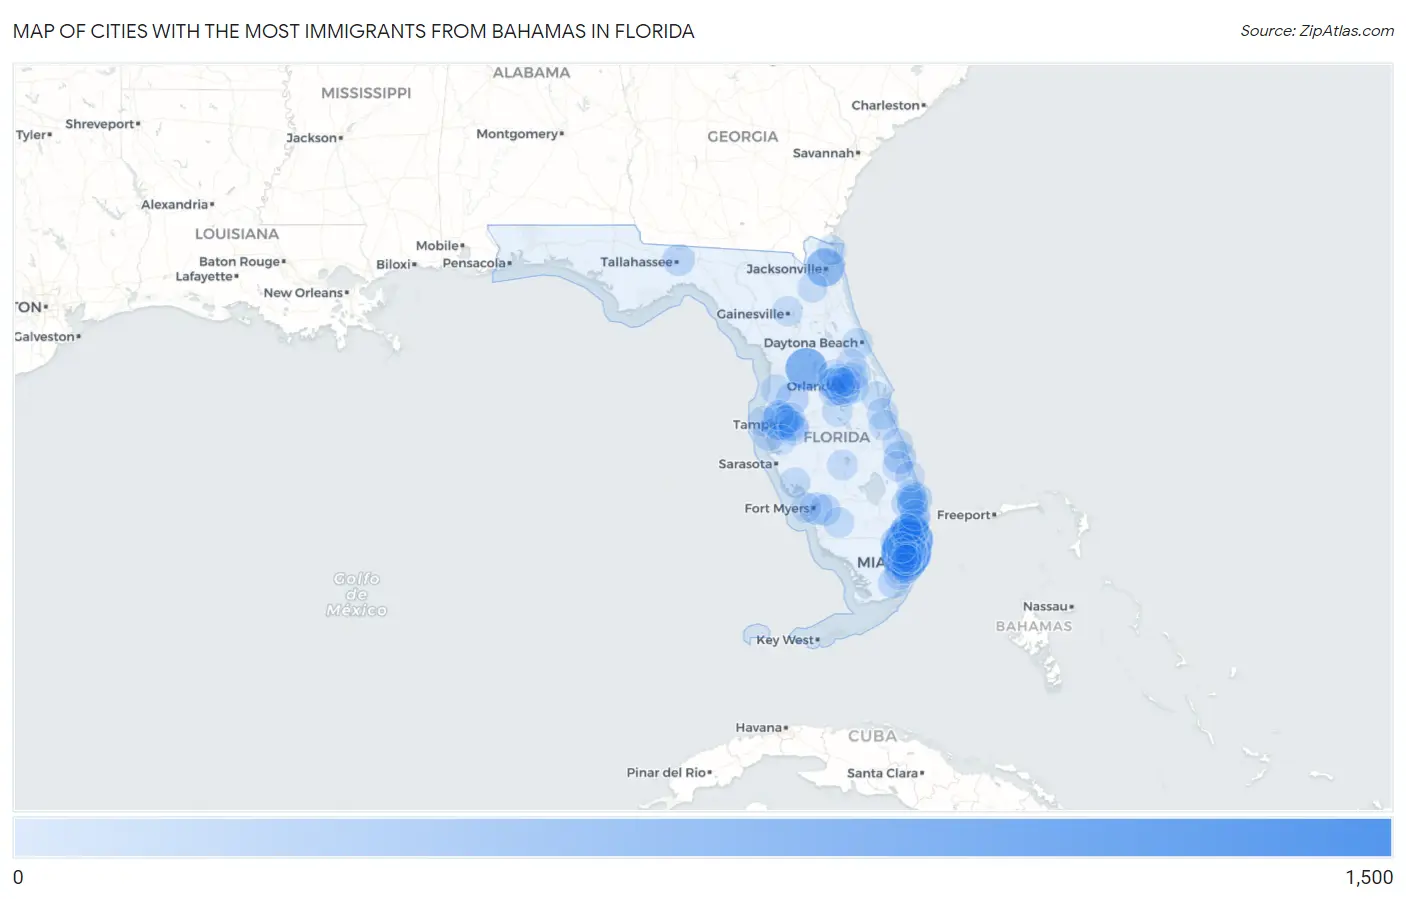
Map of Cities with the Most Immigrants from Bahamas in Florida
0
1,500
Cities with the Most Immigrants from Bahamas in Florida
| City | Bahamas | vs State | vs National | |
| 1. | Miami Gardens | 1,208 | 17,749(6.81%)#1 | 35,359(3.42%)#2 |
| 2. | Fort Lauderdale | 829 | 17,749(4.67%)#2 | 35,359(2.34%)#3 |
| 3. | Wildwood | 705 | 17,749(3.97%)#3 | 35,359(1.99%)#4 |
| 4. | Hollywood | 527 | 17,749(2.97%)#4 | 35,359(1.49%)#5 |
| 5. | Tamarac | 516 | 17,749(2.91%)#5 | 35,359(1.46%)#6 |
| 6. | Lauderhill | 510 | 17,749(2.87%)#6 | 35,359(1.44%)#7 |
| 7. | North Miami | 502 | 17,749(2.83%)#7 | 35,359(1.42%)#8 |
| 8. | Jacksonville | 499 | 17,749(2.81%)#8 | 35,359(1.41%)#9 |
| 9. | Miami | 416 | 17,749(2.34%)#9 | 35,359(1.18%)#11 |
| 10. | Tampa | 415 | 17,749(2.34%)#10 | 35,359(1.17%)#12 |
| 11. | Golden Glades | 414 | 17,749(2.33%)#11 | 35,359(1.17%)#13 |
| 12. | Miramar | 368 | 17,749(2.07%)#12 | 35,359(1.04%)#15 |
| 13. | Sunrise | 347 | 17,749(1.96%)#13 | 35,359(0.98%)#17 |
| 14. | North Miami Beach | 264 | 17,749(1.49%)#14 | 35,359(0.75%)#18 |
| 15. | Pompano Beach | 239 | 17,749(1.35%)#15 | 35,359(0.68%)#20 |
| 16. | North Lauderdale | 234 | 17,749(1.32%)#16 | 35,359(0.66%)#21 |
| 17. | Broadview Park | 230 | 17,749(1.30%)#17 | 35,359(0.65%)#23 |
| 18. | Weston | 217 | 17,749(1.22%)#18 | 35,359(0.61%)#25 |
| 19. | Orlando | 207 | 17,749(1.17%)#19 | 35,359(0.59%)#26 |
| 20. | Coral Springs | 189 | 17,749(1.06%)#20 | 35,359(0.53%)#30 |
| 21. | Pine Hills | 180 | 17,749(1.01%)#21 | 35,359(0.51%)#31 |
| 22. | Fort Myers | 166 | 17,749(0.94%)#22 | 35,359(0.47%)#33 |
| 23. | St Leo | 166 | 17,749(0.94%)#23 | 35,359(0.47%)#34 |
| 24. | Oakland Park | 165 | 17,749(0.93%)#24 | 35,359(0.47%)#36 |
| 25. | Fort Pierce | 160 | 17,749(0.90%)#25 | 35,359(0.45%)#38 |
| 26. | Royal Palm Beach | 146 | 17,749(0.82%)#26 | 35,359(0.41%)#40 |
| 27. | Riviera Beach | 146 | 17,749(0.82%)#27 | 35,359(0.41%)#41 |
| 28. | Pinewood | 141 | 17,749(0.79%)#28 | 35,359(0.40%)#42 |
| 29. | Tallahassee | 131 | 17,749(0.74%)#29 | 35,359(0.37%)#45 |
| 30. | Gladeview | 129 | 17,749(0.73%)#30 | 35,359(0.36%)#46 |
| 31. | Ives Estates | 128 | 17,749(0.72%)#31 | 35,359(0.36%)#48 |
| 32. | West Palm Beach | 125 | 17,749(0.70%)#32 | 35,359(0.35%)#49 |
| 33. | Alafaya | 125 | 17,749(0.70%)#33 | 35,359(0.35%)#50 |
| 34. | St Petersburg | 124 | 17,749(0.70%)#34 | 35,359(0.35%)#52 |
| 35. | East Lake Orient Park | 119 | 17,749(0.67%)#35 | 35,359(0.34%)#55 |
| 36. | Homestead | 114 | 17,749(0.64%)#36 | 35,359(0.32%)#57 |
| 37. | Lauderdale Lakes | 108 | 17,749(0.61%)#37 | 35,359(0.31%)#61 |
| 38. | Lehigh Acres | 100 | 17,749(0.56%)#38 | 35,359(0.28%)#64 |
| 39. | Delray Beach | 93 | 17,749(0.52%)#39 | 35,359(0.26%)#68 |
| 40. | Brandon | 91 | 17,749(0.51%)#40 | 35,359(0.26%)#71 |
| 41. | Daytona Beach | 90 | 17,749(0.51%)#41 | 35,359(0.25%)#74 |
| 42. | Apopka | 90 | 17,749(0.51%)#42 | 35,359(0.25%)#75 |
| 43. | Melbourne | 89 | 17,749(0.50%)#43 | 35,359(0.25%)#76 |
| 44. | Dania Beach | 86 | 17,749(0.48%)#44 | 35,359(0.24%)#77 |
| 45. | Fish Hawk | 86 | 17,749(0.48%)#45 | 35,359(0.24%)#78 |
| 46. | Davie | 85 | 17,749(0.48%)#46 | 35,359(0.24%)#79 |
| 47. | Spring Hill | 81 | 17,749(0.46%)#47 | 35,359(0.23%)#81 |
| 48. | Plantation Mobile Home Park | 80 | 17,749(0.45%)#48 | 35,359(0.23%)#82 |
| 49. | Lake Worth Beach | 71 | 17,749(0.40%)#49 | 35,359(0.20%)#91 |
| 50. | Boulevard Gardens | 71 | 17,749(0.40%)#50 | 35,359(0.20%)#92 |
| 51. | Oviedo | 70 | 17,749(0.39%)#51 | 35,359(0.20%)#96 |
| 52. | Poinciana | 69 | 17,749(0.39%)#52 | 35,359(0.20%)#97 |
| 53. | Liberty Triangle | 63 | 17,749(0.35%)#53 | 35,359(0.18%)#110 |
| 54. | Westview | 62 | 17,749(0.35%)#54 | 35,359(0.18%)#113 |
| 55. | Immokalee | 61 | 17,749(0.34%)#55 | 35,359(0.17%)#115 |
| 56. | Ojus | 61 | 17,749(0.34%)#56 | 35,359(0.17%)#117 |
| 57. | North Port | 54 | 17,749(0.30%)#57 | 35,359(0.15%)#126 |
| 58. | Palm Beach Gardens | 54 | 17,749(0.30%)#58 | 35,359(0.15%)#127 |
| 59. | Ocoee | 54 | 17,749(0.30%)#59 | 35,359(0.15%)#128 |
| 60. | Lake Placid | 53 | 17,749(0.30%)#60 | 35,359(0.15%)#131 |
| 61. | Vero Beach | 51 | 17,749(0.29%)#61 | 35,359(0.14%)#133 |
| 62. | Deerfield Beach | 50 | 17,749(0.28%)#62 | 35,359(0.14%)#135 |
| 63. | Gainesville | 49 | 17,749(0.28%)#63 | 35,359(0.14%)#138 |
| 64. | Port St Lucie | 48 | 17,749(0.27%)#64 | 35,359(0.14%)#139 |
| 65. | Oak Ridge | 48 | 17,749(0.27%)#65 | 35,359(0.14%)#140 |
| 66. | Bay Hill | 48 | 17,749(0.27%)#66 | 35,359(0.14%)#141 |
| 67. | Palm Bay | 47 | 17,749(0.26%)#67 | 35,359(0.13%)#143 |
| 68. | Westchester | 47 | 17,749(0.26%)#68 | 35,359(0.13%)#144 |
| 69. | Margate | 45 | 17,749(0.25%)#69 | 35,359(0.13%)#149 |
| 70. | Kendall | 44 | 17,749(0.25%)#70 | 35,359(0.12%)#153 |
| 71. | Miami Lakes | 44 | 17,749(0.25%)#71 | 35,359(0.12%)#155 |
| 72. | Boca Raton | 43 | 17,749(0.24%)#72 | 35,359(0.12%)#157 |
| 73. | Valrico | 43 | 17,749(0.24%)#73 | 35,359(0.12%)#159 |
| 74. | Cape Coral | 42 | 17,749(0.24%)#74 | 35,359(0.12%)#161 |
| 75. | Clearwater | 39 | 17,749(0.22%)#75 | 35,359(0.11%)#171 |
| 76. | South Miami Heights | 39 | 17,749(0.22%)#76 | 35,359(0.11%)#174 |
| 77. | Boynton Beach | 36 | 17,749(0.20%)#77 | 35,359(0.10%)#180 |
| 78. | University Cdp Hillsborough County | 35 | 17,749(0.20%)#78 | 35,359(0.10%)#185 |
| 79. | Lake Magdalene | 35 | 17,749(0.20%)#79 | 35,359(0.10%)#186 |
| 80. | Deltona | 34 | 17,749(0.19%)#80 | 35,359(0.10%)#189 |
| 81. | University Cdp Orange County | 33 | 17,749(0.19%)#81 | 35,359(0.09%)#192 |
| 82. | Middleburg | 31 | 17,749(0.17%)#82 | 35,359(0.09%)#198 |
| 83. | West Park | 30 | 17,749(0.17%)#83 | 35,359(0.08%)#201 |
| 84. | Miami Shores | 30 | 17,749(0.17%)#84 | 35,359(0.08%)#202 |
| 85. | Coral Gables | 29 | 17,749(0.16%)#85 | 35,359(0.08%)#206 |
| 86. | Thonotosassa | 29 | 17,749(0.16%)#86 | 35,359(0.08%)#207 |
| 87. | Conway | 29 | 17,749(0.16%)#87 | 35,359(0.08%)#208 |
| 88. | Parkland | 27 | 17,749(0.15%)#88 | 35,359(0.08%)#217 |
| 89. | Ruskin | 27 | 17,749(0.15%)#89 | 35,359(0.08%)#219 |
| 90. | Geneva | 27 | 17,749(0.15%)#90 | 35,359(0.08%)#221 |
| 91. | West Little River | 26 | 17,749(0.15%)#91 | 35,359(0.07%)#224 |
| 92. | Forest City | 25 | 17,749(0.14%)#92 | 35,359(0.07%)#232 |
| 93. | Goldenrod | 24 | 17,749(0.14%)#93 | 35,359(0.07%)#237 |
| 94. | Port Salerno | 24 | 17,749(0.14%)#94 | 35,359(0.07%)#238 |
| 95. | Fairview Shores | 23 | 17,749(0.13%)#95 | 35,359(0.07%)#245 |
| 96. | Cocoa | 22 | 17,749(0.12%)#96 | 35,359(0.06%)#252 |
| 97. | Brownsville | 22 | 17,749(0.12%)#97 | 35,359(0.06%)#253 |
| 98. | Yulee | 22 | 17,749(0.12%)#98 | 35,359(0.06%)#254 |
| 99. | Hialeah | 21 | 17,749(0.12%)#99 | 35,359(0.06%)#256 |
| 100. | Pembroke Pines | 21 | 17,749(0.12%)#100 | 35,359(0.06%)#257 |
Common Questions
What are the Top 10 Cities with the Most Immigrants from Bahamas in Florida?
Top 10 Cities with the Most Immigrants from Bahamas in Florida are:
#1
1,208
#2
829
#3
705
#4
527
#5
516
#6
510
#7
502
#8
499
#9
416
#10
415
What city has the Most Immigrants from Bahamas in Florida?
Miami Gardens has the Most Immigrants from Bahamas in Florida with 1,208.
What is the Total Immigrants from Bahamas in the State of Florida?
Total Immigrants from Bahamas in Florida is 17,749.
What is the Total Immigrants from Bahamas in the United States?
Total Immigrants from Bahamas in the United States is 35,359.