Fort Pierce, FL
Fort Pierce Map
Fort Pierce Overview
47,153
TOTAL POPULATION
22,833
MALE POPULATION
24,320
FEMALE POPULATION
93.89
MALES / 100 FEMALES
106.51
FEMALES / 100 MALES
38.4
MEDIAN AGE
3.3
AVG FAMILY SIZE
2.6
AVG HOUSEHOLD SIZE
$23,834
PER CAPITA INCOME
$53,288
AVG FAMILY INCOME
$45,121
AVG HOUSEHOLD INCOME
32.2%
WAGE / INCOME GAP [ % ]
67.8¢/ $1
WAGE / INCOME GAP [ $ ]
$12,930
FAMILY INCOME DEFICIT
0.47
INEQUALITY / GINI INDEX
20,065
LABOR FORCE [ PEOPLE ]
53.9%
PERCENT IN LABOR FORCE
10.4%
UNEMPLOYMENT RATE
Fort Pierce Area Codes
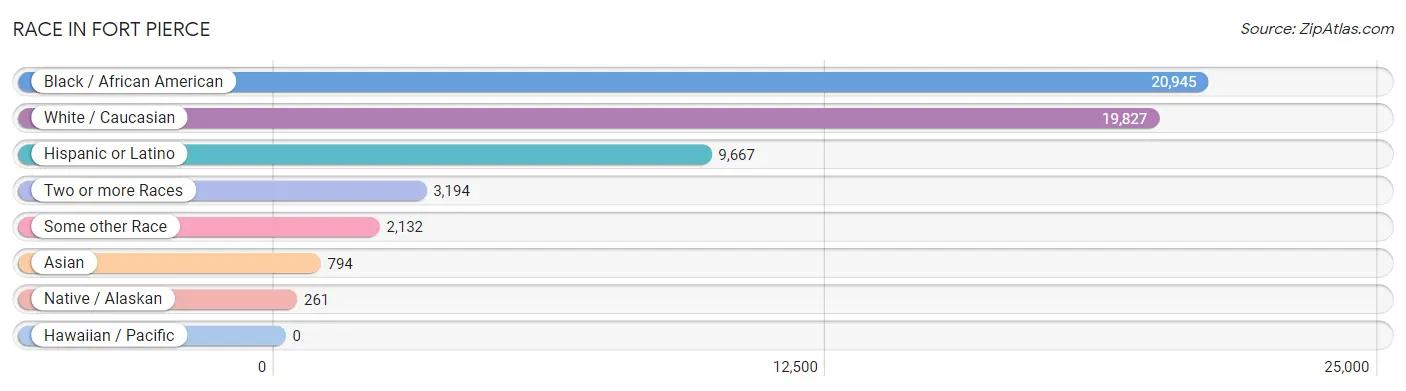
Race in Fort Pierce
The most populous races in Fort Pierce are Black / African American (20,945 | 44.4%), White / Caucasian (19,827 | 42.0%), and Hispanic or Latino (9,667 | 20.5%).
| Race | # Population | % Population |
| Asian | 794 | 1.7% |
| Black / African American | 20,945 | 44.4% |
| Hawaiian / Pacific | 0 | 0.0% |
| Hispanic or Latino | 9,667 | 20.5% |
| Native / Alaskan | 261 | 0.5% |
| White / Caucasian | 19,827 | 42.0% |
| Two or more Races | 3,194 | 6.8% |
| Some other Race | 2,132 | 4.5% |
| Total | 47,153 | 100.0% |
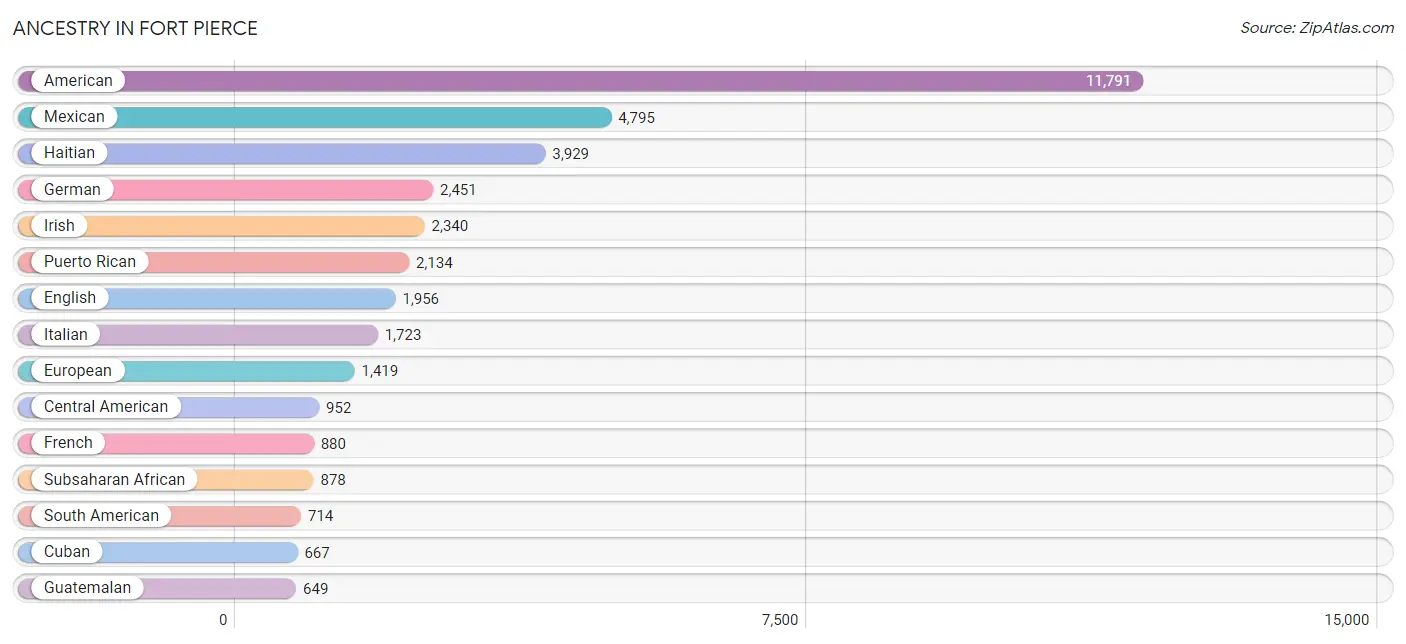
Ancestry in Fort Pierce
The most populous ancestries reported in Fort Pierce are American (11,791 | 25.0%), Mexican (4,795 | 10.2%), Haitian (3,929 | 8.3%), German (2,451 | 5.2%), and Irish (2,340 | 5.0%), together accounting for 53.7% of all Fort Pierce residents.
| Ancestry | # Population | % Population |
| African | 287 | 0.6% |
| Alaskan Athabascan | 15 | 0.0% |
| American | 11,791 | 25.0% |
| Arab | 8 | 0.0% |
| Argentinean | 66 | 0.1% |
| Austrian | 132 | 0.3% |
| Bahamian | 262 | 0.6% |
| Basque | 14 | 0.0% |
| Bhutanese | 37 | 0.1% |
| Blackfeet | 40 | 0.1% |
| Brazilian | 78 | 0.2% |
| British | 142 | 0.3% |
| British West Indian | 18 | 0.0% |
| Canadian | 59 | 0.1% |
| Cape Verdean | 9 | 0.0% |
| Central American | 952 | 2.0% |
| Central American Indian | 174 | 0.4% |
| Cherokee | 32 | 0.1% |
| Colombian | 77 | 0.2% |
| Creek | 8 | 0.0% |
| Cuban | 667 | 1.4% |
| Danish | 57 | 0.1% |
| Dominican | 229 | 0.5% |
| Dutch | 135 | 0.3% |
| Eastern European | 49 | 0.1% |
| Ecuadorian | 31 | 0.1% |
| English | 1,956 | 4.2% |
| European | 1,419 | 3.0% |
| Finnish | 6 | 0.0% |
| French | 880 | 1.9% |
| French American Indian | 17 | 0.0% |
| French Canadian | 242 | 0.5% |
| German | 2,451 | 5.2% |
| Greek | 12 | 0.0% |
| Guatemalan | 649 | 1.4% |
| Guyanese | 29 | 0.1% |
| Haitian | 3,929 | 8.3% |
| Honduran | 69 | 0.2% |
| Hungarian | 111 | 0.2% |
| Icelander | 10 | 0.0% |
| Indian (Asian) | 19 | 0.0% |
| Iranian | 34 | 0.1% |
| Irish | 2,340 | 5.0% |
| Iroquois | 22 | 0.1% |
| Italian | 1,723 | 3.6% |
| Jamaican | 589 | 1.3% |
| Japanese | 8 | 0.0% |
| Korean | 57 | 0.1% |
| Lebanese | 8 | 0.0% |
| Lithuanian | 38 | 0.1% |
| Lumbee | 8 | 0.0% |
| Maltese | 16 | 0.0% |
| Mexican | 4,795 | 10.2% |
| Nicaraguan | 21 | 0.0% |
| Nigerian | 494 | 1.1% |
| Northern European | 32 | 0.1% |
| Norwegian | 272 | 0.6% |
| Pakistani | 39 | 0.1% |
| Panamanian | 95 | 0.2% |
| Peruvian | 231 | 0.5% |
| Polish | 608 | 1.3% |
| Portuguese | 43 | 0.1% |
| Puerto Rican | 2,134 | 4.5% |
| Romanian | 22 | 0.1% |
| Russian | 109 | 0.2% |
| Salvadoran | 118 | 0.3% |
| Scotch-Irish | 124 | 0.3% |
| Scottish | 355 | 0.7% |
| Sioux | 67 | 0.1% |
| Slavic | 47 | 0.1% |
| South African | 54 | 0.1% |
| South American | 714 | 1.5% |
| Spaniard | 130 | 0.3% |
| Spanish | 25 | 0.1% |
| Subsaharan African | 878 | 1.9% |
| Swedish | 201 | 0.4% |
| Swiss | 18 | 0.0% |
| Thai | 360 | 0.8% |
| Trinidadian and Tobagonian | 248 | 0.5% |
| Turkish | 28 | 0.1% |
| U.S. Virgin Islander | 12 | 0.0% |
| Uruguayan | 22 | 0.1% |
| Venezuelan | 287 | 0.6% |
| Welsh | 191 | 0.4% |
| West Indian | 51 | 0.1% | View All 85 Rows |
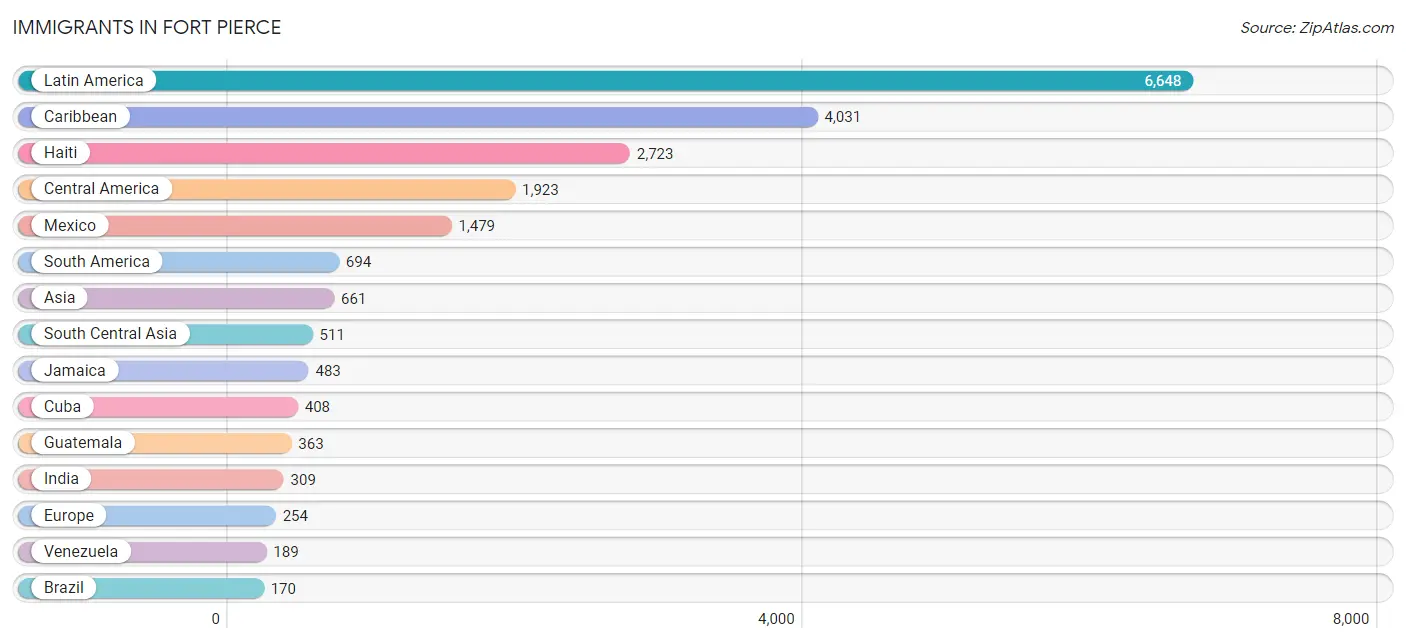
Immigrants in Fort Pierce
The most numerous immigrant groups reported in Fort Pierce came from Latin America (6,648 | 14.1%), Caribbean (4,031 | 8.6%), Haiti (2,723 | 5.8%), Central America (1,923 | 4.1%), and Mexico (1,479 | 3.1%), together accounting for 35.6% of all Fort Pierce residents.
| Immigration Origin | # Population | % Population |
| Africa | 70 | 0.2% |
| Argentina | 17 | 0.0% |
| Asia | 661 | 1.4% |
| Bahamas | 160 | 0.3% |
| Bolivia | 15 | 0.0% |
| Brazil | 170 | 0.4% |
| Canada | 88 | 0.2% |
| Caribbean | 4,031 | 8.6% |
| Central America | 1,923 | 4.1% |
| Chile | 105 | 0.2% |
| China | 19 | 0.0% |
| Colombia | 25 | 0.1% |
| Cuba | 408 | 0.9% |
| Dominica | 12 | 0.0% |
| Dominican Republic | 124 | 0.3% |
| Eastern Africa | 30 | 0.1% |
| Eastern Asia | 19 | 0.0% |
| Eastern Europe | 19 | 0.0% |
| Ecuador | 31 | 0.1% |
| El Salvador | 22 | 0.1% |
| England | 16 | 0.0% |
| Europe | 254 | 0.5% |
| France | 92 | 0.2% |
| Germany | 65 | 0.1% |
| Guatemala | 363 | 0.8% |
| Guyana | 29 | 0.1% |
| Haiti | 2,723 | 5.8% |
| Honduras | 59 | 0.1% |
| India | 309 | 0.7% |
| Iran | 69 | 0.2% |
| Jamaica | 483 | 1.0% |
| Kenya | 16 | 0.0% |
| Latin America | 6,648 | 14.1% |
| Mexico | 1,479 | 3.1% |
| Netherlands | 13 | 0.0% |
| Northern Europe | 64 | 0.1% |
| Pakistan | 133 | 0.3% |
| Peru | 95 | 0.2% |
| Philippines | 75 | 0.2% |
| Poland | 19 | 0.0% |
| Scotland | 39 | 0.1% |
| South Africa | 40 | 0.1% |
| South America | 694 | 1.5% |
| South Central Asia | 511 | 1.1% |
| South Eastern Asia | 114 | 0.2% |
| Southern Europe | 1 | 0.0% |
| Spain | 1 | 0.0% |
| Thailand | 39 | 0.1% |
| Trinidad and Tobago | 84 | 0.2% |
| Turkey | 17 | 0.0% |
| Uruguay | 18 | 0.0% |
| Venezuela | 189 | 0.4% |
| Western Asia | 17 | 0.0% |
| Western Europe | 170 | 0.4% |
| Zimbabwe | 14 | 0.0% | View All 55 Rows |
Sex and Age in Fort Pierce
Sex and Age in Fort Pierce
The most populous age groups in Fort Pierce are 15 to 19 Years (2,039 | 8.9%) for men and Under 5 Years (1,836 | 7.5%) for women.
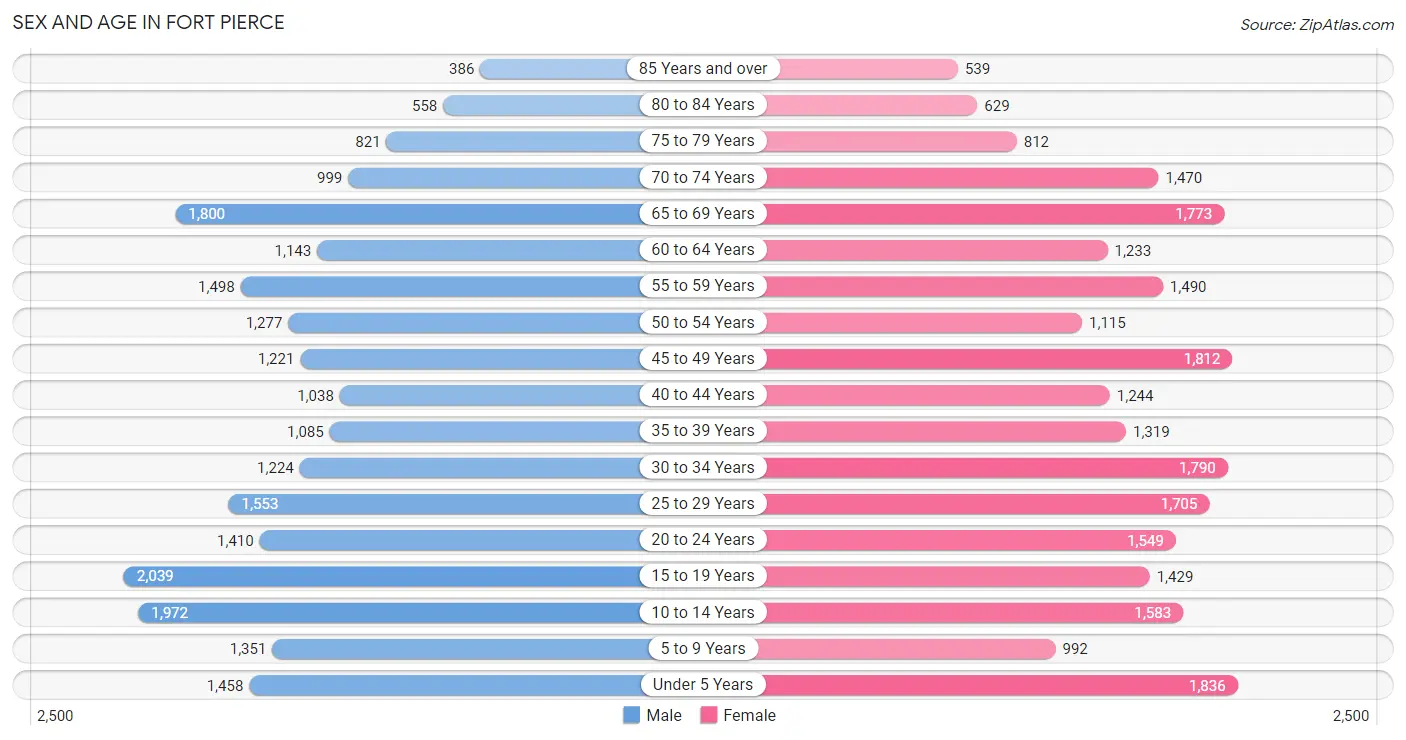
| Age Bracket | Male | Female |
| Under 5 Years | 1,458 (6.4%) | 1,836 (7.5%) |
| 5 to 9 Years | 1,351 (5.9%) | 992 (4.1%) |
| 10 to 14 Years | 1,972 (8.6%) | 1,583 (6.5%) |
| 15 to 19 Years | 2,039 (8.9%) | 1,429 (5.9%) |
| 20 to 24 Years | 1,410 (6.2%) | 1,549 (6.4%) |
| 25 to 29 Years | 1,553 (6.8%) | 1,705 (7.0%) |
| 30 to 34 Years | 1,224 (5.4%) | 1,790 (7.4%) |
| 35 to 39 Years | 1,085 (4.8%) | 1,319 (5.4%) |
| 40 to 44 Years | 1,038 (4.5%) | 1,244 (5.1%) |
| 45 to 49 Years | 1,221 (5.3%) | 1,812 (7.4%) |
| 50 to 54 Years | 1,277 (5.6%) | 1,115 (4.6%) |
| 55 to 59 Years | 1,498 (6.6%) | 1,490 (6.1%) |
| 60 to 64 Years | 1,143 (5.0%) | 1,233 (5.1%) |
| 65 to 69 Years | 1,800 (7.9%) | 1,773 (7.3%) |
| 70 to 74 Years | 999 (4.4%) | 1,470 (6.0%) |
| 75 to 79 Years | 821 (3.6%) | 812 (3.3%) |
| 80 to 84 Years | 558 (2.4%) | 629 (2.6%) |
| 85 Years and over | 386 (1.7%) | 539 (2.2%) |
| Total | 22,833 (100.0%) | 24,320 (100.0%) |
Families and Households in Fort Pierce
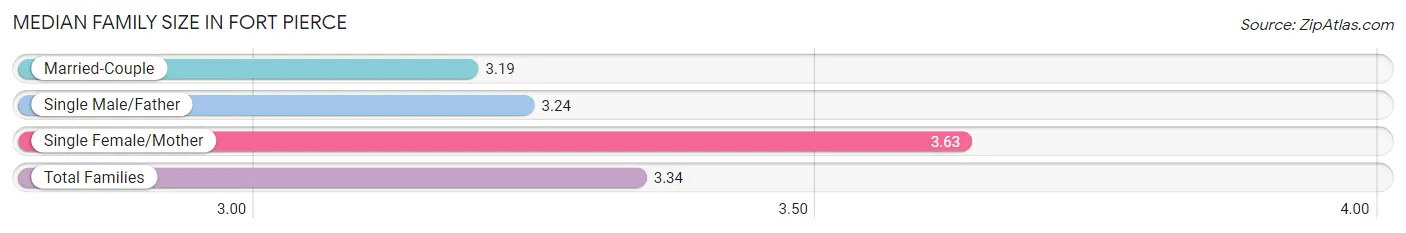
Median Family Size in Fort Pierce
The median family size in Fort Pierce is 3.34 persons per family, with single female/mother families (3,451 | 32.7%) accounting for the largest median family size of 3.63 persons per family. On the other hand, married-couple families (5,978 | 56.7%) represent the smallest median family size with 3.19 persons per family.
| Family Type | # Families | Family Size |
| Married-Couple | 5,978 (56.7%) | 3.19 |
| Single Male/Father | 1,114 (10.6%) | 3.24 |
| Single Female/Mother | 3,451 (32.7%) | 3.63 |
| Total Families | 10,543 (100.0%) | 3.34 |
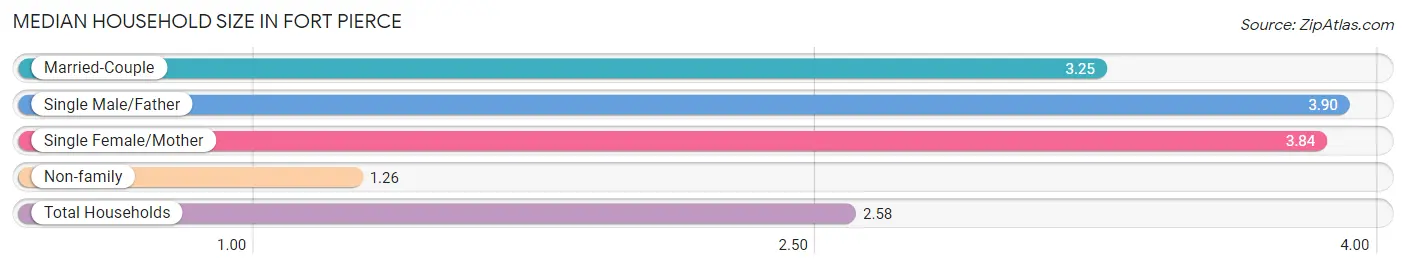
Median Household Size in Fort Pierce
The median household size in Fort Pierce is 2.58 persons per household, with single male/father households (1,114 | 6.2%) accounting for the largest median household size of 3.9 persons per household. non-family households (7,428 | 41.3%) represent the smallest median household size with 1.26 persons per household.
| Household Type | # Households | Household Size |
| Married-Couple | 5,978 (33.3%) | 3.25 |
| Single Male/Father | 1,114 (6.2%) | 3.90 |
| Single Female/Mother | 3,451 (19.2%) | 3.84 |
| Non-family | 7,428 (41.3%) | 1.26 |
| Total Households | 17,971 (100.0%) | 2.58 |
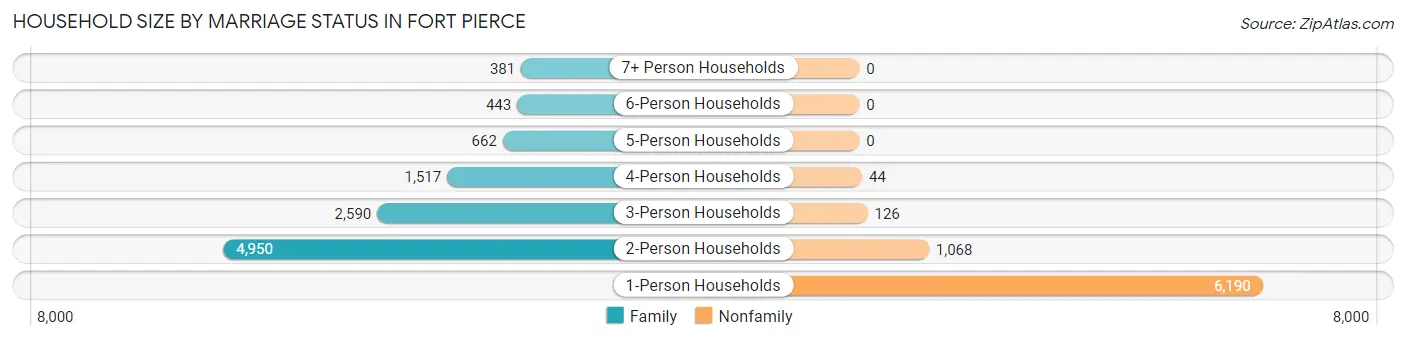
Household Size by Marriage Status in Fort Pierce
Out of a total of 17,971 households in Fort Pierce, 10,543 (58.7%) are family households, while 7,428 (41.3%) are nonfamily households. The most numerous type of family households are 2-person households, comprising 4,950, and the most common type of nonfamily households are 1-person households, comprising 6,190.
| Household Size | Family Households | Nonfamily Households |
| 1-Person Households | - | 6,190 (34.4%) |
| 2-Person Households | 4,950 (27.5%) | 1,068 (5.9%) |
| 3-Person Households | 2,590 (14.4%) | 126 (0.7%) |
| 4-Person Households | 1,517 (8.4%) | 44 (0.2%) |
| 5-Person Households | 662 (3.7%) | 0 (0.0%) |
| 6-Person Households | 443 (2.5%) | 0 (0.0%) |
| 7+ Person Households | 381 (2.1%) | 0 (0.0%) |
| Total | 10,543 (58.7%) | 7,428 (41.3%) |
Female Fertility in Fort Pierce
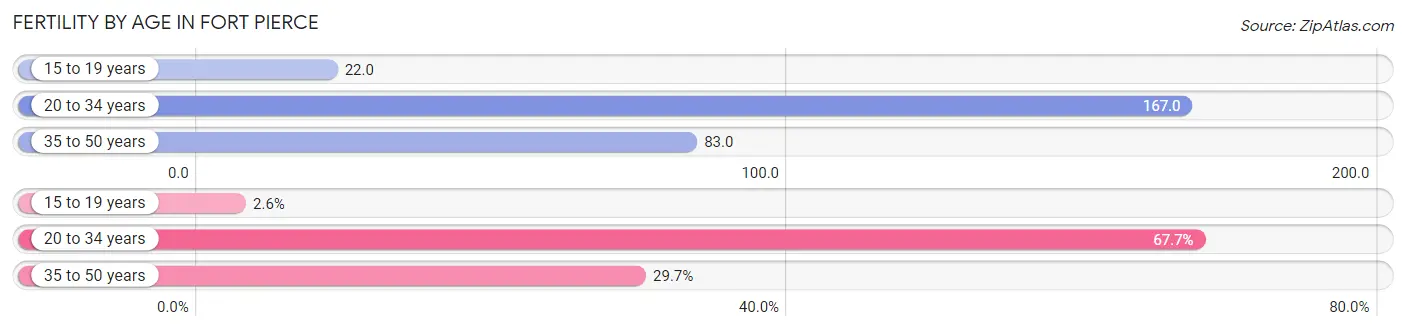
Fertility by Age in Fort Pierce
Average fertility rate in Fort Pierce is 114.0 births per 1,000 women. Women in the age bracket of 20 to 34 years have the highest fertility rate with 167.0 births per 1,000 women. Women in the age bracket of 20 to 34 years acount for 67.7% of all women with births.
| Age Bracket | Women with Births | Births / 1,000 Women |
| 15 to 19 years | 32 (2.6%) | 22.0 |
| 20 to 34 years | 840 (67.7%) | 167.0 |
| 35 to 50 years | 369 (29.7%) | 83.0 |
| Total | 1,241 (100.0%) | 114.0 |
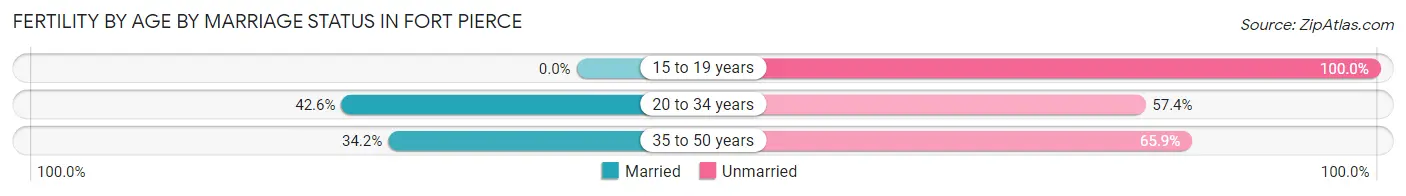
Fertility by Age by Marriage Status in Fort Pierce
39.0% of women with births (1,241) in Fort Pierce are married. The highest percentage of unmarried women with births falls into 15 to 19 years age bracket with 100.0% of them unmarried at the time of birth, while the lowest percentage of unmarried women with births belong to 20 to 34 years age bracket with 57.4% of them unmarried.
| Age Bracket | Married | Unmarried |
| 15 to 19 years | 0 (0.0%) | 32 (100.0%) |
| 20 to 34 years | 358 (42.6%) | 482 (57.4%) |
| 35 to 50 years | 126 (34.2%) | 243 (65.8%) |
| Total | 484 (39.0%) | 757 (61.0%) |
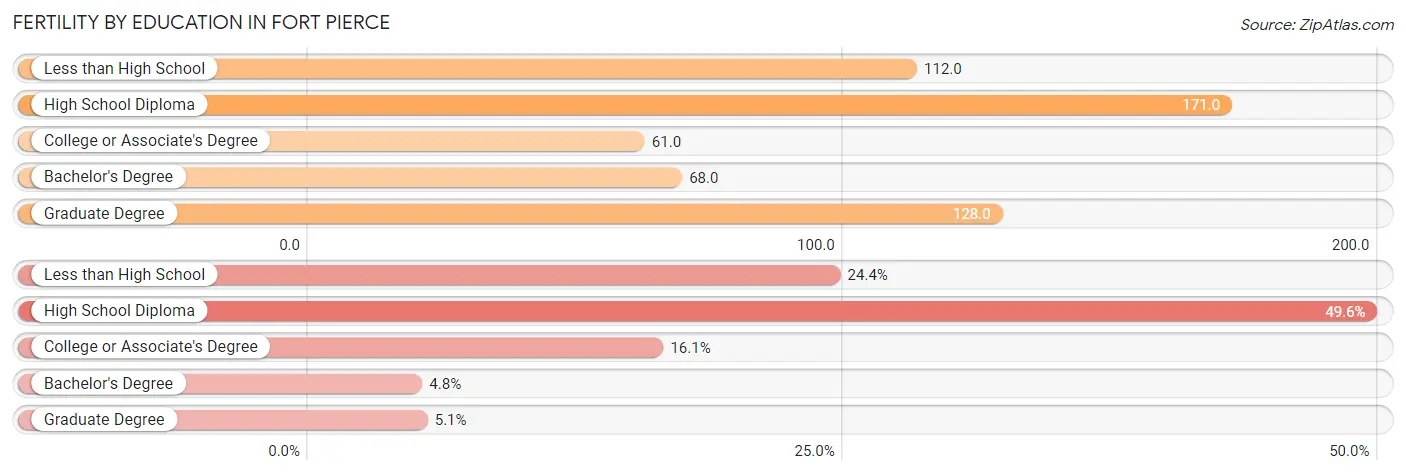
Fertility by Education in Fort Pierce
Average fertility rate in Fort Pierce is 114.0 births per 1,000 women. Women with the education attainment of high school diploma have the highest fertility rate of 171.0 births per 1,000 women, while women with the education attainment of college or associate's degree have the lowest fertility at 61.0 births per 1,000 women. Women with the education attainment of high school diploma represent 49.6% of all women with births.
| Educational Attainment | Women with Births | Births / 1,000 Women |
| Less than High School | 303 (24.4%) | 112.0 |
| High School Diploma | 615 (49.6%) | 171.0 |
| College or Associate's Degree | 200 (16.1%) | 61.0 |
| Bachelor's Degree | 60 (4.8%) | 68.0 |
| Graduate Degree | 63 (5.1%) | 128.0 |
| Total | 1,241 (100.0%) | 114.0 |
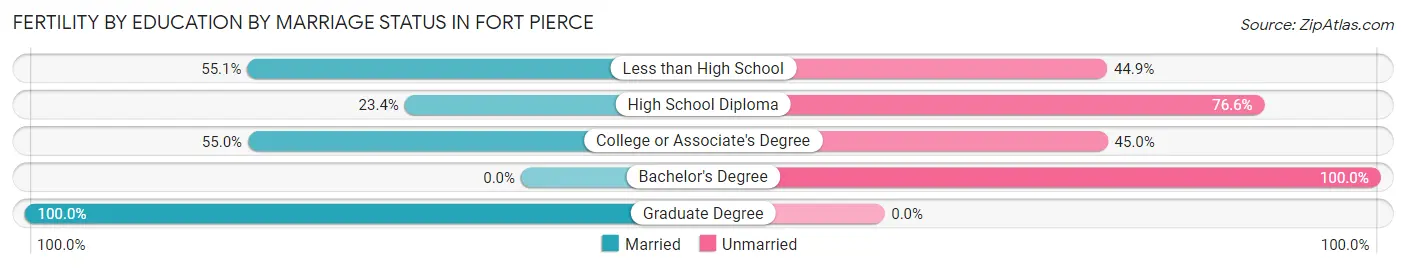
Fertility by Education by Marriage Status in Fort Pierce
61.0% of women with births in Fort Pierce are unmarried. Women with the educational attainment of graduate degree are most likely to be married with 100.0% of them married at childbirth, while women with the educational attainment of bachelor's degree are least likely to be married with 100.0% of them unmarried at childbirth.
| Educational Attainment | Married | Unmarried |
| Less than High School | 167 (55.1%) | 136 (44.9%) |
| High School Diploma | 144 (23.4%) | 471 (76.6%) |
| College or Associate's Degree | 110 (55.0%) | 90 (45.0%) |
| Bachelor's Degree | 0 (0.0%) | 60 (100.0%) |
| Graduate Degree | 63 (100.0%) | 0 (0.0%) |
| Total | 484 (39.0%) | 757 (61.0%) |
Income in Fort Pierce
Income Overview in Fort Pierce
Per Capita Income in Fort Pierce is $23,834, while median incomes of families and households are $53,288 and $45,121 respectively.
| Characteristic | Number | Measure |
| Per Capita Income | 47,153 | $23,834 |
| Median Family Income | 10,543 | $53,288 |
| Mean Family Income | 10,543 | $64,348 |
| Median Household Income | 17,971 | $45,121 |
| Mean Household Income | 17,971 | $58,317 |
| Income Deficit | 10,543 | $12,930 |
| Wage / Income Gap (%) | 47,153 | 32.16% |
| Wage / Income Gap ($) | 47,153 | 67.84¢ per $1 |
| Gini / Inequality Index | 47,153 | 0.47 |
Earnings by Sex in Fort Pierce
Average Earnings in Fort Pierce are $28,537, $33,720 for men and $22,877 for women, a difference of 32.2%.
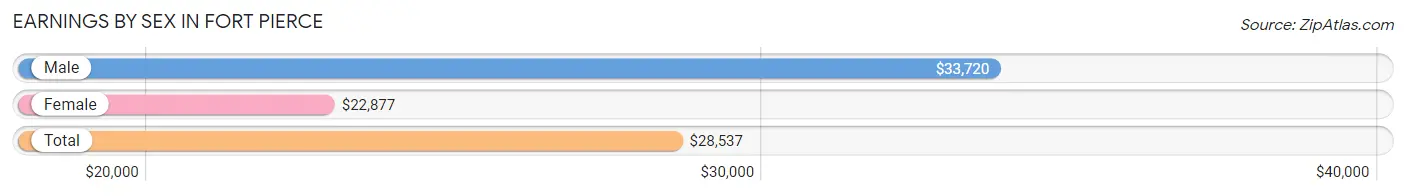
| Sex | Number | Average Earnings |
| Male | 10,040 (50.4%) | $33,720 |
| Female | 9,859 (49.5%) | $22,877 |
| Total | 19,899 (100.0%) | $28,537 |
Earnings by Sex by Income Bracket in Fort Pierce
The most common earnings brackets in Fort Pierce are $25,000 to $29,999 for men (1,260 | 12.6%) and $10,000 to $12,499 for women (951 | 9.7%).
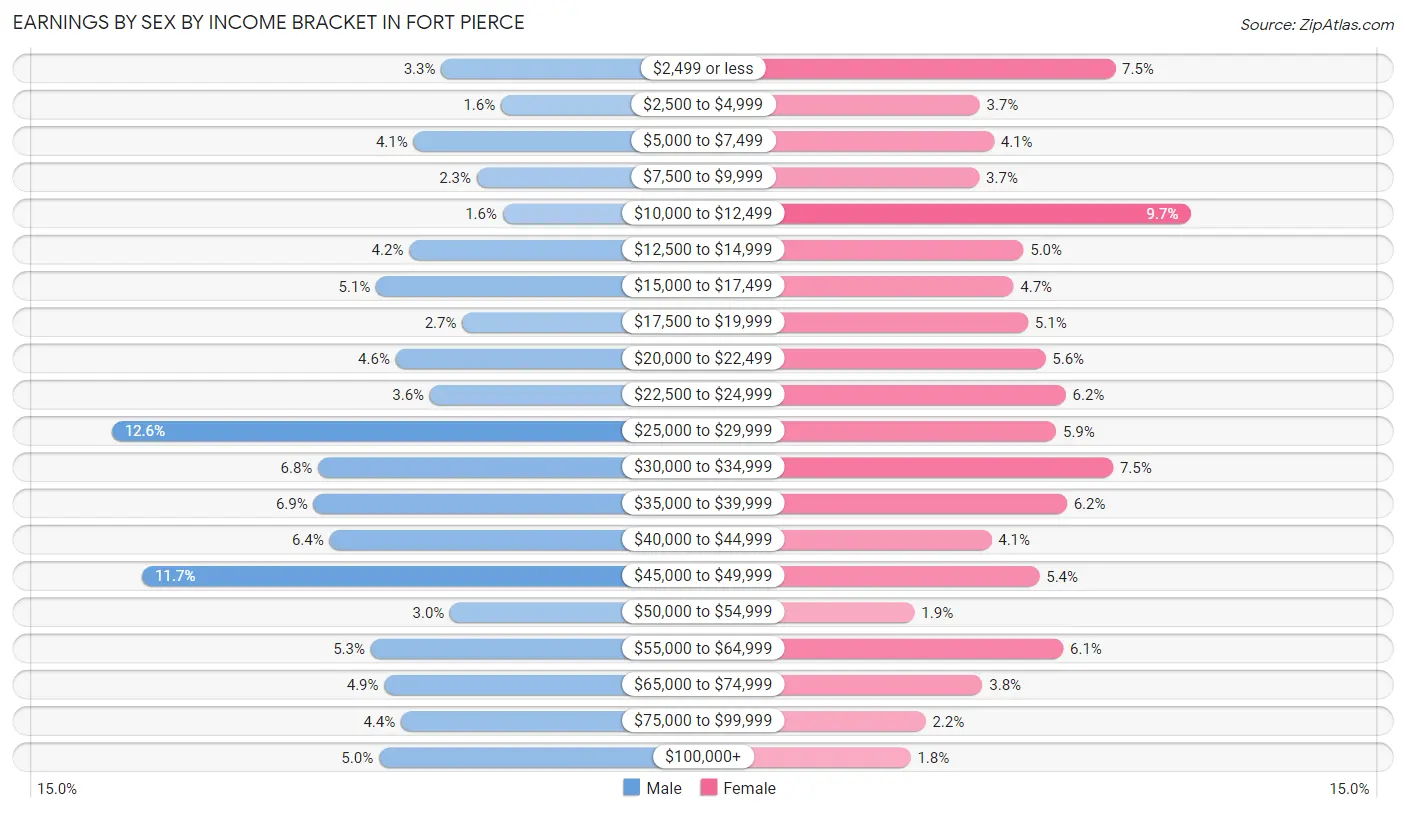
| Income | Male | Female |
| $2,499 or less | 330 (3.3%) | 743 (7.5%) |
| $2,500 to $4,999 | 162 (1.6%) | 368 (3.7%) |
| $5,000 to $7,499 | 409 (4.1%) | 407 (4.1%) |
| $7,500 to $9,999 | 230 (2.3%) | 367 (3.7%) |
| $10,000 to $12,499 | 157 (1.6%) | 951 (9.7%) |
| $12,500 to $14,999 | 421 (4.2%) | 489 (5.0%) |
| $15,000 to $17,499 | 514 (5.1%) | 461 (4.7%) |
| $17,500 to $19,999 | 271 (2.7%) | 502 (5.1%) |
| $20,000 to $22,499 | 459 (4.6%) | 550 (5.6%) |
| $22,500 to $24,999 | 362 (3.6%) | 606 (6.1%) |
| $25,000 to $29,999 | 1,260 (12.6%) | 580 (5.9%) |
| $30,000 to $34,999 | 678 (6.8%) | 737 (7.5%) |
| $35,000 to $39,999 | 691 (6.9%) | 609 (6.2%) |
| $40,000 to $44,999 | 646 (6.4%) | 400 (4.1%) |
| $45,000 to $49,999 | 1,175 (11.7%) | 533 (5.4%) |
| $50,000 to $54,999 | 305 (3.0%) | 187 (1.9%) |
| $55,000 to $64,999 | 529 (5.3%) | 599 (6.1%) |
| $65,000 to $74,999 | 491 (4.9%) | 376 (3.8%) |
| $75,000 to $99,999 | 444 (4.4%) | 218 (2.2%) |
| $100,000+ | 506 (5.0%) | 176 (1.8%) |
| Total | 10,040 (100.0%) | 9,859 (100.0%) |
Earnings by Sex by Educational Attainment in Fort Pierce
Average earnings in Fort Pierce are $36,455 for men and $24,840 for women, a difference of 31.9%. Men with an educational attainment of graduate degree enjoy the highest average annual earnings of $54,515, while those with college or associate's degree education earn the least with $29,202. Women with an educational attainment of graduate degree earn the most with the average annual earnings of $52,799, while those with high school diploma education have the smallest earnings of $18,268.
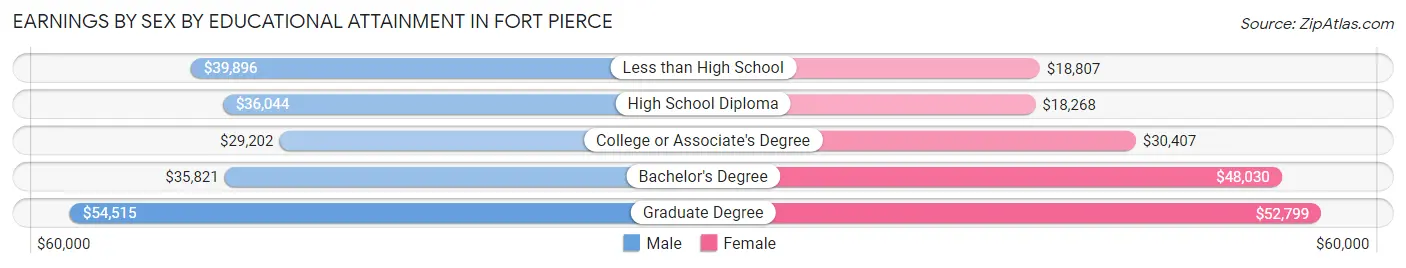
| Educational Attainment | Male Income | Female Income |
| Less than High School | $39,896 | $18,807 |
| High School Diploma | $36,044 | $18,268 |
| College or Associate's Degree | $29,202 | $30,407 |
| Bachelor's Degree | $35,821 | $48,030 |
| Graduate Degree | $54,515 | $52,799 |
| Total | $36,455 | $24,840 |
Family Income in Fort Pierce
Family Income Brackets in Fort Pierce
According to the Fort Pierce family income data, there are 2,667 families falling into the $50,000 to $74,999 income range, which is the most common income bracket and makes up 25.3% of all families. Conversely, the $200,000+ income bracket is the least frequent group with only 295 families (2.8%) belonging to this category.
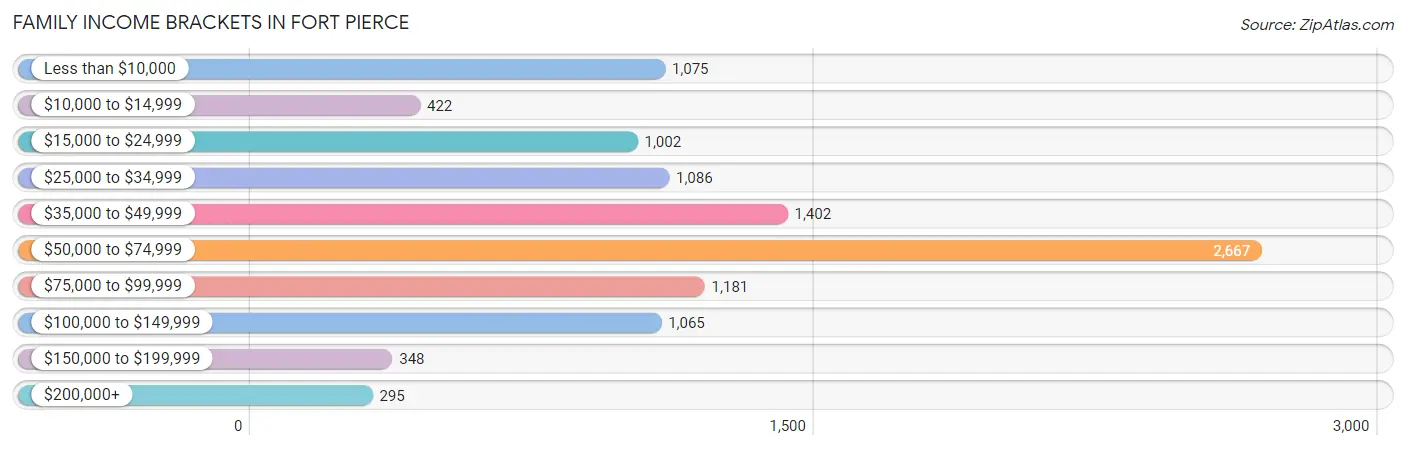
| Income Bracket | # Families | % Families |
| Less than $10,000 | 1,075 | 10.2% |
| $10,000 to $14,999 | 422 | 4.0% |
| $15,000 to $24,999 | 1,002 | 9.5% |
| $25,000 to $34,999 | 1,086 | 10.3% |
| $35,000 to $49,999 | 1,402 | 13.3% |
| $50,000 to $74,999 | 2,667 | 25.3% |
| $75,000 to $99,999 | 1,181 | 11.2% |
| $100,000 to $149,999 | 1,065 | 10.1% |
| $150,000 to $199,999 | 348 | 3.3% |
| $200,000+ | 295 | 2.8% |
Family Income by Famaliy Size in Fort Pierce
6-person families (287 | 2.7%) account for the highest median family income in Fort Pierce with $73,432 per family, while 2-person families (5,543 | 52.6%) have the highest median income of $28,828 per family member.
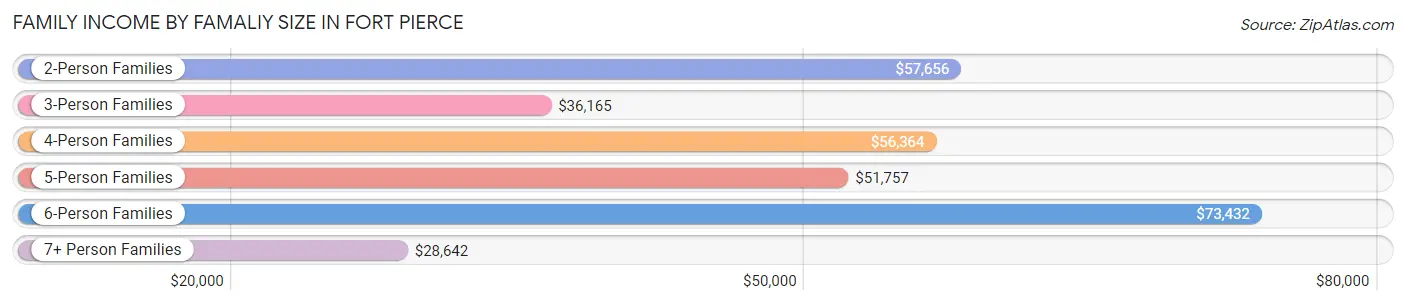
| Income Bracket | # Families | Median Income |
| 2-Person Families | 5,543 (52.6%) | $57,656 |
| 3-Person Families | 2,328 (22.1%) | $36,165 |
| 4-Person Families | 1,306 (12.4%) | $56,364 |
| 5-Person Families | 746 (7.1%) | $51,757 |
| 6-Person Families | 287 (2.7%) | $73,432 |
| 7+ Person Families | 333 (3.2%) | $28,642 |
| Total | 10,543 (100.0%) | $53,288 |
Family Income by Number of Earners in Fort Pierce
The median family income in Fort Pierce is $53,288, with families comprising 2 earners (2,939) having the highest median family income of $70,774, while families with no earners (2,184) have the lowest median family income of $34,519, accounting for 27.9% and 20.7% of families, respectively.
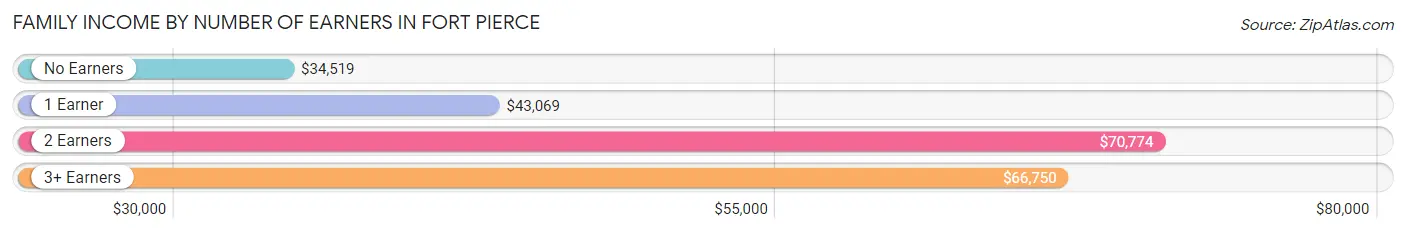
| Number of Earners | # Families | Median Income |
| No Earners | 2,184 (20.7%) | $34,519 |
| 1 Earner | 4,970 (47.1%) | $43,069 |
| 2 Earners | 2,939 (27.9%) | $70,774 |
| 3+ Earners | 450 (4.3%) | $66,750 |
| Total | 10,543 (100.0%) | $53,288 |
Household Income in Fort Pierce
Household Income Brackets in Fort Pierce
With 4,115 households falling in the category, the $50,000 to $74,999 income range is the most frequent in Fort Pierce, accounting for 22.9% of all households. In contrast, only 485 households (2.7%) fall into the $150,000 to $199,999 income bracket, making it the least populous group.
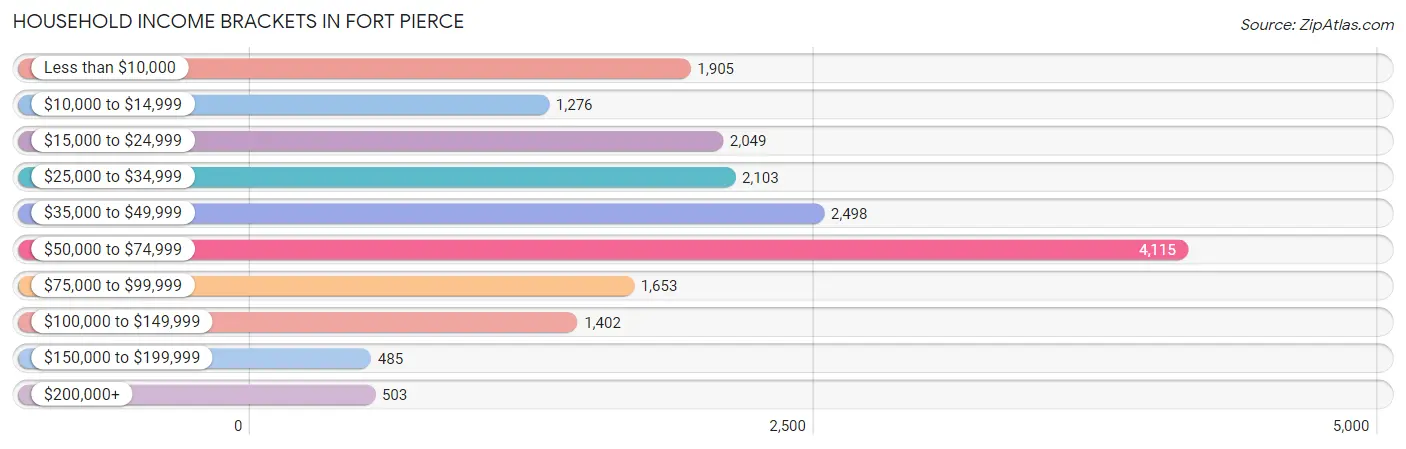
| Income Bracket | # Households | % Households |
| Less than $10,000 | 1,905 | 10.6% |
| $10,000 to $14,999 | 1,276 | 7.1% |
| $15,000 to $24,999 | 2,049 | 11.4% |
| $25,000 to $34,999 | 2,103 | 11.7% |
| $35,000 to $49,999 | 2,498 | 13.9% |
| $50,000 to $74,999 | 4,115 | 22.9% |
| $75,000 to $99,999 | 1,653 | 9.2% |
| $100,000 to $149,999 | 1,402 | 7.8% |
| $150,000 to $199,999 | 485 | 2.7% |
| $200,000+ | 503 | 2.8% |
Household Income by Householder Age in Fort Pierce
The median household income in Fort Pierce is $45,121, with the highest median household income of $50,955 found in the 15 to 24 years age bracket for the primary householder. A total of 707 households (3.9%) fall into this category. Meanwhile, the 25 to 44 years age bracket for the primary householder has the lowest median household income of $39,893, with 4,992 households (27.8%) in this group.
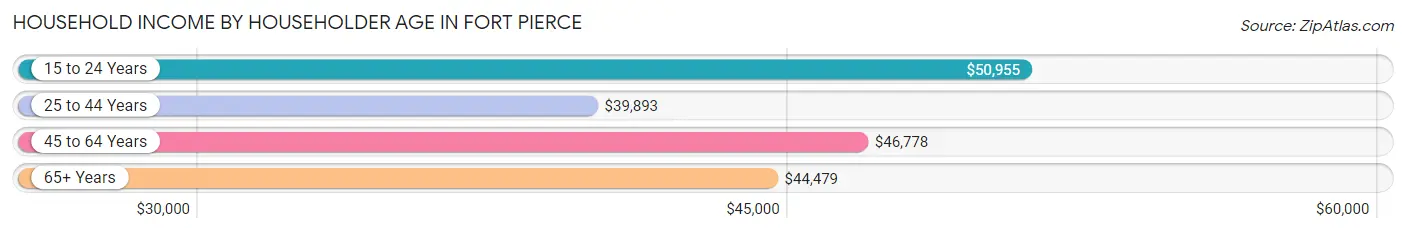
| Income Bracket | # Households | Median Income |
| 15 to 24 Years | 707 (3.9%) | $50,955 |
| 25 to 44 Years | 4,992 (27.8%) | $39,893 |
| 45 to 64 Years | 6,312 (35.1%) | $46,778 |
| 65+ Years | 5,960 (33.2%) | $44,479 |
| Total | 17,971 (100.0%) | $45,121 |
Poverty in Fort Pierce
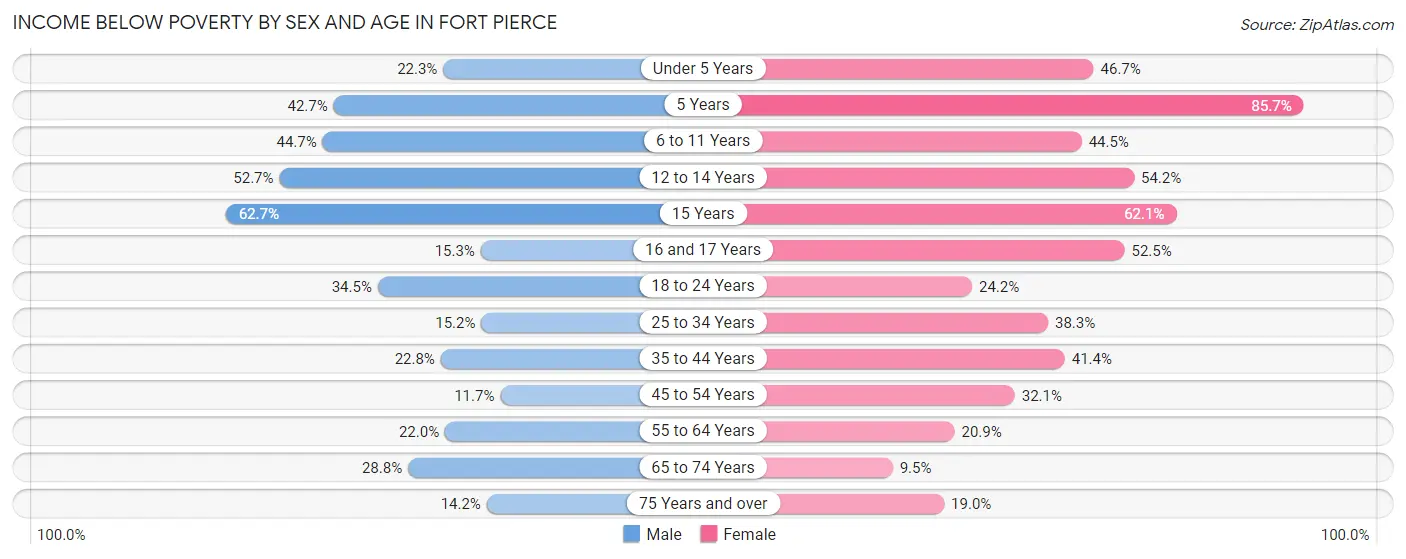
Income Below Poverty by Sex and Age in Fort Pierce
With 25.9% poverty level for males and 32.0% for females among the residents of Fort Pierce, 15 year old males and 5 year old females are the most vulnerable to poverty, with 292 males (62.7%) and 162 females (85.7%) in their respective age groups living below the poverty level.
| Age Bracket | Male | Female |
| Under 5 Years | 322 (22.3%) | 847 (46.7%) |
| 5 Years | 154 (42.7%) | 162 (85.7%) |
| 6 to 11 Years | 745 (44.7%) | 623 (44.5%) |
| 12 to 14 Years | 602 (52.7%) | 518 (54.2%) |
| 15 Years | 292 (62.7%) | 162 (62.1%) |
| 16 and 17 Years | 102 (15.3%) | 318 (52.5%) |
| 18 to 24 Years | 789 (34.4%) | 508 (24.2%) |
| 25 to 34 Years | 420 (15.2%) | 1,338 (38.3%) |
| 35 to 44 Years | 477 (22.8%) | 1,061 (41.4%) |
| 45 to 54 Years | 291 (11.7%) | 937 (32.1%) |
| 55 to 64 Years | 574 (22.0%) | 565 (20.9%) |
| 65 to 74 Years | 790 (28.8%) | 305 (9.5%) |
| 75 Years and over | 235 (14.2%) | 342 (19.0%) |
| Total | 5,793 (25.9%) | 7,686 (32.0%) |
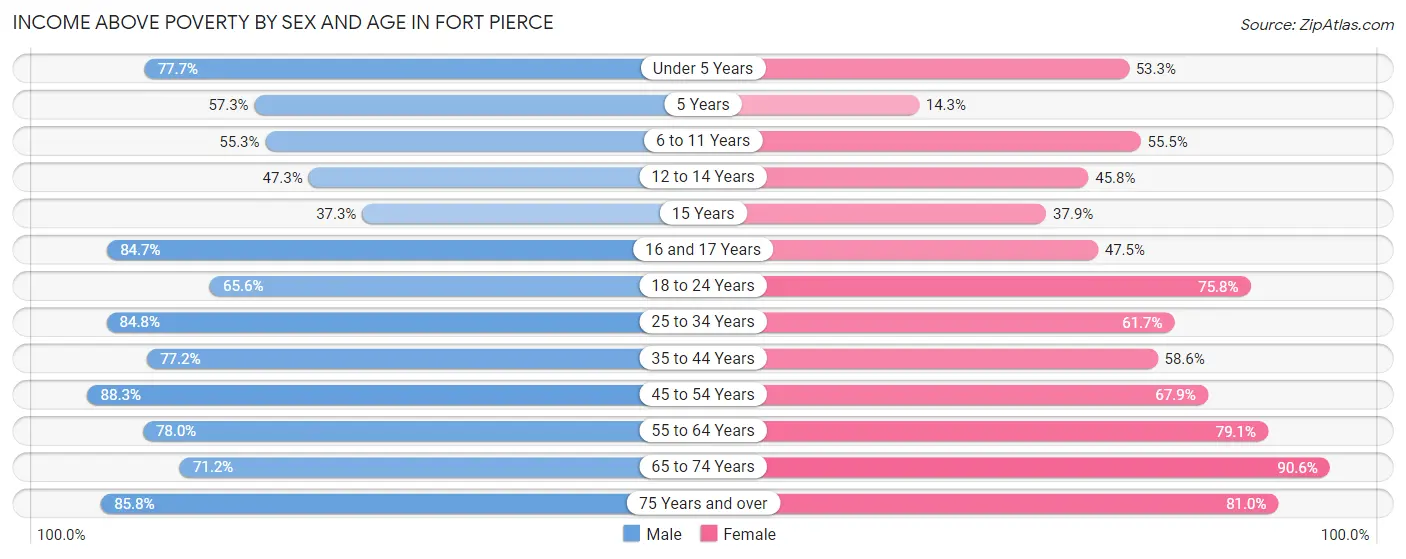
Income Above Poverty by Sex and Age in Fort Pierce
According to the poverty statistics in Fort Pierce, males aged 45 to 54 years and females aged 65 to 74 years are the age groups that are most secure financially, with 88.3% of males and 90.5% of females in these age groups living above the poverty line.
| Age Bracket | Male | Female |
| Under 5 Years | 1,122 (77.7%) | 965 (53.3%) |
| 5 Years | 207 (57.3%) | 27 (14.3%) |
| 6 to 11 Years | 922 (55.3%) | 776 (55.5%) |
| 12 to 14 Years | 540 (47.3%) | 437 (45.8%) |
| 15 Years | 174 (37.3%) | 99 (37.9%) |
| 16 and 17 Years | 563 (84.7%) | 288 (47.5%) |
| 18 to 24 Years | 1,501 (65.5%) | 1,593 (75.8%) |
| 25 to 34 Years | 2,338 (84.8%) | 2,157 (61.7%) |
| 35 to 44 Years | 1,618 (77.2%) | 1,502 (58.6%) |
| 45 to 54 Years | 2,195 (88.3%) | 1,981 (67.9%) |
| 55 to 64 Years | 2,039 (78.0%) | 2,134 (79.1%) |
| 65 to 74 Years | 1,949 (71.2%) | 2,922 (90.5%) |
| 75 Years and over | 1,416 (85.8%) | 1,458 (81.0%) |
| Total | 16,584 (74.1%) | 16,339 (68.0%) |
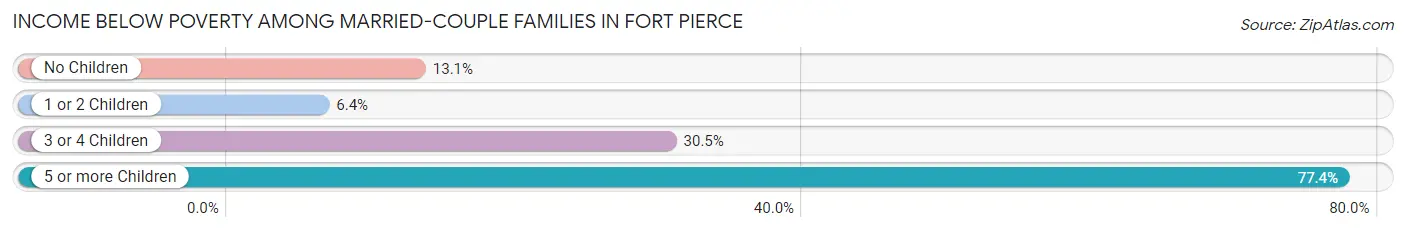
Income Below Poverty Among Married-Couple Families in Fort Pierce
The poverty statistics for married-couple families in Fort Pierce show that 13.6% or 810 of the total 5,978 families live below the poverty line. Families with 5 or more children have the highest poverty rate of 77.4%, comprising of 24 families. On the other hand, families with 1 or 2 children have the lowest poverty rate of 6.4%, which includes 81 families.
| Children | Above Poverty | Below Poverty |
| No Children | 3,595 (86.9%) | 541 (13.1%) |
| 1 or 2 Children | 1,193 (93.6%) | 81 (6.4%) |
| 3 or 4 Children | 373 (69.5%) | 164 (30.5%) |
| 5 or more Children | 7 (22.6%) | 24 (77.4%) |
| Total | 5,168 (86.5%) | 810 (13.6%) |
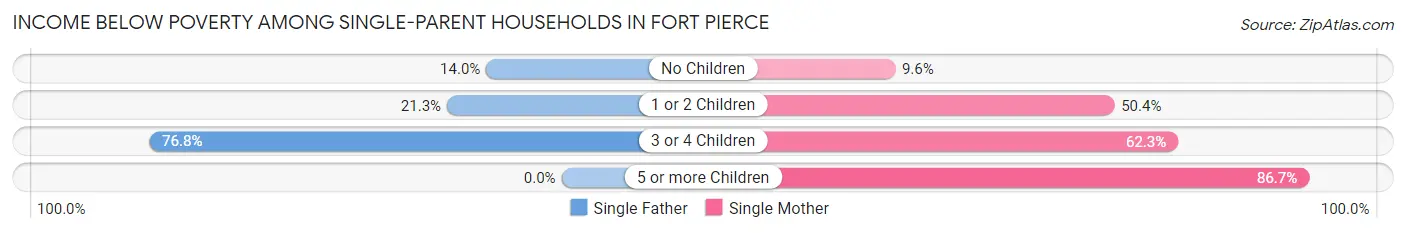
Income Below Poverty Among Single-Parent Households in Fort Pierce
According to the poverty data in Fort Pierce, 24.0% or 267 single-father households and 40.6% or 1,402 single-mother households are living below the poverty line. Among single-father households, those with 3 or 4 children have the highest poverty rate, with 86 households (76.8%) experiencing poverty. Likewise, among single-mother households, those with 5 or more children have the highest poverty rate, with 104 households (86.7%) falling below the poverty line.
| Children | Single Father | Single Mother |
| No Children | 63 (14.0%) | 100 (9.6%) |
| 1 or 2 Children | 118 (21.3%) | 952 (50.4%) |
| 3 or 4 Children | 86 (76.8%) | 246 (62.3%) |
| 5 or more Children | 0 (0.0%) | 104 (86.7%) |
| Total | 267 (24.0%) | 1,402 (40.6%) |
Income Below Poverty Among Married-Couple vs Single-Parent Households in Fort Pierce
The poverty data for Fort Pierce shows that 810 of the married-couple family households (13.6%) and 1,669 of the single-parent households (36.6%) are living below the poverty level. Within the married-couple family households, those with 5 or more children have the highest poverty rate, with 24 households (77.4%) falling below the poverty line. Among the single-parent households, those with 5 or more children have the highest poverty rate, with 104 household (86.7%) living below poverty.
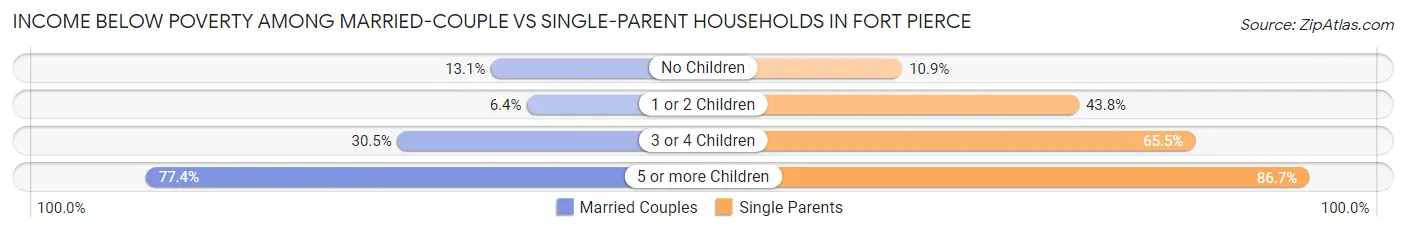
| Children | Married-Couple Families | Single-Parent Households |
| No Children | 541 (13.1%) | 163 (10.9%) |
| 1 or 2 Children | 81 (6.4%) | 1,070 (43.8%) |
| 3 or 4 Children | 164 (30.5%) | 332 (65.5%) |
| 5 or more Children | 24 (77.4%) | 104 (86.7%) |
| Total | 810 (13.6%) | 1,669 (36.6%) |
Employment Characteristics in Fort Pierce
Employment by Class of Employer in Fort Pierce
Among the 17,675 employed individuals in Fort Pierce, private company employees (12,928 | 73.1%), local government employees (1,548 | 8.8%), and not-for-profit organizations (1,103 | 6.2%) make up the most common classes of employment.
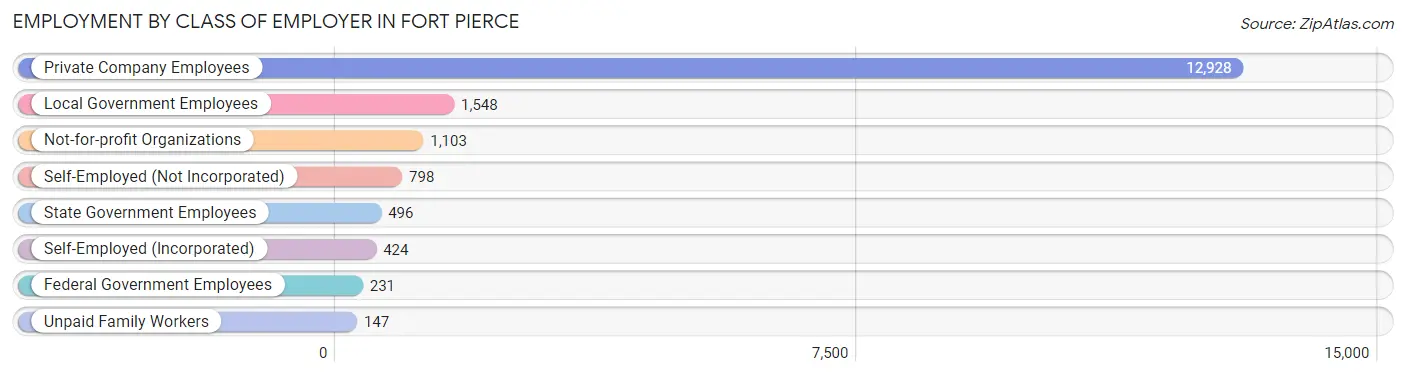
| Employer Class | # Employees | % Employees |
| Private Company Employees | 12,928 | 73.1% |
| Self-Employed (Incorporated) | 424 | 2.4% |
| Self-Employed (Not Incorporated) | 798 | 4.5% |
| Not-for-profit Organizations | 1,103 | 6.2% |
| Local Government Employees | 1,548 | 8.8% |
| State Government Employees | 496 | 2.8% |
| Federal Government Employees | 231 | 1.3% |
| Unpaid Family Workers | 147 | 0.8% |
| Total | 17,675 | 100.0% |
Employment Status by Age in Fort Pierce
According to the labor force statistics for Fort Pierce, out of the total population over 16 years of age (37,227), 53.9% or 20,065 individuals are in the labor force, with 10.4% or 2,087 of them unemployed. The age group with the highest labor force participation rate is 25 to 29 years, with 88.5% or 2,883 individuals in the labor force. Within the labor force, the 75 years and over age range has the highest percentage of unemployed individuals, with 24.8% or 58 of them being unemployed.
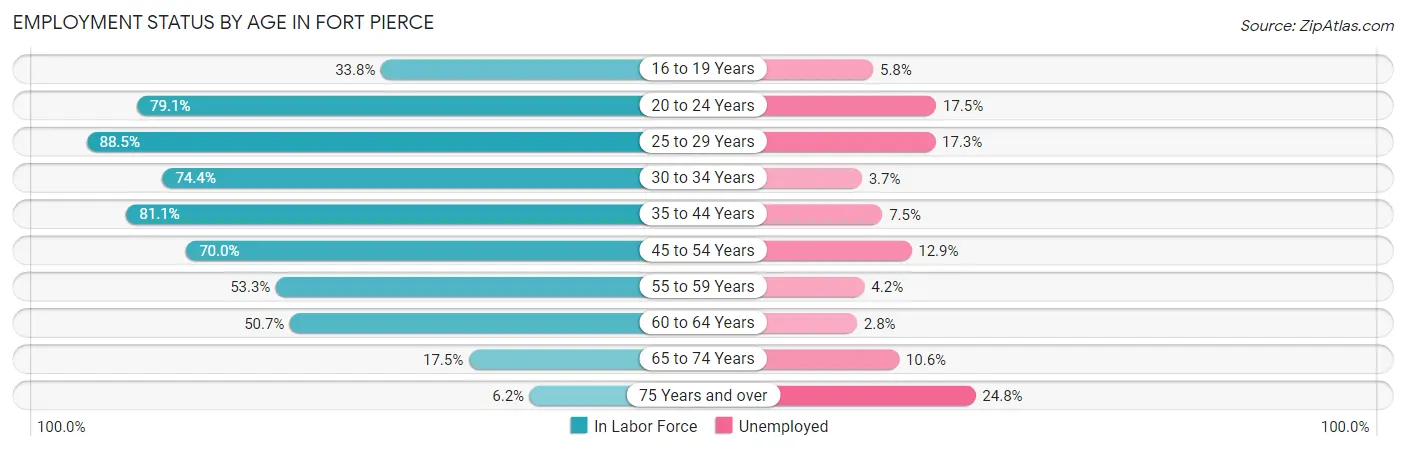
| Age Bracket | In Labor Force | Unemployed |
| 16 to 19 Years | 924 (33.8%) | 54 (5.8%) |
| 20 to 24 Years | 2,341 (79.1%) | 410 (17.5%) |
| 25 to 29 Years | 2,883 (88.5%) | 499 (17.3%) |
| 30 to 34 Years | 2,242 (74.4%) | 83 (3.7%) |
| 35 to 44 Years | 3,800 (81.1%) | 285 (7.5%) |
| 45 to 54 Years | 3,798 (70.0%) | 490 (12.9%) |
| 55 to 59 Years | 1,593 (53.3%) | 67 (4.2%) |
| 60 to 64 Years | 1,205 (50.7%) | 34 (2.8%) |
| 65 to 74 Years | 1,057 (17.5%) | 112 (10.6%) |
| 75 Years and over | 232 (6.2%) | 58 (24.8%) |
| Total | 20,065 (53.9%) | 2,087 (10.4%) |
Employment Status by Educational Attainment in Fort Pierce
According to labor force statistics for Fort Pierce, 71.3% of individuals (15,506) out of the total population between 25 and 64 years of age (21,747) are in the labor force, with 9.4% or 1,458 of them being unemployed. The group with the highest labor force participation rate are those with the educational attainment of bachelor's degree or higher, with 84.1% or 3,053 individuals in the labor force. Within the labor force, individuals with less than high school education have the highest percentage of unemployment, with 25.8% or 594 of them being unemployed.
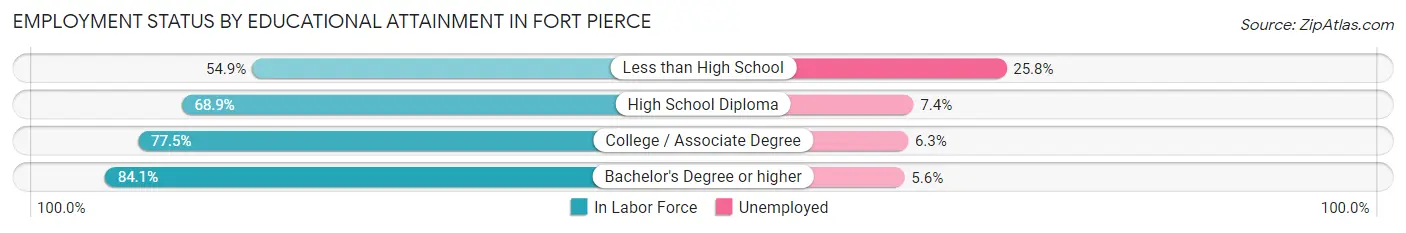
| Educational Attainment | In Labor Force | Unemployed |
| Less than High School | 2,304 (54.9%) | 1,083 (25.8%) |
| High School Diploma | 5,061 (68.9%) | 544 (7.4%) |
| College / Associate Degree | 5,096 (77.5%) | 414 (6.3%) |
| Bachelor's Degree or higher | 3,053 (84.1%) | 203 (5.6%) |
| Total | 15,506 (71.3%) | 2,044 (9.4%) |
Employment Occupations by Sex in Fort Pierce
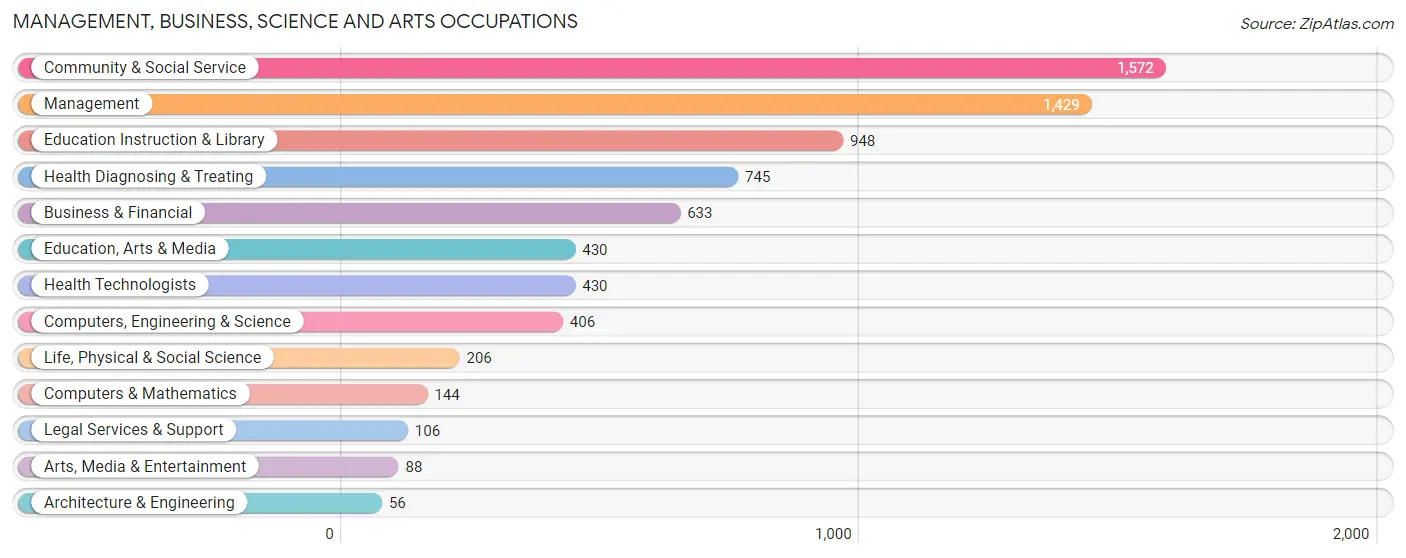
Management, Business, Science and Arts Occupations
The most common Management, Business, Science and Arts occupations in Fort Pierce are Community & Social Service (1,572 | 8.7%), Management (1,429 | 8.0%), Education Instruction & Library (948 | 5.3%), Health Diagnosing & Treating (745 | 4.2%), and Business & Financial (633 | 3.5%).
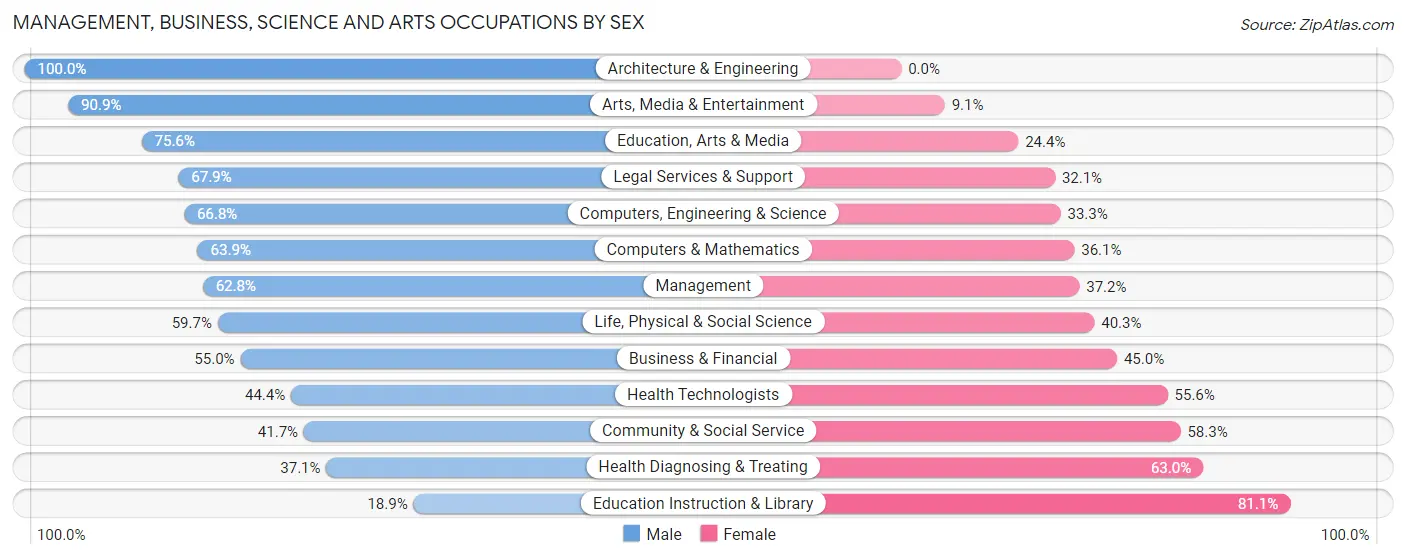
Management, Business, Science and Arts Occupations by Sex
Within the Management, Business, Science and Arts occupations in Fort Pierce, the most male-oriented occupations are Architecture & Engineering (100.0%), Arts, Media & Entertainment (90.9%), and Education, Arts & Media (75.6%), while the most female-oriented occupations are Education Instruction & Library (81.1%), Health Diagnosing & Treating (62.9%), and Community & Social Service (58.3%).
| Occupation | Male | Female |
| Management | 898 (62.8%) | 531 (37.2%) |
| Business & Financial | 348 (55.0%) | 285 (45.0%) |
| Computers, Engineering & Science | 271 (66.7%) | 135 (33.3%) |
| Computers & Mathematics | 92 (63.9%) | 52 (36.1%) |
| Architecture & Engineering | 56 (100.0%) | 0 (0.0%) |
| Life, Physical & Social Science | 123 (59.7%) | 83 (40.3%) |
| Community & Social Service | 656 (41.7%) | 916 (58.3%) |
| Education, Arts & Media | 325 (75.6%) | 105 (24.4%) |
| Legal Services & Support | 72 (67.9%) | 34 (32.1%) |
| Education Instruction & Library | 179 (18.9%) | 769 (81.1%) |
| Arts, Media & Entertainment | 80 (90.9%) | 8 (9.1%) |
| Health Diagnosing & Treating | 276 (37.0%) | 469 (62.9%) |
| Health Technologists | 191 (44.4%) | 239 (55.6%) |
| Total (Category) | 2,449 (51.2%) | 2,336 (48.8%) |
| Total (Overall) | 9,055 (50.4%) | 8,902 (49.6%) |
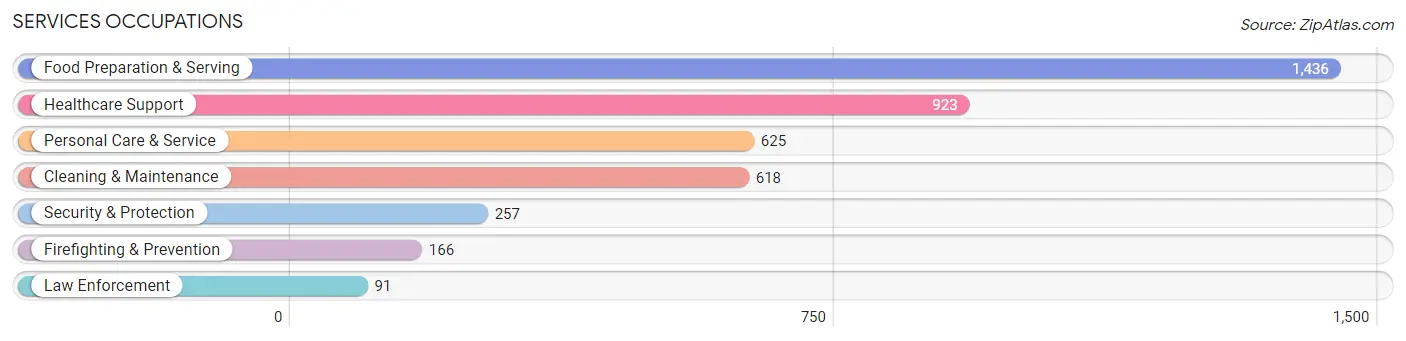
Services Occupations
The most common Services occupations in Fort Pierce are Food Preparation & Serving (1,436 | 8.0%), Healthcare Support (923 | 5.1%), Personal Care & Service (625 | 3.5%), Cleaning & Maintenance (618 | 3.4%), and Security & Protection (257 | 1.4%).
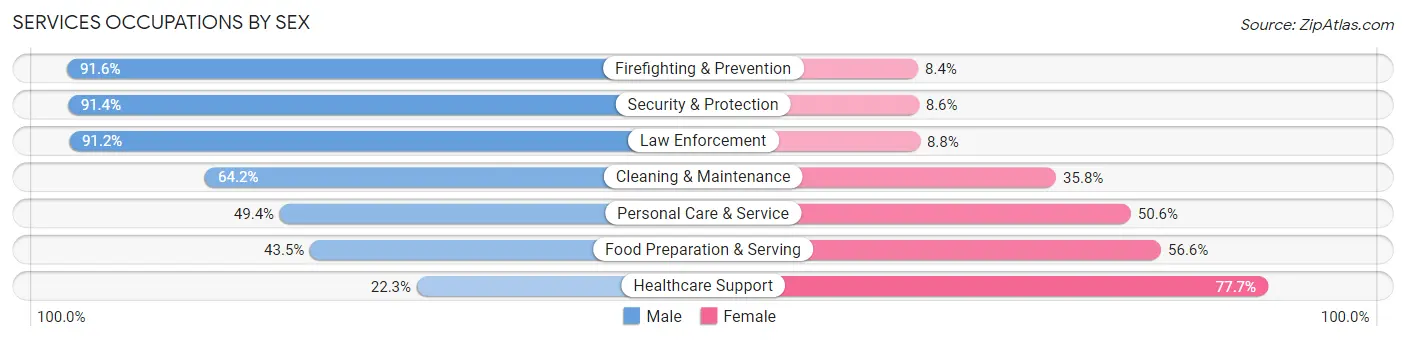
Services Occupations by Sex
Within the Services occupations in Fort Pierce, the most male-oriented occupations are Firefighting & Prevention (91.6%), Security & Protection (91.4%), and Law Enforcement (91.2%), while the most female-oriented occupations are Healthcare Support (77.7%), Food Preparation & Serving (56.6%), and Personal Care & Service (50.6%).
| Occupation | Male | Female |
| Healthcare Support | 206 (22.3%) | 717 (77.7%) |
| Security & Protection | 235 (91.4%) | 22 (8.6%) |
| Firefighting & Prevention | 152 (91.6%) | 14 (8.4%) |
| Law Enforcement | 83 (91.2%) | 8 (8.8%) |
| Food Preparation & Serving | 624 (43.4%) | 812 (56.6%) |
| Cleaning & Maintenance | 397 (64.2%) | 221 (35.8%) |
| Personal Care & Service | 309 (49.4%) | 316 (50.6%) |
| Total (Category) | 1,771 (45.9%) | 2,088 (54.1%) |
| Total (Overall) | 9,055 (50.4%) | 8,902 (49.6%) |
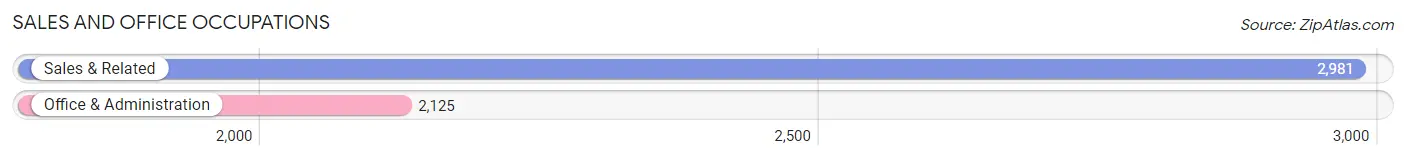
Sales and Office Occupations
The most common Sales and Office occupations in Fort Pierce are Sales & Related (2,981 | 16.6%), and Office & Administration (2,125 | 11.8%).
Sales and Office Occupations by Sex
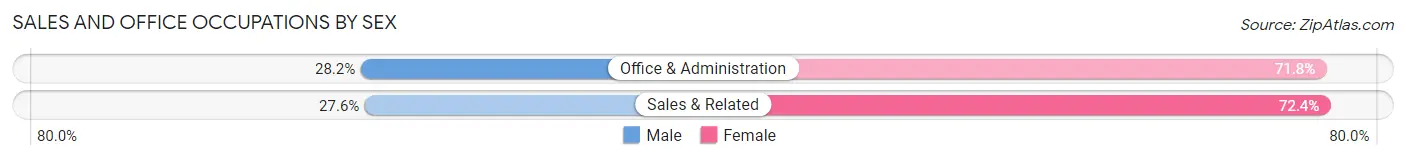
| Occupation | Male | Female |
| Sales & Related | 823 (27.6%) | 2,158 (72.4%) |
| Office & Administration | 600 (28.2%) | 1,525 (71.8%) |
| Total (Category) | 1,423 (27.9%) | 3,683 (72.1%) |
| Total (Overall) | 9,055 (50.4%) | 8,902 (49.6%) |
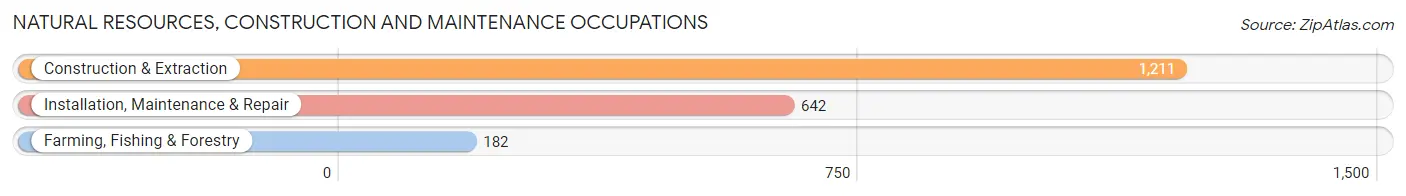
Natural Resources, Construction and Maintenance Occupations
The most common Natural Resources, Construction and Maintenance occupations in Fort Pierce are Construction & Extraction (1,211 | 6.7%), Installation, Maintenance & Repair (642 | 3.6%), and Farming, Fishing & Forestry (182 | 1.0%).
Natural Resources, Construction and Maintenance Occupations by Sex
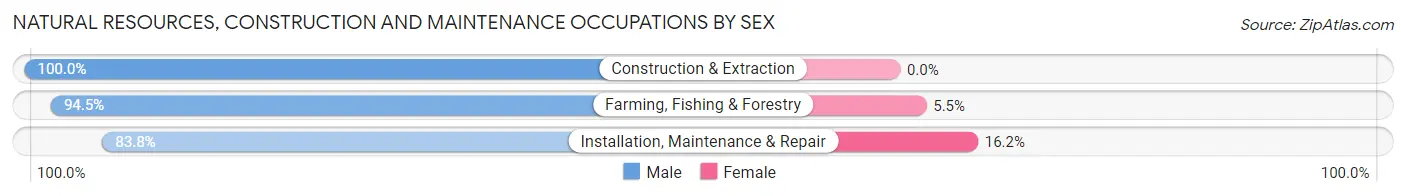
| Occupation | Male | Female |
| Farming, Fishing & Forestry | 172 (94.5%) | 10 (5.5%) |
| Construction & Extraction | 1,211 (100.0%) | 0 (0.0%) |
| Installation, Maintenance & Repair | 538 (83.8%) | 104 (16.2%) |
| Total (Category) | 1,921 (94.4%) | 114 (5.6%) |
| Total (Overall) | 9,055 (50.4%) | 8,902 (49.6%) |
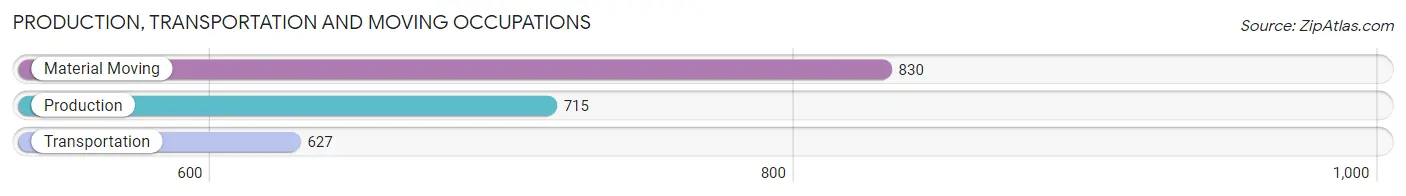
Production, Transportation and Moving Occupations
The most common Production, Transportation and Moving occupations in Fort Pierce are Material Moving (830 | 4.6%), Production (715 | 4.0%), and Transportation (627 | 3.5%).
Production, Transportation and Moving Occupations by Sex
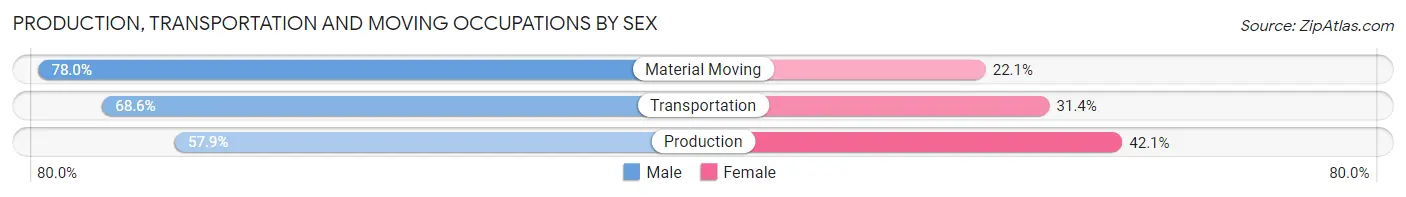
| Occupation | Male | Female |
| Production | 414 (57.9%) | 301 (42.1%) |
| Transportation | 430 (68.6%) | 197 (31.4%) |
| Material Moving | 647 (77.9%) | 183 (22.1%) |
| Total (Category) | 1,491 (68.6%) | 681 (31.4%) |
| Total (Overall) | 9,055 (50.4%) | 8,902 (49.6%) |
Employment Industries by Sex in Fort Pierce
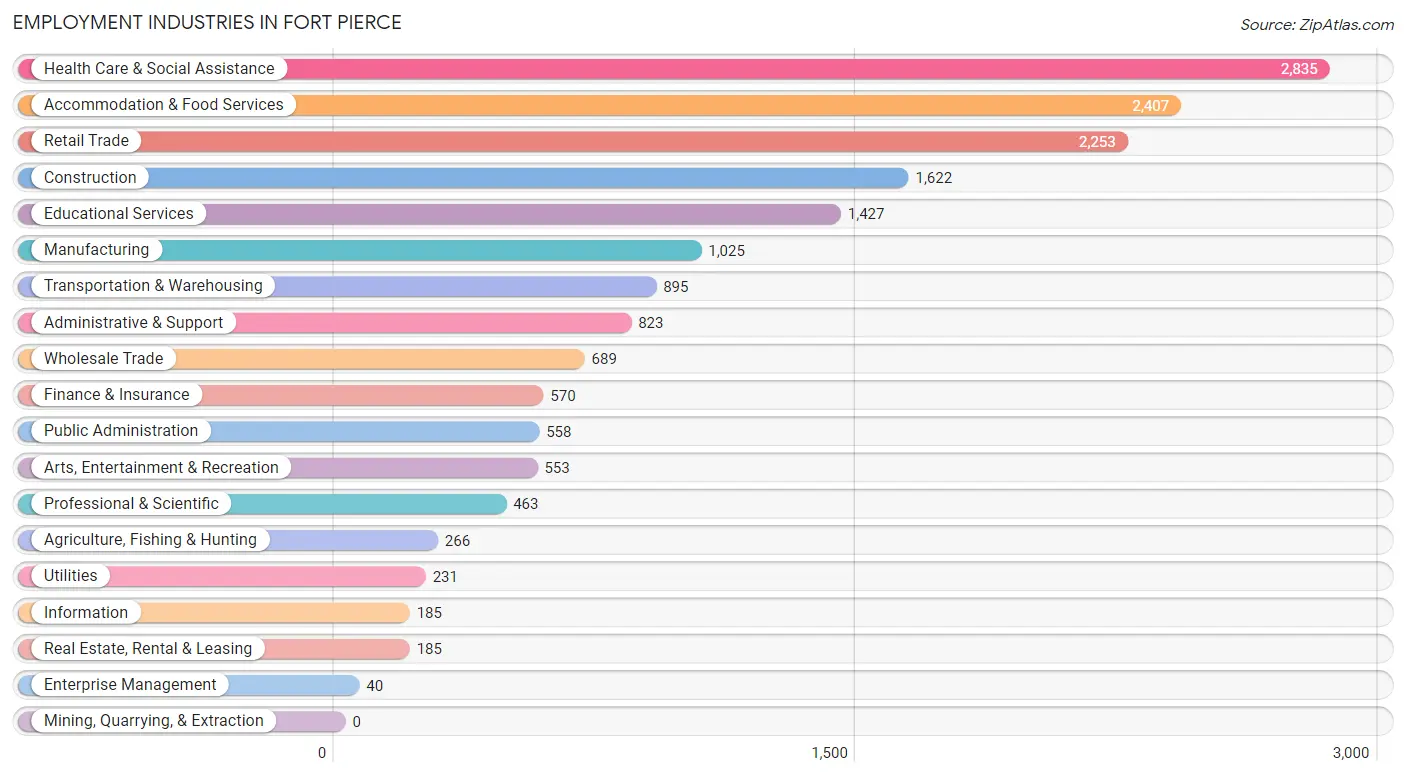
Employment Industries in Fort Pierce
The major employment industries in Fort Pierce include Health Care & Social Assistance (2,835 | 15.8%), Accommodation & Food Services (2,407 | 13.4%), Retail Trade (2,253 | 12.6%), Construction (1,622 | 9.0%), and Educational Services (1,427 | 8.0%).
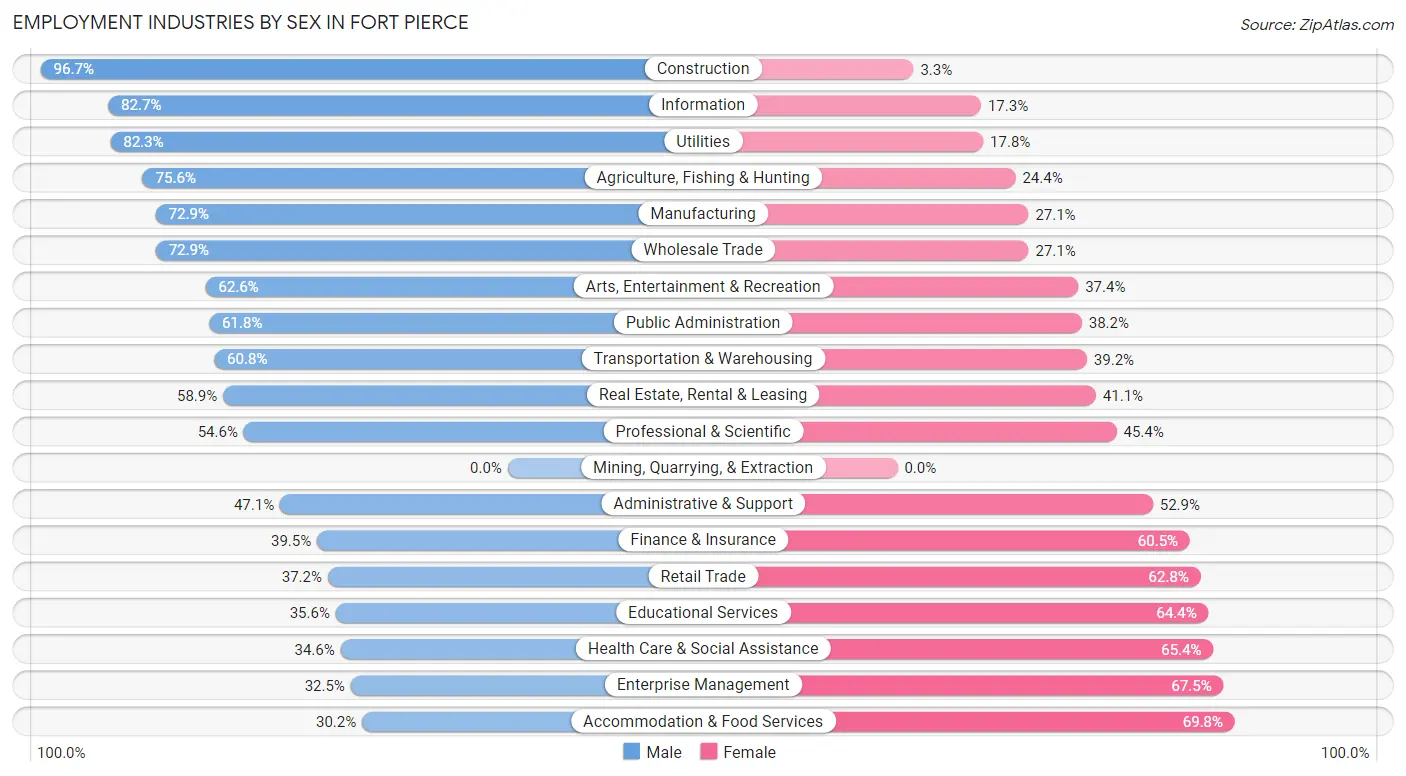
Employment Industries by Sex in Fort Pierce
The Fort Pierce industries that see more men than women are Construction (96.7%), Information (82.7%), and Utilities (82.3%), whereas the industries that tend to have a higher number of women are Accommodation & Food Services (69.8%), Enterprise Management (67.5%), and Health Care & Social Assistance (65.4%).
| Industry | Male | Female |
| Agriculture, Fishing & Hunting | 201 (75.6%) | 65 (24.4%) |
| Mining, Quarrying, & Extraction | 0 (0.0%) | 0 (0.0%) |
| Construction | 1,568 (96.7%) | 54 (3.3%) |
| Manufacturing | 747 (72.9%) | 278 (27.1%) |
| Wholesale Trade | 502 (72.9%) | 187 (27.1%) |
| Retail Trade | 839 (37.2%) | 1,414 (62.8%) |
| Transportation & Warehousing | 544 (60.8%) | 351 (39.2%) |
| Utilities | 190 (82.3%) | 41 (17.7%) |
| Information | 153 (82.7%) | 32 (17.3%) |
| Finance & Insurance | 225 (39.5%) | 345 (60.5%) |
| Real Estate, Rental & Leasing | 109 (58.9%) | 76 (41.1%) |
| Professional & Scientific | 253 (54.6%) | 210 (45.4%) |
| Enterprise Management | 13 (32.5%) | 27 (67.5%) |
| Administrative & Support | 388 (47.1%) | 435 (52.9%) |
| Educational Services | 508 (35.6%) | 919 (64.4%) |
| Health Care & Social Assistance | 981 (34.6%) | 1,854 (65.4%) |
| Arts, Entertainment & Recreation | 346 (62.6%) | 207 (37.4%) |
| Accommodation & Food Services | 726 (30.2%) | 1,681 (69.8%) |
| Public Administration | 345 (61.8%) | 213 (38.2%) |
| Total | 9,055 (50.4%) | 8,902 (49.6%) |
Education in Fort Pierce
School Enrollment in Fort Pierce
The most common levels of schooling among the 11,350 students in Fort Pierce are high school (3,322 | 29.3%), middle school (2,955 | 26.0%), and elementary school (1,864 | 16.4%).
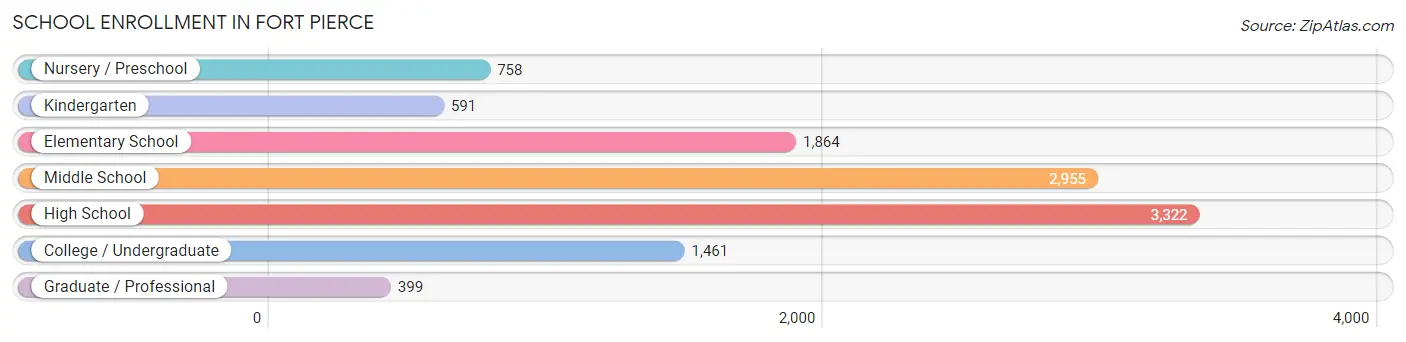
| School Level | # Students | % Students |
| Nursery / Preschool | 758 | 6.7% |
| Kindergarten | 591 | 5.2% |
| Elementary School | 1,864 | 16.4% |
| Middle School | 2,955 | 26.0% |
| High School | 3,322 | 29.3% |
| College / Undergraduate | 1,461 | 12.9% |
| Graduate / Professional | 399 | 3.5% |
| Total | 11,350 | 100.0% |
School Enrollment by Age by Funding Source in Fort Pierce
Out of a total of 11,350 students who are enrolled in schools in Fort Pierce, 1,158 (10.2%) attend a private institution, while the remaining 10,192 (89.8%) are enrolled in public schools. The age group of 35 years and over has the highest likelihood of being enrolled in private schools, with 156 (26.4% in the age bracket) enrolled. Conversely, the age group of 18 to 19 year olds has the lowest likelihood of being enrolled in a private school, with 948 (96.7% in the age bracket) attending a public institution.
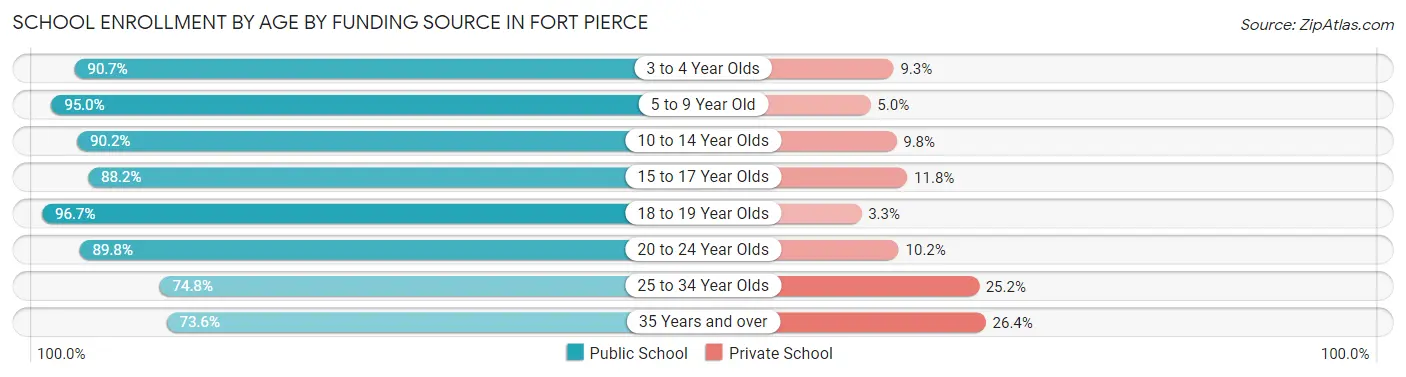
| Age Bracket | Public School | Private School |
| 3 to 4 Year Olds | 734 (90.7%) | 75 (9.3%) |
| 5 to 9 Year Old | 2,101 (95.0%) | 110 (5.0%) |
| 10 to 14 Year Olds | 3,176 (90.2%) | 345 (9.8%) |
| 15 to 17 Year Olds | 1,751 (88.2%) | 235 (11.8%) |
| 18 to 19 Year Olds | 948 (96.7%) | 32 (3.3%) |
| 20 to 24 Year Olds | 693 (89.8%) | 79 (10.2%) |
| 25 to 34 Year Olds | 360 (74.8%) | 121 (25.2%) |
| 35 Years and over | 434 (73.6%) | 156 (26.4%) |
| Total | 10,192 (89.8%) | 1,158 (10.2%) |
Educational Attainment by Field of Study in Fort Pierce
Business (1,723 | 26.0%), education (934 | 14.1%), science & technology (766 | 11.5%), arts & humanities (568 | 8.6%), and bio, nature & agricultural (544 | 8.2%) are the most common fields of study among 6,640 individuals in Fort Pierce who have obtained a bachelor's degree or higher.
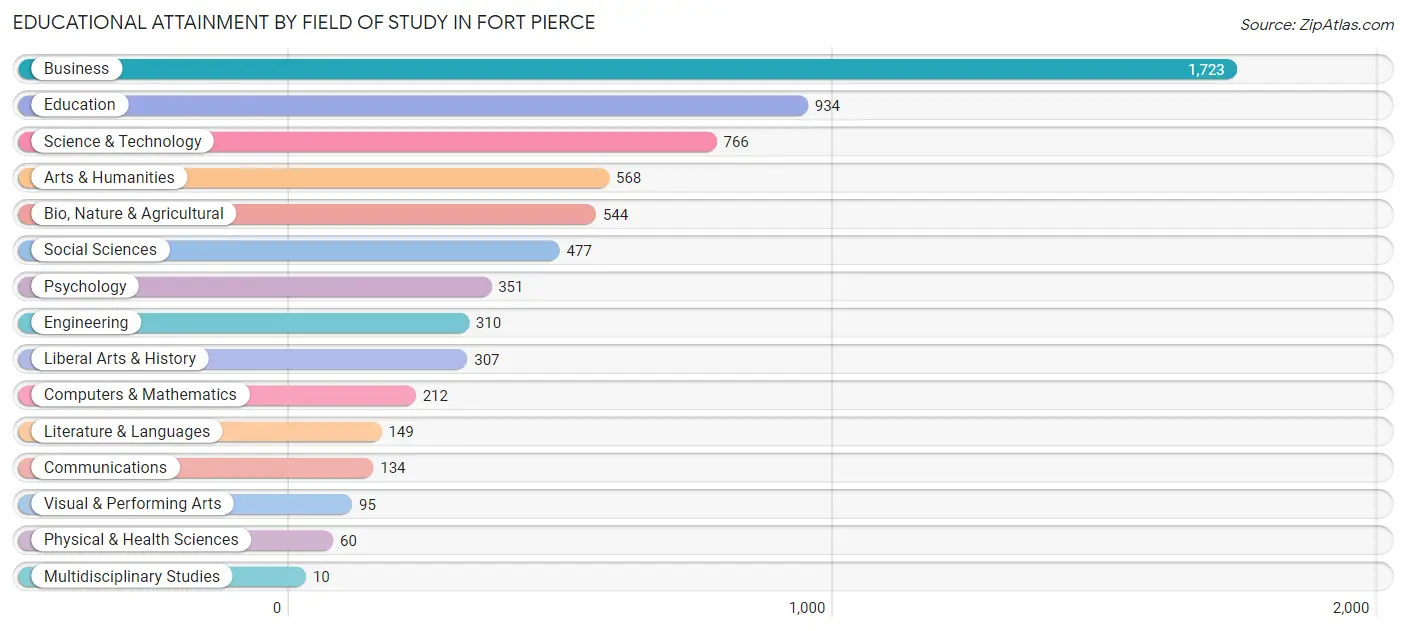
| Field of Study | # Graduates | % Graduates |
| Computers & Mathematics | 212 | 3.2% |
| Bio, Nature & Agricultural | 544 | 8.2% |
| Physical & Health Sciences | 60 | 0.9% |
| Psychology | 351 | 5.3% |
| Social Sciences | 477 | 7.2% |
| Engineering | 310 | 4.7% |
| Multidisciplinary Studies | 10 | 0.2% |
| Science & Technology | 766 | 11.5% |
| Business | 1,723 | 26.0% |
| Education | 934 | 14.1% |
| Literature & Languages | 149 | 2.2% |
| Liberal Arts & History | 307 | 4.6% |
| Visual & Performing Arts | 95 | 1.4% |
| Communications | 134 | 2.0% |
| Arts & Humanities | 568 | 8.6% |
| Total | 6,640 | 100.0% |
Transportation & Commute in Fort Pierce
Vehicle Availability by Sex in Fort Pierce
The most prevalent vehicle ownership categories in Fort Pierce are males with 2 vehicles (4,355, accounting for 49.1%) and females with 2 vehicles (3,185, making up 49.5%).
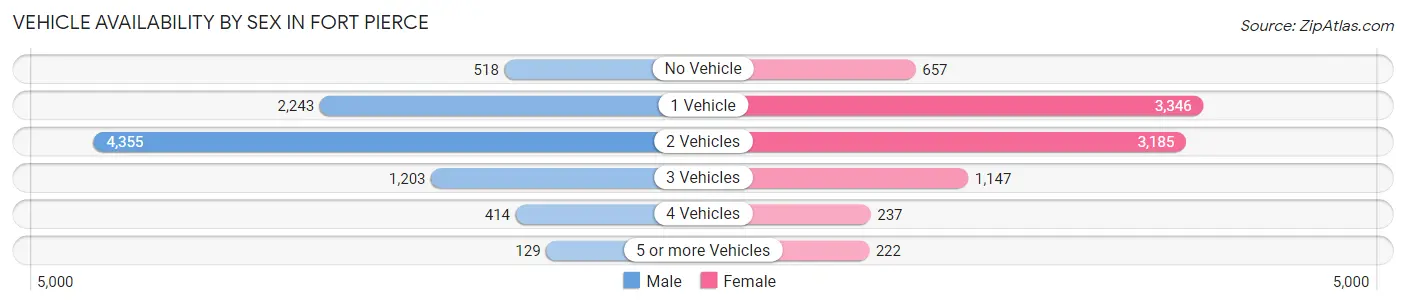
| Vehicles Available | Male | Female |
| No Vehicle | 518 (5.9%) | 657 (7.5%) |
| 1 Vehicle | 2,243 (25.3%) | 3,346 (38.1%) |
| 2 Vehicles | 4,355 (49.1%) | 3,185 (36.2%) |
| 3 Vehicles | 1,203 (13.6%) | 1,147 (13.0%) |
| 4 Vehicles | 414 (4.7%) | 237 (2.7%) |
| 5 or more Vehicles | 129 (1.5%) | 222 (2.5%) |
| Total | 8,862 (100.0%) | 8,794 (100.0%) |
Commute Time in Fort Pierce
The most frequently occuring commute durations in Fort Pierce are 30 to 34 minutes (3,334 commuters, 20.1%), 15 to 19 minutes (3,284 commuters, 19.8%), and 10 to 14 minutes (2,951 commuters, 17.8%).
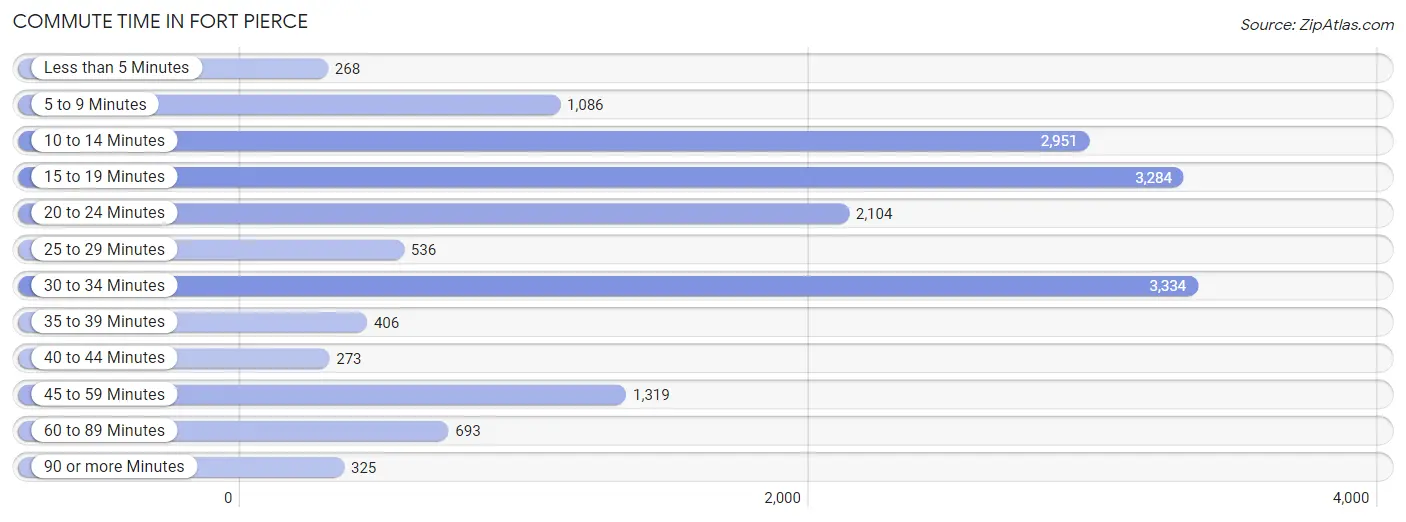
| Commute Time | # Commuters | % Commuters |
| Less than 5 Minutes | 268 | 1.6% |
| 5 to 9 Minutes | 1,086 | 6.6% |
| 10 to 14 Minutes | 2,951 | 17.8% |
| 15 to 19 Minutes | 3,284 | 19.8% |
| 20 to 24 Minutes | 2,104 | 12.7% |
| 25 to 29 Minutes | 536 | 3.2% |
| 30 to 34 Minutes | 3,334 | 20.1% |
| 35 to 39 Minutes | 406 | 2.5% |
| 40 to 44 Minutes | 273 | 1.7% |
| 45 to 59 Minutes | 1,319 | 8.0% |
| 60 to 89 Minutes | 693 | 4.2% |
| 90 or more Minutes | 325 | 2.0% |
Commute Time by Sex in Fort Pierce
The most common commute times in Fort Pierce are 30 to 34 minutes (1,776 commuters, 21.4%) for males and 10 to 14 minutes (1,696 commuters, 20.5%) for females.
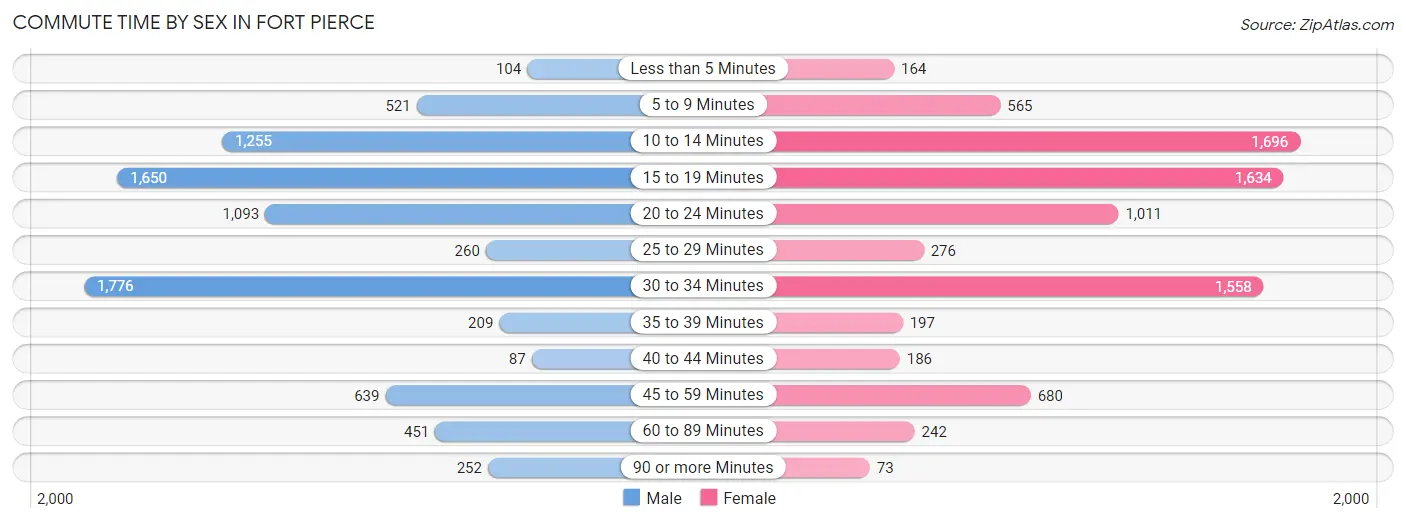
| Commute Time | Male | Female |
| Less than 5 Minutes | 104 (1.3%) | 164 (2.0%) |
| 5 to 9 Minutes | 521 (6.3%) | 565 (6.8%) |
| 10 to 14 Minutes | 1,255 (15.1%) | 1,696 (20.5%) |
| 15 to 19 Minutes | 1,650 (19.9%) | 1,634 (19.7%) |
| 20 to 24 Minutes | 1,093 (13.2%) | 1,011 (12.2%) |
| 25 to 29 Minutes | 260 (3.1%) | 276 (3.3%) |
| 30 to 34 Minutes | 1,776 (21.4%) | 1,558 (18.8%) |
| 35 to 39 Minutes | 209 (2.5%) | 197 (2.4%) |
| 40 to 44 Minutes | 87 (1.1%) | 186 (2.2%) |
| 45 to 59 Minutes | 639 (7.7%) | 680 (8.2%) |
| 60 to 89 Minutes | 451 (5.4%) | 242 (2.9%) |
| 90 or more Minutes | 252 (3.0%) | 73 (0.9%) |
Time of Departure to Work by Sex in Fort Pierce
The most frequent times of departure to work in Fort Pierce are 7:00 AM to 7:29 AM (1,240, 14.9%) for males and 8:00 AM to 8:29 AM (1,315, 15.9%) for females.
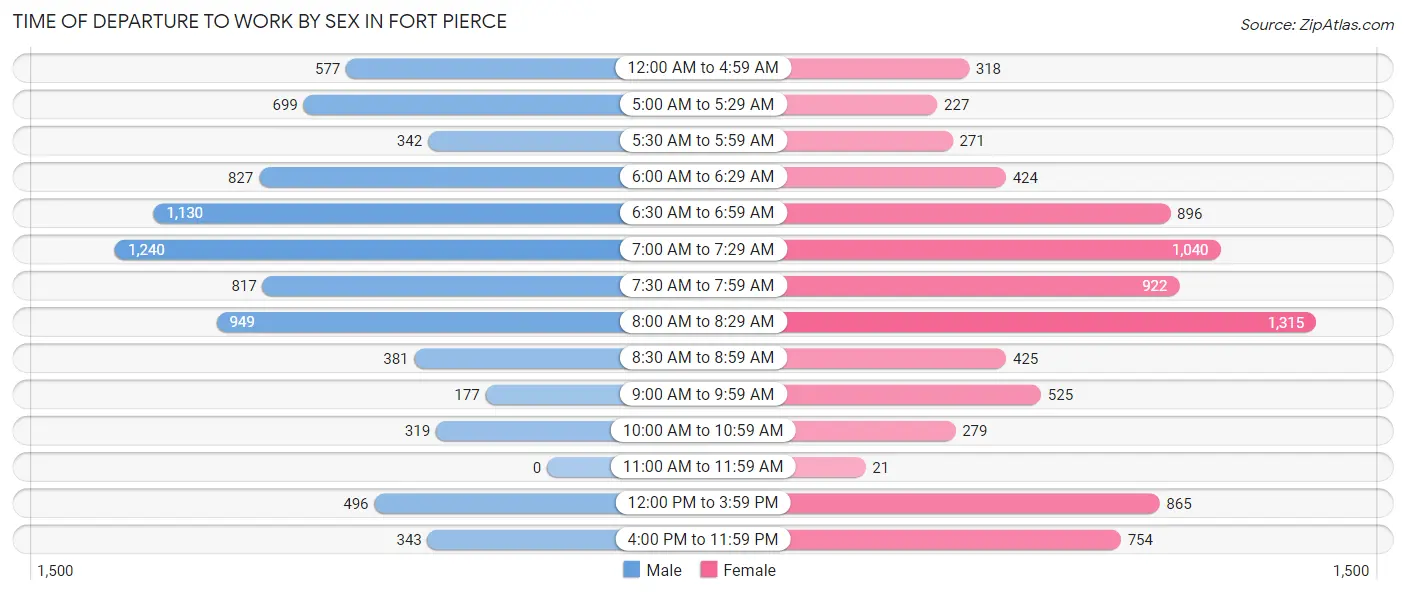
| Time of Departure | Male | Female |
| 12:00 AM to 4:59 AM | 577 (7.0%) | 318 (3.8%) |
| 5:00 AM to 5:29 AM | 699 (8.4%) | 227 (2.7%) |
| 5:30 AM to 5:59 AM | 342 (4.1%) | 271 (3.3%) |
| 6:00 AM to 6:29 AM | 827 (10.0%) | 424 (5.1%) |
| 6:30 AM to 6:59 AM | 1,130 (13.6%) | 896 (10.8%) |
| 7:00 AM to 7:29 AM | 1,240 (14.9%) | 1,040 (12.6%) |
| 7:30 AM to 7:59 AM | 817 (9.9%) | 922 (11.1%) |
| 8:00 AM to 8:29 AM | 949 (11.4%) | 1,315 (15.9%) |
| 8:30 AM to 8:59 AM | 381 (4.6%) | 425 (5.1%) |
| 9:00 AM to 9:59 AM | 177 (2.1%) | 525 (6.3%) |
| 10:00 AM to 10:59 AM | 319 (3.8%) | 279 (3.4%) |
| 11:00 AM to 11:59 AM | 0 (0.0%) | 21 (0.3%) |
| 12:00 PM to 3:59 PM | 496 (6.0%) | 865 (10.4%) |
| 4:00 PM to 11:59 PM | 343 (4.1%) | 754 (9.1%) |
| Total | 8,297 (100.0%) | 8,282 (100.0%) |
Housing Occupancy in Fort Pierce
Occupancy by Ownership in Fort Pierce
Of the total 17,971 dwellings in Fort Pierce, owner-occupied units account for 8,504 (47.3%), while renter-occupied units make up 9,467 (52.7%).
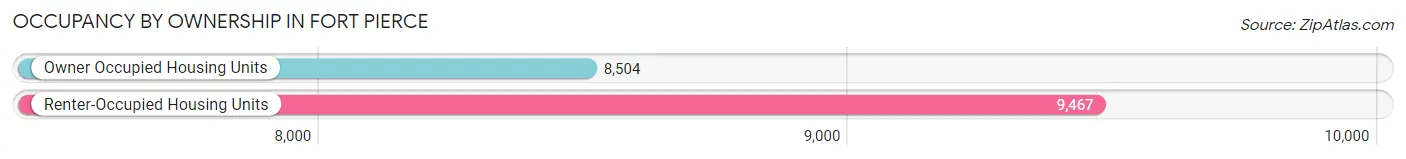
| Occupancy | # Housing Units | % Housing Units |
| Owner Occupied Housing Units | 8,504 | 47.3% |
| Renter-Occupied Housing Units | 9,467 | 52.7% |
| Total Occupied Housing Units | 17,971 | 100.0% |
Occupancy by Household Size in Fort Pierce
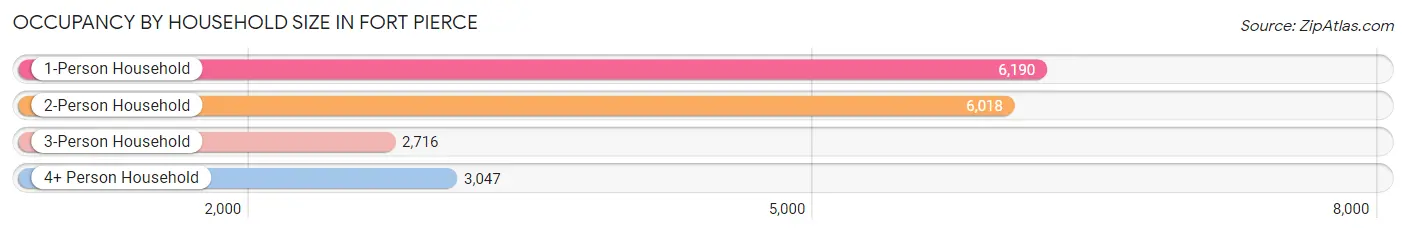
| Household Size | # Housing Units | % Housing Units |
| 1-Person Household | 6,190 | 34.4% |
| 2-Person Household | 6,018 | 33.5% |
| 3-Person Household | 2,716 | 15.1% |
| 4+ Person Household | 3,047 | 17.0% |
| Total Housing Units | 17,971 | 100.0% |
Occupancy by Ownership by Household Size in Fort Pierce
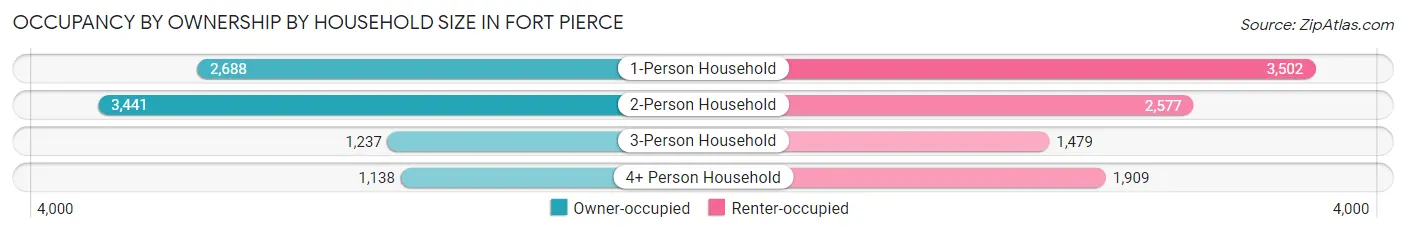
| Household Size | Owner-occupied | Renter-occupied |
| 1-Person Household | 2,688 (43.4%) | 3,502 (56.6%) |
| 2-Person Household | 3,441 (57.2%) | 2,577 (42.8%) |
| 3-Person Household | 1,237 (45.5%) | 1,479 (54.5%) |
| 4+ Person Household | 1,138 (37.3%) | 1,909 (62.6%) |
| Total Housing Units | 8,504 (47.3%) | 9,467 (52.7%) |
Occupancy by Educational Attainment in Fort Pierce
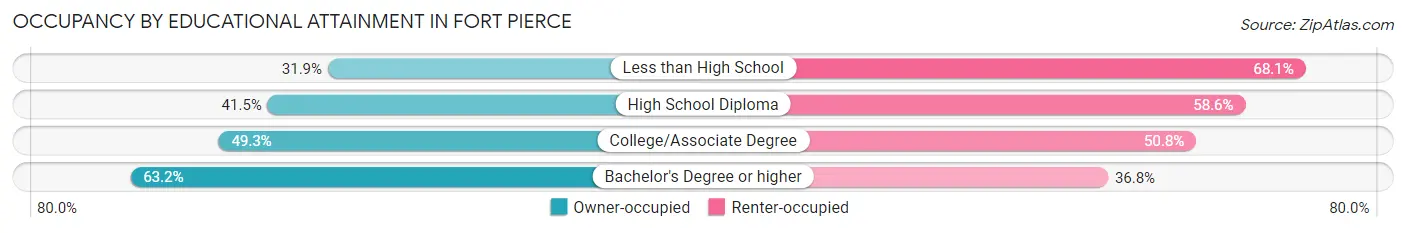
| Household Size | Owner-occupied | Renter-occupied |
| Less than High School | 1,164 (31.9%) | 2,485 (68.1%) |
| High School Diploma | 1,787 (41.4%) | 2,524 (58.6%) |
| College/Associate Degree | 2,740 (49.2%) | 2,823 (50.7%) |
| Bachelor's Degree or higher | 2,813 (63.2%) | 1,635 (36.8%) |
Occupancy by Age of Householder in Fort Pierce
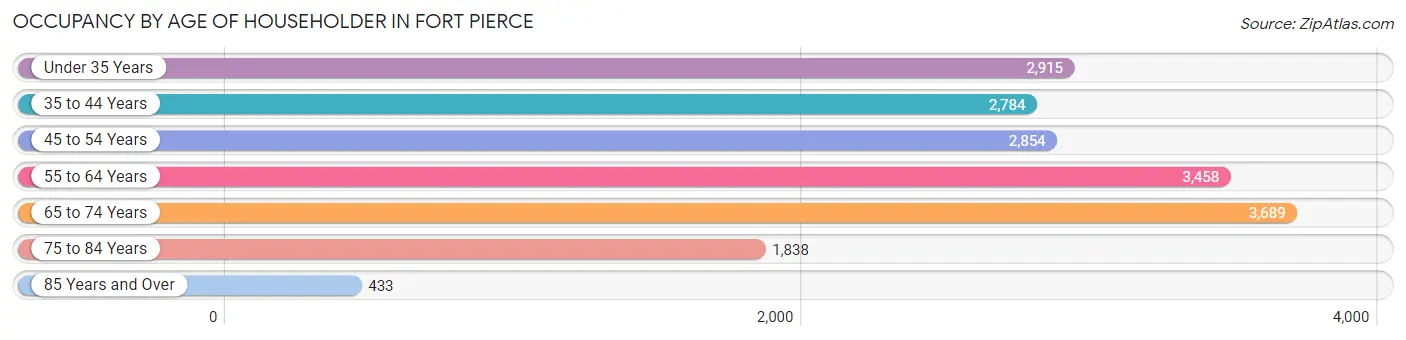
| Age Bracket | # Households | % Households |
| Under 35 Years | 2,915 | 16.2% |
| 35 to 44 Years | 2,784 | 15.5% |
| 45 to 54 Years | 2,854 | 15.9% |
| 55 to 64 Years | 3,458 | 19.2% |
| 65 to 74 Years | 3,689 | 20.5% |
| 75 to 84 Years | 1,838 | 10.2% |
| 85 Years and Over | 433 | 2.4% |
| Total | 17,971 | 100.0% |
Housing Finances in Fort Pierce
Median Income by Occupancy in Fort Pierce
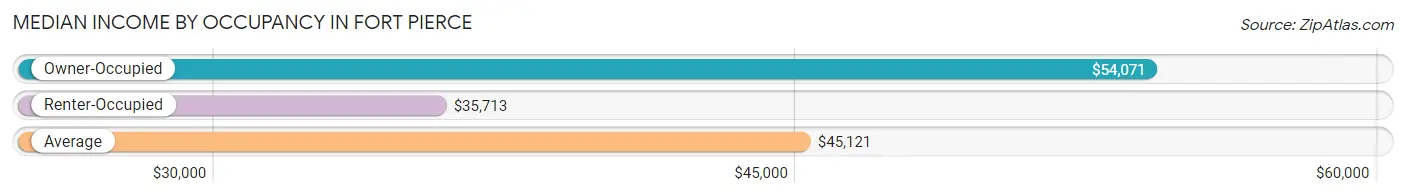
| Occupancy Type | # Households | Median Income |
| Owner-Occupied | 8,504 (47.3%) | $54,071 |
| Renter-Occupied | 9,467 (52.7%) | $35,713 |
| Average | 17,971 (100.0%) | $45,121 |
Occupancy by Householder Income Bracket in Fort Pierce
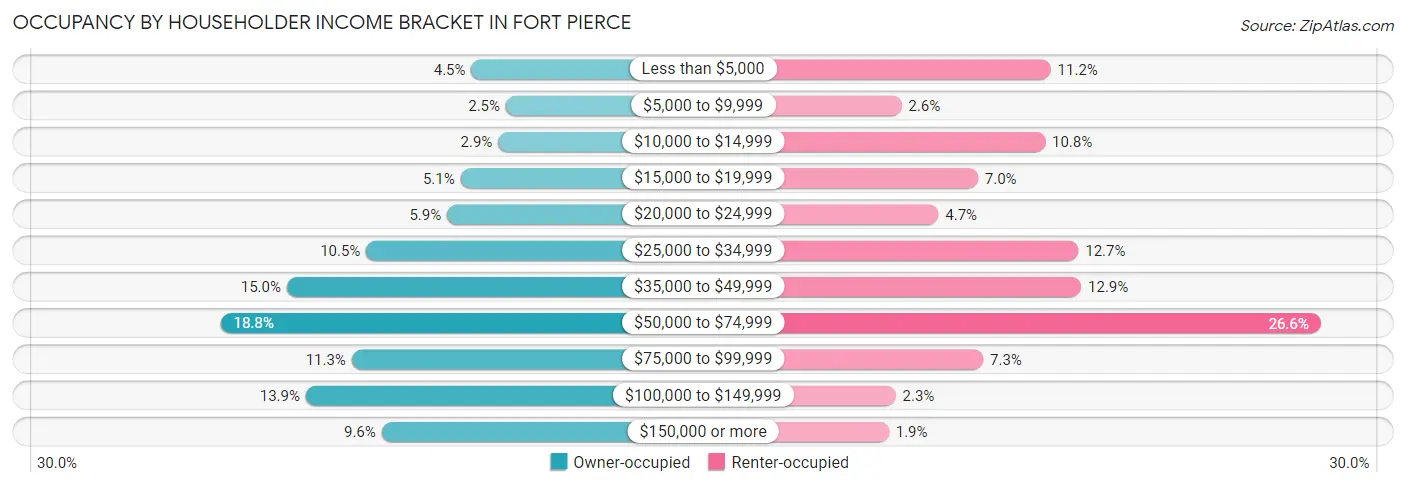
| Income Bracket | Owner-occupied | Renter-occupied |
| Less than $5,000 | 380 (4.5%) | 1,056 (11.2%) |
| $5,000 to $9,999 | 213 (2.5%) | 248 (2.6%) |
| $10,000 to $14,999 | 250 (2.9%) | 1,025 (10.8%) |
| $15,000 to $19,999 | 433 (5.1%) | 662 (7.0%) |
| $20,000 to $24,999 | 498 (5.9%) | 448 (4.7%) |
| $25,000 to $34,999 | 891 (10.5%) | 1,205 (12.7%) |
| $35,000 to $49,999 | 1,277 (15.0%) | 1,220 (12.9%) |
| $50,000 to $74,999 | 1,599 (18.8%) | 2,516 (26.6%) |
| $75,000 to $99,999 | 962 (11.3%) | 690 (7.3%) |
| $100,000 to $149,999 | 1,185 (13.9%) | 217 (2.3%) |
| $150,000 or more | 816 (9.6%) | 180 (1.9%) |
| Total | 8,504 (100.0%) | 9,467 (100.0%) |
Monthly Housing Cost Tiers in Fort Pierce
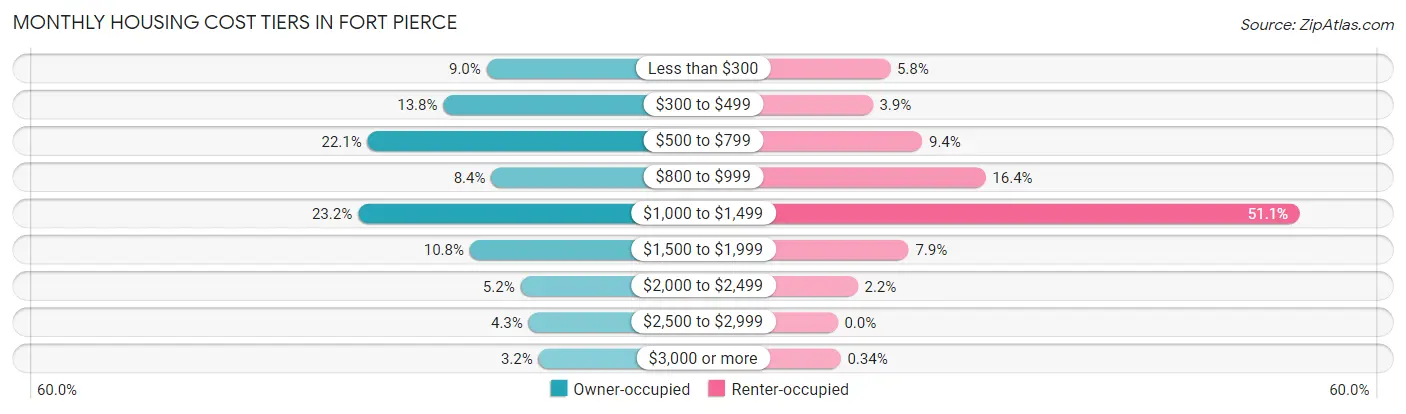
| Monthly Cost | Owner-occupied | Renter-occupied |
| Less than $300 | 762 (9.0%) | 549 (5.8%) |
| $300 to $499 | 1,169 (13.8%) | 366 (3.9%) |
| $500 to $799 | 1,880 (22.1%) | 885 (9.3%) |
| $800 to $999 | 718 (8.4%) | 1,548 (16.4%) |
| $1,000 to $1,499 | 1,970 (23.2%) | 4,837 (51.1%) |
| $1,500 to $1,999 | 920 (10.8%) | 743 (7.9%) |
| $2,000 to $2,499 | 444 (5.2%) | 210 (2.2%) |
| $2,500 to $2,999 | 367 (4.3%) | 0 (0.0%) |
| $3,000 or more | 274 (3.2%) | 32 (0.3%) |
| Total | 8,504 (100.0%) | 9,467 (100.0%) |
Physical Housing Characteristics in Fort Pierce
Housing Structures in Fort Pierce
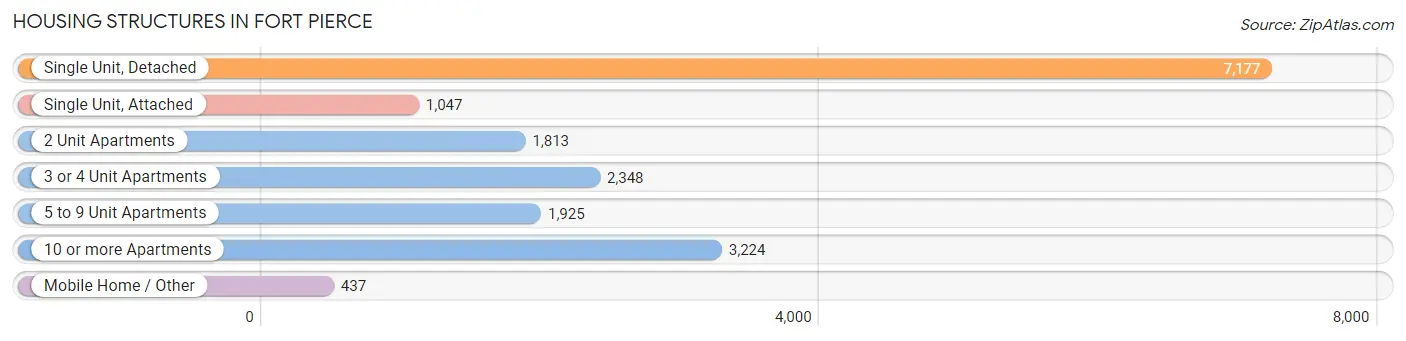
| Structure Type | # Housing Units | % Housing Units |
| Single Unit, Detached | 7,177 | 39.9% |
| Single Unit, Attached | 1,047 | 5.8% |
| 2 Unit Apartments | 1,813 | 10.1% |
| 3 or 4 Unit Apartments | 2,348 | 13.1% |
| 5 to 9 Unit Apartments | 1,925 | 10.7% |
| 10 or more Apartments | 3,224 | 17.9% |
| Mobile Home / Other | 437 | 2.4% |
| Total | 17,971 | 100.0% |
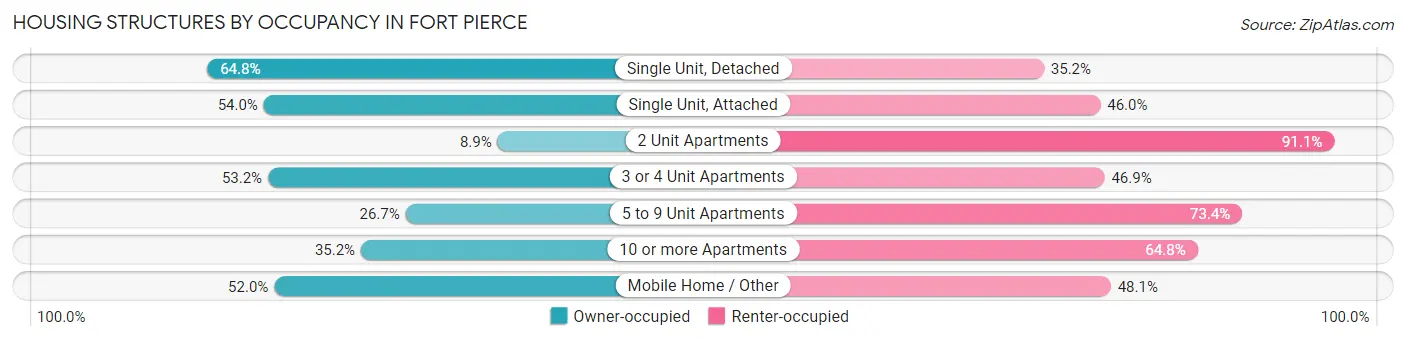
Housing Structures by Occupancy in Fort Pierce
| Structure Type | Owner-occupied | Renter-occupied |
| Single Unit, Detached | 4,653 (64.8%) | 2,524 (35.2%) |
| Single Unit, Attached | 565 (54.0%) | 482 (46.0%) |
| 2 Unit Apartments | 162 (8.9%) | 1,651 (91.1%) |
| 3 or 4 Unit Apartments | 1,248 (53.1%) | 1,100 (46.9%) |
| 5 to 9 Unit Apartments | 513 (26.7%) | 1,412 (73.4%) |
| 10 or more Apartments | 1,136 (35.2%) | 2,088 (64.8%) |
| Mobile Home / Other | 227 (51.9%) | 210 (48.0%) |
| Total | 8,504 (47.3%) | 9,467 (52.7%) |
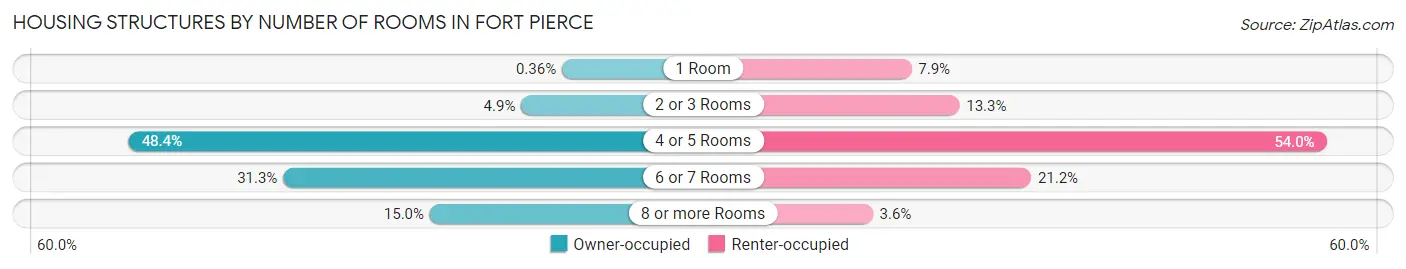
Housing Structures by Number of Rooms in Fort Pierce
| Number of Rooms | Owner-occupied | Renter-occupied |
| 1 Room | 31 (0.4%) | 751 (7.9%) |
| 2 or 3 Rooms | 415 (4.9%) | 1,254 (13.3%) |
| 4 or 5 Rooms | 4,119 (48.4%) | 5,111 (54.0%) |
| 6 or 7 Rooms | 2,662 (31.3%) | 2,007 (21.2%) |
| 8 or more Rooms | 1,277 (15.0%) | 344 (3.6%) |
| Total | 8,504 (100.0%) | 9,467 (100.0%) |
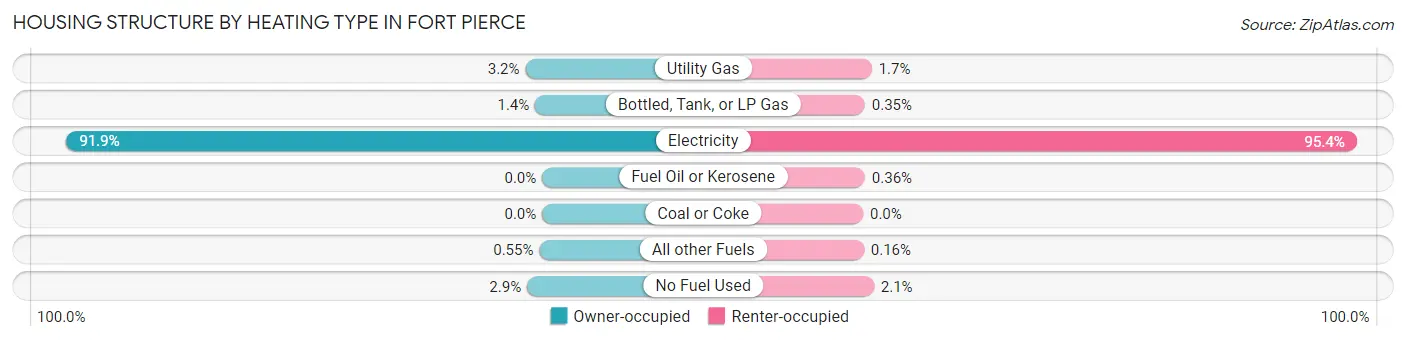
Housing Structure by Heating Type in Fort Pierce
| Heating Type | Owner-occupied | Renter-occupied |
| Utility Gas | 275 (3.2%) | 158 (1.7%) |
| Bottled, Tank, or LP Gas | 115 (1.3%) | 33 (0.4%) |
| Electricity | 7,819 (91.9%) | 9,030 (95.4%) |
| Fuel Oil or Kerosene | 0 (0.0%) | 34 (0.4%) |
| Coal or Coke | 0 (0.0%) | 0 (0.0%) |
| All other Fuels | 47 (0.5%) | 15 (0.2%) |
| No Fuel Used | 248 (2.9%) | 197 (2.1%) |
| Total | 8,504 (100.0%) | 9,467 (100.0%) |
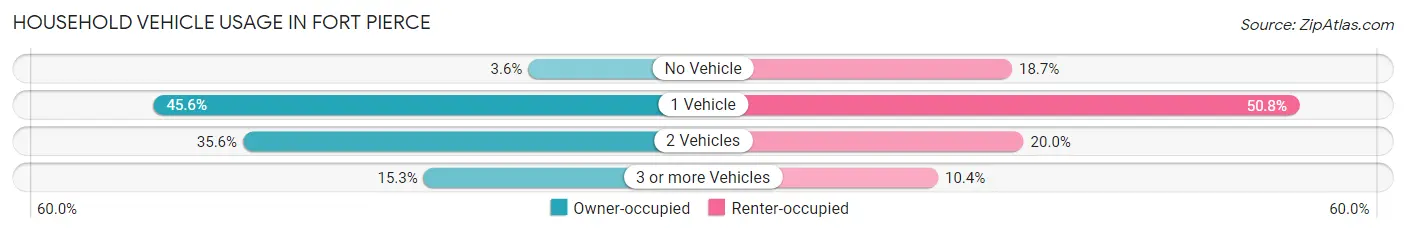
Household Vehicle Usage in Fort Pierce
| Vehicles per Household | Owner-occupied | Renter-occupied |
| No Vehicle | 305 (3.6%) | 1,772 (18.7%) |
| 1 Vehicle | 3,874 (45.6%) | 4,813 (50.8%) |
| 2 Vehicles | 3,023 (35.5%) | 1,895 (20.0%) |
| 3 or more Vehicles | 1,302 (15.3%) | 987 (10.4%) |
| Total | 8,504 (100.0%) | 9,467 (100.0%) |
Real Estate & Mortgages in Fort Pierce
Real Estate and Mortgage Overview in Fort Pierce
| Characteristic | Without Mortgage | With Mortgage |
| Housing Units | 4,860 | 3,644 |
| Median Property Value | $170,900 | $221,500 |
| Median Household Income | $46,053 | $424 |
| Monthly Housing Costs | $595 | $274 |
| Real Estate Taxes | $1,158 | $201 |
Property Value by Mortgage Status in Fort Pierce
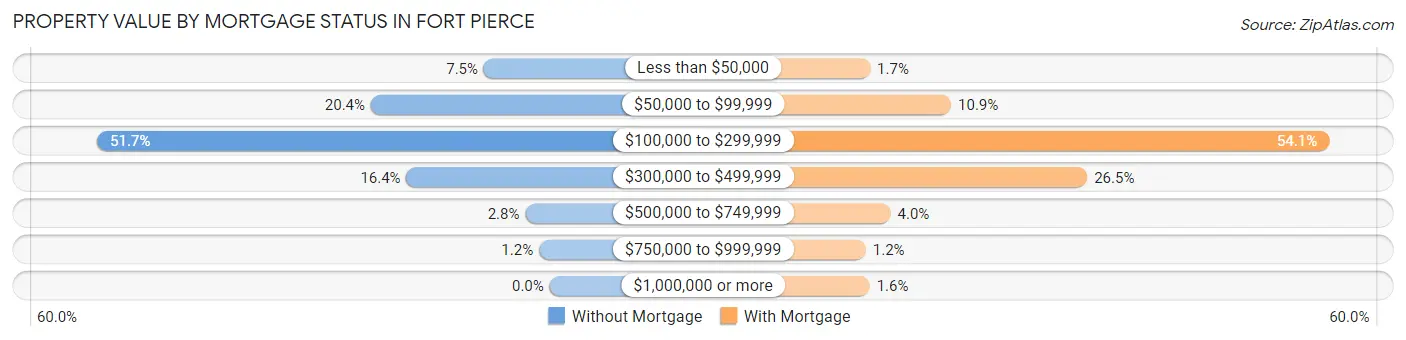
| Property Value | Without Mortgage | With Mortgage |
| Less than $50,000 | 365 (7.5%) | 61 (1.7%) |
| $50,000 to $99,999 | 993 (20.4%) | 398 (10.9%) |
| $100,000 to $299,999 | 2,513 (51.7%) | 1,972 (54.1%) |
| $300,000 to $499,999 | 795 (16.4%) | 965 (26.5%) |
| $500,000 to $749,999 | 135 (2.8%) | 146 (4.0%) |
| $750,000 to $999,999 | 59 (1.2%) | 43 (1.2%) |
| $1,000,000 or more | 0 (0.0%) | 59 (1.6%) |
| Total | 4,860 (100.0%) | 3,644 (100.0%) |
Household Income by Mortgage Status in Fort Pierce
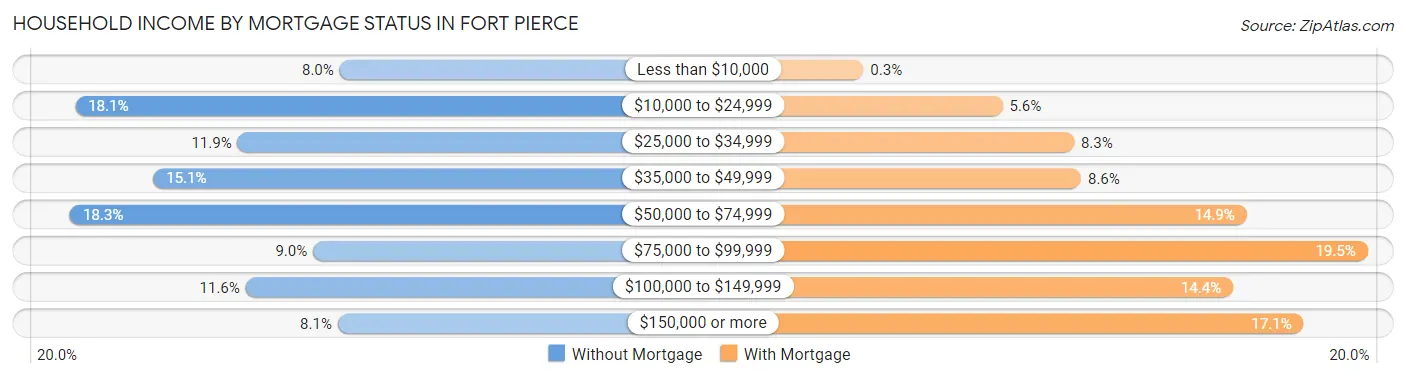
| Household Income | Without Mortgage | With Mortgage |
| Less than $10,000 | 389 (8.0%) | 11 (0.3%) |
| $10,000 to $24,999 | 878 (18.1%) | 204 (5.6%) |
| $25,000 to $34,999 | 578 (11.9%) | 303 (8.3%) |
| $35,000 to $49,999 | 734 (15.1%) | 313 (8.6%) |
| $50,000 to $74,999 | 888 (18.3%) | 543 (14.9%) |
| $75,000 to $99,999 | 438 (9.0%) | 711 (19.5%) |
| $100,000 to $149,999 | 563 (11.6%) | 524 (14.4%) |
| $150,000 or more | 392 (8.1%) | 622 (17.1%) |
| Total | 4,860 (100.0%) | 3,644 (100.0%) |
Property Value to Household Income Ratio in Fort Pierce
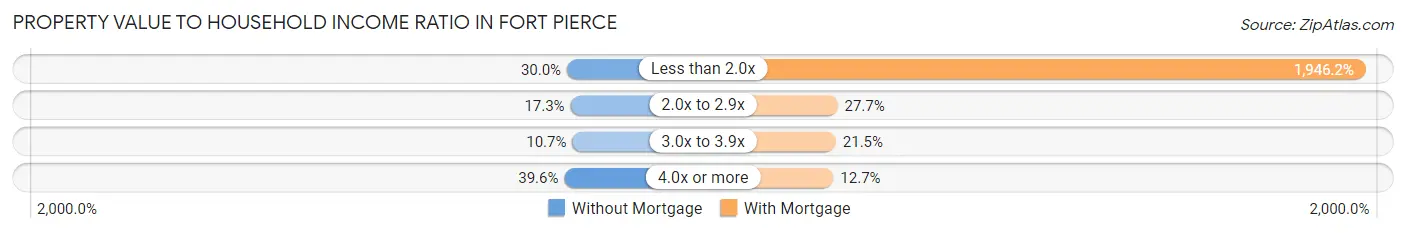
| Value-to-Income Ratio | Without Mortgage | With Mortgage |
| Less than 2.0x | 1,460 (30.0%) | 70,919 (1,946.2%) |
| 2.0x to 2.9x | 842 (17.3%) | 1,010 (27.7%) |
| 3.0x to 3.9x | 520 (10.7%) | 784 (21.5%) |
| 4.0x or more | 1,925 (39.6%) | 461 (12.7%) |
| Total | 4,860 (100.0%) | 3,644 (100.0%) |
Real Estate Taxes by Mortgage Status in Fort Pierce
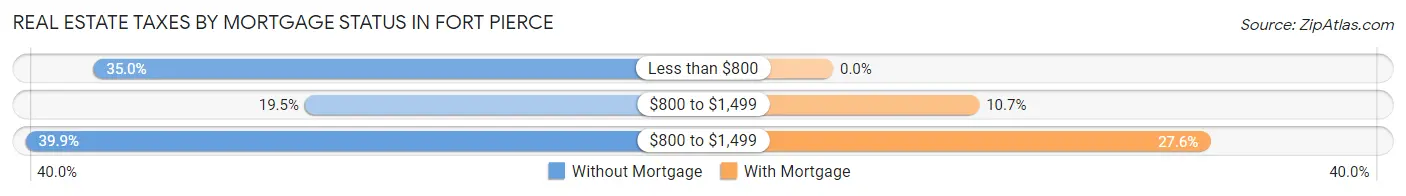
| Property Taxes | Without Mortgage | With Mortgage |
| Less than $800 | 1,700 (35.0%) | 0 (0.0%) |
| $800 to $1,499 | 949 (19.5%) | 389 (10.7%) |
| $800 to $1,499 | 1,940 (39.9%) | 1,004 (27.6%) |
| Total | 4,860 (100.0%) | 3,644 (100.0%) |
Health & Disability in Fort Pierce
Health Insurance Coverage by Age in Fort Pierce
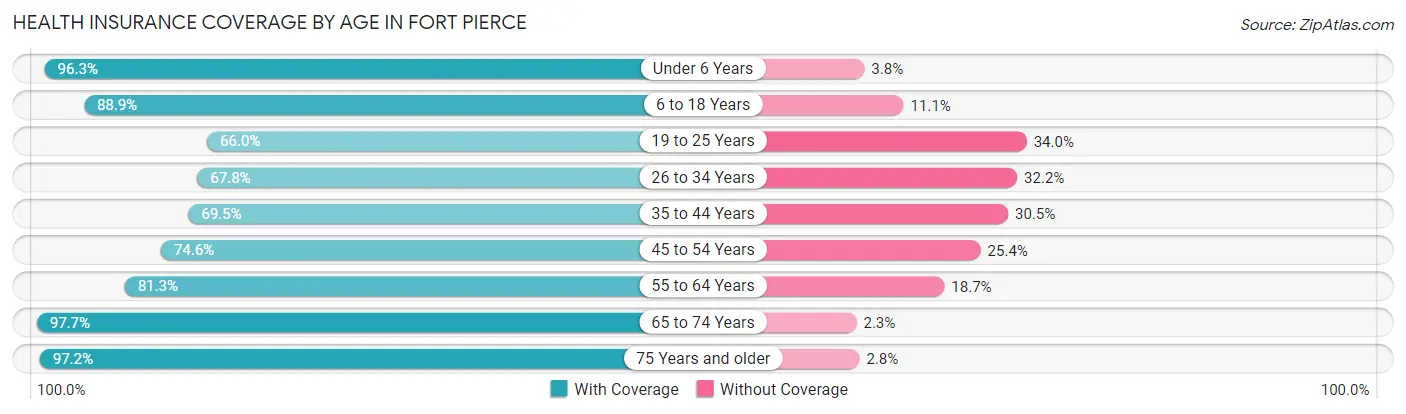
| Age Bracket | With Coverage | Without Coverage |
| Under 6 Years | 3,700 (96.3%) | 144 (3.7%) |
| 6 to 18 Years | 7,175 (88.9%) | 893 (11.1%) |
| 19 to 25 Years | 2,930 (66.0%) | 1,511 (34.0%) |
| 26 to 34 Years | 3,710 (67.8%) | 1,764 (32.2%) |
| 35 to 44 Years | 3,236 (69.5%) | 1,422 (30.5%) |
| 45 to 54 Years | 4,030 (74.6%) | 1,374 (25.4%) |
| 55 to 64 Years | 4,320 (81.3%) | 992 (18.7%) |
| 65 to 74 Years | 5,830 (97.7%) | 136 (2.3%) |
| 75 Years and older | 3,353 (97.2%) | 98 (2.8%) |
| Total | 38,284 (82.1%) | 8,334 (17.9%) |
Health Insurance Coverage by Citizenship Status in Fort Pierce
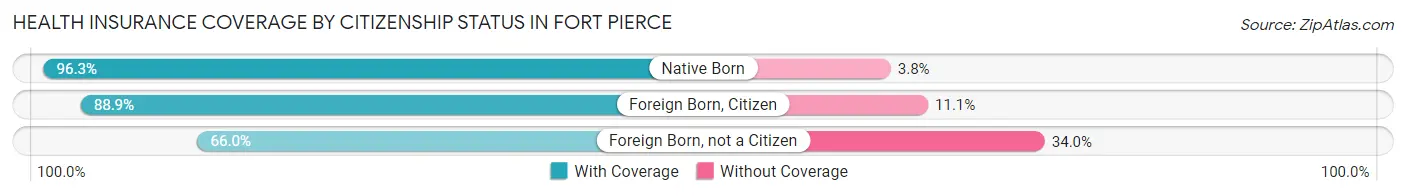
| Citizenship Status | With Coverage | Without Coverage |
| Native Born | 3,700 (96.3%) | 144 (3.7%) |
| Foreign Born, Citizen | 7,175 (88.9%) | 893 (11.1%) |
| Foreign Born, not a Citizen | 2,930 (66.0%) | 1,511 (34.0%) |
Health Insurance Coverage by Household Income in Fort Pierce
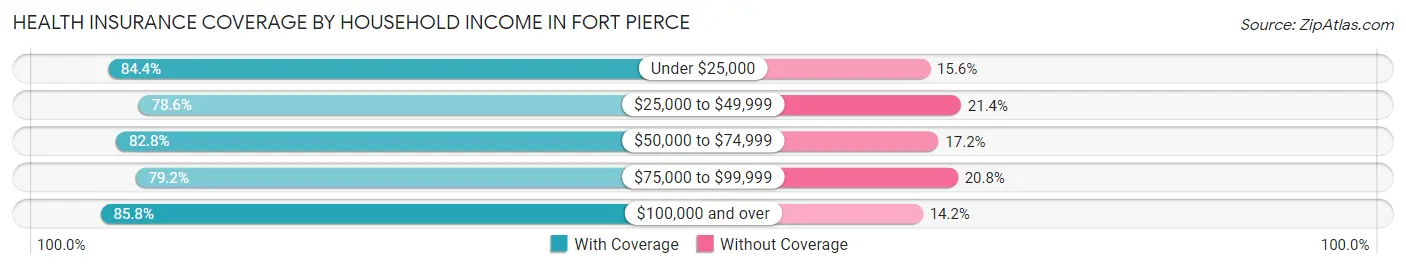
| Household Income | With Coverage | Without Coverage |
| Under $25,000 | 9,080 (84.4%) | 1,679 (15.6%) |
| $25,000 to $49,999 | 9,506 (78.6%) | 2,584 (21.4%) |
| $50,000 to $74,999 | 9,325 (82.8%) | 1,931 (17.2%) |
| $75,000 to $99,999 | 4,274 (79.2%) | 1,121 (20.8%) |
| $100,000 and over | 5,902 (85.8%) | 978 (14.2%) |
Public vs Private Health Insurance Coverage by Age in Fort Pierce
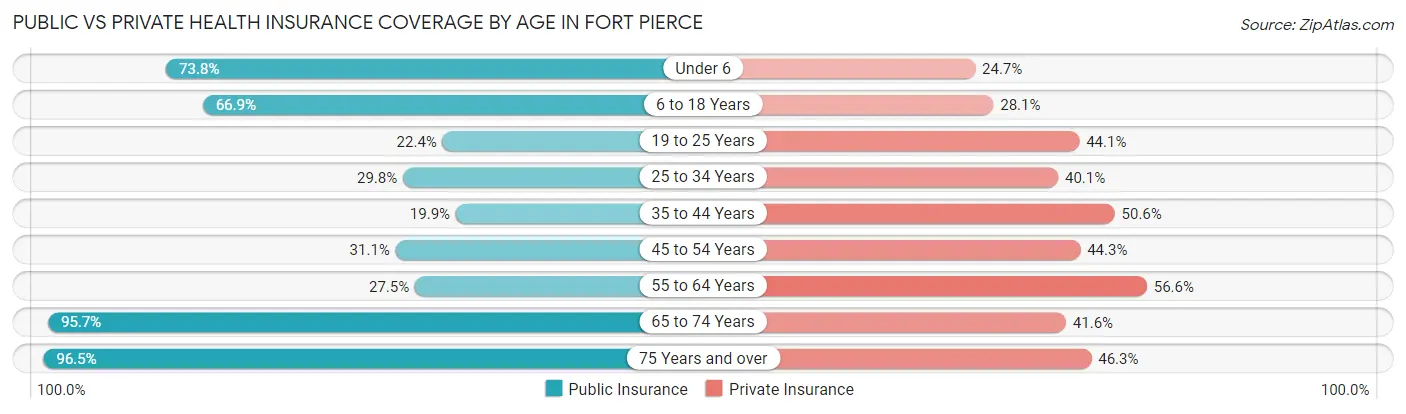
| Age Bracket | Public Insurance | Private Insurance |
| Under 6 | 2,835 (73.8%) | 951 (24.7%) |
| 6 to 18 Years | 5,400 (66.9%) | 2,269 (28.1%) |
| 19 to 25 Years | 995 (22.4%) | 1,957 (44.1%) |
| 25 to 34 Years | 1,629 (29.8%) | 2,197 (40.1%) |
| 35 to 44 Years | 929 (19.9%) | 2,359 (50.6%) |
| 45 to 54 Years | 1,682 (31.1%) | 2,392 (44.3%) |
| 55 to 64 Years | 1,462 (27.5%) | 3,007 (56.6%) |
| 65 to 74 Years | 5,707 (95.7%) | 2,482 (41.6%) |
| 75 Years and over | 3,331 (96.5%) | 1,598 (46.3%) |
| Total | 23,970 (51.4%) | 19,212 (41.2%) |
Disability Status by Sex by Age in Fort Pierce
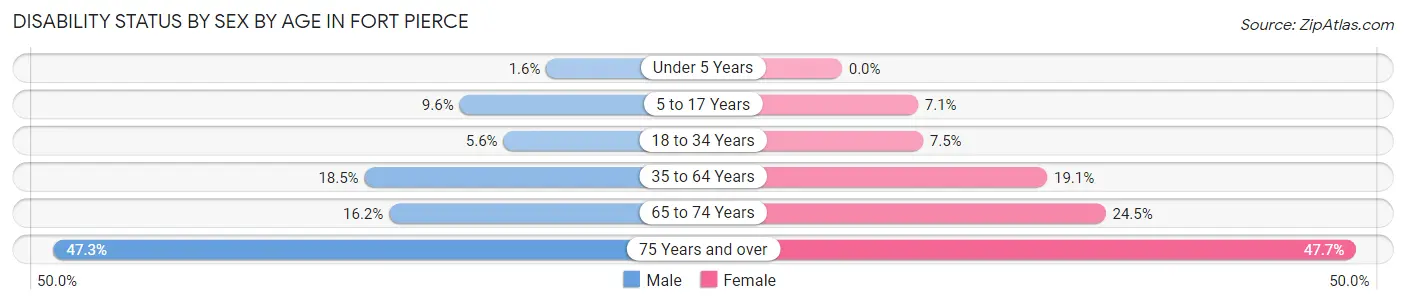
| Age Bracket | Male | Female |
| Under 5 Years | 23 (1.6%) | 0 (0.0%) |
| 5 to 17 Years | 429 (9.6%) | 243 (7.1%) |
| 18 to 34 Years | 281 (5.6%) | 420 (7.5%) |
| 35 to 64 Years | 1,328 (18.5%) | 1,558 (19.1%) |
| 65 to 74 Years | 443 (16.2%) | 790 (24.5%) |
| 75 Years and over | 781 (47.3%) | 859 (47.7%) |
Disability Class by Sex by Age in Fort Pierce
Disability Class: Hearing Difficulty
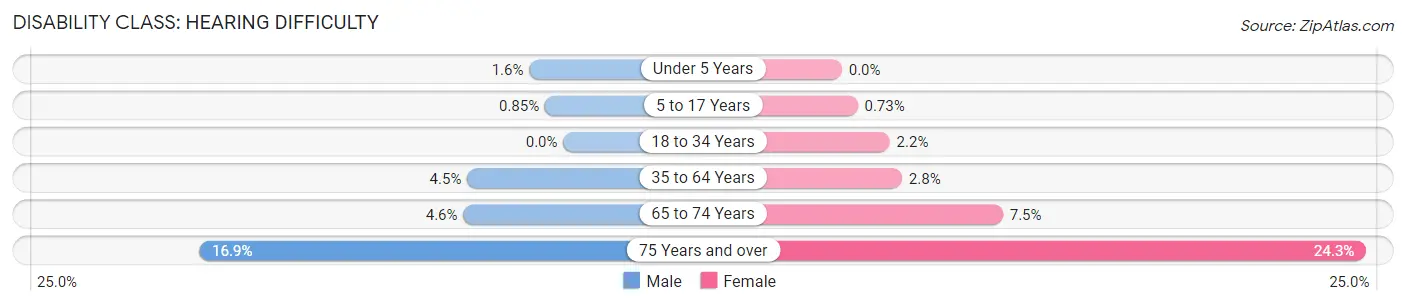
| Age Bracket | Male | Female |
| Under 5 Years | 23 (1.6%) | 0 (0.0%) |
| 5 to 17 Years | 38 (0.9%) | 25 (0.7%) |
| 18 to 34 Years | 0 (0.0%) | 124 (2.2%) |
| 35 to 64 Years | 321 (4.5%) | 228 (2.8%) |
| 65 to 74 Years | 127 (4.6%) | 241 (7.5%) |
| 75 Years and over | 279 (16.9%) | 438 (24.3%) |
Disability Class: Vision Difficulty
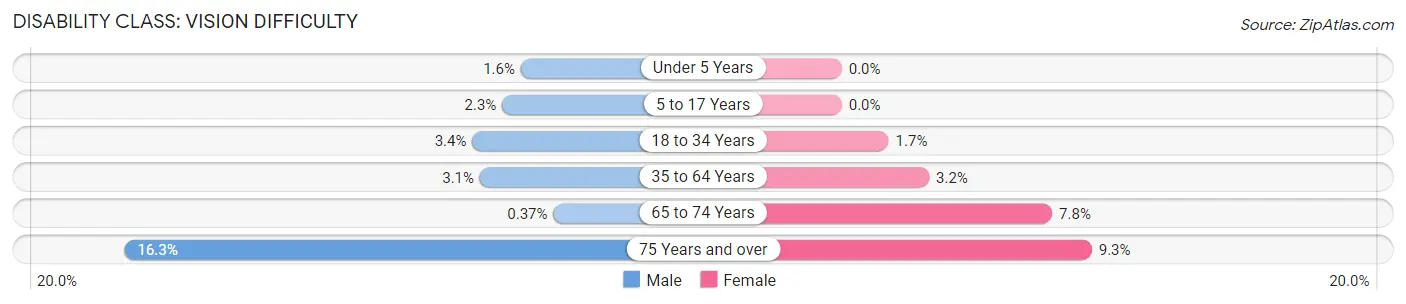
| Age Bracket | Male | Female |
| Under 5 Years | 23 (1.6%) | 0 (0.0%) |
| 5 to 17 Years | 101 (2.3%) | 0 (0.0%) |
| 18 to 34 Years | 171 (3.4%) | 97 (1.7%) |
| 35 to 64 Years | 223 (3.1%) | 265 (3.2%) |
| 65 to 74 Years | 10 (0.4%) | 252 (7.8%) |
| 75 Years and over | 269 (16.3%) | 167 (9.3%) |
Disability Class: Cognitive Difficulty
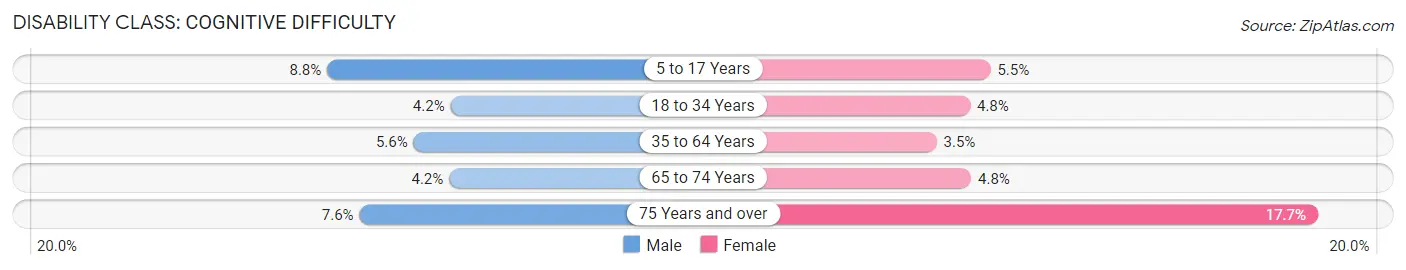
| Age Bracket | Male | Female |
| 5 to 17 Years | 390 (8.8%) | 190 (5.5%) |
| 18 to 34 Years | 212 (4.2%) | 266 (4.8%) |
| 35 to 64 Years | 400 (5.6%) | 288 (3.5%) |
| 65 to 74 Years | 116 (4.2%) | 155 (4.8%) |
| 75 Years and over | 125 (7.6%) | 318 (17.7%) |
Disability Class: Ambulatory Difficulty
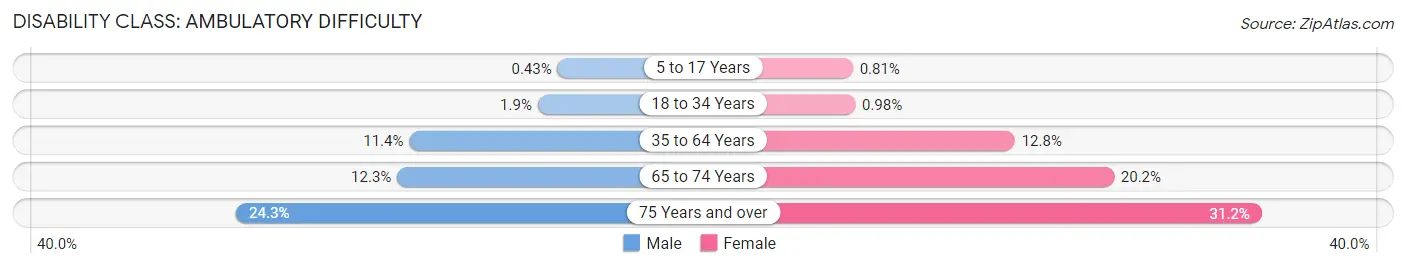
| Age Bracket | Male | Female |
| 5 to 17 Years | 19 (0.4%) | 28 (0.8%) |
| 18 to 34 Years | 96 (1.9%) | 55 (1.0%) |
| 35 to 64 Years | 823 (11.4%) | 1,050 (12.8%) |
| 65 to 74 Years | 338 (12.3%) | 652 (20.2%) |
| 75 Years and over | 401 (24.3%) | 561 (31.2%) |
Disability Class: Self-Care Difficulty
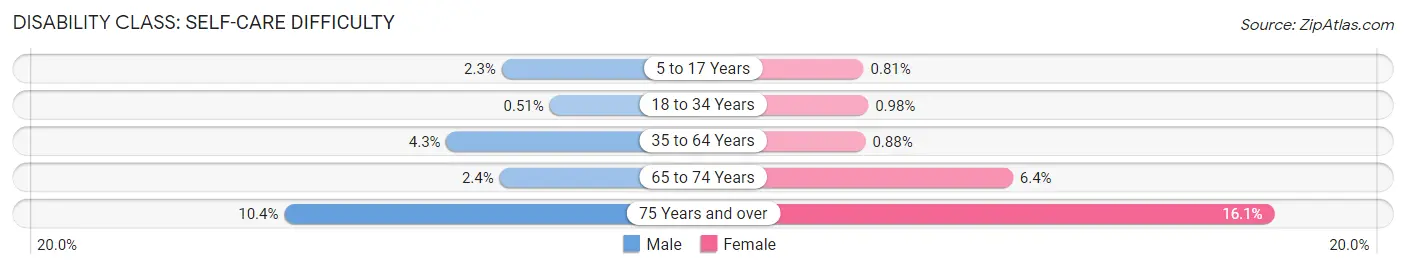
| Age Bracket | Male | Female |
| 5 to 17 Years | 102 (2.3%) | 28 (0.8%) |
| 18 to 34 Years | 26 (0.5%) | 55 (1.0%) |
| 35 to 64 Years | 312 (4.3%) | 72 (0.9%) |
| 65 to 74 Years | 65 (2.4%) | 205 (6.4%) |
| 75 Years and over | 171 (10.4%) | 289 (16.1%) |
Technology Access in Fort Pierce
Computing Device Access in Fort Pierce
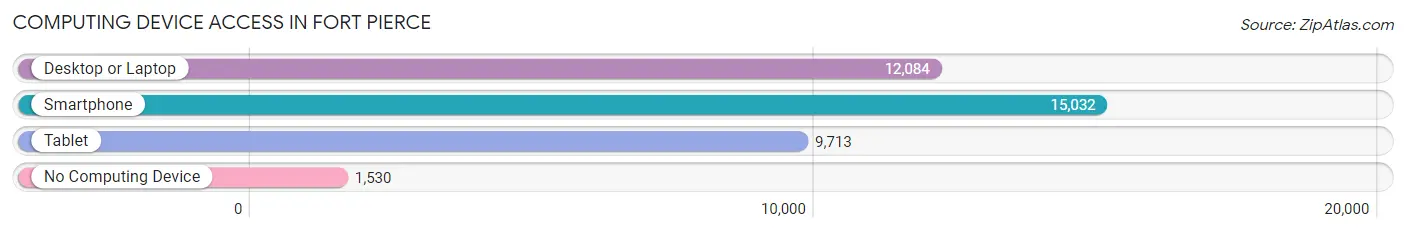
| Device Type | # Households | % Households |
| Desktop or Laptop | 12,084 | 67.2% |
| Smartphone | 15,032 | 83.7% |
| Tablet | 9,713 | 54.0% |
| No Computing Device | 1,530 | 8.5% |
| Total | 17,971 | 100.0% |
Internet Access in Fort Pierce
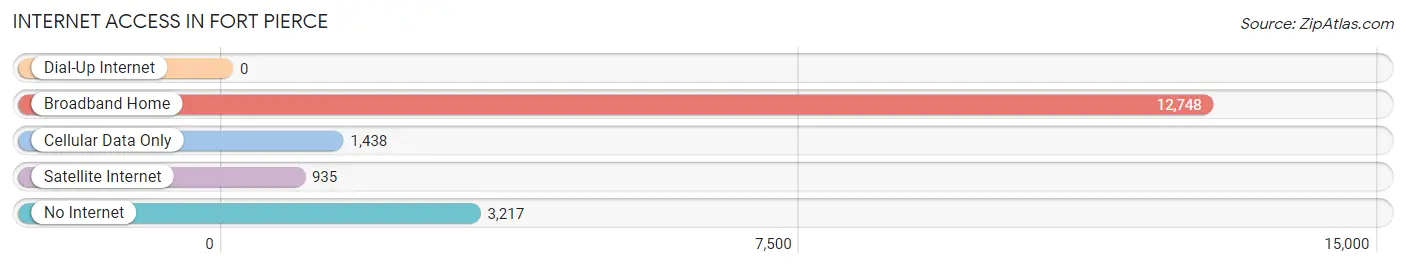
| Internet Type | # Households | % Households |
| Dial-Up Internet | 0 | 0.0% |
| Broadband Home | 12,748 | 70.9% |
| Cellular Data Only | 1,438 | 8.0% |
| Satellite Internet | 935 | 5.2% |
| No Internet | 3,217 | 17.9% |
| Total | 17,971 | 100.0% |
Fort Pierce Summary
Pierce, Florida is a city located in St. Lucie County, Florida, United States. It is the county seat of St. Lucie County and is located on the Indian River Lagoon, which is part of the Atlantic Intracoastal Waterway. The city is part of the Treasure Coast region of Florida and is known for its beaches, fishing, and outdoor activities. As of the 2010 census, the city had a population of 41,590.
History
The area that is now Fort Pierce was originally inhabited by the Ais Indians, who were part of the Seminole tribe. The area was first explored by Europeans in 1513 when Spanish explorer Ponce de Leon arrived in the area. The area was later explored by the French in 1565 and the British in 1763.
In 1837, the United States Army established a fort in the area, which was named Fort Pierce in honor of Colonel Benjamin Pierce, who was the brother of President Franklin Pierce. The fort was used as a base for the Seminole Wars and was abandoned in 1842.
In 1851, the area was incorporated as the Town of Fort Pierce. The town was a major port for the citrus industry and was a major center for the cattle industry. In the late 19th century, the area was a popular destination for tourists and was known for its fishing and hunting.
In the early 20th century, the area was a major center for the pineapple industry. The city was also a major center for the citrus industry and was home to several packing houses.
In the 1950s, the city began to experience rapid growth due to the development of the nearby St. Lucie Nuclear Power Plant. The city was also a major center for the aerospace industry and was home to several defense contractors.
Geography
Fort Pierce is located in St. Lucie County, Florida, United States. It is located on the Indian River Lagoon, which is part of the Atlantic Intracoastal Waterway. The city is located on the Treasure Coast of Florida and is bordered by the cities of Port St. Lucie to the north, Vero Beach to the south, and Stuart to the east.
The city has a total area of 16.2 square miles, of which 15.7 square miles is land and 0.5 square miles is water. The city is located at an elevation of 11 feet above sea level.
Economy
The economy of Fort Pierce is largely based on tourism, agriculture, and manufacturing. The city is a major center for the citrus industry and is home to several packing houses. The city is also a major center for the aerospace industry and is home to several defense contractors.
The city is also home to several major employers, including the St. Lucie County School District, Indian River State College, and the St. Lucie County Sheriff's Office.
Demographics
As of the 2010 census, the city had a population of 41,590. The racial makeup of the city was 57.2% White, 28.3% African American, 0.5% Native American, 1.3% Asian, 0.1% Pacific Islander, 9.7% from other races, and 2.9% from two or more races. Hispanic or Latino of any race were 22.3% of the population.
The median income for a household in the city was $35,945 and the median income for a family was $41,945. The per capita income for the city was $19,945. About 17.2% of families and 21.3% of the population were below the poverty line, including 28.3% of those under age 18 and 11.2% of those age 65 or over.
Common Questions
What is the Total Population of Fort Pierce?
Total Population of Fort Pierce is 47,153.
What is the Total Male Population of Fort Pierce?
Total Male Population of Fort Pierce is 22,833.
What is the Total Female Population of Fort Pierce?
Total Female Population of Fort Pierce is 24,320.
What is the Ratio of Males per 100 Females in Fort Pierce?
There are 93.89 Males per 100 Females in Fort Pierce.
What is the Ratio of Females per 100 Males in Fort Pierce?
There are 106.51 Females per 100 Males in Fort Pierce.
What is the Median Population Age in Fort Pierce?
Median Population Age in Fort Pierce is 38.4 Years.
What is the Average Family Size in Fort Pierce
Average Family Size in Fort Pierce is 3.3 People.
What is the Average Household Size in Fort Pierce
Average Household Size in Fort Pierce is 2.6 People.
What is Per Capita Income in Fort Pierce?
Per Capita income in Fort Pierce is $23,834.
What is the Median Family Income in Fort Pierce?
Median Family Income in Fort Pierce is $53,288.
What is the Median Household income in Fort Pierce?
Median Household Income in Fort Pierce is $45,121.
What is Income or Wage Gap in Fort Pierce?
Income or Wage Gap in Fort Pierce is 32.2%.
Women in Fort Pierce earn 67.8 cents for every dollar earned by a man.
What is Family Income Deficit in Fort Pierce?
Family Income Deficit in Fort Pierce is $12,930.
Families that are below poverty line in Fort Pierce earn $12,930 less on average than the poverty threshold level.
What is Inequality or Gini Index in Fort Pierce?
Inequality or Gini Index in Fort Pierce is 0.47.
How Large is the Labor Force in Fort Pierce?
There are 20,065 People in the Labor Forcein in Fort Pierce.
What is the Percentage of People in the Labor Force in Fort Pierce?
53.9% of People are in the Labor Force in Fort Pierce.
What is the Unemployment Rate in Fort Pierce?
Unemployment Rate in Fort Pierce is 10.4%.