Westchester, FL
Westchester Map
Westchester Overview
53,765
TOTAL POPULATION
25,130
MALE POPULATION
28,635
FEMALE POPULATION
87.76
MALES / 100 FEMALES
113.95
FEMALES / 100 MALES
45.9
MEDIAN AGE
3.2
AVG FAMILY SIZE
2.9
AVG HOUSEHOLD SIZE
$32,438
PER CAPITA INCOME
$82,883
AVG FAMILY INCOME
$74,175
AVG HOUSEHOLD INCOME
31.6%
WAGE / INCOME GAP [ % ]
68.4¢/ $1
WAGE / INCOME GAP [ $ ]
0.44
INEQUALITY / GINI INDEX
29,016
LABOR FORCE [ PEOPLE ]
61.5%
PERCENT IN LABOR FORCE
4.3%
UNEMPLOYMENT RATE
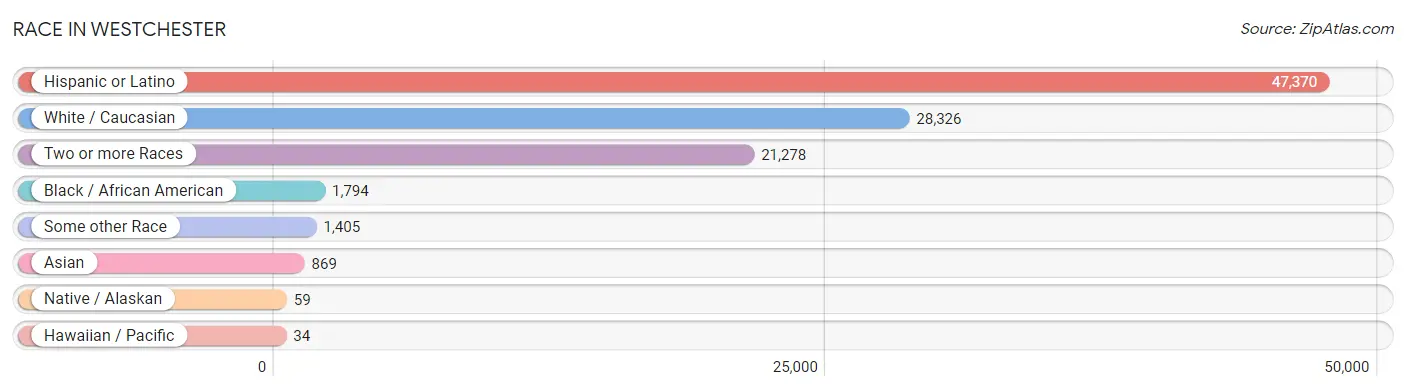
Race in Westchester
The most populous races in Westchester are Hispanic or Latino (47,370 | 88.1%), White / Caucasian (28,326 | 52.7%), and Two or more Races (21,278 | 39.6%).
| Race | # Population | % Population |
| Asian | 869 | 1.6% |
| Black / African American | 1,794 | 3.3% |
| Hawaiian / Pacific | 34 | 0.1% |
| Hispanic or Latino | 47,370 | 88.1% |
| Native / Alaskan | 59 | 0.1% |
| White / Caucasian | 28,326 | 52.7% |
| Two or more Races | 21,278 | 39.6% |
| Some other Race | 1,405 | 2.6% |
| Total | 53,765 | 100.0% |
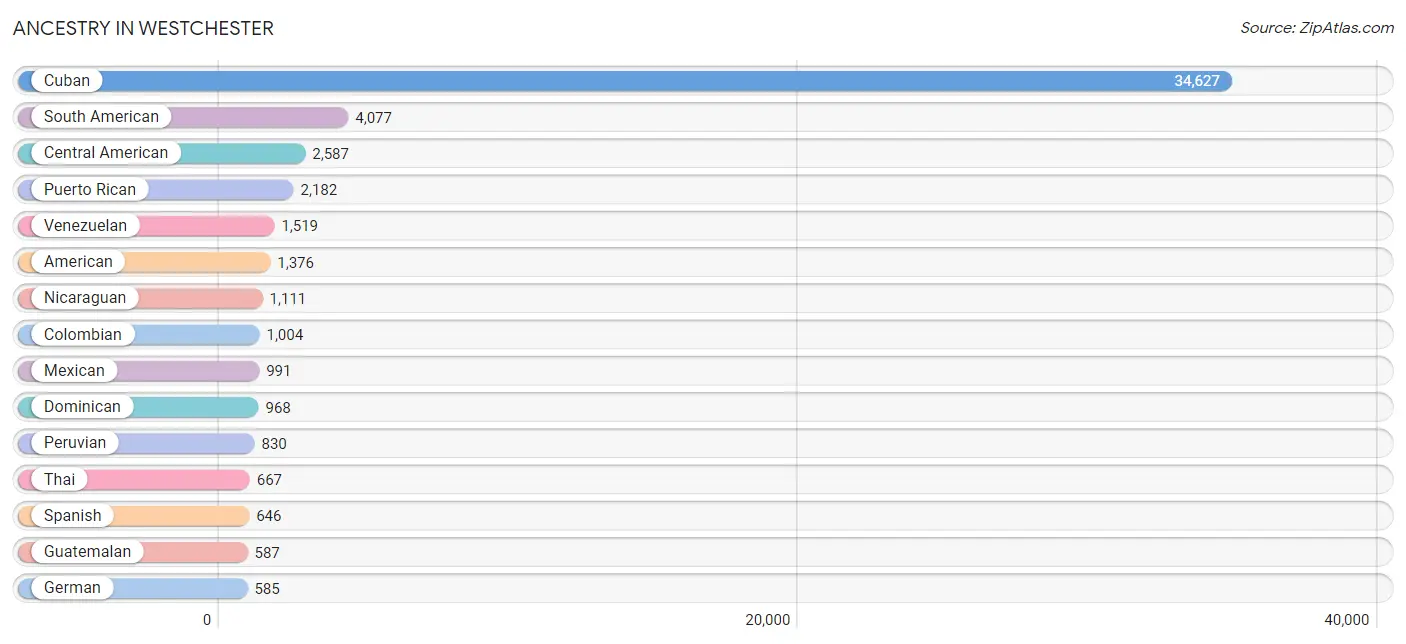
Ancestry in Westchester
The most populous ancestries reported in Westchester are Cuban (34,627 | 64.4%), South American (4,077 | 7.6%), Central American (2,587 | 4.8%), Puerto Rican (2,182 | 4.1%), and Venezuelan (1,519 | 2.8%), together accounting for 83.7% of all Westchester residents.
| Ancestry | # Population | % Population |
| African | 65 | 0.1% |
| American | 1,376 | 2.6% |
| Arab | 99 | 0.2% |
| Argentinean | 413 | 0.8% |
| Austrian | 51 | 0.1% |
| Bahamian | 4 | 0.0% |
| Bhutanese | 9 | 0.0% |
| Blackfeet | 8 | 0.0% |
| Bolivian | 18 | 0.0% |
| Brazilian | 169 | 0.3% |
| British | 62 | 0.1% |
| Burmese | 8 | 0.0% |
| Canadian | 5 | 0.0% |
| Central American | 2,587 | 4.8% |
| Cherokee | 33 | 0.1% |
| Chilean | 27 | 0.1% |
| Colombian | 1,004 | 1.9% |
| Comanche | 10 | 0.0% |
| Costa Rican | 133 | 0.3% |
| Cuban | 34,627 | 64.4% |
| Danish | 29 | 0.1% |
| Dominican | 968 | 1.8% |
| Dutch | 21 | 0.0% |
| Eastern European | 16 | 0.0% |
| Ecuadorian | 213 | 0.4% |
| English | 375 | 0.7% |
| European | 146 | 0.3% |
| Filipino | 11 | 0.0% |
| French | 443 | 0.8% |
| French Canadian | 1 | 0.0% |
| German | 585 | 1.1% |
| Greek | 28 | 0.1% |
| Guatemalan | 587 | 1.1% |
| Haitian | 40 | 0.1% |
| Honduran | 459 | 0.9% |
| Hungarian | 147 | 0.3% |
| Indian (Asian) | 491 | 0.9% |
| Iranian | 170 | 0.3% |
| Irish | 365 | 0.7% |
| Israeli | 43 | 0.1% |
| Italian | 489 | 0.9% |
| Jamaican | 90 | 0.2% |
| Korean | 78 | 0.2% |
| Lebanese | 83 | 0.2% |
| Malaysian | 32 | 0.1% |
| Mexican | 991 | 1.8% |
| Native Hawaiian | 34 | 0.1% |
| Nicaraguan | 1,111 | 2.1% |
| Nigerian | 25 | 0.1% |
| Pakistani | 32 | 0.1% |
| Panamanian | 241 | 0.4% |
| Peruvian | 830 | 1.5% |
| Polish | 104 | 0.2% |
| Portuguese | 175 | 0.3% |
| Puerto Rican | 2,182 | 4.1% |
| Romanian | 57 | 0.1% |
| Russian | 85 | 0.2% |
| Salvadoran | 56 | 0.1% |
| Scotch-Irish | 263 | 0.5% |
| Scottish | 150 | 0.3% |
| South American | 4,077 | 7.6% |
| South American Indian | 44 | 0.1% |
| Spaniard | 358 | 0.7% |
| Spanish | 646 | 1.2% |
| Sri Lankan | 14 | 0.0% |
| Subsaharan African | 90 | 0.2% |
| Swedish | 12 | 0.0% |
| Swiss | 24 | 0.0% |
| Thai | 667 | 1.2% |
| U.S. Virgin Islander | 1 | 0.0% |
| Ukrainian | 37 | 0.1% |
| Uruguayan | 53 | 0.1% |
| Venezuelan | 1,519 | 2.8% |
| Vietnamese | 17 | 0.0% |
| Welsh | 22 | 0.0% | View All 75 Rows |
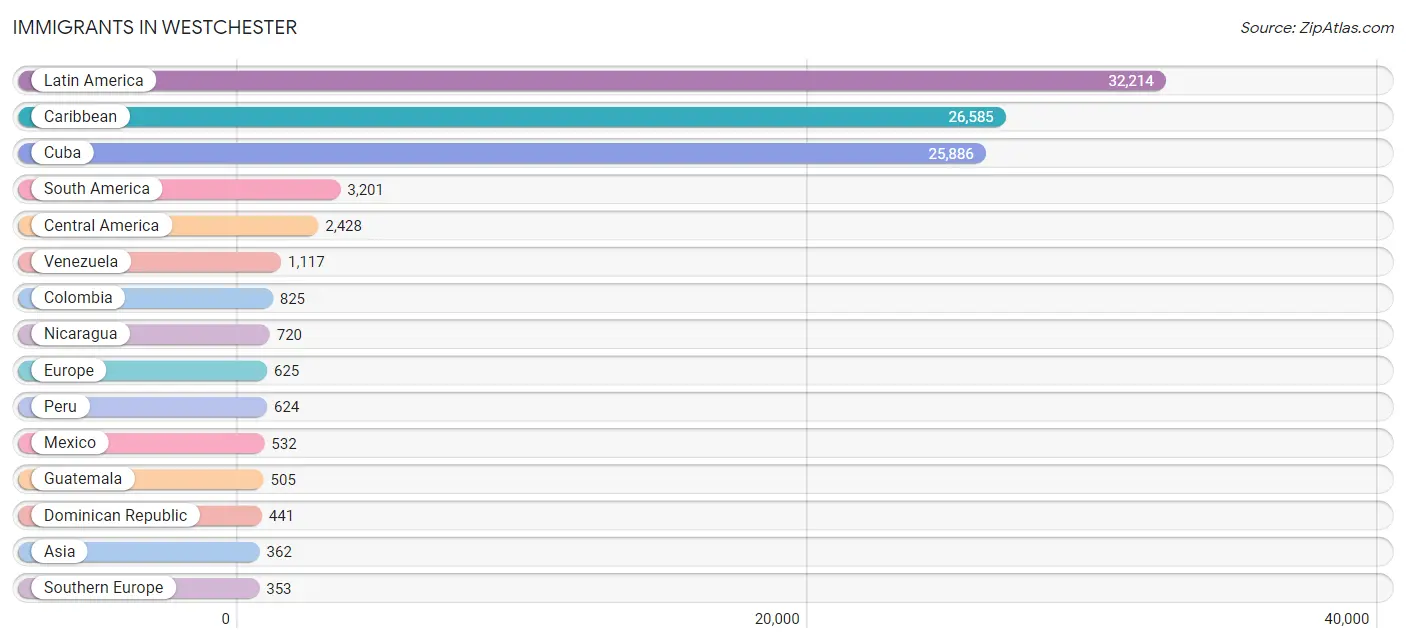
Immigrants in Westchester
The most numerous immigrant groups reported in Westchester came from Latin America (32,214 | 59.9%), Caribbean (26,585 | 49.4%), Cuba (25,886 | 48.1%), South America (3,201 | 5.9%), and Central America (2,428 | 4.5%), together accounting for 168.0% of all Westchester residents.
| Immigration Origin | # Population | % Population |
| Africa | 59 | 0.1% |
| Argentina | 251 | 0.5% |
| Asia | 362 | 0.7% |
| Bahamas | 47 | 0.1% |
| Belarus | 13 | 0.0% |
| Bolivia | 36 | 0.1% |
| Brazil | 93 | 0.2% |
| Canada | 50 | 0.1% |
| Caribbean | 26,585 | 49.4% |
| Central America | 2,428 | 4.5% |
| Chile | 30 | 0.1% |
| China | 155 | 0.3% |
| Colombia | 825 | 1.5% |
| Costa Rica | 94 | 0.2% |
| Cuba | 25,886 | 48.1% |
| Dominican Republic | 441 | 0.8% |
| Eastern Africa | 21 | 0.0% |
| Eastern Asia | 172 | 0.3% |
| Eastern Europe | 124 | 0.2% |
| Ecuador | 193 | 0.4% |
| Egypt | 8 | 0.0% |
| El Salvador | 20 | 0.0% |
| Europe | 625 | 1.2% |
| France | 20 | 0.0% |
| Germany | 80 | 0.2% |
| Greece | 12 | 0.0% |
| Guatemala | 505 | 0.9% |
| Haiti | 29 | 0.1% |
| Honduras | 324 | 0.6% |
| Hungary | 92 | 0.2% |
| India | 50 | 0.1% |
| Iran | 24 | 0.0% |
| Israel | 8 | 0.0% |
| Italy | 10 | 0.0% |
| Jamaica | 89 | 0.2% |
| Japan | 9 | 0.0% |
| Korea | 8 | 0.0% |
| Latin America | 32,214 | 59.9% |
| Mexico | 532 | 1.0% |
| Nepal | 17 | 0.0% |
| Nicaragua | 720 | 1.3% |
| Nigeria | 25 | 0.1% |
| Northern Africa | 8 | 0.0% |
| Northern Europe | 48 | 0.1% |
| Pakistan | 44 | 0.1% |
| Panama | 233 | 0.4% |
| Peru | 624 | 1.2% |
| Philippines | 40 | 0.1% |
| Poland | 9 | 0.0% |
| Romania | 10 | 0.0% |
| Scotland | 11 | 0.0% |
| South Africa | 5 | 0.0% |
| South America | 3,201 | 5.9% |
| South Central Asia | 135 | 0.3% |
| South Eastern Asia | 47 | 0.1% |
| Southern Europe | 353 | 0.7% |
| Spain | 331 | 0.6% |
| Taiwan | 11 | 0.0% |
| Trinidad and Tobago | 88 | 0.2% |
| Uruguay | 32 | 0.1% |
| Venezuela | 1,117 | 2.1% |
| Vietnam | 7 | 0.0% |
| Western Africa | 25 | 0.1% |
| Western Asia | 8 | 0.0% |
| Western Europe | 100 | 0.2% | View All 65 Rows |
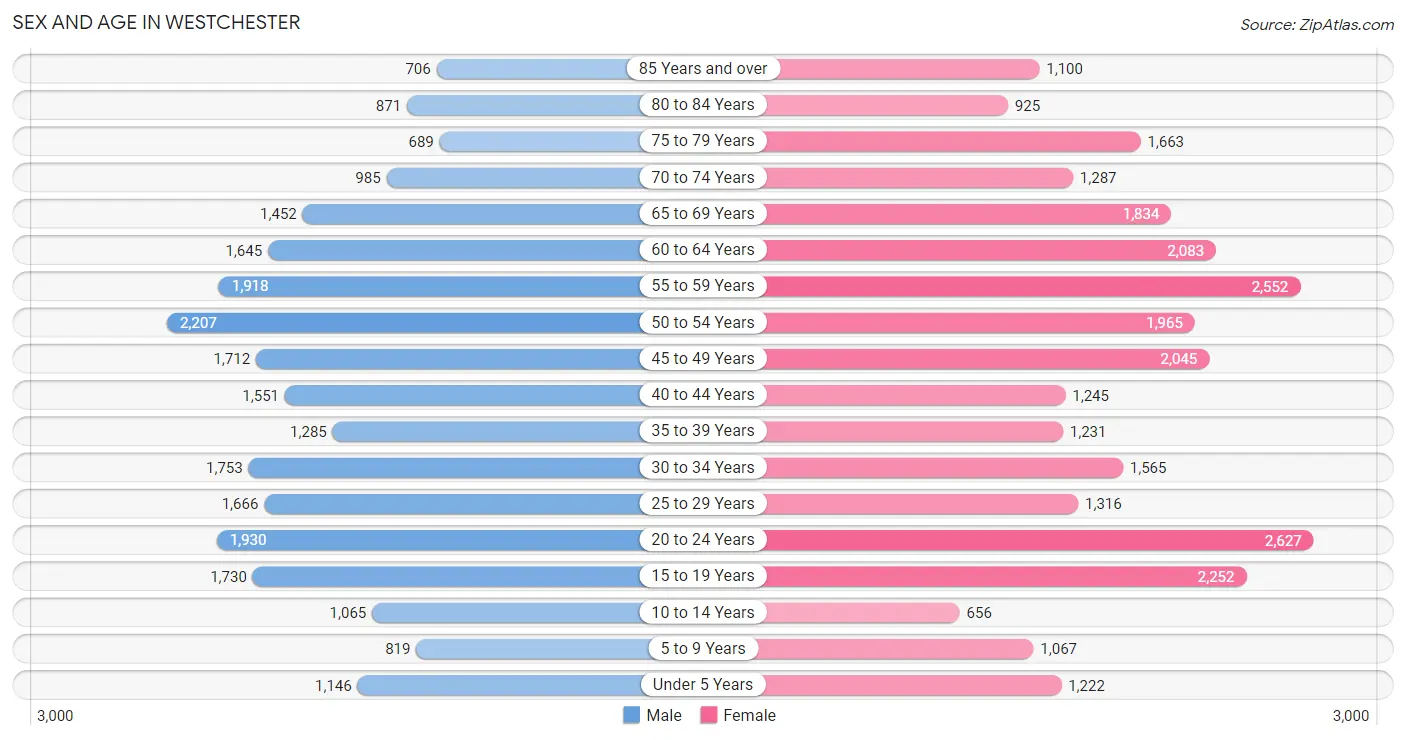
Sex and Age in Westchester
Sex and Age in Westchester
The most populous age groups in Westchester are 50 to 54 Years (2,207 | 8.8%) for men and 20 to 24 Years (2,627 | 9.2%) for women.
| Age Bracket | Male | Female |
| Under 5 Years | 1,146 (4.6%) | 1,222 (4.3%) |
| 5 to 9 Years | 819 (3.3%) | 1,067 (3.7%) |
| 10 to 14 Years | 1,065 (4.2%) | 656 (2.3%) |
| 15 to 19 Years | 1,730 (6.9%) | 2,252 (7.9%) |
| 20 to 24 Years | 1,930 (7.7%) | 2,627 (9.2%) |
| 25 to 29 Years | 1,666 (6.6%) | 1,316 (4.6%) |
| 30 to 34 Years | 1,753 (7.0%) | 1,565 (5.5%) |
| 35 to 39 Years | 1,285 (5.1%) | 1,231 (4.3%) |
| 40 to 44 Years | 1,551 (6.2%) | 1,245 (4.3%) |
| 45 to 49 Years | 1,712 (6.8%) | 2,045 (7.1%) |
| 50 to 54 Years | 2,207 (8.8%) | 1,965 (6.9%) |
| 55 to 59 Years | 1,918 (7.6%) | 2,552 (8.9%) |
| 60 to 64 Years | 1,645 (6.6%) | 2,083 (7.3%) |
| 65 to 69 Years | 1,452 (5.8%) | 1,834 (6.4%) |
| 70 to 74 Years | 985 (3.9%) | 1,287 (4.5%) |
| 75 to 79 Years | 689 (2.7%) | 1,663 (5.8%) |
| 80 to 84 Years | 871 (3.5%) | 925 (3.2%) |
| 85 Years and over | 706 (2.8%) | 1,100 (3.8%) |
| Total | 25,130 (100.0%) | 28,635 (100.0%) |
Families and Households in Westchester
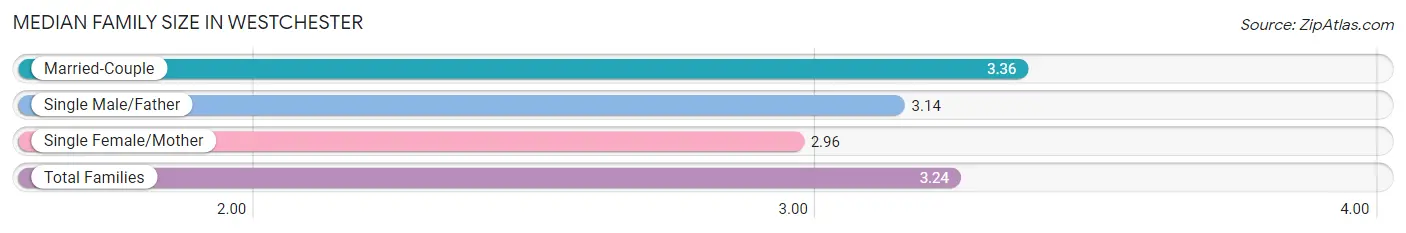
Median Family Size in Westchester
The median family size in Westchester is 3.24 persons per family, with married-couple families (8,485 | 64.3%) accounting for the largest median family size of 3.36 persons per family. On the other hand, single female/mother families (3,350 | 25.4%) represent the smallest median family size with 2.96 persons per family.
| Family Type | # Families | Family Size |
| Married-Couple | 8,485 (64.3%) | 3.36 |
| Single Male/Father | 1,352 (10.2%) | 3.14 |
| Single Female/Mother | 3,350 (25.4%) | 2.96 |
| Total Families | 13,187 (100.0%) | 3.24 |
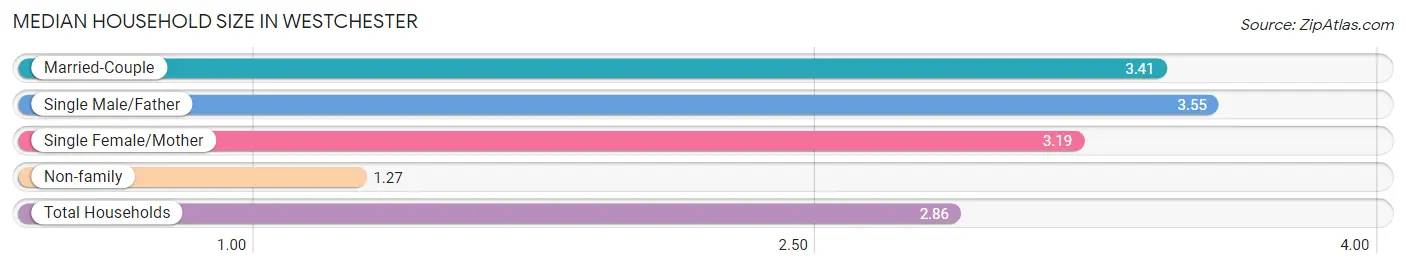
Median Household Size in Westchester
The median household size in Westchester is 2.86 persons per household, with single male/father households (1,352 | 7.8%) accounting for the largest median household size of 3.55 persons per household. non-family households (4,238 | 24.3%) represent the smallest median household size with 1.27 persons per household.
| Household Type | # Households | Household Size |
| Married-Couple | 8,485 (48.7%) | 3.41 |
| Single Male/Father | 1,352 (7.8%) | 3.55 |
| Single Female/Mother | 3,350 (19.2%) | 3.19 |
| Non-family | 4,238 (24.3%) | 1.27 |
| Total Households | 17,425 (100.0%) | 2.86 |
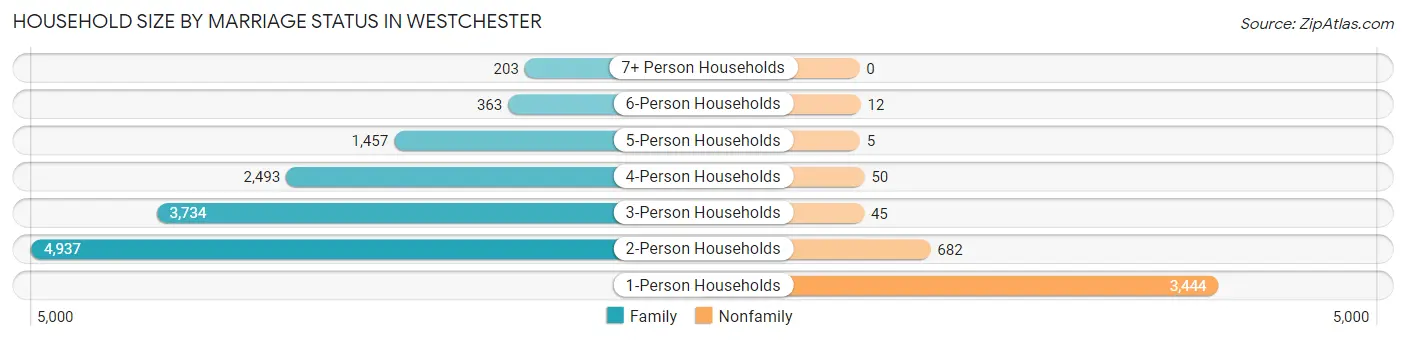
Household Size by Marriage Status in Westchester
Out of a total of 17,425 households in Westchester, 13,187 (75.7%) are family households, while 4,238 (24.3%) are nonfamily households. The most numerous type of family households are 2-person households, comprising 4,937, and the most common type of nonfamily households are 1-person households, comprising 3,444.
| Household Size | Family Households | Nonfamily Households |
| 1-Person Households | - | 3,444 (19.8%) |
| 2-Person Households | 4,937 (28.3%) | 682 (3.9%) |
| 3-Person Households | 3,734 (21.4%) | 45 (0.3%) |
| 4-Person Households | 2,493 (14.3%) | 50 (0.3%) |
| 5-Person Households | 1,457 (8.4%) | 5 (0.0%) |
| 6-Person Households | 363 (2.1%) | 12 (0.1%) |
| 7+ Person Households | 203 (1.2%) | 0 (0.0%) |
| Total | 13,187 (75.7%) | 4,238 (24.3%) |
Female Fertility in Westchester
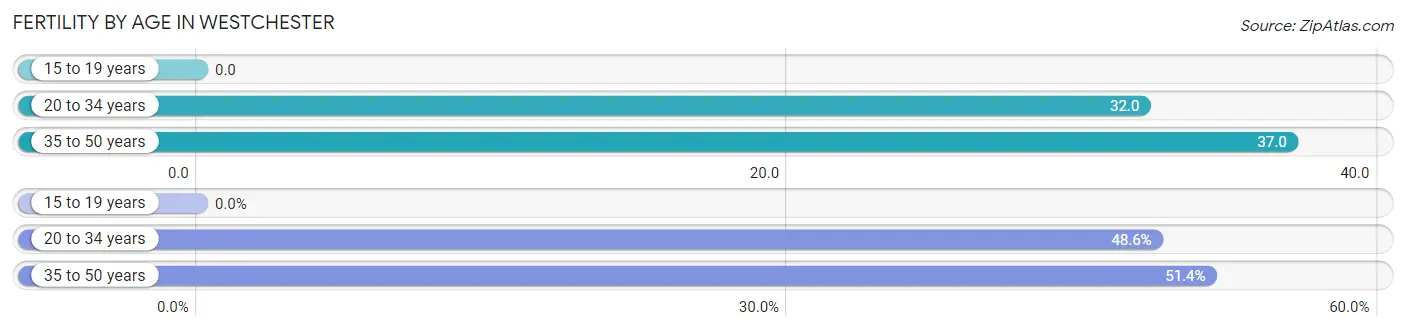
Fertility by Age in Westchester
Average fertility rate in Westchester is 28.0 births per 1,000 women. Women in the age bracket of 35 to 50 years have the highest fertility rate with 37.0 births per 1,000 women. Women in the age bracket of 35 to 50 years acount for 51.4% of all women with births.
| Age Bracket | Women with Births | Births / 1,000 Women |
| 15 to 19 years | 0 (0.0%) | 0.0 |
| 20 to 34 years | 177 (48.6%) | 32.0 |
| 35 to 50 years | 187 (51.4%) | 37.0 |
| Total | 364 (100.0%) | 28.0 |
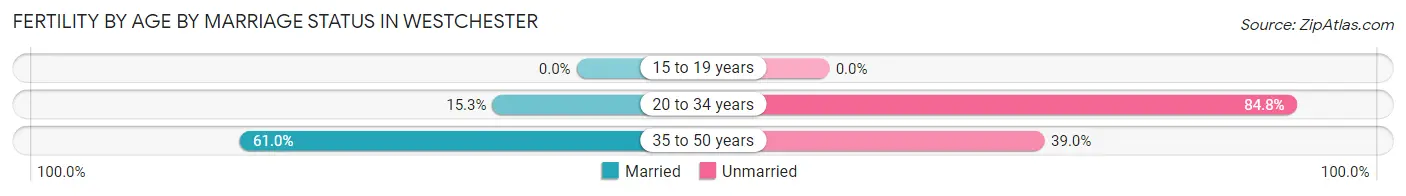
Fertility by Age by Marriage Status in Westchester
38.7% of women with births (364) in Westchester are married. The highest percentage of unmarried women with births falls into 20 to 34 years age bracket with 84.8% of them unmarried at the time of birth, while the lowest percentage of unmarried women with births belong to 35 to 50 years age bracket with 39.0% of them unmarried.
| Age Bracket | Married | Unmarried |
| 15 to 19 years | 0 (0.0%) | 0 (0.0%) |
| 20 to 34 years | 27 (15.2%) | 150 (84.8%) |
| 35 to 50 years | 114 (61.0%) | 73 (39.0%) |
| Total | 141 (38.7%) | 223 (61.3%) |
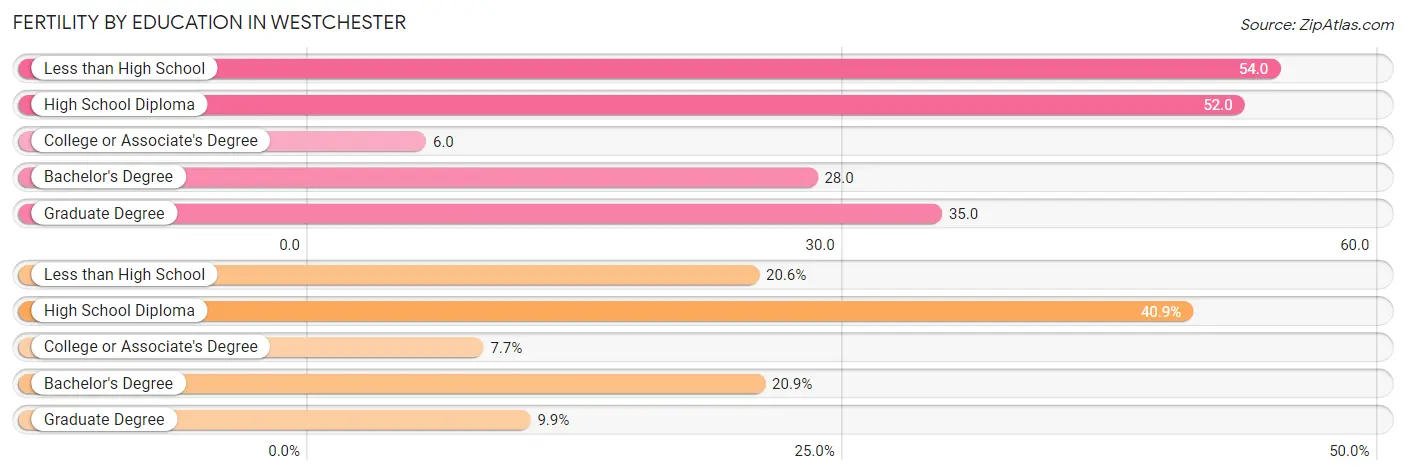
Fertility by Education in Westchester
Average fertility rate in Westchester is 28.0 births per 1,000 women. Women with the education attainment of less than high school have the highest fertility rate of 54.0 births per 1,000 women, while women with the education attainment of college or associate's degree have the lowest fertility at 6.0 births per 1,000 women. Women with the education attainment of high school diploma represent 40.9% of all women with births.
| Educational Attainment | Women with Births | Births / 1,000 Women |
| Less than High School | 75 (20.6%) | 54.0 |
| High School Diploma | 149 (40.9%) | 52.0 |
| College or Associate's Degree | 28 (7.7%) | 6.0 |
| Bachelor's Degree | 76 (20.9%) | 28.0 |
| Graduate Degree | 36 (9.9%) | 35.0 |
| Total | 364 (100.0%) | 28.0 |
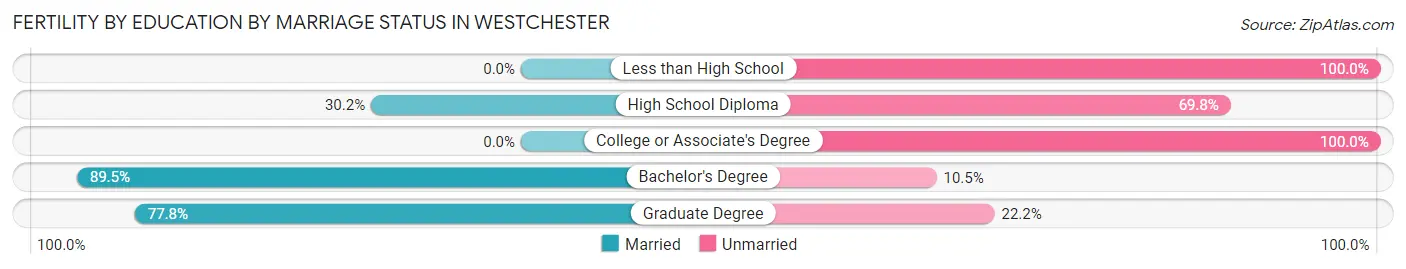
Fertility by Education by Marriage Status in Westchester
61.3% of women with births in Westchester are unmarried. Women with the educational attainment of bachelor's degree are most likely to be married with 89.5% of them married at childbirth, while women with the educational attainment of less than high school are least likely to be married with 100.0% of them unmarried at childbirth.
| Educational Attainment | Married | Unmarried |
| Less than High School | 0 (0.0%) | 75 (100.0%) |
| High School Diploma | 45 (30.2%) | 104 (69.8%) |
| College or Associate's Degree | 0 (0.0%) | 28 (100.0%) |
| Bachelor's Degree | 68 (89.5%) | 8 (10.5%) |
| Graduate Degree | 28 (77.8%) | 8 (22.2%) |
| Total | 141 (38.7%) | 223 (61.3%) |
Income in Westchester
Income Overview in Westchester
Per Capita Income in Westchester is $32,438, while median incomes of families and households are $82,883 and $74,175 respectively.
| Characteristic | Number | Measure |
| Per Capita Income | 53,765 | $32,438 |
| Median Family Income | 13,187 | $82,883 |
| Mean Family Income | 13,187 | $104,586 |
| Median Household Income | 17,425 | $74,175 |
| Mean Household Income | 17,425 | $94,574 |
| Income Deficit | 13,187 | $0 |
| Wage / Income Gap (%) | 53,765 | 31.64% |
| Wage / Income Gap ($) | 53,765 | 68.36¢ per $1 |
| Gini / Inequality Index | 53,765 | 0.44 |
Earnings by Sex in Westchester
Average Earnings in Westchester are $34,458, $39,959 for men and $27,316 for women, a difference of 31.6%.
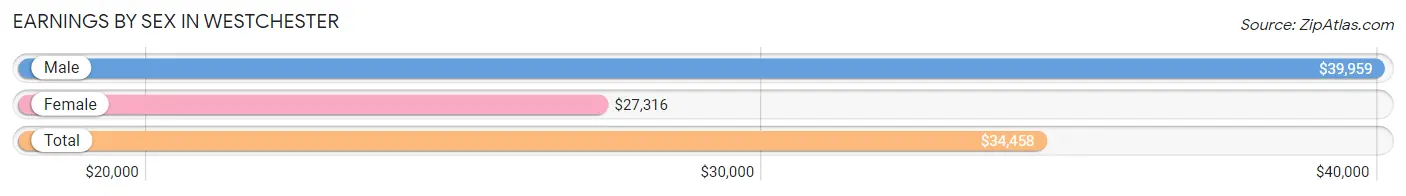
| Sex | Number | Average Earnings |
| Male | 15,306 (50.8%) | $39,959 |
| Female | 14,806 (49.2%) | $27,316 |
| Total | 30,112 (100.0%) | $34,458 |
Earnings by Sex by Income Bracket in Westchester
The most common earnings brackets in Westchester are $100,000+ for men (1,890 | 12.3%) and $75,000 to $99,999 for women (1,663 | 11.2%).
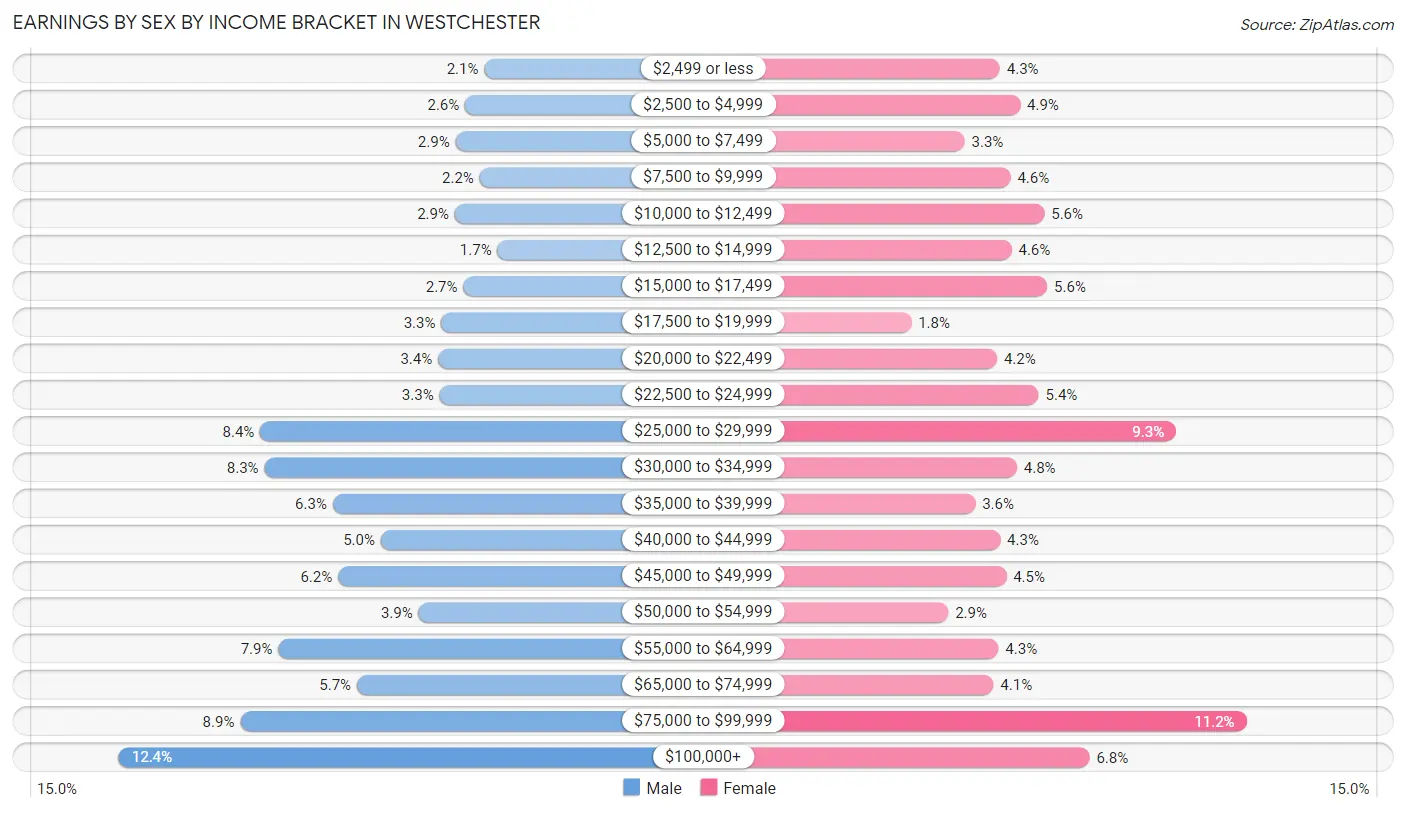
| Income | Male | Female |
| $2,499 or less | 318 (2.1%) | 636 (4.3%) |
| $2,500 to $4,999 | 401 (2.6%) | 721 (4.9%) |
| $5,000 to $7,499 | 442 (2.9%) | 490 (3.3%) |
| $7,500 to $9,999 | 339 (2.2%) | 681 (4.6%) |
| $10,000 to $12,499 | 446 (2.9%) | 821 (5.6%) |
| $12,500 to $14,999 | 261 (1.7%) | 685 (4.6%) |
| $15,000 to $17,499 | 409 (2.7%) | 833 (5.6%) |
| $17,500 to $19,999 | 503 (3.3%) | 268 (1.8%) |
| $20,000 to $22,499 | 517 (3.4%) | 625 (4.2%) |
| $22,500 to $24,999 | 511 (3.3%) | 798 (5.4%) |
| $25,000 to $29,999 | 1,282 (8.4%) | 1,369 (9.2%) |
| $30,000 to $34,999 | 1,264 (8.3%) | 707 (4.8%) |
| $35,000 to $39,999 | 970 (6.3%) | 535 (3.6%) |
| $40,000 to $44,999 | 764 (5.0%) | 638 (4.3%) |
| $45,000 to $49,999 | 948 (6.2%) | 664 (4.5%) |
| $50,000 to $54,999 | 602 (3.9%) | 422 (2.9%) |
| $55,000 to $64,999 | 1,204 (7.9%) | 630 (4.3%) |
| $65,000 to $74,999 | 866 (5.7%) | 610 (4.1%) |
| $75,000 to $99,999 | 1,369 (8.9%) | 1,663 (11.2%) |
| $100,000+ | 1,890 (12.3%) | 1,010 (6.8%) |
| Total | 15,306 (100.0%) | 14,806 (100.0%) |
Earnings by Sex by Educational Attainment in Westchester
Average earnings in Westchester are $44,361 for men and $33,308 for women, a difference of 24.9%. Men with an educational attainment of graduate degree enjoy the highest average annual earnings of $63,611, while those with less than high school education earn the least with $30,016. Women with an educational attainment of graduate degree earn the most with the average annual earnings of $67,500, while those with high school diploma education have the smallest earnings of $22,769.
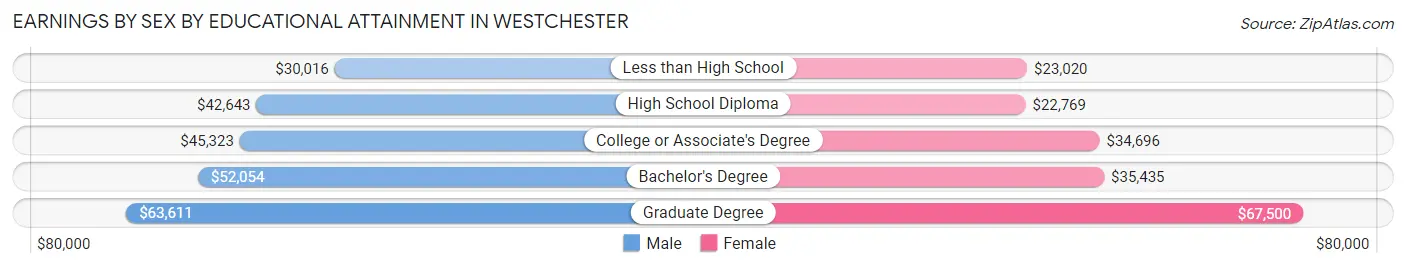
| Educational Attainment | Male Income | Female Income |
| Less than High School | $30,016 | $23,020 |
| High School Diploma | $42,643 | $22,769 |
| College or Associate's Degree | $45,323 | $34,696 |
| Bachelor's Degree | $52,054 | $35,435 |
| Graduate Degree | $63,611 | $67,500 |
| Total | $44,361 | $33,308 |
Family Income in Westchester
Family Income Brackets in Westchester
According to the Westchester family income data, there are 3,112 families falling into the $100,000 to $149,999 income range, which is the most common income bracket and makes up 23.6% of all families. Conversely, the less than $10,000 income bracket is the least frequent group with only 211 families (1.6%) belonging to this category.
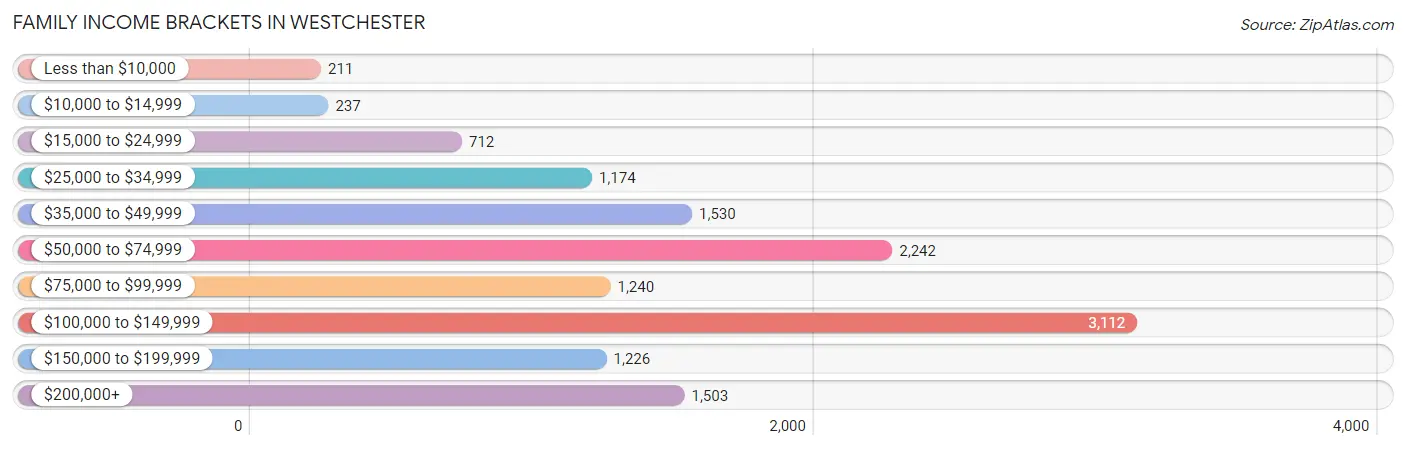
| Income Bracket | # Families | % Families |
| Less than $10,000 | 211 | 1.6% |
| $10,000 to $14,999 | 237 | 1.8% |
| $15,000 to $24,999 | 712 | 5.4% |
| $25,000 to $34,999 | 1,174 | 8.9% |
| $35,000 to $49,999 | 1,530 | 11.6% |
| $50,000 to $74,999 | 2,242 | 17.0% |
| $75,000 to $99,999 | 1,240 | 9.4% |
| $100,000 to $149,999 | 3,112 | 23.6% |
| $150,000 to $199,999 | 1,226 | 9.3% |
| $200,000+ | 1,503 | 11.4% |
Family Income by Famaliy Size in Westchester
7+ person families (101 | 0.8%) account for the highest median family income in Westchester with $203,219 per family, while 4-person families (2,221 | 16.8%) have the highest median income of $29,407 per family member.
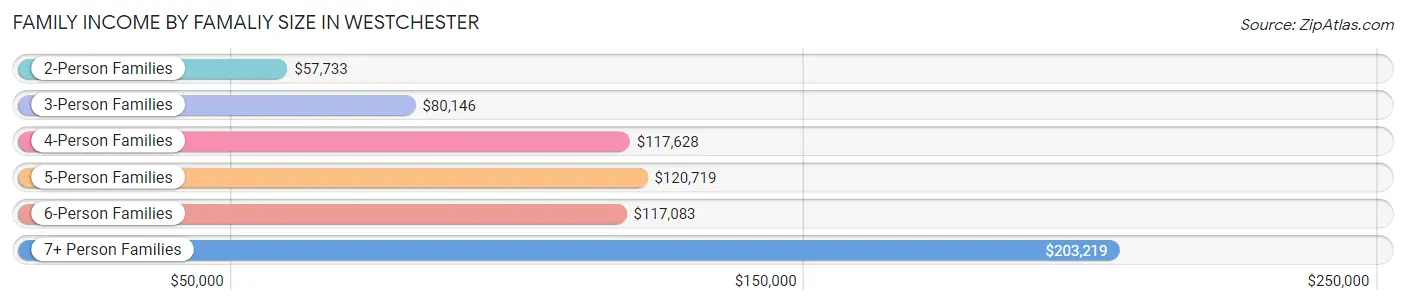
| Income Bracket | # Families | Median Income |
| 2-Person Families | 5,607 (42.5%) | $57,733 |
| 3-Person Families | 3,533 (26.8%) | $80,146 |
| 4-Person Families | 2,221 (16.8%) | $117,628 |
| 5-Person Families | 1,466 (11.1%) | $120,719 |
| 6-Person Families | 259 (2.0%) | $117,083 |
| 7+ Person Families | 101 (0.8%) | $203,219 |
| Total | 13,187 (100.0%) | $82,883 |
Family Income by Number of Earners in Westchester
The median family income in Westchester is $82,883, with families comprising 3+ earners (1,945) having the highest median family income of $132,451, while families with no earners (1,650) have the lowest median family income of $27,222, accounting for 14.7% and 12.5% of families, respectively.
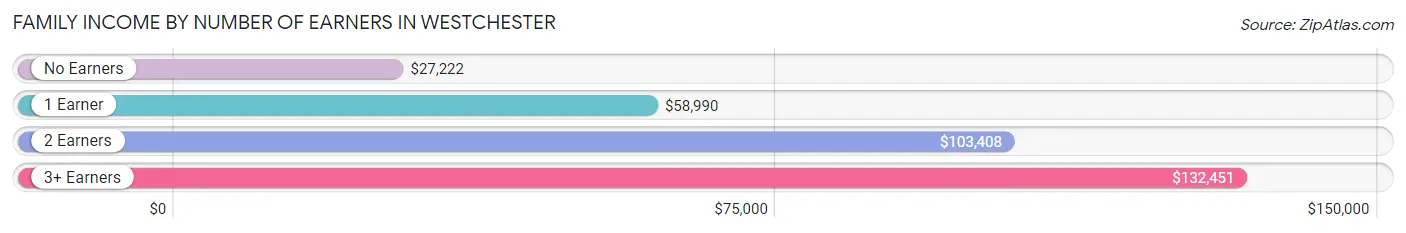
| Number of Earners | # Families | Median Income |
| No Earners | 1,650 (12.5%) | $27,222 |
| 1 Earner | 3,540 (26.8%) | $58,990 |
| 2 Earners | 6,052 (45.9%) | $103,408 |
| 3+ Earners | 1,945 (14.7%) | $132,451 |
| Total | 13,187 (100.0%) | $82,883 |
Household Income in Westchester
Household Income Brackets in Westchester
With 3,380 households falling in the category, the $100,000 to $149,999 income range is the most frequent in Westchester, accounting for 19.4% of all households. In contrast, only 592 households (3.4%) fall into the less than $10,000 income bracket, making it the least populous group.
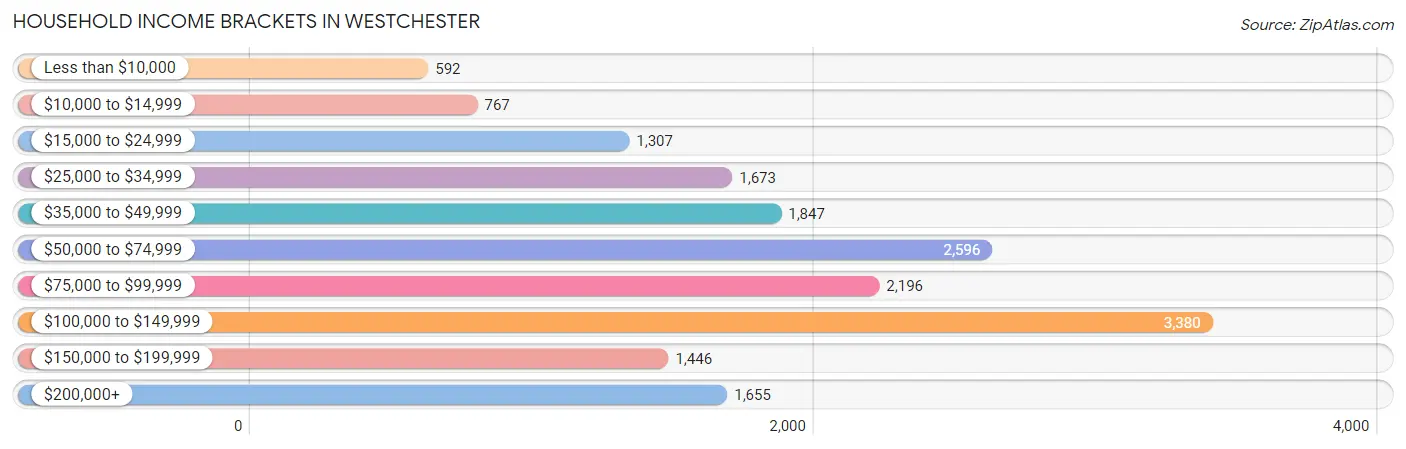
| Income Bracket | # Households | % Households |
| Less than $10,000 | 592 | 3.4% |
| $10,000 to $14,999 | 767 | 4.4% |
| $15,000 to $24,999 | 1,307 | 7.5% |
| $25,000 to $34,999 | 1,673 | 9.6% |
| $35,000 to $49,999 | 1,847 | 10.6% |
| $50,000 to $74,999 | 2,596 | 14.9% |
| $75,000 to $99,999 | 2,196 | 12.6% |
| $100,000 to $149,999 | 3,380 | 19.4% |
| $150,000 to $199,999 | 1,446 | 8.3% |
| $200,000+ | 1,655 | 9.5% |
Household Income by Householder Age in Westchester
The median household income in Westchester is $74,175, with the highest median household income of $102,991 found in the 25 to 44 years age bracket for the primary householder. A total of 3,655 households (21.0%) fall into this category. Meanwhile, the 15 to 24 years age bracket for the primary householder has the lowest median household income of $36,667, with 262 households (1.5%) in this group.
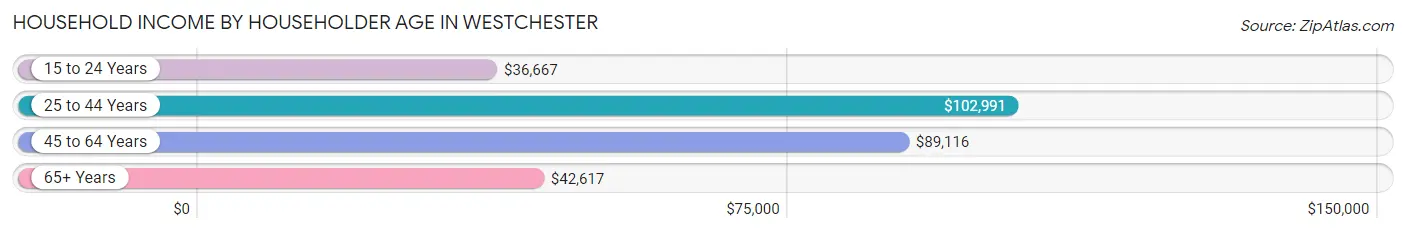
| Income Bracket | # Households | Median Income |
| 15 to 24 Years | 262 (1.5%) | $36,667 |
| 25 to 44 Years | 3,655 (21.0%) | $102,991 |
| 45 to 64 Years | 7,371 (42.3%) | $89,116 |
| 65+ Years | 6,137 (35.2%) | $42,617 |
| Total | 17,425 (100.0%) | $74,175 |
Poverty in Westchester
Income Below Poverty by Sex and Age in Westchester
With 7.3% poverty level for males and 10.7% for females among the residents of Westchester, 16 and 17 year old males and 16 and 17 year old females are the most vulnerable to poverty, with 125 males (22.2%) and 57 females (27.8%) in their respective age groups living below the poverty level.
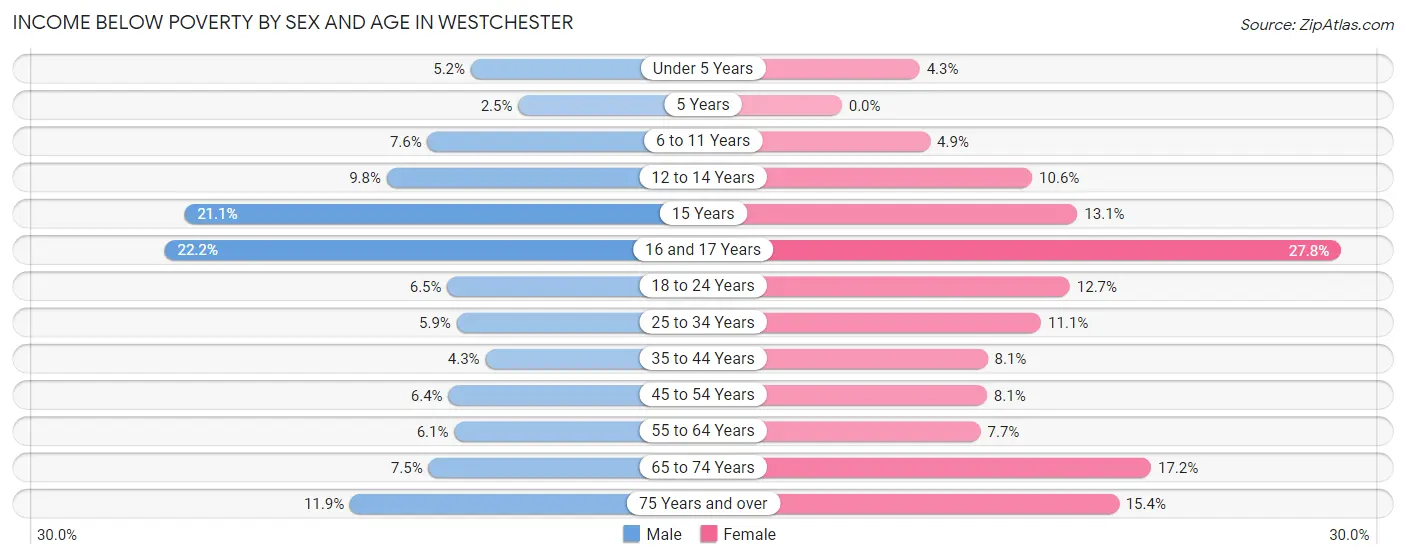
| Age Bracket | Male | Female |
| Under 5 Years | 59 (5.1%) | 53 (4.3%) |
| 5 Years | 7 (2.5%) | 0 (0.0%) |
| 6 to 11 Years | 65 (7.6%) | 57 (4.9%) |
| 12 to 14 Years | 73 (9.8%) | 39 (10.6%) |
| 15 Years | 61 (21.1%) | 42 (13.1%) |
| 16 and 17 Years | 125 (22.2%) | 57 (27.8%) |
| 18 to 24 Years | 110 (6.5%) | 242 (12.7%) |
| 25 to 34 Years | 201 (5.9%) | 316 (11.1%) |
| 35 to 44 Years | 123 (4.3%) | 201 (8.1%) |
| 45 to 54 Years | 251 (6.4%) | 324 (8.1%) |
| 55 to 64 Years | 216 (6.1%) | 358 (7.7%) |
| 65 to 74 Years | 183 (7.5%) | 537 (17.2%) |
| 75 Years and over | 269 (11.9%) | 567 (15.4%) |
| Total | 1,743 (7.3%) | 2,793 (10.7%) |
Income Above Poverty by Sex and Age in Westchester
According to the poverty statistics in Westchester, males aged 5 years and females aged 5 years are the age groups that are most secure financially, with 97.5% of males and 100.0% of females in these age groups living above the poverty line.
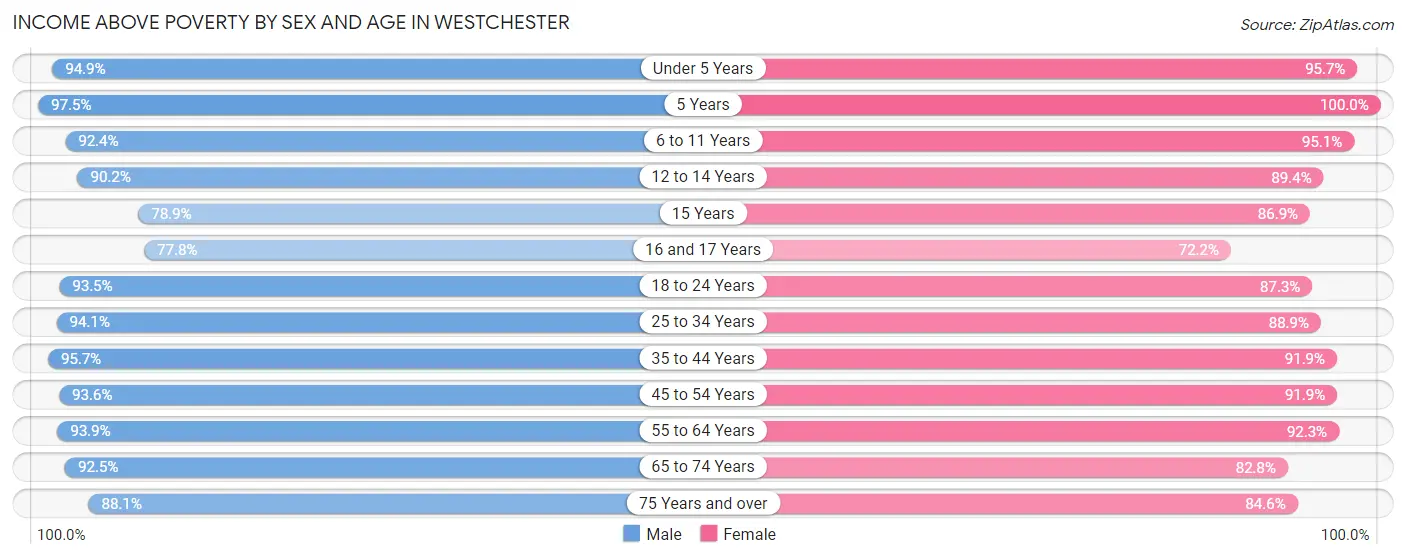
| Age Bracket | Male | Female |
| Under 5 Years | 1,087 (94.9%) | 1,169 (95.7%) |
| 5 Years | 272 (97.5%) | 137 (100.0%) |
| 6 to 11 Years | 795 (92.4%) | 1,102 (95.1%) |
| 12 to 14 Years | 670 (90.2%) | 329 (89.4%) |
| 15 Years | 228 (78.9%) | 278 (86.9%) |
| 16 and 17 Years | 438 (77.8%) | 148 (72.2%) |
| 18 to 24 Years | 1,592 (93.5%) | 1,664 (87.3%) |
| 25 to 34 Years | 3,180 (94.1%) | 2,532 (88.9%) |
| 35 to 44 Years | 2,713 (95.7%) | 2,275 (91.9%) |
| 45 to 54 Years | 3,668 (93.6%) | 3,686 (91.9%) |
| 55 to 64 Years | 3,345 (93.9%) | 4,276 (92.3%) |
| 65 to 74 Years | 2,254 (92.5%) | 2,581 (82.8%) |
| 75 Years and over | 1,996 (88.1%) | 3,110 (84.6%) |
| Total | 22,238 (92.7%) | 23,287 (89.3%) |
Income Below Poverty Among Married-Couple Families in Westchester
The poverty statistics for married-couple families in Westchester show that 4.1% or 344 of the total 8,485 families live below the poverty line. Families with no children have the highest poverty rate of 4.5%, comprising of 254 families. On the other hand, families with 3 or 4 children have the lowest poverty rate of 0.0%, which includes 0 families.
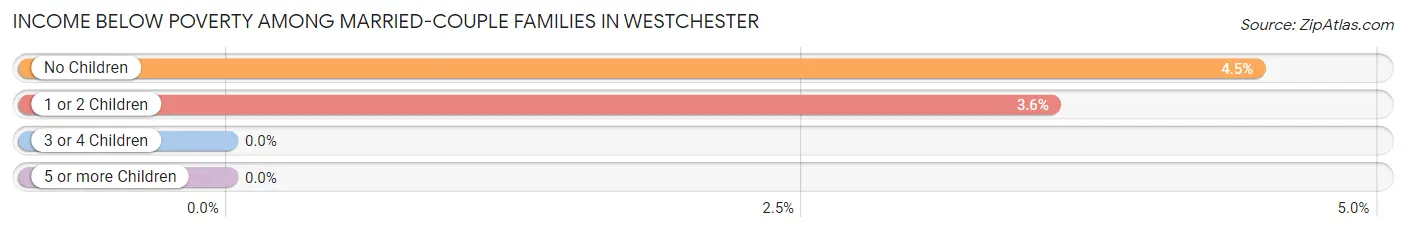
| Children | Above Poverty | Below Poverty |
| No Children | 5,426 (95.5%) | 254 (4.5%) |
| 1 or 2 Children | 2,426 (96.4%) | 90 (3.6%) |
| 3 or 4 Children | 278 (100.0%) | 0 (0.0%) |
| 5 or more Children | 11 (100.0%) | 0 (0.0%) |
| Total | 8,141 (96.0%) | 344 (4.1%) |
Income Below Poverty Among Single-Parent Households in Westchester
According to the poverty data in Westchester, 3.0% or 41 single-father households and 11.0% or 368 single-mother households are living below the poverty line. Among single-father households, those with 1 or 2 children have the highest poverty rate, with 41 households (7.6%) experiencing poverty. Likewise, among single-mother households, those with 1 or 2 children have the highest poverty rate, with 251 households (26.5%) falling below the poverty line.
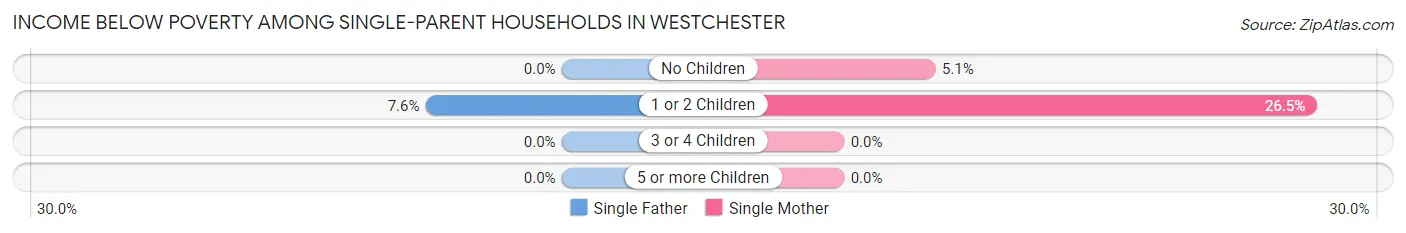
| Children | Single Father | Single Mother |
| No Children | 0 (0.0%) | 117 (5.1%) |
| 1 or 2 Children | 41 (7.6%) | 251 (26.5%) |
| 3 or 4 Children | 0 (0.0%) | 0 (0.0%) |
| 5 or more Children | 0 (0.0%) | 0 (0.0%) |
| Total | 41 (3.0%) | 368 (11.0%) |
Income Below Poverty Among Married-Couple vs Single-Parent Households in Westchester
The poverty data for Westchester shows that 344 of the married-couple family households (4.1%) and 409 of the single-parent households (8.7%) are living below the poverty level. Within the married-couple family households, those with no children have the highest poverty rate, with 254 households (4.5%) falling below the poverty line. Among the single-parent households, those with 1 or 2 children have the highest poverty rate, with 292 household (19.6%) living below poverty.
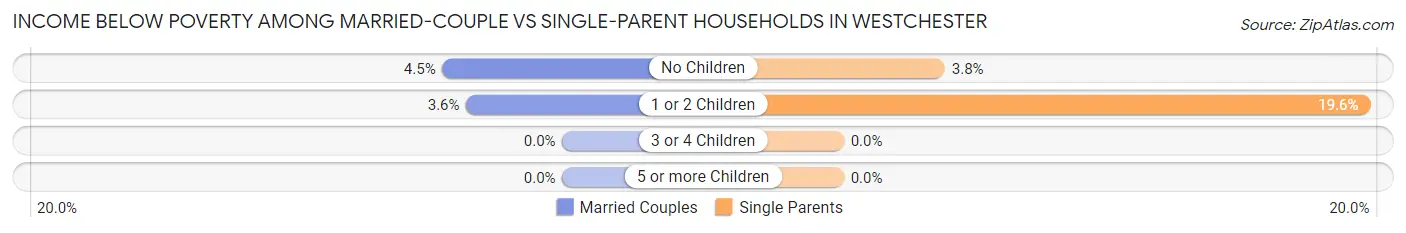
| Children | Married-Couple Families | Single-Parent Households |
| No Children | 254 (4.5%) | 117 (3.8%) |
| 1 or 2 Children | 90 (3.6%) | 292 (19.6%) |
| 3 or 4 Children | 0 (0.0%) | 0 (0.0%) |
| 5 or more Children | 0 (0.0%) | 0 (0.0%) |
| Total | 344 (4.1%) | 409 (8.7%) |
Employment Characteristics in Westchester
Employment by Class of Employer in Westchester
Among the 27,212 employed individuals in Westchester, private company employees (18,567 | 68.2%), self-employed (not incorporated) (2,451 | 9.0%), and self-employed (incorporated) (1,944 | 7.1%) make up the most common classes of employment.
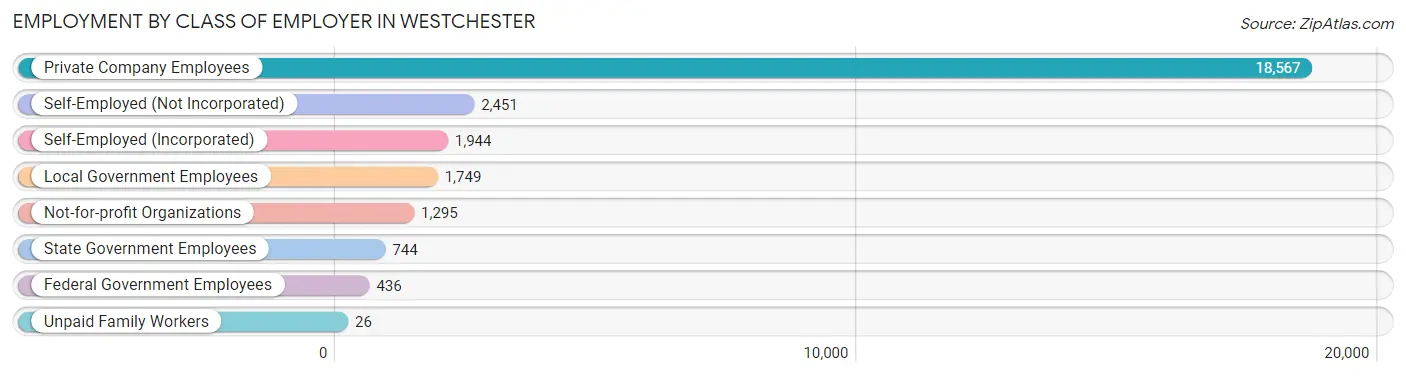
| Employer Class | # Employees | % Employees |
| Private Company Employees | 18,567 | 68.2% |
| Self-Employed (Incorporated) | 1,944 | 7.1% |
| Self-Employed (Not Incorporated) | 2,451 | 9.0% |
| Not-for-profit Organizations | 1,295 | 4.8% |
| Local Government Employees | 1,749 | 6.4% |
| State Government Employees | 744 | 2.7% |
| Federal Government Employees | 436 | 1.6% |
| Unpaid Family Workers | 26 | 0.1% |
| Total | 27,212 | 100.0% |
Employment Status by Age in Westchester
According to the labor force statistics for Westchester, out of the total population over 16 years of age (47,181), 61.5% or 29,016 individuals are in the labor force, with 4.3% or 1,248 of them unemployed. The age group with the highest labor force participation rate is 35 to 44 years, with 93.8% or 4,983 individuals in the labor force. Within the labor force, the 16 to 19 years age range has the highest percentage of unemployed individuals, with 33.6% or 289 of them being unemployed.
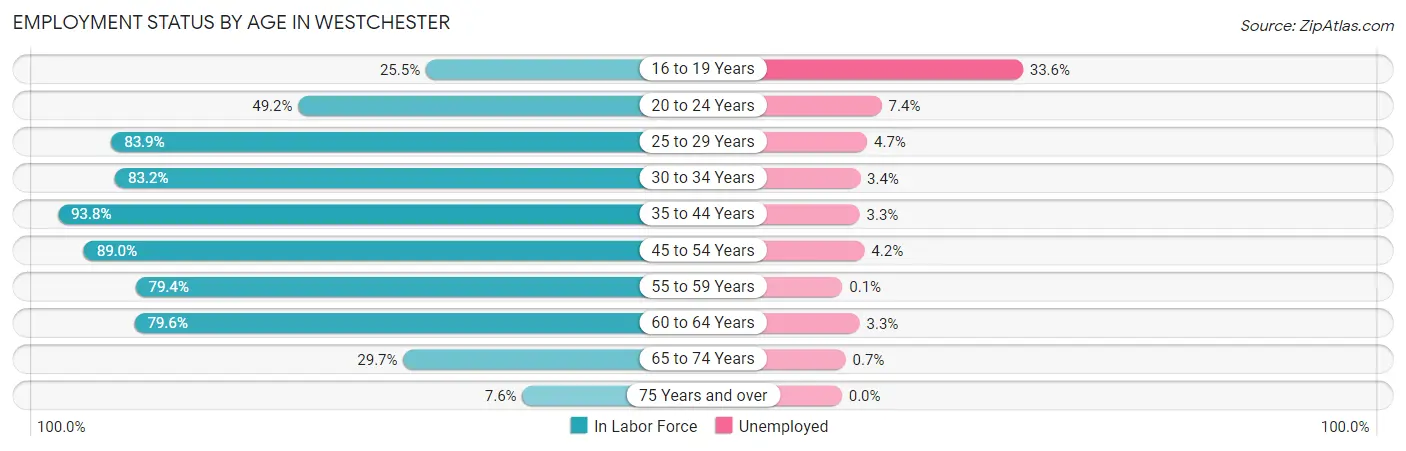
| Age Bracket | In Labor Force | Unemployed |
| 16 to 19 Years | 860 (25.5%) | 289 (33.6%) |
| 20 to 24 Years | 2,242 (49.2%) | 166 (7.4%) |
| 25 to 29 Years | 2,502 (83.9%) | 118 (4.7%) |
| 30 to 34 Years | 2,761 (83.2%) | 94 (3.4%) |
| 35 to 44 Years | 4,983 (93.8%) | 164 (3.3%) |
| 45 to 54 Years | 7,057 (89.0%) | 296 (4.2%) |
| 55 to 59 Years | 3,549 (79.4%) | 4 (0.1%) |
| 60 to 64 Years | 2,967 (79.6%) | 98 (3.3%) |
| 65 to 74 Years | 1,651 (29.7%) | 12 (0.7%) |
| 75 Years and over | 453 (7.6%) | 0 (0.0%) |
| Total | 29,016 (61.5%) | 1,248 (4.3%) |
Employment Status by Educational Attainment in Westchester
According to labor force statistics for Westchester, 85.9% of individuals (23,828) out of the total population between 25 and 64 years of age (27,739) are in the labor force, with 3.3% or 786 of them being unemployed. The group with the highest labor force participation rate are those with the educational attainment of bachelor's degree or higher, with 92.1% or 8,418 individuals in the labor force. Within the labor force, individuals with less than high school education have the highest percentage of unemployment, with 5.8% or 163 of them being unemployed.
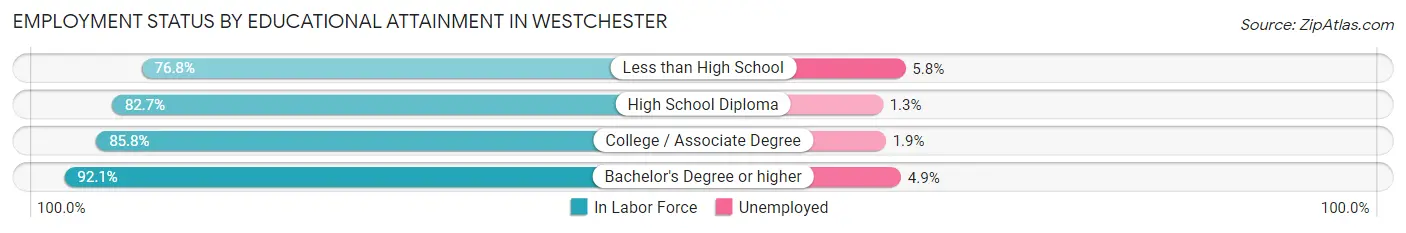
| Educational Attainment | In Labor Force | Unemployed |
| Less than High School | 2,806 (76.8%) | 212 (5.8%) |
| High School Diploma | 6,223 (82.7%) | 98 (1.3%) |
| College / Associate Degree | 6,367 (85.8%) | 141 (1.9%) |
| Bachelor's Degree or higher | 8,418 (92.1%) | 448 (4.9%) |
| Total | 23,828 (85.9%) | 915 (3.3%) |
Employment Occupations by Sex in Westchester
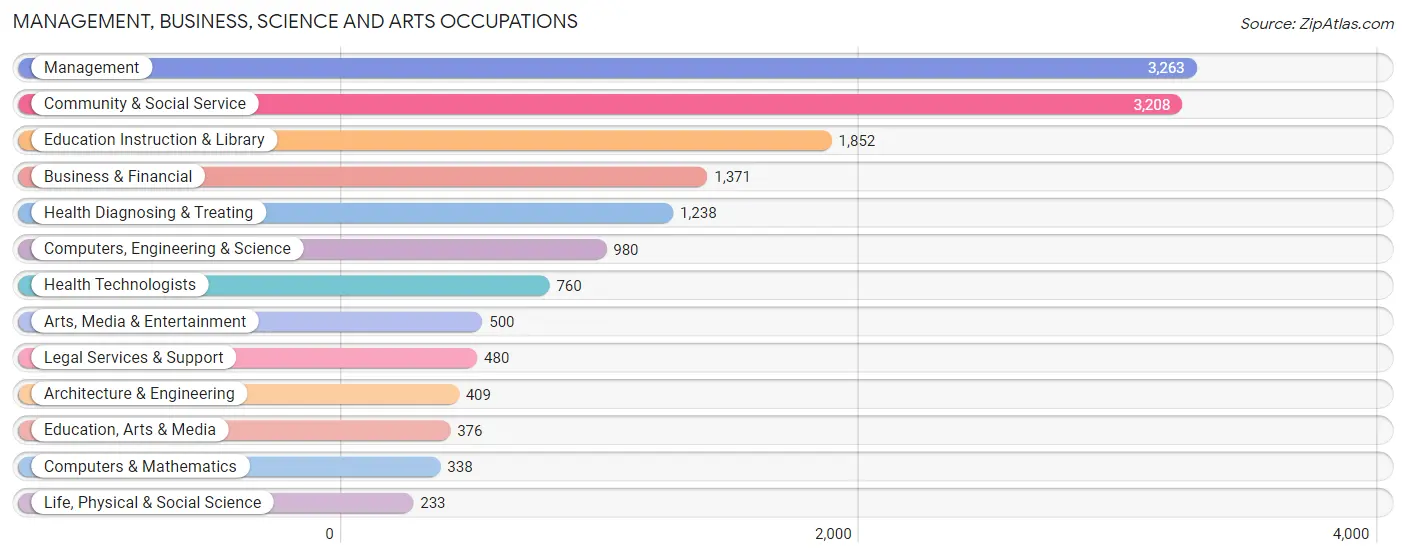
Management, Business, Science and Arts Occupations
The most common Management, Business, Science and Arts occupations in Westchester are Management (3,263 | 11.7%), Community & Social Service (3,208 | 11.6%), Education Instruction & Library (1,852 | 6.7%), Business & Financial (1,371 | 4.9%), and Health Diagnosing & Treating (1,238 | 4.5%).
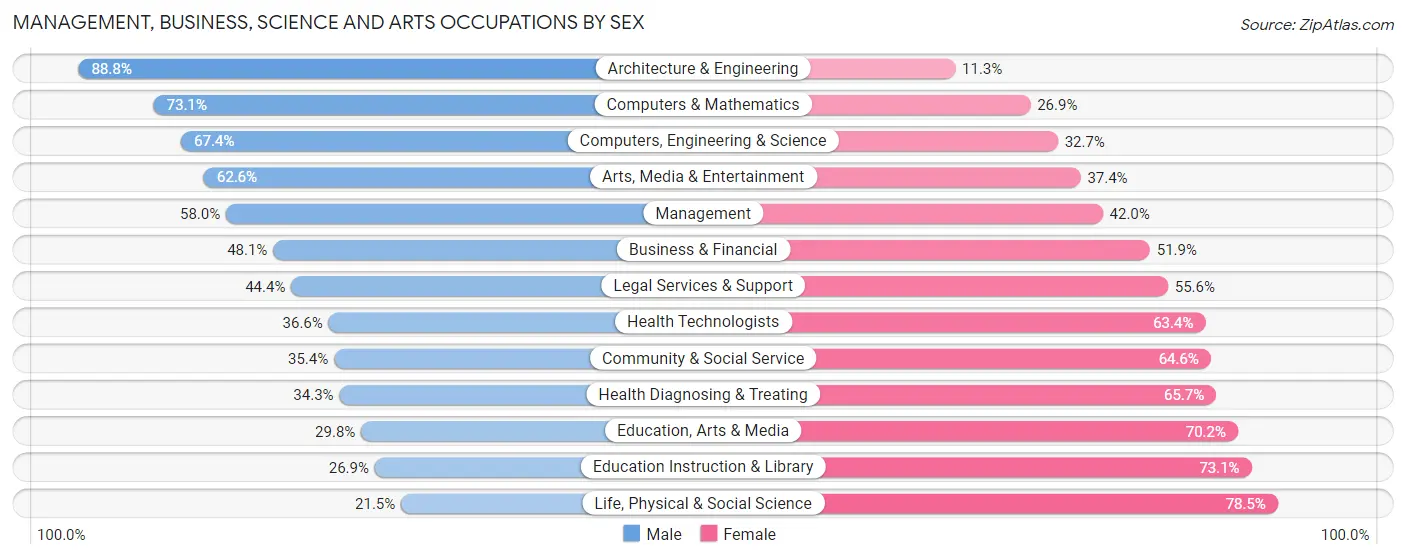
Management, Business, Science and Arts Occupations by Sex
Within the Management, Business, Science and Arts occupations in Westchester, the most male-oriented occupations are Architecture & Engineering (88.7%), Computers & Mathematics (73.1%), and Computers, Engineering & Science (67.3%), while the most female-oriented occupations are Life, Physical & Social Science (78.5%), Education Instruction & Library (73.1%), and Education, Arts & Media (70.2%).
| Occupation | Male | Female |
| Management | 1,892 (58.0%) | 1,371 (42.0%) |
| Business & Financial | 660 (48.1%) | 711 (51.9%) |
| Computers, Engineering & Science | 660 (67.3%) | 320 (32.7%) |
| Computers & Mathematics | 247 (73.1%) | 91 (26.9%) |
| Architecture & Engineering | 363 (88.7%) | 46 (11.3%) |
| Life, Physical & Social Science | 50 (21.5%) | 183 (78.5%) |
| Community & Social Service | 1,137 (35.4%) | 2,071 (64.6%) |
| Education, Arts & Media | 112 (29.8%) | 264 (70.2%) |
| Legal Services & Support | 213 (44.4%) | 267 (55.6%) |
| Education Instruction & Library | 499 (26.9%) | 1,353 (73.1%) |
| Arts, Media & Entertainment | 313 (62.6%) | 187 (37.4%) |
| Health Diagnosing & Treating | 425 (34.3%) | 813 (65.7%) |
| Health Technologists | 278 (36.6%) | 482 (63.4%) |
| Total (Category) | 4,774 (47.5%) | 5,286 (52.5%) |
| Total (Overall) | 14,211 (51.1%) | 13,573 (48.8%) |
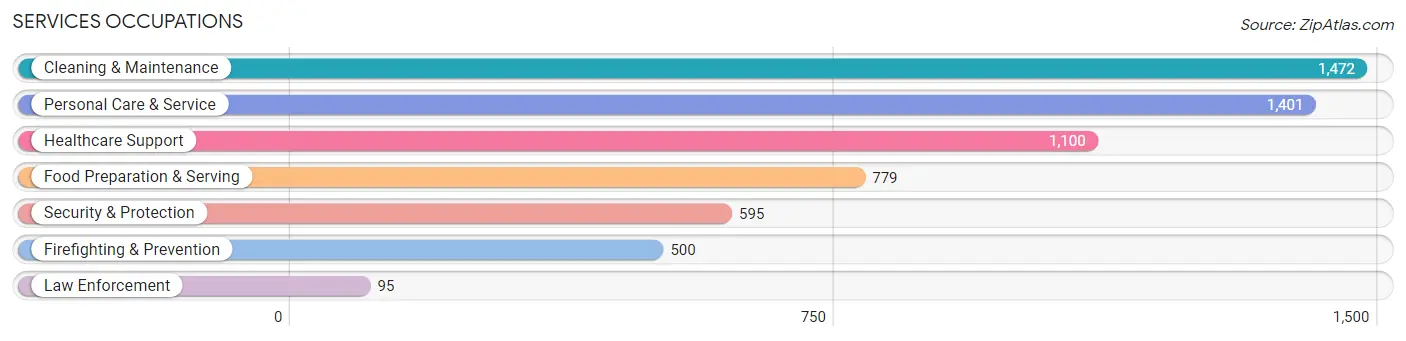
Services Occupations
The most common Services occupations in Westchester are Cleaning & Maintenance (1,472 | 5.3%), Personal Care & Service (1,401 | 5.0%), Healthcare Support (1,100 | 4.0%), Food Preparation & Serving (779 | 2.8%), and Security & Protection (595 | 2.1%).
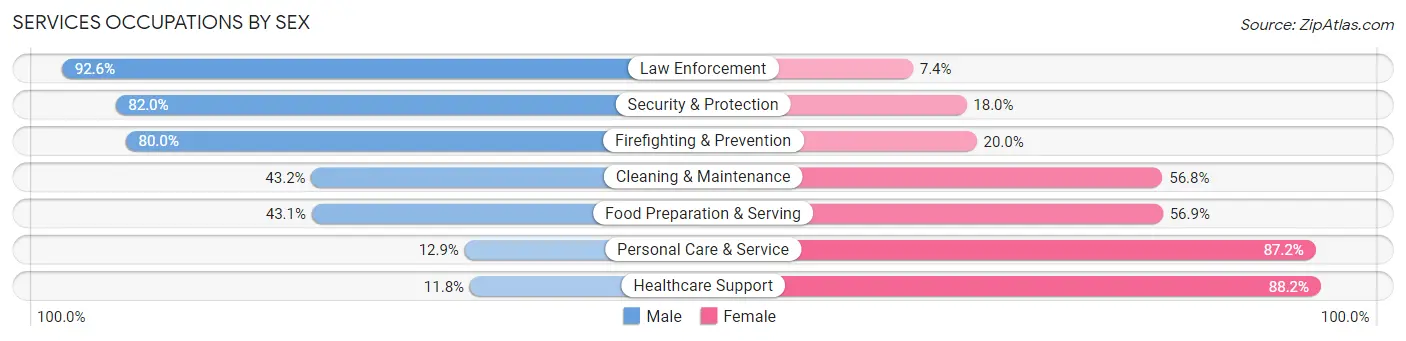
Services Occupations by Sex
Within the Services occupations in Westchester, the most male-oriented occupations are Law Enforcement (92.6%), Security & Protection (82.0%), and Firefighting & Prevention (80.0%), while the most female-oriented occupations are Healthcare Support (88.2%), Personal Care & Service (87.2%), and Food Preparation & Serving (56.9%).
| Occupation | Male | Female |
| Healthcare Support | 130 (11.8%) | 970 (88.2%) |
| Security & Protection | 488 (82.0%) | 107 (18.0%) |
| Firefighting & Prevention | 400 (80.0%) | 100 (20.0%) |
| Law Enforcement | 88 (92.6%) | 7 (7.4%) |
| Food Preparation & Serving | 336 (43.1%) | 443 (56.9%) |
| Cleaning & Maintenance | 636 (43.2%) | 836 (56.8%) |
| Personal Care & Service | 180 (12.9%) | 1,221 (87.2%) |
| Total (Category) | 1,770 (33.1%) | 3,577 (66.9%) |
| Total (Overall) | 14,211 (51.1%) | 13,573 (48.8%) |
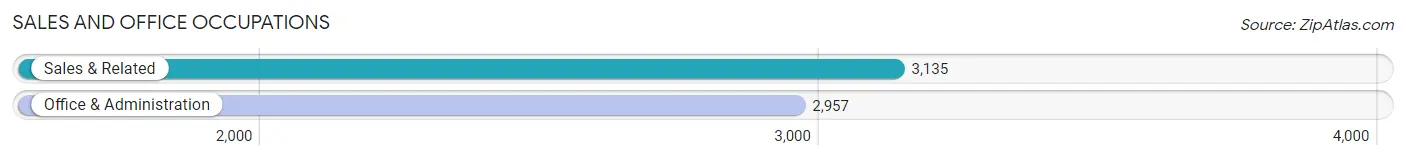
Sales and Office Occupations
The most common Sales and Office occupations in Westchester are Sales & Related (3,135 | 11.3%), and Office & Administration (2,957 | 10.6%).
Sales and Office Occupations by Sex
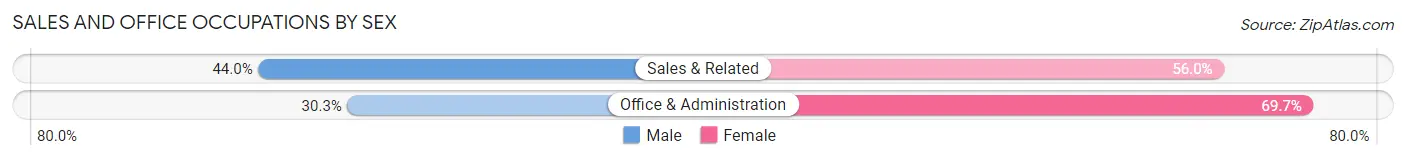
| Occupation | Male | Female |
| Sales & Related | 1,380 (44.0%) | 1,755 (56.0%) |
| Office & Administration | 896 (30.3%) | 2,061 (69.7%) |
| Total (Category) | 2,276 (37.4%) | 3,816 (62.6%) |
| Total (Overall) | 14,211 (51.1%) | 13,573 (48.8%) |
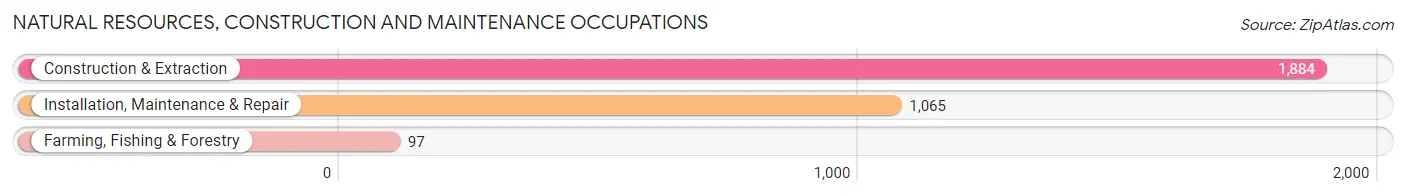
Natural Resources, Construction and Maintenance Occupations
The most common Natural Resources, Construction and Maintenance occupations in Westchester are Construction & Extraction (1,884 | 6.8%), Installation, Maintenance & Repair (1,065 | 3.8%), and Farming, Fishing & Forestry (97 | 0.4%).
Natural Resources, Construction and Maintenance Occupations by Sex
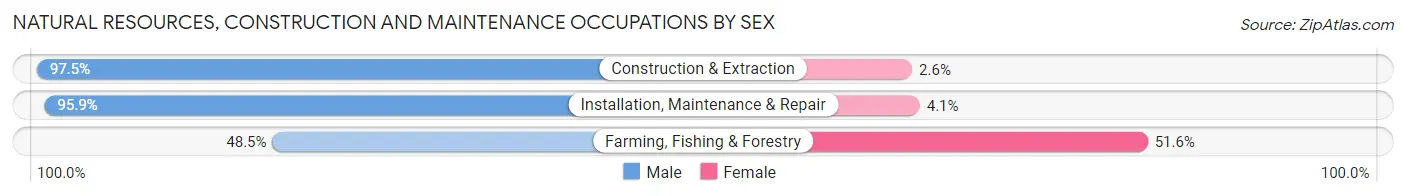
| Occupation | Male | Female |
| Farming, Fishing & Forestry | 47 (48.4%) | 50 (51.5%) |
| Construction & Extraction | 1,836 (97.5%) | 48 (2.5%) |
| Installation, Maintenance & Repair | 1,021 (95.9%) | 44 (4.1%) |
| Total (Category) | 2,904 (95.3%) | 142 (4.7%) |
| Total (Overall) | 14,211 (51.1%) | 13,573 (48.8%) |
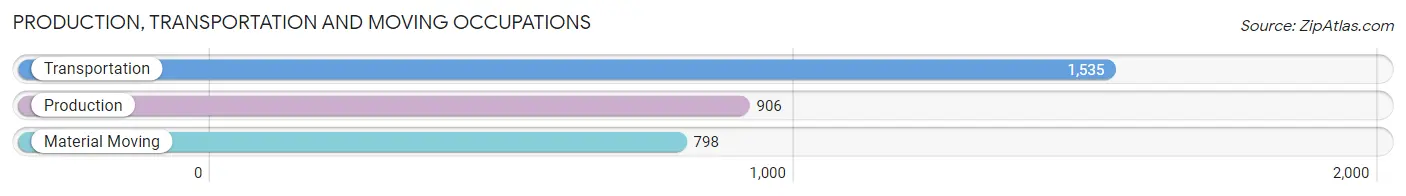
Production, Transportation and Moving Occupations
The most common Production, Transportation and Moving occupations in Westchester are Transportation (1,535 | 5.5%), Production (906 | 3.3%), and Material Moving (798 | 2.9%).
Production, Transportation and Moving Occupations by Sex
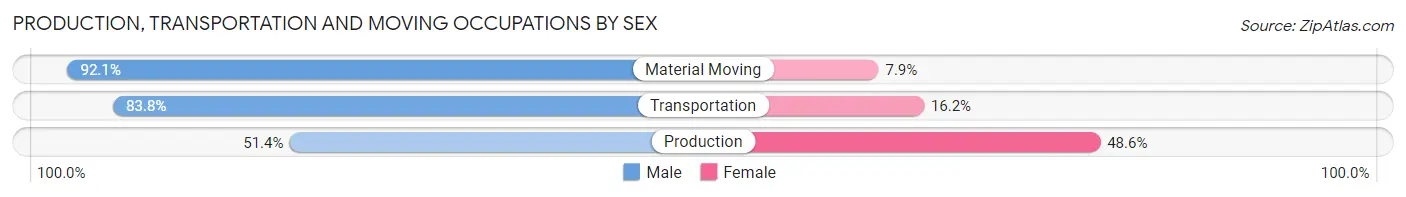
| Occupation | Male | Female |
| Production | 466 (51.4%) | 440 (48.6%) |
| Transportation | 1,286 (83.8%) | 249 (16.2%) |
| Material Moving | 735 (92.1%) | 63 (7.9%) |
| Total (Category) | 2,487 (76.8%) | 752 (23.2%) |
| Total (Overall) | 14,211 (51.1%) | 13,573 (48.8%) |
Employment Industries by Sex in Westchester
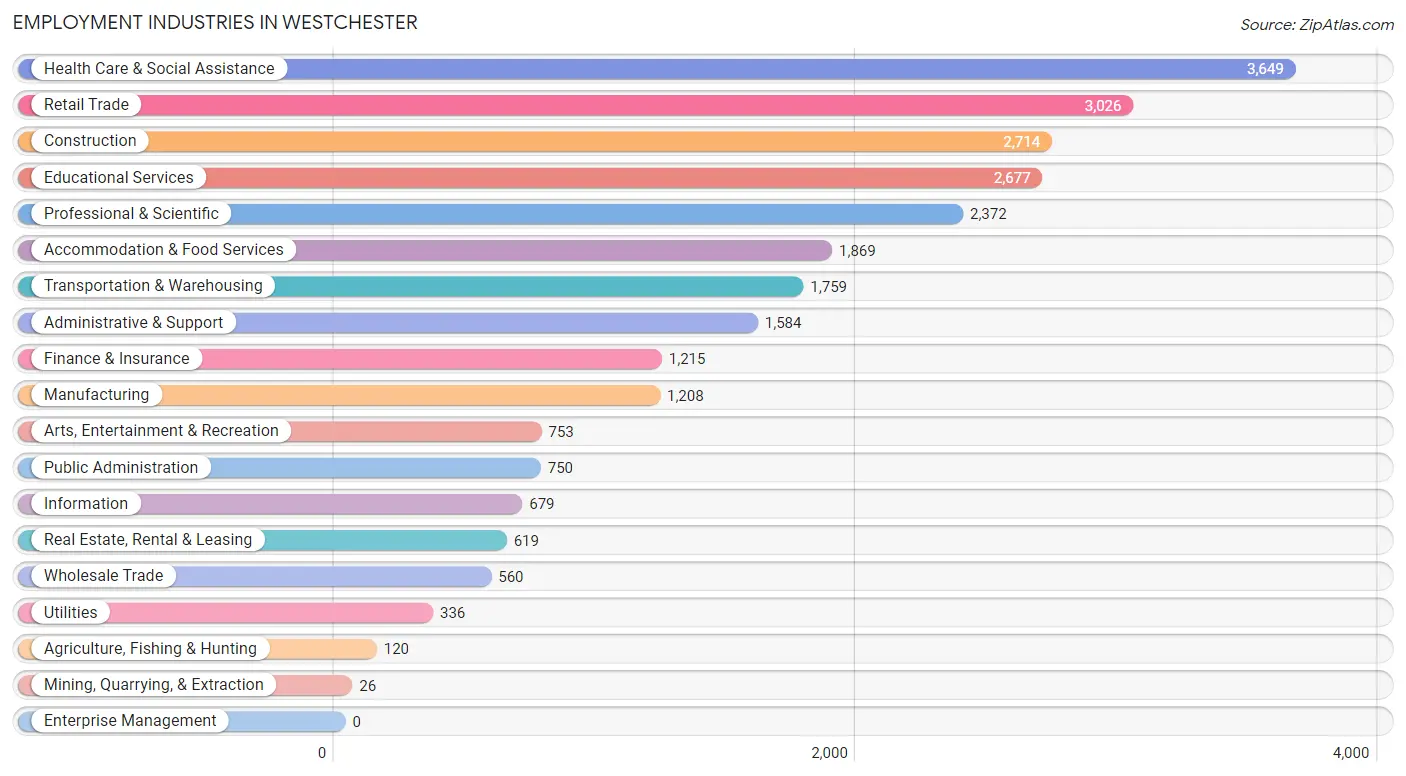
Employment Industries in Westchester
The major employment industries in Westchester include Health Care & Social Assistance (3,649 | 13.1%), Retail Trade (3,026 | 10.9%), Construction (2,714 | 9.8%), Educational Services (2,677 | 9.6%), and Professional & Scientific (2,372 | 8.5%).
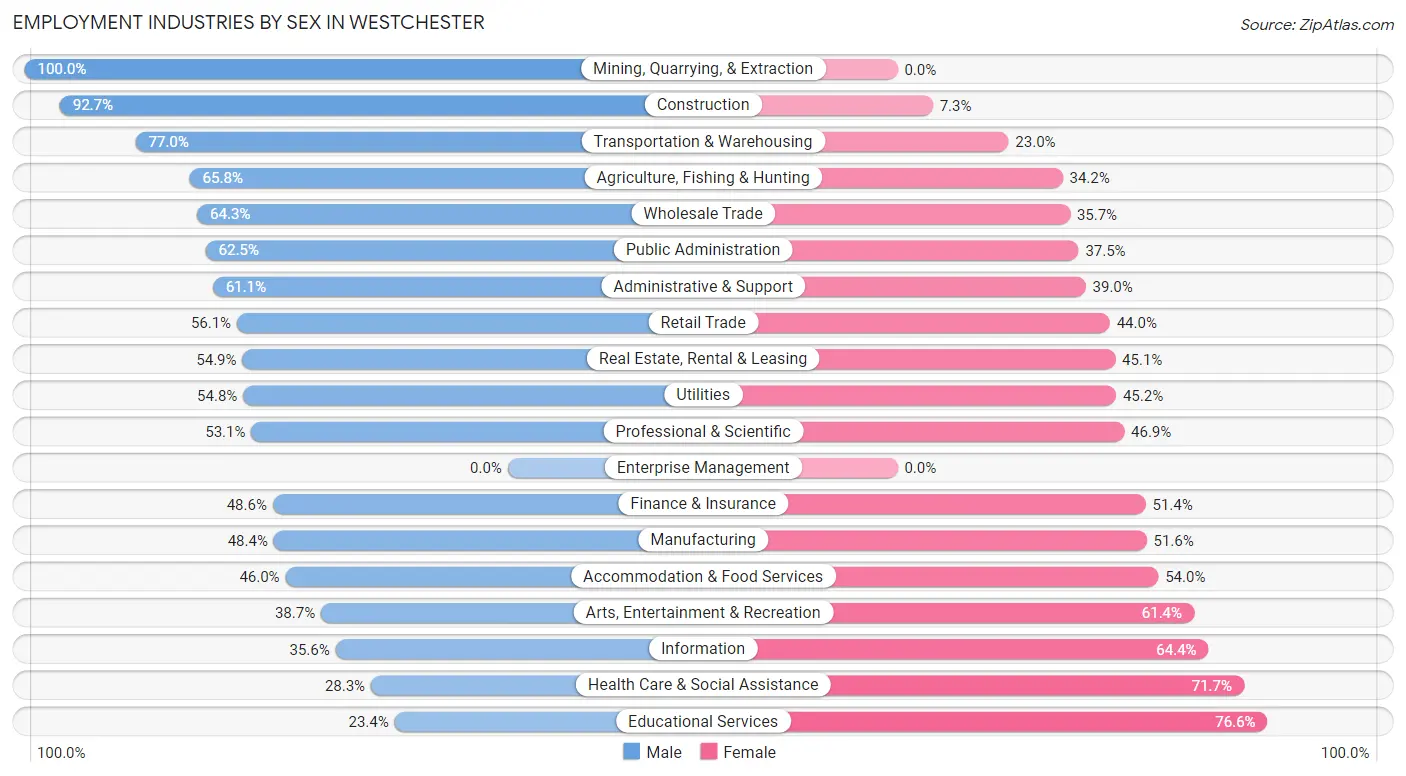
Employment Industries by Sex in Westchester
The Westchester industries that see more men than women are Mining, Quarrying, & Extraction (100.0%), Construction (92.7%), and Transportation & Warehousing (77.0%), whereas the industries that tend to have a higher number of women are Educational Services (76.6%), Health Care & Social Assistance (71.7%), and Information (64.4%).
| Industry | Male | Female |
| Agriculture, Fishing & Hunting | 79 (65.8%) | 41 (34.2%) |
| Mining, Quarrying, & Extraction | 26 (100.0%) | 0 (0.0%) |
| Construction | 2,516 (92.7%) | 198 (7.3%) |
| Manufacturing | 585 (48.4%) | 623 (51.6%) |
| Wholesale Trade | 360 (64.3%) | 200 (35.7%) |
| Retail Trade | 1,696 (56.0%) | 1,330 (44.0%) |
| Transportation & Warehousing | 1,355 (77.0%) | 404 (23.0%) |
| Utilities | 184 (54.8%) | 152 (45.2%) |
| Information | 242 (35.6%) | 437 (64.4%) |
| Finance & Insurance | 591 (48.6%) | 624 (51.4%) |
| Real Estate, Rental & Leasing | 340 (54.9%) | 279 (45.1%) |
| Professional & Scientific | 1,259 (53.1%) | 1,113 (46.9%) |
| Enterprise Management | 0 (0.0%) | 0 (0.0%) |
| Administrative & Support | 967 (61.1%) | 617 (39.0%) |
| Educational Services | 627 (23.4%) | 2,050 (76.6%) |
| Health Care & Social Assistance | 1,033 (28.3%) | 2,616 (71.7%) |
| Arts, Entertainment & Recreation | 291 (38.7%) | 462 (61.4%) |
| Accommodation & Food Services | 860 (46.0%) | 1,009 (54.0%) |
| Public Administration | 469 (62.5%) | 281 (37.5%) |
| Total | 14,211 (51.1%) | 13,573 (48.8%) |
Education in Westchester
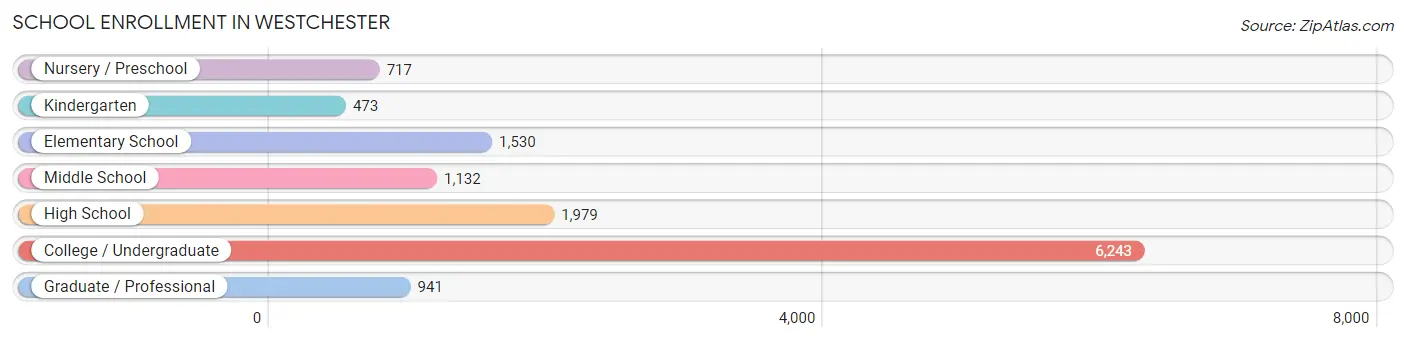
School Enrollment in Westchester
The most common levels of schooling among the 13,015 students in Westchester are college / undergraduate (6,243 | 48.0%), high school (1,979 | 15.2%), and elementary school (1,530 | 11.8%).
| School Level | # Students | % Students |
| Nursery / Preschool | 717 | 5.5% |
| Kindergarten | 473 | 3.6% |
| Elementary School | 1,530 | 11.8% |
| Middle School | 1,132 | 8.7% |
| High School | 1,979 | 15.2% |
| College / Undergraduate | 6,243 | 48.0% |
| Graduate / Professional | 941 | 7.2% |
| Total | 13,015 | 100.0% |
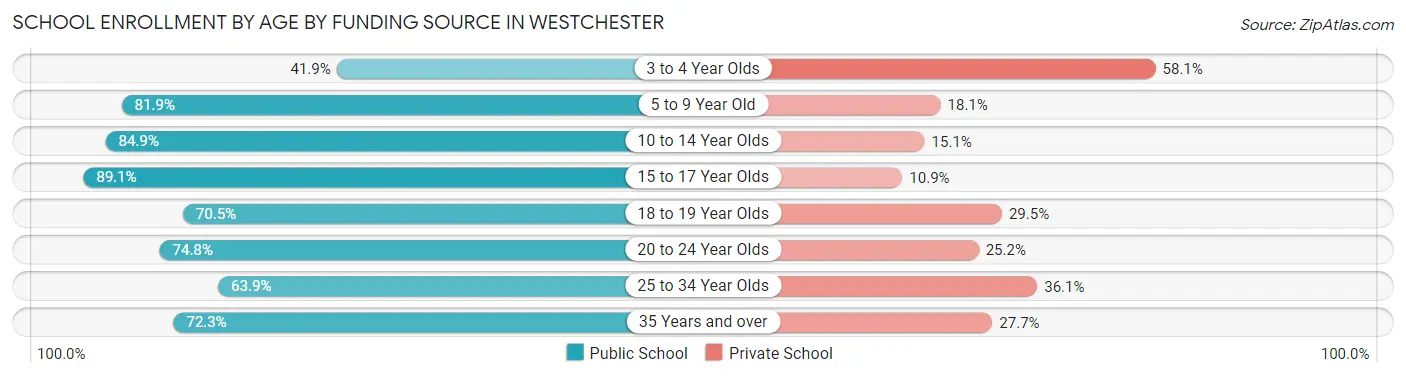
School Enrollment by Age by Funding Source in Westchester
Out of a total of 13,015 students who are enrolled in schools in Westchester, 3,267 (25.1%) attend a private institution, while the remaining 9,748 (74.9%) are enrolled in public schools. The age group of 3 to 4 year olds has the highest likelihood of being enrolled in private schools, with 416 (58.1% in the age bracket) enrolled. Conversely, the age group of 15 to 17 year olds has the lowest likelihood of being enrolled in a private school, with 1,075 (89.1% in the age bracket) attending a public institution.
| Age Bracket | Public School | Private School |
| 3 to 4 Year Olds | 300 (41.9%) | 416 (58.1%) |
| 5 to 9 Year Old | 1,493 (81.9%) | 329 (18.1%) |
| 10 to 14 Year Olds | 1,395 (84.9%) | 248 (15.1%) |
| 15 to 17 Year Olds | 1,075 (89.1%) | 132 (10.9%) |
| 18 to 19 Year Olds | 1,736 (70.5%) | 726 (29.5%) |
| 20 to 24 Year Olds | 2,659 (74.8%) | 894 (25.2%) |
| 25 to 34 Year Olds | 539 (63.9%) | 304 (36.1%) |
| 35 Years and over | 556 (72.3%) | 213 (27.7%) |
| Total | 9,748 (74.9%) | 3,267 (25.1%) |
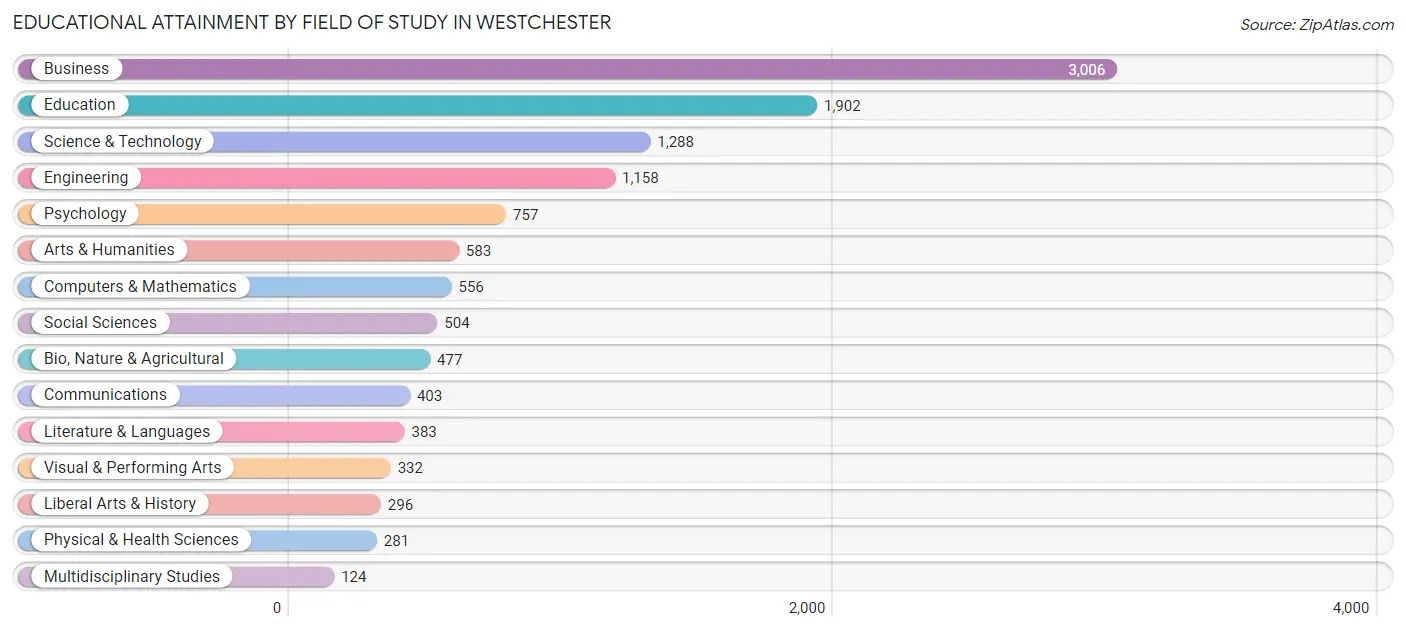
Educational Attainment by Field of Study in Westchester
Business (3,006 | 24.9%), education (1,902 | 15.8%), science & technology (1,288 | 10.7%), engineering (1,158 | 9.6%), and psychology (757 | 6.3%) are the most common fields of study among 12,050 individuals in Westchester who have obtained a bachelor's degree or higher.
| Field of Study | # Graduates | % Graduates |
| Computers & Mathematics | 556 | 4.6% |
| Bio, Nature & Agricultural | 477 | 4.0% |
| Physical & Health Sciences | 281 | 2.3% |
| Psychology | 757 | 6.3% |
| Social Sciences | 504 | 4.2% |
| Engineering | 1,158 | 9.6% |
| Multidisciplinary Studies | 124 | 1.0% |
| Science & Technology | 1,288 | 10.7% |
| Business | 3,006 | 24.9% |
| Education | 1,902 | 15.8% |
| Literature & Languages | 383 | 3.2% |
| Liberal Arts & History | 296 | 2.5% |
| Visual & Performing Arts | 332 | 2.8% |
| Communications | 403 | 3.3% |
| Arts & Humanities | 583 | 4.8% |
| Total | 12,050 | 100.0% |
Transportation & Commute in Westchester
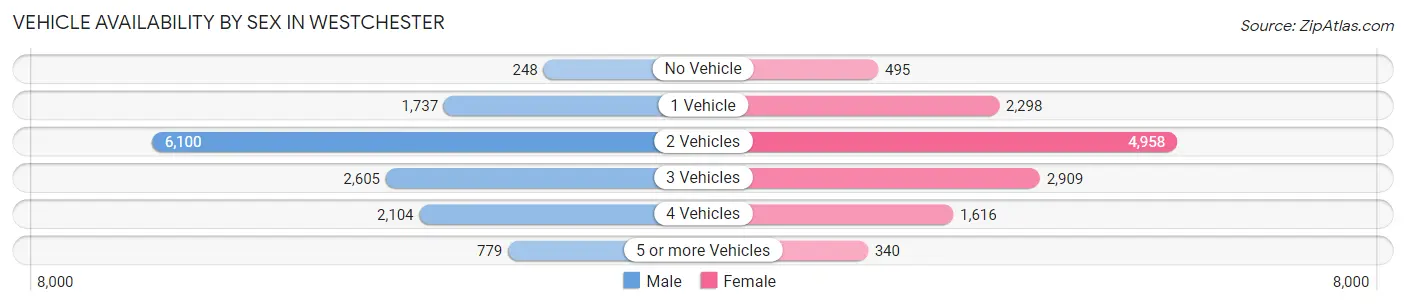
Vehicle Availability by Sex in Westchester
The most prevalent vehicle ownership categories in Westchester are males with 2 vehicles (6,100, accounting for 44.9%) and females with 2 vehicles (4,958, making up 48.3%).
| Vehicles Available | Male | Female |
| No Vehicle | 248 (1.8%) | 495 (3.9%) |
| 1 Vehicle | 1,737 (12.8%) | 2,298 (18.2%) |
| 2 Vehicles | 6,100 (44.9%) | 4,958 (39.3%) |
| 3 Vehicles | 2,605 (19.2%) | 2,909 (23.1%) |
| 4 Vehicles | 2,104 (15.5%) | 1,616 (12.8%) |
| 5 or more Vehicles | 779 (5.7%) | 340 (2.7%) |
| Total | 13,573 (100.0%) | 12,616 (100.0%) |
Commute Time in Westchester
The most frequently occuring commute durations in Westchester are 30 to 34 minutes (6,295 commuters, 24.8%), 20 to 24 minutes (4,035 commuters, 15.9%), and 45 to 59 minutes (2,899 commuters, 11.4%).
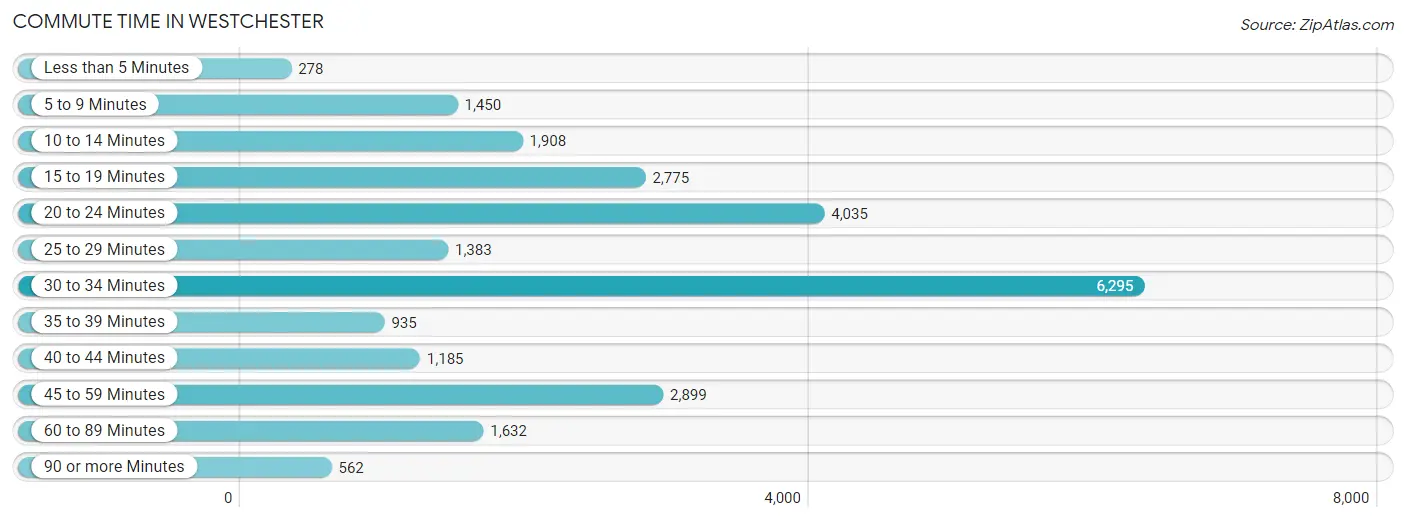
| Commute Time | # Commuters | % Commuters |
| Less than 5 Minutes | 278 | 1.1% |
| 5 to 9 Minutes | 1,450 | 5.7% |
| 10 to 14 Minutes | 1,908 | 7.5% |
| 15 to 19 Minutes | 2,775 | 11.0% |
| 20 to 24 Minutes | 4,035 | 15.9% |
| 25 to 29 Minutes | 1,383 | 5.5% |
| 30 to 34 Minutes | 6,295 | 24.8% |
| 35 to 39 Minutes | 935 | 3.7% |
| 40 to 44 Minutes | 1,185 | 4.7% |
| 45 to 59 Minutes | 2,899 | 11.4% |
| 60 to 89 Minutes | 1,632 | 6.4% |
| 90 or more Minutes | 562 | 2.2% |
Commute Time by Sex in Westchester
The most common commute times in Westchester are 30 to 34 minutes (3,094 commuters, 24.1%) for males and 30 to 34 minutes (3,201 commuters, 25.6%) for females.
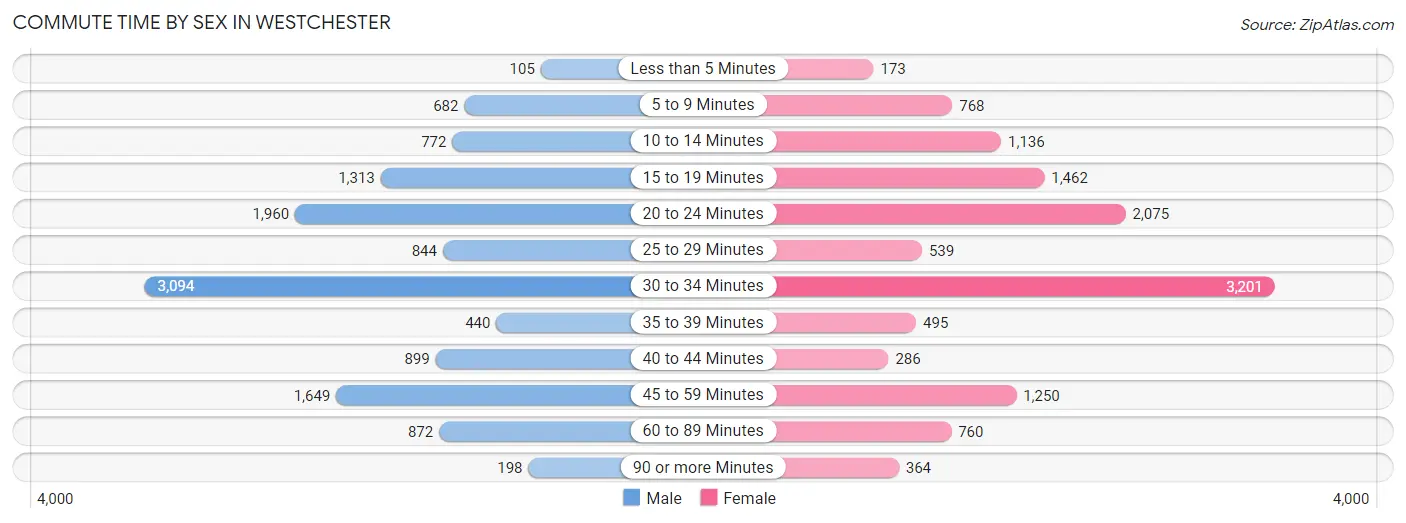
| Commute Time | Male | Female |
| Less than 5 Minutes | 105 (0.8%) | 173 (1.4%) |
| 5 to 9 Minutes | 682 (5.3%) | 768 (6.1%) |
| 10 to 14 Minutes | 772 (6.0%) | 1,136 (9.1%) |
| 15 to 19 Minutes | 1,313 (10.2%) | 1,462 (11.7%) |
| 20 to 24 Minutes | 1,960 (15.3%) | 2,075 (16.6%) |
| 25 to 29 Minutes | 844 (6.6%) | 539 (4.3%) |
| 30 to 34 Minutes | 3,094 (24.1%) | 3,201 (25.6%) |
| 35 to 39 Minutes | 440 (3.4%) | 495 (4.0%) |
| 40 to 44 Minutes | 899 (7.0%) | 286 (2.3%) |
| 45 to 59 Minutes | 1,649 (12.9%) | 1,250 (10.0%) |
| 60 to 89 Minutes | 872 (6.8%) | 760 (6.1%) |
| 90 or more Minutes | 198 (1.5%) | 364 (2.9%) |
Time of Departure to Work by Sex in Westchester
The most frequent times of departure to work in Westchester are 8:00 AM to 8:29 AM (2,277, 17.7%) for males and 7:00 AM to 7:29 AM (2,726, 21.8%) for females.
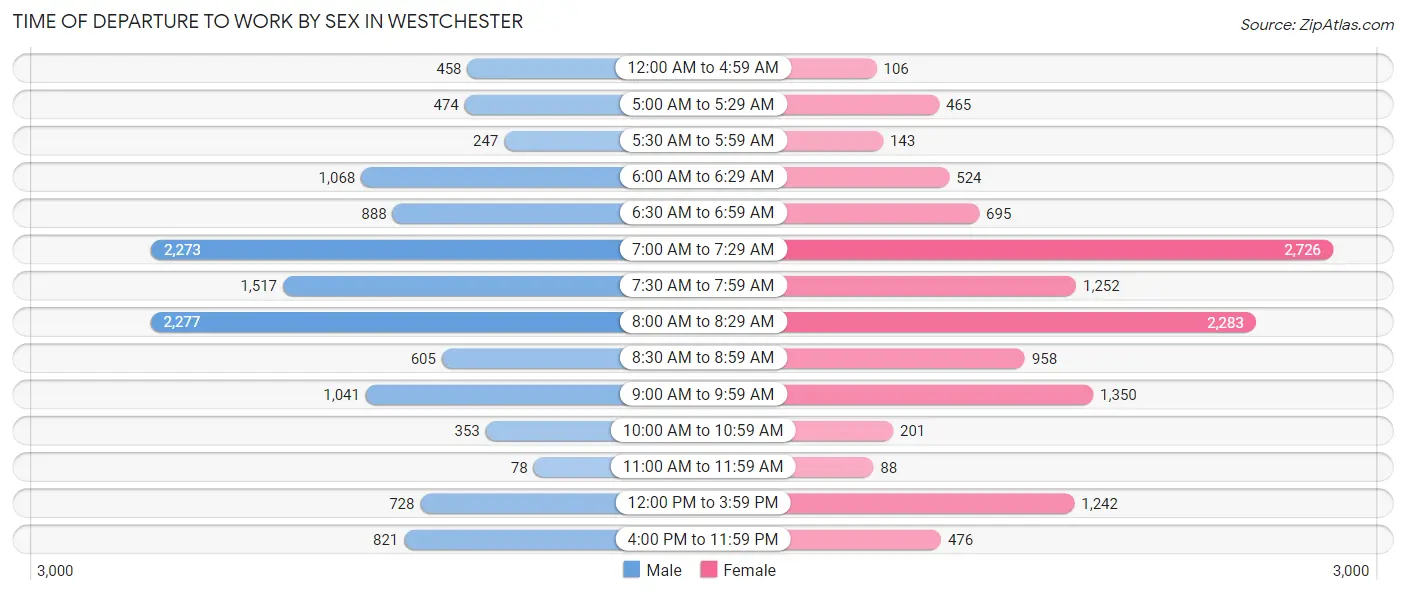
| Time of Departure | Male | Female |
| 12:00 AM to 4:59 AM | 458 (3.6%) | 106 (0.9%) |
| 5:00 AM to 5:29 AM | 474 (3.7%) | 465 (3.7%) |
| 5:30 AM to 5:59 AM | 247 (1.9%) | 143 (1.1%) |
| 6:00 AM to 6:29 AM | 1,068 (8.3%) | 524 (4.2%) |
| 6:30 AM to 6:59 AM | 888 (6.9%) | 695 (5.6%) |
| 7:00 AM to 7:29 AM | 2,273 (17.7%) | 2,726 (21.8%) |
| 7:30 AM to 7:59 AM | 1,517 (11.8%) | 1,252 (10.0%) |
| 8:00 AM to 8:29 AM | 2,277 (17.7%) | 2,283 (18.2%) |
| 8:30 AM to 8:59 AM | 605 (4.7%) | 958 (7.7%) |
| 9:00 AM to 9:59 AM | 1,041 (8.1%) | 1,350 (10.8%) |
| 10:00 AM to 10:59 AM | 353 (2.8%) | 201 (1.6%) |
| 11:00 AM to 11:59 AM | 78 (0.6%) | 88 (0.7%) |
| 12:00 PM to 3:59 PM | 728 (5.7%) | 1,242 (9.9%) |
| 4:00 PM to 11:59 PM | 821 (6.4%) | 476 (3.8%) |
| Total | 12,828 (100.0%) | 12,509 (100.0%) |
Housing Occupancy in Westchester
Occupancy by Ownership in Westchester
Of the total 17,425 dwellings in Westchester, owner-occupied units account for 11,876 (68.1%), while renter-occupied units make up 5,549 (31.9%).
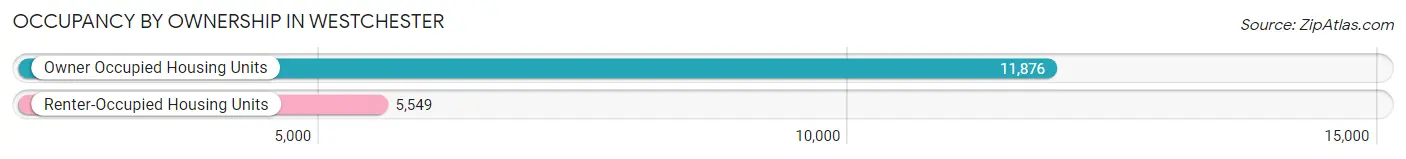
| Occupancy | # Housing Units | % Housing Units |
| Owner Occupied Housing Units | 11,876 | 68.1% |
| Renter-Occupied Housing Units | 5,549 | 31.9% |
| Total Occupied Housing Units | 17,425 | 100.0% |
Occupancy by Household Size in Westchester
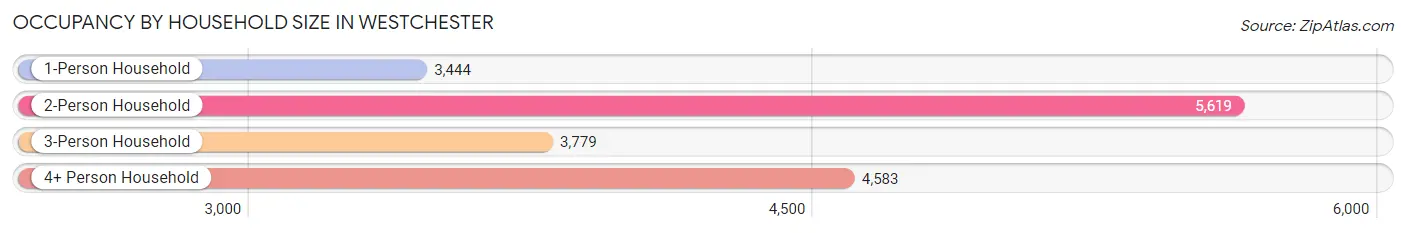
| Household Size | # Housing Units | % Housing Units |
| 1-Person Household | 3,444 | 19.8% |
| 2-Person Household | 5,619 | 32.3% |
| 3-Person Household | 3,779 | 21.7% |
| 4+ Person Household | 4,583 | 26.3% |
| Total Housing Units | 17,425 | 100.0% |
Occupancy by Ownership by Household Size in Westchester
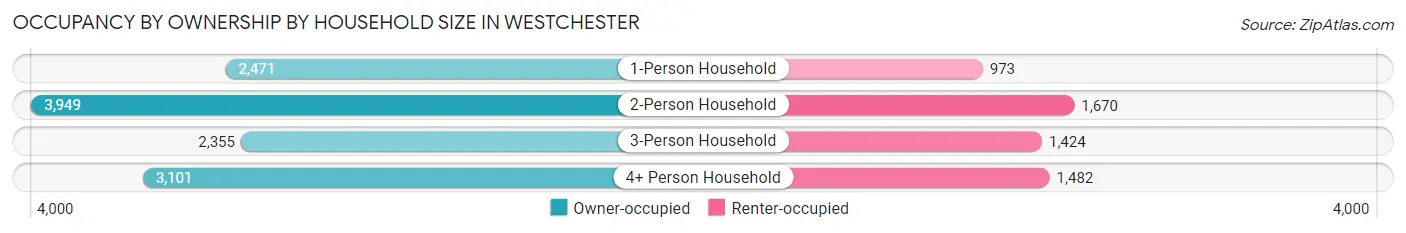
| Household Size | Owner-occupied | Renter-occupied |
| 1-Person Household | 2,471 (71.8%) | 973 (28.2%) |
| 2-Person Household | 3,949 (70.3%) | 1,670 (29.7%) |
| 3-Person Household | 2,355 (62.3%) | 1,424 (37.7%) |
| 4+ Person Household | 3,101 (67.7%) | 1,482 (32.3%) |
| Total Housing Units | 11,876 (68.1%) | 5,549 (31.9%) |
Occupancy by Educational Attainment in Westchester
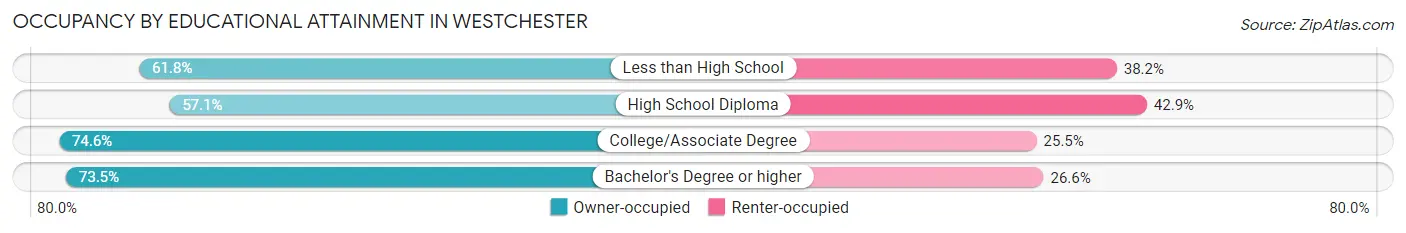
| Household Size | Owner-occupied | Renter-occupied |
| Less than High School | 1,708 (61.8%) | 1,054 (38.2%) |
| High School Diploma | 2,279 (57.1%) | 1,715 (42.9%) |
| College/Associate Degree | 3,548 (74.6%) | 1,211 (25.5%) |
| Bachelor's Degree or higher | 4,341 (73.5%) | 1,569 (26.6%) |
Occupancy by Age of Householder in Westchester
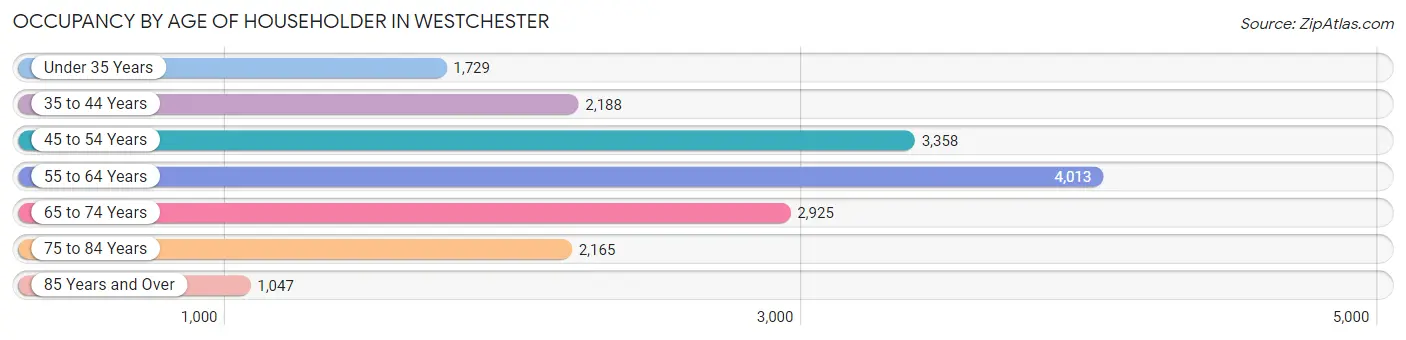
| Age Bracket | # Households | % Households |
| Under 35 Years | 1,729 | 9.9% |
| 35 to 44 Years | 2,188 | 12.6% |
| 45 to 54 Years | 3,358 | 19.3% |
| 55 to 64 Years | 4,013 | 23.0% |
| 65 to 74 Years | 2,925 | 16.8% |
| 75 to 84 Years | 2,165 | 12.4% |
| 85 Years and Over | 1,047 | 6.0% |
| Total | 17,425 | 100.0% |
Housing Finances in Westchester
Median Income by Occupancy in Westchester
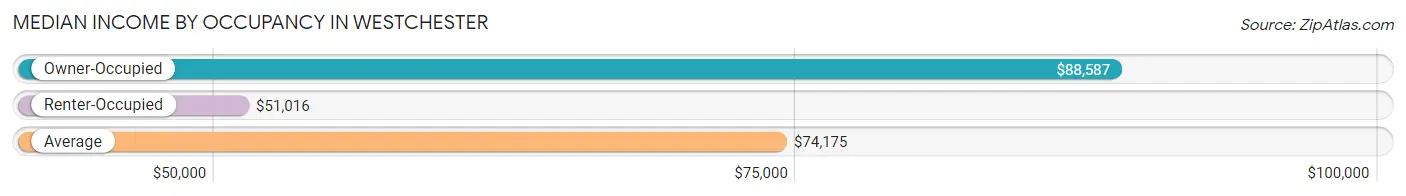
| Occupancy Type | # Households | Median Income |
| Owner-Occupied | 11,876 (68.1%) | $88,587 |
| Renter-Occupied | 5,549 (31.9%) | $51,016 |
| Average | 17,425 (100.0%) | $74,175 |
Occupancy by Householder Income Bracket in Westchester
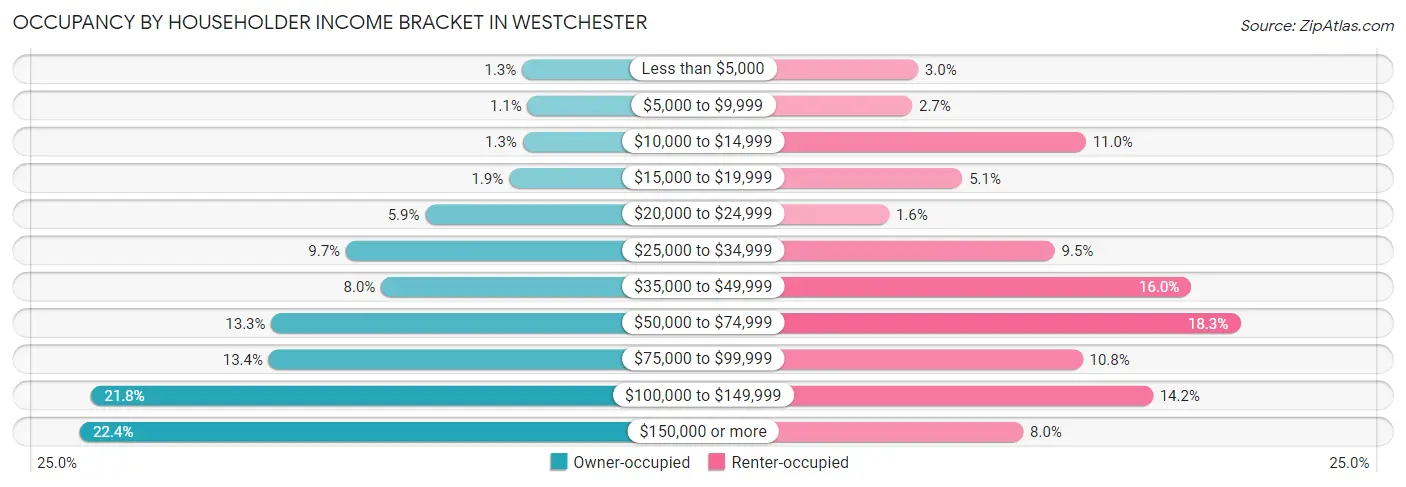
| Income Bracket | Owner-occupied | Renter-occupied |
| Less than $5,000 | 156 (1.3%) | 165 (3.0%) |
| $5,000 to $9,999 | 125 (1.1%) | 149 (2.7%) |
| $10,000 to $14,999 | 152 (1.3%) | 608 (11.0%) |
| $15,000 to $19,999 | 229 (1.9%) | 282 (5.1%) |
| $20,000 to $24,999 | 703 (5.9%) | 88 (1.6%) |
| $25,000 to $34,999 | 1,152 (9.7%) | 526 (9.5%) |
| $35,000 to $49,999 | 952 (8.0%) | 887 (16.0%) |
| $50,000 to $74,999 | 1,573 (13.3%) | 1,016 (18.3%) |
| $75,000 to $99,999 | 1,588 (13.4%) | 600 (10.8%) |
| $100,000 to $149,999 | 2,591 (21.8%) | 785 (14.1%) |
| $150,000 or more | 2,655 (22.4%) | 443 (8.0%) |
| Total | 11,876 (100.0%) | 5,549 (100.0%) |
Monthly Housing Cost Tiers in Westchester
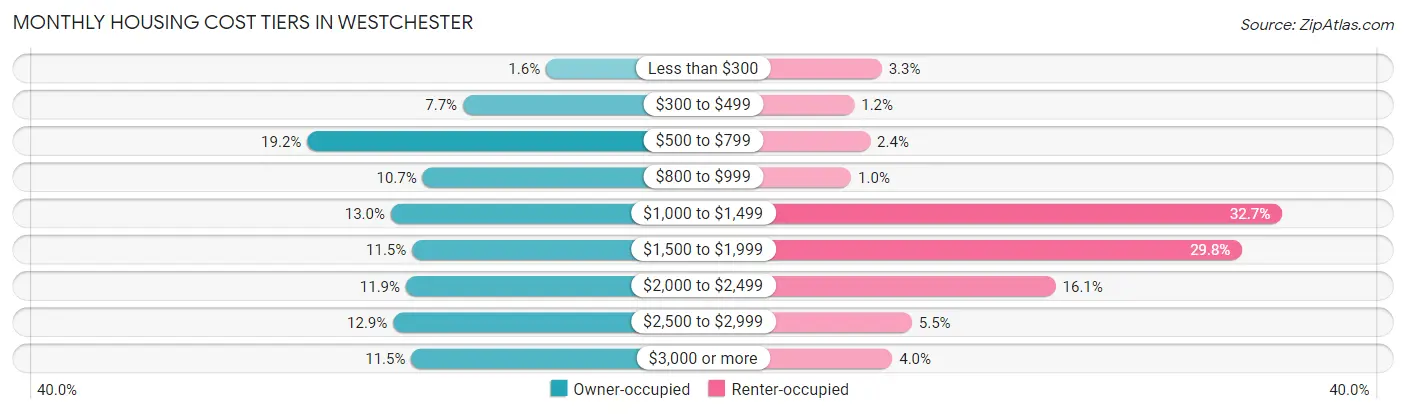
| Monthly Cost | Owner-occupied | Renter-occupied |
| Less than $300 | 190 (1.6%) | 181 (3.3%) |
| $300 to $499 | 917 (7.7%) | 69 (1.2%) |
| $500 to $799 | 2,279 (19.2%) | 134 (2.4%) |
| $800 to $999 | 1,270 (10.7%) | 56 (1.0%) |
| $1,000 to $1,499 | 1,548 (13.0%) | 1,817 (32.7%) |
| $1,500 to $1,999 | 1,361 (11.5%) | 1,654 (29.8%) |
| $2,000 to $2,499 | 1,416 (11.9%) | 892 (16.1%) |
| $2,500 to $2,999 | 1,527 (12.9%) | 304 (5.5%) |
| $3,000 or more | 1,368 (11.5%) | 224 (4.0%) |
| Total | 11,876 (100.0%) | 5,549 (100.0%) |
Physical Housing Characteristics in Westchester
Housing Structures in Westchester
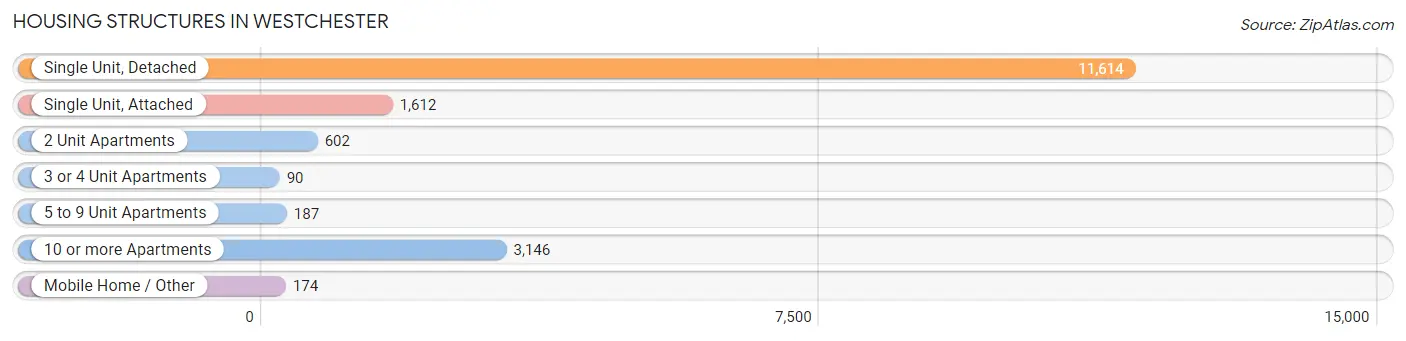
| Structure Type | # Housing Units | % Housing Units |
| Single Unit, Detached | 11,614 | 66.6% |
| Single Unit, Attached | 1,612 | 9.2% |
| 2 Unit Apartments | 602 | 3.5% |
| 3 or 4 Unit Apartments | 90 | 0.5% |
| 5 to 9 Unit Apartments | 187 | 1.1% |
| 10 or more Apartments | 3,146 | 18.0% |
| Mobile Home / Other | 174 | 1.0% |
| Total | 17,425 | 100.0% |
Housing Structures by Occupancy in Westchester
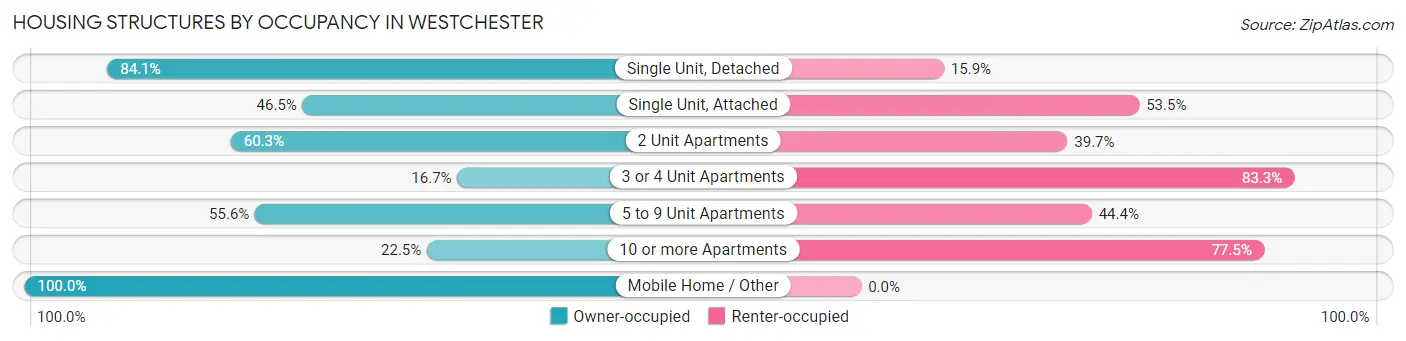
| Structure Type | Owner-occupied | Renter-occupied |
| Single Unit, Detached | 9,763 (84.1%) | 1,851 (15.9%) |
| Single Unit, Attached | 749 (46.5%) | 863 (53.5%) |
| 2 Unit Apartments | 363 (60.3%) | 239 (39.7%) |
| 3 or 4 Unit Apartments | 15 (16.7%) | 75 (83.3%) |
| 5 to 9 Unit Apartments | 104 (55.6%) | 83 (44.4%) |
| 10 or more Apartments | 708 (22.5%) | 2,438 (77.5%) |
| Mobile Home / Other | 174 (100.0%) | 0 (0.0%) |
| Total | 11,876 (68.1%) | 5,549 (31.9%) |
Housing Structures by Number of Rooms in Westchester
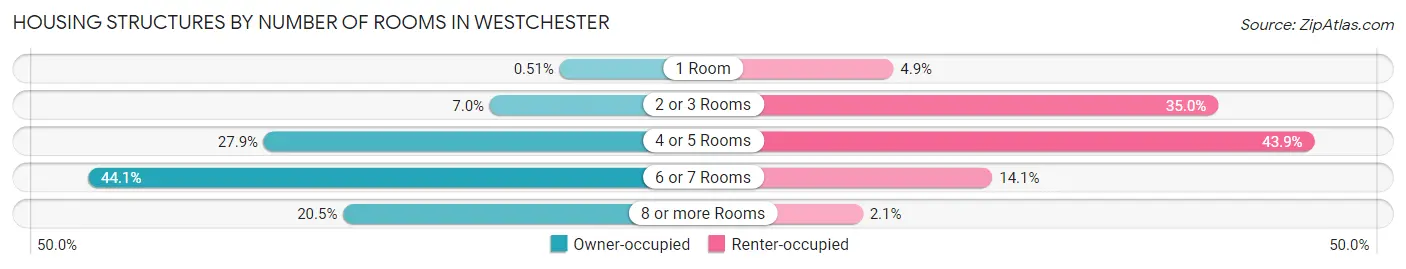
| Number of Rooms | Owner-occupied | Renter-occupied |
| 1 Room | 60 (0.5%) | 274 (4.9%) |
| 2 or 3 Rooms | 827 (7.0%) | 1,941 (35.0%) |
| 4 or 5 Rooms | 3,310 (27.9%) | 2,435 (43.9%) |
| 6 or 7 Rooms | 5,241 (44.1%) | 782 (14.1%) |
| 8 or more Rooms | 2,438 (20.5%) | 117 (2.1%) |
| Total | 11,876 (100.0%) | 5,549 (100.0%) |
Housing Structure by Heating Type in Westchester
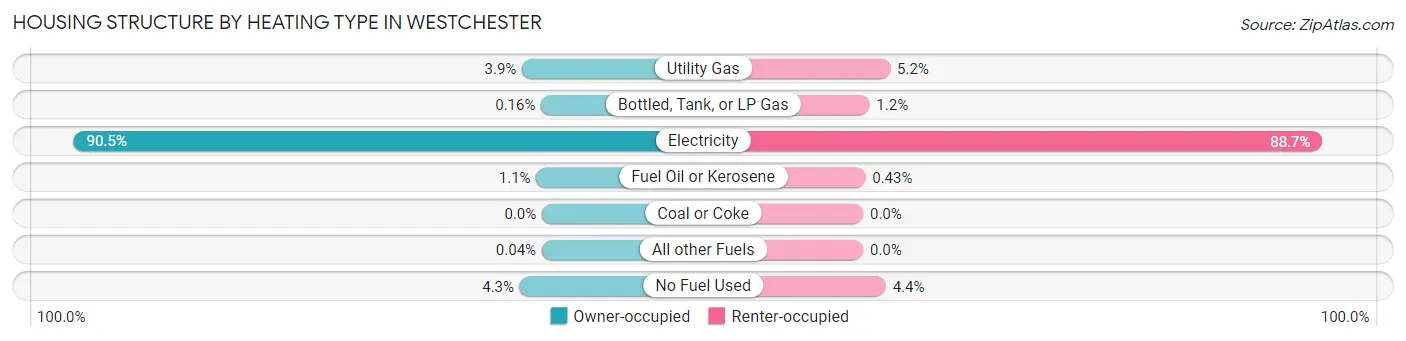
| Heating Type | Owner-occupied | Renter-occupied |
| Utility Gas | 457 (3.8%) | 290 (5.2%) |
| Bottled, Tank, or LP Gas | 19 (0.2%) | 68 (1.2%) |
| Electricity | 10,753 (90.5%) | 4,924 (88.7%) |
| Fuel Oil or Kerosene | 131 (1.1%) | 24 (0.4%) |
| Coal or Coke | 0 (0.0%) | 0 (0.0%) |
| All other Fuels | 5 (0.0%) | 0 (0.0%) |
| No Fuel Used | 511 (4.3%) | 243 (4.4%) |
| Total | 11,876 (100.0%) | 5,549 (100.0%) |
Household Vehicle Usage in Westchester
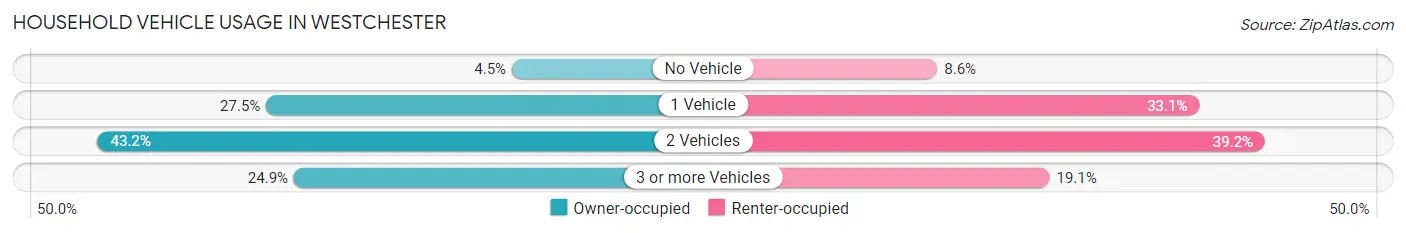
| Vehicles per Household | Owner-occupied | Renter-occupied |
| No Vehicle | 536 (4.5%) | 479 (8.6%) |
| 1 Vehicle | 3,260 (27.5%) | 1,835 (33.1%) |
| 2 Vehicles | 5,128 (43.2%) | 2,175 (39.2%) |
| 3 or more Vehicles | 2,952 (24.9%) | 1,060 (19.1%) |
| Total | 11,876 (100.0%) | 5,549 (100.0%) |
Real Estate & Mortgages in Westchester
Real Estate and Mortgage Overview in Westchester
| Characteristic | Without Mortgage | With Mortgage |
| Housing Units | 5,349 | 6,527 |
| Median Property Value | $416,300 | $455,900 |
| Median Household Income | $55,233 | $1,767 |
| Monthly Housing Costs | $731 | $1,368 |
| Real Estate Taxes | $3,163 | $67 |
Property Value by Mortgage Status in Westchester
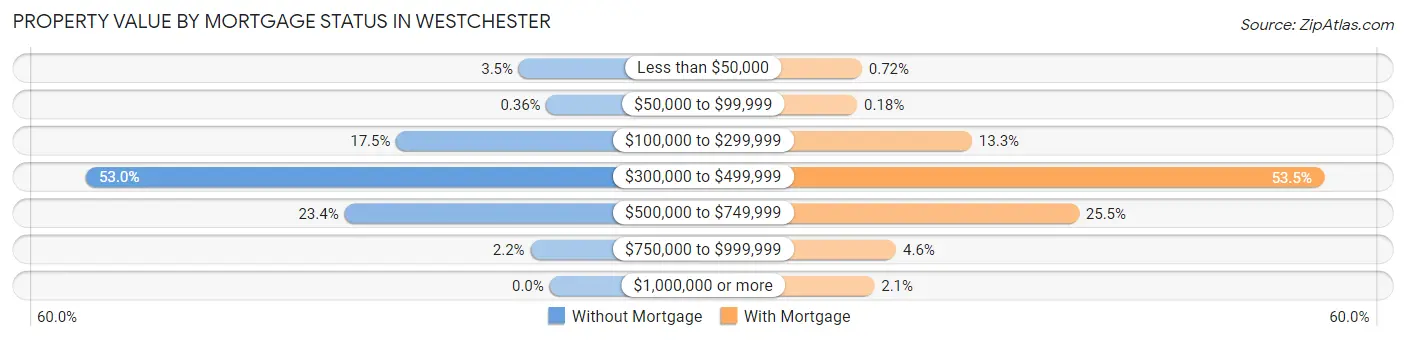
| Property Value | Without Mortgage | With Mortgage |
| Less than $50,000 | 188 (3.5%) | 47 (0.7%) |
| $50,000 to $99,999 | 19 (0.4%) | 12 (0.2%) |
| $100,000 to $299,999 | 937 (17.5%) | 868 (13.3%) |
| $300,000 to $499,999 | 2,834 (53.0%) | 3,492 (53.5%) |
| $500,000 to $749,999 | 1,254 (23.4%) | 1,666 (25.5%) |
| $750,000 to $999,999 | 117 (2.2%) | 302 (4.6%) |
| $1,000,000 or more | 0 (0.0%) | 140 (2.1%) |
| Total | 5,349 (100.0%) | 6,527 (100.0%) |
Household Income by Mortgage Status in Westchester
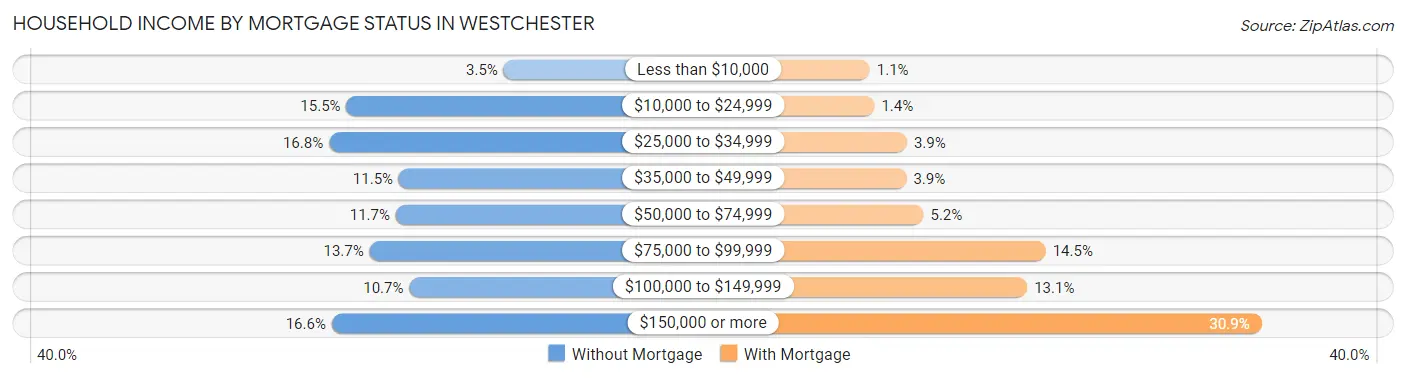
| Household Income | Without Mortgage | With Mortgage |
| Less than $10,000 | 187 (3.5%) | 71 (1.1%) |
| $10,000 to $24,999 | 828 (15.5%) | 94 (1.4%) |
| $25,000 to $34,999 | 899 (16.8%) | 256 (3.9%) |
| $35,000 to $49,999 | 614 (11.5%) | 253 (3.9%) |
| $50,000 to $74,999 | 627 (11.7%) | 338 (5.2%) |
| $75,000 to $99,999 | 734 (13.7%) | 946 (14.5%) |
| $100,000 to $149,999 | 572 (10.7%) | 854 (13.1%) |
| $150,000 or more | 888 (16.6%) | 2,019 (30.9%) |
| Total | 5,349 (100.0%) | 6,527 (100.0%) |
Property Value to Household Income Ratio in Westchester
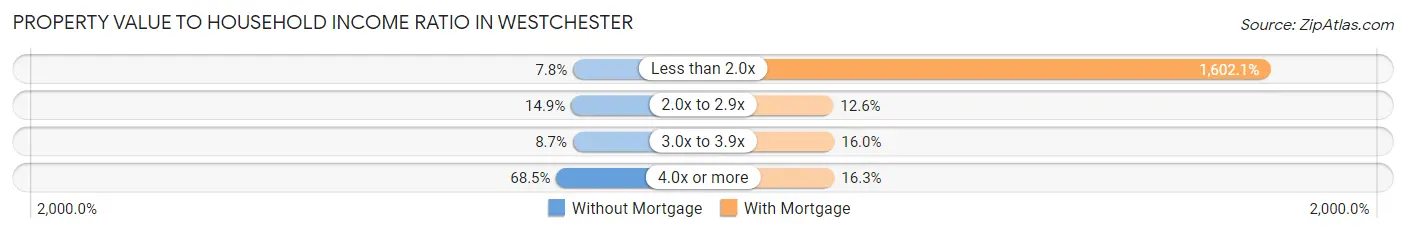
| Value-to-Income Ratio | Without Mortgage | With Mortgage |
| Less than 2.0x | 419 (7.8%) | 104,567 (1,602.1%) |
| 2.0x to 2.9x | 795 (14.9%) | 820 (12.6%) |
| 3.0x to 3.9x | 465 (8.7%) | 1,045 (16.0%) |
| 4.0x or more | 3,665 (68.5%) | 1,064 (16.3%) |
| Total | 5,349 (100.0%) | 6,527 (100.0%) |
Real Estate Taxes by Mortgage Status in Westchester
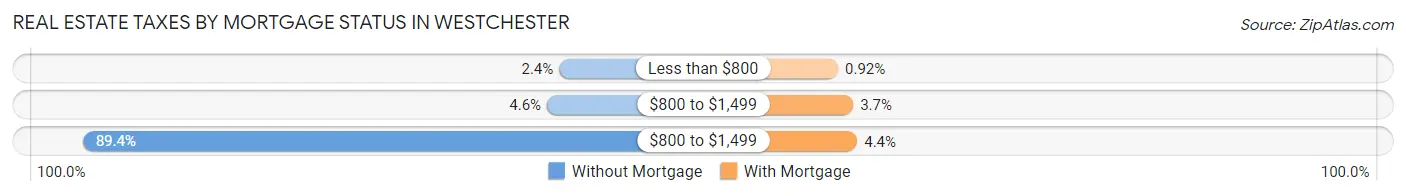
| Property Taxes | Without Mortgage | With Mortgage |
| Less than $800 | 127 (2.4%) | 60 (0.9%) |
| $800 to $1,499 | 246 (4.6%) | 240 (3.7%) |
| $800 to $1,499 | 4,781 (89.4%) | 289 (4.4%) |
| Total | 5,349 (100.0%) | 6,527 (100.0%) |
Health & Disability in Westchester
Health Insurance Coverage by Age in Westchester
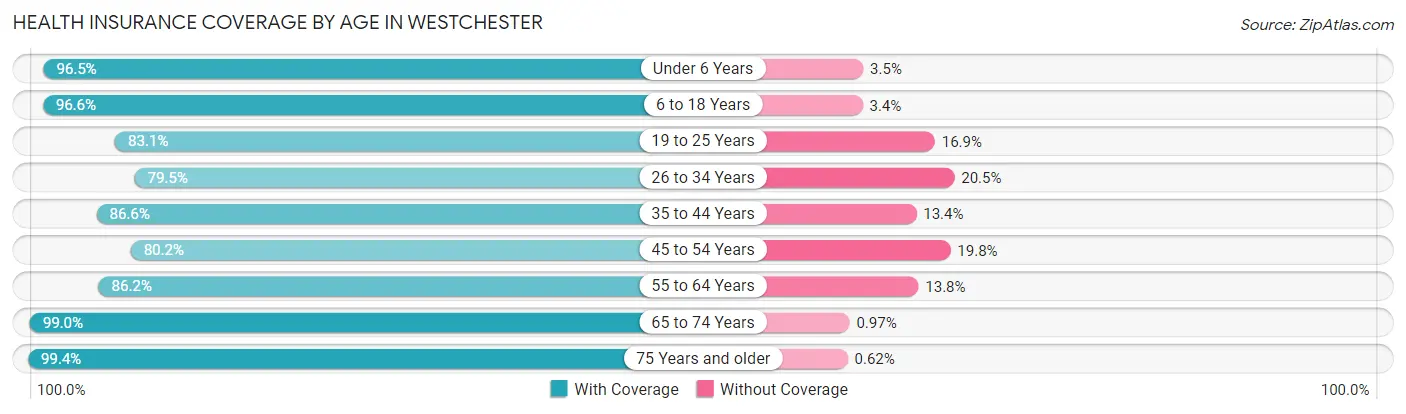
| Age Bracket | With Coverage | Without Coverage |
| Under 6 Years | 2,686 (96.5%) | 98 (3.5%) |
| 6 to 18 Years | 5,905 (96.6%) | 208 (3.4%) |
| 19 to 25 Years | 5,314 (83.1%) | 1,079 (16.9%) |
| 26 to 34 Years | 4,390 (79.5%) | 1,133 (20.5%) |
| 35 to 44 Years | 4,599 (86.6%) | 713 (13.4%) |
| 45 to 54 Years | 6,360 (80.2%) | 1,569 (19.8%) |
| 55 to 64 Years | 7,063 (86.2%) | 1,132 (13.8%) |
| 65 to 74 Years | 5,501 (99.0%) | 54 (1.0%) |
| 75 Years and older | 5,905 (99.4%) | 37 (0.6%) |
| Total | 47,723 (88.8%) | 6,023 (11.2%) |
Health Insurance Coverage by Citizenship Status in Westchester
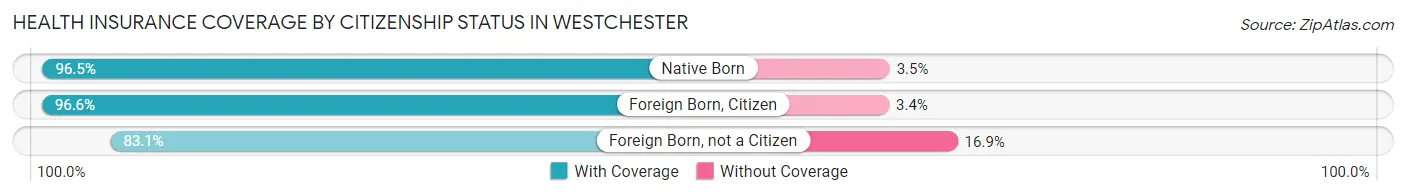
| Citizenship Status | With Coverage | Without Coverage |
| Native Born | 2,686 (96.5%) | 98 (3.5%) |
| Foreign Born, Citizen | 5,905 (96.6%) | 208 (3.4%) |
| Foreign Born, not a Citizen | 5,314 (83.1%) | 1,079 (16.9%) |
Health Insurance Coverage by Household Income in Westchester
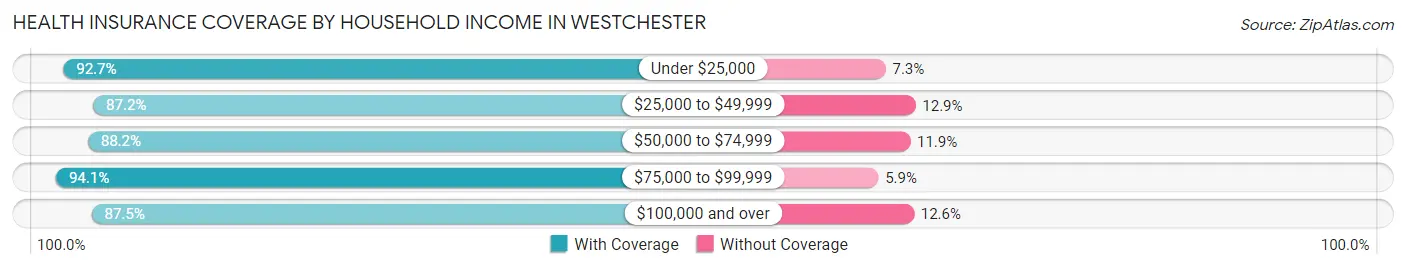
| Household Income | With Coverage | Without Coverage |
| Under $25,000 | 4,035 (92.7%) | 316 (7.3%) |
| $25,000 to $49,999 | 7,215 (87.2%) | 1,064 (12.9%) |
| $50,000 to $74,999 | 6,549 (88.1%) | 880 (11.8%) |
| $75,000 to $99,999 | 5,979 (94.1%) | 374 (5.9%) |
| $100,000 and over | 20,462 (87.5%) | 2,936 (12.6%) |
Public vs Private Health Insurance Coverage by Age in Westchester
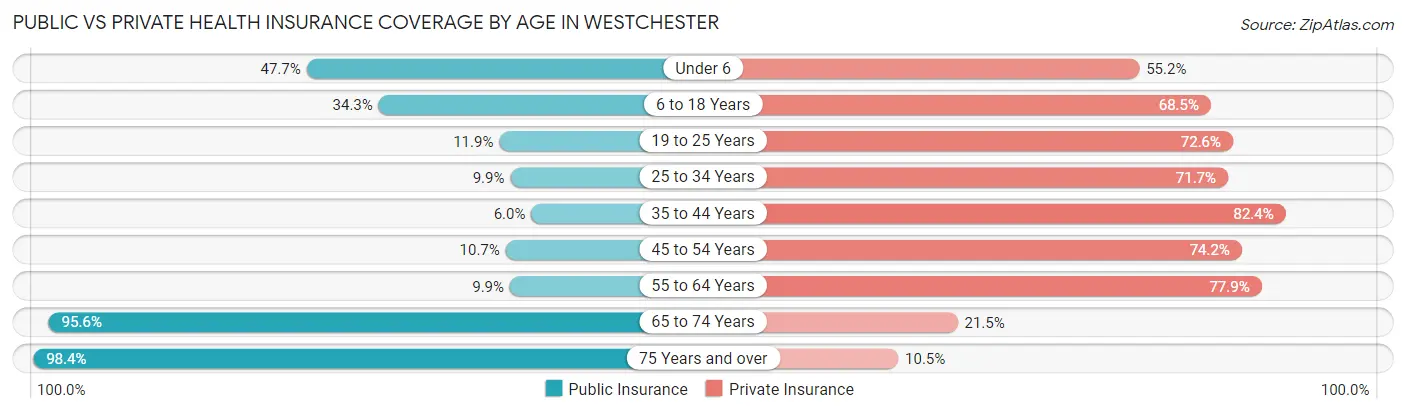
| Age Bracket | Public Insurance | Private Insurance |
| Under 6 | 1,327 (47.7%) | 1,537 (55.2%) |
| 6 to 18 Years | 2,096 (34.3%) | 4,186 (68.5%) |
| 19 to 25 Years | 761 (11.9%) | 4,640 (72.6%) |
| 25 to 34 Years | 544 (9.9%) | 3,957 (71.7%) |
| 35 to 44 Years | 316 (5.9%) | 4,375 (82.4%) |
| 45 to 54 Years | 850 (10.7%) | 5,885 (74.2%) |
| 55 to 64 Years | 814 (9.9%) | 6,383 (77.9%) |
| 65 to 74 Years | 5,308 (95.6%) | 1,193 (21.5%) |
| 75 Years and over | 5,847 (98.4%) | 621 (10.4%) |
| Total | 17,863 (33.2%) | 32,777 (61.0%) |
Disability Status by Sex by Age in Westchester
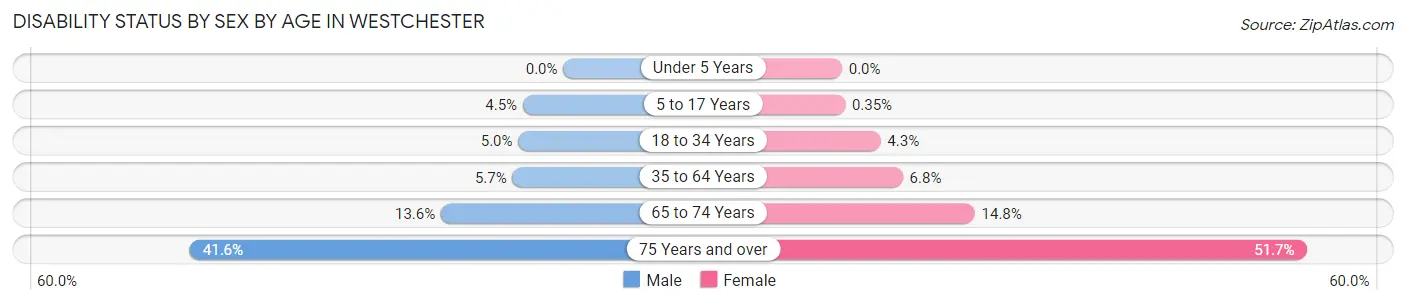
| Age Bracket | Male | Female |
| Under 5 Years | 0 (0.0%) | 0 (0.0%) |
| 5 to 17 Years | 123 (4.5%) | 8 (0.4%) |
| 18 to 34 Years | 312 (5.0%) | 311 (4.3%) |
| 35 to 64 Years | 584 (5.7%) | 754 (6.8%) |
| 65 to 74 Years | 332 (13.6%) | 461 (14.8%) |
| 75 Years and over | 942 (41.6%) | 1,902 (51.7%) |
Disability Class by Sex by Age in Westchester
Disability Class: Hearing Difficulty
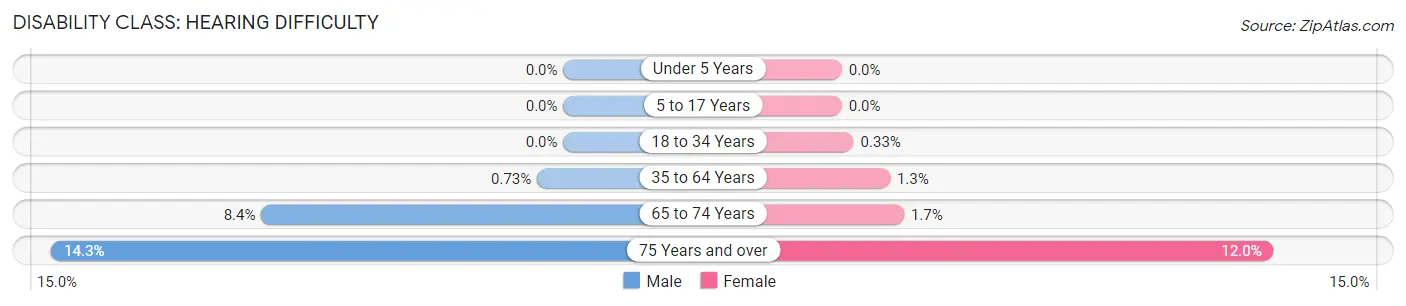
| Age Bracket | Male | Female |
| Under 5 Years | 0 (0.0%) | 0 (0.0%) |
| 5 to 17 Years | 0 (0.0%) | 0 (0.0%) |
| 18 to 34 Years | 0 (0.0%) | 24 (0.3%) |
| 35 to 64 Years | 75 (0.7%) | 149 (1.3%) |
| 65 to 74 Years | 205 (8.4%) | 54 (1.7%) |
| 75 Years and over | 323 (14.3%) | 442 (12.0%) |
Disability Class: Vision Difficulty
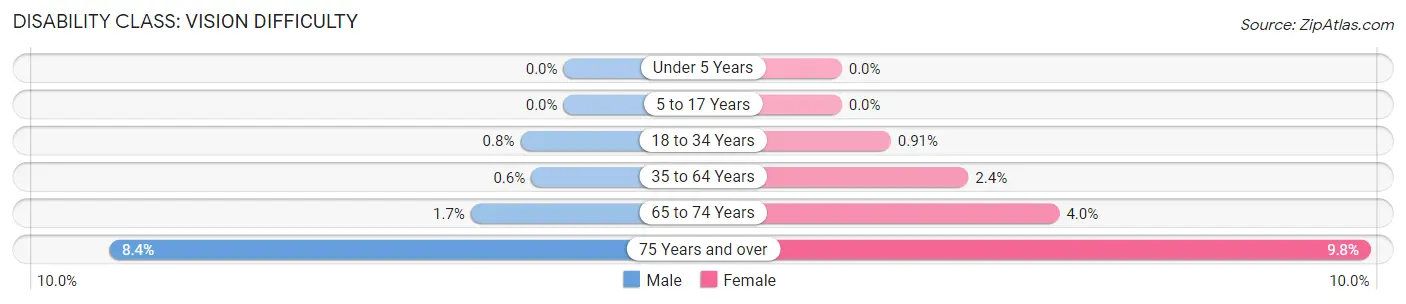
| Age Bracket | Male | Female |
| Under 5 Years | 0 (0.0%) | 0 (0.0%) |
| 5 to 17 Years | 0 (0.0%) | 0 (0.0%) |
| 18 to 34 Years | 50 (0.8%) | 66 (0.9%) |
| 35 to 64 Years | 62 (0.6%) | 261 (2.4%) |
| 65 to 74 Years | 42 (1.7%) | 126 (4.0%) |
| 75 Years and over | 191 (8.4%) | 361 (9.8%) |
Disability Class: Cognitive Difficulty
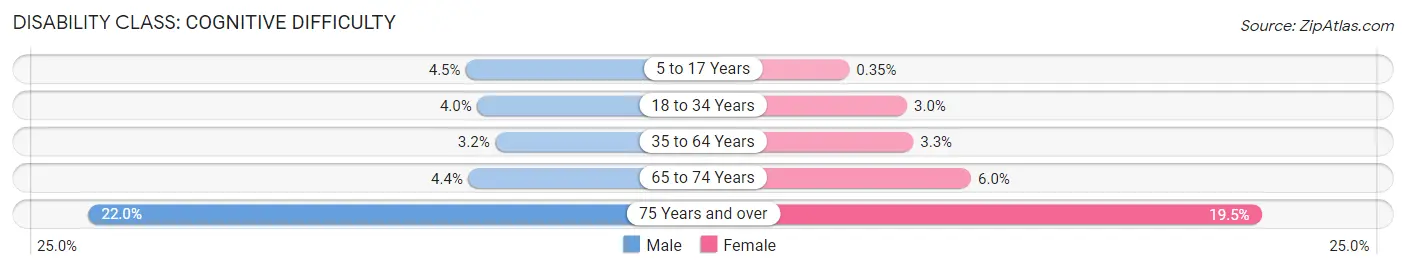
| Age Bracket | Male | Female |
| 5 to 17 Years | 123 (4.5%) | 8 (0.4%) |
| 18 to 34 Years | 248 (4.0%) | 219 (3.0%) |
| 35 to 64 Years | 325 (3.2%) | 369 (3.3%) |
| 65 to 74 Years | 107 (4.4%) | 187 (6.0%) |
| 75 Years and over | 499 (22.0%) | 716 (19.5%) |
Disability Class: Ambulatory Difficulty
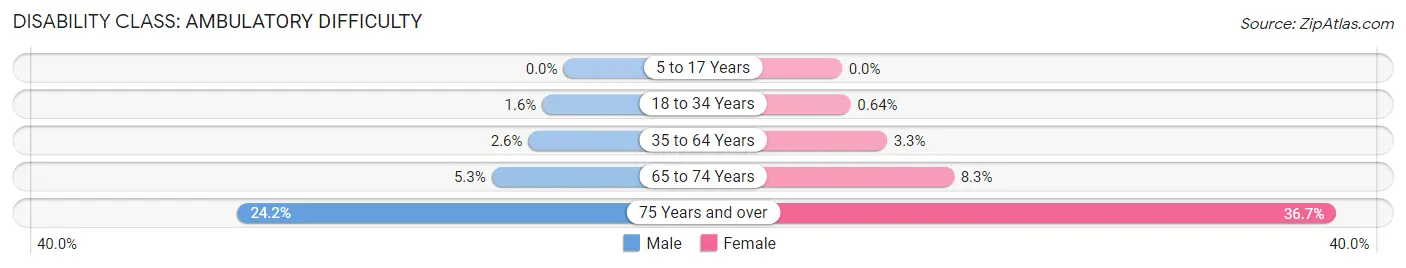
| Age Bracket | Male | Female |
| 5 to 17 Years | 0 (0.0%) | 0 (0.0%) |
| 18 to 34 Years | 98 (1.6%) | 46 (0.6%) |
| 35 to 64 Years | 268 (2.6%) | 371 (3.3%) |
| 65 to 74 Years | 130 (5.3%) | 259 (8.3%) |
| 75 Years and over | 548 (24.2%) | 1,349 (36.7%) |
Disability Class: Self-Care Difficulty
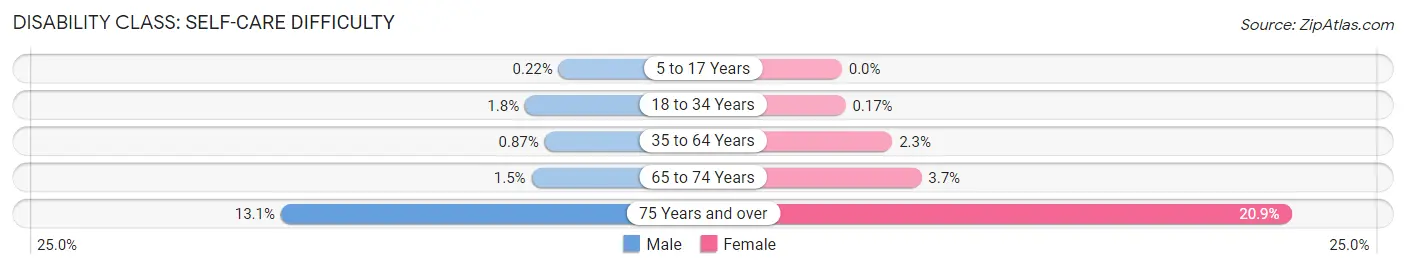
| Age Bracket | Male | Female |
| 5 to 17 Years | 6 (0.2%) | 0 (0.0%) |
| 18 to 34 Years | 111 (1.8%) | 12 (0.2%) |
| 35 to 64 Years | 90 (0.9%) | 260 (2.3%) |
| 65 to 74 Years | 36 (1.5%) | 115 (3.7%) |
| 75 Years and over | 297 (13.1%) | 767 (20.9%) |
Technology Access in Westchester
Computing Device Access in Westchester
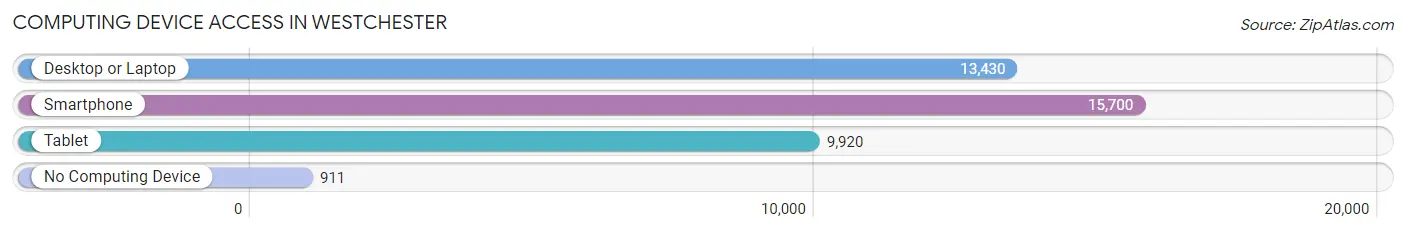
| Device Type | # Households | % Households |
| Desktop or Laptop | 13,430 | 77.1% |
| Smartphone | 15,700 | 90.1% |
| Tablet | 9,920 | 56.9% |
| No Computing Device | 911 | 5.2% |
| Total | 17,425 | 100.0% |
Internet Access in Westchester
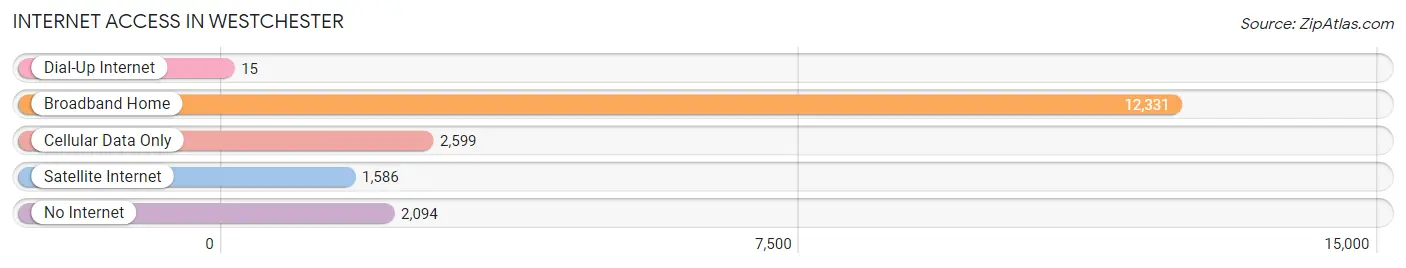
| Internet Type | # Households | % Households |
| Dial-Up Internet | 15 | 0.1% |
| Broadband Home | 12,331 | 70.8% |
| Cellular Data Only | 2,599 | 14.9% |
| Satellite Internet | 1,586 | 9.1% |
| No Internet | 2,094 | 12.0% |
| Total | 17,425 | 100.0% |
Westchester Summary
Westchester is a census-designated place (CDP) located in Miami-Dade County, Florida, United States. The population was 8,845 at the 2010 census. It is located near the city of Miami and is part of the Miami metropolitan area.
Geography
Westchester is located at 25 41 25 North 80 20 17 West 25 690278 80 338333
According to the United States Census Bureau, the CDP has a total area of 2.3 square miles (6.0 km2), all land.
History
Westchester was originally part of the Everglades, and was settled in the early 1900s by farmers and ranchers. The area was known as Westchester Country Club Estates until the 1950s, when it was incorporated as the Town of Westchester. The town was annexed by the City of Miami in the late 1950s.
Economy
Westchester is home to a variety of businesses, including retail stores, restaurants, and professional services. The area is also home to several large employers, including the University of Miami, Miami-Dade County Public Schools, and Baptist Health South Florida.
Demographics
As of the census of 2000, there were 8,845 people, 2,945 households, and 2,072 families residing in the CDP. The population density was 3,845.3 people per square mile (1,482.2/km2). There were 3,093 housing units at an average density of 1,334.3/sq mi (515.3/km2). The racial makeup of the CDP was 79.2% White (non-Hispanic), 8.2% African American, 0.2% Native American, 5.2% Asian, 0.1% Pacific Islander, 4.7% from other races, and 2.5% from two or more races. Hispanic or Latino of any race were 57.2% of the population.
There were 2,945 households, out of which 33.2% had children under the age of 18 living with them, 51.2% were married couples living together, 13.2% had a female householder with no husband present, and 30.2% were non-families. 24.2% of all households were made up of individuals, and 8.2% had someone living alone who was 65 years of age or older. The average household size was 2.99 and the average family size was 3.56.
In the CDP, the population was spread out, with 25.2% under the age of 18, 9.2% from 18 to 24, 32.2% from 25 to 44, 21.2% from 45 to 64, and 12.2% who were 65 years of age or older. The median age was 35 years. For every 100 females, there were 95.2 males. For every 100 females age 18 and over, there were 92.2 males.
The median income for a household in the CDP was $37,945, and the median income for a family was $41,945. Males had a median income of $30,945 versus $25,945 for females. The per capita income for the CDP was $16,945. About 10.2% of families and 12.2% of the population were below the poverty line, including 16.2% of those under age 18 and 8.2% of those age 65 or over.
Common Questions
What is the Total Population of Westchester?
Total Population of Westchester is 53,765.
What is the Total Male Population of Westchester?
Total Male Population of Westchester is 25,130.
What is the Total Female Population of Westchester?
Total Female Population of Westchester is 28,635.
What is the Ratio of Males per 100 Females in Westchester?
There are 87.76 Males per 100 Females in Westchester.
What is the Ratio of Females per 100 Males in Westchester?
There are 113.95 Females per 100 Males in Westchester.
What is the Median Population Age in Westchester?
Median Population Age in Westchester is 45.9 Years.
What is the Average Family Size in Westchester
Average Family Size in Westchester is 3.2 People.
What is the Average Household Size in Westchester
Average Household Size in Westchester is 2.9 People.
What is Per Capita Income in Westchester?
Per Capita income in Westchester is $32,438.
What is the Median Family Income in Westchester?
Median Family Income in Westchester is $82,883.
What is the Median Household income in Westchester?
Median Household Income in Westchester is $74,175.
What is Income or Wage Gap in Westchester?
Income or Wage Gap in Westchester is 31.6%.
Women in Westchester earn 68.4 cents for every dollar earned by a man.
What is Inequality or Gini Index in Westchester?
Inequality or Gini Index in Westchester is 0.44.
How Large is the Labor Force in Westchester?
There are 29,016 People in the Labor Forcein in Westchester.
What is the Percentage of People in the Labor Force in Westchester?
61.5% of People are in the Labor Force in Westchester.
What is the Unemployment Rate in Westchester?
Unemployment Rate in Westchester is 4.3%.