Southeast Arcadia, FL
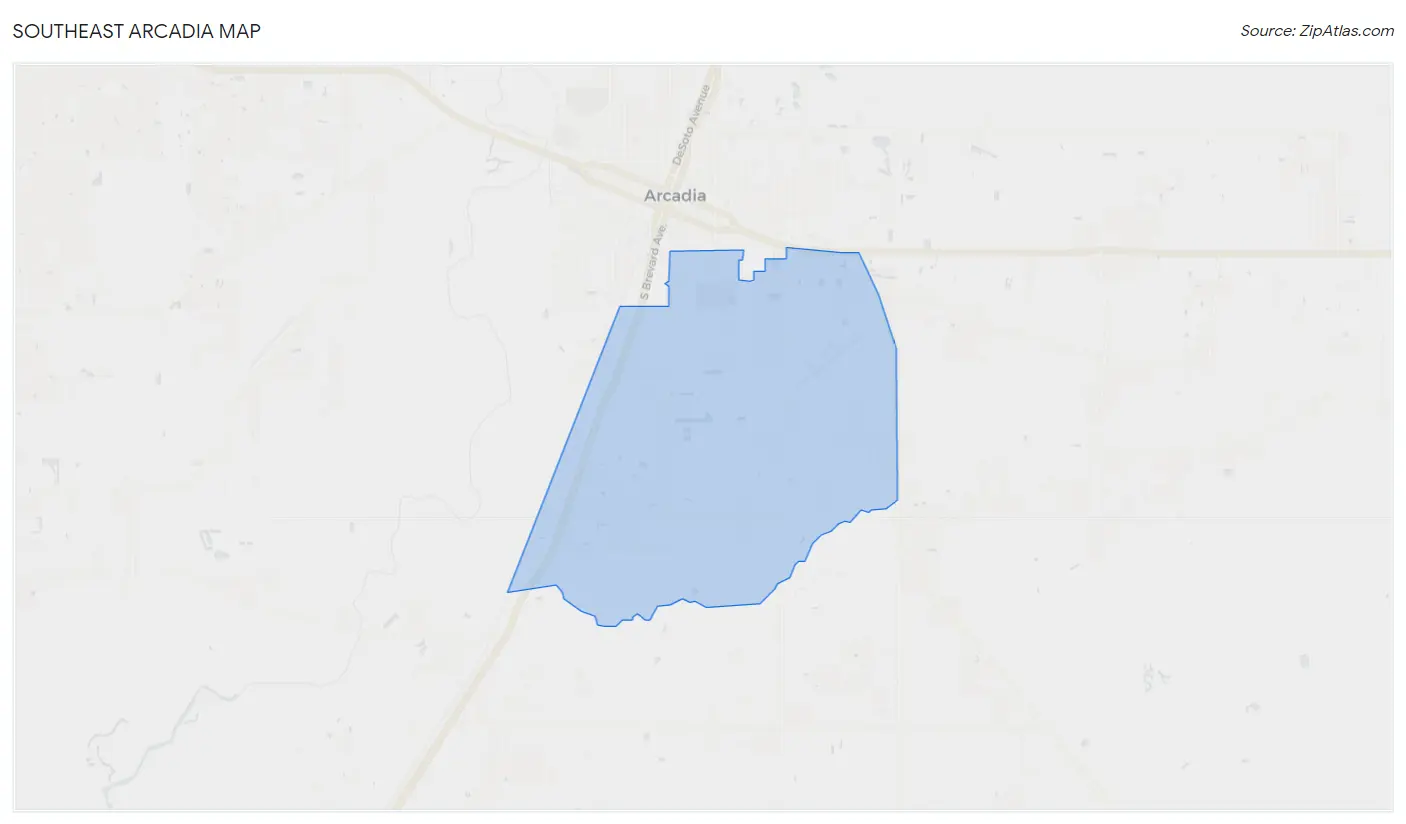
Southeast Arcadia Map
Southeast Arcadia Overview
7,675
TOTAL POPULATION
3,916
MALE POPULATION
3,759
FEMALE POPULATION
104.18
MALES / 100 FEMALES
95.99
FEMALES / 100 MALES
33.5
MEDIAN AGE
3.3
AVG FAMILY SIZE
2.9
AVG HOUSEHOLD SIZE
$18,236
PER CAPITA INCOME
$53,417
AVG FAMILY INCOME
$44,659
AVG HOUSEHOLD INCOME
17.4%
WAGE / INCOME GAP [ % ]
82.6¢/ $1
WAGE / INCOME GAP [ $ ]
0.37
INEQUALITY / GINI INDEX
3,600
LABOR FORCE [ PEOPLE ]
60.4%
PERCENT IN LABOR FORCE
15.0%
UNEMPLOYMENT RATE
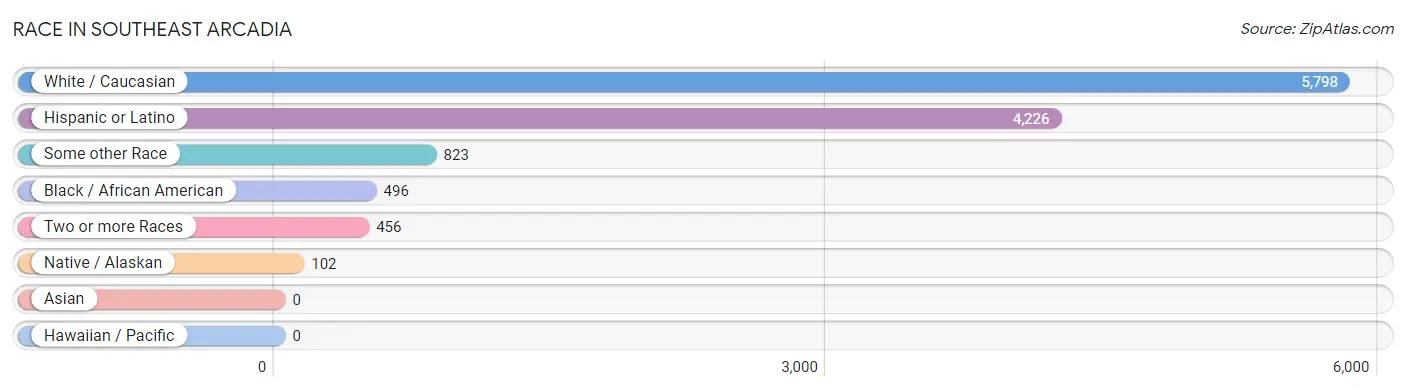
Race in Southeast Arcadia
The most populous races in Southeast Arcadia are White / Caucasian (5,798 | 75.5%), Hispanic or Latino (4,226 | 55.1%), and Some other Race (823 | 10.7%).
| Race | # Population | % Population |
| Asian | 0 | 0.0% |
| Black / African American | 496 | 6.5% |
| Hawaiian / Pacific | 0 | 0.0% |
| Hispanic or Latino | 4,226 | 55.1% |
| Native / Alaskan | 102 | 1.3% |
| White / Caucasian | 5,798 | 75.5% |
| Two or more Races | 456 | 5.9% |
| Some other Race | 823 | 10.7% |
| Total | 7,675 | 100.0% |
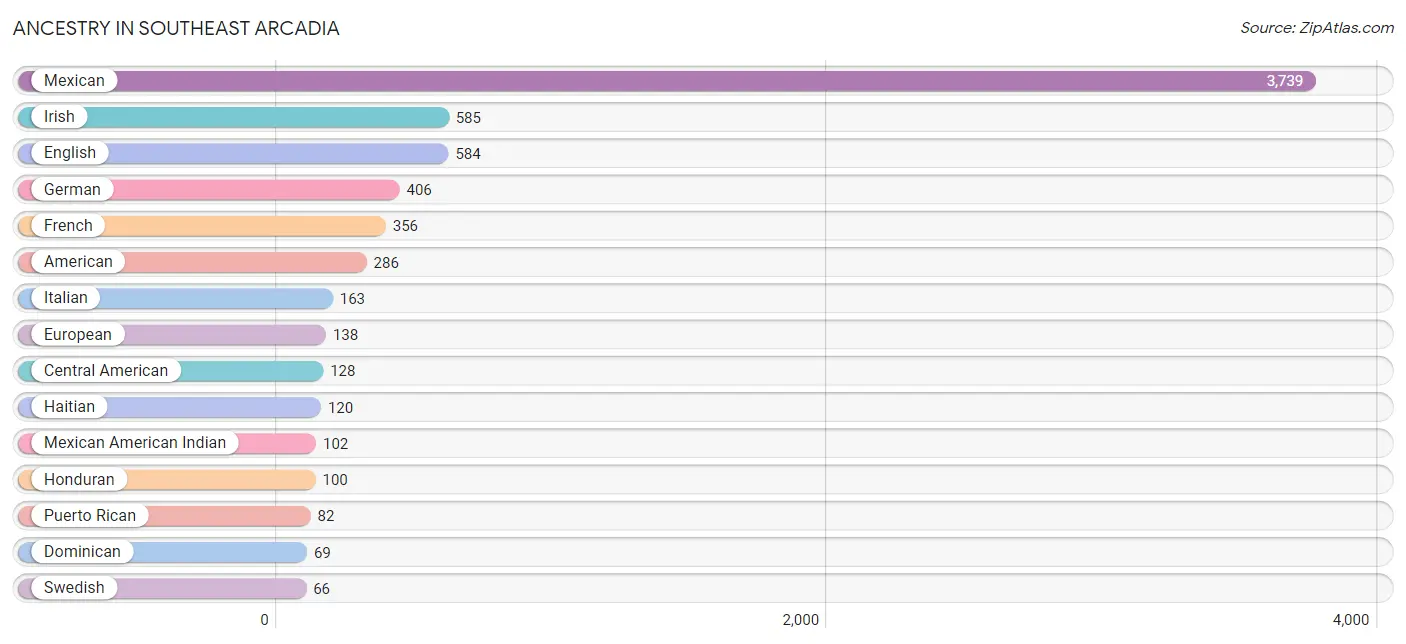
Ancestry in Southeast Arcadia
The most populous ancestries reported in Southeast Arcadia are Mexican (3,739 | 48.7%), Irish (585 | 7.6%), English (584 | 7.6%), German (406 | 5.3%), and French (356 | 4.6%), together accounting for 73.9% of all Southeast Arcadia residents.
| Ancestry | # Population | % Population |
| American | 286 | 3.7% |
| Argentinean | 35 | 0.5% |
| Austrian | 35 | 0.5% |
| Canadian | 7 | 0.1% |
| Central American | 128 | 1.7% |
| Cuban | 48 | 0.6% |
| Dominican | 69 | 0.9% |
| English | 584 | 7.6% |
| European | 138 | 1.8% |
| French | 356 | 4.6% |
| German | 406 | 5.3% |
| Haitian | 120 | 1.6% |
| Honduran | 100 | 1.3% |
| Irish | 585 | 7.6% |
| Italian | 163 | 2.1% |
| Mexican | 3,739 | 48.7% |
| Mexican American Indian | 102 | 1.3% |
| Polish | 12 | 0.2% |
| Puerto Rican | 82 | 1.1% |
| Salvadoran | 28 | 0.4% |
| Scandinavian | 17 | 0.2% |
| Scotch-Irish | 8 | 0.1% |
| South American | 35 | 0.5% |
| Spaniard | 37 | 0.5% |
| Swedish | 66 | 0.9% |
| Welsh | 21 | 0.3% | View All 26 Rows |
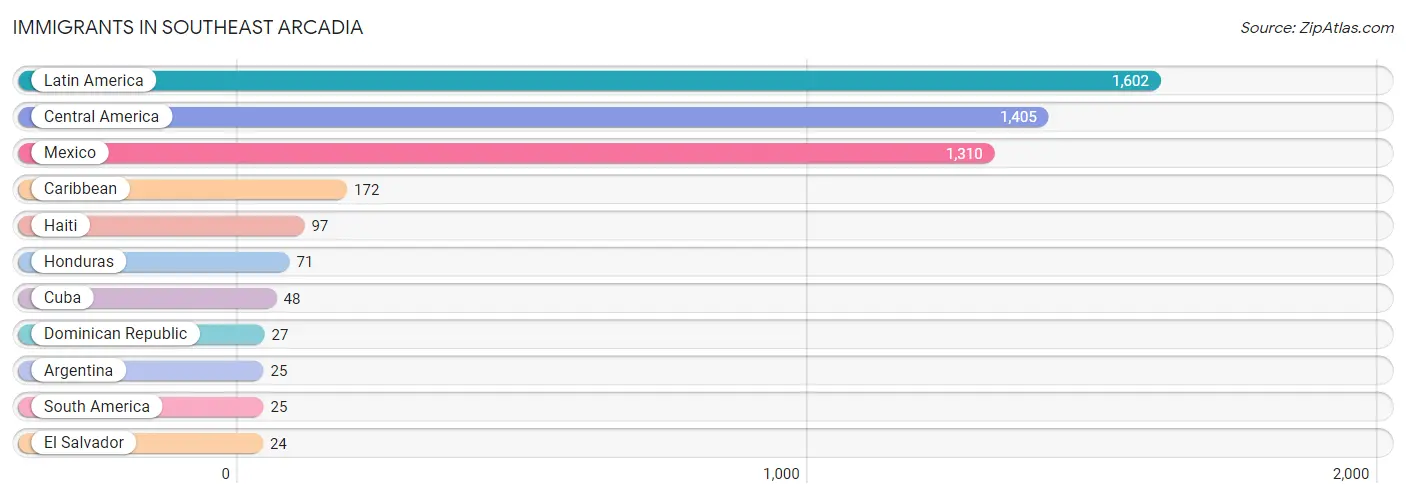
Immigrants in Southeast Arcadia
The most numerous immigrant groups reported in Southeast Arcadia came from Latin America (1,602 | 20.9%), Central America (1,405 | 18.3%), Mexico (1,310 | 17.1%), Caribbean (172 | 2.2%), and Haiti (97 | 1.3%), together accounting for 59.7% of all Southeast Arcadia residents.
| Immigration Origin | # Population | % Population |
| Argentina | 25 | 0.3% |
| Caribbean | 172 | 2.2% |
| Central America | 1,405 | 18.3% |
| Cuba | 48 | 0.6% |
| Dominican Republic | 27 | 0.4% |
| El Salvador | 24 | 0.3% |
| Haiti | 97 | 1.3% |
| Honduras | 71 | 0.9% |
| Latin America | 1,602 | 20.9% |
| Mexico | 1,310 | 17.1% |
| South America | 25 | 0.3% | View All 11 Rows |
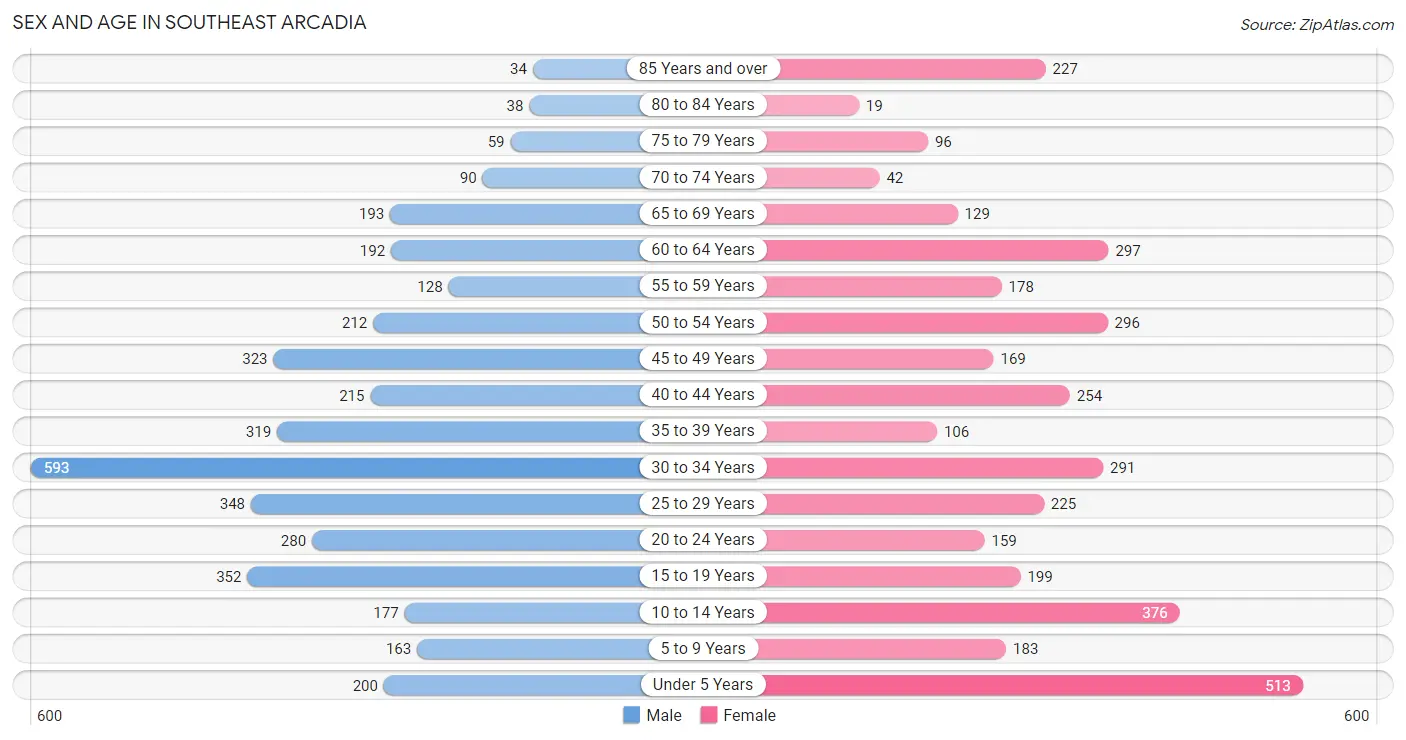
Sex and Age in Southeast Arcadia
Sex and Age in Southeast Arcadia
The most populous age groups in Southeast Arcadia are 30 to 34 Years (593 | 15.1%) for men and Under 5 Years (513 | 13.7%) for women.
| Age Bracket | Male | Female |
| Under 5 Years | 200 (5.1%) | 513 (13.7%) |
| 5 to 9 Years | 163 (4.2%) | 183 (4.9%) |
| 10 to 14 Years | 177 (4.5%) | 376 (10.0%) |
| 15 to 19 Years | 352 (9.0%) | 199 (5.3%) |
| 20 to 24 Years | 280 (7.1%) | 159 (4.2%) |
| 25 to 29 Years | 348 (8.9%) | 225 (6.0%) |
| 30 to 34 Years | 593 (15.1%) | 291 (7.7%) |
| 35 to 39 Years | 319 (8.2%) | 106 (2.8%) |
| 40 to 44 Years | 215 (5.5%) | 254 (6.8%) |
| 45 to 49 Years | 323 (8.3%) | 169 (4.5%) |
| 50 to 54 Years | 212 (5.4%) | 296 (7.9%) |
| 55 to 59 Years | 128 (3.3%) | 178 (4.7%) |
| 60 to 64 Years | 192 (4.9%) | 297 (7.9%) |
| 65 to 69 Years | 193 (4.9%) | 129 (3.4%) |
| 70 to 74 Years | 90 (2.3%) | 42 (1.1%) |
| 75 to 79 Years | 59 (1.5%) | 96 (2.5%) |
| 80 to 84 Years | 38 (1.0%) | 19 (0.5%) |
| 85 Years and over | 34 (0.9%) | 227 (6.0%) |
| Total | 3,916 (100.0%) | 3,759 (100.0%) |
Families and Households in Southeast Arcadia
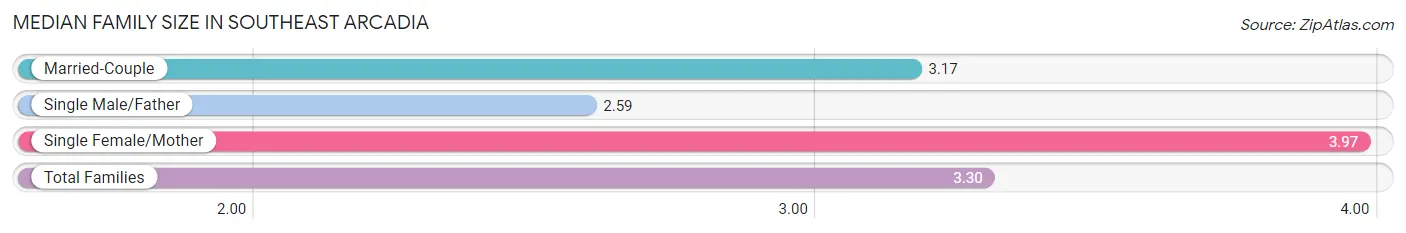
Median Family Size in Southeast Arcadia
The median family size in Southeast Arcadia is 3.30 persons per family, with single female/mother families (517 | 25.7%) accounting for the largest median family size of 3.97 persons per family. On the other hand, single male/father families (268 | 13.3%) represent the smallest median family size with 2.59 persons per family.
| Family Type | # Families | Family Size |
| Married-Couple | 1,225 (61.0%) | 3.17 |
| Single Male/Father | 268 (13.3%) | 2.59 |
| Single Female/Mother | 517 (25.7%) | 3.97 |
| Total Families | 2,010 (100.0%) | 3.30 |
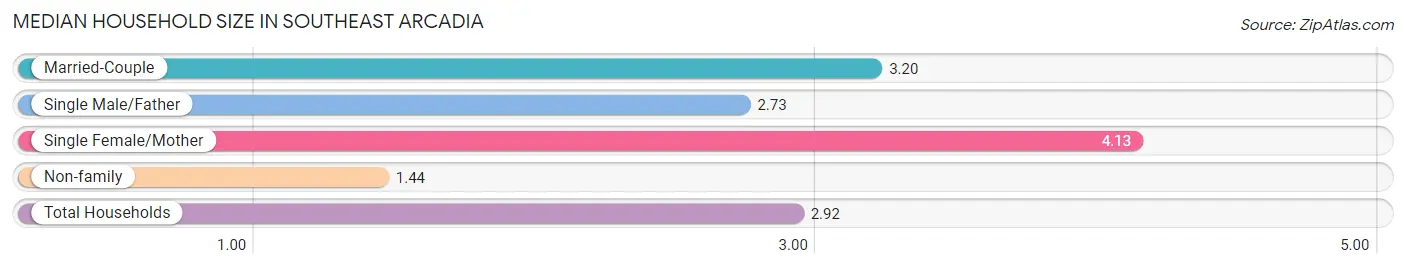
Median Household Size in Southeast Arcadia
The median household size in Southeast Arcadia is 2.92 persons per household, with single female/mother households (517 | 19.7%) accounting for the largest median household size of 4.13 persons per household. non-family households (616 | 23.5%) represent the smallest median household size with 1.44 persons per household.
| Household Type | # Households | Household Size |
| Married-Couple | 1,225 (46.7%) | 3.20 |
| Single Male/Father | 268 (10.2%) | 2.73 |
| Single Female/Mother | 517 (19.7%) | 4.13 |
| Non-family | 616 (23.5%) | 1.44 |
| Total Households | 2,626 (100.0%) | 2.92 |
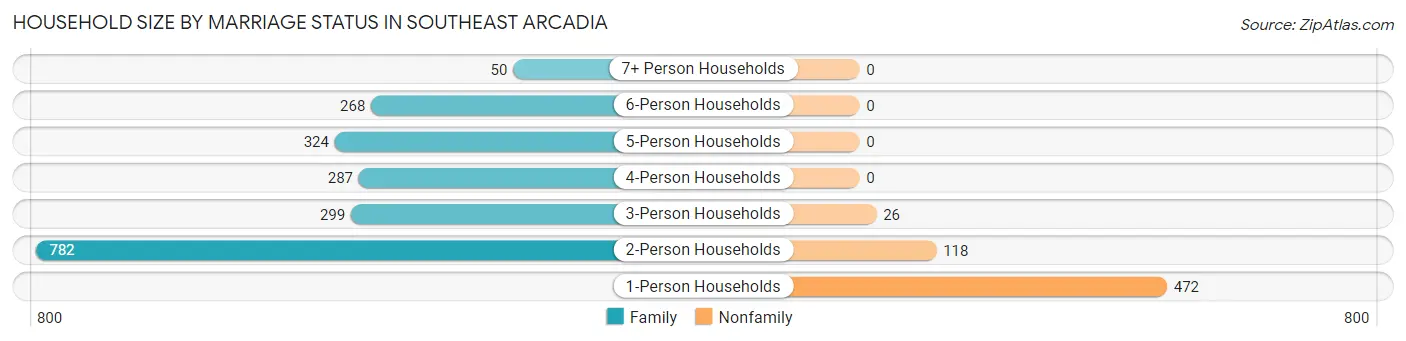
Household Size by Marriage Status in Southeast Arcadia
Out of a total of 2,626 households in Southeast Arcadia, 2,010 (76.5%) are family households, while 616 (23.5%) are nonfamily households. The most numerous type of family households are 2-person households, comprising 782, and the most common type of nonfamily households are 1-person households, comprising 472.
| Household Size | Family Households | Nonfamily Households |
| 1-Person Households | - | 472 (18.0%) |
| 2-Person Households | 782 (29.8%) | 118 (4.5%) |
| 3-Person Households | 299 (11.4%) | 26 (1.0%) |
| 4-Person Households | 287 (10.9%) | 0 (0.0%) |
| 5-Person Households | 324 (12.3%) | 0 (0.0%) |
| 6-Person Households | 268 (10.2%) | 0 (0.0%) |
| 7+ Person Households | 50 (1.9%) | 0 (0.0%) |
| Total | 2,010 (76.5%) | 616 (23.5%) |
Female Fertility in Southeast Arcadia
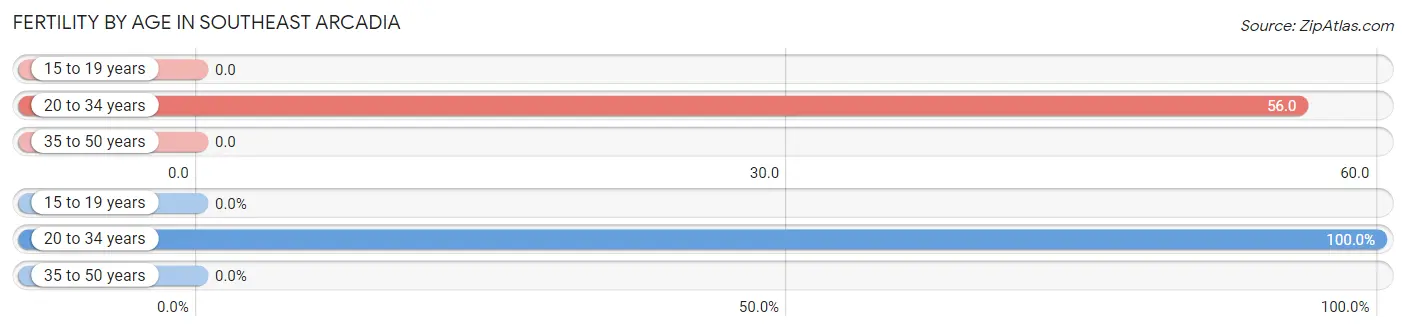
Fertility by Age in Southeast Arcadia
Average fertility rate in Southeast Arcadia is 26.0 births per 1,000 women. Women in the age bracket of 20 to 34 years have the highest fertility rate with 56.0 births per 1,000 women. Women in the age bracket of 20 to 34 years acount for 100.0% of all women with births.
| Age Bracket | Women with Births | Births / 1,000 Women |
| 15 to 19 years | 0 (0.0%) | 0.0 |
| 20 to 34 years | 38 (100.0%) | 56.0 |
| 35 to 50 years | 0 (0.0%) | 0.0 |
| Total | 38 (100.0%) | 26.0 |
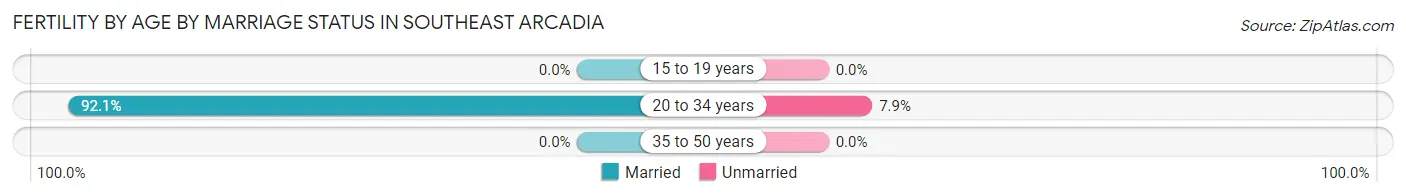
Fertility by Age by Marriage Status in Southeast Arcadia
92.1% of women with births (38) in Southeast Arcadia are married. The highest percentage of unmarried women with births falls into 20 to 34 years age bracket with 7.9% of them unmarried at the time of birth, while the lowest percentage of unmarried women with births belong to 20 to 34 years age bracket with 7.9% of them unmarried.
| Age Bracket | Married | Unmarried |
| 15 to 19 years | 0 (0.0%) | 0 (0.0%) |
| 20 to 34 years | 35 (92.1%) | 3 (7.9%) |
| 35 to 50 years | 0 (0.0%) | 0 (0.0%) |
| Total | 35 (92.1%) | 3 (7.9%) |
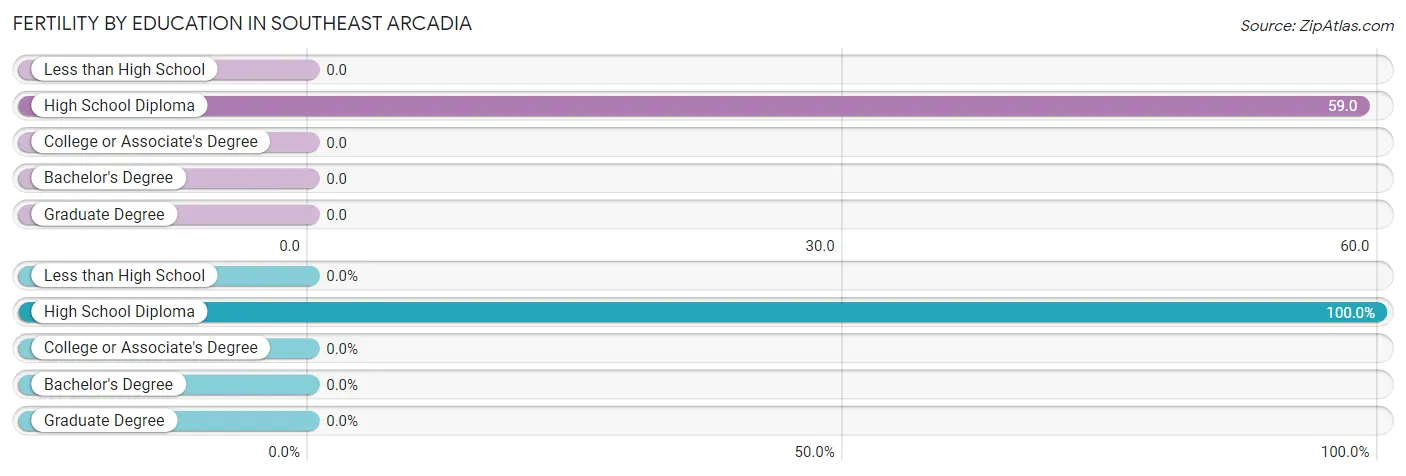
Fertility by Education in Southeast Arcadia
| Educational Attainment | Women with Births | Births / 1,000 Women |
| Less than High School | 0 (0.0%) | 0.0 |
| High School Diploma | 38 (100.0%) | 59.0 |
| College or Associate's Degree | 0 (0.0%) | 0.0 |
| Bachelor's Degree | 0 (0.0%) | 0.0 |
| Graduate Degree | 0 (0.0%) | 0.0 |
| Total | 38 (100.0%) | 26.0 |
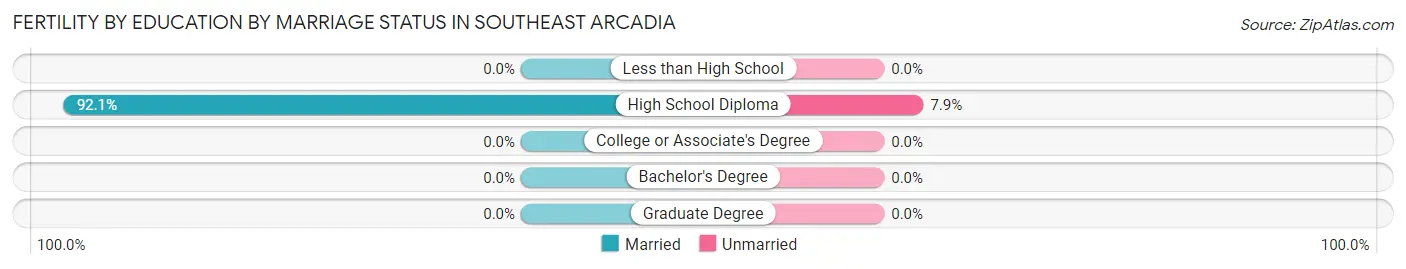
Fertility by Education by Marriage Status in Southeast Arcadia
7.9% of women with births in Southeast Arcadia are unmarried. Women with the educational attainment of high school diploma are most likely to be married with 92.1% of them married at childbirth, while women with the educational attainment of high school diploma are least likely to be married with 7.9% of them unmarried at childbirth.
| Educational Attainment | Married | Unmarried |
| Less than High School | 0 (0.0%) | 0 (0.0%) |
| High School Diploma | 35 (92.1%) | 3 (7.9%) |
| College or Associate's Degree | 0 (0.0%) | 0 (0.0%) |
| Bachelor's Degree | 0 (0.0%) | 0 (0.0%) |
| Graduate Degree | 0 (0.0%) | 0 (0.0%) |
| Total | 35 (92.1%) | 3 (7.9%) |
Income in Southeast Arcadia
Income Overview in Southeast Arcadia
Per Capita Income in Southeast Arcadia is $18,236, while median incomes of families and households are $53,417 and $44,659 respectively.
| Characteristic | Number | Measure |
| Per Capita Income | 7,675 | $18,236 |
| Median Family Income | 2,010 | $53,417 |
| Mean Family Income | 2,010 | $57,466 |
| Median Household Income | 2,626 | $44,659 |
| Mean Household Income | 2,626 | $54,118 |
| Income Deficit | 2,010 | $0 |
| Wage / Income Gap (%) | 7,675 | 17.43% |
| Wage / Income Gap ($) | 7,675 | 82.57¢ per $1 |
| Gini / Inequality Index | 7,675 | 0.37 |
Earnings by Sex in Southeast Arcadia
Average Earnings in Southeast Arcadia are $28,703, $30,452 for men and $25,143 for women, a difference of 17.4%.
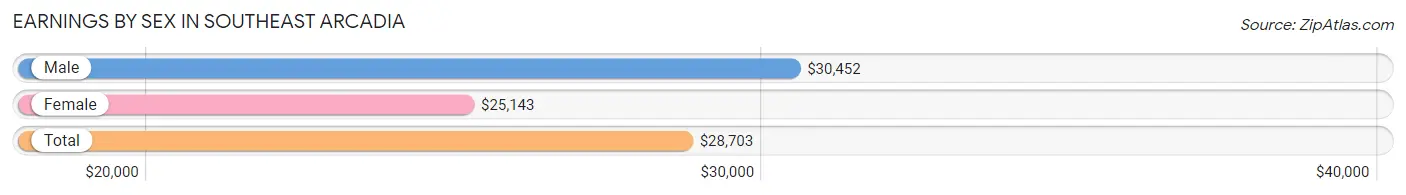
| Sex | Number | Average Earnings |
| Male | 2,269 (65.4%) | $30,452 |
| Female | 1,202 (34.6%) | $25,143 |
| Total | 3,471 (100.0%) | $28,703 |
Earnings by Sex by Income Bracket in Southeast Arcadia
The most common earnings brackets in Southeast Arcadia are $30,000 to $34,999 for men (249 | 11.0%) and $25,000 to $29,999 for women (136 | 11.3%).
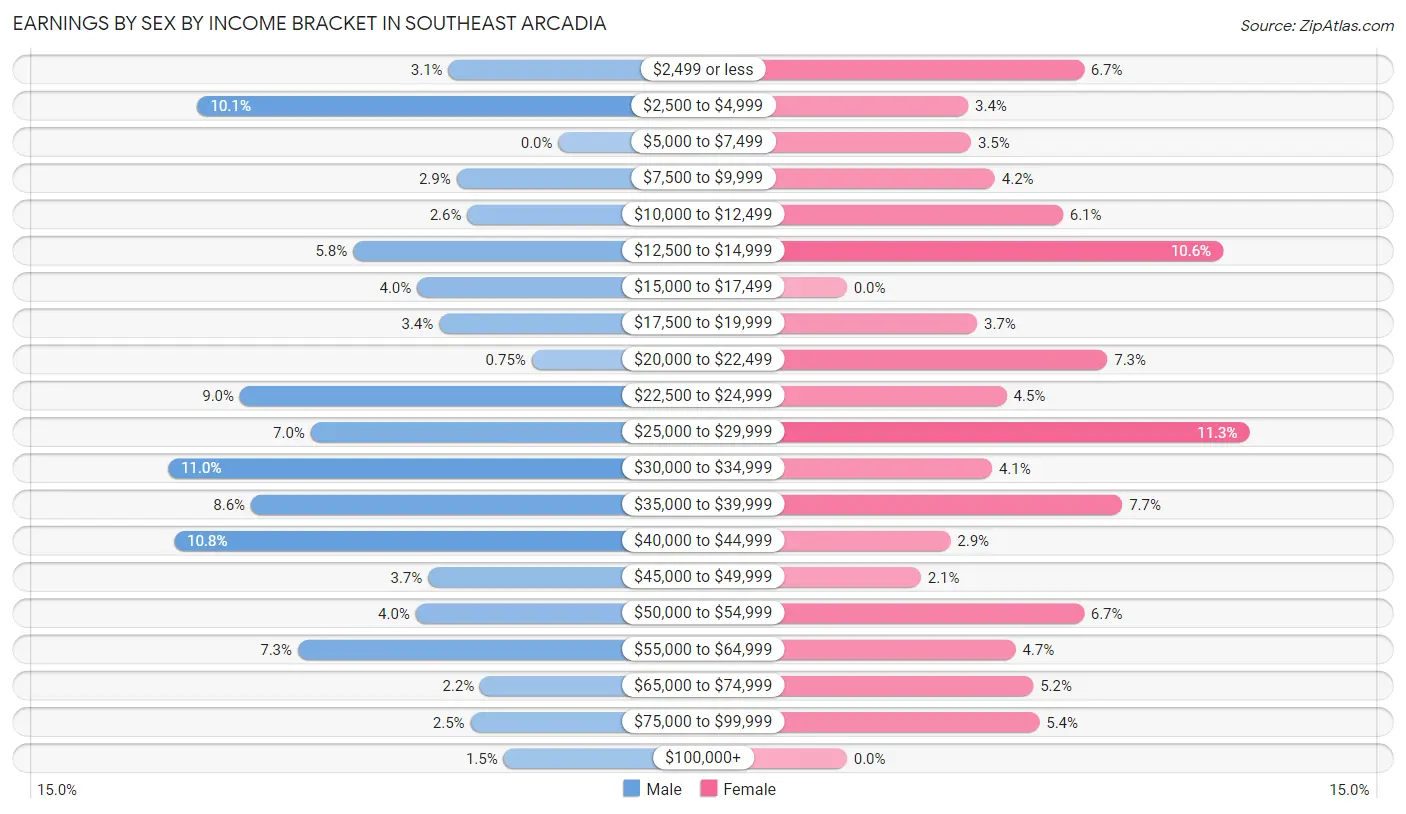
| Income | Male | Female |
| $2,499 or less | 70 (3.1%) | 80 (6.7%) |
| $2,500 to $4,999 | 230 (10.1%) | 41 (3.4%) |
| $5,000 to $7,499 | 0 (0.0%) | 42 (3.5%) |
| $7,500 to $9,999 | 65 (2.9%) | 50 (4.2%) |
| $10,000 to $12,499 | 58 (2.6%) | 73 (6.1%) |
| $12,500 to $14,999 | 131 (5.8%) | 127 (10.6%) |
| $15,000 to $17,499 | 90 (4.0%) | 0 (0.0%) |
| $17,500 to $19,999 | 76 (3.4%) | 44 (3.7%) |
| $20,000 to $22,499 | 17 (0.7%) | 88 (7.3%) |
| $22,500 to $24,999 | 203 (8.9%) | 54 (4.5%) |
| $25,000 to $29,999 | 158 (7.0%) | 136 (11.3%) |
| $30,000 to $34,999 | 249 (11.0%) | 49 (4.1%) |
| $35,000 to $39,999 | 196 (8.6%) | 93 (7.7%) |
| $40,000 to $44,999 | 245 (10.8%) | 35 (2.9%) |
| $45,000 to $49,999 | 83 (3.7%) | 25 (2.1%) |
| $50,000 to $54,999 | 91 (4.0%) | 80 (6.7%) |
| $55,000 to $64,999 | 166 (7.3%) | 57 (4.7%) |
| $65,000 to $74,999 | 50 (2.2%) | 63 (5.2%) |
| $75,000 to $99,999 | 56 (2.5%) | 65 (5.4%) |
| $100,000+ | 35 (1.5%) | 0 (0.0%) |
| Total | 2,269 (100.0%) | 1,202 (100.0%) |
Earnings by Sex by Educational Attainment in Southeast Arcadia
Average earnings in Southeast Arcadia are $30,606 for men and $25,679 for women, a difference of 16.1%. Men with an educational attainment of bachelor's degree enjoy the highest average annual earnings of $84,107, while those with less than high school education earn the least with $24,212. Women with an educational attainment of bachelor's degree earn the most with the average annual earnings of $53,947, while those with less than high school education have the smallest earnings of $20,993.
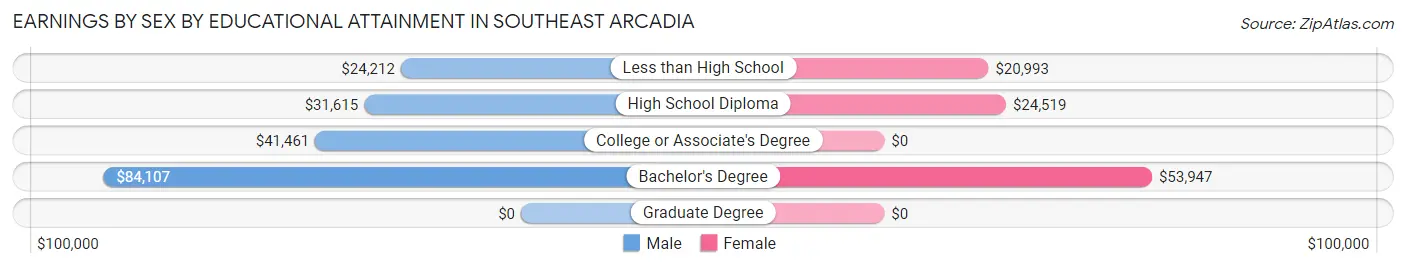
| Educational Attainment | Male Income | Female Income |
| Less than High School | $24,212 | $20,993 |
| High School Diploma | $31,615 | $24,519 |
| College or Associate's Degree | $41,461 | $0 |
| Bachelor's Degree | $84,107 | $53,947 |
| Graduate Degree | - | - |
| Total | $30,606 | $25,679 |
Family Income in Southeast Arcadia
Family Income Brackets in Southeast Arcadia
According to the Southeast Arcadia family income data, there are 482 families falling into the $25,000 to $34,999 income range, which is the most common income bracket and makes up 24.0% of all families.
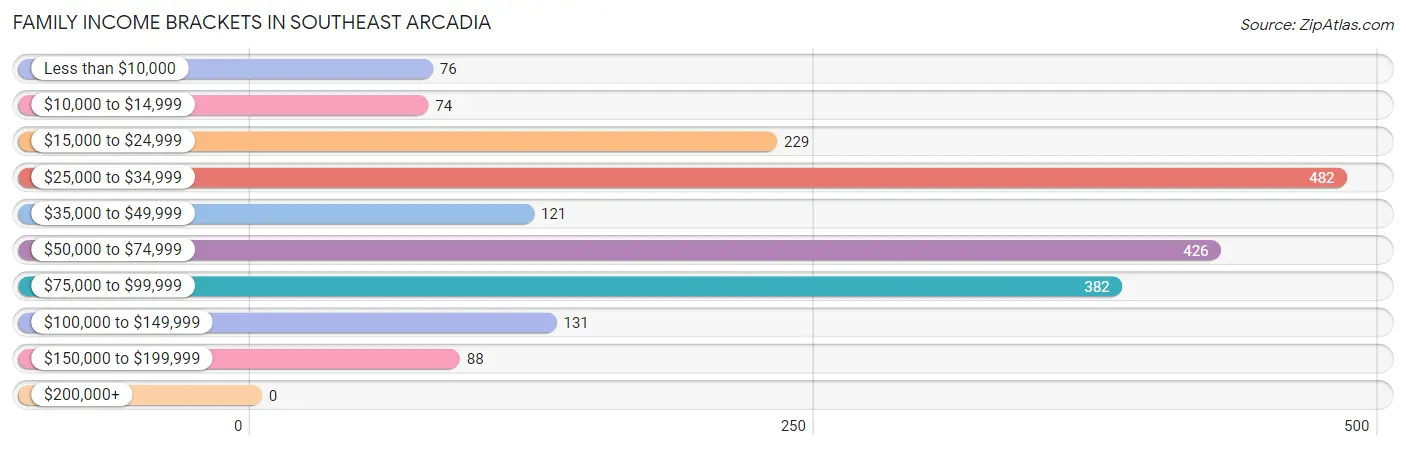
| Income Bracket | # Families | % Families |
| Less than $10,000 | 76 | 3.8% |
| $10,000 to $14,999 | 74 | 3.7% |
| $15,000 to $24,999 | 229 | 11.4% |
| $25,000 to $34,999 | 482 | 24.0% |
| $35,000 to $49,999 | 121 | 6.0% |
| $50,000 to $74,999 | 426 | 21.2% |
| $75,000 to $99,999 | 382 | 19.0% |
| $100,000 to $149,999 | 131 | 6.5% |
| $150,000 to $199,999 | 88 | 4.4% |
| $200,000+ | 0 | 0.0% |
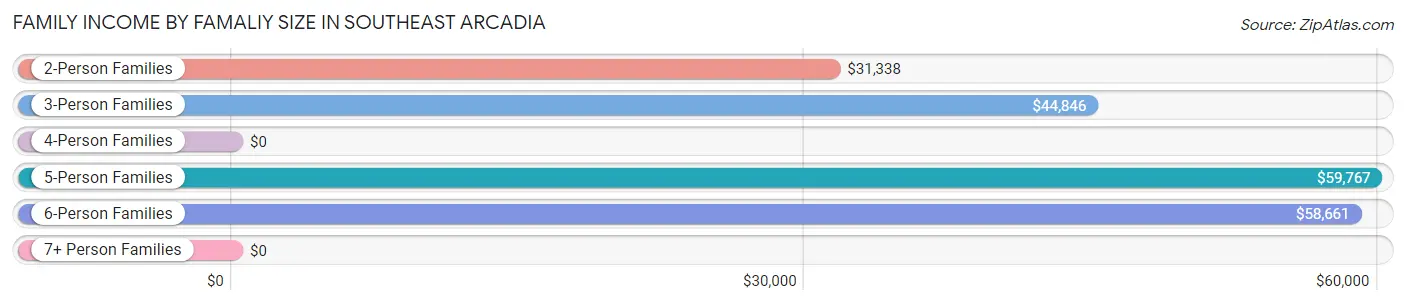
Family Income by Famaliy Size in Southeast Arcadia
5-person families (301 | 15.0%) account for the highest median family income in Southeast Arcadia with $59,767 per family, while 2-person families (856 | 42.6%) have the highest median income of $15,669 per family member.
| Income Bracket | # Families | Median Income |
| 2-Person Families | 856 (42.6%) | $31,338 |
| 3-Person Families | 299 (14.9%) | $44,846 |
| 4-Person Families | 236 (11.7%) | $0 |
| 5-Person Families | 301 (15.0%) | $59,767 |
| 6-Person Families | 290 (14.4%) | $58,661 |
| 7+ Person Families | 28 (1.4%) | $0 |
| Total | 2,010 (100.0%) | $53,417 |
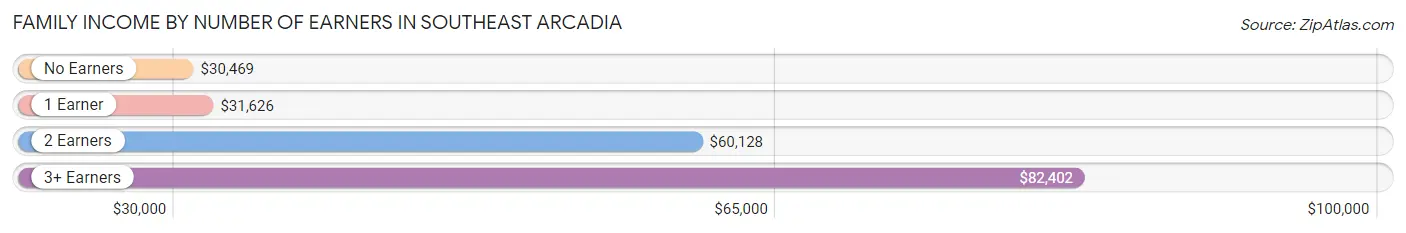
Family Income by Number of Earners in Southeast Arcadia
The median family income in Southeast Arcadia is $53,417, with families comprising 3+ earners (291) having the highest median family income of $82,402, while families with no earners (351) have the lowest median family income of $30,469, accounting for 14.5% and 17.5% of families, respectively.
| Number of Earners | # Families | Median Income |
| No Earners | 351 (17.5%) | $30,469 |
| 1 Earner | 782 (38.9%) | $31,626 |
| 2 Earners | 586 (29.1%) | $60,128 |
| 3+ Earners | 291 (14.5%) | $82,402 |
| Total | 2,010 (100.0%) | $53,417 |
Household Income in Southeast Arcadia
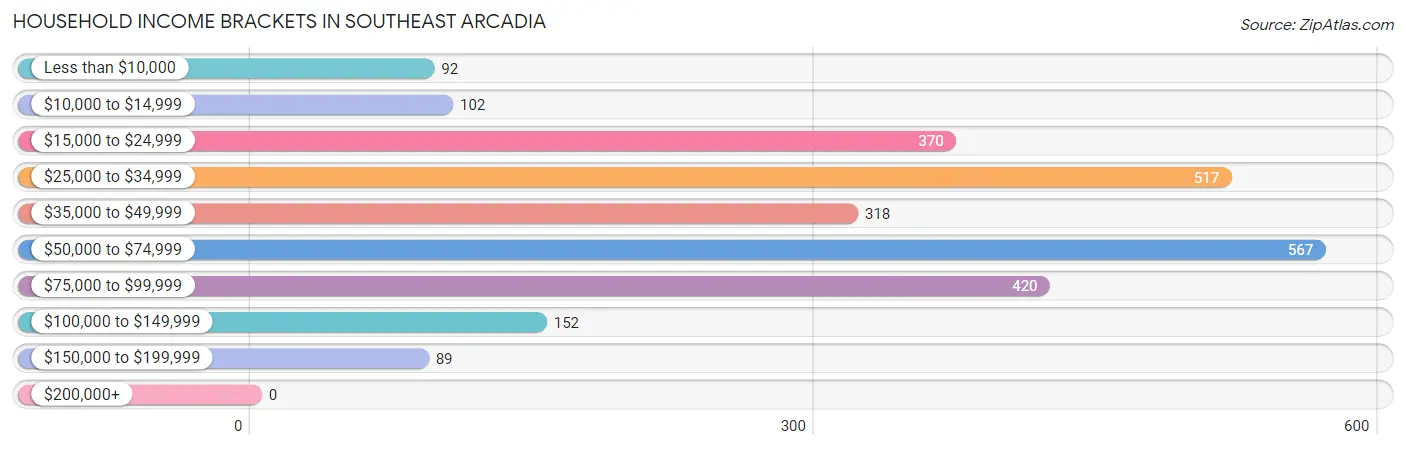
Household Income Brackets in Southeast Arcadia
With 567 households falling in the category, the $50,000 to $74,999 income range is the most frequent in Southeast Arcadia, accounting for 21.6% of all households.
| Income Bracket | # Households | % Households |
| Less than $10,000 | 92 | 3.5% |
| $10,000 to $14,999 | 102 | 3.9% |
| $15,000 to $24,999 | 370 | 14.1% |
| $25,000 to $34,999 | 517 | 19.7% |
| $35,000 to $49,999 | 318 | 12.1% |
| $50,000 to $74,999 | 567 | 21.6% |
| $75,000 to $99,999 | 420 | 16.0% |
| $100,000 to $149,999 | 152 | 5.8% |
| $150,000 to $199,999 | 89 | 3.4% |
| $200,000+ | 0 | 0.0% |
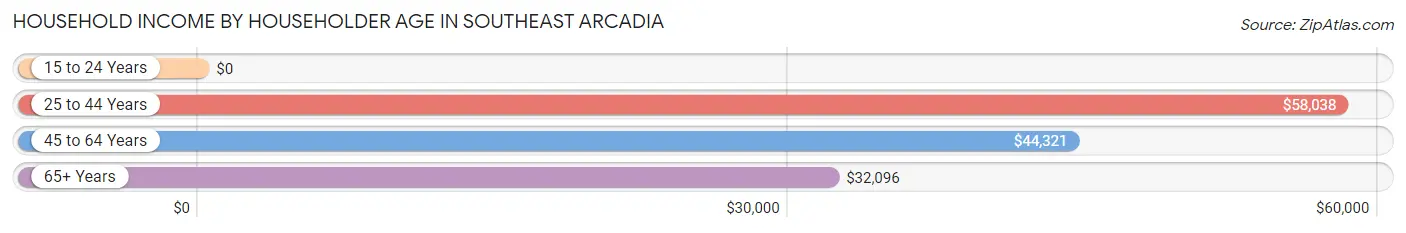
Household Income by Householder Age in Southeast Arcadia
The median household income in Southeast Arcadia is $44,659, with the highest median household income of $58,038 found in the 25 to 44 years age bracket for the primary householder. A total of 1,141 households (43.4%) fall into this category. Meanwhile, the 15 to 24 years age bracket for the primary householder has the lowest median household income of $0, with 91 households (3.5%) in this group.
| Income Bracket | # Households | Median Income |
| 15 to 24 Years | 91 (3.5%) | $0 |
| 25 to 44 Years | 1,141 (43.4%) | $58,038 |
| 45 to 64 Years | 851 (32.4%) | $44,321 |
| 65+ Years | 543 (20.7%) | $32,096 |
| Total | 2,626 (100.0%) | $44,659 |
Poverty in Southeast Arcadia
Income Below Poverty by Sex and Age in Southeast Arcadia
With 16.7% poverty level for males and 34.6% for females among the residents of Southeast Arcadia, 5 year old males and under 5 year old females are the most vulnerable to poverty, with 22 males (57.9%) and 351 females (68.4%) in their respective age groups living below the poverty level.
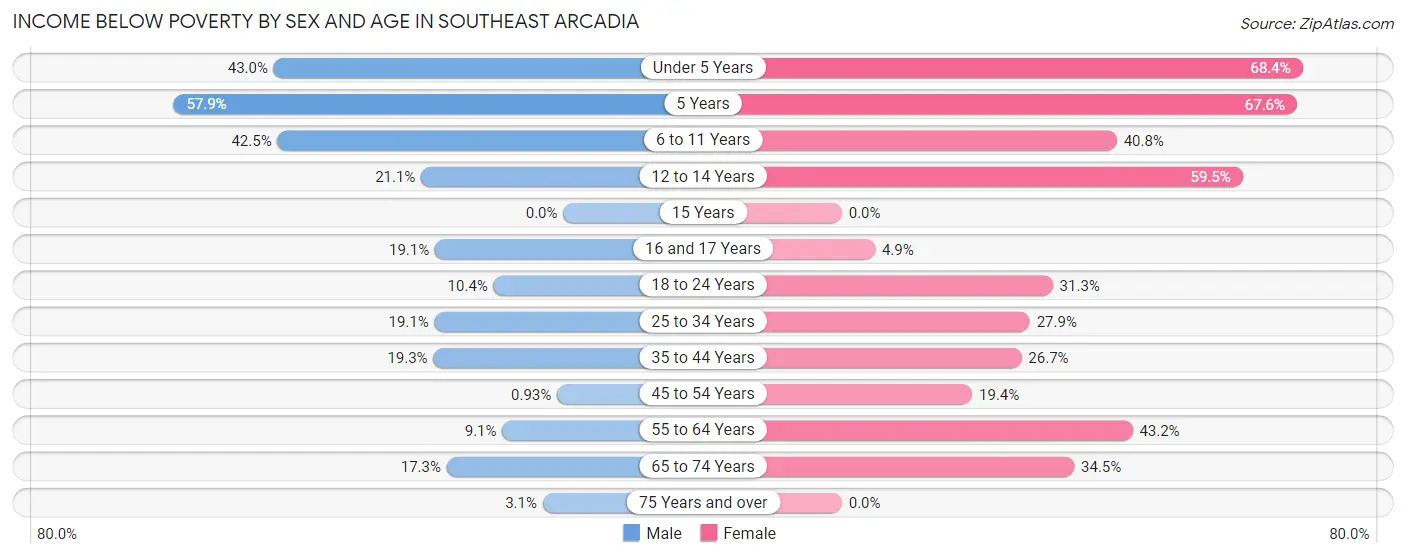
| Age Bracket | Male | Female |
| Under 5 Years | 86 (43.0%) | 351 (68.4%) |
| 5 Years | 22 (57.9%) | 25 (67.6%) |
| 6 to 11 Years | 90 (42.4%) | 109 (40.8%) |
| 12 to 14 Years | 19 (21.1%) | 147 (59.5%) |
| 15 Years | 0 (0.0%) | 0 (0.0%) |
| 16 and 17 Years | 24 (19.1%) | 6 (4.9%) |
| 18 to 24 Years | 44 (10.3%) | 67 (31.3%) |
| 25 to 34 Years | 180 (19.1%) | 144 (27.9%) |
| 35 to 44 Years | 103 (19.3%) | 96 (26.7%) |
| 45 to 54 Years | 5 (0.9%) | 90 (19.4%) |
| 55 to 64 Years | 29 (9.1%) | 205 (43.2%) |
| 65 to 74 Years | 49 (17.3%) | 59 (34.5%) |
| 75 Years and over | 4 (3.0%) | 0 (0.0%) |
| Total | 655 (16.7%) | 1,299 (34.6%) |
Income Above Poverty by Sex and Age in Southeast Arcadia
According to the poverty statistics in Southeast Arcadia, males aged 15 years and females aged 15 years are the age groups that are most secure financially, with 100.0% of males and 100.0% of females in these age groups living above the poverty line.
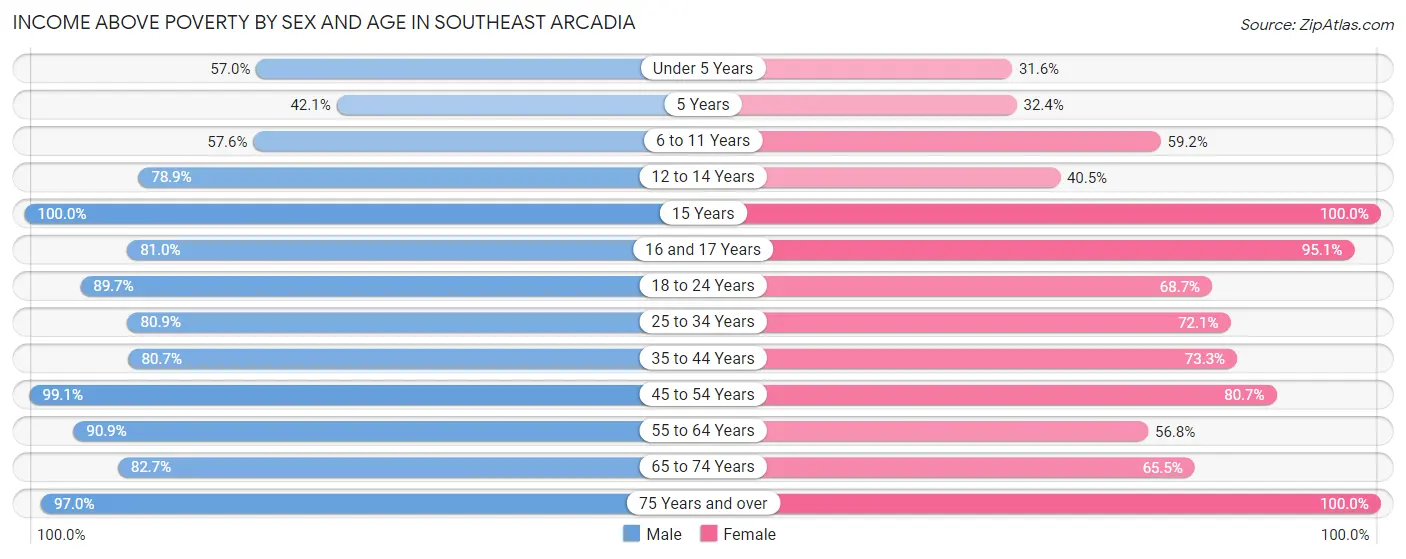
| Age Bracket | Male | Female |
| Under 5 Years | 114 (57.0%) | 162 (31.6%) |
| 5 Years | 16 (42.1%) | 12 (32.4%) |
| 6 to 11 Years | 122 (57.6%) | 158 (59.2%) |
| 12 to 14 Years | 71 (78.9%) | 100 (40.5%) |
| 15 Years | 81 (100.0%) | 22 (100.0%) |
| 16 and 17 Years | 102 (80.9%) | 116 (95.1%) |
| 18 to 24 Years | 381 (89.6%) | 147 (68.7%) |
| 25 to 34 Years | 761 (80.9%) | 372 (72.1%) |
| 35 to 44 Years | 431 (80.7%) | 264 (73.3%) |
| 45 to 54 Years | 530 (99.1%) | 375 (80.6%) |
| 55 to 64 Years | 291 (90.9%) | 270 (56.8%) |
| 65 to 74 Years | 234 (82.7%) | 112 (65.5%) |
| 75 Years and over | 127 (97.0%) | 342 (100.0%) |
| Total | 3,261 (83.3%) | 2,452 (65.4%) |
Income Below Poverty Among Married-Couple Families in Southeast Arcadia
The poverty statistics for married-couple families in Southeast Arcadia show that 16.7% or 204 of the total 1,225 families live below the poverty line. Families with 3 or 4 children have the highest poverty rate of 25.9%, comprising of 83 families. On the other hand, families with no children have the lowest poverty rate of 7.4%, which includes 44 families.
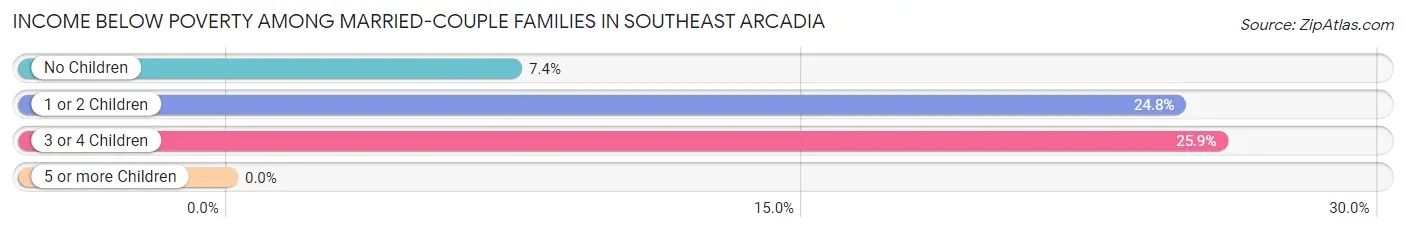
| Children | Above Poverty | Below Poverty |
| No Children | 549 (92.6%) | 44 (7.4%) |
| 1 or 2 Children | 234 (75.2%) | 77 (24.8%) |
| 3 or 4 Children | 238 (74.1%) | 83 (25.9%) |
| 5 or more Children | 0 (0.0%) | 0 (0.0%) |
| Total | 1,021 (83.4%) | 204 (16.7%) |
Income Below Poverty Among Single-Parent Households in Southeast Arcadia
According to the poverty data in Southeast Arcadia, 7.8% or 21 single-father households and 47.0% or 243 single-mother households are living below the poverty line. Among single-father households, those with 1 or 2 children have the highest poverty rate, with 11 households (16.7%) experiencing poverty. Likewise, among single-mother households, those with 5 or more children have the highest poverty rate, with 25 households (100.0%) falling below the poverty line.
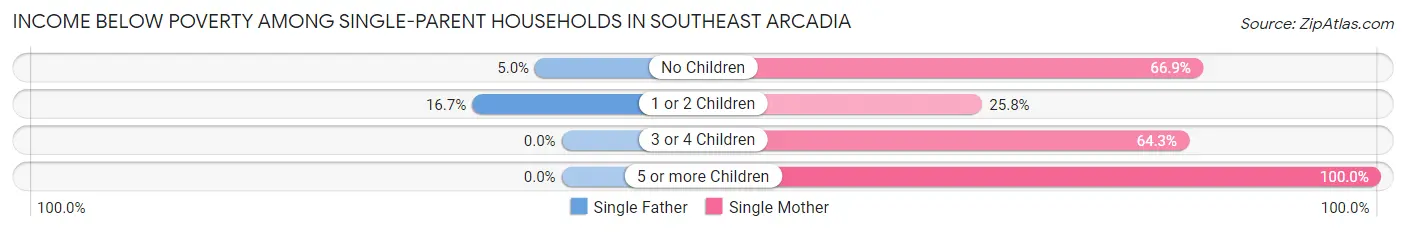
| Children | Single Father | Single Mother |
| No Children | 10 (5.0%) | 113 (66.9%) |
| 1 or 2 Children | 11 (16.7%) | 69 (25.8%) |
| 3 or 4 Children | 0 (0.0%) | 36 (64.3%) |
| 5 or more Children | 0 (0.0%) | 25 (100.0%) |
| Total | 21 (7.8%) | 243 (47.0%) |
Income Below Poverty Among Married-Couple vs Single-Parent Households in Southeast Arcadia
The poverty data for Southeast Arcadia shows that 204 of the married-couple family households (16.7%) and 264 of the single-parent households (33.6%) are living below the poverty level. Within the married-couple family households, those with 3 or 4 children have the highest poverty rate, with 83 households (25.9%) falling below the poverty line. Among the single-parent households, those with 5 or more children have the highest poverty rate, with 25 household (100.0%) living below poverty.
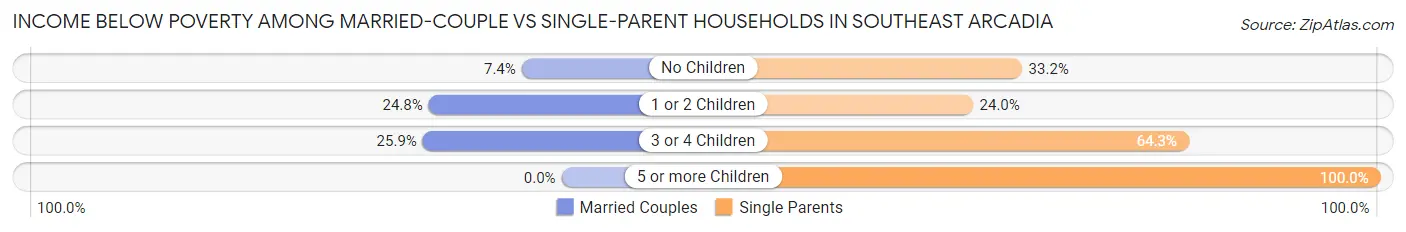
| Children | Married-Couple Families | Single-Parent Households |
| No Children | 44 (7.4%) | 123 (33.2%) |
| 1 or 2 Children | 77 (24.8%) | 80 (24.0%) |
| 3 or 4 Children | 83 (25.9%) | 36 (64.3%) |
| 5 or more Children | 0 (0.0%) | 25 (100.0%) |
| Total | 204 (16.7%) | 264 (33.6%) |
Employment Characteristics in Southeast Arcadia
Employment by Class of Employer in Southeast Arcadia
Among the 3,031 employed individuals in Southeast Arcadia, private company employees (2,164 | 71.4%), self-employed (not incorporated) (254 | 8.4%), and local government employees (248 | 8.2%) make up the most common classes of employment.
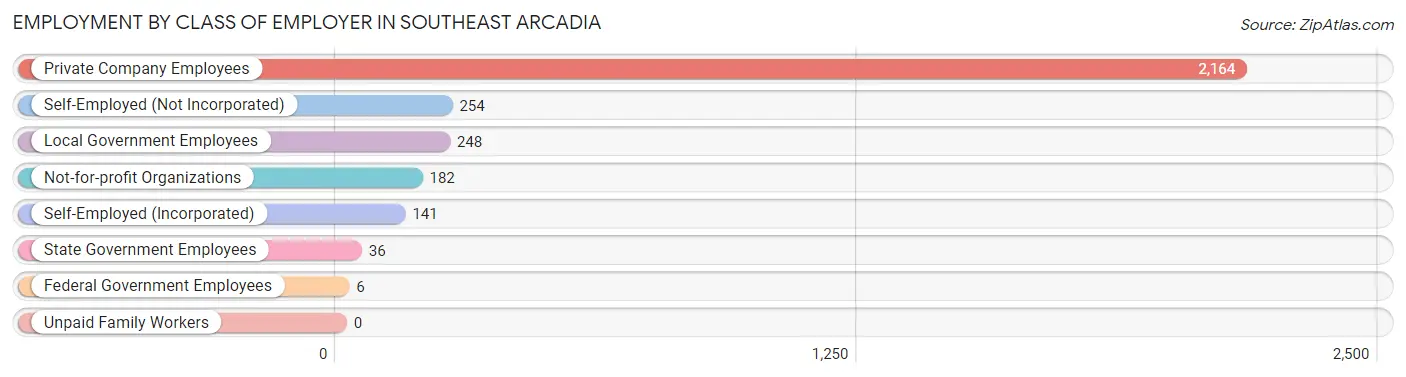
| Employer Class | # Employees | % Employees |
| Private Company Employees | 2,164 | 71.4% |
| Self-Employed (Incorporated) | 141 | 4.6% |
| Self-Employed (Not Incorporated) | 254 | 8.4% |
| Not-for-profit Organizations | 182 | 6.0% |
| Local Government Employees | 248 | 8.2% |
| State Government Employees | 36 | 1.2% |
| Federal Government Employees | 6 | 0.2% |
| Unpaid Family Workers | 0 | 0.0% |
| Total | 3,031 | 100.0% |
Employment Status by Age in Southeast Arcadia
According to the labor force statistics for Southeast Arcadia, out of the total population over 16 years of age (5,960), 60.4% or 3,600 individuals are in the labor force, with 15.0% or 540 of them unemployed. The age group with the highest labor force participation rate is 35 to 44 years, with 90.0% or 805 individuals in the labor force. Within the labor force, the 25 to 29 years age range has the highest percentage of unemployed individuals, with 46.2% or 206 of them being unemployed.
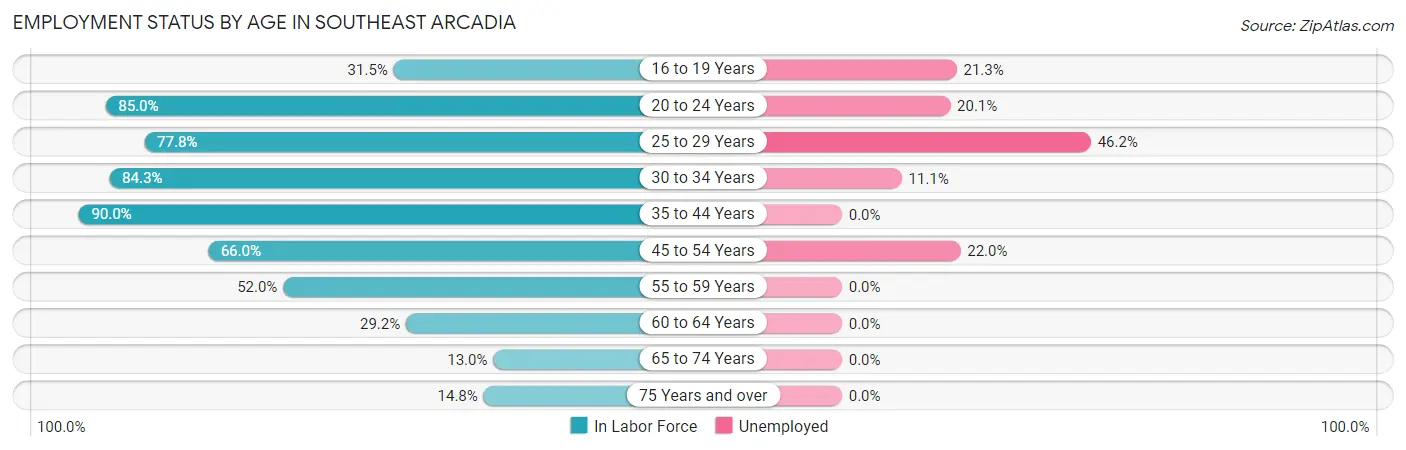
| Age Bracket | In Labor Force | Unemployed |
| 16 to 19 Years | 141 (31.5%) | 30 (21.3%) |
| 20 to 24 Years | 373 (85.0%) | 75 (20.1%) |
| 25 to 29 Years | 446 (77.8%) | 206 (46.2%) |
| 30 to 34 Years | 745 (84.3%) | 83 (11.1%) |
| 35 to 44 Years | 805 (90.0%) | 0 (0.0%) |
| 45 to 54 Years | 660 (66.0%) | 145 (22.0%) |
| 55 to 59 Years | 159 (52.0%) | 0 (0.0%) |
| 60 to 64 Years | 143 (29.2%) | 0 (0.0%) |
| 65 to 74 Years | 59 (13.0%) | 0 (0.0%) |
| 75 Years and over | 70 (14.8%) | 0 (0.0%) |
| Total | 3,600 (60.4%) | 540 (15.0%) |
Employment Status by Educational Attainment in Southeast Arcadia
According to labor force statistics for Southeast Arcadia, 71.3% of individuals (2,956) out of the total population between 25 and 64 years of age (4,146) are in the labor force, with 14.7% or 435 of them being unemployed. The group with the highest labor force participation rate are those with the educational attainment of bachelor's degree or higher, with 75.6% or 102 individuals in the labor force. Within the labor force, individuals with less than high school education have the highest percentage of unemployment, with 28.3% or 369 of them being unemployed.
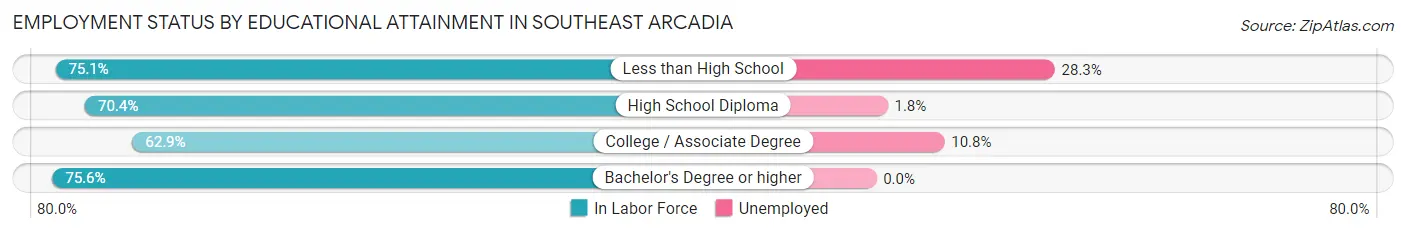
| Educational Attainment | In Labor Force | Unemployed |
| Less than High School | 1,305 (75.1%) | 492 (28.3%) |
| High School Diploma | 1,133 (70.4%) | 29 (1.8%) |
| College / Associate Degree | 417 (62.9%) | 72 (10.8%) |
| Bachelor's Degree or higher | 102 (75.6%) | 0 (0.0%) |
| Total | 2,956 (71.3%) | 609 (14.7%) |
Employment Occupations by Sex in Southeast Arcadia
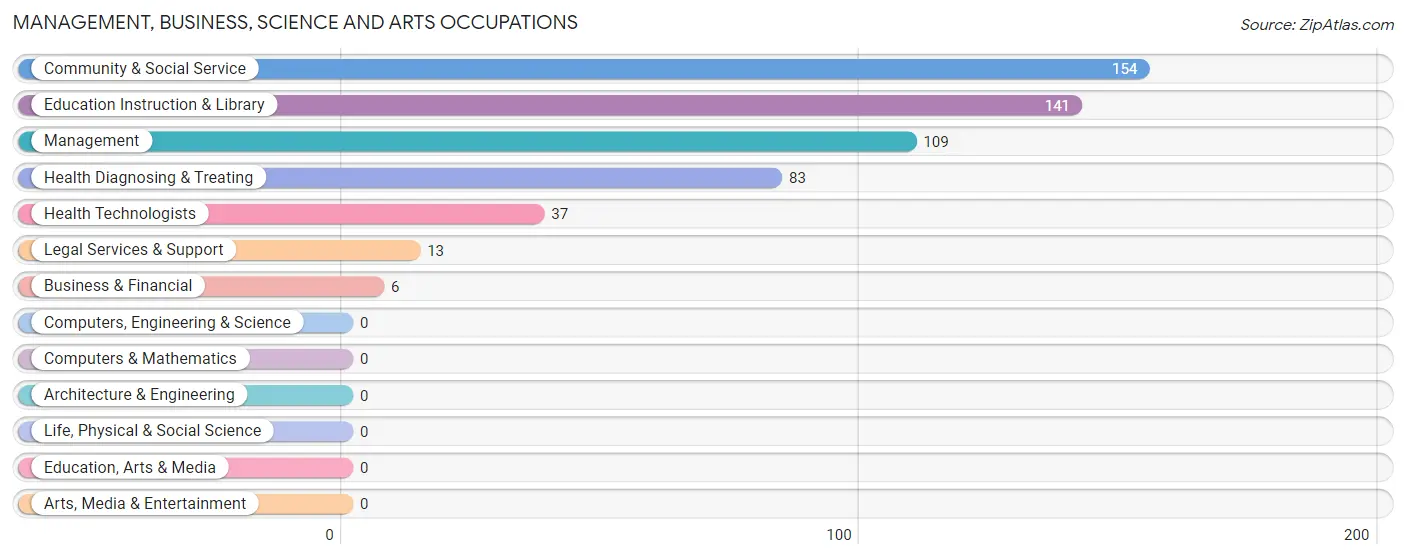
Management, Business, Science and Arts Occupations
The most common Management, Business, Science and Arts occupations in Southeast Arcadia are Community & Social Service (154 | 5.0%), Education Instruction & Library (141 | 4.6%), Management (109 | 3.6%), Health Diagnosing & Treating (83 | 2.7%), and Health Technologists (37 | 1.2%).
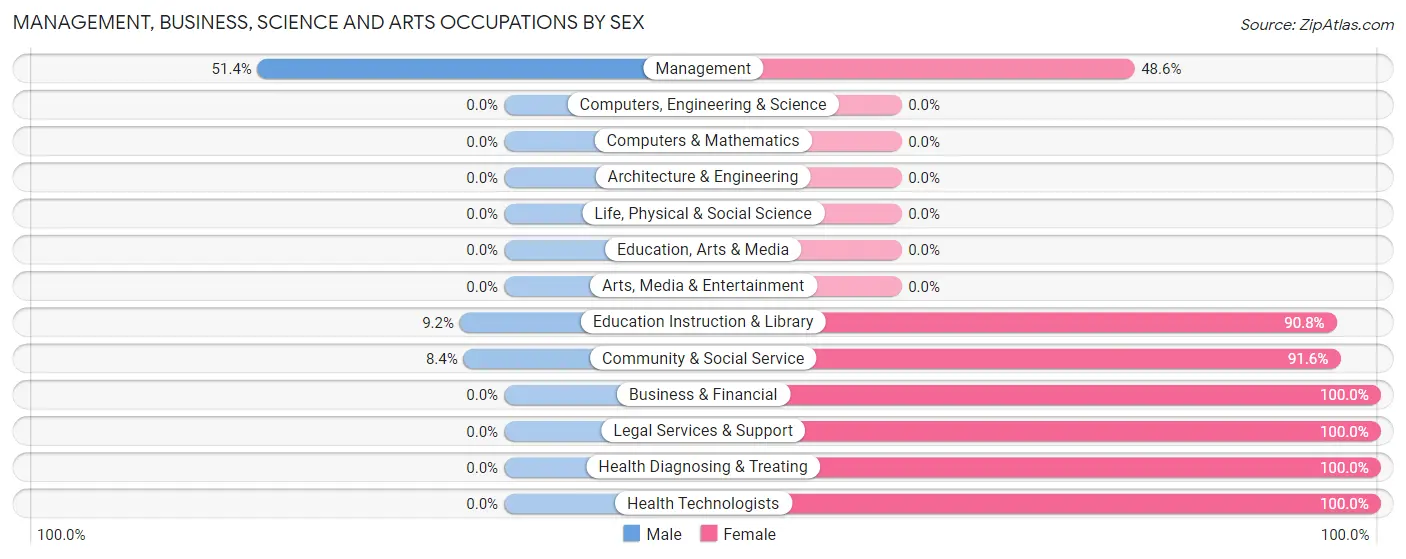
Management, Business, Science and Arts Occupations by Sex
Within the Management, Business, Science and Arts occupations in Southeast Arcadia, the most male-oriented occupations are Management (51.4%), Education Instruction & Library (9.2%), and Community & Social Service (8.4%), while the most female-oriented occupations are Business & Financial (100.0%), Legal Services & Support (100.0%), and Health Diagnosing & Treating (100.0%).
| Occupation | Male | Female |
| Management | 56 (51.4%) | 53 (48.6%) |
| Business & Financial | 0 (0.0%) | 6 (100.0%) |
| Computers, Engineering & Science | 0 (0.0%) | 0 (0.0%) |
| Computers & Mathematics | 0 (0.0%) | 0 (0.0%) |
| Architecture & Engineering | 0 (0.0%) | 0 (0.0%) |
| Life, Physical & Social Science | 0 (0.0%) | 0 (0.0%) |
| Community & Social Service | 13 (8.4%) | 141 (91.6%) |
| Education, Arts & Media | 0 (0.0%) | 0 (0.0%) |
| Legal Services & Support | 0 (0.0%) | 13 (100.0%) |
| Education Instruction & Library | 13 (9.2%) | 128 (90.8%) |
| Arts, Media & Entertainment | 0 (0.0%) | 0 (0.0%) |
| Health Diagnosing & Treating | 0 (0.0%) | 83 (100.0%) |
| Health Technologists | 0 (0.0%) | 37 (100.0%) |
| Total (Category) | 69 (19.6%) | 283 (80.4%) |
| Total (Overall) | 2,021 (66.0%) | 1,041 (34.0%) |
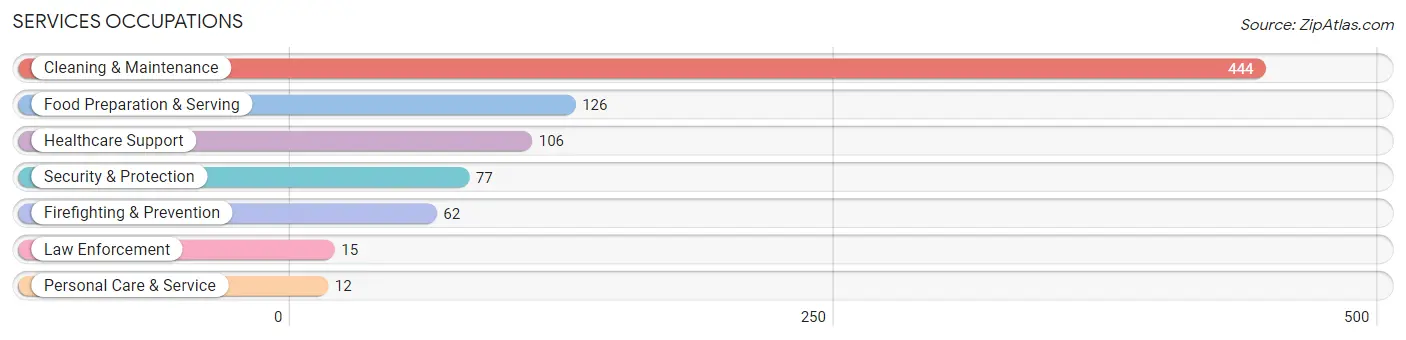
Services Occupations
The most common Services occupations in Southeast Arcadia are Cleaning & Maintenance (444 | 14.5%), Food Preparation & Serving (126 | 4.1%), Healthcare Support (106 | 3.5%), Security & Protection (77 | 2.5%), and Firefighting & Prevention (62 | 2.0%).
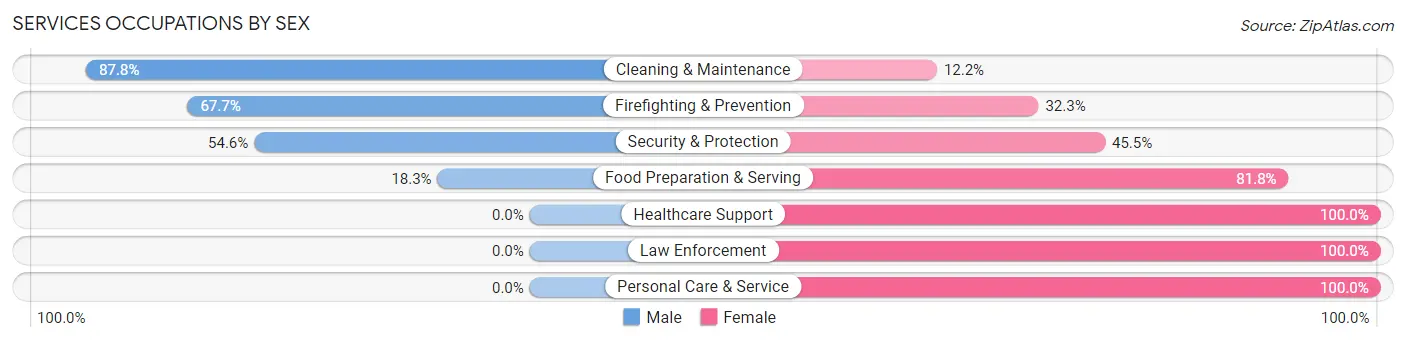
Services Occupations by Sex
Within the Services occupations in Southeast Arcadia, the most male-oriented occupations are Cleaning & Maintenance (87.8%), Firefighting & Prevention (67.7%), and Security & Protection (54.5%), while the most female-oriented occupations are Healthcare Support (100.0%), Law Enforcement (100.0%), and Personal Care & Service (100.0%).
| Occupation | Male | Female |
| Healthcare Support | 0 (0.0%) | 106 (100.0%) |
| Security & Protection | 42 (54.5%) | 35 (45.5%) |
| Firefighting & Prevention | 42 (67.7%) | 20 (32.3%) |
| Law Enforcement | 0 (0.0%) | 15 (100.0%) |
| Food Preparation & Serving | 23 (18.2%) | 103 (81.8%) |
| Cleaning & Maintenance | 390 (87.8%) | 54 (12.2%) |
| Personal Care & Service | 0 (0.0%) | 12 (100.0%) |
| Total (Category) | 455 (59.5%) | 310 (40.5%) |
| Total (Overall) | 2,021 (66.0%) | 1,041 (34.0%) |
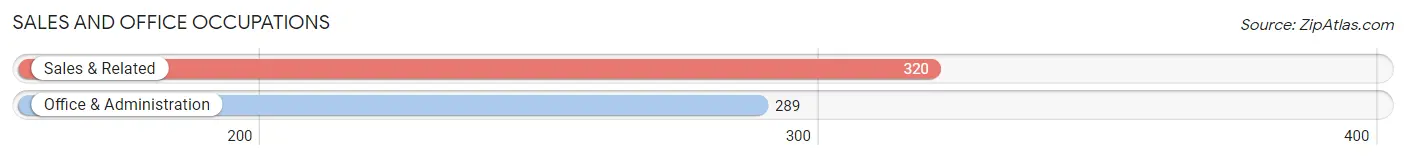
Sales and Office Occupations
The most common Sales and Office occupations in Southeast Arcadia are Sales & Related (320 | 10.4%), and Office & Administration (289 | 9.4%).
Sales and Office Occupations by Sex
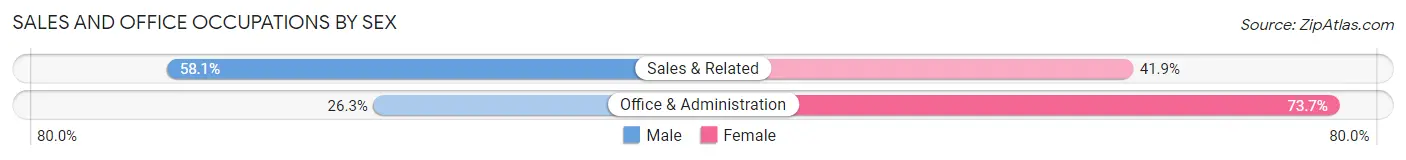
| Occupation | Male | Female |
| Sales & Related | 186 (58.1%) | 134 (41.9%) |
| Office & Administration | 76 (26.3%) | 213 (73.7%) |
| Total (Category) | 262 (43.0%) | 347 (57.0%) |
| Total (Overall) | 2,021 (66.0%) | 1,041 (34.0%) |
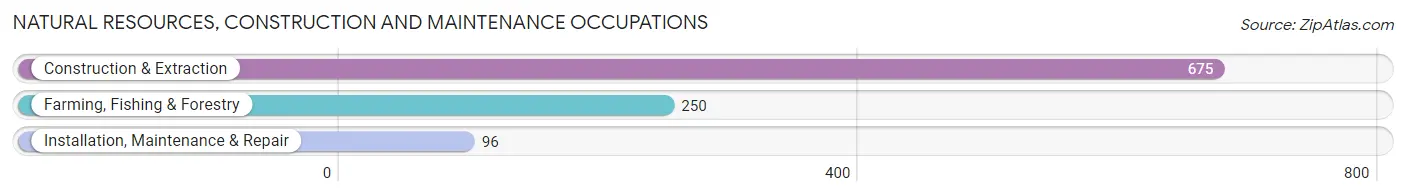
Natural Resources, Construction and Maintenance Occupations
The most common Natural Resources, Construction and Maintenance occupations in Southeast Arcadia are Construction & Extraction (675 | 22.0%), Farming, Fishing & Forestry (250 | 8.2%), and Installation, Maintenance & Repair (96 | 3.1%).
Natural Resources, Construction and Maintenance Occupations by Sex
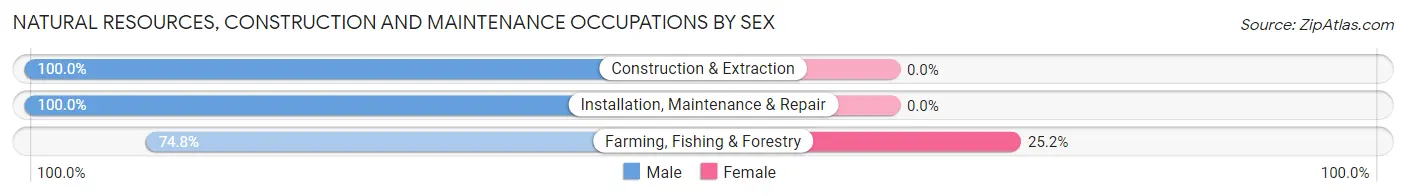
| Occupation | Male | Female |
| Farming, Fishing & Forestry | 187 (74.8%) | 63 (25.2%) |
| Construction & Extraction | 675 (100.0%) | 0 (0.0%) |
| Installation, Maintenance & Repair | 96 (100.0%) | 0 (0.0%) |
| Total (Category) | 958 (93.8%) | 63 (6.2%) |
| Total (Overall) | 2,021 (66.0%) | 1,041 (34.0%) |
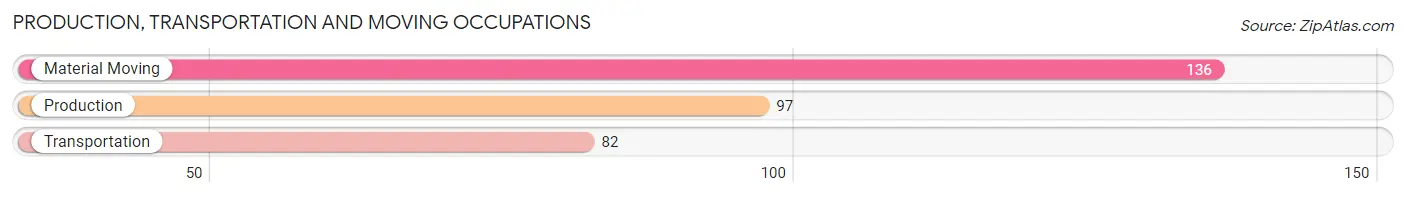
Production, Transportation and Moving Occupations
The most common Production, Transportation and Moving occupations in Southeast Arcadia are Material Moving (136 | 4.4%), Production (97 | 3.2%), and Transportation (82 | 2.7%).
Production, Transportation and Moving Occupations by Sex
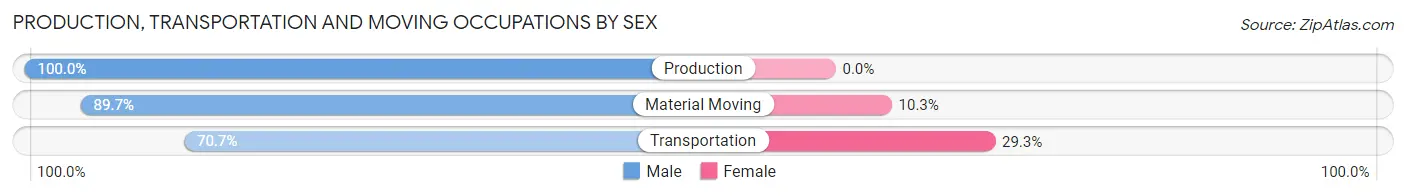
| Occupation | Male | Female |
| Production | 97 (100.0%) | 0 (0.0%) |
| Transportation | 58 (70.7%) | 24 (29.3%) |
| Material Moving | 122 (89.7%) | 14 (10.3%) |
| Total (Category) | 277 (87.9%) | 38 (12.1%) |
| Total (Overall) | 2,021 (66.0%) | 1,041 (34.0%) |
Employment Industries by Sex in Southeast Arcadia
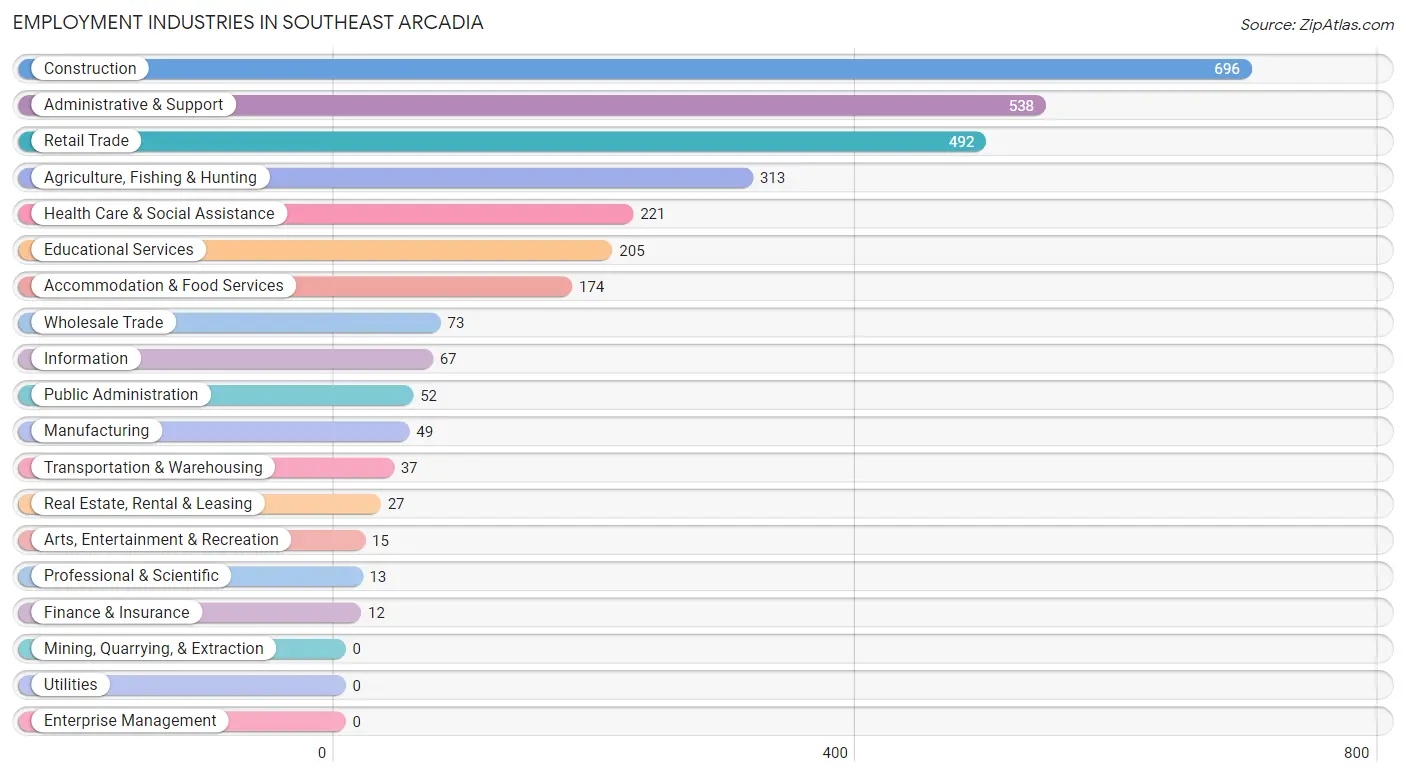
Employment Industries in Southeast Arcadia
The major employment industries in Southeast Arcadia include Construction (696 | 22.7%), Administrative & Support (538 | 17.6%), Retail Trade (492 | 16.1%), Agriculture, Fishing & Hunting (313 | 10.2%), and Health Care & Social Assistance (221 | 7.2%).
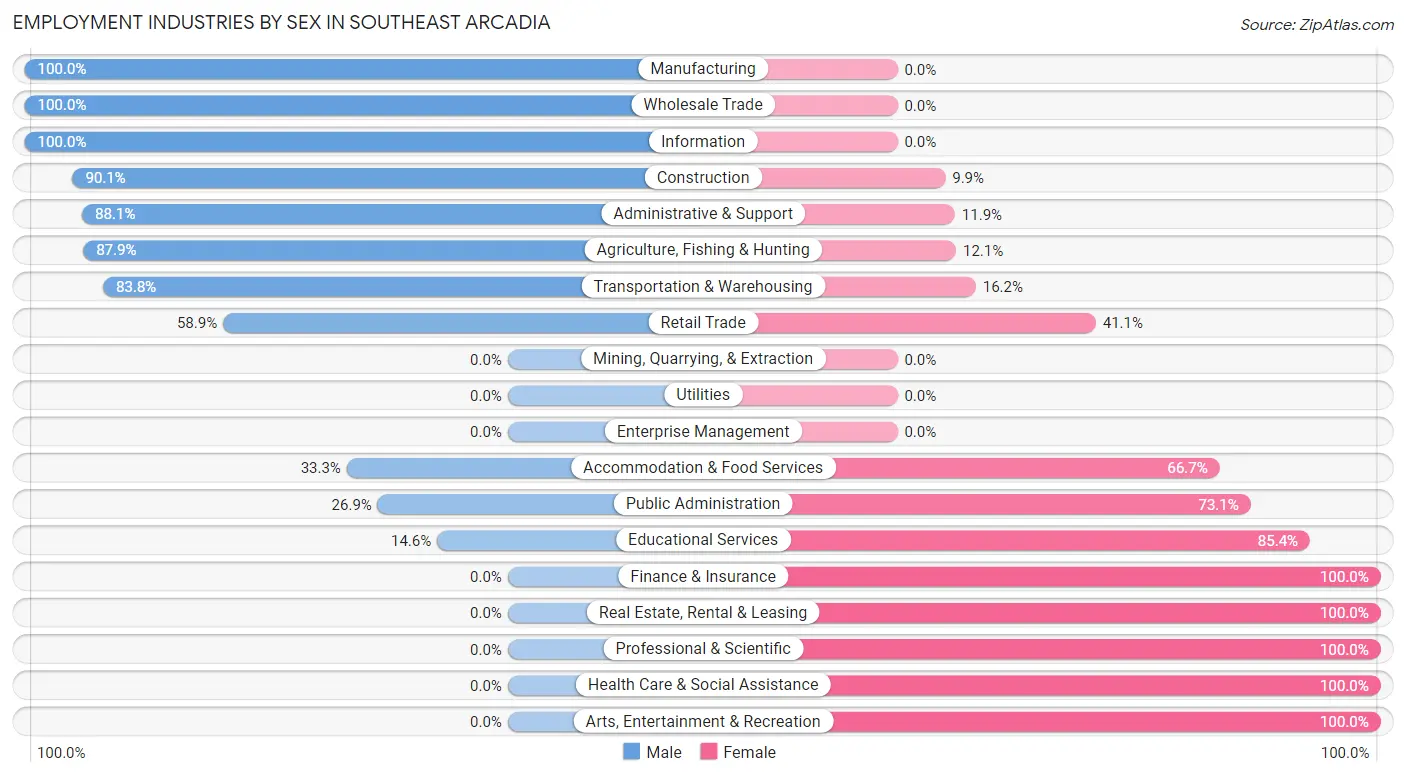
Employment Industries by Sex in Southeast Arcadia
The Southeast Arcadia industries that see more men than women are Manufacturing (100.0%), Wholesale Trade (100.0%), and Information (100.0%), whereas the industries that tend to have a higher number of women are Finance & Insurance (100.0%), Real Estate, Rental & Leasing (100.0%), and Professional & Scientific (100.0%).
| Industry | Male | Female |
| Agriculture, Fishing & Hunting | 275 (87.9%) | 38 (12.1%) |
| Mining, Quarrying, & Extraction | 0 (0.0%) | 0 (0.0%) |
| Construction | 627 (90.1%) | 69 (9.9%) |
| Manufacturing | 49 (100.0%) | 0 (0.0%) |
| Wholesale Trade | 73 (100.0%) | 0 (0.0%) |
| Retail Trade | 290 (58.9%) | 202 (41.1%) |
| Transportation & Warehousing | 31 (83.8%) | 6 (16.2%) |
| Utilities | 0 (0.0%) | 0 (0.0%) |
| Information | 67 (100.0%) | 0 (0.0%) |
| Finance & Insurance | 0 (0.0%) | 12 (100.0%) |
| Real Estate, Rental & Leasing | 0 (0.0%) | 27 (100.0%) |
| Professional & Scientific | 0 (0.0%) | 13 (100.0%) |
| Enterprise Management | 0 (0.0%) | 0 (0.0%) |
| Administrative & Support | 474 (88.1%) | 64 (11.9%) |
| Educational Services | 30 (14.6%) | 175 (85.4%) |
| Health Care & Social Assistance | 0 (0.0%) | 221 (100.0%) |
| Arts, Entertainment & Recreation | 0 (0.0%) | 15 (100.0%) |
| Accommodation & Food Services | 58 (33.3%) | 116 (66.7%) |
| Public Administration | 14 (26.9%) | 38 (73.1%) |
| Total | 2,021 (66.0%) | 1,041 (34.0%) |
Education in Southeast Arcadia
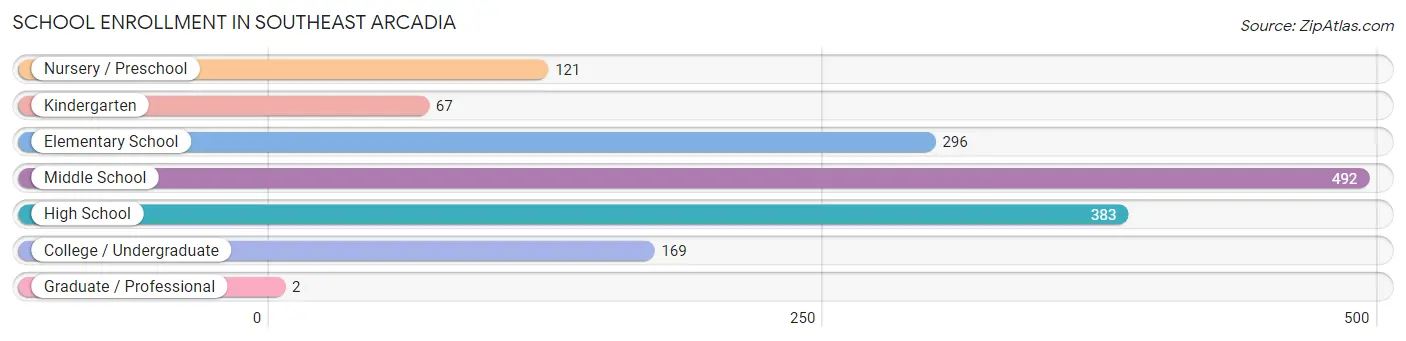
School Enrollment in Southeast Arcadia
The most common levels of schooling among the 1,530 students in Southeast Arcadia are middle school (492 | 32.2%), high school (383 | 25.0%), and elementary school (296 | 19.4%).
| School Level | # Students | % Students |
| Nursery / Preschool | 121 | 7.9% |
| Kindergarten | 67 | 4.4% |
| Elementary School | 296 | 19.4% |
| Middle School | 492 | 32.2% |
| High School | 383 | 25.0% |
| College / Undergraduate | 169 | 11.1% |
| Graduate / Professional | 2 | 0.1% |
| Total | 1,530 | 100.0% |
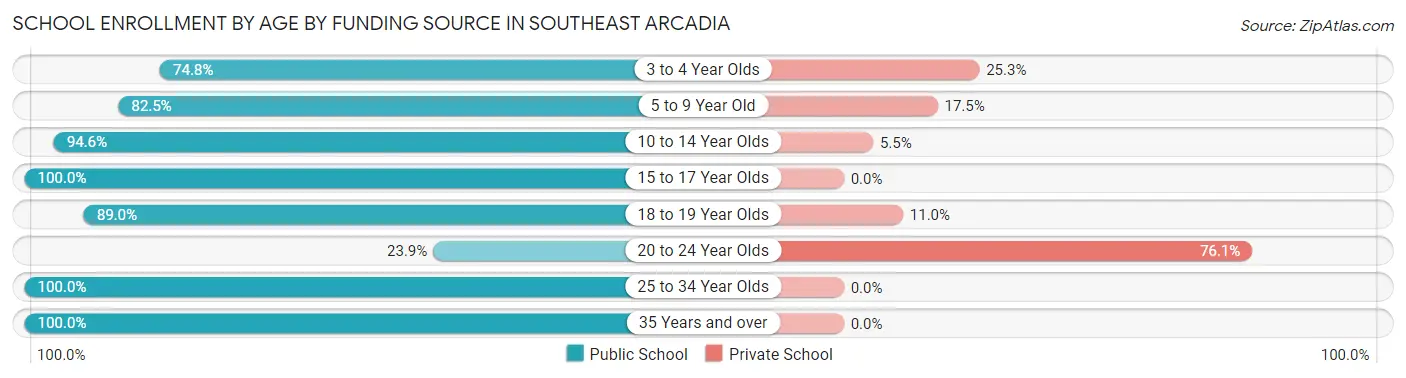
School Enrollment by Age by Funding Source in Southeast Arcadia
Out of a total of 1,530 students who are enrolled in schools in Southeast Arcadia, 223 (14.6%) attend a private institution, while the remaining 1,307 (85.4%) are enrolled in public schools. The age group of 20 to 24 year olds has the highest likelihood of being enrolled in private schools, with 105 (76.1% in the age bracket) enrolled. Conversely, the age group of 15 to 17 year olds has the lowest likelihood of being enrolled in a private school, with 331 (100.0% in the age bracket) attending a public institution.
| Age Bracket | Public School | Private School |
| 3 to 4 Year Olds | 74 (74.8%) | 25 (25.3%) |
| 5 to 9 Year Old | 236 (82.5%) | 50 (17.5%) |
| 10 to 14 Year Olds | 503 (94.6%) | 29 (5.4%) |
| 15 to 17 Year Olds | 331 (100.0%) | 0 (0.0%) |
| 18 to 19 Year Olds | 121 (89.0%) | 15 (11.0%) |
| 20 to 24 Year Olds | 33 (23.9%) | 105 (76.1%) |
| 25 to 34 Year Olds | 6 (100.0%) | 0 (0.0%) |
| 35 Years and over | 2 (100.0%) | 0 (0.0%) |
| Total | 1,307 (85.4%) | 223 (14.6%) |
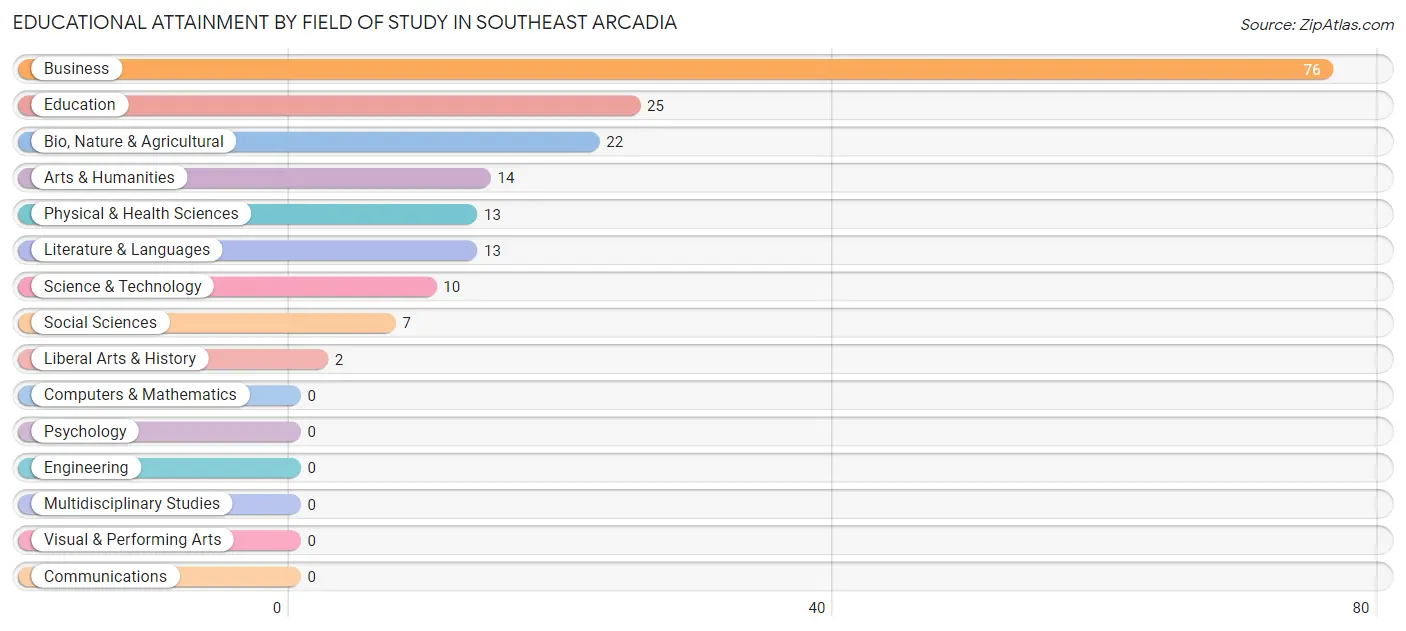
Educational Attainment by Field of Study in Southeast Arcadia
Business (76 | 41.8%), education (25 | 13.7%), bio, nature & agricultural (22 | 12.1%), arts & humanities (14 | 7.7%), and physical & health sciences (13 | 7.1%) are the most common fields of study among 182 individuals in Southeast Arcadia who have obtained a bachelor's degree or higher.
| Field of Study | # Graduates | % Graduates |
| Computers & Mathematics | 0 | 0.0% |
| Bio, Nature & Agricultural | 22 | 12.1% |
| Physical & Health Sciences | 13 | 7.1% |
| Psychology | 0 | 0.0% |
| Social Sciences | 7 | 3.8% |
| Engineering | 0 | 0.0% |
| Multidisciplinary Studies | 0 | 0.0% |
| Science & Technology | 10 | 5.5% |
| Business | 76 | 41.8% |
| Education | 25 | 13.7% |
| Literature & Languages | 13 | 7.1% |
| Liberal Arts & History | 2 | 1.1% |
| Visual & Performing Arts | 0 | 0.0% |
| Communications | 0 | 0.0% |
| Arts & Humanities | 14 | 7.7% |
| Total | 182 | 100.0% |
Transportation & Commute in Southeast Arcadia
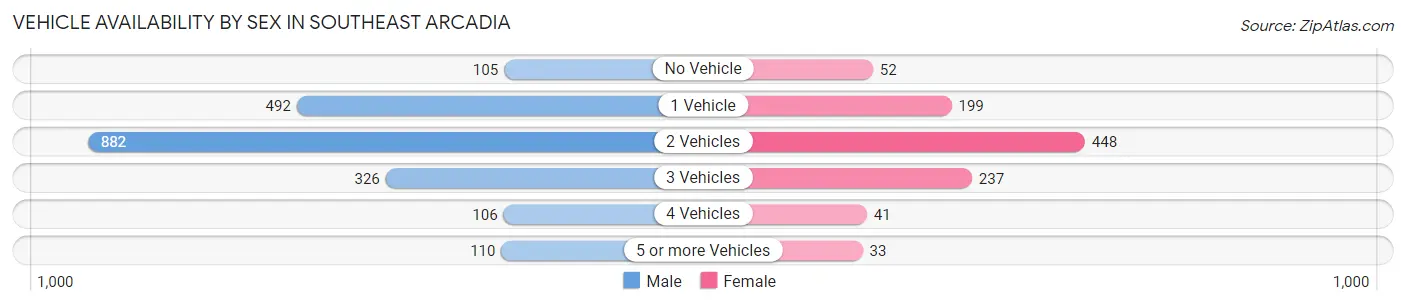
Vehicle Availability by Sex in Southeast Arcadia
The most prevalent vehicle ownership categories in Southeast Arcadia are males with 2 vehicles (882, accounting for 43.6%) and females with 2 vehicles (448, making up 87.3%).
| Vehicles Available | Male | Female |
| No Vehicle | 105 (5.2%) | 52 (5.1%) |
| 1 Vehicle | 492 (24.3%) | 199 (19.7%) |
| 2 Vehicles | 882 (43.6%) | 448 (44.4%) |
| 3 Vehicles | 326 (16.1%) | 237 (23.5%) |
| 4 Vehicles | 106 (5.2%) | 41 (4.1%) |
| 5 or more Vehicles | 110 (5.4%) | 33 (3.3%) |
| Total | 2,021 (100.0%) | 1,010 (100.0%) |
Commute Time in Southeast Arcadia
The most frequently occuring commute durations in Southeast Arcadia are 20 to 24 minutes (726 commuters, 24.1%), 5 to 9 minutes (500 commuters, 16.6%), and 45 to 59 minutes (431 commuters, 14.3%).
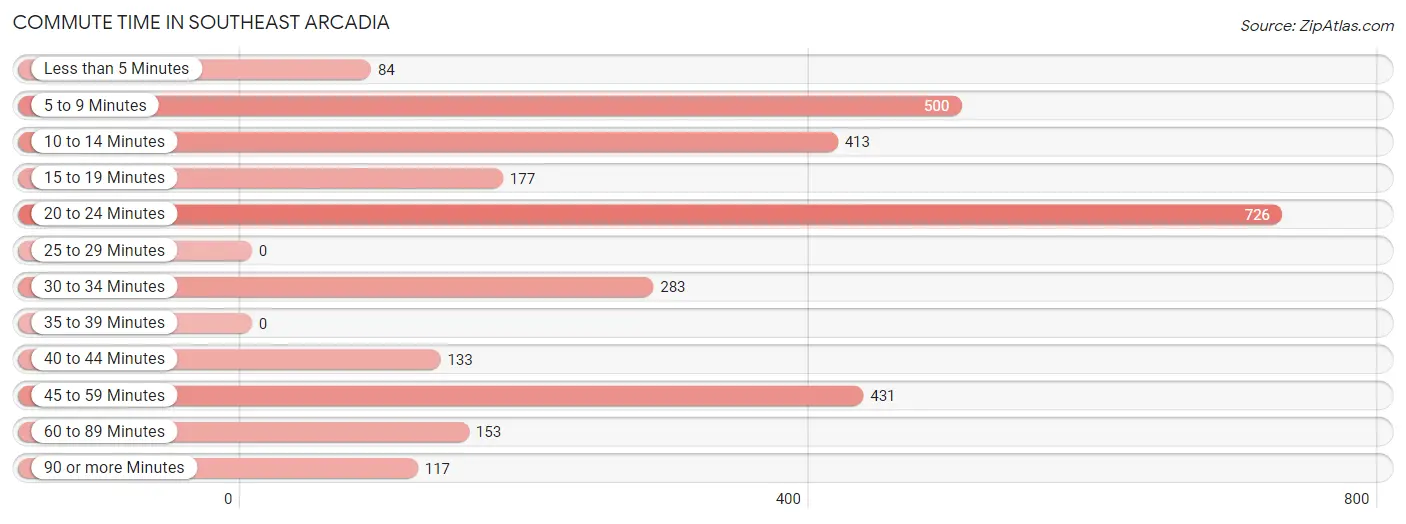
| Commute Time | # Commuters | % Commuters |
| Less than 5 Minutes | 84 | 2.8% |
| 5 to 9 Minutes | 500 | 16.6% |
| 10 to 14 Minutes | 413 | 13.7% |
| 15 to 19 Minutes | 177 | 5.9% |
| 20 to 24 Minutes | 726 | 24.1% |
| 25 to 29 Minutes | 0 | 0.0% |
| 30 to 34 Minutes | 283 | 9.4% |
| 35 to 39 Minutes | 0 | 0.0% |
| 40 to 44 Minutes | 133 | 4.4% |
| 45 to 59 Minutes | 431 | 14.3% |
| 60 to 89 Minutes | 153 | 5.1% |
| 90 or more Minutes | 117 | 3.9% |
Commute Time by Sex in Southeast Arcadia
The most common commute times in Southeast Arcadia are 20 to 24 minutes (623 commuters, 30.8%) for males and 5 to 9 minutes (273 commuters, 27.4%) for females.
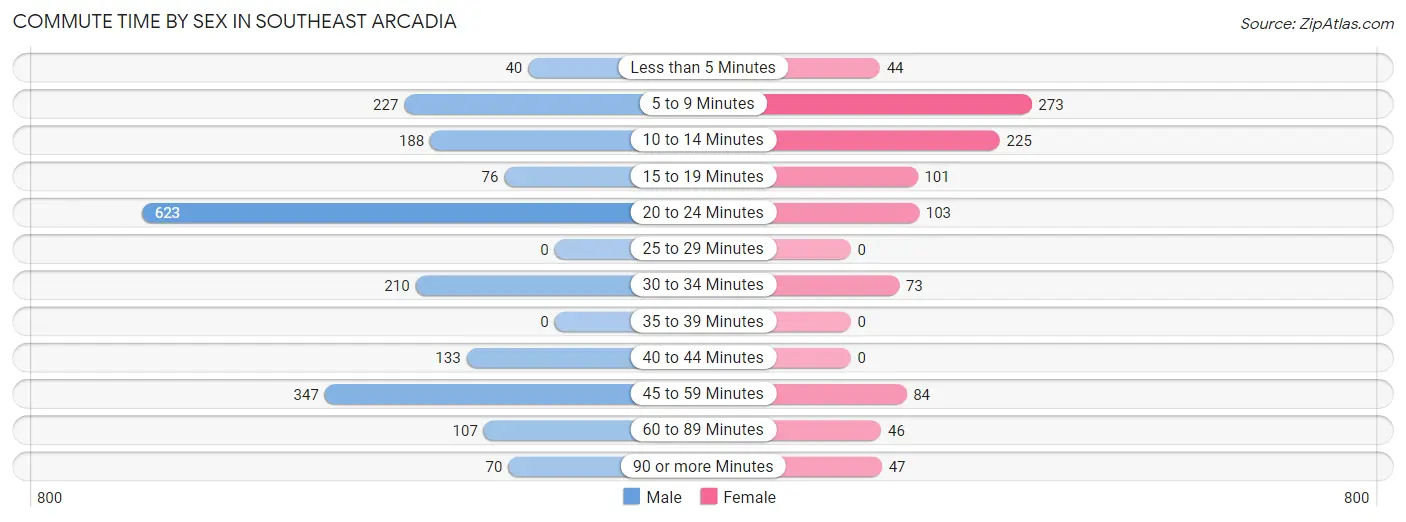
| Commute Time | Male | Female |
| Less than 5 Minutes | 40 (2.0%) | 44 (4.4%) |
| 5 to 9 Minutes | 227 (11.2%) | 273 (27.4%) |
| 10 to 14 Minutes | 188 (9.3%) | 225 (22.6%) |
| 15 to 19 Minutes | 76 (3.8%) | 101 (10.1%) |
| 20 to 24 Minutes | 623 (30.8%) | 103 (10.3%) |
| 25 to 29 Minutes | 0 (0.0%) | 0 (0.0%) |
| 30 to 34 Minutes | 210 (10.4%) | 73 (7.3%) |
| 35 to 39 Minutes | 0 (0.0%) | 0 (0.0%) |
| 40 to 44 Minutes | 133 (6.6%) | 0 (0.0%) |
| 45 to 59 Minutes | 347 (17.2%) | 84 (8.4%) |
| 60 to 89 Minutes | 107 (5.3%) | 46 (4.6%) |
| 90 or more Minutes | 70 (3.5%) | 47 (4.7%) |
Time of Departure to Work by Sex in Southeast Arcadia
The most frequent times of departure to work in Southeast Arcadia are 7:00 AM to 7:29 AM (433, 21.4%) for males and 7:30 AM to 7:59 AM (200, 20.1%) for females.
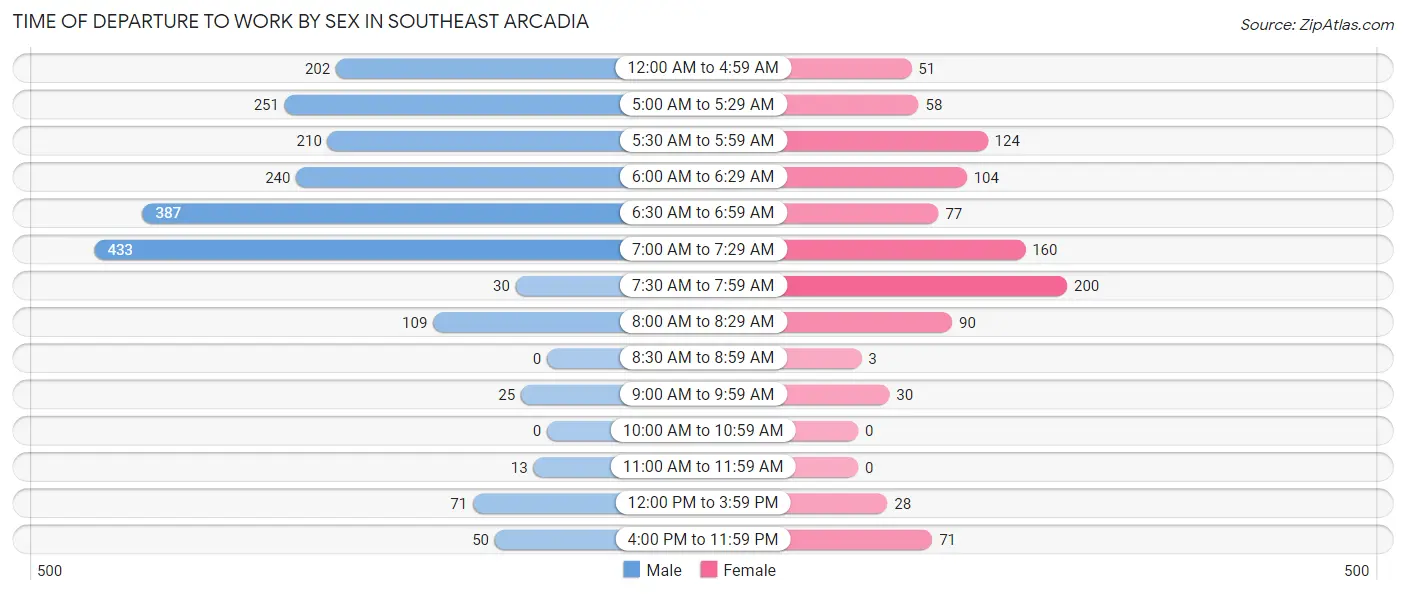
| Time of Departure | Male | Female |
| 12:00 AM to 4:59 AM | 202 (10.0%) | 51 (5.1%) |
| 5:00 AM to 5:29 AM | 251 (12.4%) | 58 (5.8%) |
| 5:30 AM to 5:59 AM | 210 (10.4%) | 124 (12.4%) |
| 6:00 AM to 6:29 AM | 240 (11.9%) | 104 (10.4%) |
| 6:30 AM to 6:59 AM | 387 (19.2%) | 77 (7.7%) |
| 7:00 AM to 7:29 AM | 433 (21.4%) | 160 (16.1%) |
| 7:30 AM to 7:59 AM | 30 (1.5%) | 200 (20.1%) |
| 8:00 AM to 8:29 AM | 109 (5.4%) | 90 (9.0%) |
| 8:30 AM to 8:59 AM | 0 (0.0%) | 3 (0.3%) |
| 9:00 AM to 9:59 AM | 25 (1.2%) | 30 (3.0%) |
| 10:00 AM to 10:59 AM | 0 (0.0%) | 0 (0.0%) |
| 11:00 AM to 11:59 AM | 13 (0.6%) | 0 (0.0%) |
| 12:00 PM to 3:59 PM | 71 (3.5%) | 28 (2.8%) |
| 4:00 PM to 11:59 PM | 50 (2.5%) | 71 (7.1%) |
| Total | 2,021 (100.0%) | 996 (100.0%) |
Housing Occupancy in Southeast Arcadia
Occupancy by Ownership in Southeast Arcadia
Of the total 2,626 dwellings in Southeast Arcadia, owner-occupied units account for 1,636 (62.3%), while renter-occupied units make up 990 (37.7%).
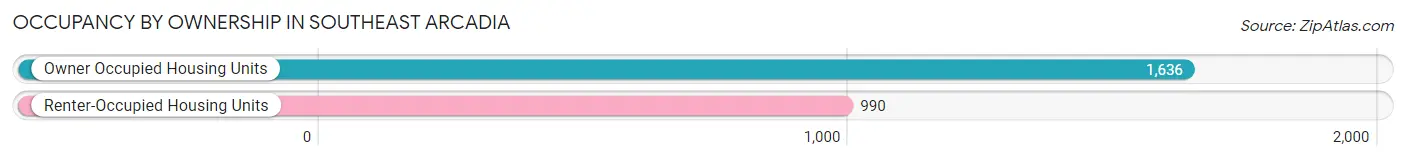
| Occupancy | # Housing Units | % Housing Units |
| Owner Occupied Housing Units | 1,636 | 62.3% |
| Renter-Occupied Housing Units | 990 | 37.7% |
| Total Occupied Housing Units | 2,626 | 100.0% |
Occupancy by Household Size in Southeast Arcadia
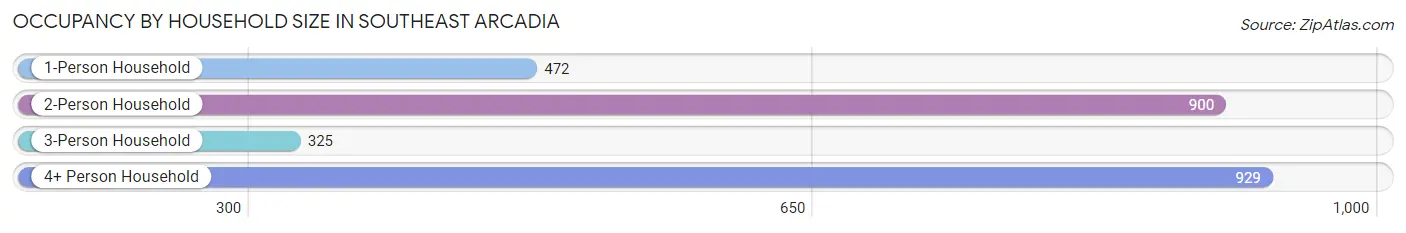
| Household Size | # Housing Units | % Housing Units |
| 1-Person Household | 472 | 18.0% |
| 2-Person Household | 900 | 34.3% |
| 3-Person Household | 325 | 12.4% |
| 4+ Person Household | 929 | 35.4% |
| Total Housing Units | 2,626 | 100.0% |
Occupancy by Ownership by Household Size in Southeast Arcadia

| Household Size | Owner-occupied | Renter-occupied |
| 1-Person Household | 256 (54.2%) | 216 (45.8%) |
| 2-Person Household | 580 (64.4%) | 320 (35.6%) |
| 3-Person Household | 187 (57.5%) | 138 (42.5%) |
| 4+ Person Household | 613 (66.0%) | 316 (34.0%) |
| Total Housing Units | 1,636 (62.3%) | 990 (37.7%) |
Occupancy by Educational Attainment in Southeast Arcadia
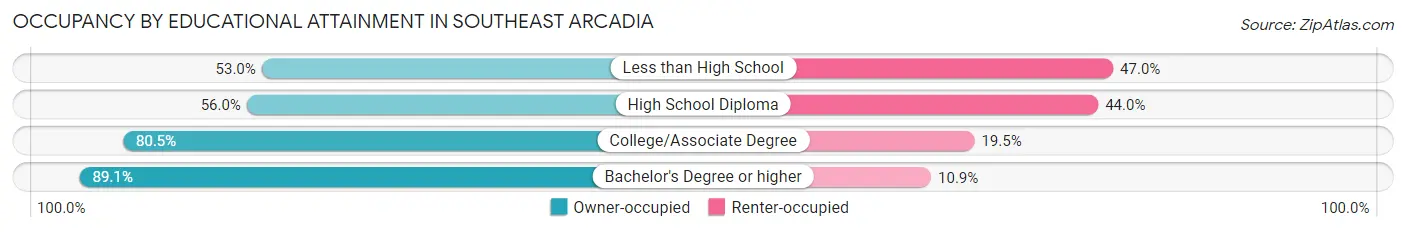
| Household Size | Owner-occupied | Renter-occupied |
| Less than High School | 554 (53.0%) | 491 (47.0%) |
| High School Diploma | 455 (56.0%) | 358 (44.0%) |
| College/Associate Degree | 537 (80.5%) | 130 (19.5%) |
| Bachelor's Degree or higher | 90 (89.1%) | 11 (10.9%) |
Occupancy by Age of Householder in Southeast Arcadia
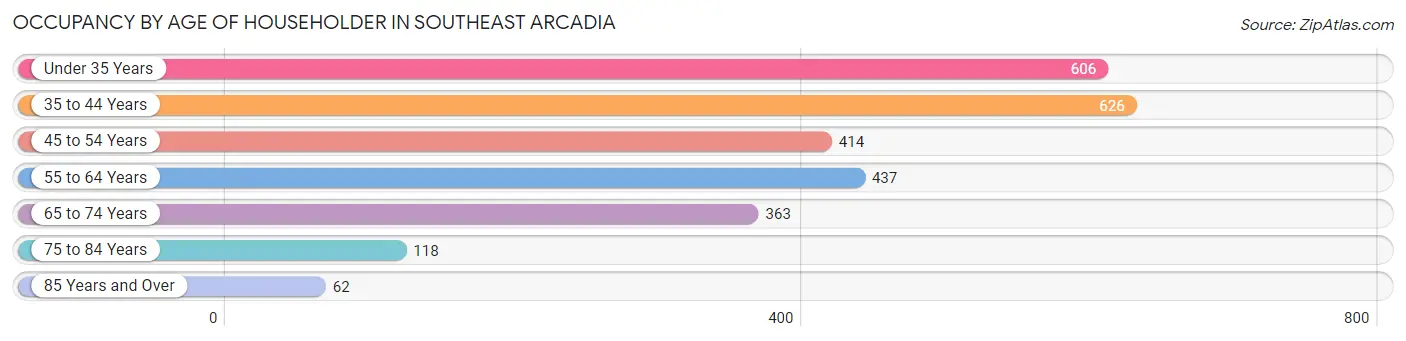
| Age Bracket | # Households | % Households |
| Under 35 Years | 606 | 23.1% |
| 35 to 44 Years | 626 | 23.8% |
| 45 to 54 Years | 414 | 15.8% |
| 55 to 64 Years | 437 | 16.6% |
| 65 to 74 Years | 363 | 13.8% |
| 75 to 84 Years | 118 | 4.5% |
| 85 Years and Over | 62 | 2.4% |
| Total | 2,626 | 100.0% |
Housing Finances in Southeast Arcadia
Median Income by Occupancy in Southeast Arcadia
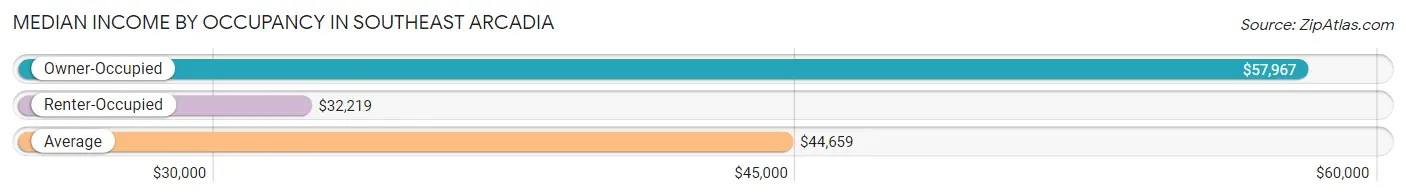
| Occupancy Type | # Households | Median Income |
| Owner-Occupied | 1,636 (62.3%) | $57,967 |
| Renter-Occupied | 990 (37.7%) | $32,219 |
| Average | 2,626 (100.0%) | $44,659 |
Occupancy by Householder Income Bracket in Southeast Arcadia
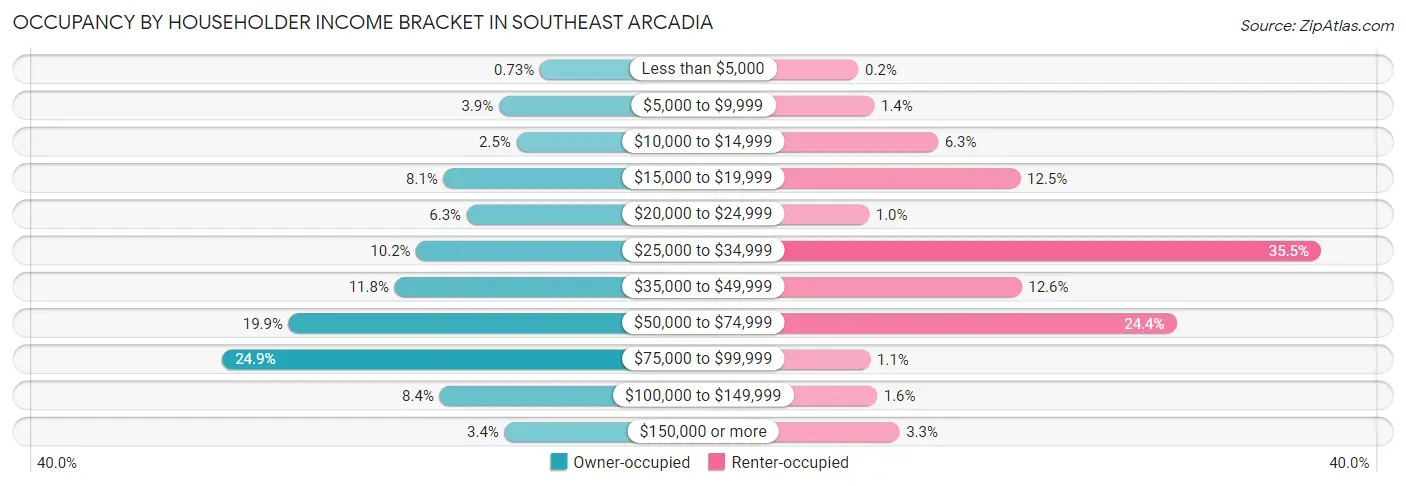
| Income Bracket | Owner-occupied | Renter-occupied |
| Less than $5,000 | 12 (0.7%) | 2 (0.2%) |
| $5,000 to $9,999 | 63 (3.8%) | 14 (1.4%) |
| $10,000 to $14,999 | 41 (2.5%) | 62 (6.3%) |
| $15,000 to $19,999 | 132 (8.1%) | 124 (12.5%) |
| $20,000 to $24,999 | 103 (6.3%) | 10 (1.0%) |
| $25,000 to $34,999 | 166 (10.2%) | 351 (35.4%) |
| $35,000 to $49,999 | 193 (11.8%) | 125 (12.6%) |
| $50,000 to $74,999 | 325 (19.9%) | 242 (24.4%) |
| $75,000 to $99,999 | 408 (24.9%) | 11 (1.1%) |
| $100,000 to $149,999 | 137 (8.4%) | 16 (1.6%) |
| $150,000 or more | 56 (3.4%) | 33 (3.3%) |
| Total | 1,636 (100.0%) | 990 (100.0%) |
Monthly Housing Cost Tiers in Southeast Arcadia
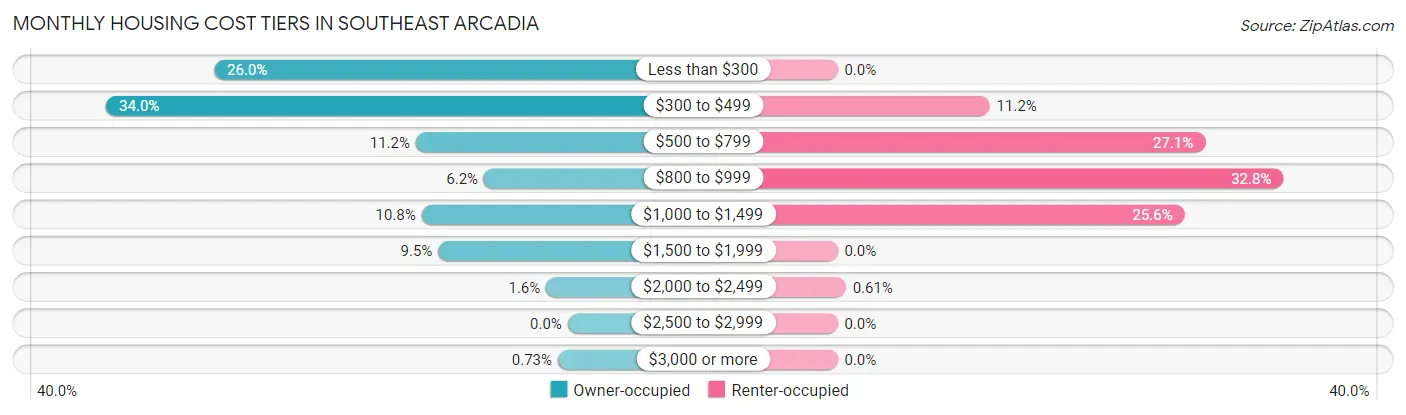
| Monthly Cost | Owner-occupied | Renter-occupied |
| Less than $300 | 426 (26.0%) | 0 (0.0%) |
| $300 to $499 | 556 (34.0%) | 111 (11.2%) |
| $500 to $799 | 183 (11.2%) | 268 (27.1%) |
| $800 to $999 | 101 (6.2%) | 325 (32.8%) |
| $1,000 to $1,499 | 176 (10.8%) | 253 (25.6%) |
| $1,500 to $1,999 | 156 (9.5%) | 0 (0.0%) |
| $2,000 to $2,499 | 26 (1.6%) | 6 (0.6%) |
| $2,500 to $2,999 | 0 (0.0%) | 0 (0.0%) |
| $3,000 or more | 12 (0.7%) | 0 (0.0%) |
| Total | 1,636 (100.0%) | 990 (100.0%) |
Physical Housing Characteristics in Southeast Arcadia
Housing Structures in Southeast Arcadia
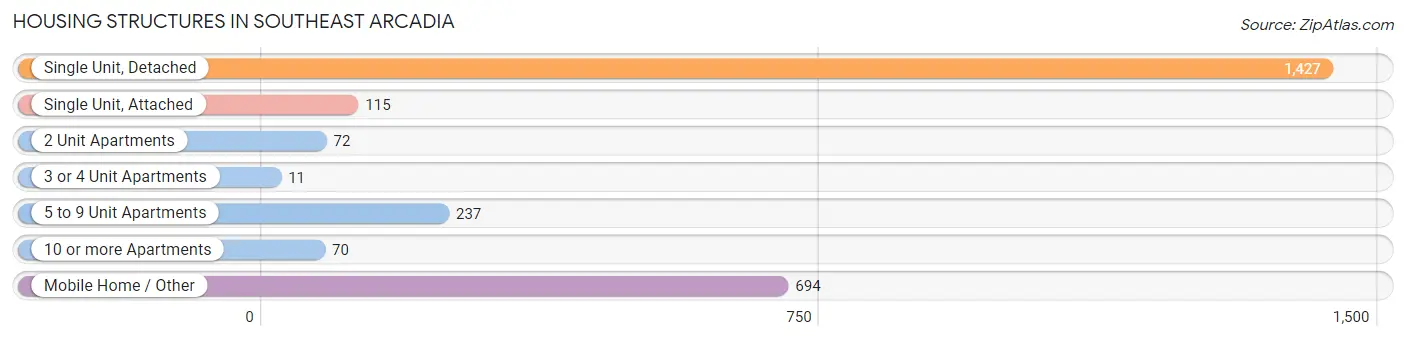
| Structure Type | # Housing Units | % Housing Units |
| Single Unit, Detached | 1,427 | 54.3% |
| Single Unit, Attached | 115 | 4.4% |
| 2 Unit Apartments | 72 | 2.7% |
| 3 or 4 Unit Apartments | 11 | 0.4% |
| 5 to 9 Unit Apartments | 237 | 9.0% |
| 10 or more Apartments | 70 | 2.7% |
| Mobile Home / Other | 694 | 26.4% |
| Total | 2,626 | 100.0% |
Housing Structures by Occupancy in Southeast Arcadia
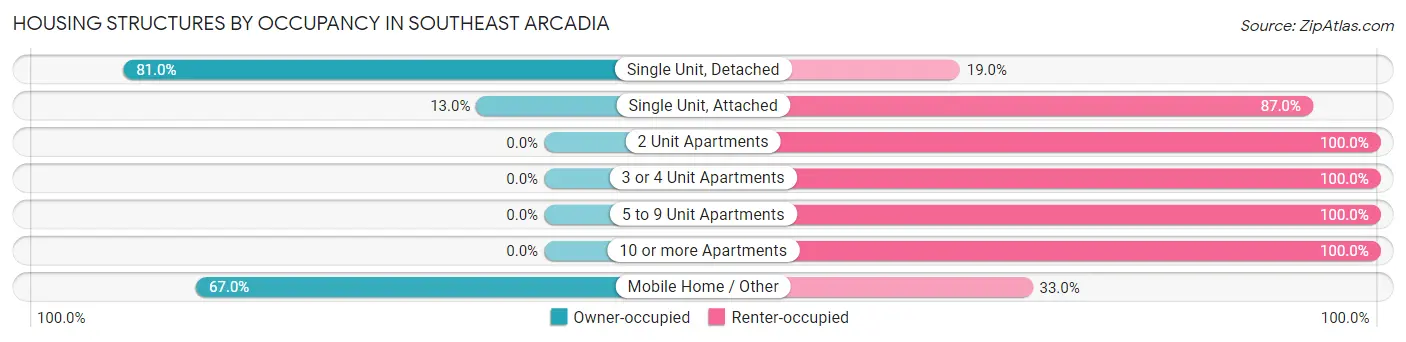
| Structure Type | Owner-occupied | Renter-occupied |
| Single Unit, Detached | 1,156 (81.0%) | 271 (19.0%) |
| Single Unit, Attached | 15 (13.0%) | 100 (87.0%) |
| 2 Unit Apartments | 0 (0.0%) | 72 (100.0%) |
| 3 or 4 Unit Apartments | 0 (0.0%) | 11 (100.0%) |
| 5 to 9 Unit Apartments | 0 (0.0%) | 237 (100.0%) |
| 10 or more Apartments | 0 (0.0%) | 70 (100.0%) |
| Mobile Home / Other | 465 (67.0%) | 229 (33.0%) |
| Total | 1,636 (62.3%) | 990 (37.7%) |
Housing Structures by Number of Rooms in Southeast Arcadia
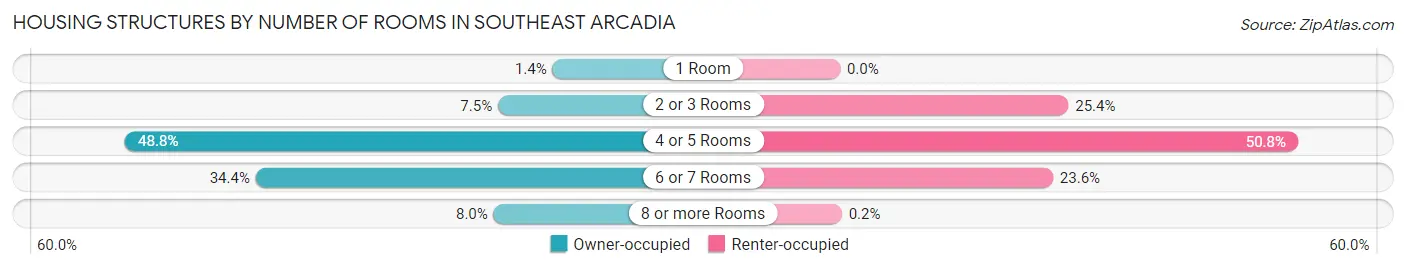
| Number of Rooms | Owner-occupied | Renter-occupied |
| 1 Room | 23 (1.4%) | 0 (0.0%) |
| 2 or 3 Rooms | 122 (7.5%) | 251 (25.4%) |
| 4 or 5 Rooms | 799 (48.8%) | 503 (50.8%) |
| 6 or 7 Rooms | 562 (34.4%) | 234 (23.6%) |
| 8 or more Rooms | 130 (8.0%) | 2 (0.2%) |
| Total | 1,636 (100.0%) | 990 (100.0%) |
Housing Structure by Heating Type in Southeast Arcadia
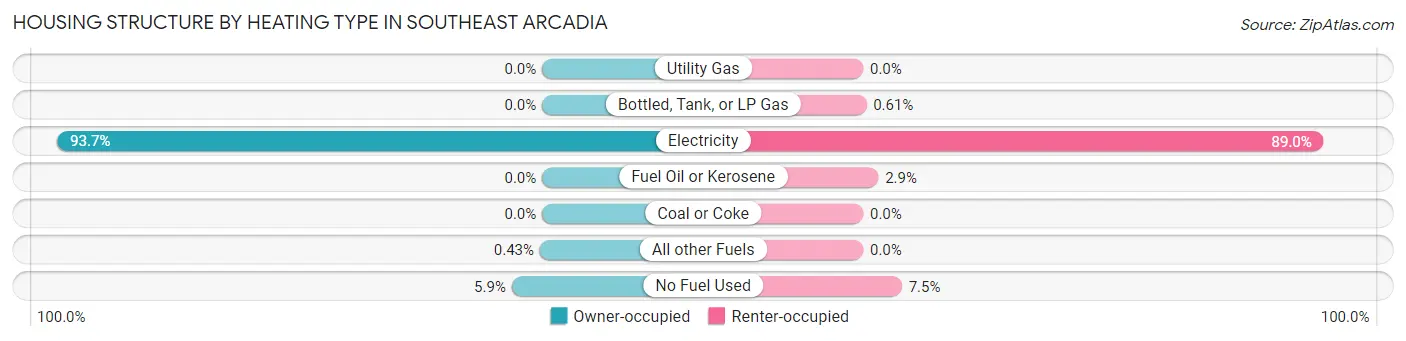
| Heating Type | Owner-occupied | Renter-occupied |
| Utility Gas | 0 (0.0%) | 0 (0.0%) |
| Bottled, Tank, or LP Gas | 0 (0.0%) | 6 (0.6%) |
| Electricity | 1,533 (93.7%) | 881 (89.0%) |
| Fuel Oil or Kerosene | 0 (0.0%) | 29 (2.9%) |
| Coal or Coke | 0 (0.0%) | 0 (0.0%) |
| All other Fuels | 7 (0.4%) | 0 (0.0%) |
| No Fuel Used | 96 (5.9%) | 74 (7.5%) |
| Total | 1,636 (100.0%) | 990 (100.0%) |
Household Vehicle Usage in Southeast Arcadia
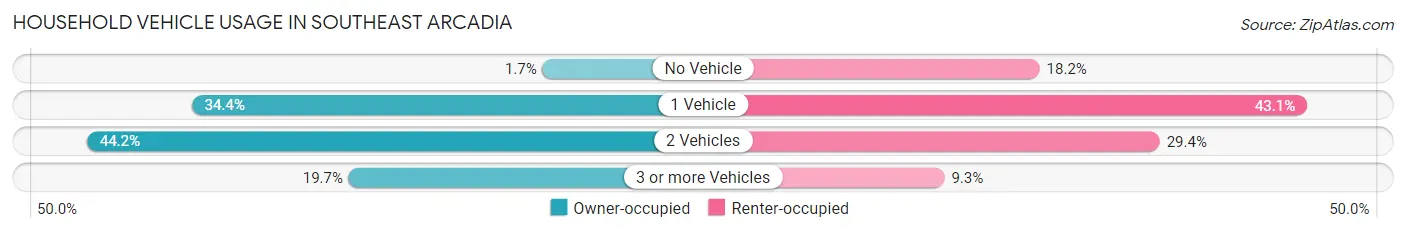
| Vehicles per Household | Owner-occupied | Renter-occupied |
| No Vehicle | 27 (1.7%) | 180 (18.2%) |
| 1 Vehicle | 563 (34.4%) | 427 (43.1%) |
| 2 Vehicles | 723 (44.2%) | 291 (29.4%) |
| 3 or more Vehicles | 323 (19.7%) | 92 (9.3%) |
| Total | 1,636 (100.0%) | 990 (100.0%) |
Real Estate & Mortgages in Southeast Arcadia
Real Estate and Mortgage Overview in Southeast Arcadia
| Characteristic | Without Mortgage | With Mortgage |
| Housing Units | 1,157 | 479 |
| Median Property Value | $108,300 | $150,500 |
| Median Household Income | $43,082 | $0 |
| Monthly Housing Costs | $365 | $12 |
| Real Estate Taxes | $1,151 | $10 |
Property Value by Mortgage Status in Southeast Arcadia
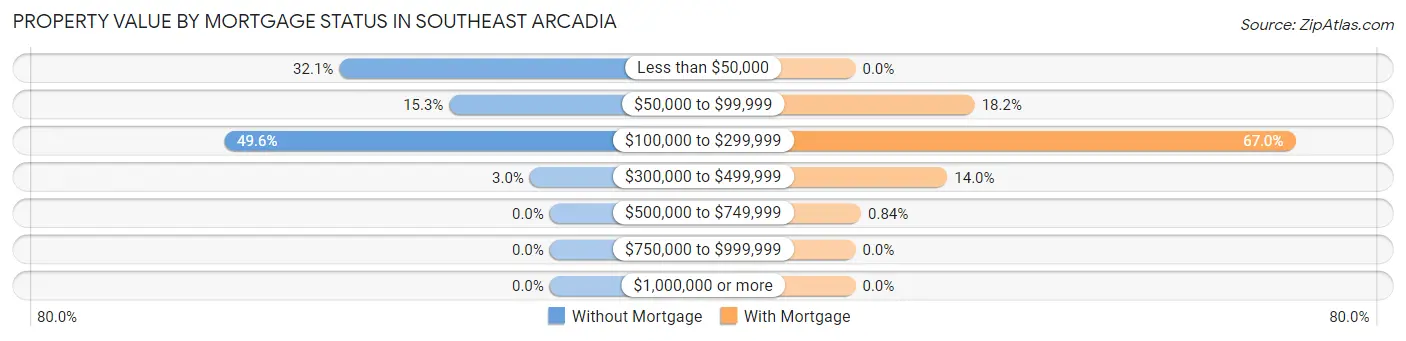
| Property Value | Without Mortgage | With Mortgage |
| Less than $50,000 | 371 (32.1%) | 0 (0.0%) |
| $50,000 to $99,999 | 177 (15.3%) | 87 (18.2%) |
| $100,000 to $299,999 | 574 (49.6%) | 321 (67.0%) |
| $300,000 to $499,999 | 35 (3.0%) | 67 (14.0%) |
| $500,000 to $749,999 | 0 (0.0%) | 4 (0.8%) |
| $750,000 to $999,999 | 0 (0.0%) | 0 (0.0%) |
| $1,000,000 or more | 0 (0.0%) | 0 (0.0%) |
| Total | 1,157 (100.0%) | 479 (100.0%) |
Household Income by Mortgage Status in Southeast Arcadia
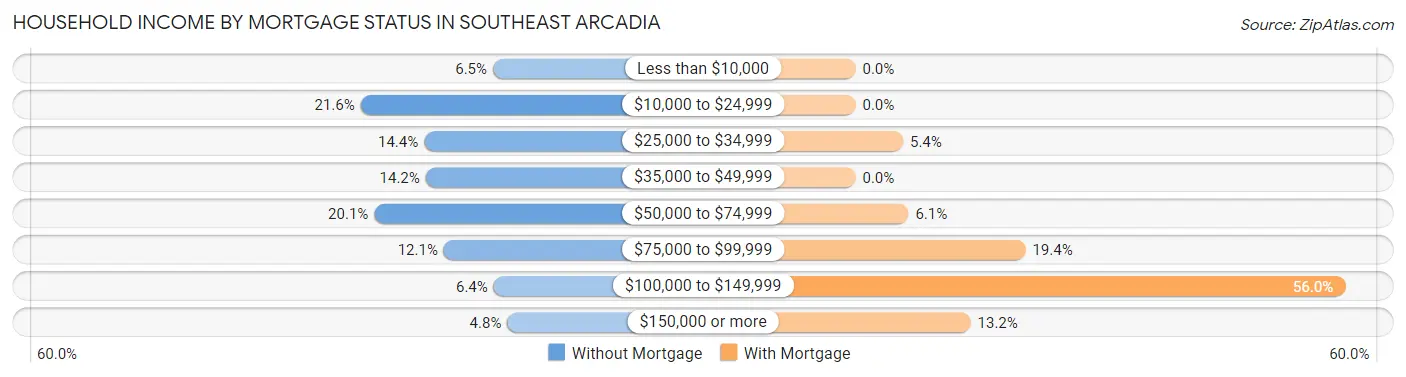
| Household Income | Without Mortgage | With Mortgage |
| Less than $10,000 | 75 (6.5%) | 0 (0.0%) |
| $10,000 to $24,999 | 250 (21.6%) | 0 (0.0%) |
| $25,000 to $34,999 | 166 (14.3%) | 26 (5.4%) |
| $35,000 to $49,999 | 164 (14.2%) | 0 (0.0%) |
| $50,000 to $74,999 | 232 (20.1%) | 29 (6.0%) |
| $75,000 to $99,999 | 140 (12.1%) | 93 (19.4%) |
| $100,000 to $149,999 | 74 (6.4%) | 268 (55.9%) |
| $150,000 or more | 56 (4.8%) | 63 (13.2%) |
| Total | 1,157 (100.0%) | 479 (100.0%) |
Property Value to Household Income Ratio in Southeast Arcadia
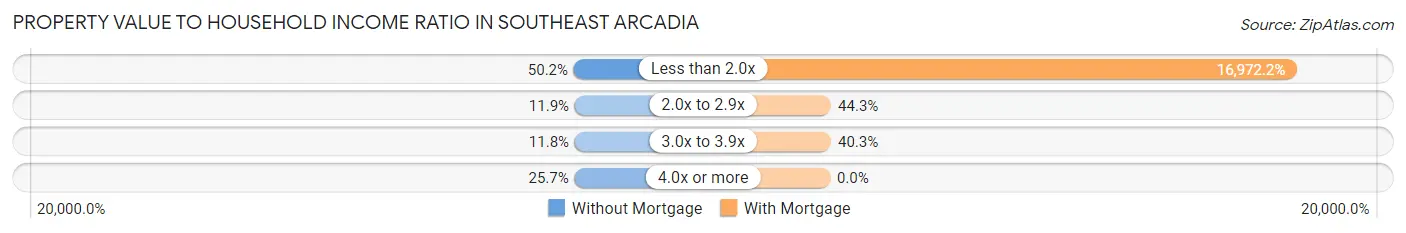
| Value-to-Income Ratio | Without Mortgage | With Mortgage |
| Less than 2.0x | 581 (50.2%) | 81,297 (16,972.2%) |
| 2.0x to 2.9x | 138 (11.9%) | 212 (44.3%) |
| 3.0x to 3.9x | 136 (11.7%) | 193 (40.3%) |
| 4.0x or more | 297 (25.7%) | 0 (0.0%) |
| Total | 1,157 (100.0%) | 479 (100.0%) |
Real Estate Taxes by Mortgage Status in Southeast Arcadia
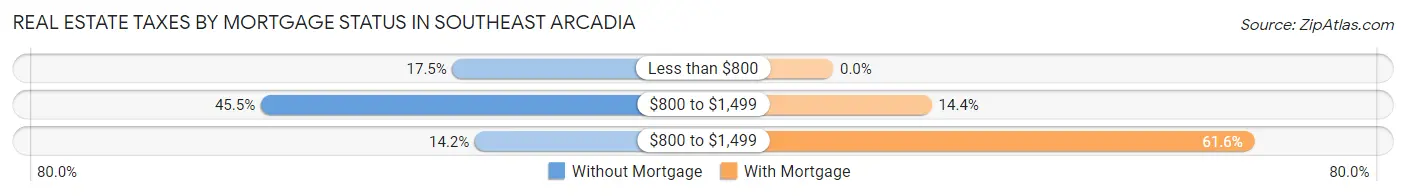
| Property Taxes | Without Mortgage | With Mortgage |
| Less than $800 | 202 (17.5%) | 0 (0.0%) |
| $800 to $1,499 | 526 (45.5%) | 69 (14.4%) |
| $800 to $1,499 | 164 (14.2%) | 295 (61.6%) |
| Total | 1,157 (100.0%) | 479 (100.0%) |
Health & Disability in Southeast Arcadia
Health Insurance Coverage by Age in Southeast Arcadia
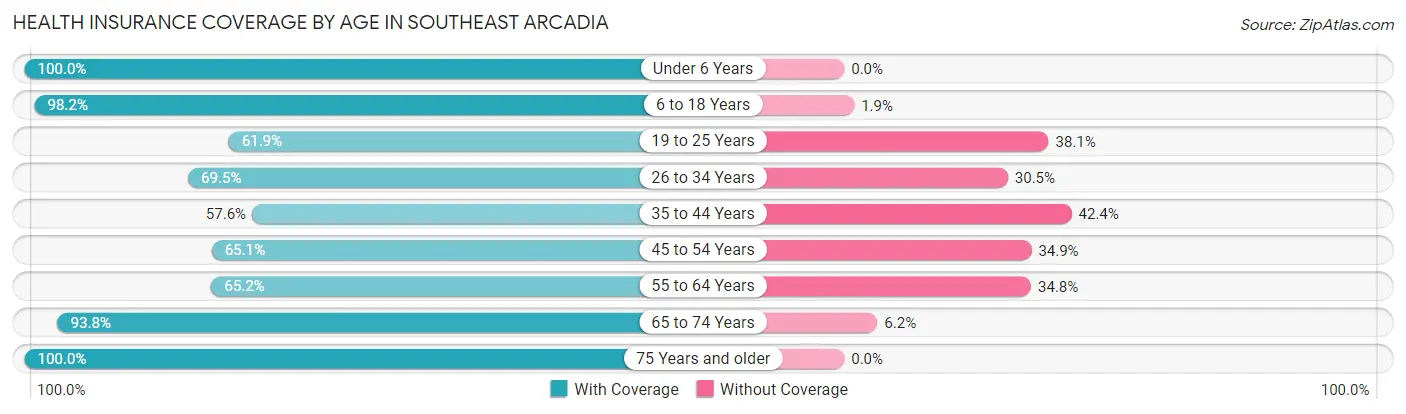
| Age Bracket | With Coverage | Without Coverage |
| Under 6 Years | 796 (100.0%) | 0 (0.0%) |
| 6 to 18 Years | 1,168 (98.2%) | 22 (1.8%) |
| 19 to 25 Years | 585 (61.9%) | 360 (38.1%) |
| 26 to 34 Years | 784 (69.5%) | 344 (30.5%) |
| 35 to 44 Years | 515 (57.6%) | 379 (42.4%) |
| 45 to 54 Years | 651 (65.1%) | 349 (34.9%) |
| 55 to 64 Years | 518 (65.2%) | 277 (34.8%) |
| 65 to 74 Years | 426 (93.8%) | 28 (6.2%) |
| 75 Years and older | 473 (100.0%) | 0 (0.0%) |
| Total | 5,916 (77.1%) | 1,759 (22.9%) |
Health Insurance Coverage by Citizenship Status in Southeast Arcadia
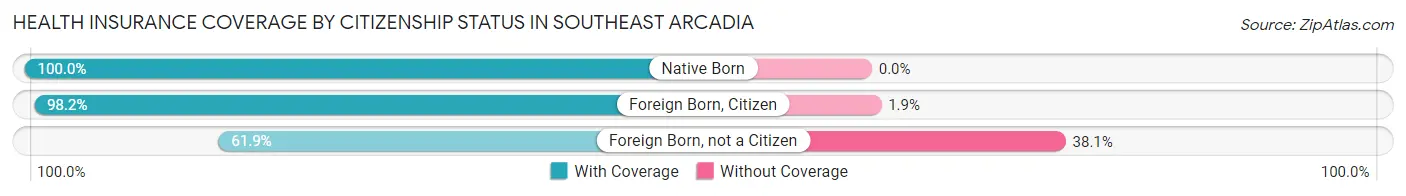
| Citizenship Status | With Coverage | Without Coverage |
| Native Born | 796 (100.0%) | 0 (0.0%) |
| Foreign Born, Citizen | 1,168 (98.2%) | 22 (1.8%) |
| Foreign Born, not a Citizen | 585 (61.9%) | 360 (38.1%) |
Health Insurance Coverage by Household Income in Southeast Arcadia
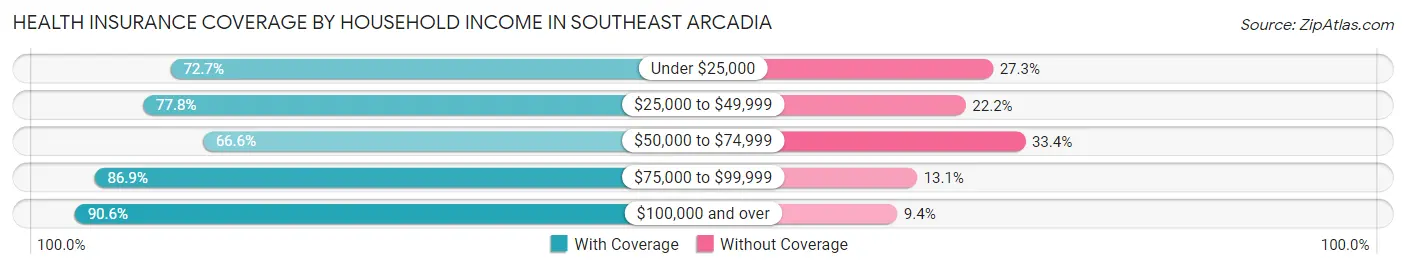
| Household Income | With Coverage | Without Coverage |
| Under $25,000 | 848 (72.7%) | 319 (27.3%) |
| $25,000 to $49,999 | 1,708 (77.8%) | 488 (22.2%) |
| $50,000 to $74,999 | 1,377 (66.6%) | 690 (33.4%) |
| $75,000 to $99,999 | 1,201 (86.9%) | 181 (13.1%) |
| $100,000 and over | 782 (90.6%) | 81 (9.4%) |
Public vs Private Health Insurance Coverage by Age in Southeast Arcadia
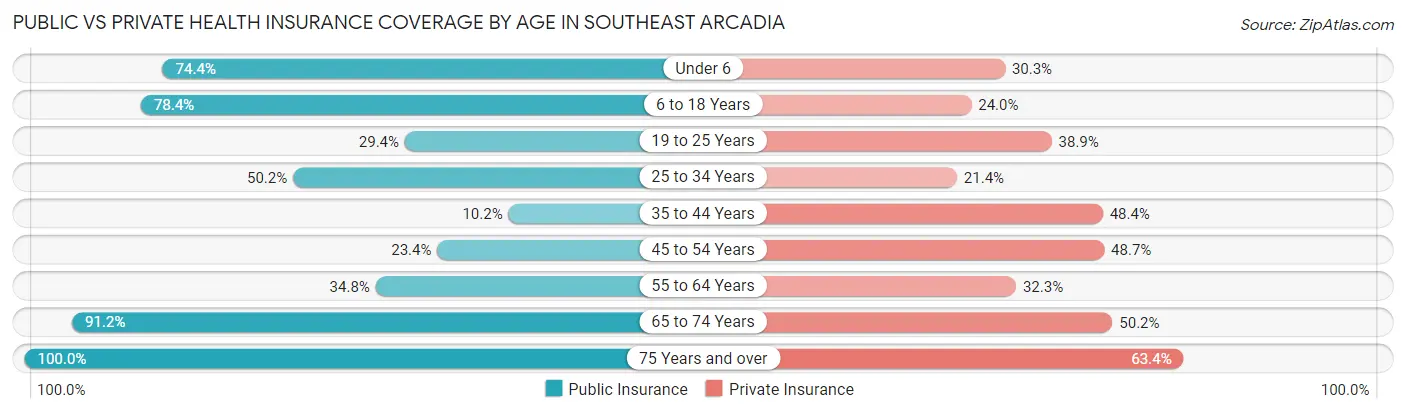
| Age Bracket | Public Insurance | Private Insurance |
| Under 6 | 592 (74.4%) | 241 (30.3%) |
| 6 to 18 Years | 933 (78.4%) | 286 (24.0%) |
| 19 to 25 Years | 278 (29.4%) | 368 (38.9%) |
| 25 to 34 Years | 566 (50.2%) | 241 (21.4%) |
| 35 to 44 Years | 91 (10.2%) | 433 (48.4%) |
| 45 to 54 Years | 234 (23.4%) | 487 (48.7%) |
| 55 to 64 Years | 277 (34.8%) | 257 (32.3%) |
| 65 to 74 Years | 414 (91.2%) | 228 (50.2%) |
| 75 Years and over | 473 (100.0%) | 300 (63.4%) |
| Total | 3,858 (50.3%) | 2,841 (37.0%) |
Disability Status by Sex by Age in Southeast Arcadia
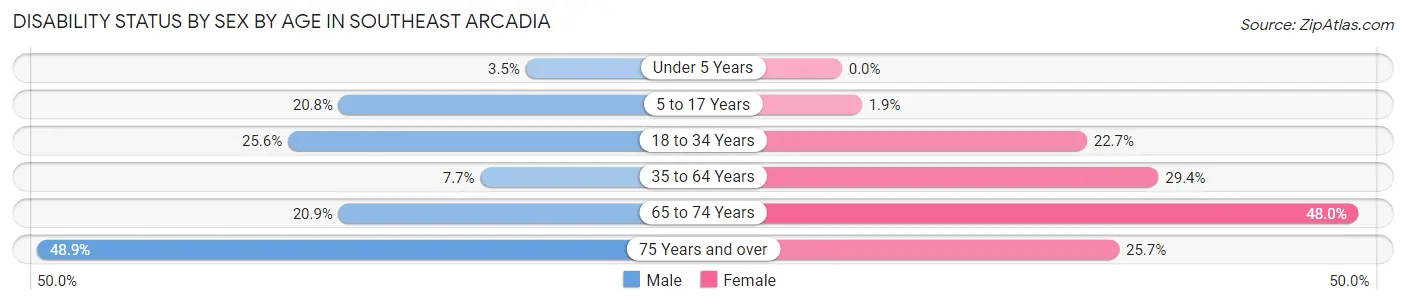
| Age Bracket | Male | Female |
| Under 5 Years | 7 (3.5%) | 0 (0.0%) |
| 5 to 17 Years | 114 (20.8%) | 13 (1.8%) |
| 18 to 34 Years | 349 (25.6%) | 166 (22.7%) |
| 35 to 64 Years | 107 (7.7%) | 382 (29.4%) |
| 65 to 74 Years | 59 (20.8%) | 82 (47.9%) |
| 75 Years and over | 64 (48.8%) | 88 (25.7%) |
Disability Class by Sex by Age in Southeast Arcadia
Disability Class: Hearing Difficulty
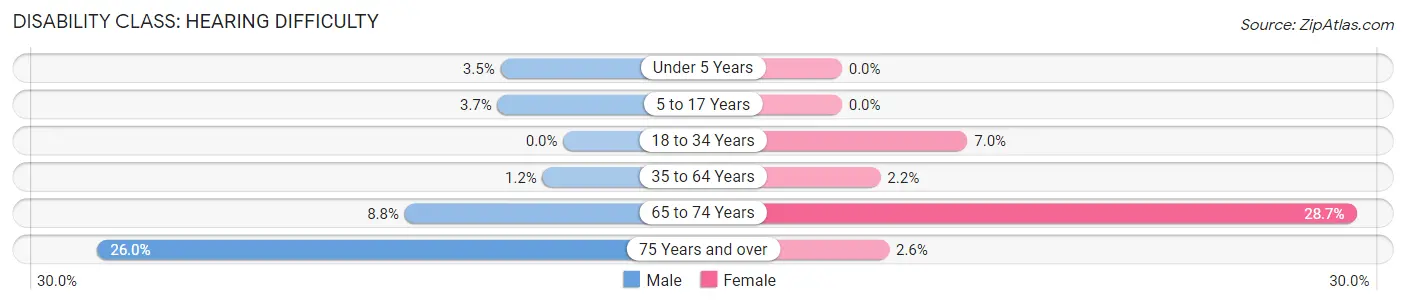
| Age Bracket | Male | Female |
| Under 5 Years | 7 (3.5%) | 0 (0.0%) |
| 5 to 17 Years | 20 (3.7%) | 0 (0.0%) |
| 18 to 34 Years | 0 (0.0%) | 51 (7.0%) |
| 35 to 64 Years | 16 (1.1%) | 28 (2.1%) |
| 65 to 74 Years | 25 (8.8%) | 49 (28.6%) |
| 75 Years and over | 34 (26.0%) | 9 (2.6%) |
Disability Class: Vision Difficulty

| Age Bracket | Male | Female |
| Under 5 Years | 7 (3.5%) | 0 (0.0%) |
| 5 to 17 Years | 20 (3.7%) | 0 (0.0%) |
| 18 to 34 Years | 0 (0.0%) | 42 (5.8%) |
| 35 to 64 Years | 9 (0.6%) | 8 (0.6%) |
| 65 to 74 Years | 16 (5.7%) | 19 (11.1%) |
| 75 Years and over | 10 (7.6%) | 53 (15.5%) |
Disability Class: Cognitive Difficulty
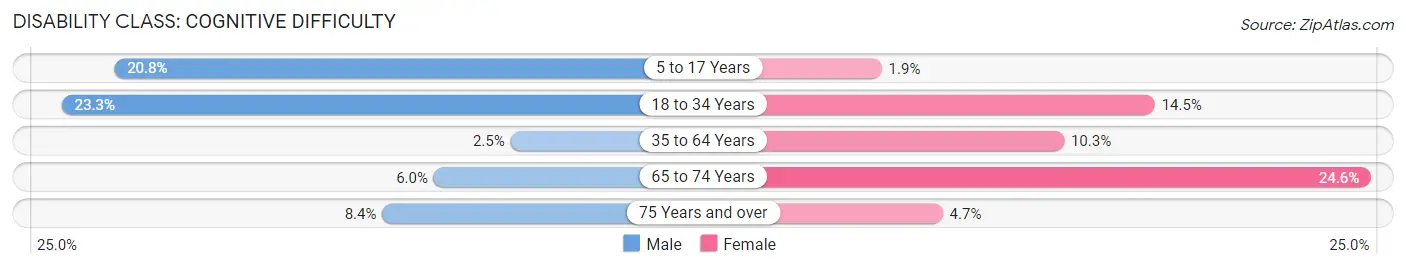
| Age Bracket | Male | Female |
| 5 to 17 Years | 114 (20.8%) | 13 (1.8%) |
| 18 to 34 Years | 318 (23.3%) | 106 (14.5%) |
| 35 to 64 Years | 34 (2.5%) | 134 (10.3%) |
| 65 to 74 Years | 17 (6.0%) | 42 (24.6%) |
| 75 Years and over | 11 (8.4%) | 16 (4.7%) |
Disability Class: Ambulatory Difficulty
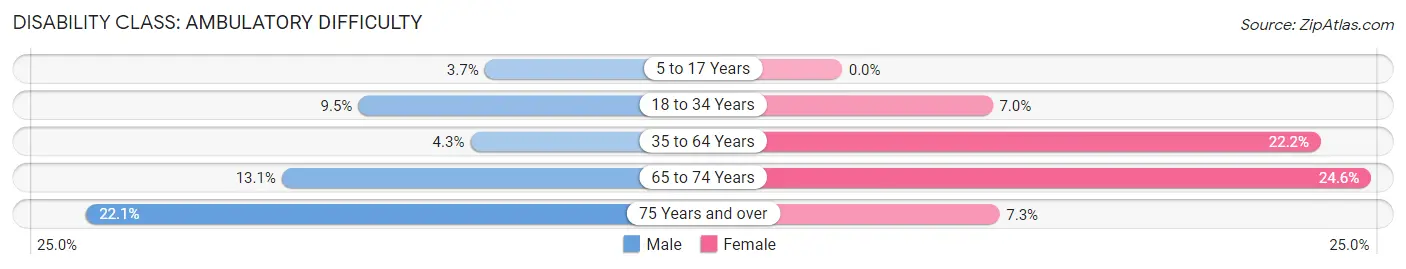
| Age Bracket | Male | Female |
| 5 to 17 Years | 20 (3.7%) | 0 (0.0%) |
| 18 to 34 Years | 130 (9.5%) | 51 (7.0%) |
| 35 to 64 Years | 60 (4.3%) | 289 (22.2%) |
| 65 to 74 Years | 37 (13.1%) | 42 (24.6%) |
| 75 Years and over | 29 (22.1%) | 25 (7.3%) |
Disability Class: Self-Care Difficulty
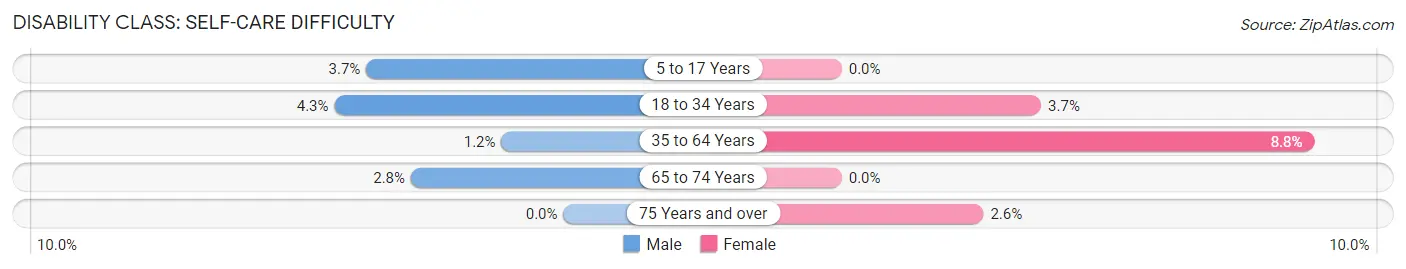
| Age Bracket | Male | Female |
| 5 to 17 Years | 20 (3.7%) | 0 (0.0%) |
| 18 to 34 Years | 58 (4.3%) | 27 (3.7%) |
| 35 to 64 Years | 16 (1.1%) | 114 (8.8%) |
| 65 to 74 Years | 8 (2.8%) | 0 (0.0%) |
| 75 Years and over | 0 (0.0%) | 9 (2.6%) |
Technology Access in Southeast Arcadia
Computing Device Access in Southeast Arcadia
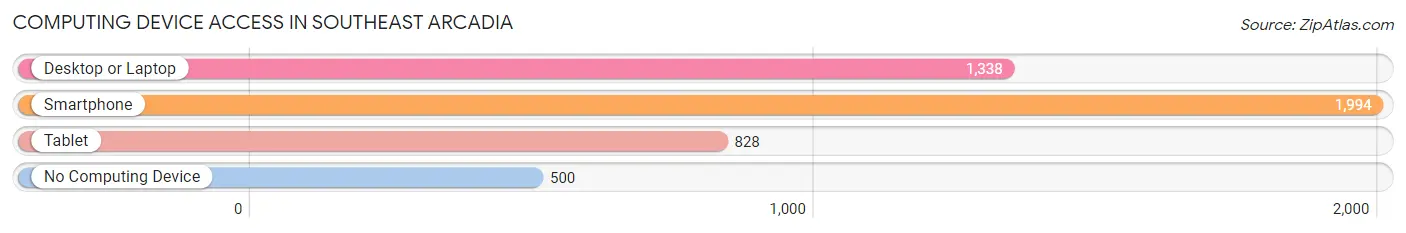
| Device Type | # Households | % Households |
| Desktop or Laptop | 1,338 | 50.9% |
| Smartphone | 1,994 | 75.9% |
| Tablet | 828 | 31.5% |
| No Computing Device | 500 | 19.0% |
| Total | 2,626 | 100.0% |
Internet Access in Southeast Arcadia
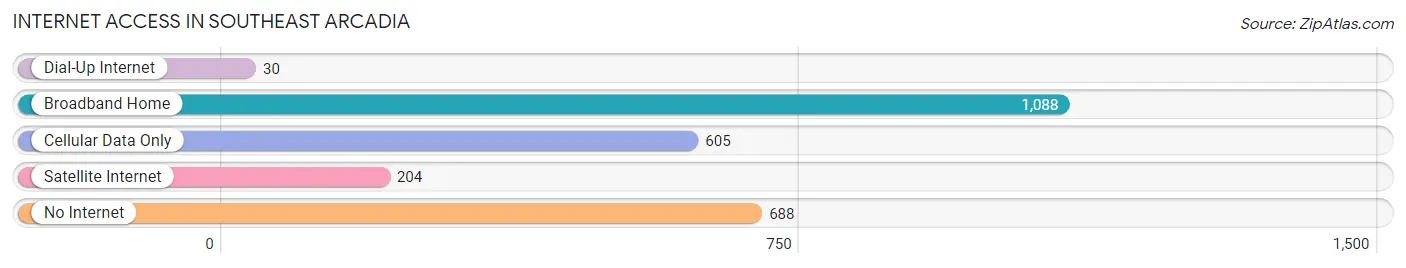
| Internet Type | # Households | % Households |
| Dial-Up Internet | 30 | 1.1% |
| Broadband Home | 1,088 | 41.4% |
| Cellular Data Only | 605 | 23.0% |
| Satellite Internet | 204 | 7.8% |
| No Internet | 688 | 26.2% |
| Total | 2,626 | 100.0% |
Southeast Arcadia Summary
Southeast Arcadia is a small city located in DeSoto County, Florida. It is situated in the southeastern part of the state, approximately 50 miles east of Tampa and 75 miles south of Orlando. The city is home to a population of approximately 7,000 people and is part of the larger Arcadia metropolitan area.
History
Southeast Arcadia was founded in 1887 by a group of settlers from Arcadia, Indiana. The settlers were looking for a place to start a new life and found the area to be ideal for farming and ranching. The city was originally known as Arcadia Station, but the name was changed to Southeast Arcadia in 1895.
The city was incorporated in 1911 and has since grown to become a thriving community. The city has a rich history and is home to many historic sites, including the Arcadia Historic District, which is listed on the National Register of Historic Places.
Geography
Southeast Arcadia is located in the southeastern part of DeSoto County, Florida. The city is situated on the Peace River, which is a major tributary of the Gulf of Mexico. The city is surrounded by a number of small towns and villages, including Nocatee, Ona, and Zolfo Springs.
The city has a total area of 4.2 square miles, of which 4.1 square miles is land and 0.1 square miles is water. The city is located at an elevation of 39 feet above sea level.
Economy
Southeast Arcadia is a small city with a diverse economy. The city is home to a number of businesses, including retail stores, restaurants, and professional services. The city is also home to a number of manufacturing companies, including a paper mill and a furniture factory.
The city is also home to a number of agricultural businesses, including citrus groves, cattle ranches, and vegetable farms. The city is also home to a number of tourist attractions, including the Arcadia Historic District and the Peace River Wildlife Refuge.
Demographics
As of the 2010 census, the population of Southeast Arcadia was 7,000. The racial makeup of the city was 79.3% White, 15.2% African American, 0.7% Native American, 0.7% Asian, 0.1% Pacific Islander, and 3.9% from other races. Hispanic or Latino of any race were 8.3% of the population.
The median household income in Southeast Arcadia was $35,000, and the median family income was $41,000. The per capita income for the city was $17,000. About 17.3% of the population was below the poverty line.
Conclusion
Southeast Arcadia is a small city located in DeSoto County, Florida. It is situated in the southeastern part of the state, approximately 50 miles east of Tampa and 75 miles south of Orlando. The city is home to a population of approximately 7,000 people and is part of the larger Arcadia metropolitan area. The city has a rich history and is home to many historic sites, including the Arcadia Historic District, which is listed on the National Register of Historic Places. The city has a diverse economy, with businesses ranging from retail stores to manufacturing companies. The population of Southeast Arcadia is predominantly White, with African Americans, Native Americans, Asians, and Pacific Islanders making up a small percentage of the population. The median household income in Southeast Arcadia is $35,000, and the median family income is $41,000.
Common Questions
What is the Total Population of Southeast Arcadia?
Total Population of Southeast Arcadia is 7,675.
What is the Total Male Population of Southeast Arcadia?
Total Male Population of Southeast Arcadia is 3,916.
What is the Total Female Population of Southeast Arcadia?
Total Female Population of Southeast Arcadia is 3,759.
What is the Ratio of Males per 100 Females in Southeast Arcadia?
There are 104.18 Males per 100 Females in Southeast Arcadia.
What is the Ratio of Females per 100 Males in Southeast Arcadia?
There are 95.99 Females per 100 Males in Southeast Arcadia.
What is the Median Population Age in Southeast Arcadia?
Median Population Age in Southeast Arcadia is 33.5 Years.
What is the Average Family Size in Southeast Arcadia
Average Family Size in Southeast Arcadia is 3.3 People.
What is the Average Household Size in Southeast Arcadia
Average Household Size in Southeast Arcadia is 2.9 People.
What is Per Capita Income in Southeast Arcadia?
Per Capita income in Southeast Arcadia is $18,236.
What is the Median Family Income in Southeast Arcadia?
Median Family Income in Southeast Arcadia is $53,417.
What is the Median Household income in Southeast Arcadia?
Median Household Income in Southeast Arcadia is $44,659.
What is Income or Wage Gap in Southeast Arcadia?
Income or Wage Gap in Southeast Arcadia is 17.4%.
Women in Southeast Arcadia earn 82.6 cents for every dollar earned by a man.
What is Inequality or Gini Index in Southeast Arcadia?
Inequality or Gini Index in Southeast Arcadia is 0.37.
How Large is the Labor Force in Southeast Arcadia?
There are 3,600 People in the Labor Forcein in Southeast Arcadia.
What is the Percentage of People in the Labor Force in Southeast Arcadia?
60.4% of People are in the Labor Force in Southeast Arcadia.
What is the Unemployment Rate in Southeast Arcadia?
Unemployment Rate in Southeast Arcadia is 15.0%.