Country Club, FL
Country Club Map
Country Club Overview
50,975
TOTAL POPULATION
24,885
MALE POPULATION
26,090
FEMALE POPULATION
95.38
MALES / 100 FEMALES
104.84
FEMALES / 100 MALES
39.8
MEDIAN AGE
3.2
AVG FAMILY SIZE
2.8
AVG HOUSEHOLD SIZE
$28,902
PER CAPITA INCOME
$67,733
AVG FAMILY INCOME
$66,140
AVG HOUSEHOLD INCOME
18.1%
WAGE / INCOME GAP [ % ]
81.9¢/ $1
WAGE / INCOME GAP [ $ ]
$10,836
FAMILY INCOME DEFICIT
0.40
INEQUALITY / GINI INDEX
29,510
LABOR FORCE [ PEOPLE ]
71.0%
PERCENT IN LABOR FORCE
4.6%
UNEMPLOYMENT RATE
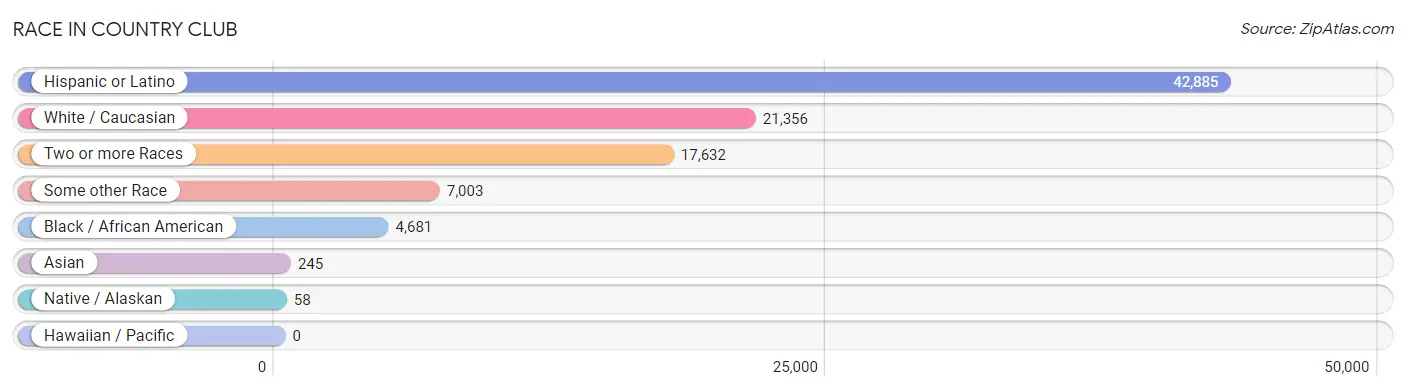
Race in Country Club
The most populous races in Country Club are Hispanic or Latino (42,885 | 84.1%), White / Caucasian (21,356 | 41.9%), and Two or more Races (17,632 | 34.6%).
| Race | # Population | % Population |
| Asian | 245 | 0.5% |
| Black / African American | 4,681 | 9.2% |
| Hawaiian / Pacific | 0 | 0.0% |
| Hispanic or Latino | 42,885 | 84.1% |
| Native / Alaskan | 58 | 0.1% |
| White / Caucasian | 21,356 | 41.9% |
| Two or more Races | 17,632 | 34.6% |
| Some other Race | 7,003 | 13.7% |
| Total | 50,975 | 100.0% |
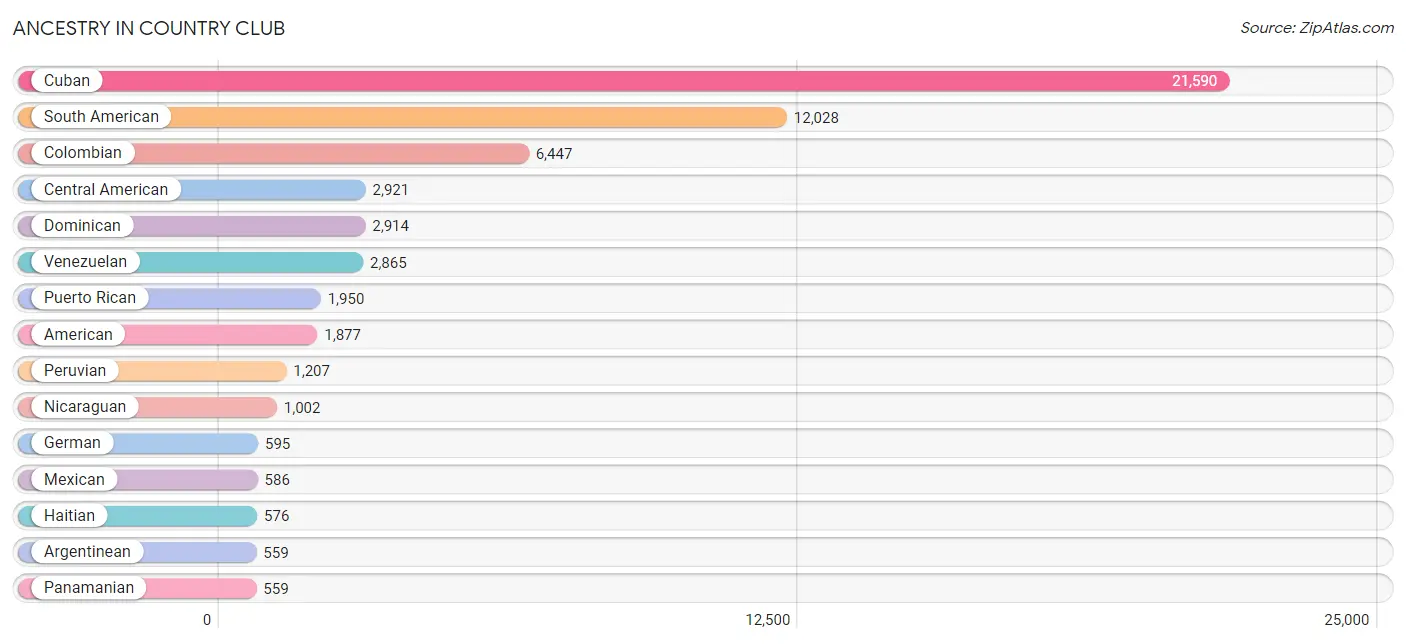
Ancestry in Country Club
The most populous ancestries reported in Country Club are Cuban (21,590 | 42.3%), South American (12,028 | 23.6%), Colombian (6,447 | 12.7%), Central American (2,921 | 5.7%), and Dominican (2,914 | 5.7%), together accounting for 90.1% of all Country Club residents.
| Ancestry | # Population | % Population |
| African | 145 | 0.3% |
| American | 1,877 | 3.7% |
| Arab | 159 | 0.3% |
| Argentinean | 559 | 1.1% |
| Armenian | 17 | 0.0% |
| Austrian | 7 | 0.0% |
| Belizean | 32 | 0.1% |
| Bhutanese | 5 | 0.0% |
| Bolivian | 44 | 0.1% |
| Brazilian | 299 | 0.6% |
| British | 25 | 0.1% |
| British West Indian | 19 | 0.0% |
| Burmese | 15 | 0.0% |
| Canadian | 59 | 0.1% |
| Central American | 2,921 | 5.7% |
| Central American Indian | 62 | 0.1% |
| Chilean | 415 | 0.8% |
| Colombian | 6,447 | 12.7% |
| Costa Rican | 203 | 0.4% |
| Cuban | 21,590 | 42.3% |
| Danish | 1 | 0.0% |
| Dominican | 2,914 | 5.7% |
| Dutch | 59 | 0.1% |
| Dutch West Indian | 169 | 0.3% |
| Ecuadorian | 438 | 0.9% |
| English | 381 | 0.7% |
| European | 257 | 0.5% |
| Finnish | 11 | 0.0% |
| French | 195 | 0.4% |
| French Canadian | 30 | 0.1% |
| German | 595 | 1.2% |
| Guatemalan | 274 | 0.5% |
| Guyanese | 13 | 0.0% |
| Haitian | 576 | 1.1% |
| Honduran | 488 | 1.0% |
| Indian (Asian) | 107 | 0.2% |
| Irish | 238 | 0.5% |
| Italian | 525 | 1.0% |
| Jamaican | 280 | 0.5% |
| Lebanese | 159 | 0.3% |
| Mexican | 586 | 1.1% |
| Nicaraguan | 1,002 | 2.0% |
| Nigerian | 67 | 0.1% |
| Northern European | 15 | 0.0% |
| Norwegian | 33 | 0.1% |
| Pakistani | 16 | 0.0% |
| Palestinian | 16 | 0.0% |
| Panamanian | 559 | 1.1% |
| Peruvian | 1,207 | 2.4% |
| Polish | 78 | 0.2% |
| Portuguese | 66 | 0.1% |
| Puerto Rican | 1,950 | 3.8% |
| Romanian | 8 | 0.0% |
| Russian | 5 | 0.0% |
| Salvadoran | 395 | 0.8% |
| Scotch-Irish | 41 | 0.1% |
| Scottish | 6 | 0.0% |
| Slovene | 7 | 0.0% |
| South American | 12,028 | 23.6% |
| Spaniard | 135 | 0.3% |
| Spanish | 28 | 0.1% |
| Subsaharan African | 436 | 0.9% |
| Swedish | 24 | 0.1% |
| Thai | 123 | 0.2% |
| Trinidadian and Tobagonian | 49 | 0.1% |
| Turkish | 12 | 0.0% |
| U.S. Virgin Islander | 37 | 0.1% |
| Uruguayan | 53 | 0.1% |
| Venezuelan | 2,865 | 5.6% |
| Welsh | 5 | 0.0% |
| West Indian | 133 | 0.3% | View All 71 Rows |
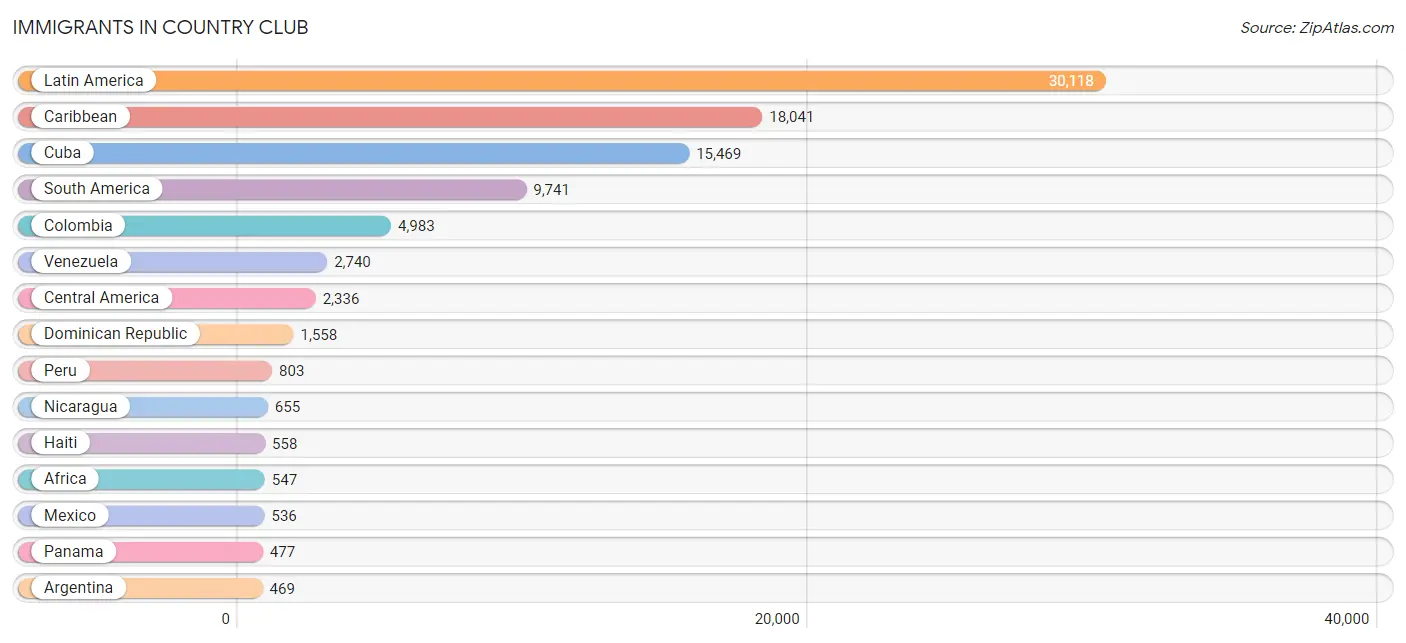
Immigrants in Country Club
The most numerous immigrant groups reported in Country Club came from Latin America (30,118 | 59.1%), Caribbean (18,041 | 35.4%), Cuba (15,469 | 30.3%), South America (9,741 | 19.1%), and Colombia (4,983 | 9.8%), together accounting for 153.7% of all Country Club residents.
| Immigration Origin | # Population | % Population |
| Africa | 547 | 1.1% |
| Argentina | 469 | 0.9% |
| Asia | 251 | 0.5% |
| Bangladesh | 13 | 0.0% |
| Bolivia | 44 | 0.1% |
| Brazil | 66 | 0.1% |
| Cameroon | 23 | 0.1% |
| Canada | 116 | 0.2% |
| Caribbean | 18,041 | 35.4% |
| Central America | 2,336 | 4.6% |
| Chile | 252 | 0.5% |
| China | 64 | 0.1% |
| Colombia | 4,983 | 9.8% |
| Costa Rica | 157 | 0.3% |
| Cuba | 15,469 | 30.3% |
| Dominican Republic | 1,558 | 3.1% |
| Eastern Africa | 110 | 0.2% |
| Eastern Asia | 108 | 0.2% |
| Ecuador | 321 | 0.6% |
| El Salvador | 98 | 0.2% |
| England | 19 | 0.0% |
| Europe | 108 | 0.2% |
| Germany | 13 | 0.0% |
| Guatemala | 143 | 0.3% |
| Haiti | 558 | 1.1% |
| Honduras | 270 | 0.5% |
| India | 13 | 0.0% |
| Jamaica | 129 | 0.3% |
| Japan | 5 | 0.0% |
| Korea | 39 | 0.1% |
| Latin America | 30,118 | 59.1% |
| Lebanon | 46 | 0.1% |
| Mexico | 536 | 1.1% |
| Middle Africa | 23 | 0.1% |
| Netherlands | 14 | 0.0% |
| Nicaragua | 655 | 1.3% |
| Nigeria | 414 | 0.8% |
| Northern Europe | 19 | 0.0% |
| Pakistan | 13 | 0.0% |
| Panama | 477 | 0.9% |
| Peru | 803 | 1.6% |
| Philippines | 28 | 0.1% |
| Saudi Arabia | 7 | 0.0% |
| South America | 9,741 | 19.1% |
| South Central Asia | 39 | 0.1% |
| South Eastern Asia | 39 | 0.1% |
| Southern Europe | 62 | 0.1% |
| Spain | 62 | 0.1% |
| Thailand | 11 | 0.0% |
| Trinidad and Tobago | 44 | 0.1% |
| Turkey | 12 | 0.0% |
| Uruguay | 63 | 0.1% |
| Venezuela | 2,740 | 5.4% |
| West Indies | 50 | 0.1% |
| Western Africa | 414 | 0.8% |
| Western Asia | 65 | 0.1% |
| Western Europe | 27 | 0.1% | View All 57 Rows |
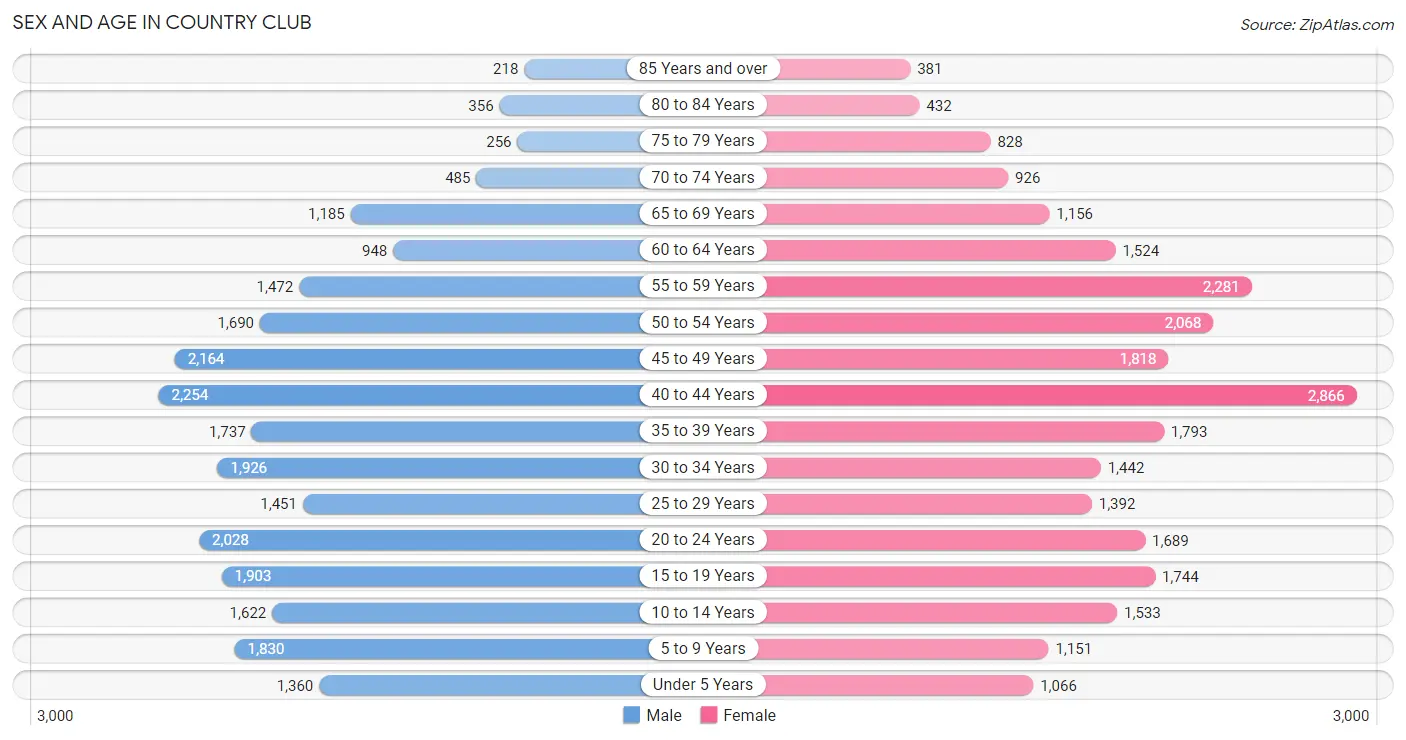
Sex and Age in Country Club
Sex and Age in Country Club
The most populous age groups in Country Club are 40 to 44 Years (2,254 | 9.1%) for men and 40 to 44 Years (2,866 | 11.0%) for women.
| Age Bracket | Male | Female |
| Under 5 Years | 1,360 (5.5%) | 1,066 (4.1%) |
| 5 to 9 Years | 1,830 (7.3%) | 1,151 (4.4%) |
| 10 to 14 Years | 1,622 (6.5%) | 1,533 (5.9%) |
| 15 to 19 Years | 1,903 (7.6%) | 1,744 (6.7%) |
| 20 to 24 Years | 2,028 (8.2%) | 1,689 (6.5%) |
| 25 to 29 Years | 1,451 (5.8%) | 1,392 (5.3%) |
| 30 to 34 Years | 1,926 (7.7%) | 1,442 (5.5%) |
| 35 to 39 Years | 1,737 (7.0%) | 1,793 (6.9%) |
| 40 to 44 Years | 2,254 (9.1%) | 2,866 (11.0%) |
| 45 to 49 Years | 2,164 (8.7%) | 1,818 (7.0%) |
| 50 to 54 Years | 1,690 (6.8%) | 2,068 (7.9%) |
| 55 to 59 Years | 1,472 (5.9%) | 2,281 (8.7%) |
| 60 to 64 Years | 948 (3.8%) | 1,524 (5.8%) |
| 65 to 69 Years | 1,185 (4.8%) | 1,156 (4.4%) |
| 70 to 74 Years | 485 (1.9%) | 926 (3.5%) |
| 75 to 79 Years | 256 (1.0%) | 828 (3.2%) |
| 80 to 84 Years | 356 (1.4%) | 432 (1.7%) |
| 85 Years and over | 218 (0.9%) | 381 (1.5%) |
| Total | 24,885 (100.0%) | 26,090 (100.0%) |
Families and Households in Country Club
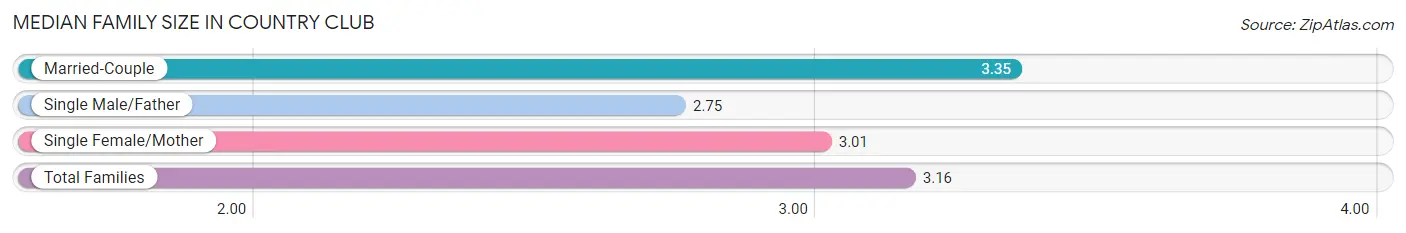
Median Family Size in Country Club
The median family size in Country Club is 3.16 persons per family, with married-couple families (7,113 | 53.8%) accounting for the largest median family size of 3.35 persons per family. On the other hand, single male/father families (1,630 | 12.3%) represent the smallest median family size with 2.75 persons per family.
| Family Type | # Families | Family Size |
| Married-Couple | 7,113 (53.8%) | 3.35 |
| Single Male/Father | 1,630 (12.3%) | 2.75 |
| Single Female/Mother | 4,478 (33.9%) | 3.01 |
| Total Families | 13,221 (100.0%) | 3.16 |
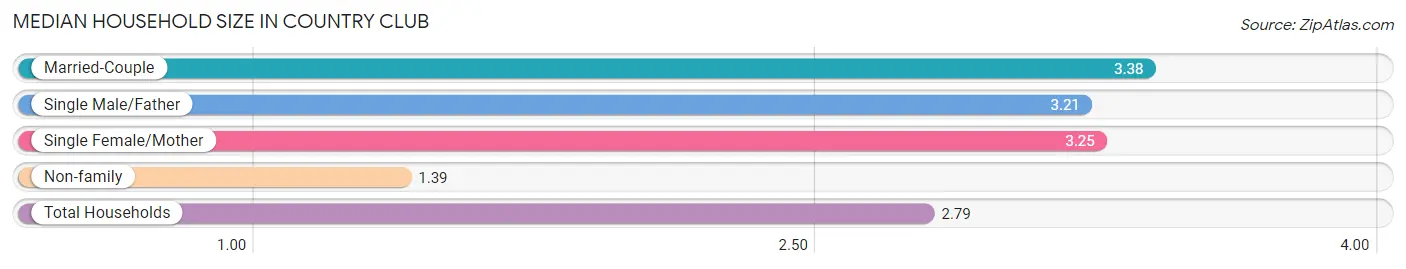
Median Household Size in Country Club
The median household size in Country Club is 2.79 persons per household, with married-couple households (7,113 | 39.0%) accounting for the largest median household size of 3.38 persons per household. non-family households (5,015 | 27.5%) represent the smallest median household size with 1.39 persons per household.
| Household Type | # Households | Household Size |
| Married-Couple | 7,113 (39.0%) | 3.38 |
| Single Male/Father | 1,630 (8.9%) | 3.21 |
| Single Female/Mother | 4,478 (24.6%) | 3.25 |
| Non-family | 5,015 (27.5%) | 1.39 |
| Total Households | 18,236 (100.0%) | 2.79 |
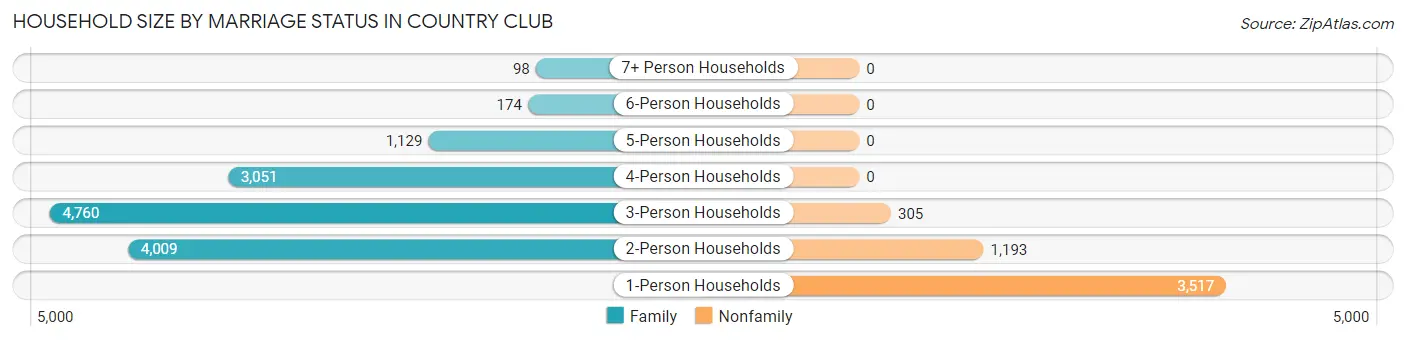
Household Size by Marriage Status in Country Club
Out of a total of 18,236 households in Country Club, 13,221 (72.5%) are family households, while 5,015 (27.5%) are nonfamily households. The most numerous type of family households are 3-person households, comprising 4,760, and the most common type of nonfamily households are 1-person households, comprising 3,517.
| Household Size | Family Households | Nonfamily Households |
| 1-Person Households | - | 3,517 (19.3%) |
| 2-Person Households | 4,009 (22.0%) | 1,193 (6.5%) |
| 3-Person Households | 4,760 (26.1%) | 305 (1.7%) |
| 4-Person Households | 3,051 (16.7%) | 0 (0.0%) |
| 5-Person Households | 1,129 (6.2%) | 0 (0.0%) |
| 6-Person Households | 174 (0.9%) | 0 (0.0%) |
| 7+ Person Households | 98 (0.5%) | 0 (0.0%) |
| Total | 13,221 (72.5%) | 5,015 (27.5%) |
Female Fertility in Country Club
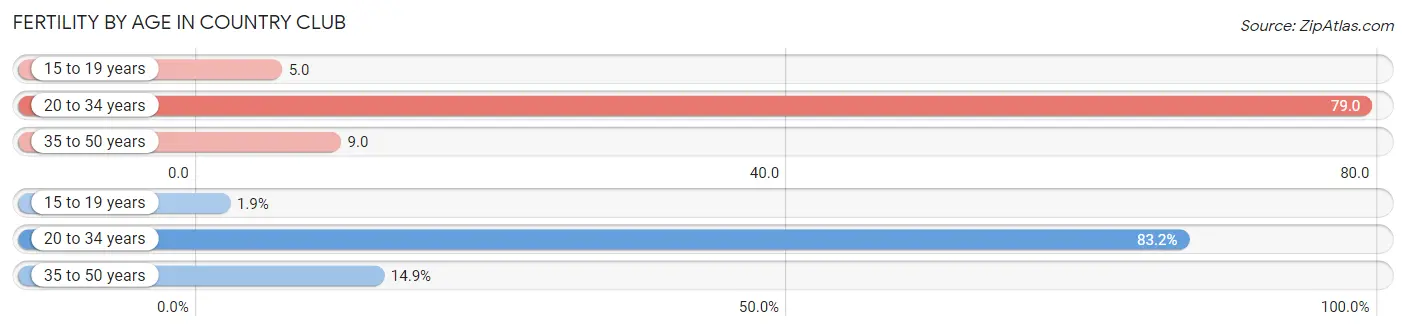
Fertility by Age in Country Club
Average fertility rate in Country Club is 33.0 births per 1,000 women. Women in the age bracket of 20 to 34 years have the highest fertility rate with 79.0 births per 1,000 women. Women in the age bracket of 20 to 34 years acount for 83.2% of all women with births.
| Age Bracket | Women with Births | Births / 1,000 Women |
| 15 to 19 years | 8 (1.9%) | 5.0 |
| 20 to 34 years | 357 (83.2%) | 79.0 |
| 35 to 50 years | 64 (14.9%) | 9.0 |
| Total | 429 (100.0%) | 33.0 |
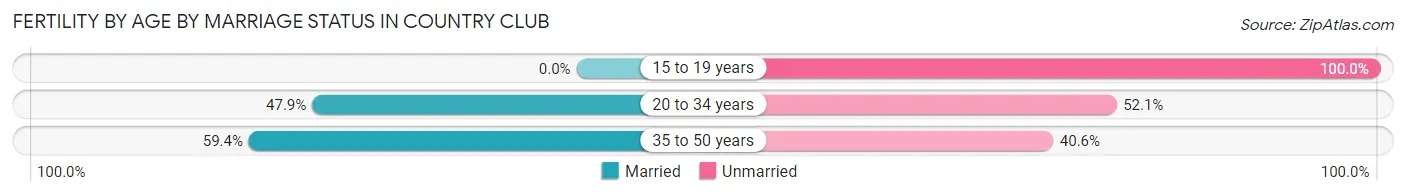
Fertility by Age by Marriage Status in Country Club
48.7% of women with births (429) in Country Club are married. The highest percentage of unmarried women with births falls into 15 to 19 years age bracket with 100.0% of them unmarried at the time of birth, while the lowest percentage of unmarried women with births belong to 35 to 50 years age bracket with 40.6% of them unmarried.
| Age Bracket | Married | Unmarried |
| 15 to 19 years | 0 (0.0%) | 8 (100.0%) |
| 20 to 34 years | 171 (47.9%) | 186 (52.1%) |
| 35 to 50 years | 38 (59.4%) | 26 (40.6%) |
| Total | 209 (48.7%) | 220 (51.3%) |
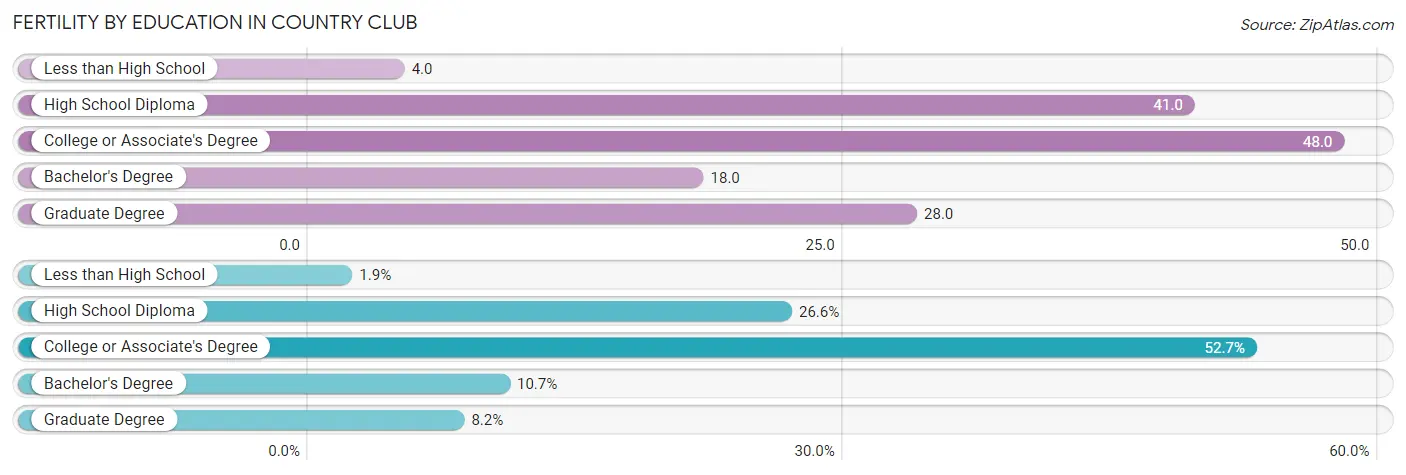
Fertility by Education in Country Club
Average fertility rate in Country Club is 33.0 births per 1,000 women. Women with the education attainment of college or associate's degree have the highest fertility rate of 48.0 births per 1,000 women, while women with the education attainment of less than high school have the lowest fertility at 4.0 births per 1,000 women. Women with the education attainment of college or associate's degree represent 52.7% of all women with births.
| Educational Attainment | Women with Births | Births / 1,000 Women |
| Less than High School | 8 (1.9%) | 4.0 |
| High School Diploma | 114 (26.6%) | 41.0 |
| College or Associate's Degree | 226 (52.7%) | 48.0 |
| Bachelor's Degree | 46 (10.7%) | 18.0 |
| Graduate Degree | 35 (8.2%) | 28.0 |
| Total | 429 (100.0%) | 33.0 |
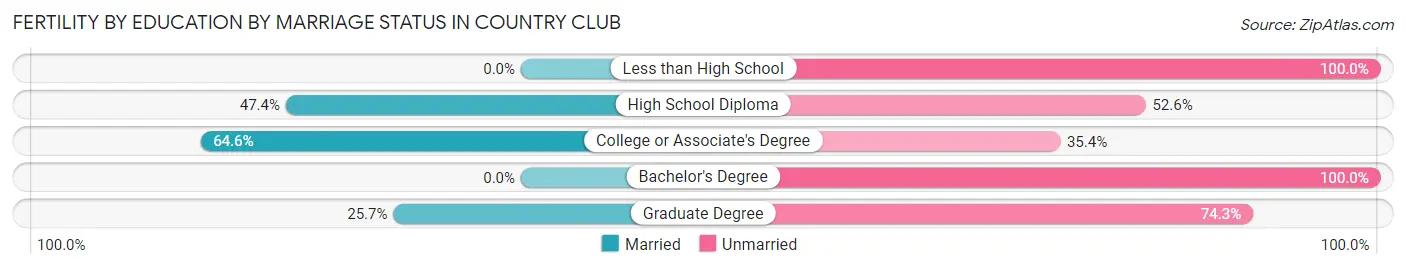
Fertility by Education by Marriage Status in Country Club
51.3% of women with births in Country Club are unmarried. Women with the educational attainment of college or associate's degree are most likely to be married with 64.6% of them married at childbirth, while women with the educational attainment of less than high school are least likely to be married with 100.0% of them unmarried at childbirth.
| Educational Attainment | Married | Unmarried |
| Less than High School | 0 (0.0%) | 8 (100.0%) |
| High School Diploma | 54 (47.4%) | 60 (52.6%) |
| College or Associate's Degree | 146 (64.6%) | 80 (35.4%) |
| Bachelor's Degree | 0 (0.0%) | 46 (100.0%) |
| Graduate Degree | 9 (25.7%) | 26 (74.3%) |
| Total | 209 (48.7%) | 220 (51.3%) |
Income in Country Club
Income Overview in Country Club
Per Capita Income in Country Club is $28,902, while median incomes of families and households are $67,733 and $66,140 respectively.
| Characteristic | Number | Measure |
| Per Capita Income | 50,975 | $28,902 |
| Median Family Income | 13,221 | $67,733 |
| Mean Family Income | 13,221 | $79,116 |
| Median Household Income | 18,236 | $66,140 |
| Mean Household Income | 18,236 | $77,696 |
| Income Deficit | 13,221 | $10,836 |
| Wage / Income Gap (%) | 50,975 | 18.14% |
| Wage / Income Gap ($) | 50,975 | 81.86¢ per $1 |
| Gini / Inequality Index | 50,975 | 0.40 |
Earnings by Sex in Country Club
Average Earnings in Country Club are $34,840, $37,502 for men and $30,699 for women, a difference of 18.1%.
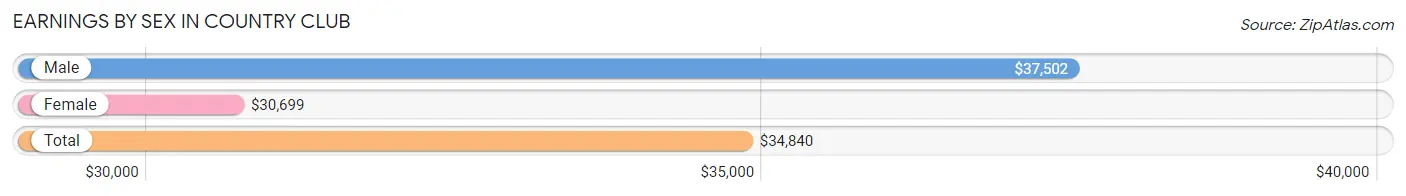
| Sex | Number | Average Earnings |
| Male | 15,223 (50.8%) | $37,502 |
| Female | 14,766 (49.2%) | $30,699 |
| Total | 29,989 (100.0%) | $34,840 |
Earnings by Sex by Income Bracket in Country Club
The most common earnings brackets in Country Club are $30,000 to $34,999 for men (1,516 | 10.0%) and $25,000 to $29,999 for women (1,469 | 10.0%).
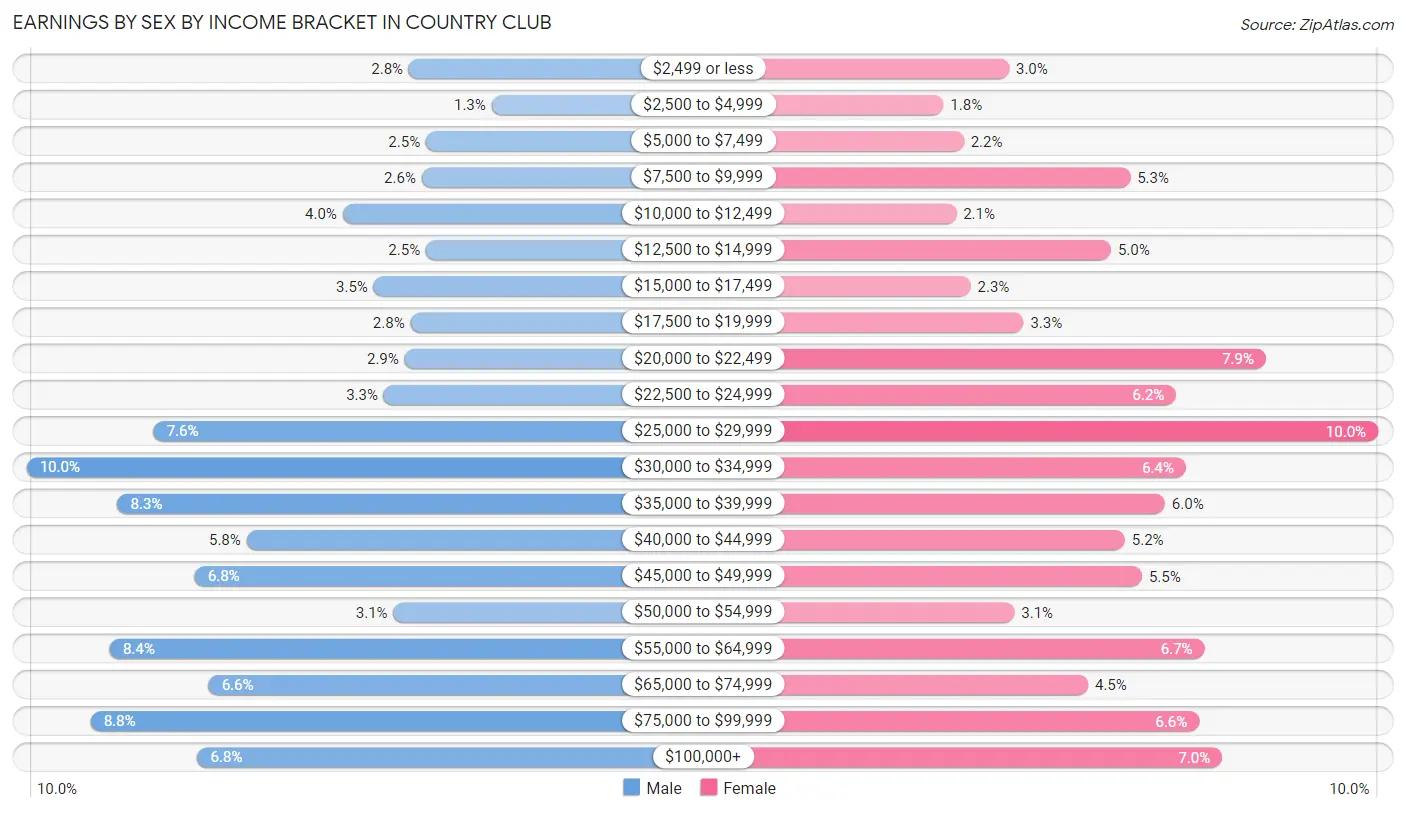
| Income | Male | Female |
| $2,499 or less | 427 (2.8%) | 449 (3.0%) |
| $2,500 to $4,999 | 190 (1.3%) | 268 (1.8%) |
| $5,000 to $7,499 | 377 (2.5%) | 323 (2.2%) |
| $7,500 to $9,999 | 389 (2.6%) | 784 (5.3%) |
| $10,000 to $12,499 | 615 (4.0%) | 302 (2.1%) |
| $12,500 to $14,999 | 378 (2.5%) | 731 (5.0%) |
| $15,000 to $17,499 | 526 (3.5%) | 343 (2.3%) |
| $17,500 to $19,999 | 421 (2.8%) | 489 (3.3%) |
| $20,000 to $22,499 | 439 (2.9%) | 1,159 (7.9%) |
| $22,500 to $24,999 | 498 (3.3%) | 911 (6.2%) |
| $25,000 to $29,999 | 1,154 (7.6%) | 1,469 (10.0%) |
| $30,000 to $34,999 | 1,516 (10.0%) | 937 (6.4%) |
| $35,000 to $39,999 | 1,257 (8.3%) | 880 (6.0%) |
| $40,000 to $44,999 | 889 (5.8%) | 770 (5.2%) |
| $45,000 to $49,999 | 1,037 (6.8%) | 817 (5.5%) |
| $50,000 to $54,999 | 471 (3.1%) | 463 (3.1%) |
| $55,000 to $64,999 | 1,279 (8.4%) | 990 (6.7%) |
| $65,000 to $74,999 | 997 (6.6%) | 668 (4.5%) |
| $75,000 to $99,999 | 1,334 (8.8%) | 975 (6.6%) |
| $100,000+ | 1,029 (6.8%) | 1,038 (7.0%) |
| Total | 15,223 (100.0%) | 14,766 (100.0%) |
Earnings by Sex by Educational Attainment in Country Club
Average earnings in Country Club are $40,566 for men and $33,531 for women, a difference of 17.3%. Men with an educational attainment of graduate degree enjoy the highest average annual earnings of $58,668, while those with less than high school education earn the least with $28,019. Women with an educational attainment of graduate degree earn the most with the average annual earnings of $55,580, while those with high school diploma education have the smallest earnings of $23,586.
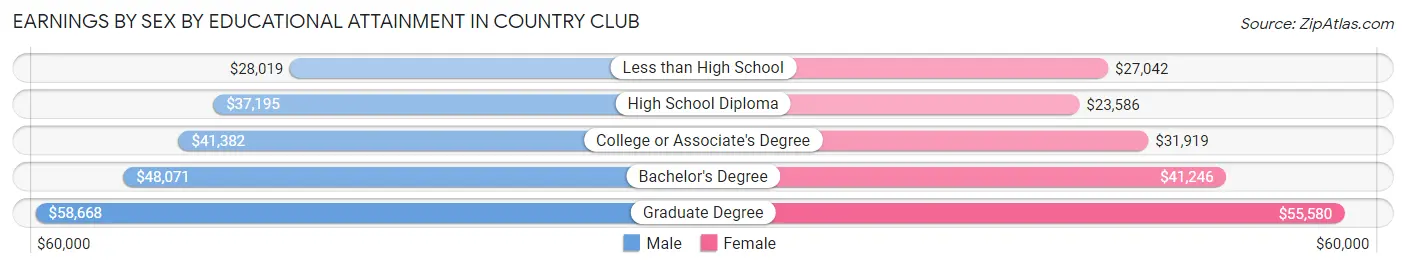
| Educational Attainment | Male Income | Female Income |
| Less than High School | $28,019 | $27,042 |
| High School Diploma | $37,195 | $23,586 |
| College or Associate's Degree | $41,382 | $31,919 |
| Bachelor's Degree | $48,071 | $41,246 |
| Graduate Degree | $58,668 | $55,580 |
| Total | $40,566 | $33,531 |
Family Income in Country Club
Family Income Brackets in Country Club
According to the Country Club family income data, there are 3,001 families falling into the $50,000 to $74,999 income range, which is the most common income bracket and makes up 22.7% of all families. Conversely, the less than $10,000 income bracket is the least frequent group with only 555 families (4.2%) belonging to this category.
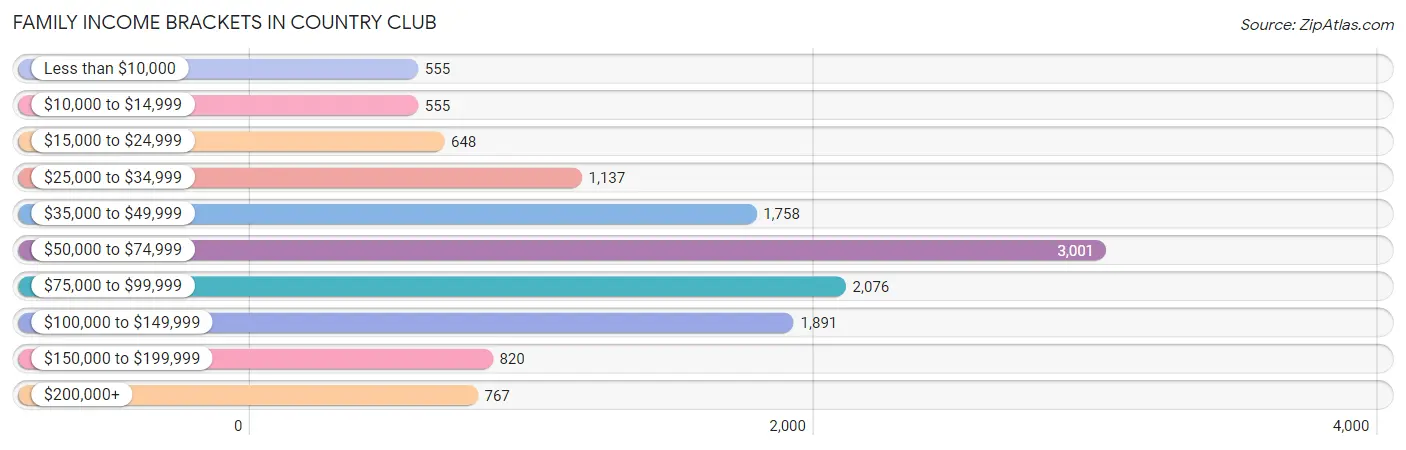
| Income Bracket | # Families | % Families |
| Less than $10,000 | 555 | 4.2% |
| $10,000 to $14,999 | 555 | 4.2% |
| $15,000 to $24,999 | 648 | 4.9% |
| $25,000 to $34,999 | 1,137 | 8.6% |
| $35,000 to $49,999 | 1,758 | 13.3% |
| $50,000 to $74,999 | 3,001 | 22.7% |
| $75,000 to $99,999 | 2,076 | 15.7% |
| $100,000 to $149,999 | 1,891 | 14.3% |
| $150,000 to $199,999 | 820 | 6.2% |
| $200,000+ | 767 | 5.8% |
Family Income by Famaliy Size in Country Club
5-person families (869 | 6.6%) account for the highest median family income in Country Club with $100,327 per family, while 2-person families (5,023 | 38.0%) have the highest median income of $29,790 per family member.
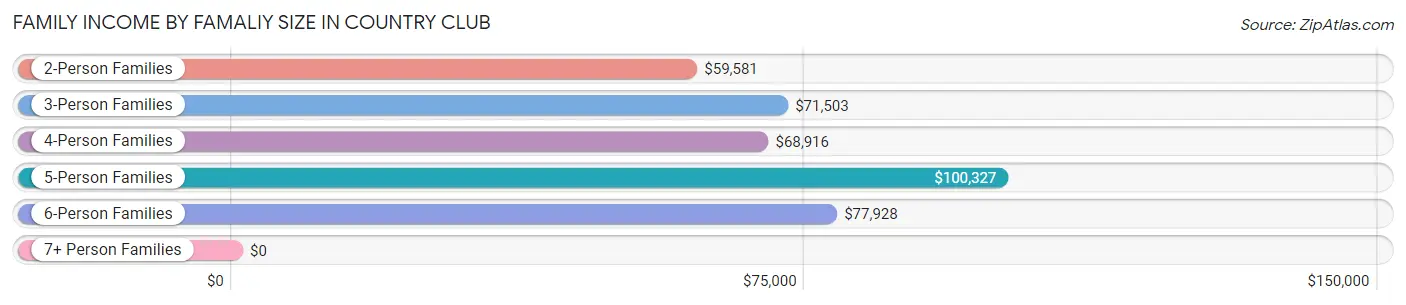
| Income Bracket | # Families | Median Income |
| 2-Person Families | 5,023 (38.0%) | $59,581 |
| 3-Person Families | 4,401 (33.3%) | $71,503 |
| 4-Person Families | 2,688 (20.3%) | $68,916 |
| 5-Person Families | 869 (6.6%) | $100,327 |
| 6-Person Families | 153 (1.2%) | $77,928 |
| 7+ Person Families | 87 (0.7%) | $0 |
| Total | 13,221 (100.0%) | $67,733 |
Family Income by Number of Earners in Country Club
The median family income in Country Club is $67,733, with families comprising 3+ earners (1,828) having the highest median family income of $96,442, while families with no earners (1,137) have the lowest median family income of $12,030, accounting for 13.8% and 8.6% of families, respectively.
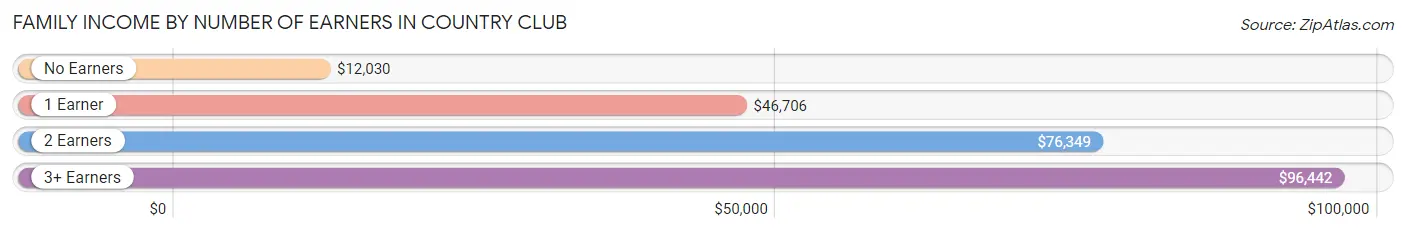
| Number of Earners | # Families | Median Income |
| No Earners | 1,137 (8.6%) | $12,030 |
| 1 Earner | 4,375 (33.1%) | $46,706 |
| 2 Earners | 5,881 (44.5%) | $76,349 |
| 3+ Earners | 1,828 (13.8%) | $96,442 |
| Total | 13,221 (100.0%) | $67,733 |
Household Income in Country Club
Household Income Brackets in Country Club
With 3,629 households falling in the category, the $50,000 to $74,999 income range is the most frequent in Country Club, accounting for 19.9% of all households. In contrast, only 584 households (3.2%) fall into the $10,000 to $14,999 income bracket, making it the least populous group.
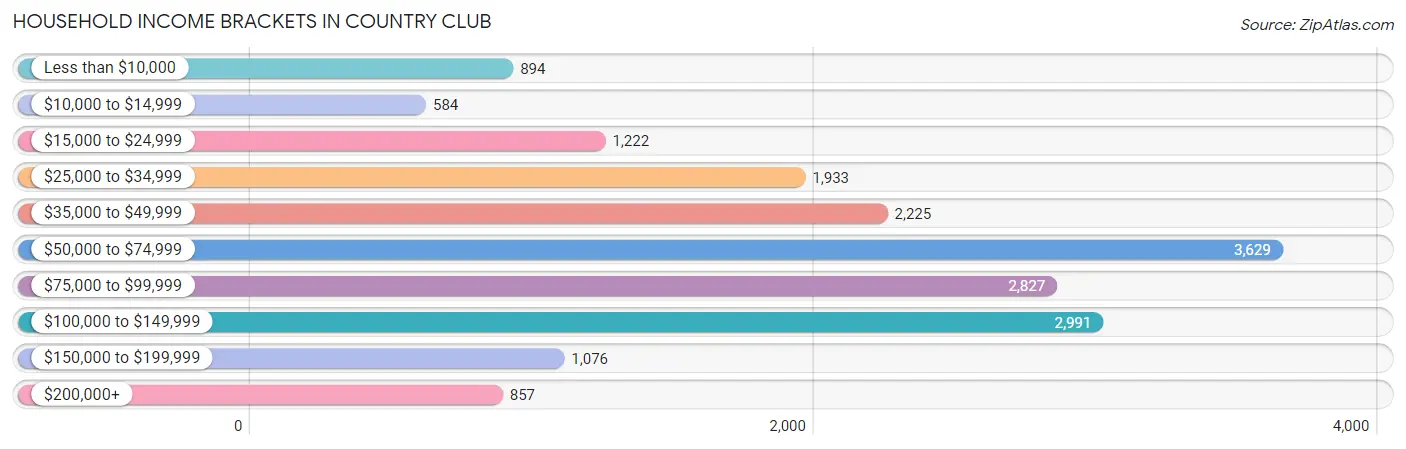
| Income Bracket | # Households | % Households |
| Less than $10,000 | 894 | 4.9% |
| $10,000 to $14,999 | 584 | 3.2% |
| $15,000 to $24,999 | 1,222 | 6.7% |
| $25,000 to $34,999 | 1,933 | 10.6% |
| $35,000 to $49,999 | 2,225 | 12.2% |
| $50,000 to $74,999 | 3,629 | 19.9% |
| $75,000 to $99,999 | 2,827 | 15.5% |
| $100,000 to $149,999 | 2,991 | 16.4% |
| $150,000 to $199,999 | 1,076 | 5.9% |
| $200,000+ | 857 | 4.7% |
Household Income by Householder Age in Country Club
The median household income in Country Club is $66,140, with the highest median household income of $70,942 found in the 25 to 44 years age bracket for the primary householder. A total of 7,111 households (39.0%) fall into this category. Meanwhile, the 15 to 24 years age bracket for the primary householder has the lowest median household income of $36,157, with 280 households (1.5%) in this group.
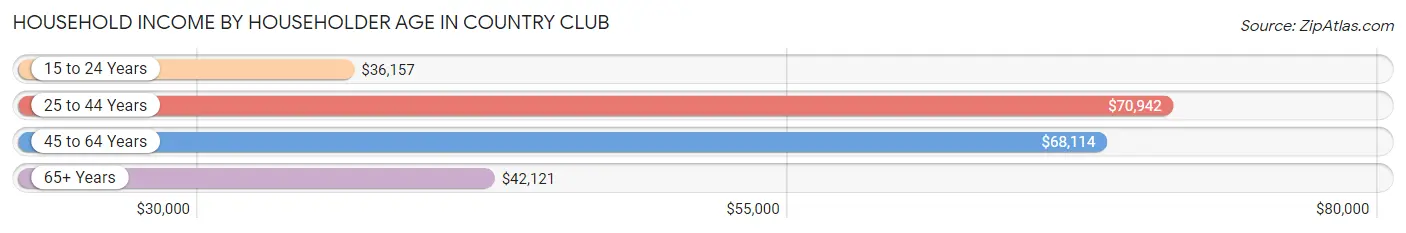
| Income Bracket | # Households | Median Income |
| 15 to 24 Years | 280 (1.5%) | $36,157 |
| 25 to 44 Years | 7,111 (39.0%) | $70,942 |
| 45 to 64 Years | 7,795 (42.7%) | $68,114 |
| 65+ Years | 3,050 (16.7%) | $42,121 |
| Total | 18,236 (100.0%) | $66,140 |
Poverty in Country Club
Income Below Poverty by Sex and Age in Country Club
With 14.6% poverty level for males and 12.4% for females among the residents of Country Club, 5 year old males and 25 to 34 year old females are the most vulnerable to poverty, with 62 males (34.4%) and 543 females (19.2%) in their respective age groups living below the poverty level.
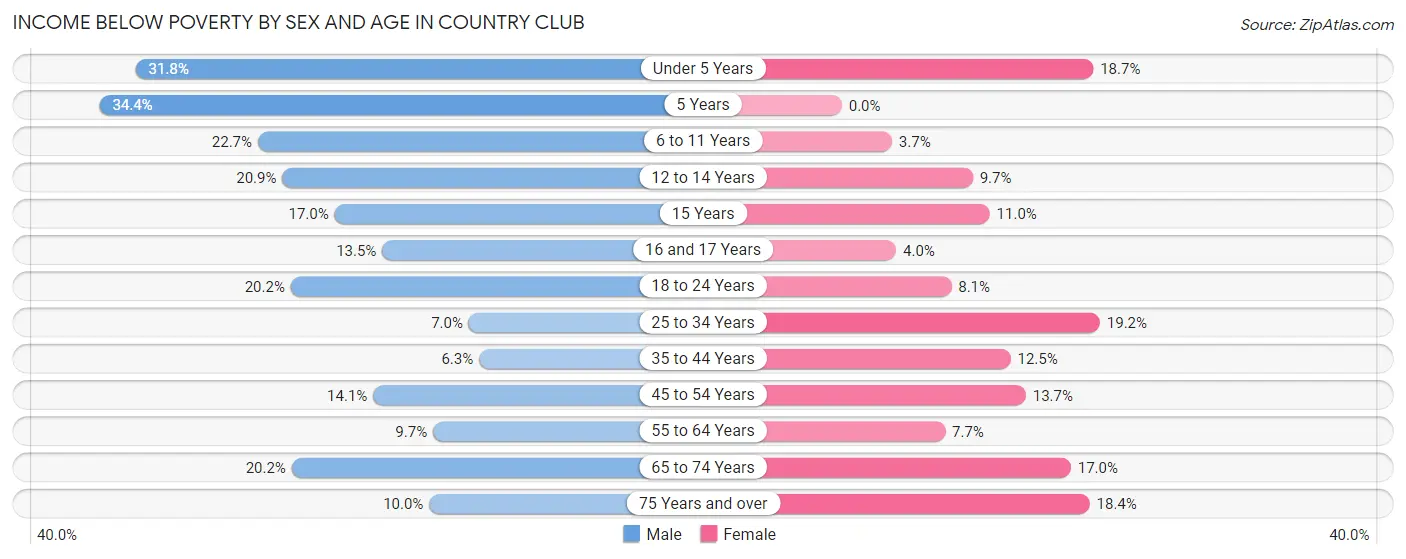
| Age Bracket | Male | Female |
| Under 5 Years | 432 (31.8%) | 199 (18.7%) |
| 5 Years | 62 (34.4%) | 0 (0.0%) |
| 6 to 11 Years | 493 (22.7%) | 53 (3.7%) |
| 12 to 14 Years | 197 (20.9%) | 106 (9.7%) |
| 15 Years | 70 (17.0%) | 48 (11.0%) |
| 16 and 17 Years | 103 (13.5%) | 28 (4.0%) |
| 18 to 24 Years | 557 (20.2%) | 187 (8.1%) |
| 25 to 34 Years | 237 (7.0%) | 543 (19.2%) |
| 35 to 44 Years | 250 (6.3%) | 584 (12.5%) |
| 45 to 54 Years | 544 (14.1%) | 531 (13.7%) |
| 55 to 64 Years | 233 (9.7%) | 291 (7.7%) |
| 65 to 74 Years | 332 (20.2%) | 347 (17.0%) |
| 75 Years and over | 79 (10.0%) | 298 (18.4%) |
| Total | 3,589 (14.6%) | 3,215 (12.4%) |
Income Above Poverty by Sex and Age in Country Club
According to the poverty statistics in Country Club, males aged 35 to 44 years and females aged 5 years are the age groups that are most secure financially, with 93.7% of males and 100.0% of females in these age groups living above the poverty line.
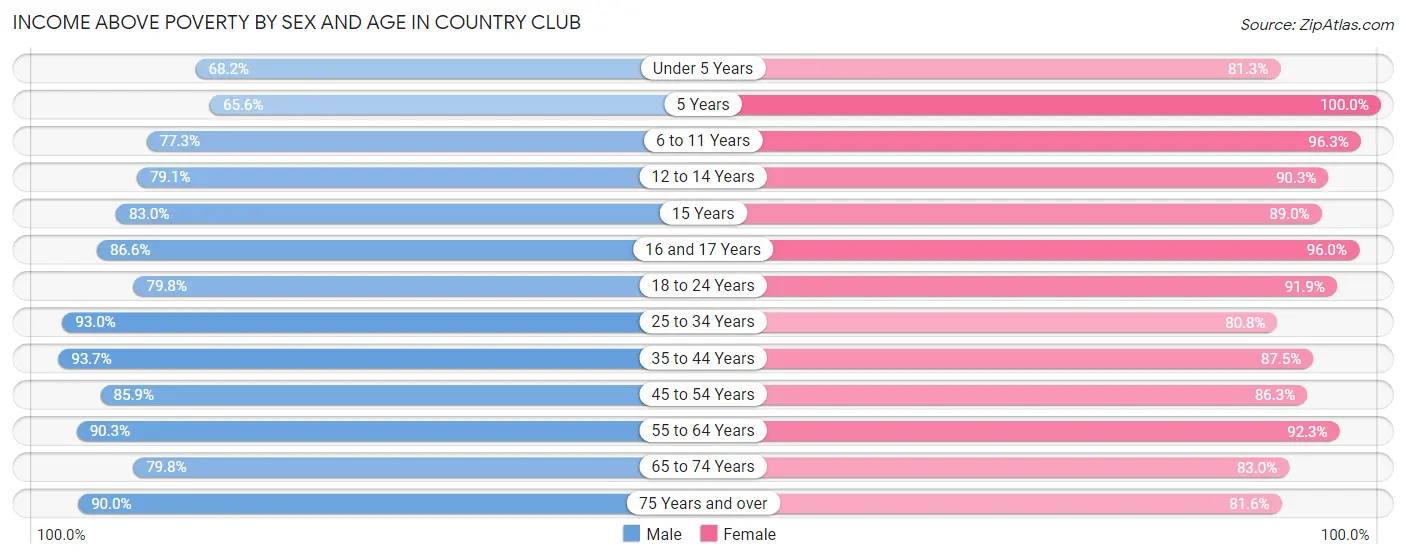
| Age Bracket | Male | Female |
| Under 5 Years | 928 (68.2%) | 867 (81.3%) |
| 5 Years | 118 (65.6%) | 167 (100.0%) |
| 6 to 11 Years | 1,681 (77.3%) | 1,373 (96.3%) |
| 12 to 14 Years | 747 (79.1%) | 984 (90.3%) |
| 15 Years | 342 (83.0%) | 389 (89.0%) |
| 16 and 17 Years | 663 (86.6%) | 667 (96.0%) |
| 18 to 24 Years | 2,195 (79.8%) | 2,114 (91.9%) |
| 25 to 34 Years | 3,140 (93.0%) | 2,291 (80.8%) |
| 35 to 44 Years | 3,741 (93.7%) | 4,075 (87.5%) |
| 45 to 54 Years | 3,310 (85.9%) | 3,355 (86.3%) |
| 55 to 64 Years | 2,173 (90.3%) | 3,505 (92.3%) |
| 65 to 74 Years | 1,314 (79.8%) | 1,694 (83.0%) |
| 75 Years and over | 714 (90.0%) | 1,322 (81.6%) |
| Total | 21,066 (85.4%) | 22,803 (87.6%) |
Income Below Poverty Among Married-Couple Families in Country Club
The poverty statistics for married-couple families in Country Club show that 8.7% or 617 of the total 7,113 families live below the poverty line. Families with 1 or 2 children have the highest poverty rate of 11.5%, comprising of 407 families. On the other hand, families with 3 or 4 children have the lowest poverty rate of 0.0%, which includes 0 families.
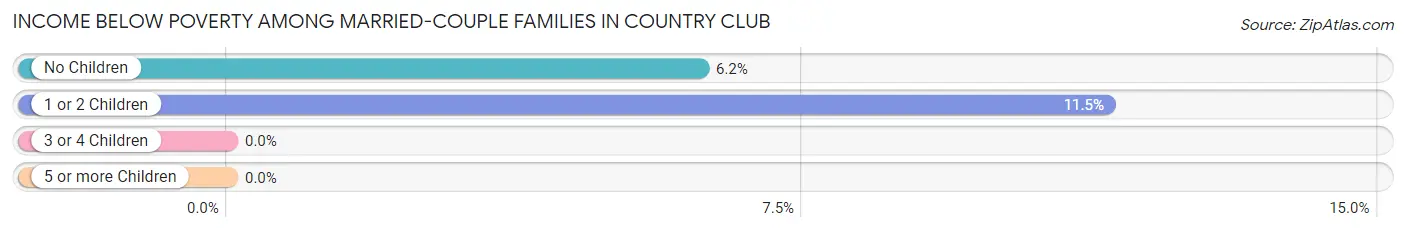
| Children | Above Poverty | Below Poverty |
| No Children | 3,206 (93.9%) | 210 (6.1%) |
| 1 or 2 Children | 3,146 (88.5%) | 407 (11.5%) |
| 3 or 4 Children | 144 (100.0%) | 0 (0.0%) |
| 5 or more Children | 0 (0.0%) | 0 (0.0%) |
| Total | 6,496 (91.3%) | 617 (8.7%) |
Income Below Poverty Among Single-Parent Households in Country Club
According to the poverty data in Country Club, 9.4% or 153 single-father households and 17.5% or 782 single-mother households are living below the poverty line. Among single-father households, those with 1 or 2 children have the highest poverty rate, with 153 households (16.9%) experiencing poverty. Likewise, among single-mother households, those with 1 or 2 children have the highest poverty rate, with 432 households (21.9%) falling below the poverty line.
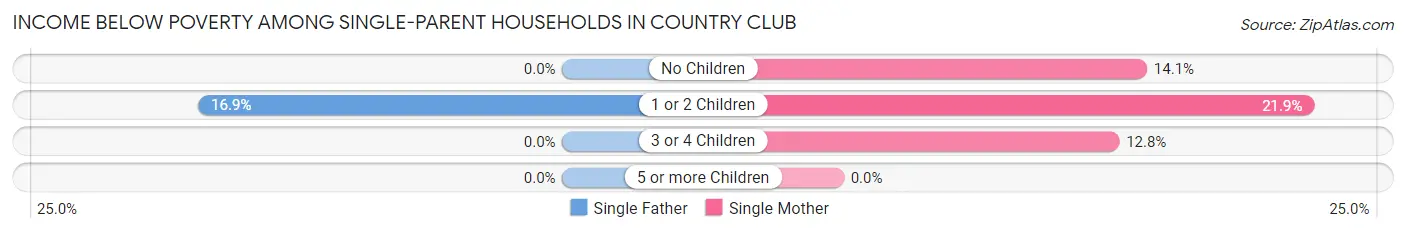
| Children | Single Father | Single Mother |
| No Children | 0 (0.0%) | 311 (14.1%) |
| 1 or 2 Children | 153 (16.9%) | 432 (21.9%) |
| 3 or 4 Children | 0 (0.0%) | 39 (12.8%) |
| 5 or more Children | 0 (0.0%) | 0 (0.0%) |
| Total | 153 (9.4%) | 782 (17.5%) |
Income Below Poverty Among Married-Couple vs Single-Parent Households in Country Club
The poverty data for Country Club shows that 617 of the married-couple family households (8.7%) and 935 of the single-parent households (15.3%) are living below the poverty level. Within the married-couple family households, those with 1 or 2 children have the highest poverty rate, with 407 households (11.5%) falling below the poverty line. Among the single-parent households, those with 1 or 2 children have the highest poverty rate, with 585 household (20.3%) living below poverty.
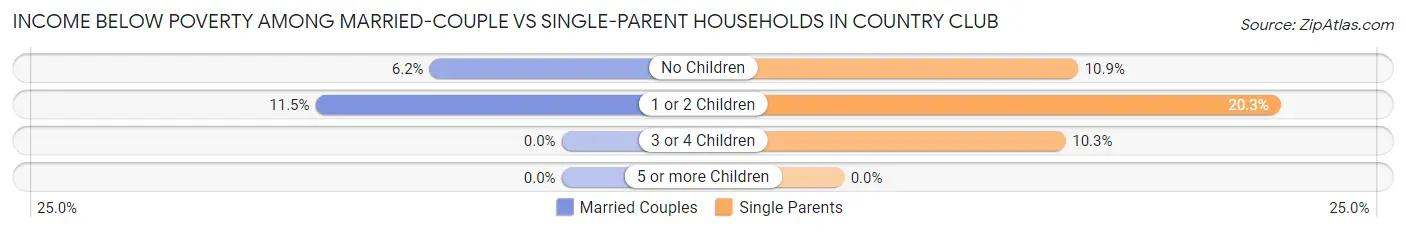
| Children | Married-Couple Families | Single-Parent Households |
| No Children | 210 (6.1%) | 311 (10.9%) |
| 1 or 2 Children | 407 (11.5%) | 585 (20.3%) |
| 3 or 4 Children | 0 (0.0%) | 39 (10.3%) |
| 5 or more Children | 0 (0.0%) | 0 (0.0%) |
| Total | 617 (8.7%) | 935 (15.3%) |
Employment Characteristics in Country Club
Employment by Class of Employer in Country Club
Among the 27,782 employed individuals in Country Club, private company employees (21,490 | 77.3%), self-employed (not incorporated) (1,916 | 6.9%), and local government employees (1,625 | 5.9%) make up the most common classes of employment.
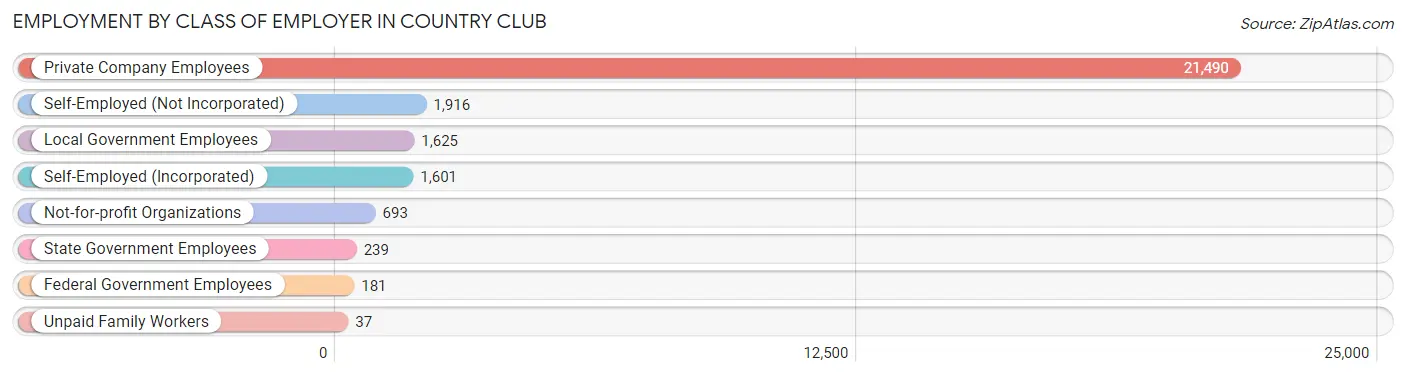
| Employer Class | # Employees | % Employees |
| Private Company Employees | 21,490 | 77.3% |
| Self-Employed (Incorporated) | 1,601 | 5.8% |
| Self-Employed (Not Incorporated) | 1,916 | 6.9% |
| Not-for-profit Organizations | 693 | 2.5% |
| Local Government Employees | 1,625 | 5.9% |
| State Government Employees | 239 | 0.9% |
| Federal Government Employees | 181 | 0.6% |
| Unpaid Family Workers | 37 | 0.1% |
| Total | 27,782 | 100.0% |
Employment Status by Age in Country Club
According to the labor force statistics for Country Club, out of the total population over 16 years of age (41,563), 71.0% or 29,510 individuals are in the labor force, with 4.6% or 1,357 of them unemployed. The age group with the highest labor force participation rate is 35 to 44 years, with 92.5% or 8,001 individuals in the labor force. Within the labor force, the 16 to 19 years age range has the highest percentage of unemployed individuals, with 25.7% or 123 of them being unemployed.
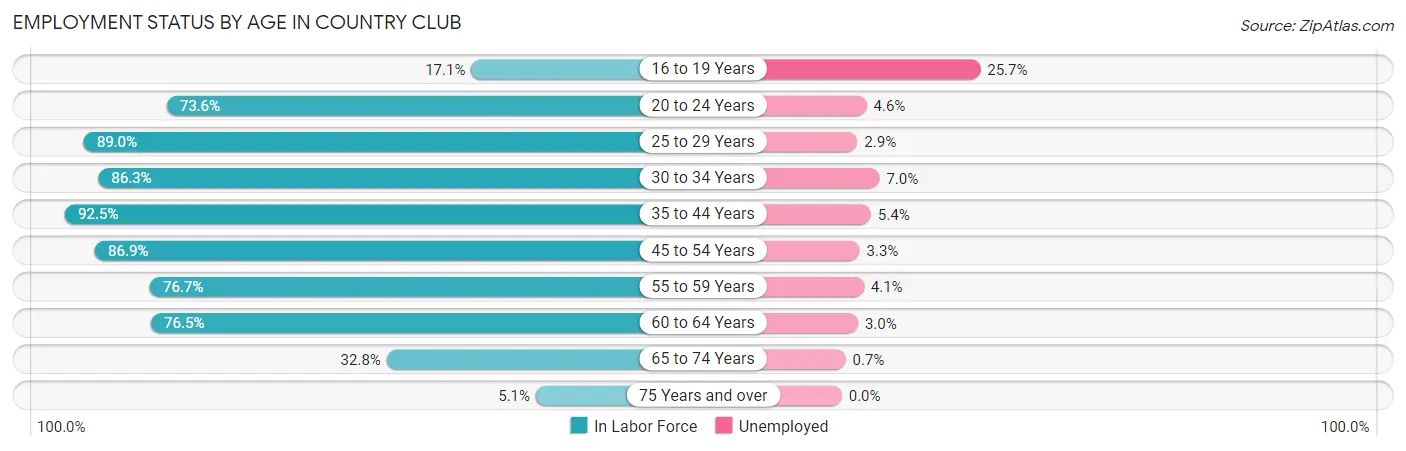
| Age Bracket | In Labor Force | Unemployed |
| 16 to 19 Years | 478 (17.1%) | 123 (25.7%) |
| 20 to 24 Years | 2,736 (73.6%) | 126 (4.6%) |
| 25 to 29 Years | 2,530 (89.0%) | 73 (2.9%) |
| 30 to 34 Years | 2,907 (86.3%) | 203 (7.0%) |
| 35 to 44 Years | 8,001 (92.5%) | 432 (5.4%) |
| 45 to 54 Years | 6,726 (86.9%) | 222 (3.3%) |
| 55 to 59 Years | 2,879 (76.7%) | 118 (4.1%) |
| 60 to 64 Years | 1,891 (76.5%) | 57 (3.0%) |
| 65 to 74 Years | 1,231 (32.8%) | 9 (0.7%) |
| 75 Years and over | 126 (5.1%) | 0 (0.0%) |
| Total | 29,510 (71.0%) | 1,357 (4.6%) |
Employment Status by Educational Attainment in Country Club
According to labor force statistics for Country Club, 86.5% of individuals (24,934) out of the total population between 25 and 64 years of age (28,826) are in the labor force, with 4.4% or 1,097 of them being unemployed. The group with the highest labor force participation rate are those with the educational attainment of bachelor's degree or higher, with 94.3% or 8,708 individuals in the labor force. Within the labor force, individuals with less than high school education have the highest percentage of unemployment, with 9.2% or 175 of them being unemployed.
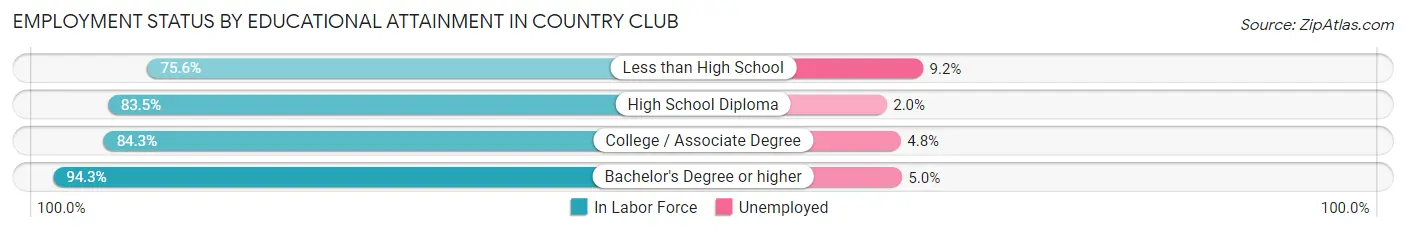
| Educational Attainment | In Labor Force | Unemployed |
| Less than High School | 1,904 (75.6%) | 232 (9.2%) |
| High School Diploma | 6,877 (83.5%) | 165 (2.0%) |
| College / Associate Degree | 7,450 (84.3%) | 424 (4.8%) |
| Bachelor's Degree or higher | 8,708 (94.3%) | 462 (5.0%) |
| Total | 24,934 (86.5%) | 1,268 (4.4%) |
Employment Occupations by Sex in Country Club
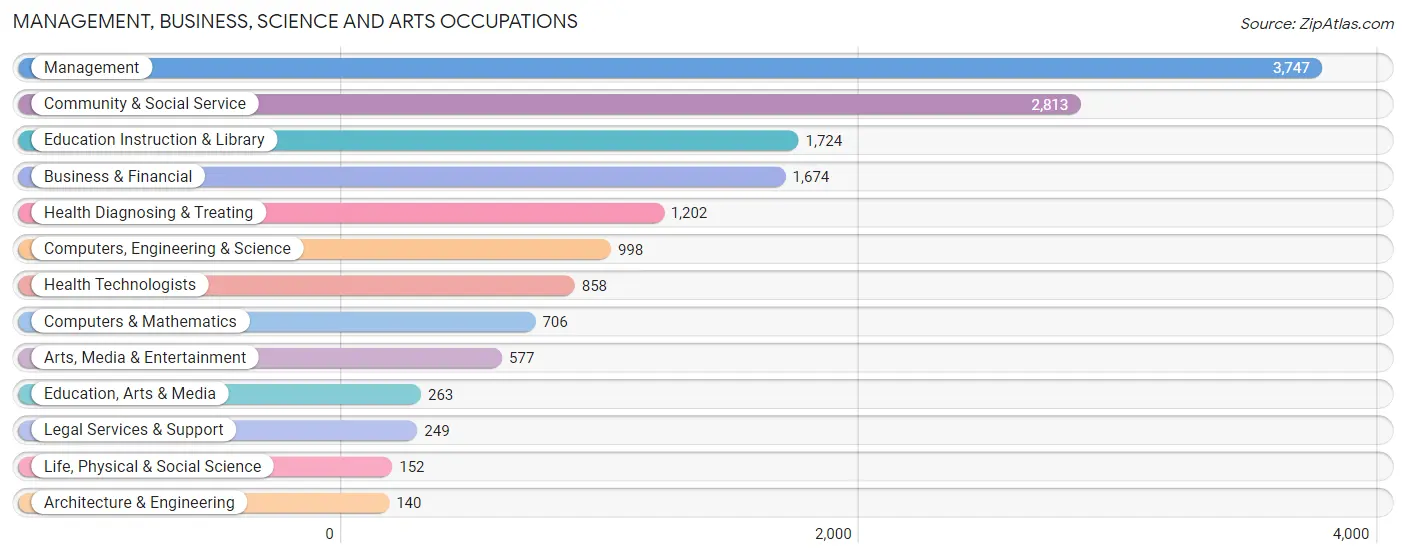
Management, Business, Science and Arts Occupations
The most common Management, Business, Science and Arts occupations in Country Club are Management (3,747 | 13.3%), Community & Social Service (2,813 | 10.0%), Education Instruction & Library (1,724 | 6.1%), Business & Financial (1,674 | 5.9%), and Health Diagnosing & Treating (1,202 | 4.3%).
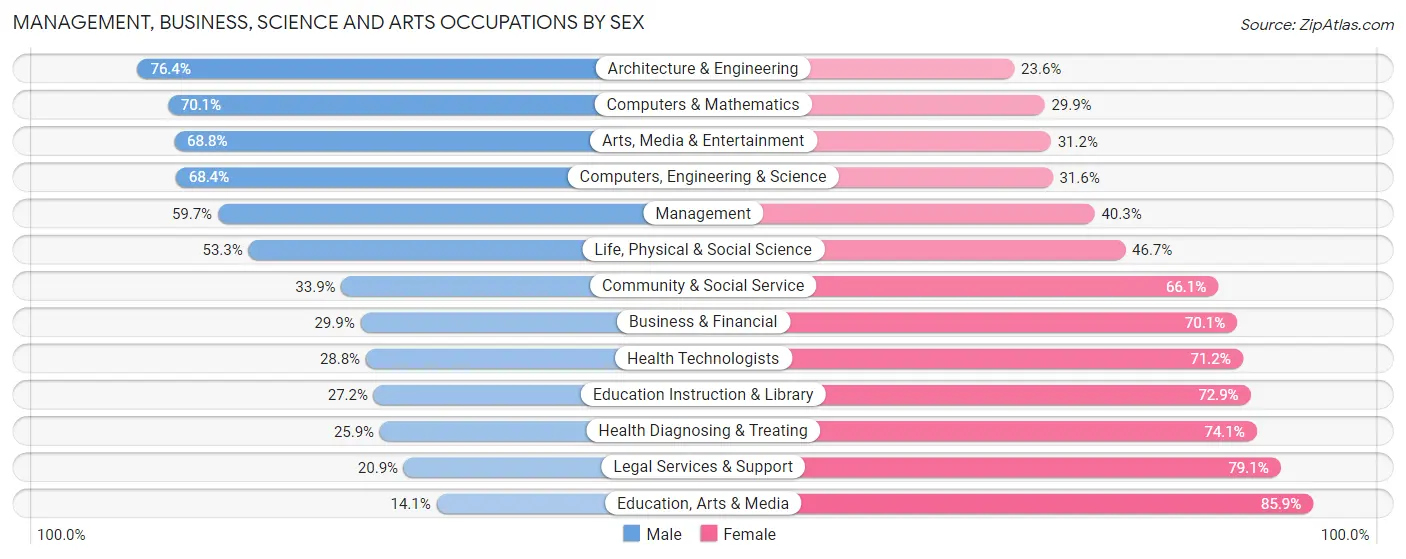
Management, Business, Science and Arts Occupations by Sex
Within the Management, Business, Science and Arts occupations in Country Club, the most male-oriented occupations are Architecture & Engineering (76.4%), Computers & Mathematics (70.1%), and Arts, Media & Entertainment (68.8%), while the most female-oriented occupations are Education, Arts & Media (85.9%), Legal Services & Support (79.1%), and Health Diagnosing & Treating (74.1%).
| Occupation | Male | Female |
| Management | 2,236 (59.7%) | 1,511 (40.3%) |
| Business & Financial | 501 (29.9%) | 1,173 (70.1%) |
| Computers, Engineering & Science | 683 (68.4%) | 315 (31.6%) |
| Computers & Mathematics | 495 (70.1%) | 211 (29.9%) |
| Architecture & Engineering | 107 (76.4%) | 33 (23.6%) |
| Life, Physical & Social Science | 81 (53.3%) | 71 (46.7%) |
| Community & Social Service | 954 (33.9%) | 1,859 (66.1%) |
| Education, Arts & Media | 37 (14.1%) | 226 (85.9%) |
| Legal Services & Support | 52 (20.9%) | 197 (79.1%) |
| Education Instruction & Library | 468 (27.2%) | 1,256 (72.9%) |
| Arts, Media & Entertainment | 397 (68.8%) | 180 (31.2%) |
| Health Diagnosing & Treating | 311 (25.9%) | 891 (74.1%) |
| Health Technologists | 247 (28.8%) | 611 (71.2%) |
| Total (Category) | 4,685 (44.9%) | 5,749 (55.1%) |
| Total (Overall) | 14,565 (51.8%) | 13,569 (48.2%) |
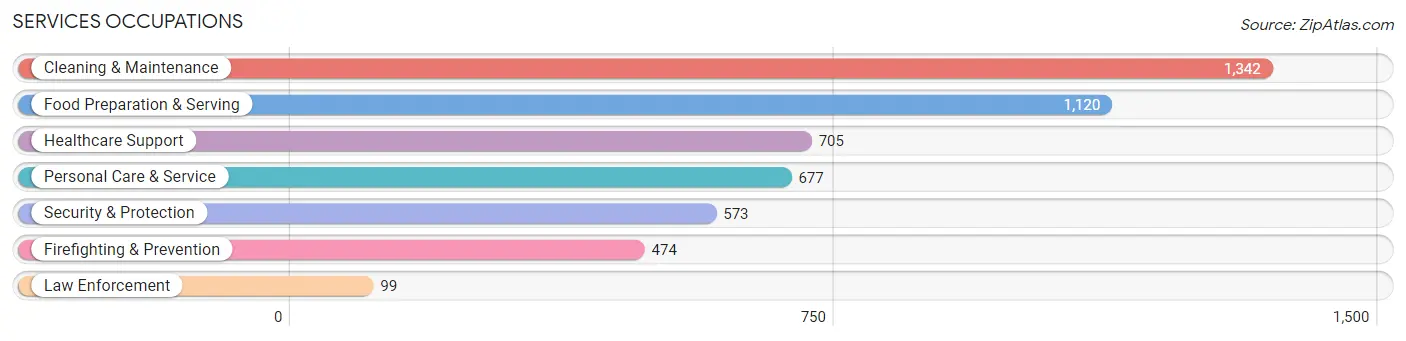
Services Occupations
The most common Services occupations in Country Club are Cleaning & Maintenance (1,342 | 4.8%), Food Preparation & Serving (1,120 | 4.0%), Healthcare Support (705 | 2.5%), Personal Care & Service (677 | 2.4%), and Security & Protection (573 | 2.0%).
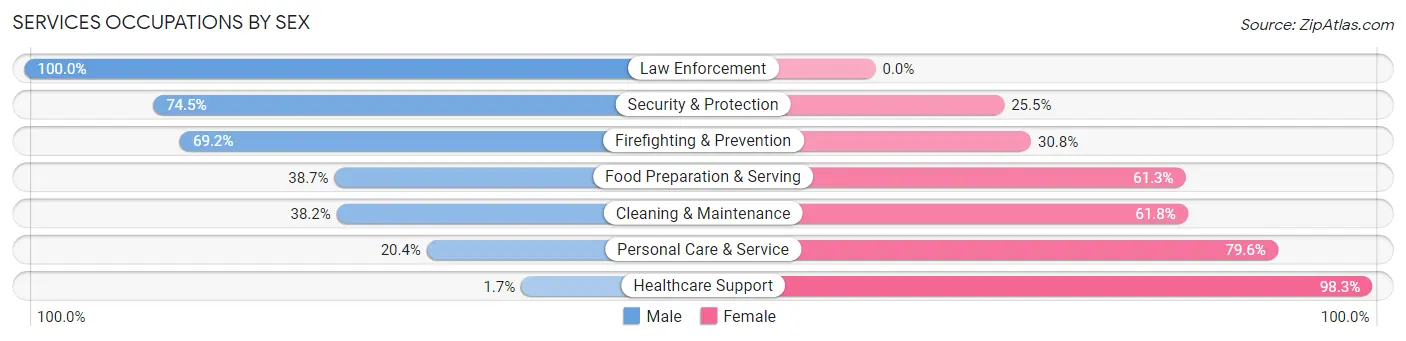
Services Occupations by Sex
Within the Services occupations in Country Club, the most male-oriented occupations are Law Enforcement (100.0%), Security & Protection (74.5%), and Firefighting & Prevention (69.2%), while the most female-oriented occupations are Healthcare Support (98.3%), Personal Care & Service (79.6%), and Cleaning & Maintenance (61.8%).
| Occupation | Male | Female |
| Healthcare Support | 12 (1.7%) | 693 (98.3%) |
| Security & Protection | 427 (74.5%) | 146 (25.5%) |
| Firefighting & Prevention | 328 (69.2%) | 146 (30.8%) |
| Law Enforcement | 99 (100.0%) | 0 (0.0%) |
| Food Preparation & Serving | 433 (38.7%) | 687 (61.3%) |
| Cleaning & Maintenance | 513 (38.2%) | 829 (61.8%) |
| Personal Care & Service | 138 (20.4%) | 539 (79.6%) |
| Total (Category) | 1,523 (34.5%) | 2,894 (65.5%) |
| Total (Overall) | 14,565 (51.8%) | 13,569 (48.2%) |
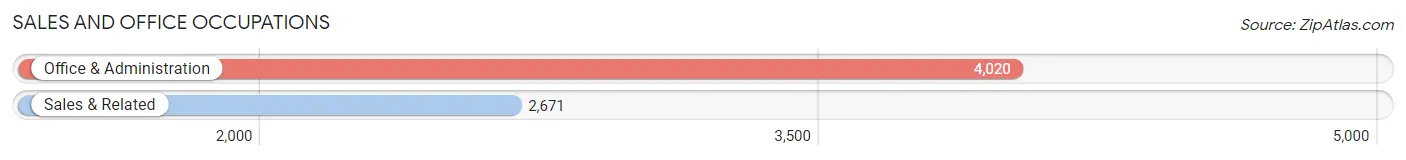
Sales and Office Occupations
The most common Sales and Office occupations in Country Club are Office & Administration (4,020 | 14.3%), and Sales & Related (2,671 | 9.5%).
Sales and Office Occupations by Sex
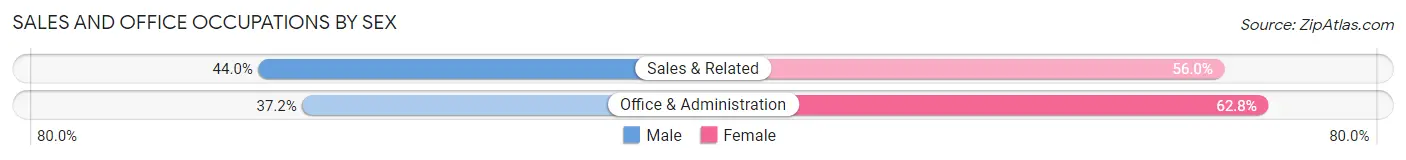
| Occupation | Male | Female |
| Sales & Related | 1,175 (44.0%) | 1,496 (56.0%) |
| Office & Administration | 1,497 (37.2%) | 2,523 (62.8%) |
| Total (Category) | 2,672 (39.9%) | 4,019 (60.1%) |
| Total (Overall) | 14,565 (51.8%) | 13,569 (48.2%) |
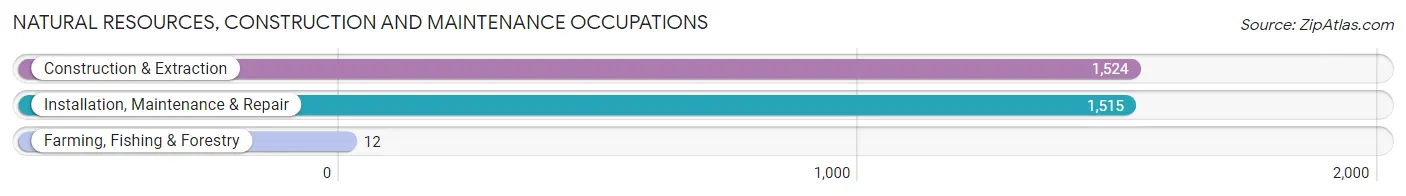
Natural Resources, Construction and Maintenance Occupations
The most common Natural Resources, Construction and Maintenance occupations in Country Club are Construction & Extraction (1,524 | 5.4%), Installation, Maintenance & Repair (1,515 | 5.4%), and Farming, Fishing & Forestry (12 | 0.0%).
Natural Resources, Construction and Maintenance Occupations by Sex
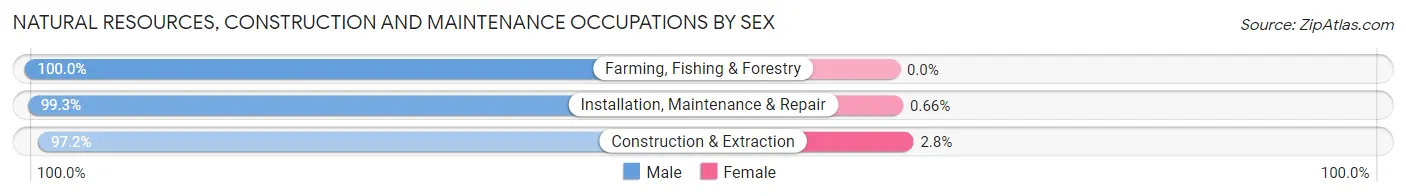
| Occupation | Male | Female |
| Farming, Fishing & Forestry | 12 (100.0%) | 0 (0.0%) |
| Construction & Extraction | 1,481 (97.2%) | 43 (2.8%) |
| Installation, Maintenance & Repair | 1,505 (99.3%) | 10 (0.7%) |
| Total (Category) | 2,998 (98.3%) | 53 (1.7%) |
| Total (Overall) | 14,565 (51.8%) | 13,569 (48.2%) |
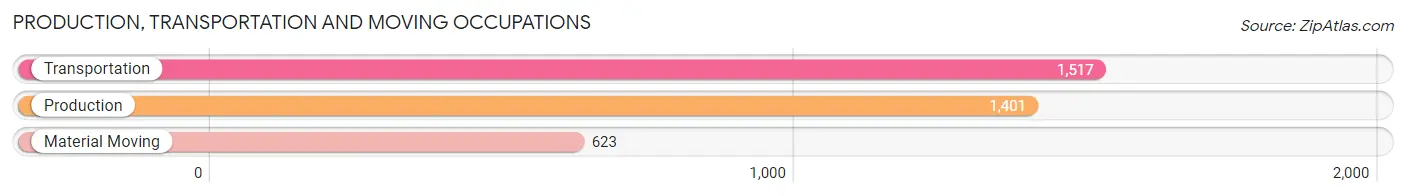
Production, Transportation and Moving Occupations
The most common Production, Transportation and Moving occupations in Country Club are Transportation (1,517 | 5.4%), Production (1,401 | 5.0%), and Material Moving (623 | 2.2%).
Production, Transportation and Moving Occupations by Sex
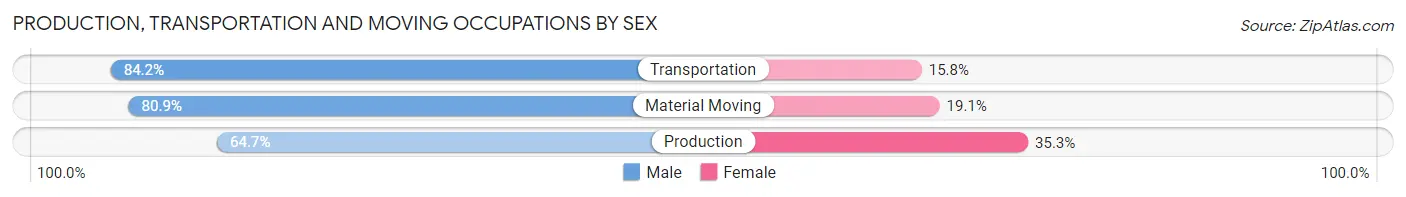
| Occupation | Male | Female |
| Production | 906 (64.7%) | 495 (35.3%) |
| Transportation | 1,277 (84.2%) | 240 (15.8%) |
| Material Moving | 504 (80.9%) | 119 (19.1%) |
| Total (Category) | 2,687 (75.9%) | 854 (24.1%) |
| Total (Overall) | 14,565 (51.8%) | 13,569 (48.2%) |
Employment Industries by Sex in Country Club
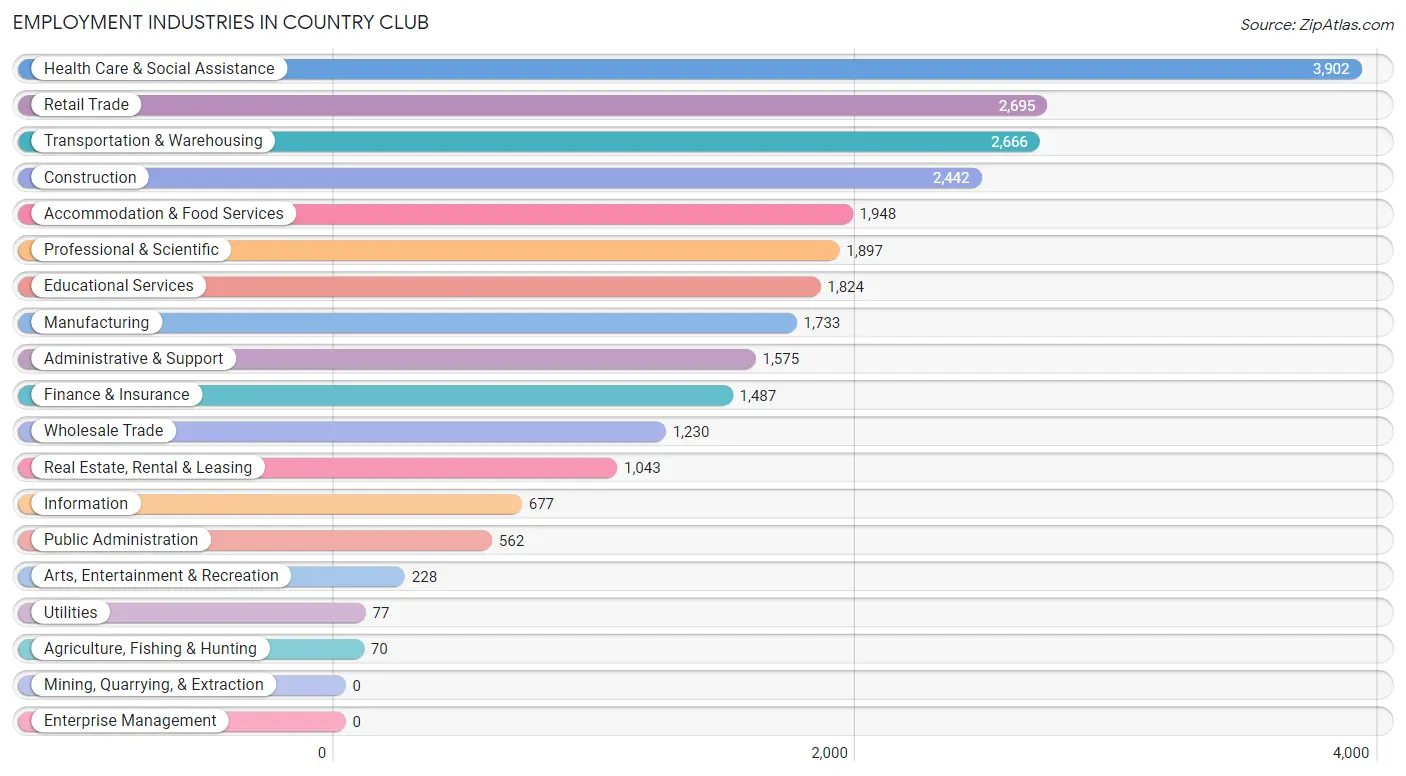
Employment Industries in Country Club
The major employment industries in Country Club include Health Care & Social Assistance (3,902 | 13.9%), Retail Trade (2,695 | 9.6%), Transportation & Warehousing (2,666 | 9.5%), Construction (2,442 | 8.7%), and Accommodation & Food Services (1,948 | 6.9%).
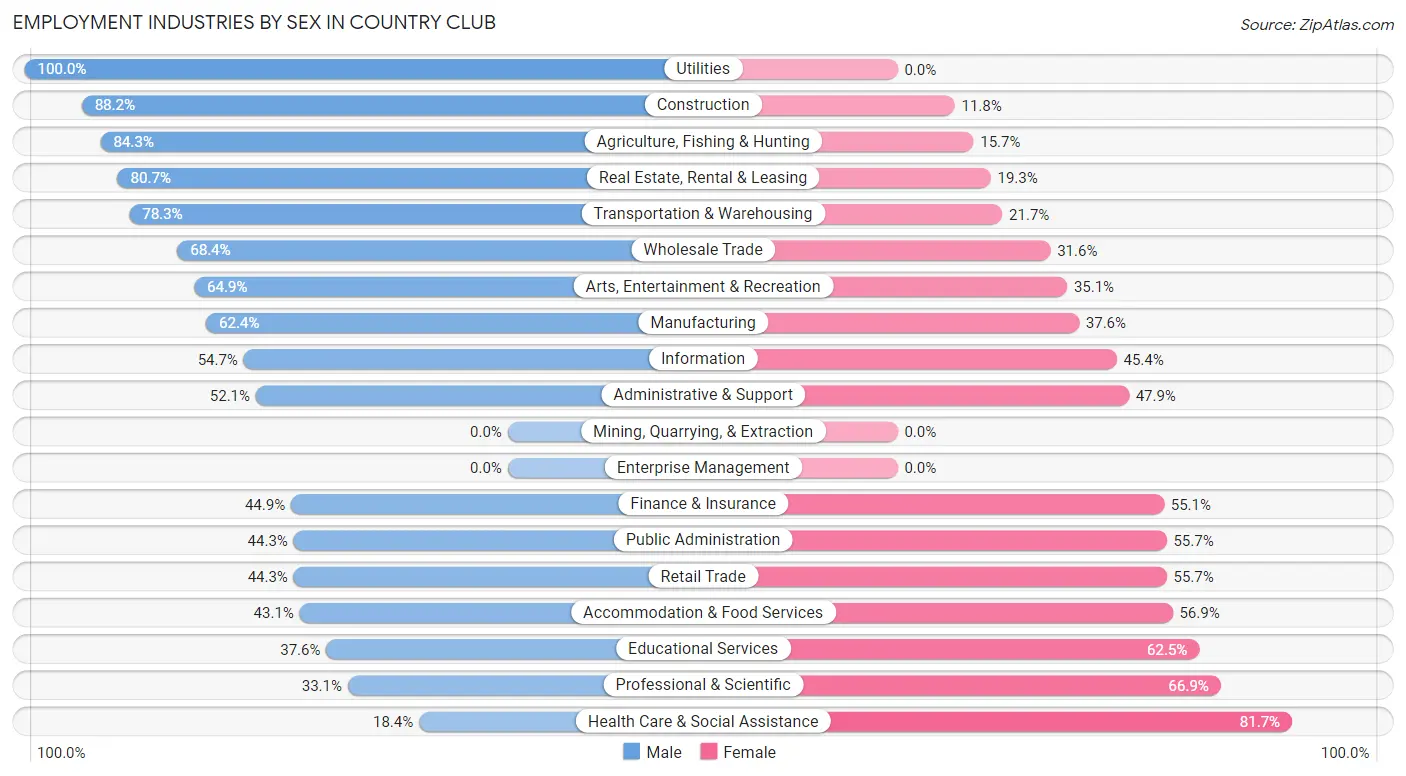
Employment Industries by Sex in Country Club
The Country Club industries that see more men than women are Utilities (100.0%), Construction (88.2%), and Agriculture, Fishing & Hunting (84.3%), whereas the industries that tend to have a higher number of women are Health Care & Social Assistance (81.7%), Professional & Scientific (66.9%), and Educational Services (62.5%).
| Industry | Male | Female |
| Agriculture, Fishing & Hunting | 59 (84.3%) | 11 (15.7%) |
| Mining, Quarrying, & Extraction | 0 (0.0%) | 0 (0.0%) |
| Construction | 2,153 (88.2%) | 289 (11.8%) |
| Manufacturing | 1,082 (62.4%) | 651 (37.6%) |
| Wholesale Trade | 841 (68.4%) | 389 (31.6%) |
| Retail Trade | 1,194 (44.3%) | 1,501 (55.7%) |
| Transportation & Warehousing | 2,088 (78.3%) | 578 (21.7%) |
| Utilities | 77 (100.0%) | 0 (0.0%) |
| Information | 370 (54.6%) | 307 (45.4%) |
| Finance & Insurance | 667 (44.9%) | 820 (55.1%) |
| Real Estate, Rental & Leasing | 842 (80.7%) | 201 (19.3%) |
| Professional & Scientific | 628 (33.1%) | 1,269 (66.9%) |
| Enterprise Management | 0 (0.0%) | 0 (0.0%) |
| Administrative & Support | 821 (52.1%) | 754 (47.9%) |
| Educational Services | 685 (37.6%) | 1,139 (62.5%) |
| Health Care & Social Assistance | 716 (18.3%) | 3,186 (81.7%) |
| Arts, Entertainment & Recreation | 148 (64.9%) | 80 (35.1%) |
| Accommodation & Food Services | 839 (43.1%) | 1,109 (56.9%) |
| Public Administration | 249 (44.3%) | 313 (55.7%) |
| Total | 14,565 (51.8%) | 13,569 (48.2%) |
Education in Country Club
School Enrollment in Country Club
The most common levels of schooling among the 13,433 students in Country Club are college / undergraduate (3,399 | 25.3%), high school (3,346 | 24.9%), and middle school (2,382 | 17.7%).
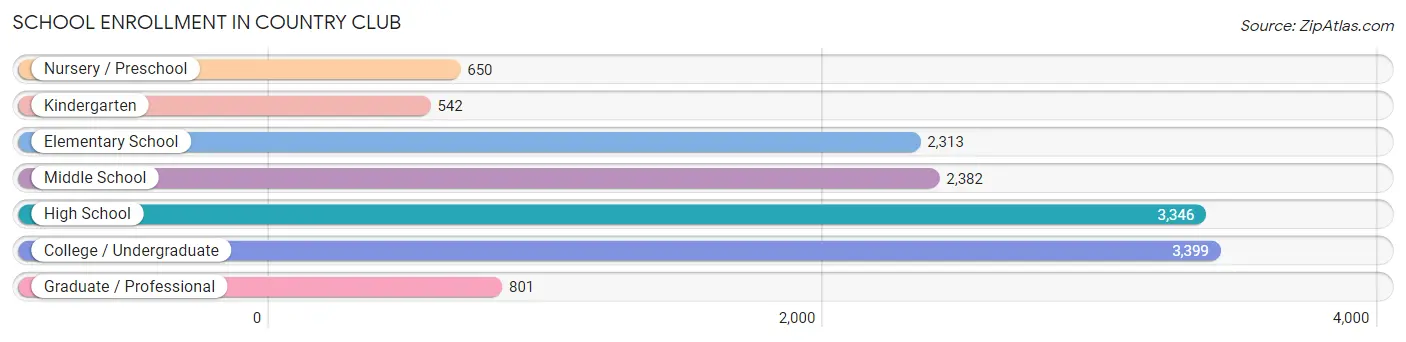
| School Level | # Students | % Students |
| Nursery / Preschool | 650 | 4.8% |
| Kindergarten | 542 | 4.0% |
| Elementary School | 2,313 | 17.2% |
| Middle School | 2,382 | 17.7% |
| High School | 3,346 | 24.9% |
| College / Undergraduate | 3,399 | 25.3% |
| Graduate / Professional | 801 | 6.0% |
| Total | 13,433 | 100.0% |
School Enrollment by Age by Funding Source in Country Club
Out of a total of 13,433 students who are enrolled in schools in Country Club, 2,767 (20.6%) attend a private institution, while the remaining 10,666 (79.4%) are enrolled in public schools. The age group of 35 years and over has the highest likelihood of being enrolled in private schools, with 663 (57.7% in the age bracket) enrolled. Conversely, the age group of 10 to 14 year olds has the lowest likelihood of being enrolled in a private school, with 2,961 (96.6% in the age bracket) attending a public institution.
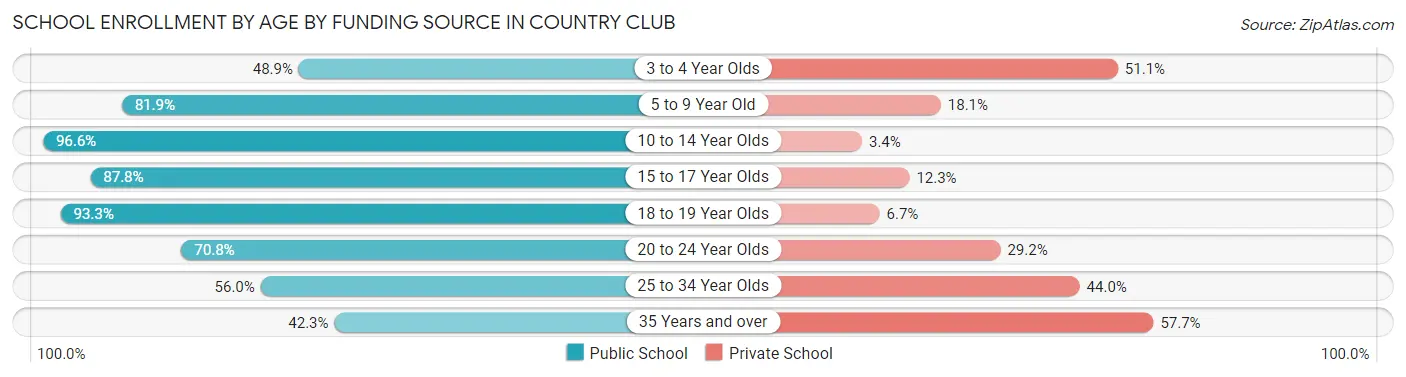
| Age Bracket | Public School | Private School |
| 3 to 4 Year Olds | 227 (48.9%) | 237 (51.1%) |
| 5 to 9 Year Old | 2,294 (81.9%) | 507 (18.1%) |
| 10 to 14 Year Olds | 2,961 (96.6%) | 105 (3.4%) |
| 15 to 17 Year Olds | 2,013 (87.7%) | 281 (12.2%) |
| 18 to 19 Year Olds | 920 (93.3%) | 66 (6.7%) |
| 20 to 24 Year Olds | 1,253 (70.8%) | 517 (29.2%) |
| 25 to 34 Year Olds | 506 (56.0%) | 397 (44.0%) |
| 35 Years and over | 486 (42.3%) | 663 (57.7%) |
| Total | 10,666 (79.4%) | 2,767 (20.6%) |
Educational Attainment by Field of Study in Country Club
Business (2,956 | 27.3%), science & technology (1,812 | 16.7%), education (1,276 | 11.8%), engineering (1,093 | 10.1%), and social sciences (731 | 6.8%) are the most common fields of study among 10,823 individuals in Country Club who have obtained a bachelor's degree or higher.
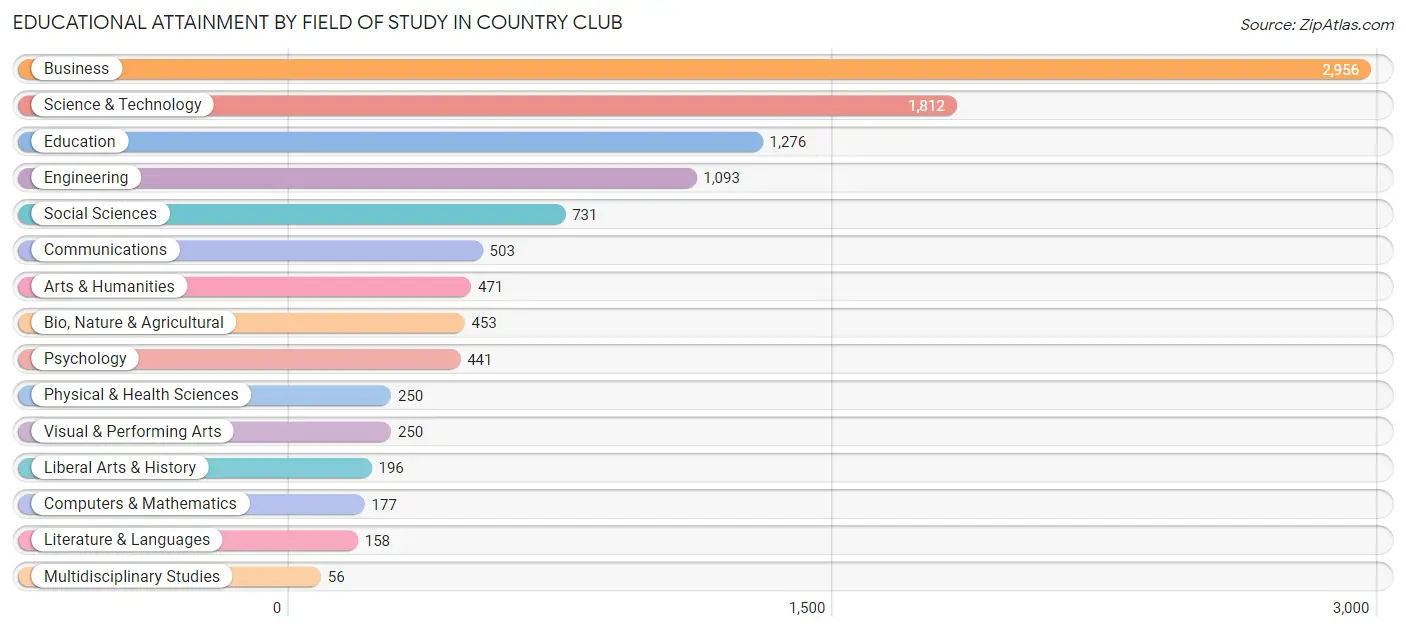
| Field of Study | # Graduates | % Graduates |
| Computers & Mathematics | 177 | 1.6% |
| Bio, Nature & Agricultural | 453 | 4.2% |
| Physical & Health Sciences | 250 | 2.3% |
| Psychology | 441 | 4.1% |
| Social Sciences | 731 | 6.8% |
| Engineering | 1,093 | 10.1% |
| Multidisciplinary Studies | 56 | 0.5% |
| Science & Technology | 1,812 | 16.7% |
| Business | 2,956 | 27.3% |
| Education | 1,276 | 11.8% |
| Literature & Languages | 158 | 1.5% |
| Liberal Arts & History | 196 | 1.8% |
| Visual & Performing Arts | 250 | 2.3% |
| Communications | 503 | 4.6% |
| Arts & Humanities | 471 | 4.3% |
| Total | 10,823 | 100.0% |
Transportation & Commute in Country Club
Vehicle Availability by Sex in Country Club
The most prevalent vehicle ownership categories in Country Club are males with 2 vehicles (7,792, accounting for 54.0%) and females with 2 vehicles (7,573, making up 58.4%).
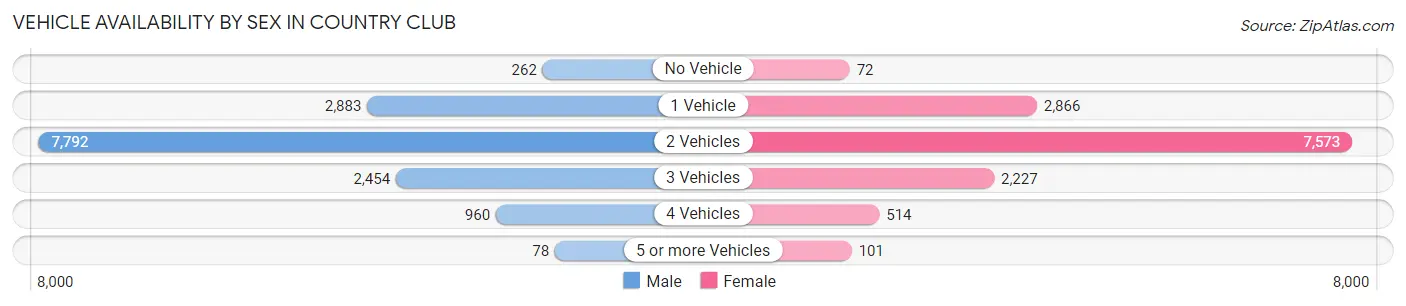
| Vehicles Available | Male | Female |
| No Vehicle | 262 (1.8%) | 72 (0.5%) |
| 1 Vehicle | 2,883 (20.0%) | 2,866 (21.5%) |
| 2 Vehicles | 7,792 (54.0%) | 7,573 (56.7%) |
| 3 Vehicles | 2,454 (17.0%) | 2,227 (16.7%) |
| 4 Vehicles | 960 (6.7%) | 514 (3.8%) |
| 5 or more Vehicles | 78 (0.5%) | 101 (0.8%) |
| Total | 14,429 (100.0%) | 13,353 (100.0%) |
Commute Time in Country Club
The most frequently occuring commute durations in Country Club are 30 to 34 minutes (5,701 commuters, 22.4%), 15 to 19 minutes (3,554 commuters, 14.0%), and 20 to 24 minutes (3,333 commuters, 13.1%).
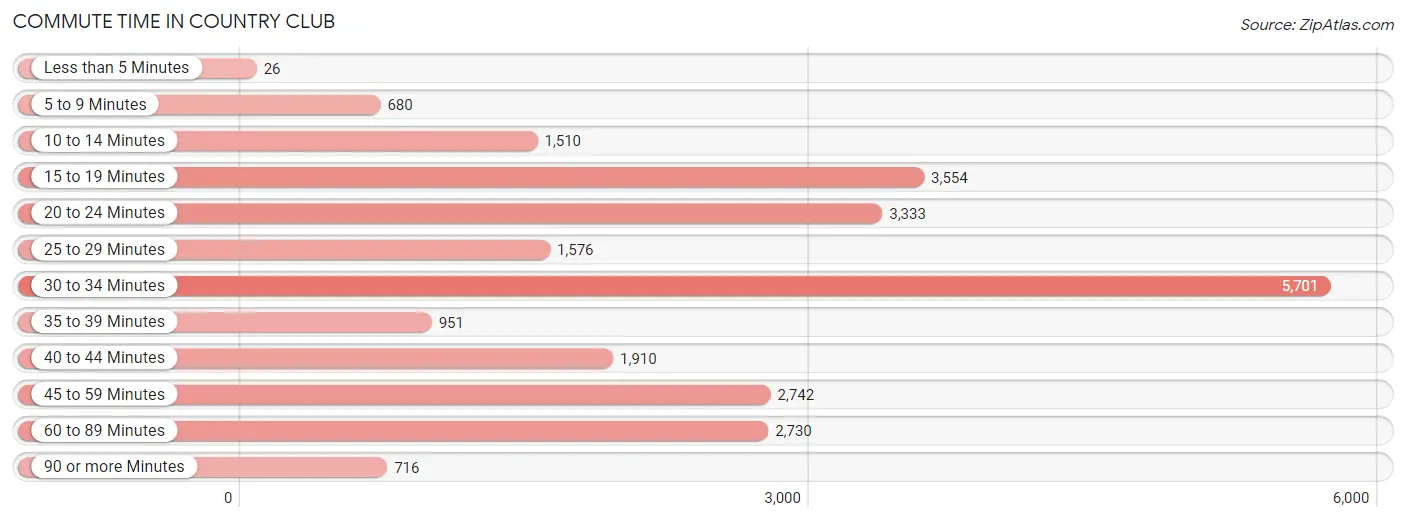
| Commute Time | # Commuters | % Commuters |
| Less than 5 Minutes | 26 | 0.1% |
| 5 to 9 Minutes | 680 | 2.7% |
| 10 to 14 Minutes | 1,510 | 5.9% |
| 15 to 19 Minutes | 3,554 | 14.0% |
| 20 to 24 Minutes | 3,333 | 13.1% |
| 25 to 29 Minutes | 1,576 | 6.2% |
| 30 to 34 Minutes | 5,701 | 22.4% |
| 35 to 39 Minutes | 951 | 3.7% |
| 40 to 44 Minutes | 1,910 | 7.5% |
| 45 to 59 Minutes | 2,742 | 10.8% |
| 60 to 89 Minutes | 2,730 | 10.7% |
| 90 or more Minutes | 716 | 2.8% |
Commute Time by Sex in Country Club
The most common commute times in Country Club are 30 to 34 minutes (3,105 commuters, 22.8%) for males and 30 to 34 minutes (2,596 commuters, 22.0%) for females.
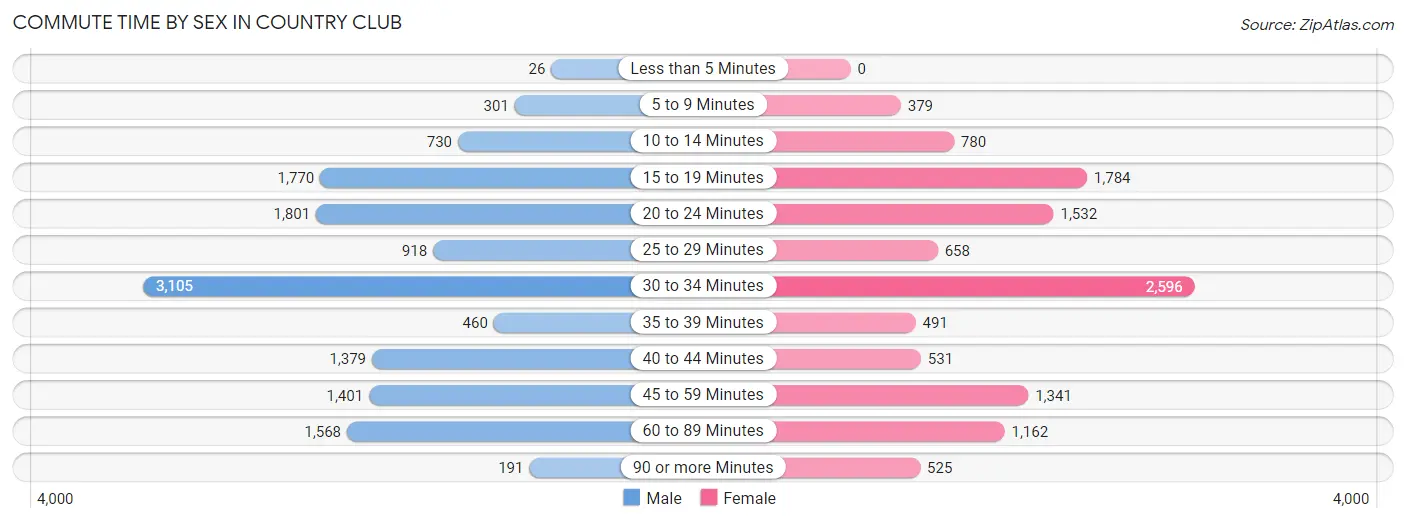
| Commute Time | Male | Female |
| Less than 5 Minutes | 26 (0.2%) | 0 (0.0%) |
| 5 to 9 Minutes | 301 (2.2%) | 379 (3.2%) |
| 10 to 14 Minutes | 730 (5.3%) | 780 (6.6%) |
| 15 to 19 Minutes | 1,770 (13.0%) | 1,784 (15.1%) |
| 20 to 24 Minutes | 1,801 (13.2%) | 1,532 (13.0%) |
| 25 to 29 Minutes | 918 (6.7%) | 658 (5.6%) |
| 30 to 34 Minutes | 3,105 (22.8%) | 2,596 (22.0%) |
| 35 to 39 Minutes | 460 (3.4%) | 491 (4.2%) |
| 40 to 44 Minutes | 1,379 (10.1%) | 531 (4.5%) |
| 45 to 59 Minutes | 1,401 (10.3%) | 1,341 (11.4%) |
| 60 to 89 Minutes | 1,568 (11.5%) | 1,162 (9.9%) |
| 90 or more Minutes | 191 (1.4%) | 525 (4.5%) |
Time of Departure to Work by Sex in Country Club
The most frequent times of departure to work in Country Club are 8:00 AM to 8:29 AM (2,119, 15.5%) for males and 7:00 AM to 7:29 AM (2,685, 22.8%) for females.
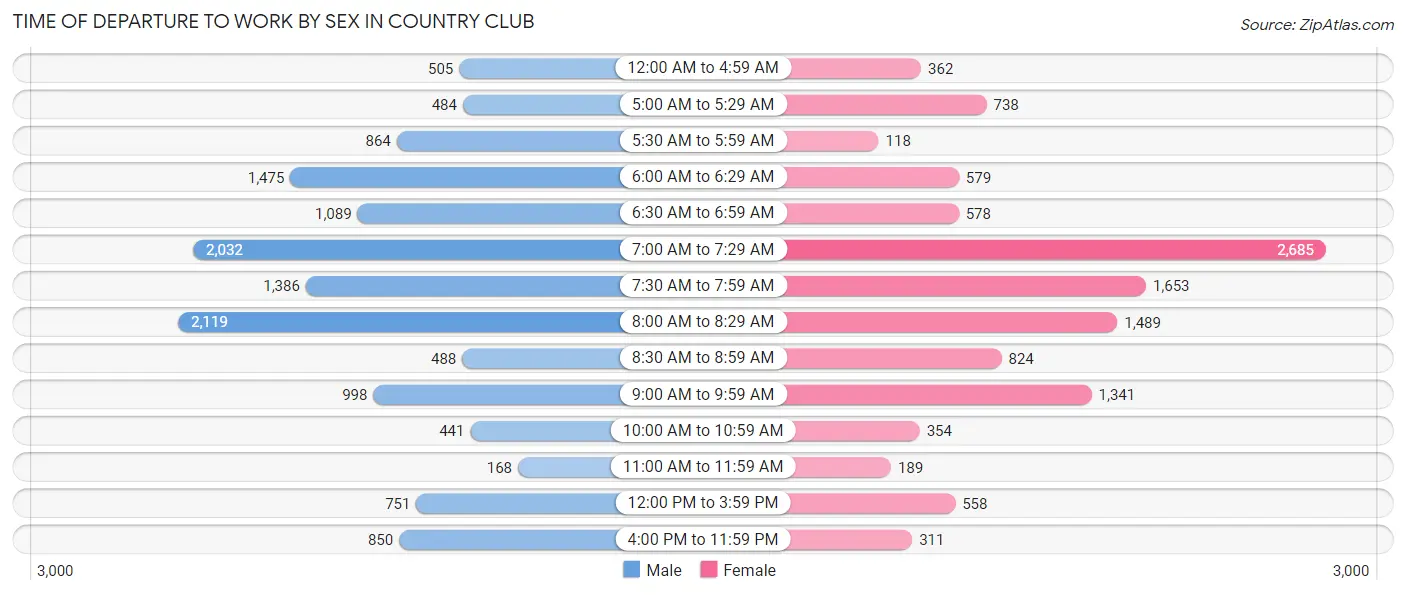
| Time of Departure | Male | Female |
| 12:00 AM to 4:59 AM | 505 (3.7%) | 362 (3.1%) |
| 5:00 AM to 5:29 AM | 484 (3.5%) | 738 (6.3%) |
| 5:30 AM to 5:59 AM | 864 (6.3%) | 118 (1.0%) |
| 6:00 AM to 6:29 AM | 1,475 (10.8%) | 579 (4.9%) |
| 6:30 AM to 6:59 AM | 1,089 (8.0%) | 578 (4.9%) |
| 7:00 AM to 7:29 AM | 2,032 (14.9%) | 2,685 (22.8%) |
| 7:30 AM to 7:59 AM | 1,386 (10.2%) | 1,653 (14.0%) |
| 8:00 AM to 8:29 AM | 2,119 (15.5%) | 1,489 (12.6%) |
| 8:30 AM to 8:59 AM | 488 (3.6%) | 824 (7.0%) |
| 9:00 AM to 9:59 AM | 998 (7.3%) | 1,341 (11.4%) |
| 10:00 AM to 10:59 AM | 441 (3.2%) | 354 (3.0%) |
| 11:00 AM to 11:59 AM | 168 (1.2%) | 189 (1.6%) |
| 12:00 PM to 3:59 PM | 751 (5.5%) | 558 (4.7%) |
| 4:00 PM to 11:59 PM | 850 (6.2%) | 311 (2.6%) |
| Total | 13,650 (100.0%) | 11,779 (100.0%) |
Housing Occupancy in Country Club
Occupancy by Ownership in Country Club
Of the total 18,236 dwellings in Country Club, owner-occupied units account for 8,190 (44.9%), while renter-occupied units make up 10,046 (55.1%).
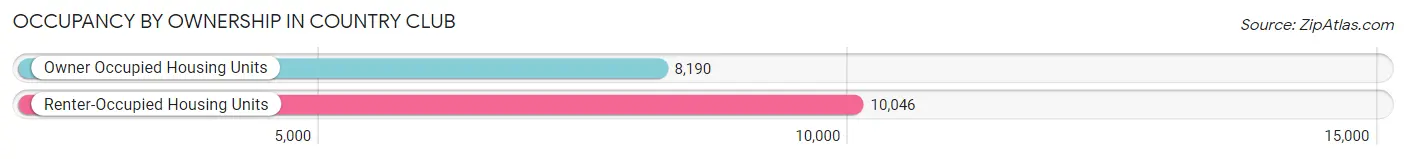
| Occupancy | # Housing Units | % Housing Units |
| Owner Occupied Housing Units | 8,190 | 44.9% |
| Renter-Occupied Housing Units | 10,046 | 55.1% |
| Total Occupied Housing Units | 18,236 | 100.0% |
Occupancy by Household Size in Country Club
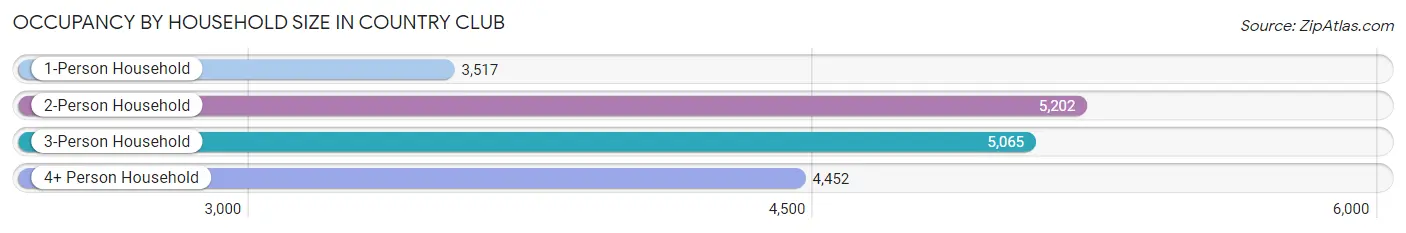
| Household Size | # Housing Units | % Housing Units |
| 1-Person Household | 3,517 | 19.3% |
| 2-Person Household | 5,202 | 28.5% |
| 3-Person Household | 5,065 | 27.8% |
| 4+ Person Household | 4,452 | 24.4% |
| Total Housing Units | 18,236 | 100.0% |
Occupancy by Ownership by Household Size in Country Club
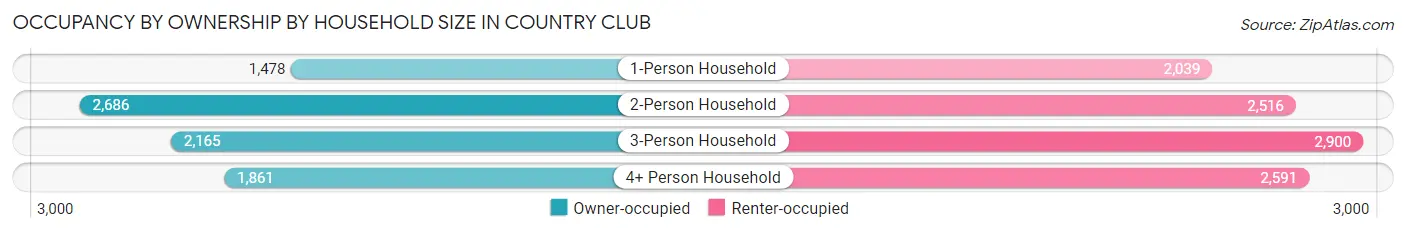
| Household Size | Owner-occupied | Renter-occupied |
| 1-Person Household | 1,478 (42.0%) | 2,039 (58.0%) |
| 2-Person Household | 2,686 (51.6%) | 2,516 (48.4%) |
| 3-Person Household | 2,165 (42.7%) | 2,900 (57.3%) |
| 4+ Person Household | 1,861 (41.8%) | 2,591 (58.2%) |
| Total Housing Units | 8,190 (44.9%) | 10,046 (55.1%) |
Occupancy by Educational Attainment in Country Club
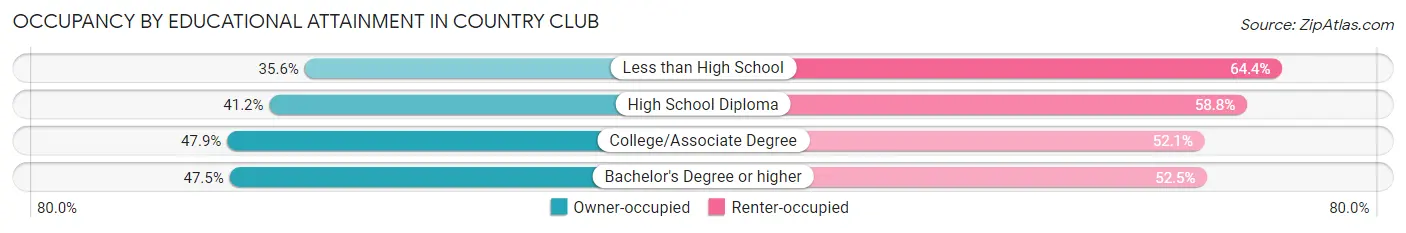
| Household Size | Owner-occupied | Renter-occupied |
| Less than High School | 697 (35.6%) | 1,262 (64.4%) |
| High School Diploma | 1,695 (41.2%) | 2,421 (58.8%) |
| College/Associate Degree | 2,832 (47.9%) | 3,084 (52.1%) |
| Bachelor's Degree or higher | 2,966 (47.5%) | 3,279 (52.5%) |
Occupancy by Age of Householder in Country Club
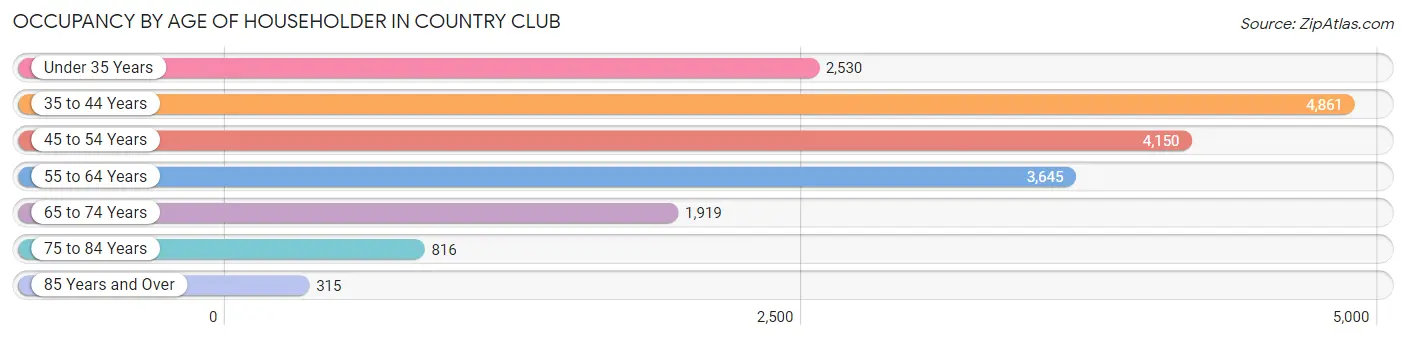
| Age Bracket | # Households | % Households |
| Under 35 Years | 2,530 | 13.9% |
| 35 to 44 Years | 4,861 | 26.7% |
| 45 to 54 Years | 4,150 | 22.8% |
| 55 to 64 Years | 3,645 | 20.0% |
| 65 to 74 Years | 1,919 | 10.5% |
| 75 to 84 Years | 816 | 4.5% |
| 85 Years and Over | 315 | 1.7% |
| Total | 18,236 | 100.0% |
Housing Finances in Country Club
Median Income by Occupancy in Country Club
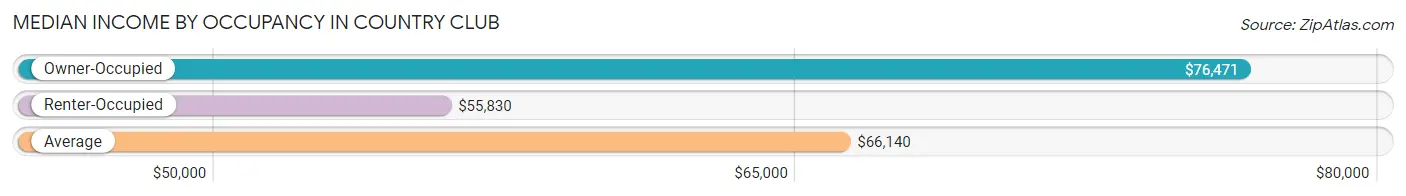
| Occupancy Type | # Households | Median Income |
| Owner-Occupied | 8,190 (44.9%) | $76,471 |
| Renter-Occupied | 10,046 (55.1%) | $55,830 |
| Average | 18,236 (100.0%) | $66,140 |
Occupancy by Householder Income Bracket in Country Club
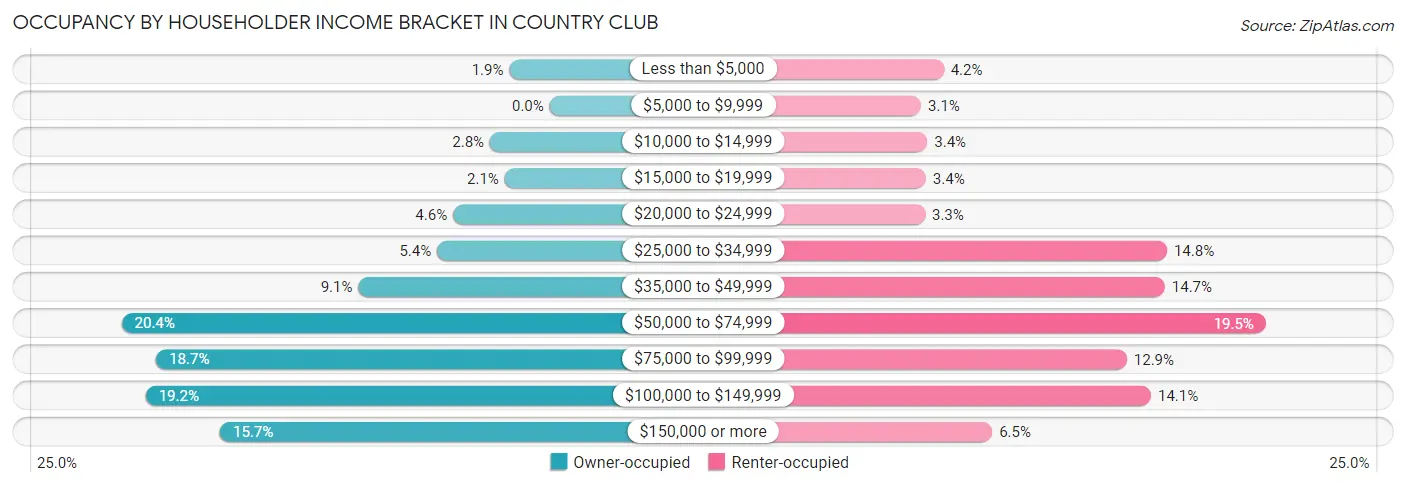
| Income Bracket | Owner-occupied | Renter-occupied |
| Less than $5,000 | 157 (1.9%) | 422 (4.2%) |
| $5,000 to $9,999 | 0 (0.0%) | 313 (3.1%) |
| $10,000 to $14,999 | 233 (2.8%) | 344 (3.4%) |
| $15,000 to $19,999 | 175 (2.1%) | 337 (3.4%) |
| $20,000 to $24,999 | 377 (4.6%) | 333 (3.3%) |
| $25,000 to $34,999 | 439 (5.4%) | 1,490 (14.8%) |
| $35,000 to $49,999 | 746 (9.1%) | 1,480 (14.7%) |
| $50,000 to $74,999 | 1,669 (20.4%) | 1,962 (19.5%) |
| $75,000 to $99,999 | 1,534 (18.7%) | 1,298 (12.9%) |
| $100,000 to $149,999 | 1,575 (19.2%) | 1,413 (14.1%) |
| $150,000 or more | 1,285 (15.7%) | 654 (6.5%) |
| Total | 8,190 (100.0%) | 10,046 (100.0%) |
Monthly Housing Cost Tiers in Country Club
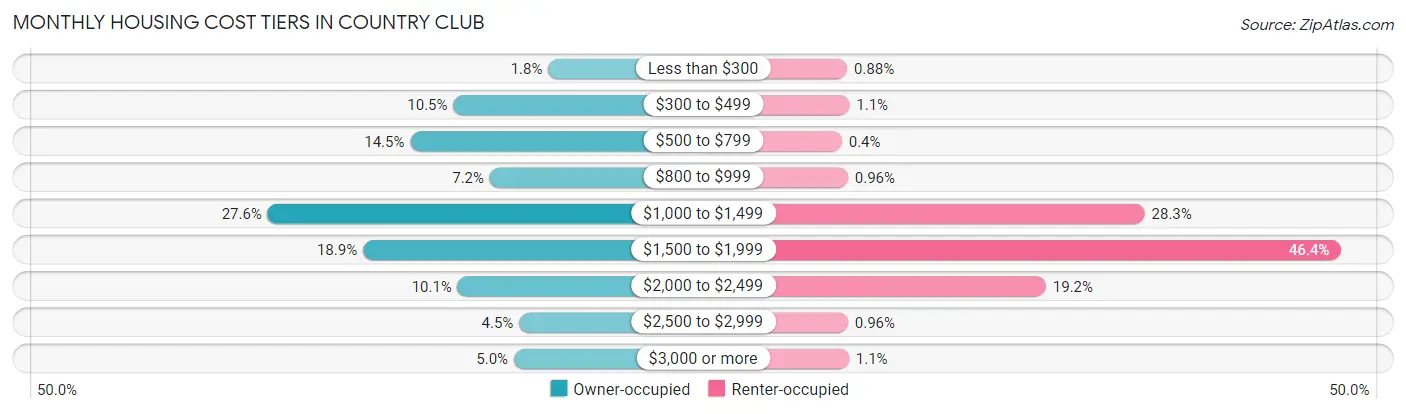
| Monthly Cost | Owner-occupied | Renter-occupied |
| Less than $300 | 147 (1.8%) | 88 (0.9%) |
| $300 to $499 | 862 (10.5%) | 111 (1.1%) |
| $500 to $799 | 1,187 (14.5%) | 40 (0.4%) |
| $800 to $999 | 587 (7.2%) | 96 (1.0%) |
| $1,000 to $1,499 | 2,262 (27.6%) | 2,841 (28.3%) |
| $1,500 to $1,999 | 1,544 (18.9%) | 4,658 (46.4%) |
| $2,000 to $2,499 | 830 (10.1%) | 1,928 (19.2%) |
| $2,500 to $2,999 | 366 (4.5%) | 96 (1.0%) |
| $3,000 or more | 405 (5.0%) | 105 (1.1%) |
| Total | 8,190 (100.0%) | 10,046 (100.0%) |
Physical Housing Characteristics in Country Club
Housing Structures in Country Club
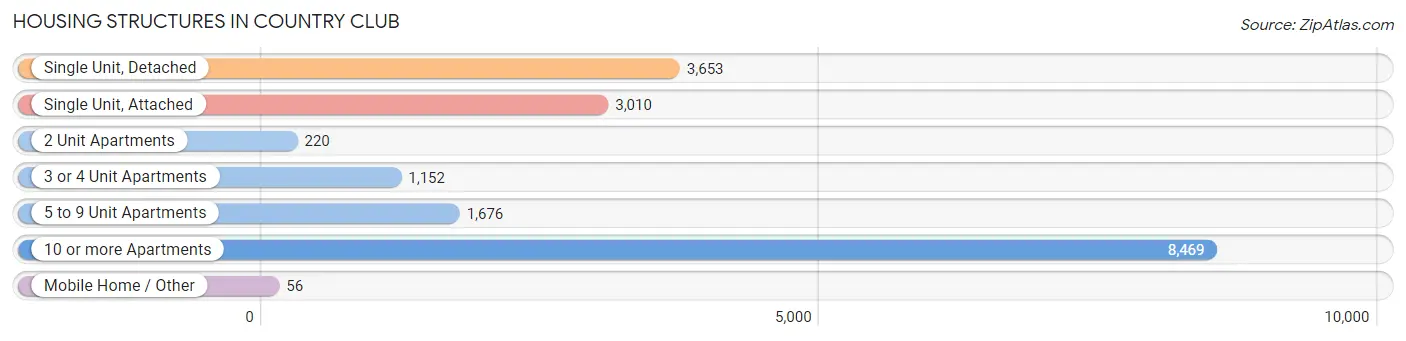
| Structure Type | # Housing Units | % Housing Units |
| Single Unit, Detached | 3,653 | 20.0% |
| Single Unit, Attached | 3,010 | 16.5% |
| 2 Unit Apartments | 220 | 1.2% |
| 3 or 4 Unit Apartments | 1,152 | 6.3% |
| 5 to 9 Unit Apartments | 1,676 | 9.2% |
| 10 or more Apartments | 8,469 | 46.4% |
| Mobile Home / Other | 56 | 0.3% |
| Total | 18,236 | 100.0% |
Housing Structures by Occupancy in Country Club
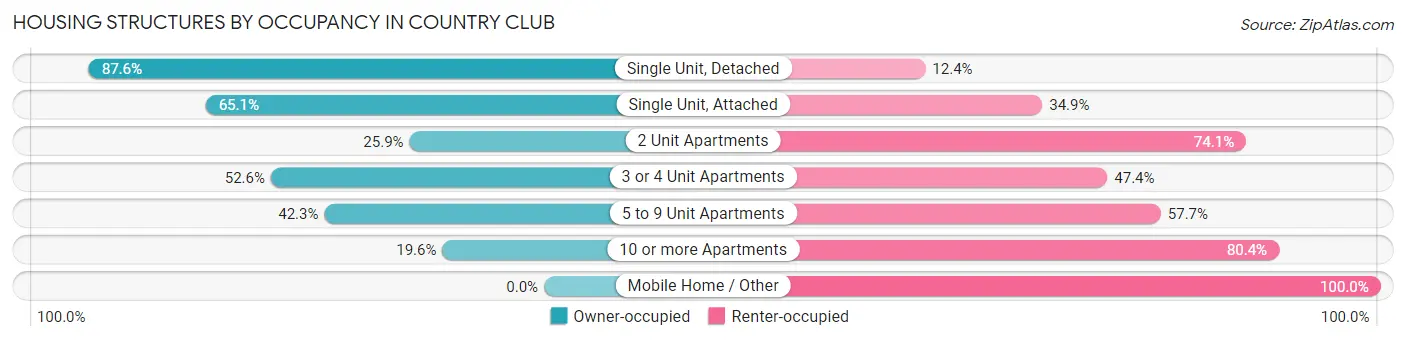
| Structure Type | Owner-occupied | Renter-occupied |
| Single Unit, Detached | 3,201 (87.6%) | 452 (12.4%) |
| Single Unit, Attached | 1,960 (65.1%) | 1,050 (34.9%) |
| 2 Unit Apartments | 57 (25.9%) | 163 (74.1%) |
| 3 or 4 Unit Apartments | 606 (52.6%) | 546 (47.4%) |
| 5 to 9 Unit Apartments | 709 (42.3%) | 967 (57.7%) |
| 10 or more Apartments | 1,657 (19.6%) | 6,812 (80.4%) |
| Mobile Home / Other | 0 (0.0%) | 56 (100.0%) |
| Total | 8,190 (44.9%) | 10,046 (55.1%) |
Housing Structures by Number of Rooms in Country Club
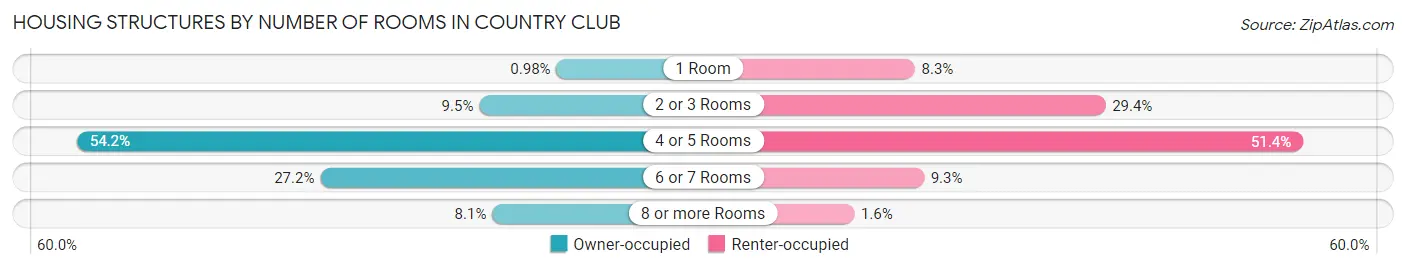
| Number of Rooms | Owner-occupied | Renter-occupied |
| 1 Room | 80 (1.0%) | 833 (8.3%) |
| 2 or 3 Rooms | 781 (9.5%) | 2,958 (29.4%) |
| 4 or 5 Rooms | 4,439 (54.2%) | 5,164 (51.4%) |
| 6 or 7 Rooms | 2,227 (27.2%) | 934 (9.3%) |
| 8 or more Rooms | 663 (8.1%) | 157 (1.6%) |
| Total | 8,190 (100.0%) | 10,046 (100.0%) |
Housing Structure by Heating Type in Country Club
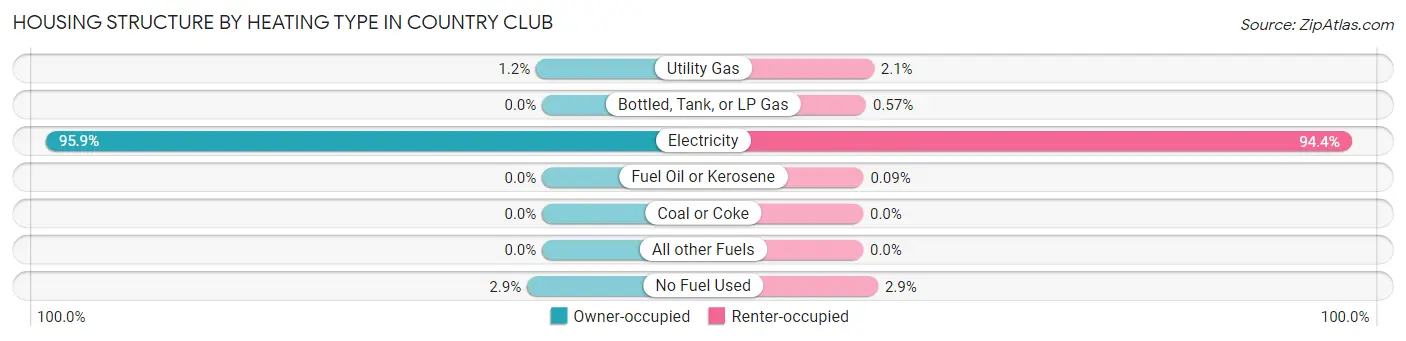
| Heating Type | Owner-occupied | Renter-occupied |
| Utility Gas | 97 (1.2%) | 210 (2.1%) |
| Bottled, Tank, or LP Gas | 0 (0.0%) | 57 (0.6%) |
| Electricity | 7,854 (95.9%) | 9,481 (94.4%) |
| Fuel Oil or Kerosene | 0 (0.0%) | 9 (0.1%) |
| Coal or Coke | 0 (0.0%) | 0 (0.0%) |
| All other Fuels | 0 (0.0%) | 0 (0.0%) |
| No Fuel Used | 239 (2.9%) | 289 (2.9%) |
| Total | 8,190 (100.0%) | 10,046 (100.0%) |
Household Vehicle Usage in Country Club
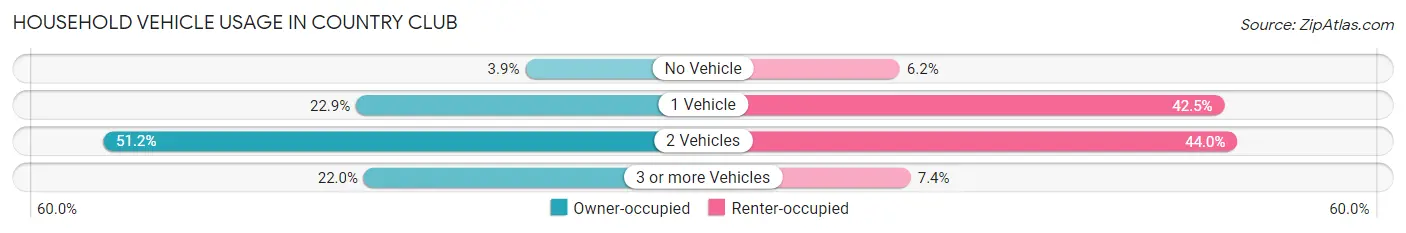
| Vehicles per Household | Owner-occupied | Renter-occupied |
| No Vehicle | 321 (3.9%) | 619 (6.2%) |
| 1 Vehicle | 1,873 (22.9%) | 4,271 (42.5%) |
| 2 Vehicles | 4,194 (51.2%) | 4,415 (44.0%) |
| 3 or more Vehicles | 1,802 (22.0%) | 741 (7.4%) |
| Total | 8,190 (100.0%) | 10,046 (100.0%) |
Real Estate & Mortgages in Country Club
Real Estate and Mortgage Overview in Country Club
| Characteristic | Without Mortgage | With Mortgage |
| Housing Units | 2,917 | 5,273 |
| Median Property Value | $355,600 | $294,000 |
| Median Household Income | $69,356 | $1,019 |
| Monthly Housing Costs | $626 | $405 |
| Real Estate Taxes | $2,496 | $122 |
Property Value by Mortgage Status in Country Club
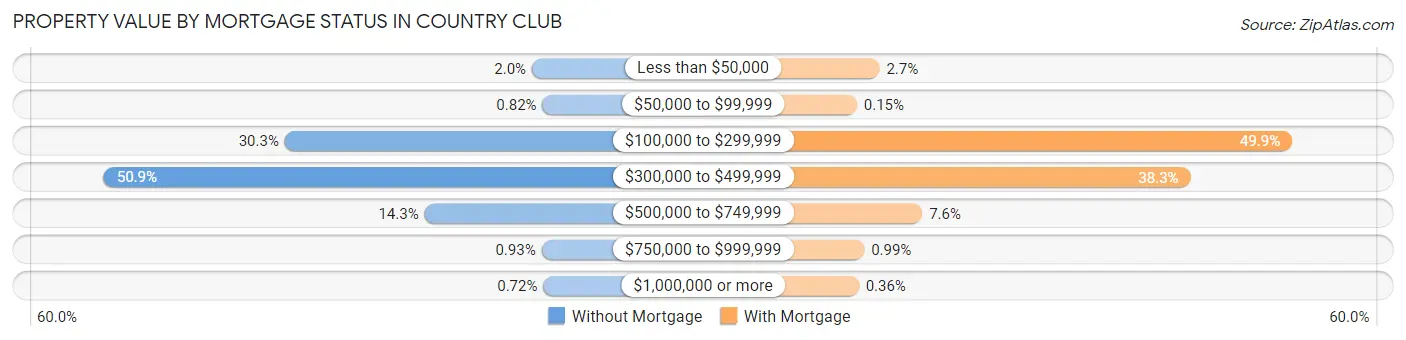
| Property Value | Without Mortgage | With Mortgage |
| Less than $50,000 | 59 (2.0%) | 144 (2.7%) |
| $50,000 to $99,999 | 24 (0.8%) | 8 (0.2%) |
| $100,000 to $299,999 | 883 (30.3%) | 2,630 (49.9%) |
| $300,000 to $499,999 | 1,486 (50.9%) | 2,018 (38.3%) |
| $500,000 to $749,999 | 417 (14.3%) | 402 (7.6%) |
| $750,000 to $999,999 | 27 (0.9%) | 52 (1.0%) |
| $1,000,000 or more | 21 (0.7%) | 19 (0.4%) |
| Total | 2,917 (100.0%) | 5,273 (100.0%) |
Household Income by Mortgage Status in Country Club
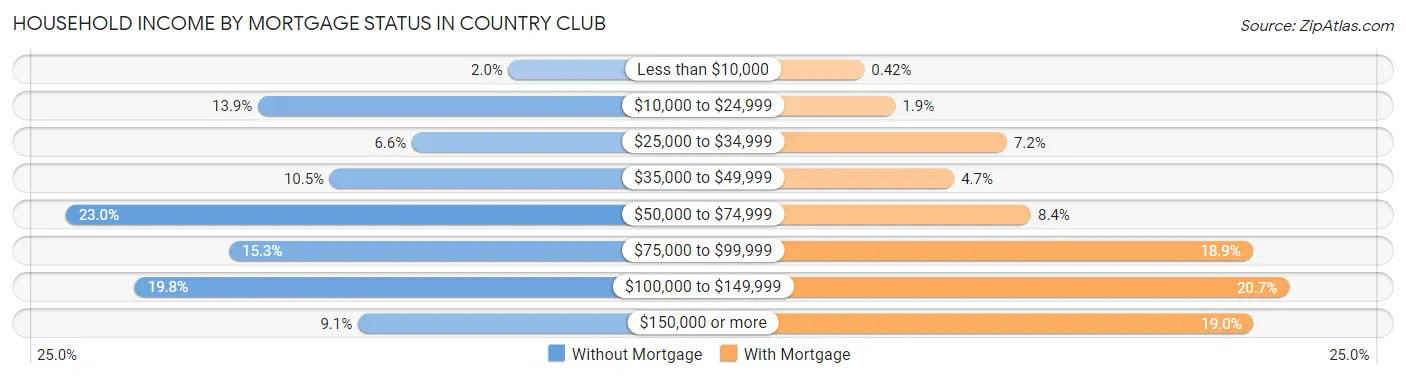
| Household Income | Without Mortgage | With Mortgage |
| Less than $10,000 | 57 (1.9%) | 22 (0.4%) |
| $10,000 to $24,999 | 405 (13.9%) | 100 (1.9%) |
| $25,000 to $34,999 | 191 (6.6%) | 380 (7.2%) |
| $35,000 to $49,999 | 305 (10.5%) | 248 (4.7%) |
| $50,000 to $74,999 | 672 (23.0%) | 441 (8.4%) |
| $75,000 to $99,999 | 445 (15.3%) | 997 (18.9%) |
| $100,000 to $149,999 | 576 (19.8%) | 1,089 (20.6%) |
| $150,000 or more | 266 (9.1%) | 999 (19.0%) |
| Total | 2,917 (100.0%) | 5,273 (100.0%) |
Property Value to Household Income Ratio in Country Club
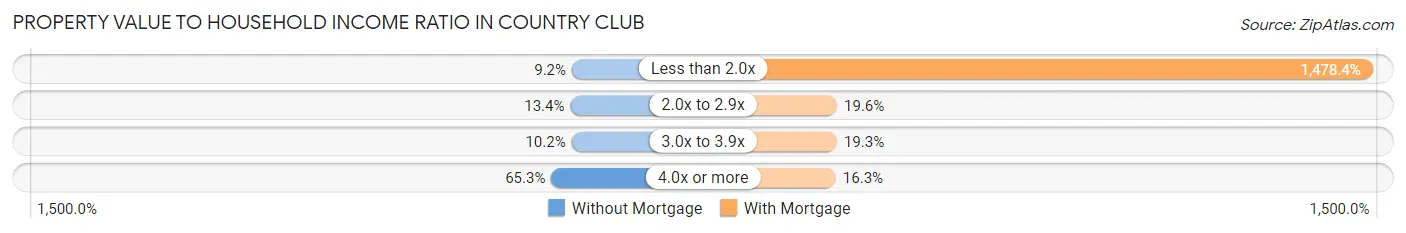
| Value-to-Income Ratio | Without Mortgage | With Mortgage |
| Less than 2.0x | 267 (9.1%) | 77,956 (1,478.4%) |
| 2.0x to 2.9x | 391 (13.4%) | 1,035 (19.6%) |
| 3.0x to 3.9x | 297 (10.2%) | 1,015 (19.3%) |
| 4.0x or more | 1,905 (65.3%) | 861 (16.3%) |
| Total | 2,917 (100.0%) | 5,273 (100.0%) |
Real Estate Taxes by Mortgage Status in Country Club
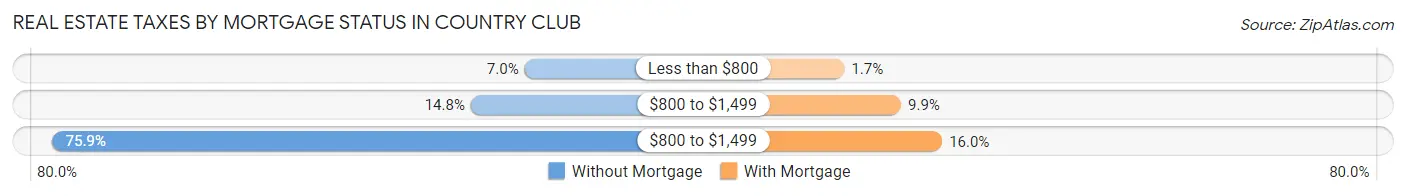
| Property Taxes | Without Mortgage | With Mortgage |
| Less than $800 | 203 (7.0%) | 88 (1.7%) |
| $800 to $1,499 | 432 (14.8%) | 524 (9.9%) |
| $800 to $1,499 | 2,214 (75.9%) | 841 (16.0%) |
| Total | 2,917 (100.0%) | 5,273 (100.0%) |
Health & Disability in Country Club
Health Insurance Coverage by Age in Country Club
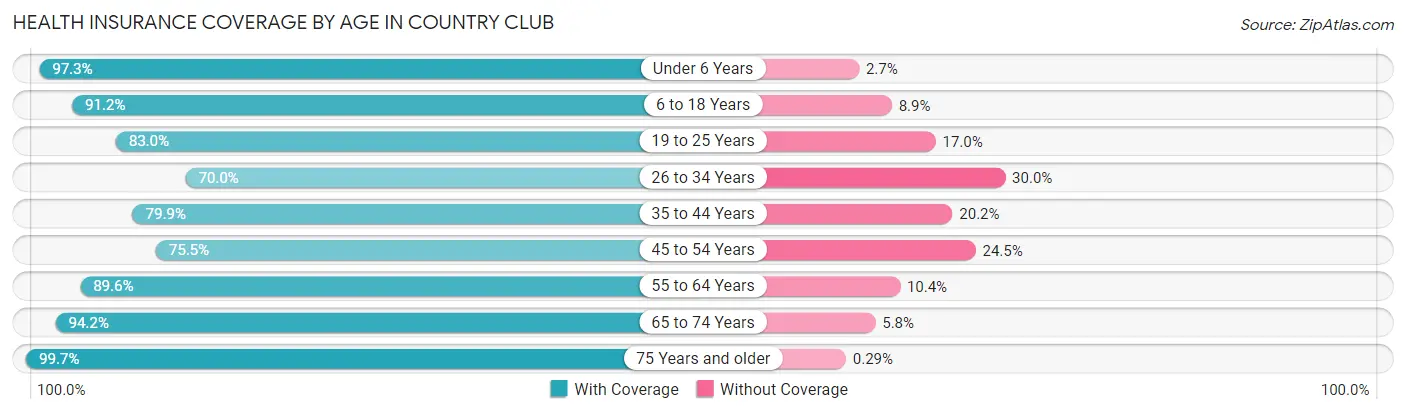
| Age Bracket | With Coverage | Without Coverage |
| Under 6 Years | 2,697 (97.3%) | 76 (2.7%) |
| 6 to 18 Years | 8,053 (91.1%) | 782 (8.8%) |
| 19 to 25 Years | 4,161 (83.0%) | 853 (17.0%) |
| 26 to 34 Years | 3,855 (70.0%) | 1,652 (30.0%) |
| 35 to 44 Years | 6,907 (79.8%) | 1,743 (20.2%) |
| 45 to 54 Years | 5,845 (75.5%) | 1,895 (24.5%) |
| 55 to 64 Years | 5,558 (89.6%) | 644 (10.4%) |
| 65 to 74 Years | 3,474 (94.2%) | 213 (5.8%) |
| 75 Years and older | 2,406 (99.7%) | 7 (0.3%) |
| Total | 42,956 (84.5%) | 7,865 (15.5%) |
Health Insurance Coverage by Citizenship Status in Country Club
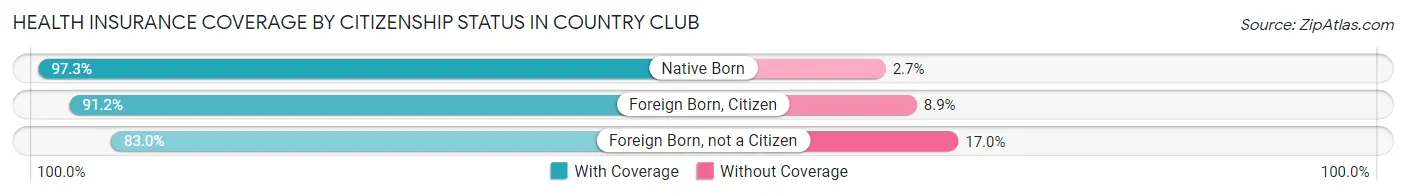
| Citizenship Status | With Coverage | Without Coverage |
| Native Born | 2,697 (97.3%) | 76 (2.7%) |
| Foreign Born, Citizen | 8,053 (91.1%) | 782 (8.8%) |
| Foreign Born, not a Citizen | 4,161 (83.0%) | 853 (17.0%) |
Health Insurance Coverage by Household Income in Country Club
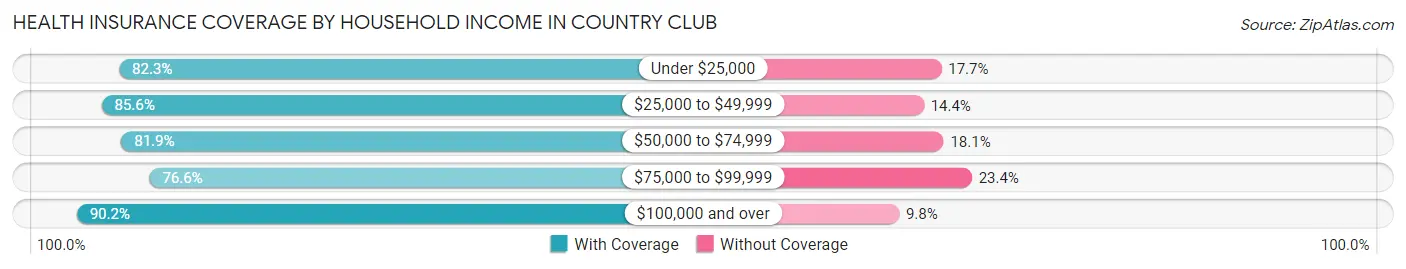
| Household Income | With Coverage | Without Coverage |
| Under $25,000 | 4,476 (82.3%) | 963 (17.7%) |
| $25,000 to $49,999 | 9,136 (85.6%) | 1,538 (14.4%) |
| $50,000 to $74,999 | 8,333 (81.9%) | 1,844 (18.1%) |
| $75,000 to $99,999 | 6,308 (76.6%) | 1,927 (23.4%) |
| $100,000 and over | 14,688 (90.2%) | 1,591 (9.8%) |
Public vs Private Health Insurance Coverage by Age in Country Club
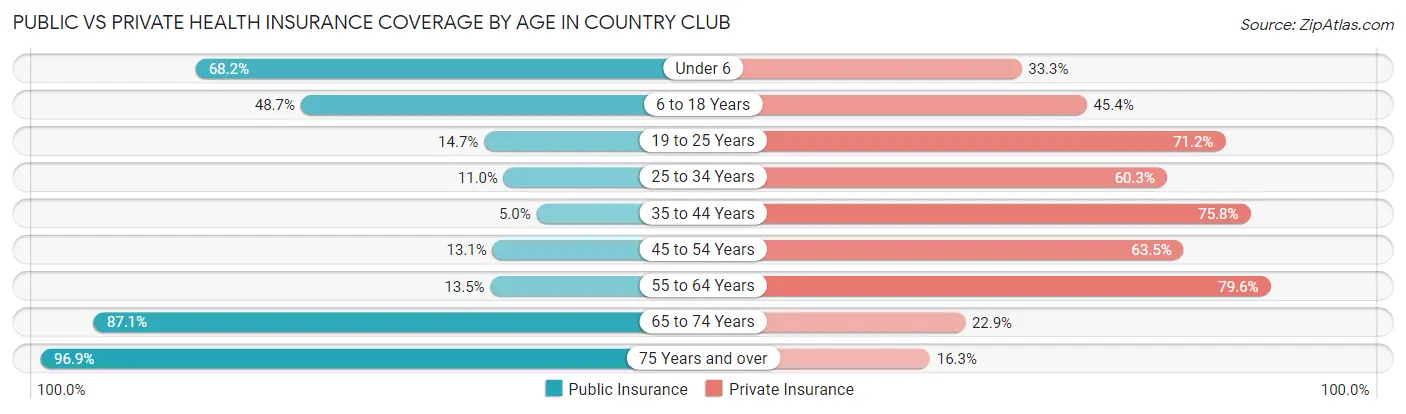
| Age Bracket | Public Insurance | Private Insurance |
| Under 6 | 1,892 (68.2%) | 924 (33.3%) |
| 6 to 18 Years | 4,306 (48.7%) | 4,013 (45.4%) |
| 19 to 25 Years | 737 (14.7%) | 3,568 (71.2%) |
| 25 to 34 Years | 608 (11.0%) | 3,321 (60.3%) |
| 35 to 44 Years | 431 (5.0%) | 6,559 (75.8%) |
| 45 to 54 Years | 1,016 (13.1%) | 4,911 (63.4%) |
| 55 to 64 Years | 839 (13.5%) | 4,934 (79.5%) |
| 65 to 74 Years | 3,213 (87.1%) | 843 (22.9%) |
| 75 Years and over | 2,339 (96.9%) | 394 (16.3%) |
| Total | 15,381 (30.3%) | 29,467 (58.0%) |
Disability Status by Sex by Age in Country Club
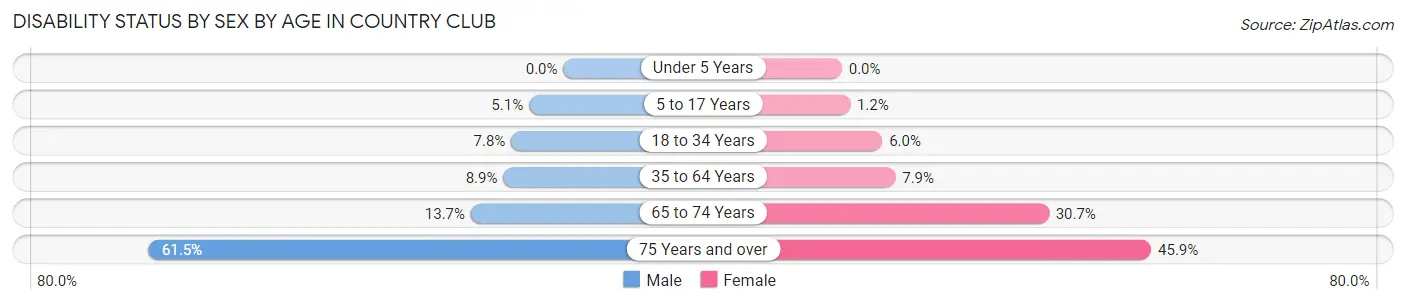
| Age Bracket | Male | Female |
| Under 5 Years | 0 (0.0%) | 0 (0.0%) |
| 5 to 17 Years | 236 (5.1%) | 46 (1.2%) |
| 18 to 34 Years | 475 (7.7%) | 308 (6.0%) |
| 35 to 64 Years | 914 (8.9%) | 980 (7.9%) |
| 65 to 74 Years | 226 (13.7%) | 627 (30.7%) |
| 75 Years and over | 488 (61.5%) | 744 (45.9%) |
Disability Class by Sex by Age in Country Club
Disability Class: Hearing Difficulty
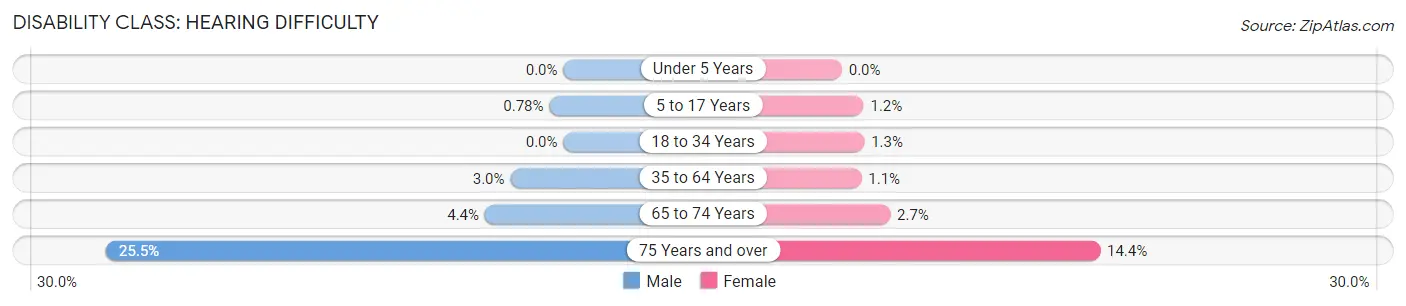
| Age Bracket | Male | Female |
| Under 5 Years | 0 (0.0%) | 0 (0.0%) |
| 5 to 17 Years | 36 (0.8%) | 46 (1.2%) |
| 18 to 34 Years | 0 (0.0%) | 64 (1.3%) |
| 35 to 64 Years | 302 (2.9%) | 135 (1.1%) |
| 65 to 74 Years | 72 (4.4%) | 55 (2.7%) |
| 75 Years and over | 202 (25.5%) | 233 (14.4%) |
Disability Class: Vision Difficulty
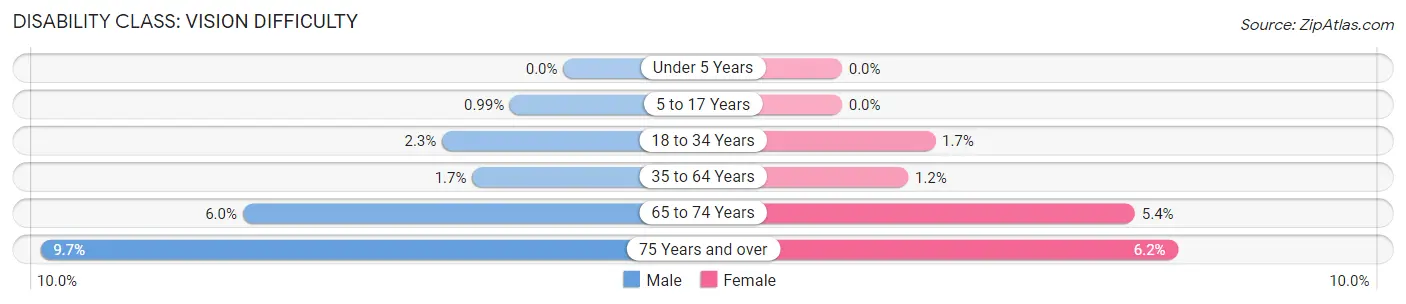
| Age Bracket | Male | Female |
| Under 5 Years | 0 (0.0%) | 0 (0.0%) |
| 5 to 17 Years | 46 (1.0%) | 0 (0.0%) |
| 18 to 34 Years | 138 (2.2%) | 89 (1.7%) |
| 35 to 64 Years | 173 (1.7%) | 152 (1.2%) |
| 65 to 74 Years | 98 (5.9%) | 111 (5.4%) |
| 75 Years and over | 77 (9.7%) | 101 (6.2%) |
Disability Class: Cognitive Difficulty
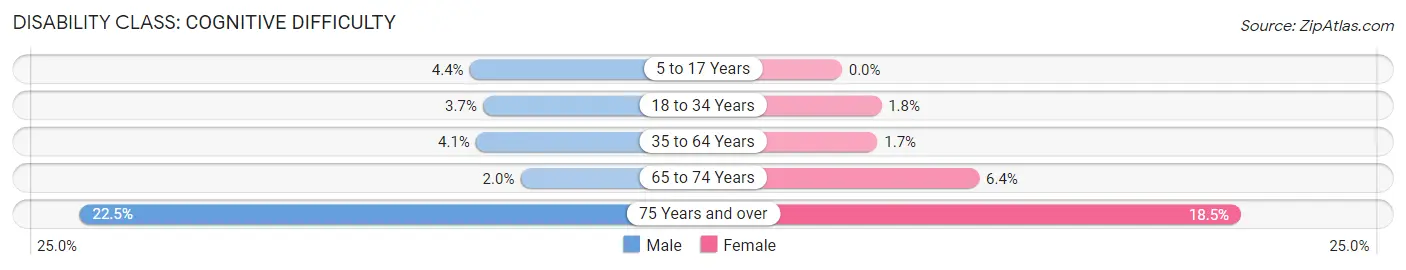
| Age Bracket | Male | Female |
| 5 to 17 Years | 202 (4.4%) | 0 (0.0%) |
| 18 to 34 Years | 229 (3.7%) | 94 (1.8%) |
| 35 to 64 Years | 417 (4.1%) | 204 (1.7%) |
| 65 to 74 Years | 33 (2.0%) | 130 (6.4%) |
| 75 Years and over | 178 (22.5%) | 300 (18.5%) |
Disability Class: Ambulatory Difficulty
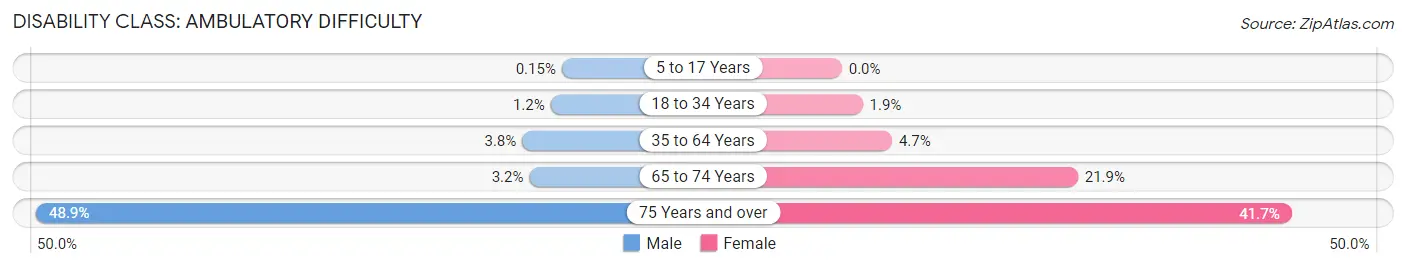
| Age Bracket | Male | Female |
| 5 to 17 Years | 7 (0.2%) | 0 (0.0%) |
| 18 to 34 Years | 73 (1.2%) | 99 (1.9%) |
| 35 to 64 Years | 393 (3.8%) | 575 (4.7%) |
| 65 to 74 Years | 52 (3.2%) | 447 (21.9%) |
| 75 Years and over | 388 (48.9%) | 676 (41.7%) |
Disability Class: Self-Care Difficulty
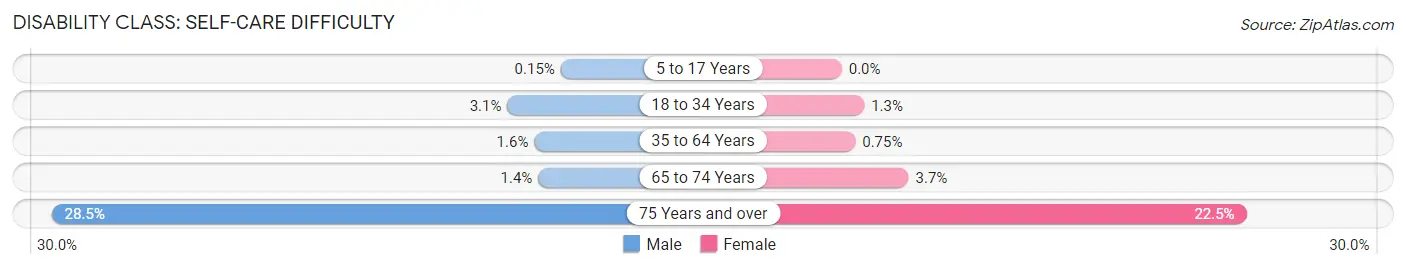
| Age Bracket | Male | Female |
| 5 to 17 Years | 7 (0.2%) | 0 (0.0%) |
| 18 to 34 Years | 191 (3.1%) | 64 (1.3%) |
| 35 to 64 Years | 166 (1.6%) | 92 (0.7%) |
| 65 to 74 Years | 23 (1.4%) | 76 (3.7%) |
| 75 Years and over | 226 (28.5%) | 365 (22.5%) |
Technology Access in Country Club
Computing Device Access in Country Club
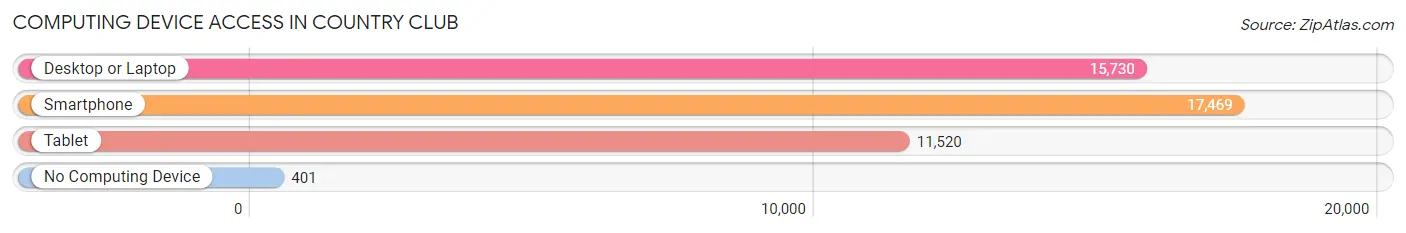
| Device Type | # Households | % Households |
| Desktop or Laptop | 15,730 | 86.3% |
| Smartphone | 17,469 | 95.8% |
| Tablet | 11,520 | 63.2% |
| No Computing Device | 401 | 2.2% |
| Total | 18,236 | 100.0% |
Internet Access in Country Club
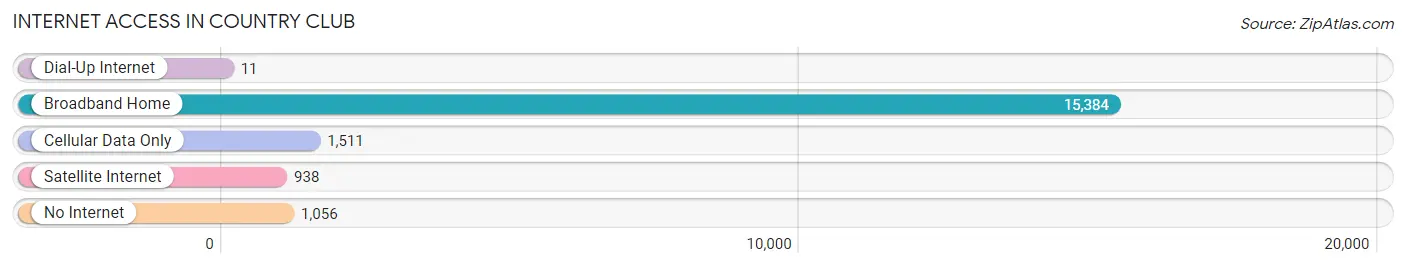
| Internet Type | # Households | % Households |
| Dial-Up Internet | 11 | 0.1% |
| Broadband Home | 15,384 | 84.4% |
| Cellular Data Only | 1,511 | 8.3% |
| Satellite Internet | 938 | 5.1% |
| No Internet | 1,056 | 5.8% |
| Total | 18,236 | 100.0% |
Country Club Summary
Club, FL is a small town located in Miami-Dade County, Florida. It is situated on the eastern edge of the Everglades, just south of Miami. The town is known for its lush tropical landscape, its vibrant nightlife, and its close proximity to the beaches of South Florida.
History
The area that is now Country Club, FL was originally inhabited by the Tequesta Indians. The Tequesta were a peaceful tribe that lived in the area for centuries before the arrival of Europeans. In the late 1700s, the Spanish began to settle in the area, and by the early 1800s, the area was part of the United States.
In the late 1800s, the area was developed as a resort community. The area was known as the “Country Club District” and was home to some of the most exclusive resorts in the area. The area was also home to some of the most luxurious homes in the area.
In the early 1900s, the area was annexed by the City of Miami. The area was then developed as a residential neighborhood. The area was known for its lush tropical landscape and its close proximity to the beaches of South Florida.
Geography
Country Club, FL is located in Miami-Dade County, Florida. It is situated on the eastern edge of the Everglades, just south of Miami. The town is bordered by the cities of Miami, Coral Gables, and South Miami. The town is located on the Atlantic Ocean and is home to several beaches, including Miami Beach, South Beach, and Key Biscayne.
The town is home to several parks, including the Country Club Park, which is a large public park with a lake, playgrounds, and picnic areas. The town is also home to several golf courses, including the Country Club of Miami, which is one of the oldest golf courses in the area.
Economy
The economy of Country Club, FL is largely based on tourism. The town is home to several resorts, hotels, and restaurants, which attract visitors from all over the world. The town is also home to several shopping centers, which offer a variety of retail stores and restaurants.
The town is also home to several businesses, including banks, insurance companies, and real estate firms. The town is also home to several medical centers, which provide medical care to the residents of the town.
Demographics
As of the 2010 census, the population of Country Club, FL was 8,945. The population is largely made up of Hispanic and Latino Americans, who make up the majority of the population. The town is also home to a large number of African Americans, who make up about 10% of the population. The town is also home to a small number of Asian Americans, who make up about 2% of the population.
The median household income in Country Club, FL is $50,845, which is slightly higher than the national average. The median home value in the town is $250,000, which is slightly higher than the national average. The town has a low unemployment rate, which is below the national average.
Conclusion
Country Club, FL is a small town located in Miami-Dade County, Florida. It is situated on the eastern edge of the Everglades, just south of Miami. The town is known for its lush tropical landscape, its vibrant nightlife, and its close proximity to the beaches of South Florida. The town has a diverse population, with a majority of Hispanic and Latino Americans, as well as a small number of African Americans and Asian Americans. The town has a strong economy, which is largely based on tourism, and a low unemployment rate.
Common Questions
What is the Total Population of Country Club?
Total Population of Country Club is 50,975.
What is the Total Male Population of Country Club?
Total Male Population of Country Club is 24,885.
What is the Total Female Population of Country Club?
Total Female Population of Country Club is 26,090.
What is the Ratio of Males per 100 Females in Country Club?
There are 95.38 Males per 100 Females in Country Club.
What is the Ratio of Females per 100 Males in Country Club?
There are 104.84 Females per 100 Males in Country Club.
What is the Median Population Age in Country Club?
Median Population Age in Country Club is 39.8 Years.
What is the Average Family Size in Country Club
Average Family Size in Country Club is 3.2 People.
What is the Average Household Size in Country Club
Average Household Size in Country Club is 2.8 People.
What is Per Capita Income in Country Club?
Per Capita income in Country Club is $28,902.
What is the Median Family Income in Country Club?
Median Family Income in Country Club is $67,733.
What is the Median Household income in Country Club?
Median Household Income in Country Club is $66,140.
What is Income or Wage Gap in Country Club?
Income or Wage Gap in Country Club is 18.1%.
Women in Country Club earn 81.9 cents for every dollar earned by a man.
What is Family Income Deficit in Country Club?
Family Income Deficit in Country Club is $10,836.
Families that are below poverty line in Country Club earn $10,836 less on average than the poverty threshold level.
What is Inequality or Gini Index in Country Club?
Inequality or Gini Index in Country Club is 0.40.
How Large is the Labor Force in Country Club?
There are 29,510 People in the Labor Forcein in Country Club.
What is the Percentage of People in the Labor Force in Country Club?
71.0% of People are in the Labor Force in Country Club.
What is the Unemployment Rate in Country Club?
Unemployment Rate in Country Club is 4.6%.