Hialeah, FL
Hialeah Map
Hialeah Overview
222,996
TOTAL POPULATION
108,532
MALE POPULATION
114,464
FEMALE POPULATION
94.82
MALES / 100 FEMALES
105.47
FEMALES / 100 MALES
45.5
MEDIAN AGE
3.2
AVG FAMILY SIZE
2.9
AVG HOUSEHOLD SIZE
$24,295
PER CAPITA INCOME
$55,066
AVG FAMILY INCOME
$49,531
AVG HOUSEHOLD INCOME
24.2%
WAGE / INCOME GAP [ % ]
75.8¢/ $1
WAGE / INCOME GAP [ $ ]
$8,386
FAMILY INCOME DEFICIT
0.47
INEQUALITY / GINI INDEX
117,073
LABOR FORCE [ PEOPLE ]
61.7%
PERCENT IN LABOR FORCE
3.7%
UNEMPLOYMENT RATE
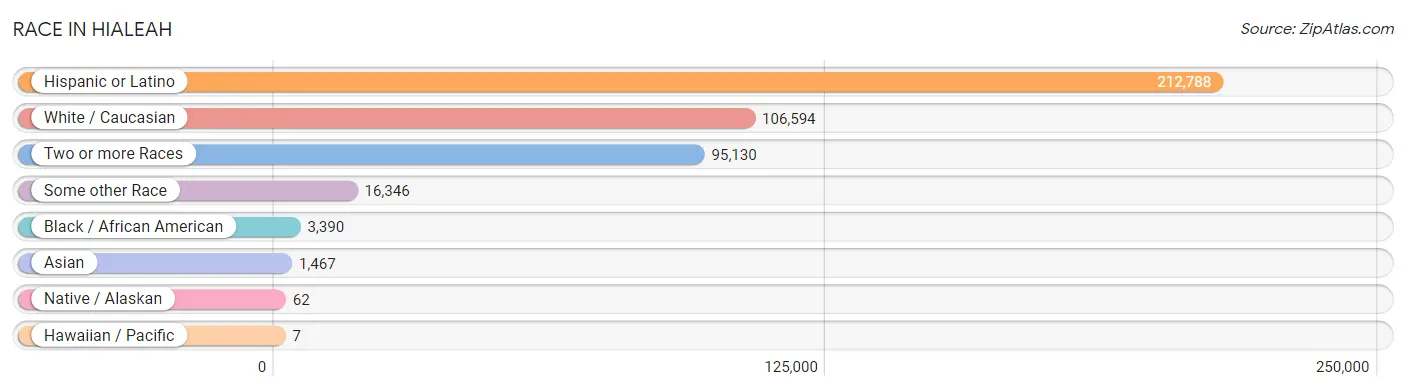
Race in Hialeah
The most populous races in Hialeah are Hispanic or Latino (212,788 | 95.4%), White / Caucasian (106,594 | 47.8%), and Two or more Races (95,130 | 42.7%).
| Race | # Population | % Population |
| Asian | 1,467 | 0.7% |
| Black / African American | 3,390 | 1.5% |
| Hawaiian / Pacific | 7 | 0.0% |
| Hispanic or Latino | 212,788 | 95.4% |
| Native / Alaskan | 62 | 0.0% |
| White / Caucasian | 106,594 | 47.8% |
| Two or more Races | 95,130 | 42.7% |
| Some other Race | 16,346 | 7.3% |
| Total | 222,996 | 100.0% |
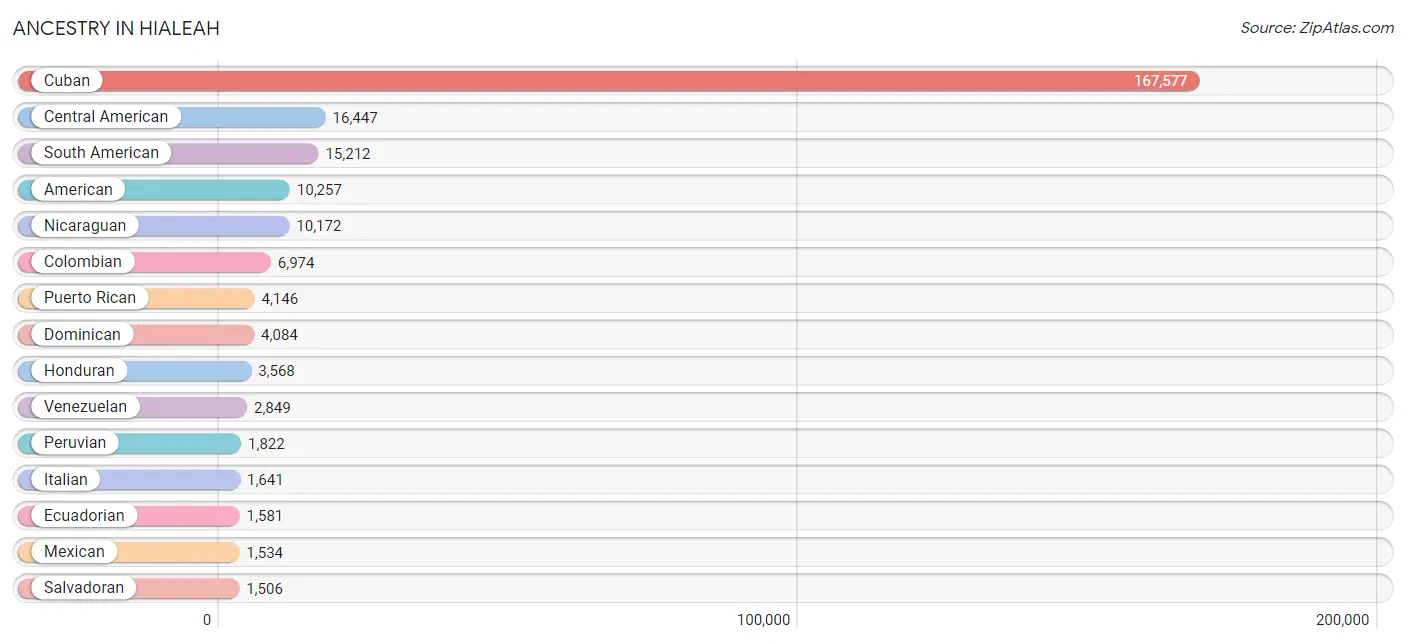
Ancestry in Hialeah
The most populous ancestries reported in Hialeah are Cuban (167,577 | 75.1%), Central American (16,447 | 7.4%), South American (15,212 | 6.8%), American (10,257 | 4.6%), and Nicaraguan (10,172 | 4.6%), together accounting for 98.5% of all Hialeah residents.
| Ancestry | # Population | % Population |
| Afghan | 124 | 0.1% |
| African | 276 | 0.1% |
| Alaska Native | 4 | 0.0% |
| American | 10,257 | 4.6% |
| Arab | 493 | 0.2% |
| Argentinean | 927 | 0.4% |
| Austrian | 33 | 0.0% |
| Bahamian | 4 | 0.0% |
| Barbadian | 15 | 0.0% |
| Blackfeet | 8 | 0.0% |
| Bolivian | 27 | 0.0% |
| Brazilian | 178 | 0.1% |
| British | 130 | 0.1% |
| Burmese | 45 | 0.0% |
| Canadian | 27 | 0.0% |
| Central American | 16,447 | 7.4% |
| Central American Indian | 62 | 0.0% |
| Cherokee | 38 | 0.0% |
| Chilean | 590 | 0.3% |
| Chippewa | 5 | 0.0% |
| Colombian | 6,974 | 3.1% |
| Costa Rican | 406 | 0.2% |
| Cuban | 167,577 | 75.1% |
| Czech | 7 | 0.0% |
| Danish | 55 | 0.0% |
| Dominican | 4,084 | 1.8% |
| Dutch | 105 | 0.1% |
| Ecuadorian | 1,581 | 0.7% |
| English | 336 | 0.2% |
| European | 361 | 0.2% |
| Finnish | 29 | 0.0% |
| French | 398 | 0.2% |
| French Canadian | 40 | 0.0% |
| German | 659 | 0.3% |
| Greek | 25 | 0.0% |
| Guamanian / Chamorro | 17 | 0.0% |
| Guatemalan | 486 | 0.2% |
| Haitian | 340 | 0.2% |
| Honduran | 3,568 | 1.6% |
| Hungarian | 29 | 0.0% |
| Indian (Asian) | 885 | 0.4% |
| Iranian | 15 | 0.0% |
| Irish | 412 | 0.2% |
| Italian | 1,641 | 0.7% |
| Jamaican | 173 | 0.1% |
| Korean | 205 | 0.1% |
| Lebanese | 423 | 0.2% |
| Lithuanian | 14 | 0.0% |
| Mexican | 1,534 | 0.7% |
| Mexican American Indian | 120 | 0.1% |
| Native Hawaiian | 7 | 0.0% |
| Nicaraguan | 10,172 | 4.6% |
| Northern European | 27 | 0.0% |
| Norwegian | 35 | 0.0% |
| Panamanian | 309 | 0.1% |
| Paraguayan | 149 | 0.1% |
| Peruvian | 1,822 | 0.8% |
| Polish | 101 | 0.1% |
| Portuguese | 434 | 0.2% |
| Puerto Rican | 4,146 | 1.9% |
| Romanian | 65 | 0.0% |
| Russian | 108 | 0.1% |
| Salvadoran | 1,506 | 0.7% |
| Scandinavian | 25 | 0.0% |
| Scottish | 40 | 0.0% |
| Seminole | 1 | 0.0% |
| Serbian | 31 | 0.0% |
| South American | 15,212 | 6.8% |
| South American Indian | 35 | 0.0% |
| Spaniard | 841 | 0.4% |
| Spanish | 471 | 0.2% |
| Spanish American | 49 | 0.0% |
| Spanish American Indian | 11 | 0.0% |
| Sri Lankan | 117 | 0.1% |
| Subsaharan African | 276 | 0.1% |
| Swedish | 35 | 0.0% |
| Syrian | 7 | 0.0% |
| Thai | 168 | 0.1% |
| Trinidadian and Tobagonian | 41 | 0.0% |
| Turkish | 5 | 0.0% |
| Uruguayan | 293 | 0.1% |
| Venezuelan | 2,849 | 1.3% |
| Vietnamese | 111 | 0.1% |
| West Indian | 134 | 0.1% | View All 84 Rows |
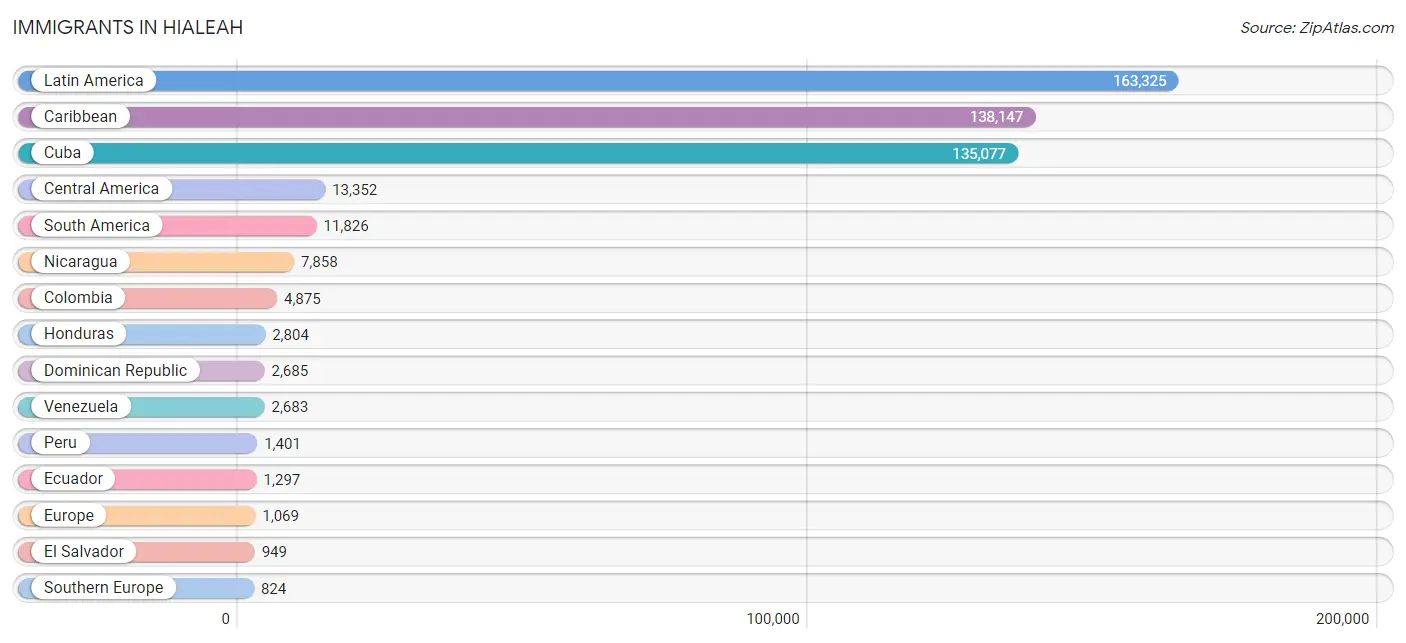
Immigrants in Hialeah
The most numerous immigrant groups reported in Hialeah came from Latin America (163,325 | 73.2%), Caribbean (138,147 | 62.0%), Cuba (135,077 | 60.6%), Central America (13,352 | 6.0%), and South America (11,826 | 5.3%), together accounting for 207.1% of all Hialeah residents.
| Immigration Origin | # Population | % Population |
| Afghanistan | 31 | 0.0% |
| Africa | 11 | 0.0% |
| Argentina | 733 | 0.3% |
| Asia | 809 | 0.4% |
| Bahamas | 21 | 0.0% |
| Bangladesh | 52 | 0.0% |
| Belarus | 6 | 0.0% |
| Bolivia | 24 | 0.0% |
| Brazil | 223 | 0.1% |
| Cameroon | 5 | 0.0% |
| Canada | 31 | 0.0% |
| Caribbean | 138,147 | 62.0% |
| Central America | 13,352 | 6.0% |
| Chile | 292 | 0.1% |
| China | 425 | 0.2% |
| Colombia | 4,875 | 2.2% |
| Costa Rica | 235 | 0.1% |
| Cuba | 135,077 | 60.6% |
| Dominica | 22 | 0.0% |
| Dominican Republic | 2,685 | 1.2% |
| Eastern Africa | 6 | 0.0% |
| Eastern Asia | 443 | 0.2% |
| Eastern Europe | 147 | 0.1% |
| Ecuador | 1,297 | 0.6% |
| El Salvador | 949 | 0.4% |
| England | 34 | 0.0% |
| Europe | 1,069 | 0.5% |
| Germany | 64 | 0.0% |
| Guatemala | 439 | 0.2% |
| Guyana | 15 | 0.0% |
| Haiti | 212 | 0.1% |
| Honduras | 2,804 | 1.3% |
| India | 81 | 0.0% |
| Italy | 112 | 0.1% |
| Jamaica | 49 | 0.0% |
| Korea | 18 | 0.0% |
| Latin America | 163,325 | 73.2% |
| Lebanon | 22 | 0.0% |
| Mexico | 784 | 0.4% |
| Micronesia | 35 | 0.0% |
| Middle Africa | 5 | 0.0% |
| Nicaragua | 7,858 | 3.5% |
| Northern Europe | 34 | 0.0% |
| Oceania | 35 | 0.0% |
| Pakistan | 116 | 0.1% |
| Panama | 283 | 0.1% |
| Peru | 1,401 | 0.6% |
| Philippines | 18 | 0.0% |
| Portugal | 14 | 0.0% |
| Romania | 107 | 0.1% |
| Russia | 20 | 0.0% |
| Serbia | 14 | 0.0% |
| South America | 11,826 | 5.3% |
| South Central Asia | 280 | 0.1% |
| South Eastern Asia | 64 | 0.0% |
| Southern Europe | 824 | 0.4% |
| Spain | 698 | 0.3% |
| Trinidad and Tobago | 41 | 0.0% |
| Uruguay | 234 | 0.1% |
| Venezuela | 2,683 | 1.2% |
| Vietnam | 46 | 0.0% |
| West Indies | 15 | 0.0% |
| Western Asia | 22 | 0.0% |
| Western Europe | 64 | 0.0% | View All 64 Rows |
Sex and Age in Hialeah
Sex and Age in Hialeah
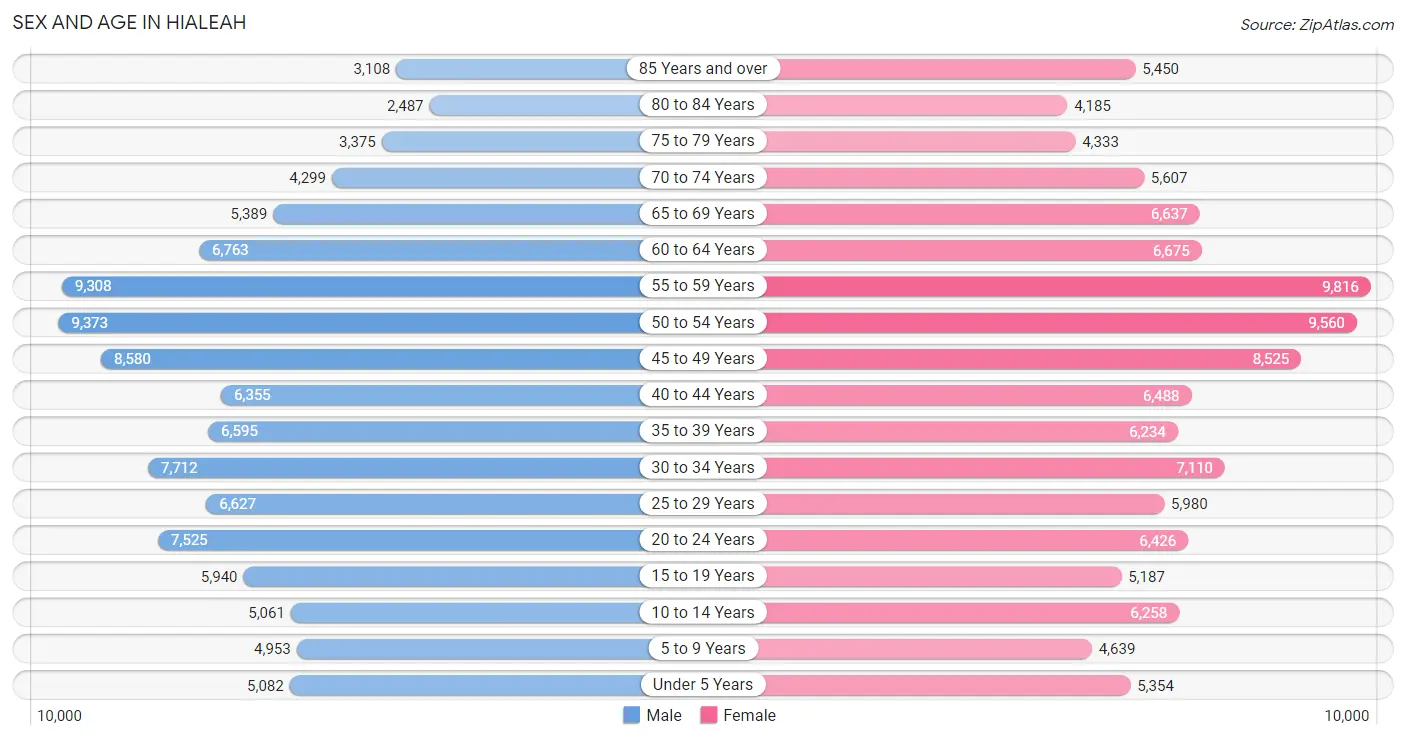
The most populous age groups in Hialeah are 50 to 54 Years (9,373 | 8.6%) for men and 55 to 59 Years (9,816 | 8.6%) for women.
| Age Bracket | Male | Female |
| Under 5 Years | 5,082 (4.7%) | 5,354 (4.7%) |
| 5 to 9 Years | 4,953 (4.6%) | 4,639 (4.1%) |
| 10 to 14 Years | 5,061 (4.7%) | 6,258 (5.5%) |
| 15 to 19 Years | 5,940 (5.5%) | 5,187 (4.5%) |
| 20 to 24 Years | 7,525 (6.9%) | 6,426 (5.6%) |
| 25 to 29 Years | 6,627 (6.1%) | 5,980 (5.2%) |
| 30 to 34 Years | 7,712 (7.1%) | 7,110 (6.2%) |
| 35 to 39 Years | 6,595 (6.1%) | 6,234 (5.4%) |
| 40 to 44 Years | 6,355 (5.9%) | 6,488 (5.7%) |
| 45 to 49 Years | 8,580 (7.9%) | 8,525 (7.4%) |
| 50 to 54 Years | 9,373 (8.6%) | 9,560 (8.4%) |
| 55 to 59 Years | 9,308 (8.6%) | 9,816 (8.6%) |
| 60 to 64 Years | 6,763 (6.2%) | 6,675 (5.8%) |
| 65 to 69 Years | 5,389 (5.0%) | 6,637 (5.8%) |
| 70 to 74 Years | 4,299 (4.0%) | 5,607 (4.9%) |
| 75 to 79 Years | 3,375 (3.1%) | 4,333 (3.8%) |
| 80 to 84 Years | 2,487 (2.3%) | 4,185 (3.7%) |
| 85 Years and over | 3,108 (2.9%) | 5,450 (4.8%) |
| Total | 108,532 (100.0%) | 114,464 (100.0%) |
Families and Households in Hialeah
Median Family Size in Hialeah
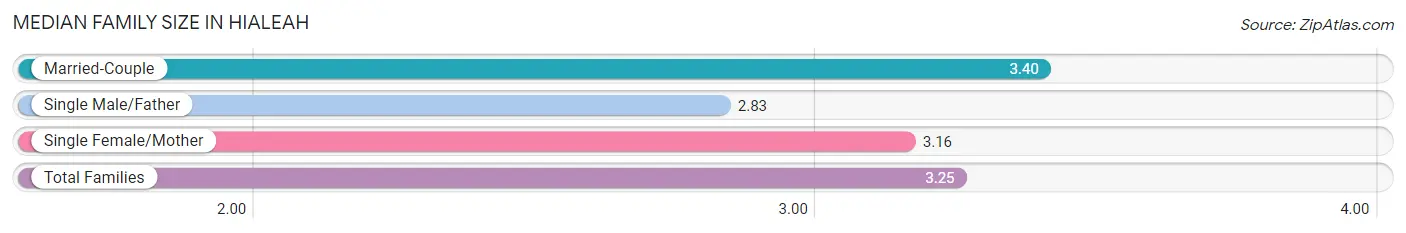
The median family size in Hialeah is 3.25 persons per family, with married-couple families (32,407 | 57.4%) accounting for the largest median family size of 3.4 persons per family. On the other hand, single male/father families (7,388 | 13.1%) represent the smallest median family size with 2.83 persons per family.
| Family Type | # Families | Family Size |
| Married-Couple | 32,407 (57.4%) | 3.40 |
| Single Male/Father | 7,388 (13.1%) | 2.83 |
| Single Female/Mother | 16,666 (29.5%) | 3.16 |
| Total Families | 56,461 (100.0%) | 3.25 |
Median Household Size in Hialeah
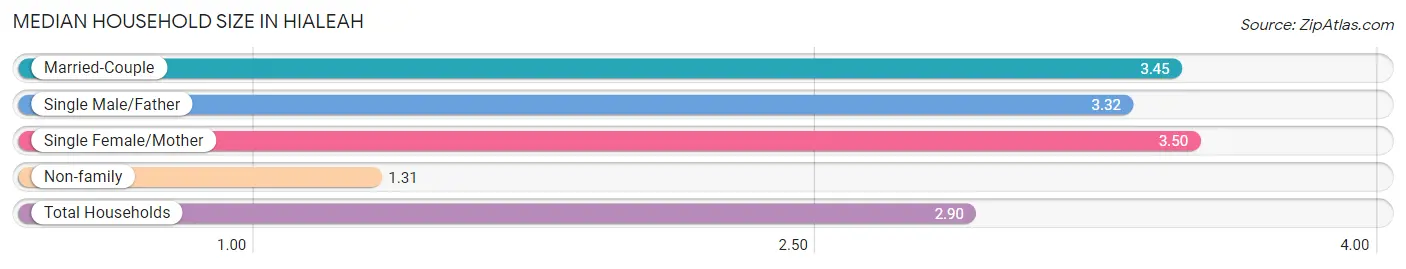
The median household size in Hialeah is 2.90 persons per household, with single female/mother households (16,666 | 21.9%) accounting for the largest median household size of 3.5 persons per household. non-family households (19,794 | 26.0%) represent the smallest median household size with 1.31 persons per household.
| Household Type | # Households | Household Size |
| Married-Couple | 32,407 (42.5%) | 3.45 |
| Single Male/Father | 7,388 (9.7%) | 3.32 |
| Single Female/Mother | 16,666 (21.9%) | 3.50 |
| Non-family | 19,794 (26.0%) | 1.31 |
| Total Households | 76,255 (100.0%) | 2.90 |
Household Size by Marriage Status in Hialeah
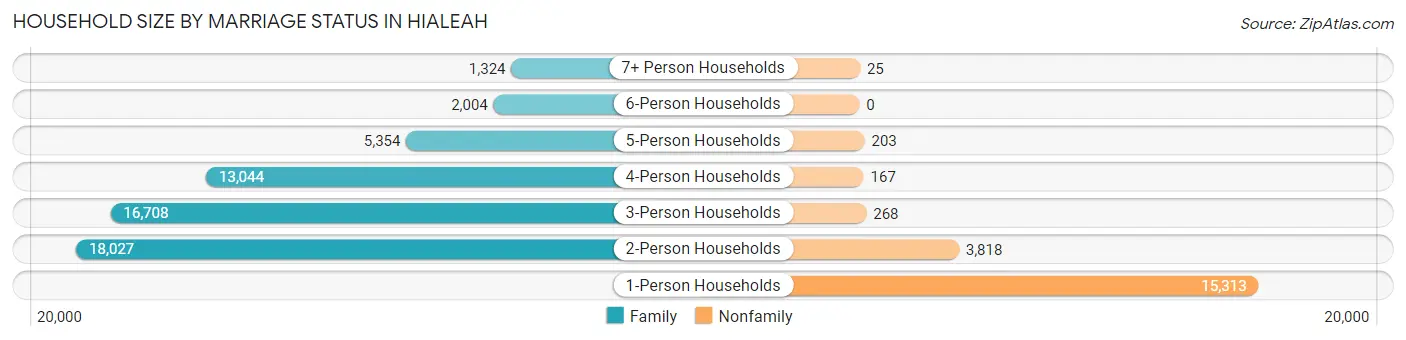
Out of a total of 76,255 households in Hialeah, 56,461 (74.0%) are family households, while 19,794 (26.0%) are nonfamily households. The most numerous type of family households are 2-person households, comprising 18,027, and the most common type of nonfamily households are 1-person households, comprising 15,313.
| Household Size | Family Households | Nonfamily Households |
| 1-Person Households | - | 15,313 (20.1%) |
| 2-Person Households | 18,027 (23.6%) | 3,818 (5.0%) |
| 3-Person Households | 16,708 (21.9%) | 268 (0.4%) |
| 4-Person Households | 13,044 (17.1%) | 167 (0.2%) |
| 5-Person Households | 5,354 (7.0%) | 203 (0.3%) |
| 6-Person Households | 2,004 (2.6%) | 0 (0.0%) |
| 7+ Person Households | 1,324 (1.7%) | 25 (0.0%) |
| Total | 56,461 (74.0%) | 19,794 (26.0%) |
Female Fertility in Hialeah
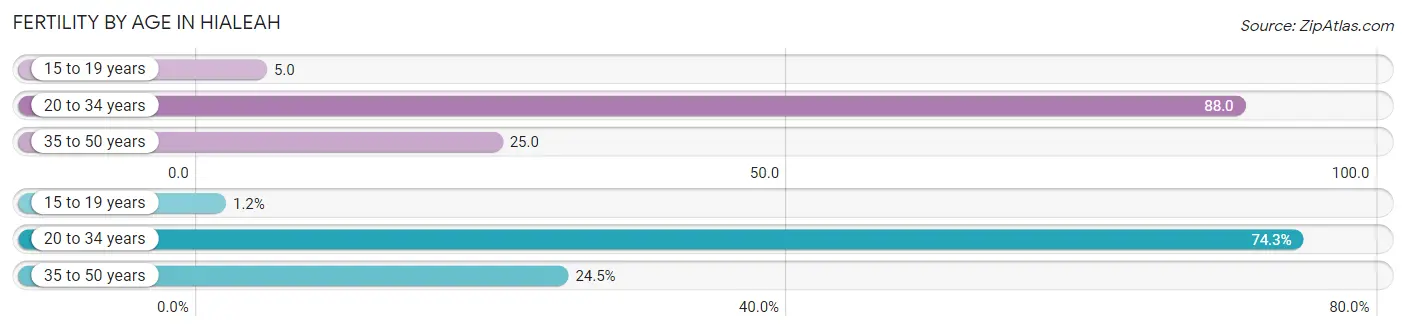
Fertility by Age in Hialeah
Average fertility rate in Hialeah is 48.0 births per 1,000 women. Women in the age bracket of 20 to 34 years have the highest fertility rate with 88.0 births per 1,000 women. Women in the age bracket of 20 to 34 years acount for 74.3% of all women with births.
| Age Bracket | Women with Births | Births / 1,000 Women |
| 15 to 19 years | 28 (1.2%) | 5.0 |
| 20 to 34 years | 1,711 (74.3%) | 88.0 |
| 35 to 50 years | 563 (24.5%) | 25.0 |
| Total | 2,302 (100.0%) | 48.0 |
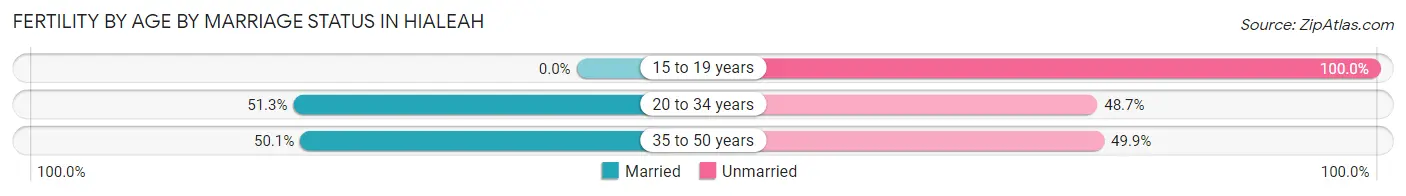
Fertility by Age by Marriage Status in Hialeah
50.4% of women with births (2,302) in Hialeah are married. The highest percentage of unmarried women with births falls into 15 to 19 years age bracket with 100.0% of them unmarried at the time of birth, while the lowest percentage of unmarried women with births belong to 20 to 34 years age bracket with 48.7% of them unmarried.
| Age Bracket | Married | Unmarried |
| 15 to 19 years | 0 (0.0%) | 28 (100.0%) |
| 20 to 34 years | 878 (51.3%) | 833 (48.7%) |
| 35 to 50 years | 282 (50.1%) | 281 (49.9%) |
| Total | 1,160 (50.4%) | 1,142 (49.6%) |
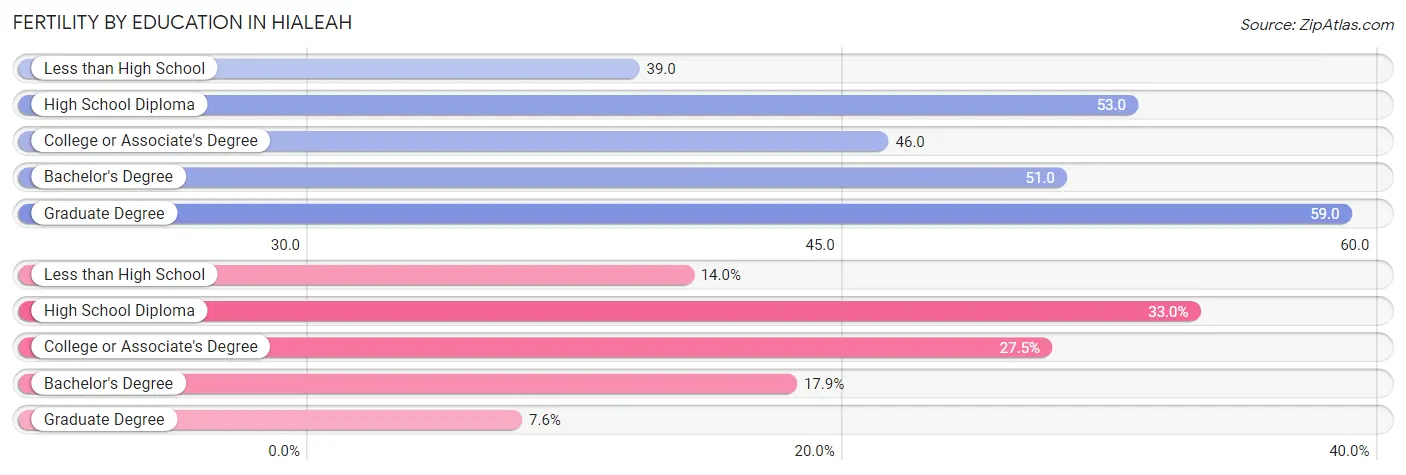
Fertility by Education in Hialeah
Average fertility rate in Hialeah is 48.0 births per 1,000 women. Women with the education attainment of graduate degree have the highest fertility rate of 59.0 births per 1,000 women, while women with the education attainment of less than high school have the lowest fertility at 39.0 births per 1,000 women. Women with the education attainment of high school diploma represent 33.0% of all women with births.
| Educational Attainment | Women with Births | Births / 1,000 Women |
| Less than High School | 323 (14.0%) | 39.0 |
| High School Diploma | 760 (33.0%) | 53.0 |
| College or Associate's Degree | 632 (27.5%) | 46.0 |
| Bachelor's Degree | 412 (17.9%) | 51.0 |
| Graduate Degree | 175 (7.6%) | 59.0 |
| Total | 2,302 (100.0%) | 48.0 |
Fertility by Education by Marriage Status in Hialeah
49.6% of women with births in Hialeah are unmarried. Women with the educational attainment of bachelor's degree are most likely to be married with 72.8% of them married at childbirth, while women with the educational attainment of high school diploma are least likely to be married with 64.3% of them unmarried at childbirth.

| Educational Attainment | Married | Unmarried |
| Less than High School | 140 (43.3%) | 183 (56.7%) |
| High School Diploma | 271 (35.7%) | 489 (64.3%) |
| College or Associate's Degree | 344 (54.4%) | 288 (45.6%) |
| Bachelor's Degree | 300 (72.8%) | 112 (27.2%) |
| Graduate Degree | 105 (60.0%) | 70 (40.0%) |
| Total | 1,160 (50.4%) | 1,142 (49.6%) |
Income in Hialeah
Income Overview in Hialeah
Per Capita Income in Hialeah is $24,295, while median incomes of families and households are $55,066 and $49,531 respectively.
| Characteristic | Number | Measure |
| Per Capita Income | 222,996 | $24,295 |
| Median Family Income | 56,461 | $55,066 |
| Mean Family Income | 56,461 | $73,270 |
| Median Household Income | 76,255 | $49,531 |
| Mean Household Income | 76,255 | $67,710 |
| Income Deficit | 56,461 | $8,386 |
| Wage / Income Gap (%) | 222,996 | 24.25% |
| Wage / Income Gap ($) | 222,996 | 75.75¢ per $1 |
| Gini / Inequality Index | 222,996 | 0.47 |
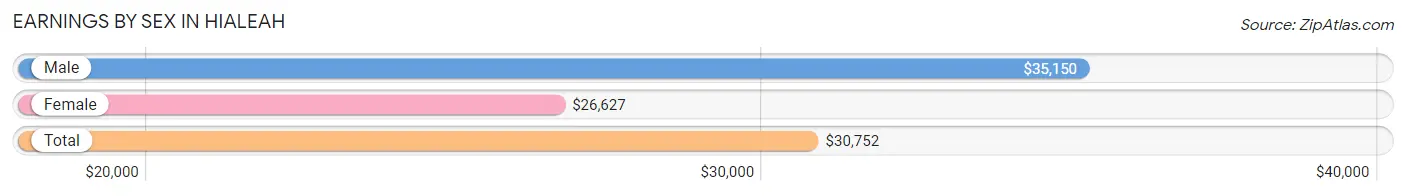
Earnings by Sex in Hialeah
Average Earnings in Hialeah are $30,752, $35,150 for men and $26,627 for women, a difference of 24.2%.
| Sex | Number | Average Earnings |
| Male | 64,511 (54.3%) | $35,150 |
| Female | 54,231 (45.7%) | $26,627 |
| Total | 118,742 (100.0%) | $30,752 |
Earnings by Sex by Income Bracket in Hialeah
The most common earnings brackets in Hialeah are $25,000 to $29,999 for men (6,571 | 10.2%) and $25,000 to $29,999 for women (5,804 | 10.7%).

| Income | Male | Female |
| $2,499 or less | 1,416 (2.2%) | 1,366 (2.5%) |
| $2,500 to $4,999 | 859 (1.3%) | 1,518 (2.8%) |
| $5,000 to $7,499 | 1,298 (2.0%) | 1,847 (3.4%) |
| $7,500 to $9,999 | 1,747 (2.7%) | 2,171 (4.0%) |
| $10,000 to $12,499 | 2,152 (3.3%) | 2,535 (4.7%) |
| $12,500 to $14,999 | 2,293 (3.5%) | 3,467 (6.4%) |
| $15,000 to $17,499 | 2,276 (3.5%) | 3,005 (5.5%) |
| $17,500 to $19,999 | 1,884 (2.9%) | 3,492 (6.4%) |
| $20,000 to $22,499 | 2,851 (4.4%) | 2,625 (4.8%) |
| $22,500 to $24,999 | 3,630 (5.6%) | 3,259 (6.0%) |
| $25,000 to $29,999 | 6,571 (10.2%) | 5,804 (10.7%) |
| $30,000 to $34,999 | 5,111 (7.9%) | 5,249 (9.7%) |
| $35,000 to $39,999 | 5,343 (8.3%) | 3,128 (5.8%) |
| $40,000 to $44,999 | 4,742 (7.3%) | 3,180 (5.9%) |
| $45,000 to $49,999 | 3,788 (5.9%) | 2,362 (4.4%) |
| $50,000 to $54,999 | 3,273 (5.1%) | 2,149 (4.0%) |
| $55,000 to $64,999 | 5,229 (8.1%) | 2,491 (4.6%) |
| $65,000 to $74,999 | 3,014 (4.7%) | 1,404 (2.6%) |
| $75,000 to $99,999 | 3,488 (5.4%) | 2,289 (4.2%) |
| $100,000+ | 3,546 (5.5%) | 890 (1.6%) |
| Total | 64,511 (100.0%) | 54,231 (100.0%) |
Earnings by Sex by Educational Attainment in Hialeah
Average earnings in Hialeah are $37,209 for men and $27,976 for women, a difference of 24.8%. Men with an educational attainment of bachelor's degree enjoy the highest average annual earnings of $45,213, while those with less than high school education earn the least with $33,385. Women with an educational attainment of graduate degree earn the most with the average annual earnings of $48,713, while those with less than high school education have the smallest earnings of $21,020.
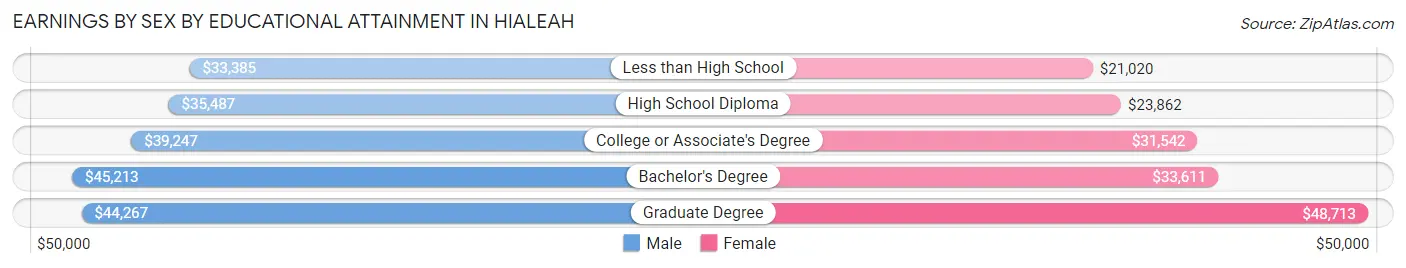
| Educational Attainment | Male Income | Female Income |
| Less than High School | $33,385 | $21,020 |
| High School Diploma | $35,487 | $23,862 |
| College or Associate's Degree | $39,247 | $31,542 |
| Bachelor's Degree | $45,213 | $33,611 |
| Graduate Degree | $44,267 | $48,713 |
| Total | $37,209 | $27,976 |
Family Income in Hialeah
Family Income Brackets in Hialeah
According to the Hialeah family income data, there are 10,276 families falling into the $50,000 to $74,999 income range, which is the most common income bracket and makes up 18.2% of all families. Conversely, the $10,000 to $14,999 income bracket is the least frequent group with only 1,637 families (2.9%) belonging to this category.
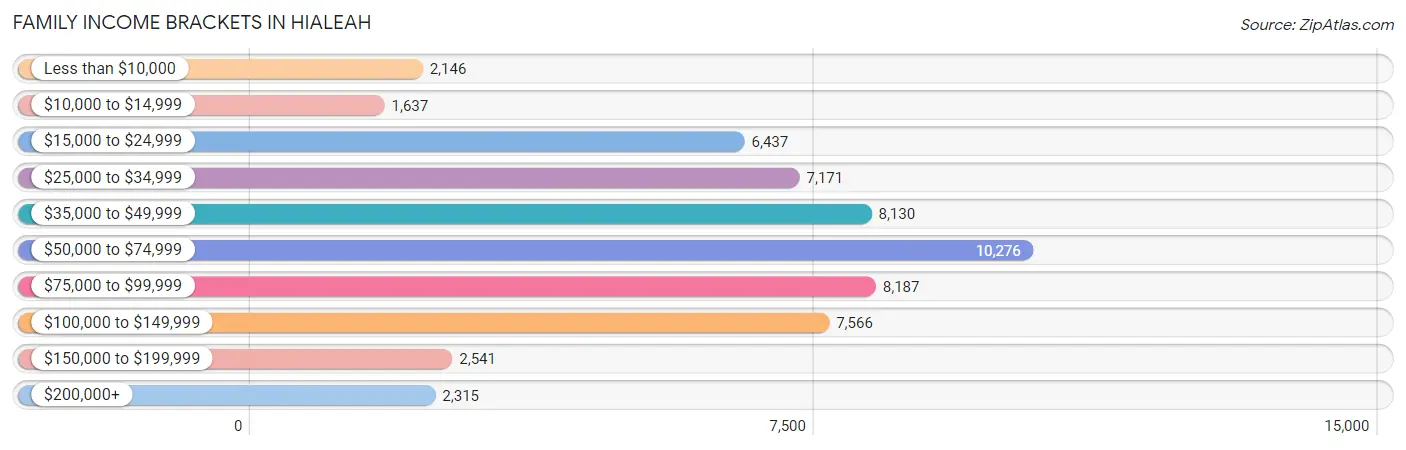
| Income Bracket | # Families | % Families |
| Less than $10,000 | 2,146 | 3.8% |
| $10,000 to $14,999 | 1,637 | 2.9% |
| $15,000 to $24,999 | 6,437 | 11.4% |
| $25,000 to $34,999 | 7,171 | 12.7% |
| $35,000 to $49,999 | 8,130 | 14.4% |
| $50,000 to $74,999 | 10,276 | 18.2% |
| $75,000 to $99,999 | 8,187 | 14.5% |
| $100,000 to $149,999 | 7,566 | 13.4% |
| $150,000 to $199,999 | 2,541 | 4.5% |
| $200,000+ | 2,315 | 4.1% |
Family Income by Famaliy Size in Hialeah
7+ person families (996 | 1.8%) account for the highest median family income in Hialeah with $122,835 per family, while 4-person families (10,433 | 18.5%) have the highest median income of $20,906 per family member.
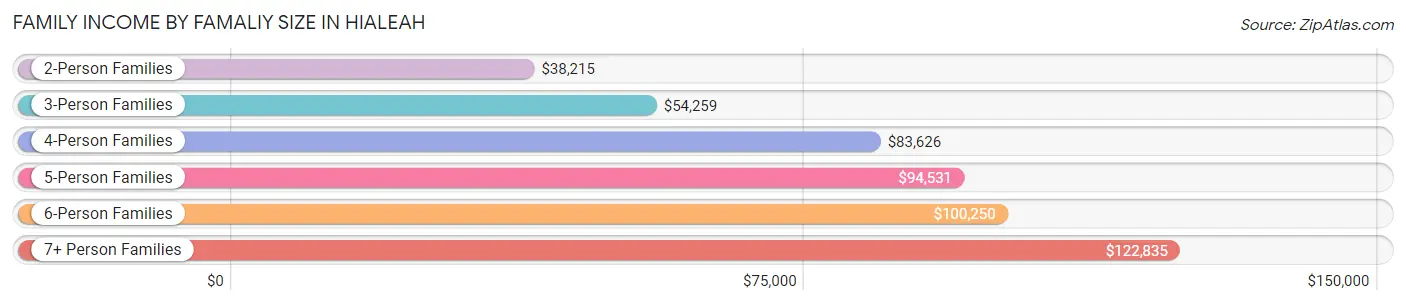
| Income Bracket | # Families | Median Income |
| 2-Person Families | 22,085 (39.1%) | $38,215 |
| 3-Person Families | 16,517 (29.2%) | $54,259 |
| 4-Person Families | 10,433 (18.5%) | $83,626 |
| 5-Person Families | 4,644 (8.2%) | $94,531 |
| 6-Person Families | 1,786 (3.2%) | $100,250 |
| 7+ Person Families | 996 (1.8%) | $122,835 |
| Total | 56,461 (100.0%) | $55,066 |
Family Income by Number of Earners in Hialeah
The median family income in Hialeah is $55,066, with families comprising 3+ earners (10,659) having the highest median family income of $112,351, while families with no earners (7,958) have the lowest median family income of $22,193, accounting for 18.9% and 14.1% of families, respectively.
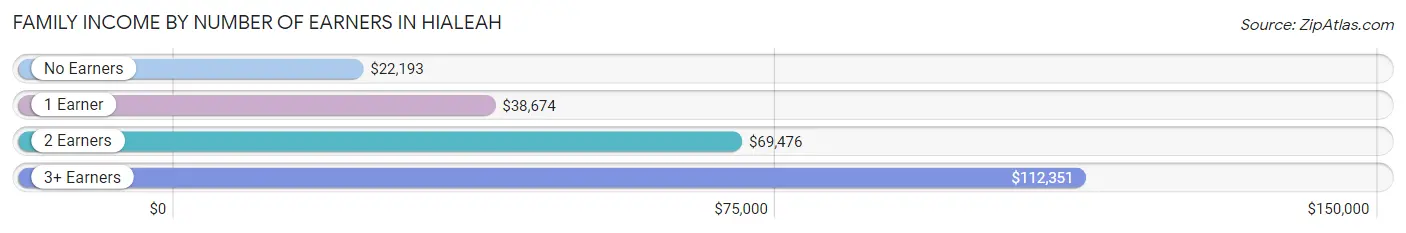
| Number of Earners | # Families | Median Income |
| No Earners | 7,958 (14.1%) | $22,193 |
| 1 Earner | 18,485 (32.7%) | $38,674 |
| 2 Earners | 19,359 (34.3%) | $69,476 |
| 3+ Earners | 10,659 (18.9%) | $112,351 |
| Total | 56,461 (100.0%) | $55,066 |
Household Income in Hialeah
Household Income Brackets in Hialeah
With 12,658 households falling in the category, the $50,000 to $74,999 income range is the most frequent in Hialeah, accounting for 16.6% of all households. In contrast, only 2,745 households (3.6%) fall into the $200,000+ income bracket, making it the least populous group.
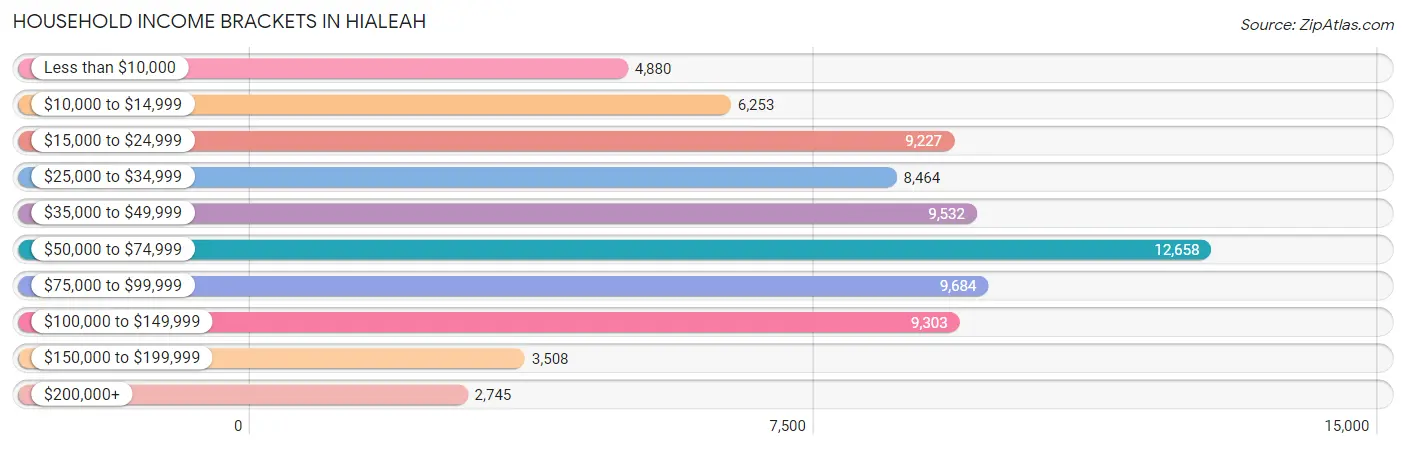
| Income Bracket | # Households | % Households |
| Less than $10,000 | 4,880 | 6.4% |
| $10,000 to $14,999 | 6,253 | 8.2% |
| $15,000 to $24,999 | 9,227 | 12.1% |
| $25,000 to $34,999 | 8,464 | 11.1% |
| $35,000 to $49,999 | 9,532 | 12.5% |
| $50,000 to $74,999 | 12,658 | 16.6% |
| $75,000 to $99,999 | 9,684 | 12.7% |
| $100,000 to $149,999 | 9,303 | 12.2% |
| $150,000 to $199,999 | 3,508 | 4.6% |
| $200,000+ | 2,745 | 3.6% |
Household Income by Householder Age in Hialeah
The median household income in Hialeah is $49,531, with the highest median household income of $62,752 found in the 45 to 64 years age bracket for the primary householder. A total of 33,251 households (43.6%) fall into this category. Meanwhile, the 65+ years age bracket for the primary householder has the lowest median household income of $23,650, with 23,261 households (30.5%) in this group.
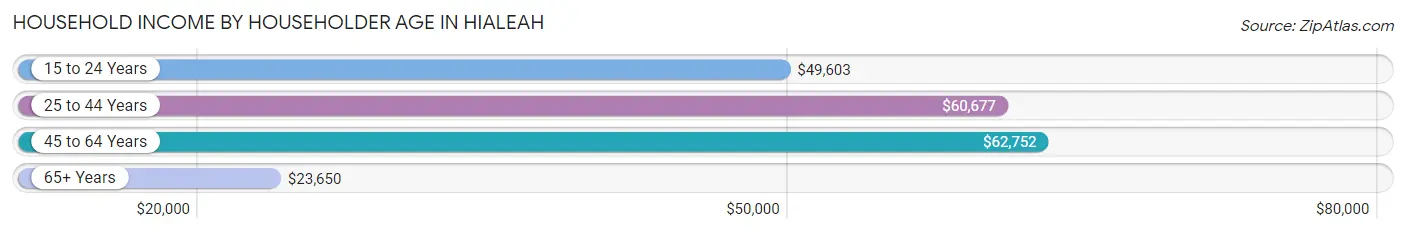
| Income Bracket | # Households | Median Income |
| 15 to 24 Years | 1,056 (1.4%) | $49,603 |
| 25 to 44 Years | 18,687 (24.5%) | $60,677 |
| 45 to 64 Years | 33,251 (43.6%) | $62,752 |
| 65+ Years | 23,261 (30.5%) | $23,650 |
| Total | 76,255 (100.0%) | $49,531 |
Poverty in Hialeah
Income Below Poverty by Sex and Age in Hialeah
With 14.6% poverty level for males and 20.8% for females among the residents of Hialeah, 75 year old and over males and 75 year old and over females are the most vulnerable to poverty, with 2,559 males (29.2%) and 4,347 females (32.3%) in their respective age groups living below the poverty level.
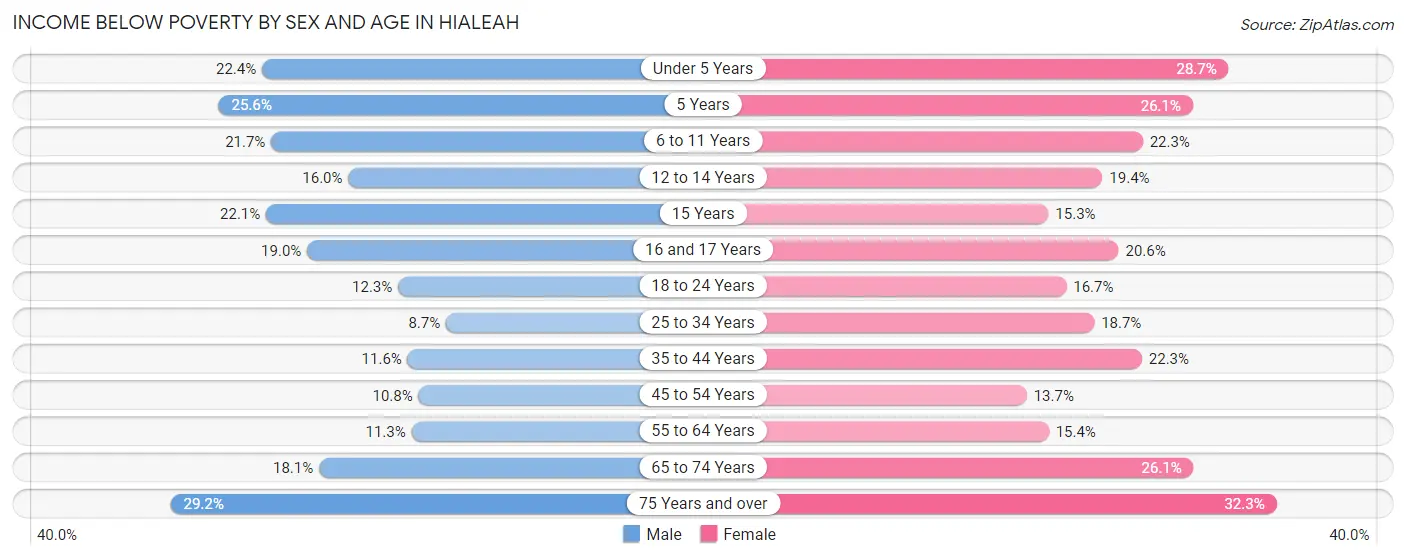
| Age Bracket | Male | Female |
| Under 5 Years | 1,134 (22.4%) | 1,519 (28.7%) |
| 5 Years | 258 (25.6%) | 228 (26.1%) |
| 6 to 11 Years | 1,291 (21.7%) | 1,306 (22.3%) |
| 12 to 14 Years | 465 (16.0%) | 792 (19.4%) |
| 15 Years | 177 (22.1%) | 166 (15.3%) |
| 16 and 17 Years | 434 (19.0%) | 426 (20.5%) |
| 18 to 24 Years | 1,271 (12.3%) | 1,410 (16.7%) |
| 25 to 34 Years | 1,246 (8.7%) | 2,452 (18.7%) |
| 35 to 44 Years | 1,497 (11.6%) | 2,831 (22.3%) |
| 45 to 54 Years | 1,927 (10.7%) | 2,482 (13.7%) |
| 55 to 64 Years | 1,799 (11.3%) | 2,530 (15.4%) |
| 65 to 74 Years | 1,740 (18.1%) | 3,189 (26.1%) |
| 75 Years and over | 2,559 (29.2%) | 4,347 (32.3%) |
| Total | 15,798 (14.6%) | 23,678 (20.8%) |
Income Above Poverty by Sex and Age in Hialeah
According to the poverty statistics in Hialeah, males aged 25 to 34 years and females aged 45 to 54 years are the age groups that are most secure financially, with 91.3% of males and 86.3% of females in these age groups living above the poverty line.
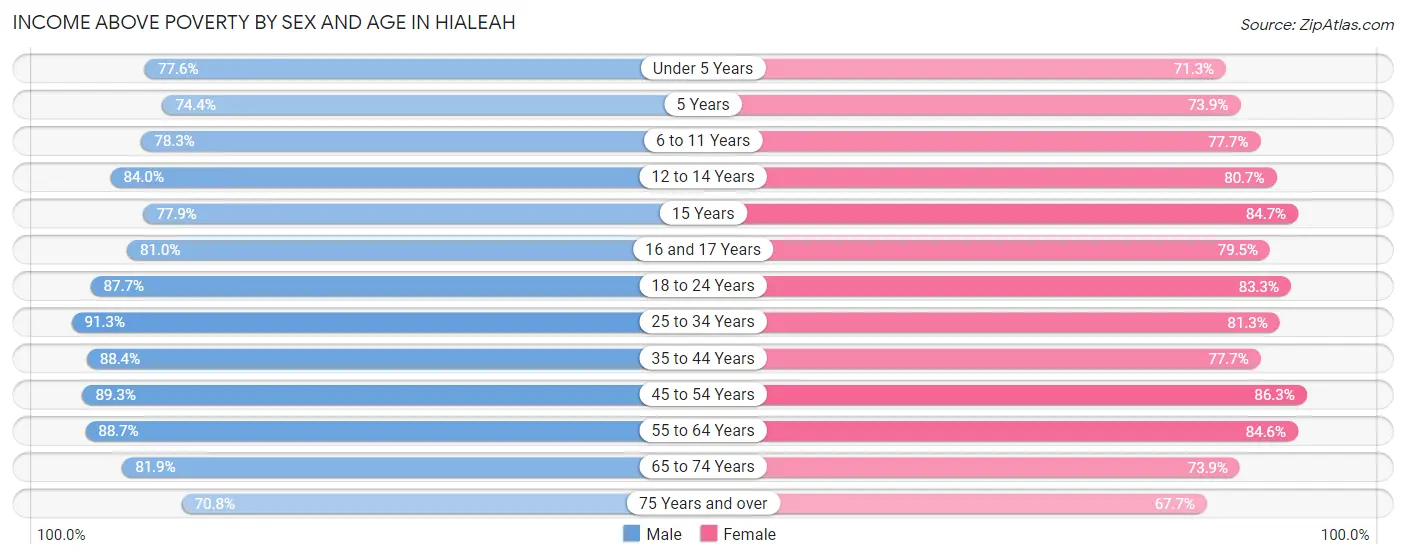
| Age Bracket | Male | Female |
| Under 5 Years | 3,936 (77.6%) | 3,771 (71.3%) |
| 5 Years | 750 (74.4%) | 647 (73.9%) |
| 6 to 11 Years | 4,661 (78.3%) | 4,541 (77.7%) |
| 12 to 14 Years | 2,449 (84.0%) | 3,302 (80.6%) |
| 15 Years | 625 (77.9%) | 916 (84.7%) |
| 16 and 17 Years | 1,848 (81.0%) | 1,647 (79.4%) |
| 18 to 24 Years | 9,088 (87.7%) | 7,048 (83.3%) |
| 25 to 34 Years | 13,055 (91.3%) | 10,631 (81.3%) |
| 35 to 44 Years | 11,453 (88.4%) | 9,874 (77.7%) |
| 45 to 54 Years | 16,002 (89.2%) | 15,597 (86.3%) |
| 55 to 64 Years | 14,168 (88.7%) | 13,936 (84.6%) |
| 65 to 74 Years | 7,853 (81.9%) | 9,020 (73.9%) |
| 75 Years and over | 6,216 (70.8%) | 9,122 (67.7%) |
| Total | 92,104 (85.4%) | 90,052 (79.2%) |
Income Below Poverty Among Married-Couple Families in Hialeah
The poverty statistics for married-couple families in Hialeah show that 9.8% or 3,187 of the total 32,407 families live below the poverty line. Families with 3 or 4 children have the highest poverty rate of 13.1%, comprising of 148 families. On the other hand, families with 5 or more children have the lowest poverty rate of 0.0%, which includes 0 families.
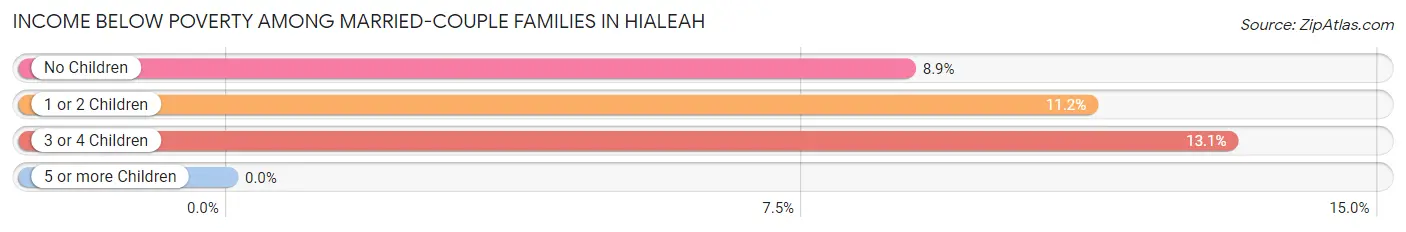
| Children | Above Poverty | Below Poverty |
| No Children | 18,133 (91.1%) | 1,761 (8.8%) |
| 1 or 2 Children | 10,099 (88.8%) | 1,278 (11.2%) |
| 3 or 4 Children | 985 (86.9%) | 148 (13.1%) |
| 5 or more Children | 3 (100.0%) | 0 (0.0%) |
| Total | 29,220 (90.2%) | 3,187 (9.8%) |
Income Below Poverty Among Single-Parent Households in Hialeah
According to the poverty data in Hialeah, 12.3% or 911 single-father households and 23.4% or 3,893 single-mother households are living below the poverty line. Among single-father households, those with 3 or 4 children have the highest poverty rate, with 25 households (28.1%) experiencing poverty. Likewise, among single-mother households, those with 5 or more children have the highest poverty rate, with 32 households (100.0%) falling below the poverty line.
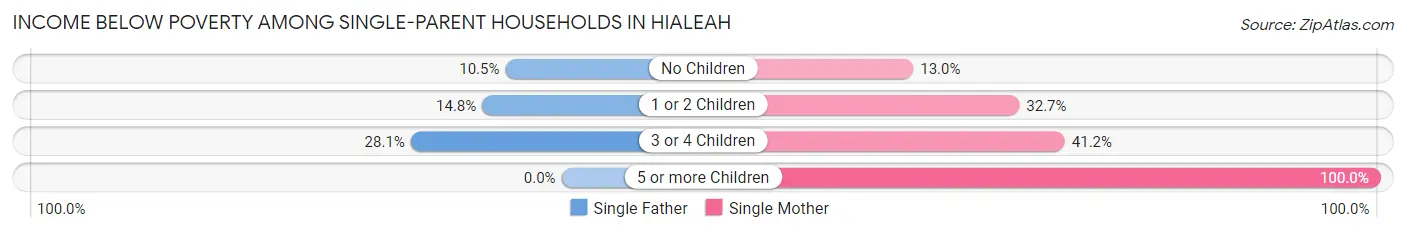
| Children | Single Father | Single Mother |
| No Children | 467 (10.5%) | 1,075 (13.0%) |
| 1 or 2 Children | 419 (14.8%) | 2,519 (32.7%) |
| 3 or 4 Children | 25 (28.1%) | 267 (41.2%) |
| 5 or more Children | 0 (0.0%) | 32 (100.0%) |
| Total | 911 (12.3%) | 3,893 (23.4%) |
Income Below Poverty Among Married-Couple vs Single-Parent Households in Hialeah
The poverty data for Hialeah shows that 3,187 of the married-couple family households (9.8%) and 4,804 of the single-parent households (20.0%) are living below the poverty level. Within the married-couple family households, those with 3 or 4 children have the highest poverty rate, with 148 households (13.1%) falling below the poverty line. Among the single-parent households, those with 5 or more children have the highest poverty rate, with 32 household (100.0%) living below poverty.
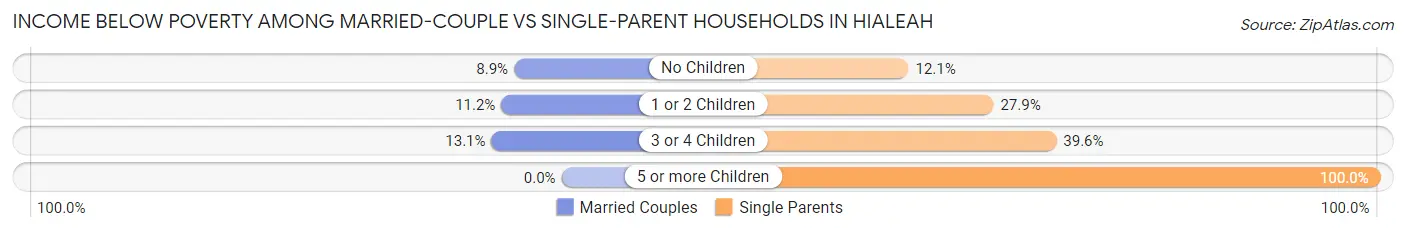
| Children | Married-Couple Families | Single-Parent Households |
| No Children | 1,761 (8.8%) | 1,542 (12.1%) |
| 1 or 2 Children | 1,278 (11.2%) | 2,938 (27.9%) |
| 3 or 4 Children | 148 (13.1%) | 292 (39.6%) |
| 5 or more Children | 0 (0.0%) | 32 (100.0%) |
| Total | 3,187 (9.8%) | 4,804 (20.0%) |
Employment Characteristics in Hialeah
Employment by Class of Employer in Hialeah
Among the 110,370 employed individuals in Hialeah, private company employees (80,011 | 72.5%), self-employed (not incorporated) (12,262 | 11.1%), and self-employed (incorporated) (6,026 | 5.5%) make up the most common classes of employment.
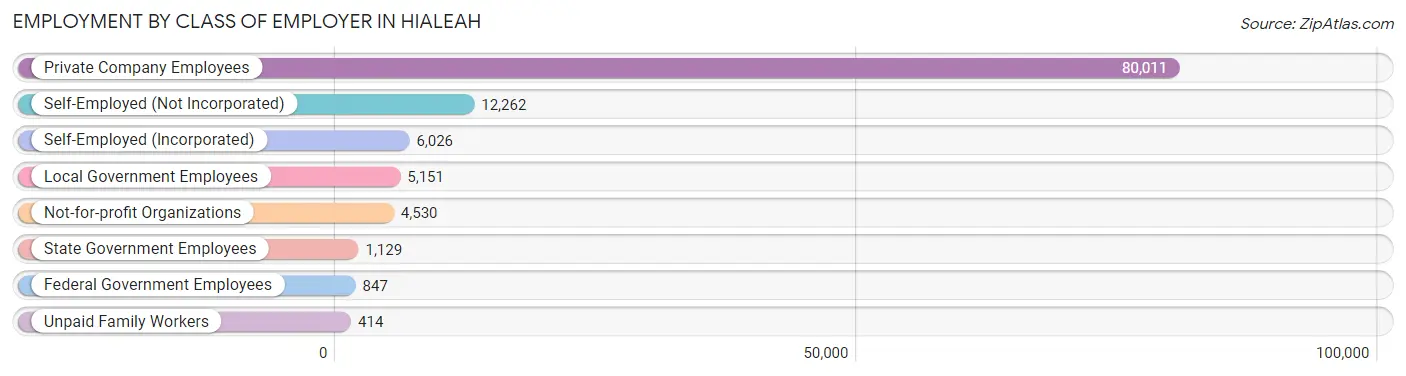
| Employer Class | # Employees | % Employees |
| Private Company Employees | 80,011 | 72.5% |
| Self-Employed (Incorporated) | 6,026 | 5.5% |
| Self-Employed (Not Incorporated) | 12,262 | 11.1% |
| Not-for-profit Organizations | 4,530 | 4.1% |
| Local Government Employees | 5,151 | 4.7% |
| State Government Employees | 1,129 | 1.0% |
| Federal Government Employees | 847 | 0.8% |
| Unpaid Family Workers | 414 | 0.4% |
| Total | 110,370 | 100.0% |
Employment Status by Age in Hialeah
According to the labor force statistics for Hialeah, out of the total population over 16 years of age (189,746), 61.7% or 117,073 individuals are in the labor force, with 3.7% or 4,332 of them unemployed. The age group with the highest labor force participation rate is 35 to 44 years, with 85.3% or 21,898 individuals in the labor force. Within the labor force, the 16 to 19 years age range has the highest percentage of unemployed individuals, with 13.9% or 321 of them being unemployed.
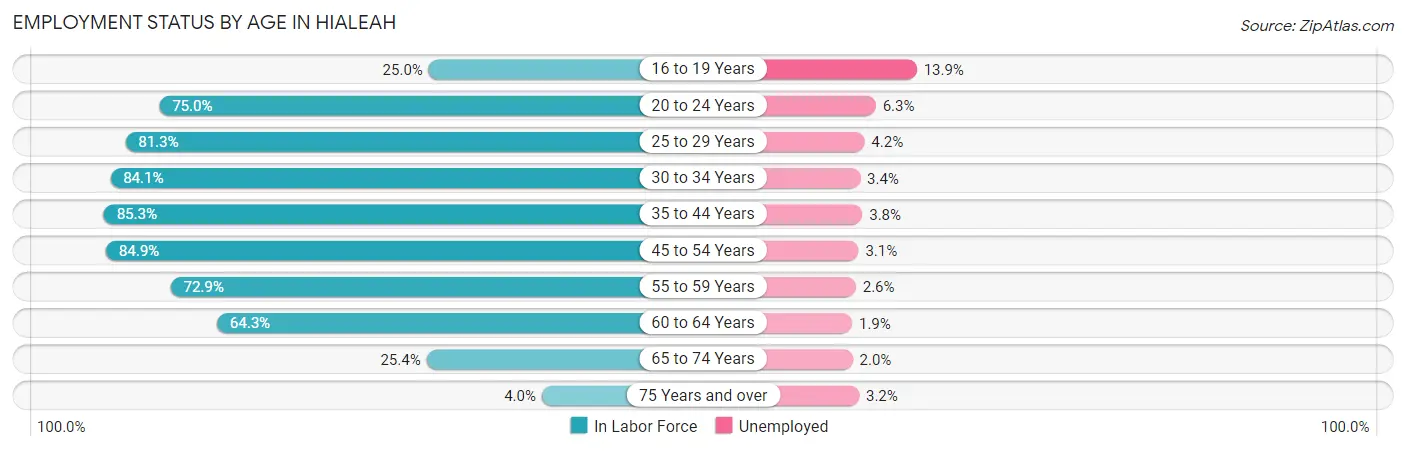
| Age Bracket | In Labor Force | Unemployed |
| 16 to 19 Years | 2,306 (25.0%) | 321 (13.9%) |
| 20 to 24 Years | 10,463 (75.0%) | 659 (6.3%) |
| 25 to 29 Years | 10,249 (81.3%) | 430 (4.2%) |
| 30 to 34 Years | 12,465 (84.1%) | 424 (3.4%) |
| 35 to 44 Years | 21,898 (85.3%) | 832 (3.8%) |
| 45 to 54 Years | 30,596 (84.9%) | 948 (3.1%) |
| 55 to 59 Years | 13,941 (72.9%) | 362 (2.6%) |
| 60 to 64 Years | 8,641 (64.3%) | 164 (1.9%) |
| 65 to 74 Years | 5,571 (25.4%) | 111 (2.0%) |
| 75 Years and over | 918 (4.0%) | 29 (3.2%) |
| Total | 117,073 (61.7%) | 4,332 (3.7%) |
Employment Status by Educational Attainment in Hialeah
According to labor force statistics for Hialeah, 80.4% of individuals (97,848) out of the total population between 25 and 64 years of age (121,701) are in the labor force, with 3.2% or 3,131 of them being unemployed. The group with the highest labor force participation rate are those with the educational attainment of bachelor's degree or higher, with 88.3% or 23,977 individuals in the labor force. Within the labor force, individuals with less than high school education have the highest percentage of unemployment, with 4.4% or 664 of them being unemployed.
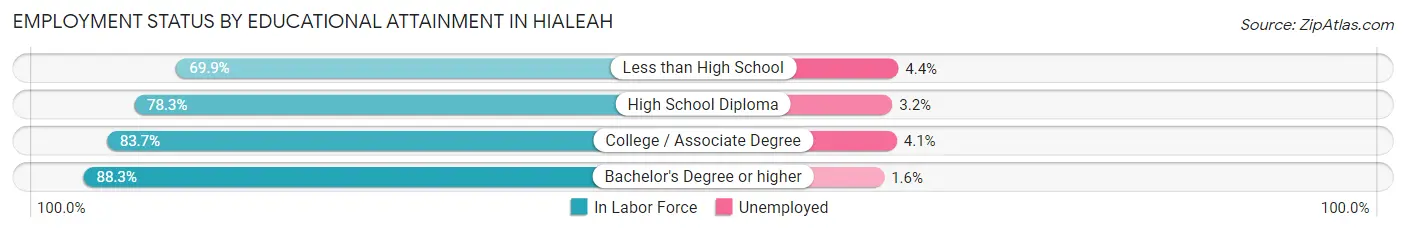
| Educational Attainment | In Labor Force | Unemployed |
| Less than High School | 15,080 (69.9%) | 949 (4.4%) |
| High School Diploma | 34,243 (78.3%) | 1,399 (3.2%) |
| College / Associate Degree | 24,475 (83.7%) | 1,199 (4.1%) |
| Bachelor's Degree or higher | 23,977 (88.3%) | 434 (1.6%) |
| Total | 97,848 (80.4%) | 3,894 (3.2%) |
Employment Occupations by Sex in Hialeah
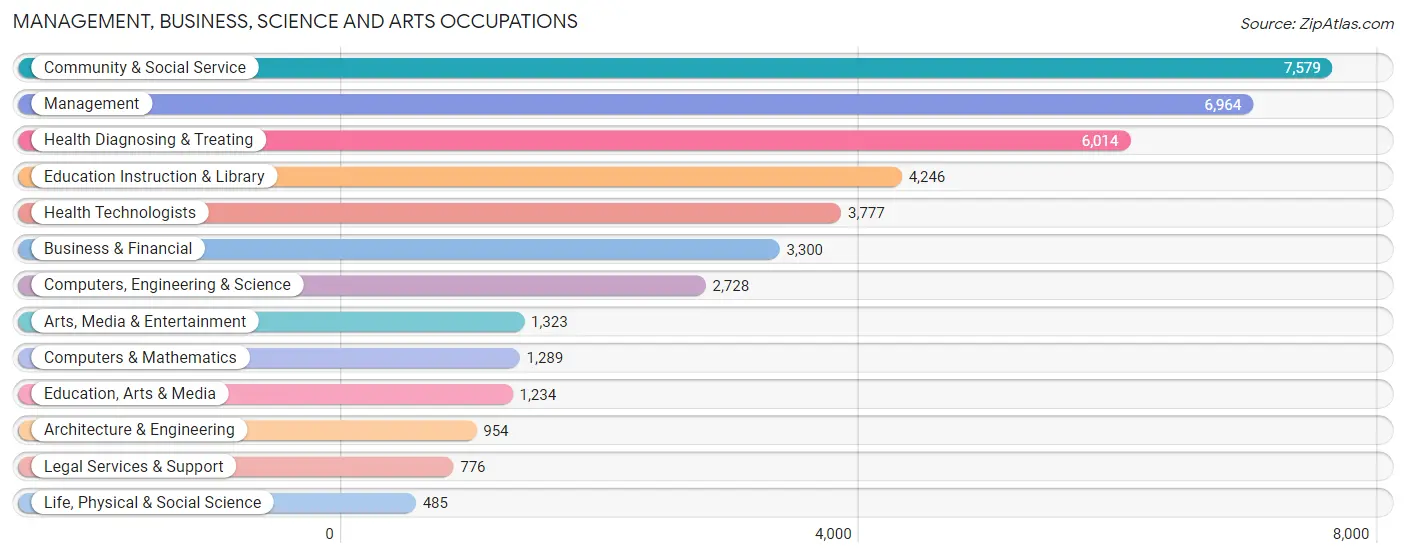
Management, Business, Science and Arts Occupations
The most common Management, Business, Science and Arts occupations in Hialeah are Community & Social Service (7,579 | 6.7%), Management (6,964 | 6.2%), Health Diagnosing & Treating (6,014 | 5.3%), Education Instruction & Library (4,246 | 3.8%), and Health Technologists (3,777 | 3.4%).
Management, Business, Science and Arts Occupations by Sex
Within the Management, Business, Science and Arts occupations in Hialeah, the most male-oriented occupations are Computers & Mathematics (96.9%), Architecture & Engineering (82.7%), and Computers, Engineering & Science (79.1%), while the most female-oriented occupations are Legal Services & Support (86.7%), Education Instruction & Library (78.7%), and Life, Physical & Social Science (75.3%).
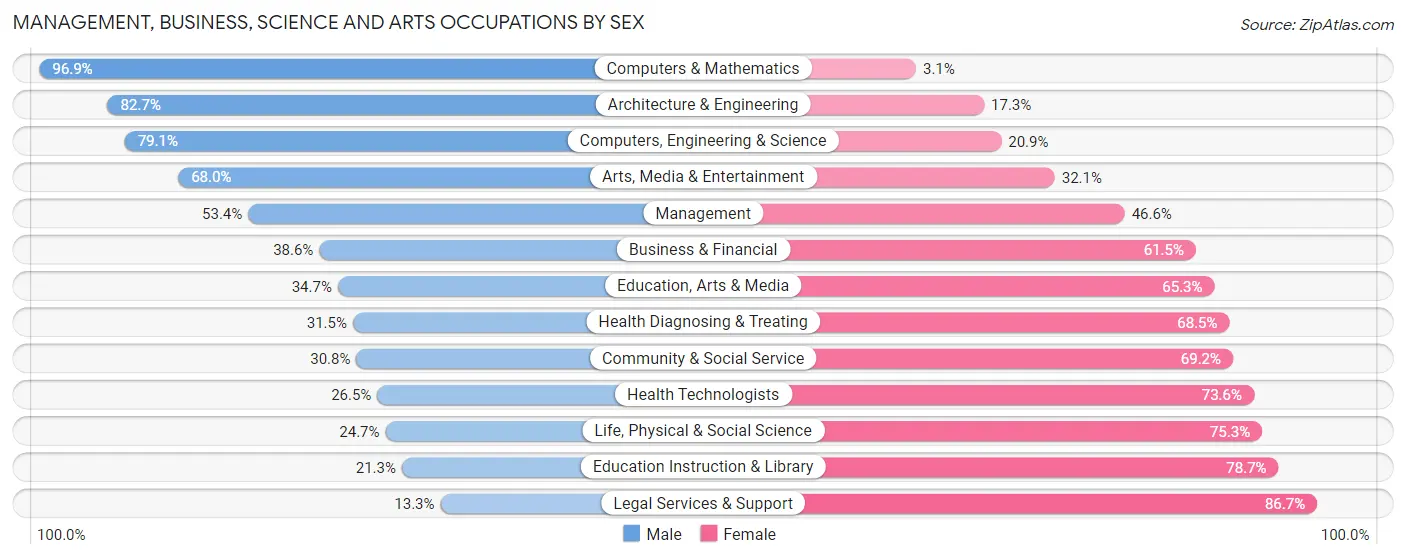
| Occupation | Male | Female |
| Management | 3,717 (53.4%) | 3,247 (46.6%) |
| Business & Financial | 1,272 (38.6%) | 2,028 (61.5%) |
| Computers, Engineering & Science | 2,158 (79.1%) | 570 (20.9%) |
| Computers & Mathematics | 1,249 (96.9%) | 40 (3.1%) |
| Architecture & Engineering | 789 (82.7%) | 165 (17.3%) |
| Life, Physical & Social Science | 120 (24.7%) | 365 (75.3%) |
| Community & Social Service | 2,335 (30.8%) | 5,244 (69.2%) |
| Education, Arts & Media | 428 (34.7%) | 806 (65.3%) |
| Legal Services & Support | 103 (13.3%) | 673 (86.7%) |
| Education Instruction & Library | 905 (21.3%) | 3,341 (78.7%) |
| Arts, Media & Entertainment | 899 (67.9%) | 424 (32.1%) |
| Health Diagnosing & Treating | 1,897 (31.5%) | 4,117 (68.5%) |
| Health Technologists | 999 (26.5%) | 2,778 (73.6%) |
| Total (Category) | 11,379 (42.8%) | 15,206 (57.2%) |
| Total (Overall) | 61,818 (54.8%) | 50,881 (45.2%) |
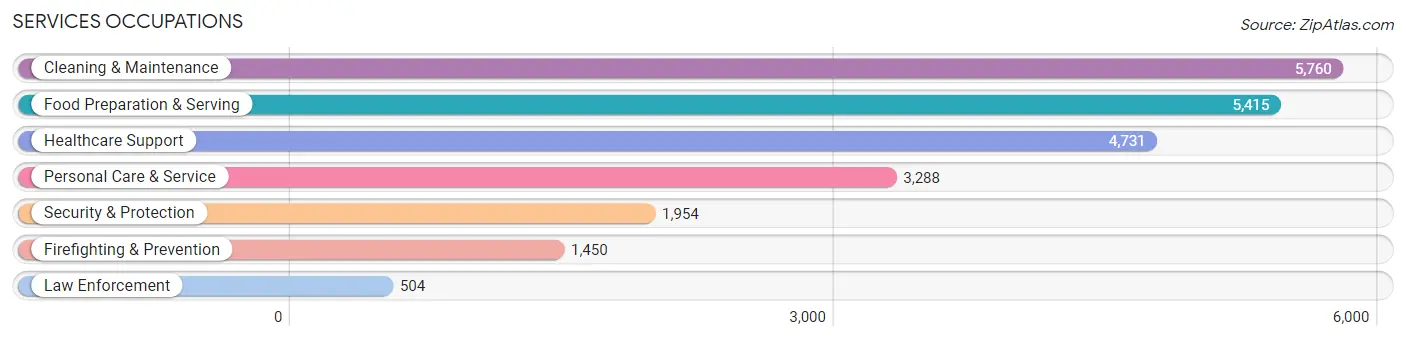
Services Occupations
The most common Services occupations in Hialeah are Cleaning & Maintenance (5,760 | 5.1%), Food Preparation & Serving (5,415 | 4.8%), Healthcare Support (4,731 | 4.2%), Personal Care & Service (3,288 | 2.9%), and Security & Protection (1,954 | 1.7%).
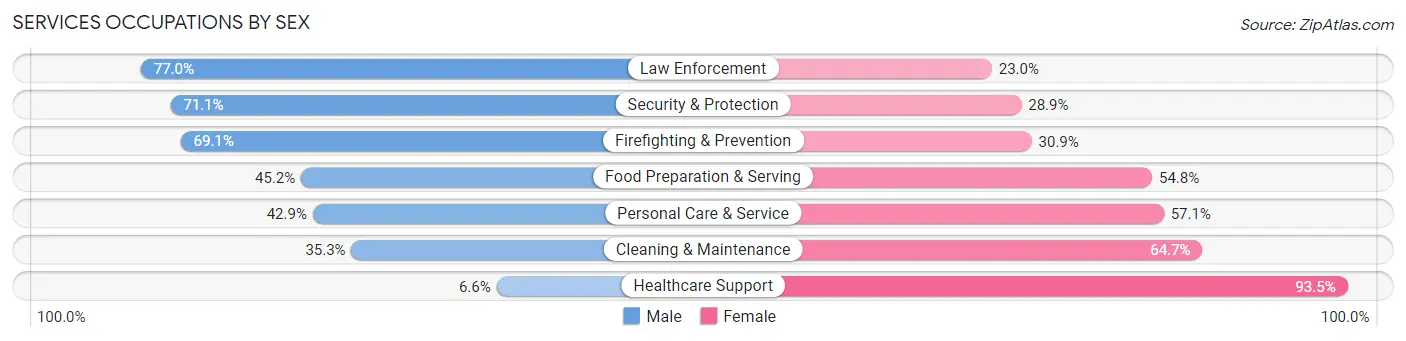
Services Occupations by Sex
Within the Services occupations in Hialeah, the most male-oriented occupations are Law Enforcement (77.0%), Security & Protection (71.1%), and Firefighting & Prevention (69.1%), while the most female-oriented occupations are Healthcare Support (93.4%), Cleaning & Maintenance (64.7%), and Personal Care & Service (57.1%).
| Occupation | Male | Female |
| Healthcare Support | 310 (6.6%) | 4,421 (93.4%) |
| Security & Protection | 1,390 (71.1%) | 564 (28.9%) |
| Firefighting & Prevention | 1,002 (69.1%) | 448 (30.9%) |
| Law Enforcement | 388 (77.0%) | 116 (23.0%) |
| Food Preparation & Serving | 2,450 (45.2%) | 2,965 (54.8%) |
| Cleaning & Maintenance | 2,032 (35.3%) | 3,728 (64.7%) |
| Personal Care & Service | 1,412 (42.9%) | 1,876 (57.1%) |
| Total (Category) | 7,594 (35.9%) | 13,554 (64.1%) |
| Total (Overall) | 61,818 (54.8%) | 50,881 (45.2%) |
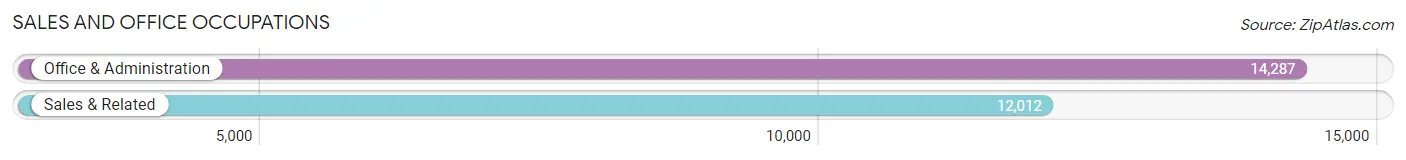
Sales and Office Occupations
The most common Sales and Office occupations in Hialeah are Office & Administration (14,287 | 12.7%), and Sales & Related (12,012 | 10.7%).
Sales and Office Occupations by Sex
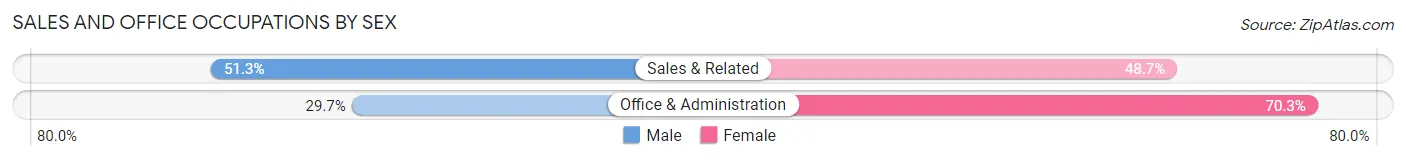
| Occupation | Male | Female |
| Sales & Related | 6,163 (51.3%) | 5,849 (48.7%) |
| Office & Administration | 4,242 (29.7%) | 10,045 (70.3%) |
| Total (Category) | 10,405 (39.6%) | 15,894 (60.4%) |
| Total (Overall) | 61,818 (54.8%) | 50,881 (45.2%) |
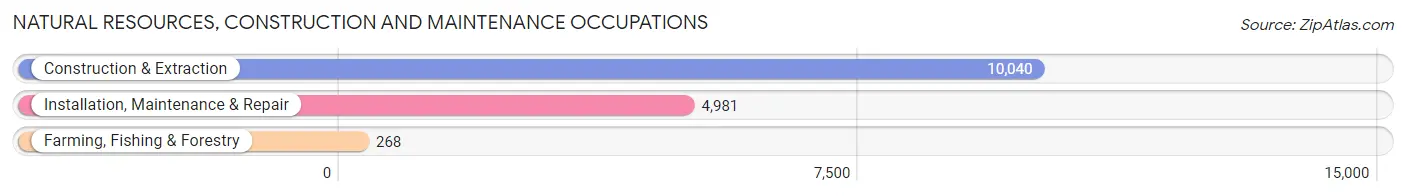
Natural Resources, Construction and Maintenance Occupations
The most common Natural Resources, Construction and Maintenance occupations in Hialeah are Construction & Extraction (10,040 | 8.9%), Installation, Maintenance & Repair (4,981 | 4.4%), and Farming, Fishing & Forestry (268 | 0.2%).
Natural Resources, Construction and Maintenance Occupations by Sex
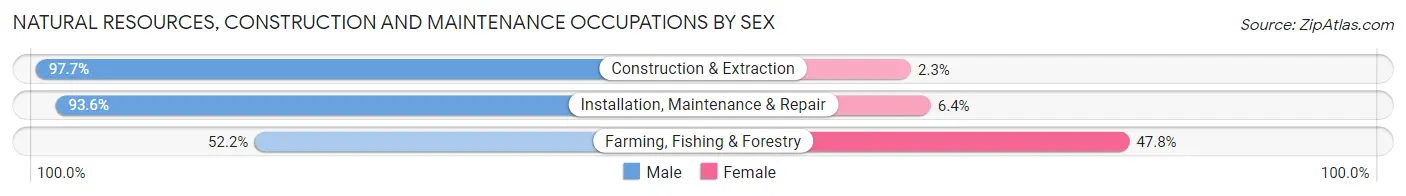
| Occupation | Male | Female |
| Farming, Fishing & Forestry | 140 (52.2%) | 128 (47.8%) |
| Construction & Extraction | 9,806 (97.7%) | 234 (2.3%) |
| Installation, Maintenance & Repair | 4,660 (93.6%) | 321 (6.4%) |
| Total (Category) | 14,606 (95.5%) | 683 (4.5%) |
| Total (Overall) | 61,818 (54.8%) | 50,881 (45.2%) |
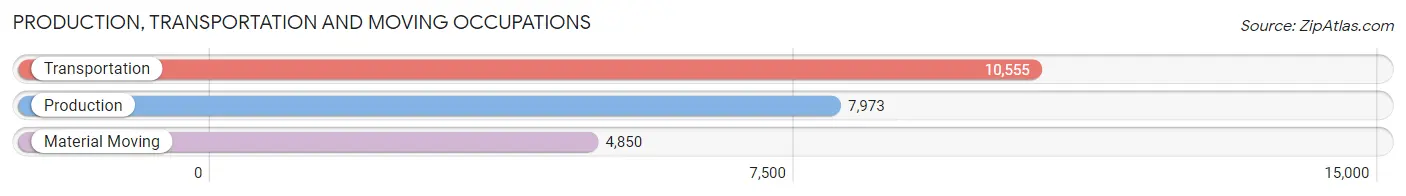
Production, Transportation and Moving Occupations
The most common Production, Transportation and Moving occupations in Hialeah are Transportation (10,555 | 9.4%), Production (7,973 | 7.1%), and Material Moving (4,850 | 4.3%).
Production, Transportation and Moving Occupations by Sex
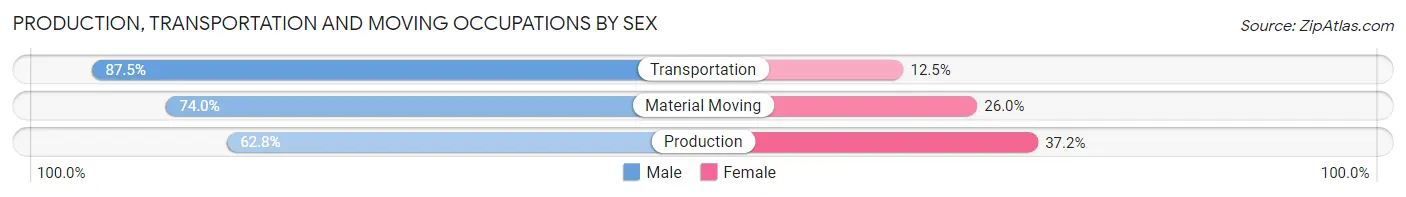
| Occupation | Male | Female |
| Production | 5,008 (62.8%) | 2,965 (37.2%) |
| Transportation | 9,238 (87.5%) | 1,317 (12.5%) |
| Material Moving | 3,588 (74.0%) | 1,262 (26.0%) |
| Total (Category) | 17,834 (76.3%) | 5,544 (23.7%) |
| Total (Overall) | 61,818 (54.8%) | 50,881 (45.2%) |
Employment Industries by Sex in Hialeah
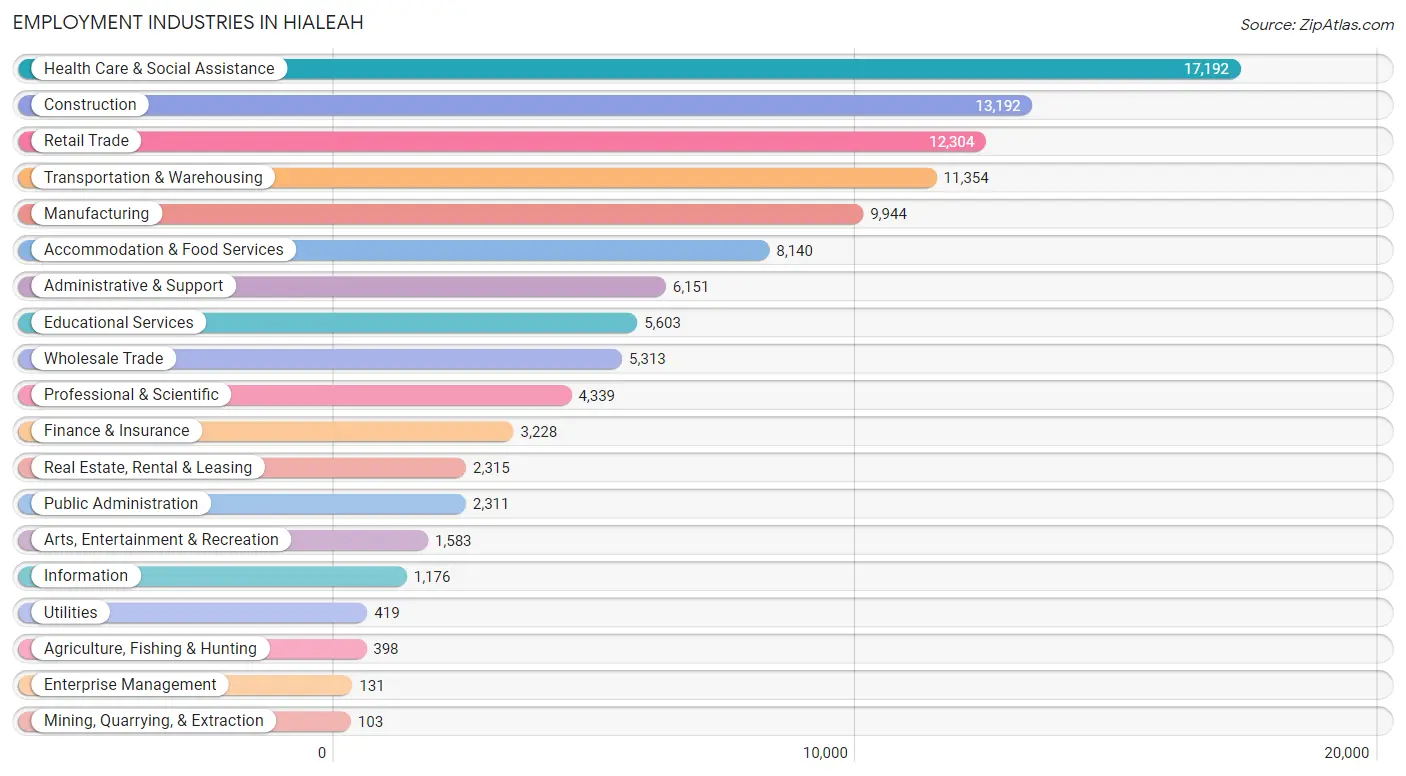
Employment Industries in Hialeah
The major employment industries in Hialeah include Health Care & Social Assistance (17,192 | 15.2%), Construction (13,192 | 11.7%), Retail Trade (12,304 | 10.9%), Transportation & Warehousing (11,354 | 10.1%), and Manufacturing (9,944 | 8.8%).
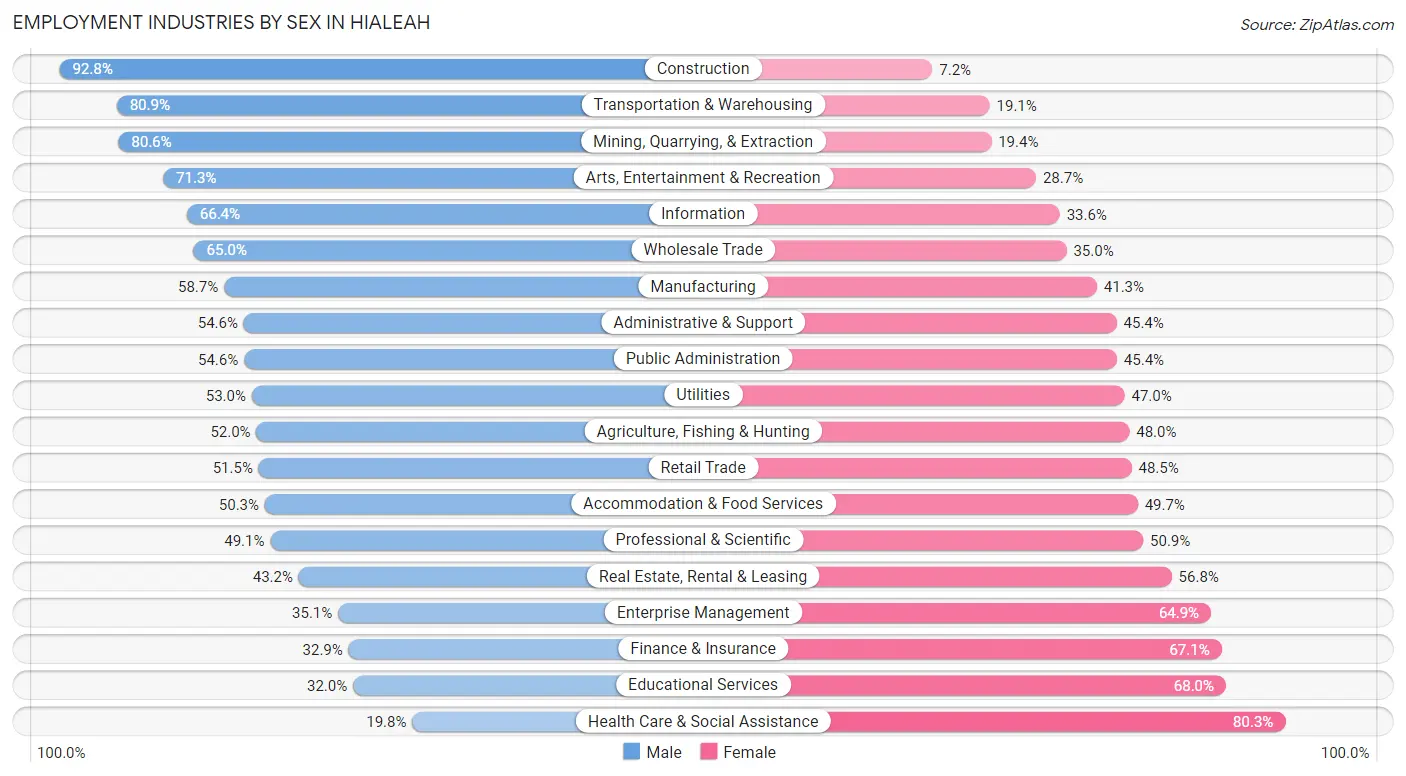
Employment Industries by Sex in Hialeah
The Hialeah industries that see more men than women are Construction (92.8%), Transportation & Warehousing (80.9%), and Mining, Quarrying, & Extraction (80.6%), whereas the industries that tend to have a higher number of women are Health Care & Social Assistance (80.2%), Educational Services (68.0%), and Finance & Insurance (67.1%).
| Industry | Male | Female |
| Agriculture, Fishing & Hunting | 207 (52.0%) | 191 (48.0%) |
| Mining, Quarrying, & Extraction | 83 (80.6%) | 20 (19.4%) |
| Construction | 12,238 (92.8%) | 954 (7.2%) |
| Manufacturing | 5,839 (58.7%) | 4,105 (41.3%) |
| Wholesale Trade | 3,454 (65.0%) | 1,859 (35.0%) |
| Retail Trade | 6,341 (51.5%) | 5,963 (48.5%) |
| Transportation & Warehousing | 9,188 (80.9%) | 2,166 (19.1%) |
| Utilities | 222 (53.0%) | 197 (47.0%) |
| Information | 781 (66.4%) | 395 (33.6%) |
| Finance & Insurance | 1,063 (32.9%) | 2,165 (67.1%) |
| Real Estate, Rental & Leasing | 1,001 (43.2%) | 1,314 (56.8%) |
| Professional & Scientific | 2,132 (49.1%) | 2,207 (50.9%) |
| Enterprise Management | 46 (35.1%) | 85 (64.9%) |
| Administrative & Support | 3,360 (54.6%) | 2,791 (45.4%) |
| Educational Services | 1,794 (32.0%) | 3,809 (68.0%) |
| Health Care & Social Assistance | 3,396 (19.8%) | 13,796 (80.2%) |
| Arts, Entertainment & Recreation | 1,129 (71.3%) | 454 (28.7%) |
| Accommodation & Food Services | 4,092 (50.3%) | 4,048 (49.7%) |
| Public Administration | 1,261 (54.6%) | 1,050 (45.4%) |
| Total | 61,818 (54.8%) | 50,881 (45.2%) |
Education in Hialeah
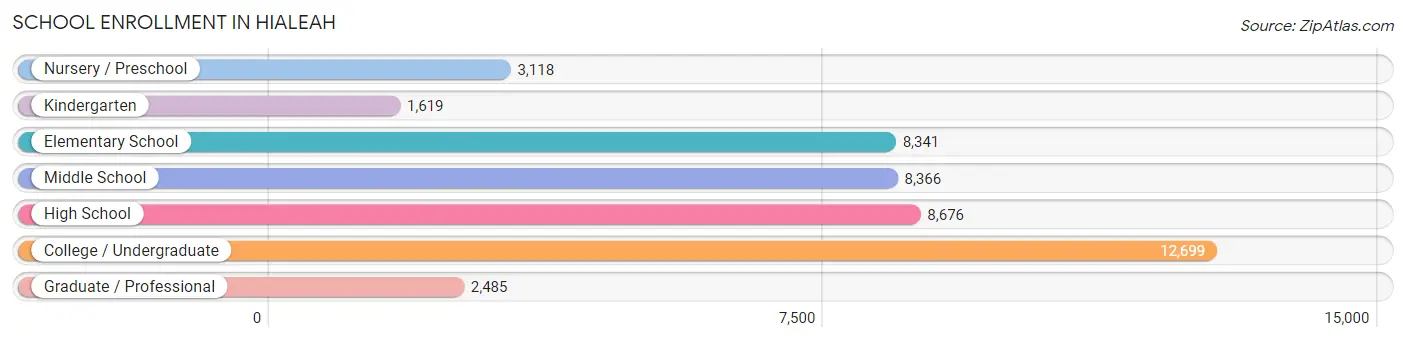
School Enrollment in Hialeah
The most common levels of schooling among the 45,304 students in Hialeah are college / undergraduate (12,699 | 28.0%), high school (8,676 | 19.2%), and middle school (8,366 | 18.5%).
| School Level | # Students | % Students |
| Nursery / Preschool | 3,118 | 6.9% |
| Kindergarten | 1,619 | 3.6% |
| Elementary School | 8,341 | 18.4% |
| Middle School | 8,366 | 18.5% |
| High School | 8,676 | 19.2% |
| College / Undergraduate | 12,699 | 28.0% |
| Graduate / Professional | 2,485 | 5.5% |
| Total | 45,304 | 100.0% |
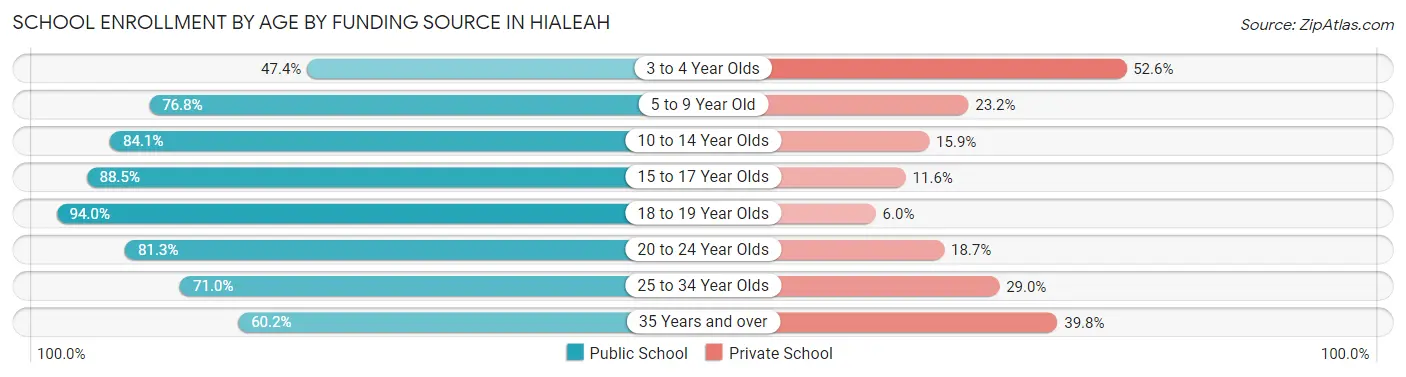
School Enrollment by Age by Funding Source in Hialeah
Out of a total of 45,304 students who are enrolled in schools in Hialeah, 9,604 (21.2%) attend a private institution, while the remaining 35,700 (78.8%) are enrolled in public schools. The age group of 3 to 4 year olds has the highest likelihood of being enrolled in private schools, with 1,272 (52.6% in the age bracket) enrolled. Conversely, the age group of 18 to 19 year olds has the lowest likelihood of being enrolled in a private school, with 3,248 (94.0% in the age bracket) attending a public institution.
| Age Bracket | Public School | Private School |
| 3 to 4 Year Olds | 1,145 (47.4%) | 1,272 (52.6%) |
| 5 to 9 Year Old | 6,886 (76.8%) | 2,083 (23.2%) |
| 10 to 14 Year Olds | 9,199 (84.1%) | 1,742 (15.9%) |
| 15 to 17 Year Olds | 5,386 (88.4%) | 703 (11.6%) |
| 18 to 19 Year Olds | 3,248 (94.0%) | 206 (6.0%) |
| 20 to 24 Year Olds | 5,274 (81.3%) | 1,213 (18.7%) |
| 25 to 34 Year Olds | 2,489 (71.0%) | 1,015 (29.0%) |
| 35 Years and over | 2,073 (60.2%) | 1,370 (39.8%) |
| Total | 35,700 (78.8%) | 9,604 (21.2%) |
Educational Attainment by Field of Study in Hialeah
Business (7,027 | 20.5%), education (5,381 | 15.7%), science & technology (4,962 | 14.5%), engineering (3,841 | 11.2%), and social sciences (1,986 | 5.8%) are the most common fields of study among 34,256 individuals in Hialeah who have obtained a bachelor's degree or higher.
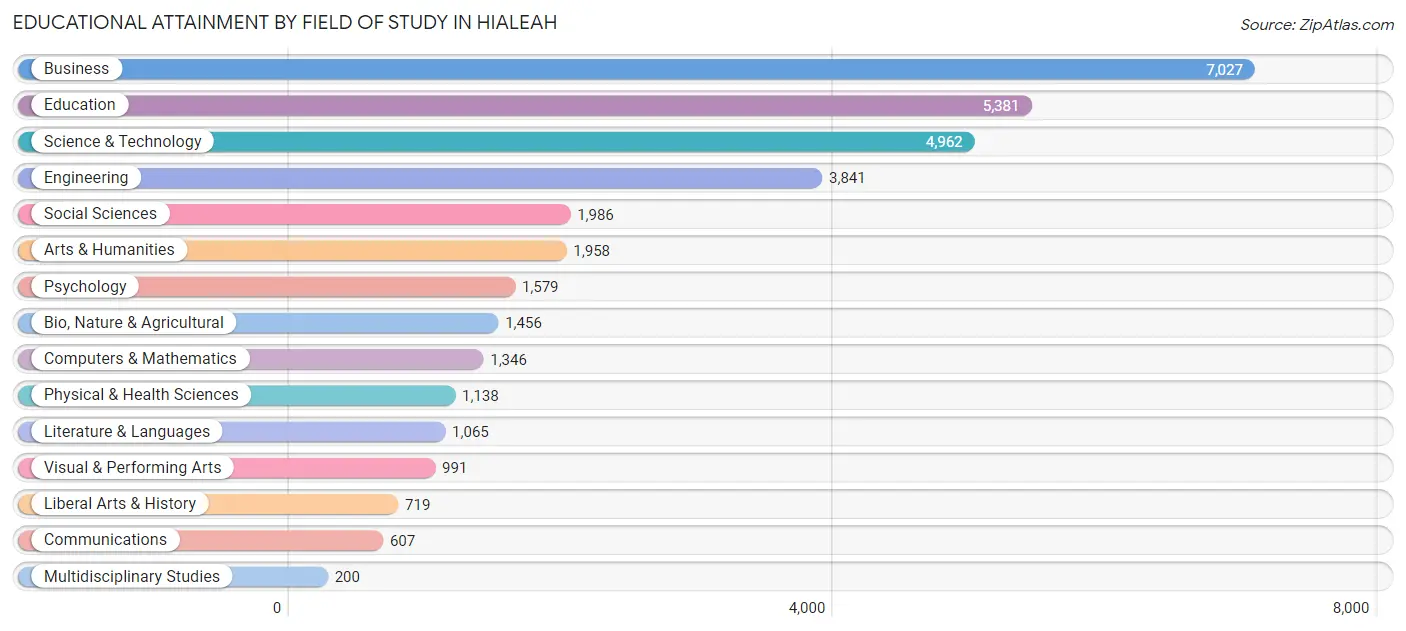
| Field of Study | # Graduates | % Graduates |
| Computers & Mathematics | 1,346 | 3.9% |
| Bio, Nature & Agricultural | 1,456 | 4.3% |
| Physical & Health Sciences | 1,138 | 3.3% |
| Psychology | 1,579 | 4.6% |
| Social Sciences | 1,986 | 5.8% |
| Engineering | 3,841 | 11.2% |
| Multidisciplinary Studies | 200 | 0.6% |
| Science & Technology | 4,962 | 14.5% |
| Business | 7,027 | 20.5% |
| Education | 5,381 | 15.7% |
| Literature & Languages | 1,065 | 3.1% |
| Liberal Arts & History | 719 | 2.1% |
| Visual & Performing Arts | 991 | 2.9% |
| Communications | 607 | 1.8% |
| Arts & Humanities | 1,958 | 5.7% |
| Total | 34,256 | 100.0% |
Transportation & Commute in Hialeah
Vehicle Availability by Sex in Hialeah
The most prevalent vehicle ownership categories in Hialeah are males with 2 vehicles (24,468, accounting for 40.3%) and females with 2 vehicles (20,098, making up 49.5%).
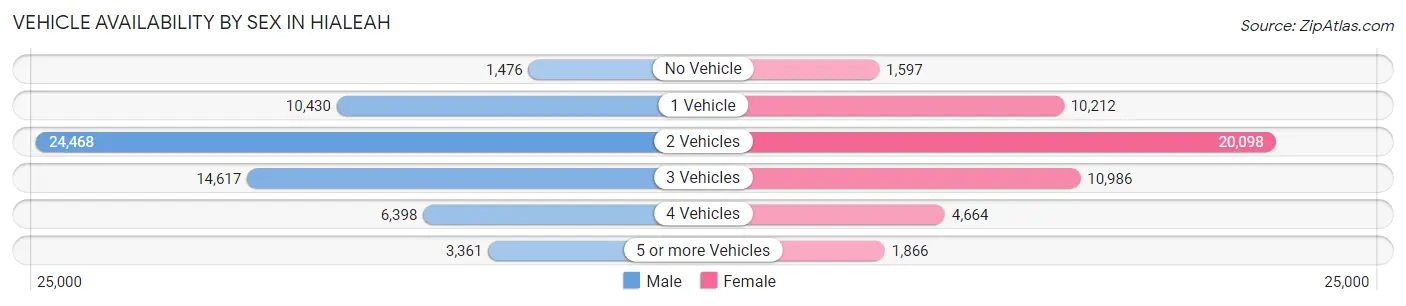
| Vehicles Available | Male | Female |
| No Vehicle | 1,476 (2.4%) | 1,597 (3.2%) |
| 1 Vehicle | 10,430 (17.2%) | 10,212 (20.7%) |
| 2 Vehicles | 24,468 (40.3%) | 20,098 (40.7%) |
| 3 Vehicles | 14,617 (24.1%) | 10,986 (22.2%) |
| 4 Vehicles | 6,398 (10.5%) | 4,664 (9.4%) |
| 5 or more Vehicles | 3,361 (5.5%) | 1,866 (3.8%) |
| Total | 60,750 (100.0%) | 49,423 (100.0%) |
Commute Time in Hialeah
The most frequently occuring commute durations in Hialeah are 30 to 34 minutes (21,310 commuters, 21.7%), 20 to 24 minutes (15,793 commuters, 16.1%), and 15 to 19 minutes (13,174 commuters, 13.4%).
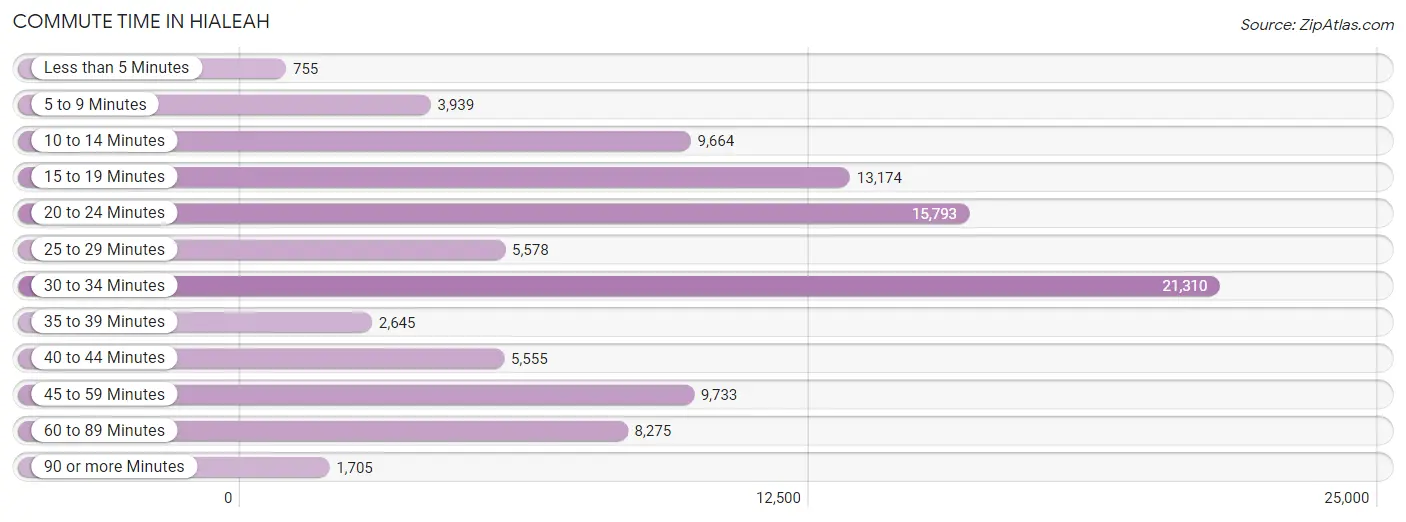
| Commute Time | # Commuters | % Commuters |
| Less than 5 Minutes | 755 | 0.8% |
| 5 to 9 Minutes | 3,939 | 4.0% |
| 10 to 14 Minutes | 9,664 | 9.9% |
| 15 to 19 Minutes | 13,174 | 13.4% |
| 20 to 24 Minutes | 15,793 | 16.1% |
| 25 to 29 Minutes | 5,578 | 5.7% |
| 30 to 34 Minutes | 21,310 | 21.7% |
| 35 to 39 Minutes | 2,645 | 2.7% |
| 40 to 44 Minutes | 5,555 | 5.7% |
| 45 to 59 Minutes | 9,733 | 9.9% |
| 60 to 89 Minutes | 8,275 | 8.4% |
| 90 or more Minutes | 1,705 | 1.7% |
Commute Time by Sex in Hialeah
The most common commute times in Hialeah are 30 to 34 minutes (12,123 commuters, 22.8%) for males and 30 to 34 minutes (9,187 commuters, 20.4%) for females.
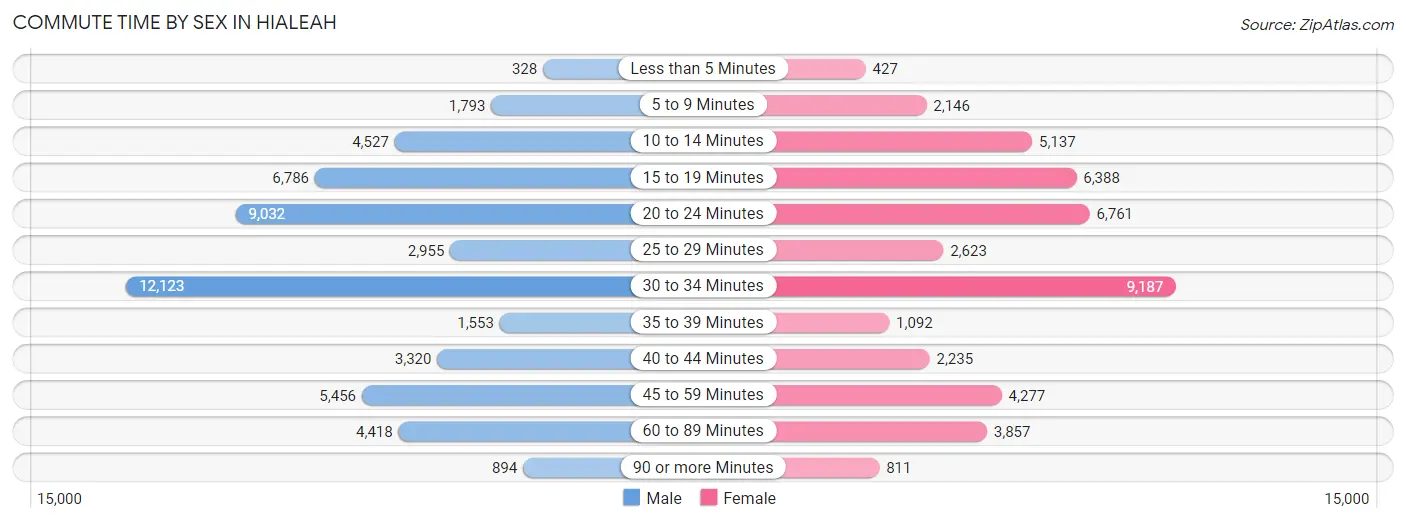
| Commute Time | Male | Female |
| Less than 5 Minutes | 328 (0.6%) | 427 (0.9%) |
| 5 to 9 Minutes | 1,793 (3.4%) | 2,146 (4.8%) |
| 10 to 14 Minutes | 4,527 (8.5%) | 5,137 (11.4%) |
| 15 to 19 Minutes | 6,786 (12.8%) | 6,388 (14.2%) |
| 20 to 24 Minutes | 9,032 (17.0%) | 6,761 (15.0%) |
| 25 to 29 Minutes | 2,955 (5.6%) | 2,623 (5.8%) |
| 30 to 34 Minutes | 12,123 (22.8%) | 9,187 (20.4%) |
| 35 to 39 Minutes | 1,553 (2.9%) | 1,092 (2.4%) |
| 40 to 44 Minutes | 3,320 (6.2%) | 2,235 (5.0%) |
| 45 to 59 Minutes | 5,456 (10.3%) | 4,277 (9.5%) |
| 60 to 89 Minutes | 4,418 (8.3%) | 3,857 (8.6%) |
| 90 or more Minutes | 894 (1.7%) | 811 (1.8%) |
Time of Departure to Work by Sex in Hialeah
The most frequent times of departure to work in Hialeah are 7:00 AM to 7:29 AM (9,224, 17.3%) for males and 7:00 AM to 7:29 AM (8,469, 18.8%) for females.
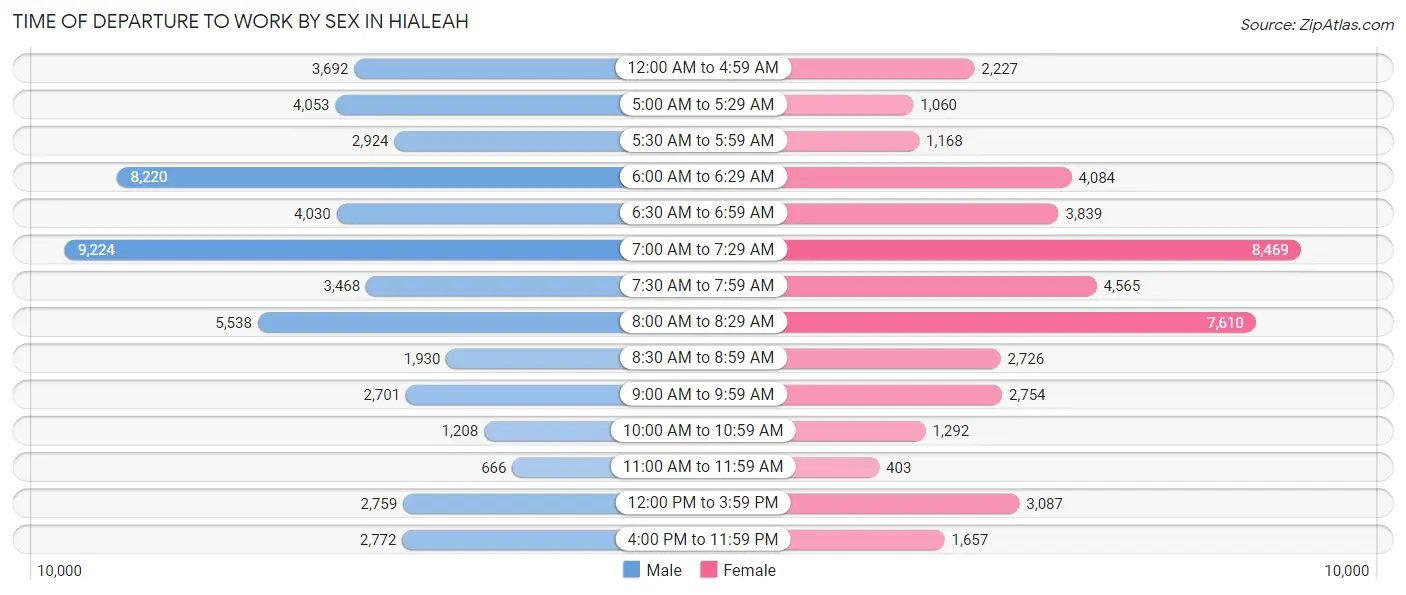
| Time of Departure | Male | Female |
| 12:00 AM to 4:59 AM | 3,692 (6.9%) | 2,227 (5.0%) |
| 5:00 AM to 5:29 AM | 4,053 (7.6%) | 1,060 (2.4%) |
| 5:30 AM to 5:59 AM | 2,924 (5.5%) | 1,168 (2.6%) |
| 6:00 AM to 6:29 AM | 8,220 (15.5%) | 4,084 (9.1%) |
| 6:30 AM to 6:59 AM | 4,030 (7.6%) | 3,839 (8.5%) |
| 7:00 AM to 7:29 AM | 9,224 (17.3%) | 8,469 (18.8%) |
| 7:30 AM to 7:59 AM | 3,468 (6.5%) | 4,565 (10.2%) |
| 8:00 AM to 8:29 AM | 5,538 (10.4%) | 7,610 (16.9%) |
| 8:30 AM to 8:59 AM | 1,930 (3.6%) | 2,726 (6.1%) |
| 9:00 AM to 9:59 AM | 2,701 (5.1%) | 2,754 (6.1%) |
| 10:00 AM to 10:59 AM | 1,208 (2.3%) | 1,292 (2.9%) |
| 11:00 AM to 11:59 AM | 666 (1.3%) | 403 (0.9%) |
| 12:00 PM to 3:59 PM | 2,759 (5.2%) | 3,087 (6.9%) |
| 4:00 PM to 11:59 PM | 2,772 (5.2%) | 1,657 (3.7%) |
| Total | 53,185 (100.0%) | 44,941 (100.0%) |
Housing Occupancy in Hialeah
Occupancy by Ownership in Hialeah
Of the total 76,255 dwellings in Hialeah, owner-occupied units account for 36,109 (47.3%), while renter-occupied units make up 40,146 (52.6%).
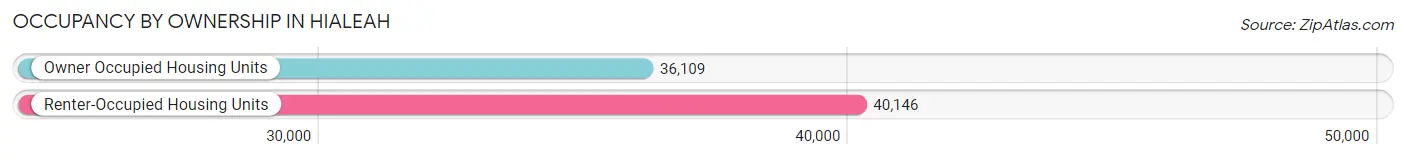
| Occupancy | # Housing Units | % Housing Units |
| Owner Occupied Housing Units | 36,109 | 47.3% |
| Renter-Occupied Housing Units | 40,146 | 52.6% |
| Total Occupied Housing Units | 76,255 | 100.0% |
Occupancy by Household Size in Hialeah
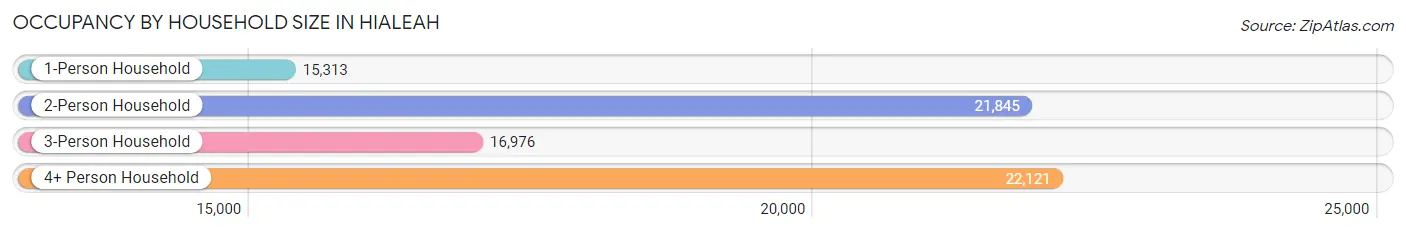
| Household Size | # Housing Units | % Housing Units |
| 1-Person Household | 15,313 | 20.1% |
| 2-Person Household | 21,845 | 28.6% |
| 3-Person Household | 16,976 | 22.3% |
| 4+ Person Household | 22,121 | 29.0% |
| Total Housing Units | 76,255 | 100.0% |
Occupancy by Ownership by Household Size in Hialeah
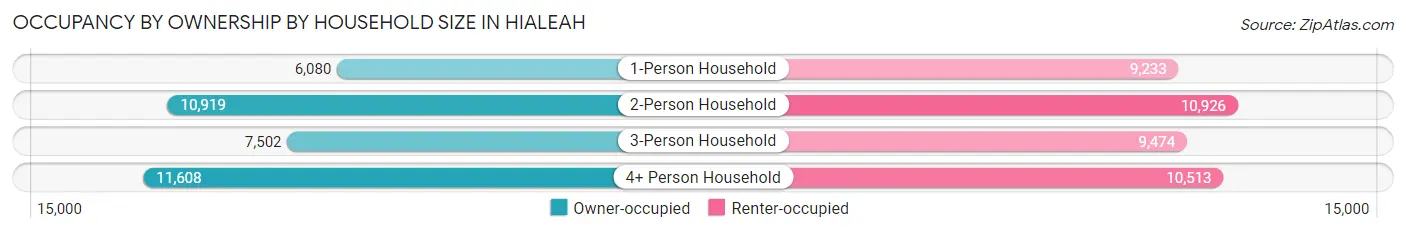
| Household Size | Owner-occupied | Renter-occupied |
| 1-Person Household | 6,080 (39.7%) | 9,233 (60.3%) |
| 2-Person Household | 10,919 (50.0%) | 10,926 (50.0%) |
| 3-Person Household | 7,502 (44.2%) | 9,474 (55.8%) |
| 4+ Person Household | 11,608 (52.5%) | 10,513 (47.5%) |
| Total Housing Units | 36,109 (47.3%) | 40,146 (52.6%) |
Occupancy by Educational Attainment in Hialeah
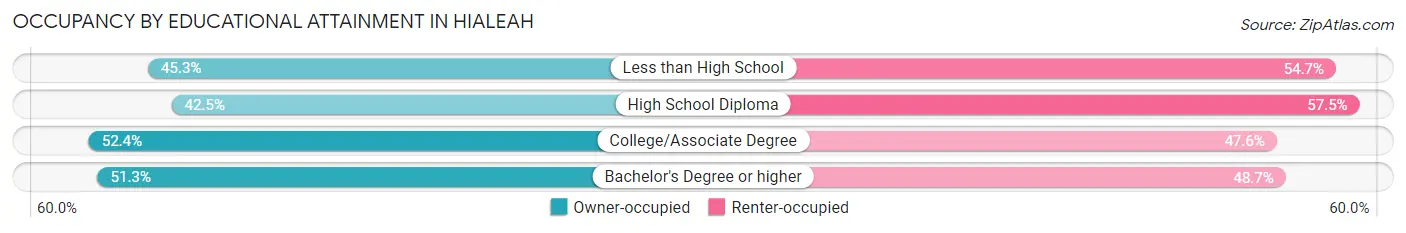
| Household Size | Owner-occupied | Renter-occupied |
| Less than High School | 8,496 (45.3%) | 10,252 (54.7%) |
| High School Diploma | 10,042 (42.5%) | 13,573 (57.5%) |
| College/Associate Degree | 9,004 (52.4%) | 8,193 (47.6%) |
| Bachelor's Degree or higher | 8,567 (51.3%) | 8,128 (48.7%) |
Occupancy by Age of Householder in Hialeah
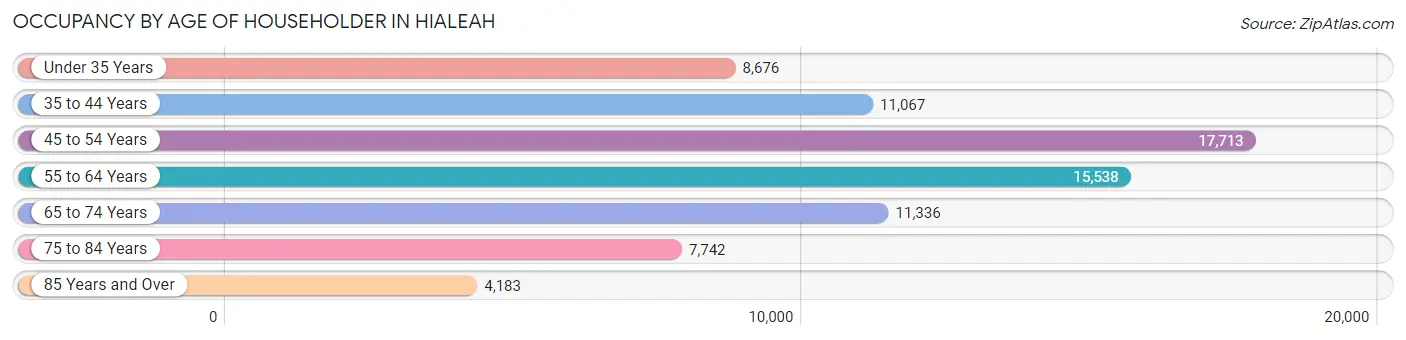
| Age Bracket | # Households | % Households |
| Under 35 Years | 8,676 | 11.4% |
| 35 to 44 Years | 11,067 | 14.5% |
| 45 to 54 Years | 17,713 | 23.2% |
| 55 to 64 Years | 15,538 | 20.4% |
| 65 to 74 Years | 11,336 | 14.9% |
| 75 to 84 Years | 7,742 | 10.2% |
| 85 Years and Over | 4,183 | 5.5% |
| Total | 76,255 | 100.0% |
Housing Finances in Hialeah
Median Income by Occupancy in Hialeah
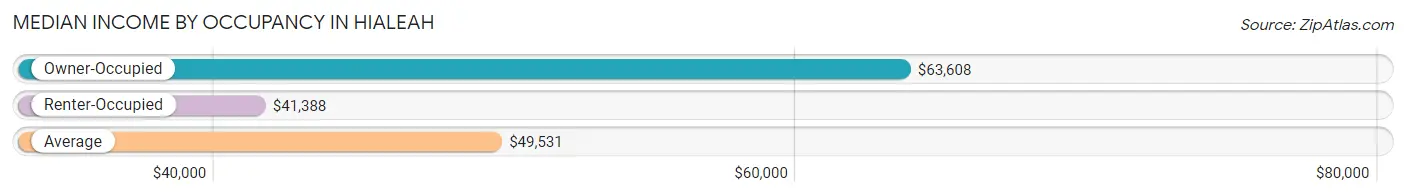
| Occupancy Type | # Households | Median Income |
| Owner-Occupied | 36,109 (47.3%) | $63,608 |
| Renter-Occupied | 40,146 (52.6%) | $41,388 |
| Average | 76,255 (100.0%) | $49,531 |
Occupancy by Householder Income Bracket in Hialeah
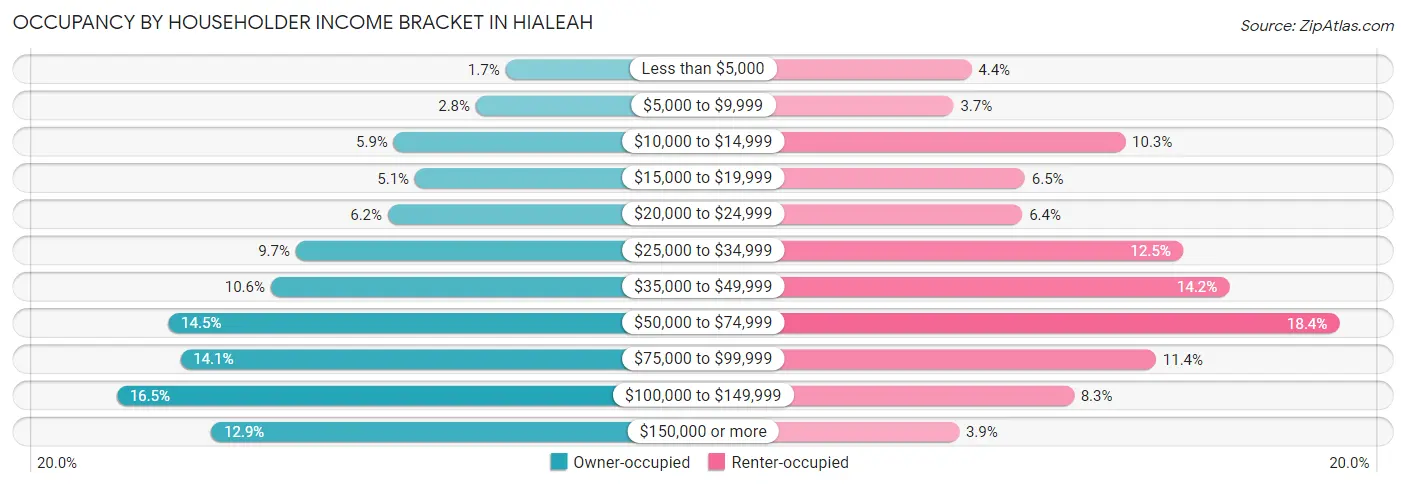
| Income Bracket | Owner-occupied | Renter-occupied |
| Less than $5,000 | 606 (1.7%) | 1,771 (4.4%) |
| $5,000 to $9,999 | 1,013 (2.8%) | 1,497 (3.7%) |
| $10,000 to $14,999 | 2,145 (5.9%) | 4,123 (10.3%) |
| $15,000 to $19,999 | 1,851 (5.1%) | 2,590 (6.5%) |
| $20,000 to $24,999 | 2,225 (6.2%) | 2,548 (6.4%) |
| $25,000 to $34,999 | 3,493 (9.7%) | 5,003 (12.5%) |
| $35,000 to $49,999 | 3,835 (10.6%) | 5,712 (14.2%) |
| $50,000 to $74,999 | 5,247 (14.5%) | 7,395 (18.4%) |
| $75,000 to $99,999 | 5,081 (14.1%) | 4,591 (11.4%) |
| $100,000 to $149,999 | 5,954 (16.5%) | 3,335 (8.3%) |
| $150,000 or more | 4,659 (12.9%) | 1,581 (3.9%) |
| Total | 36,109 (100.0%) | 40,146 (100.0%) |
Monthly Housing Cost Tiers in Hialeah
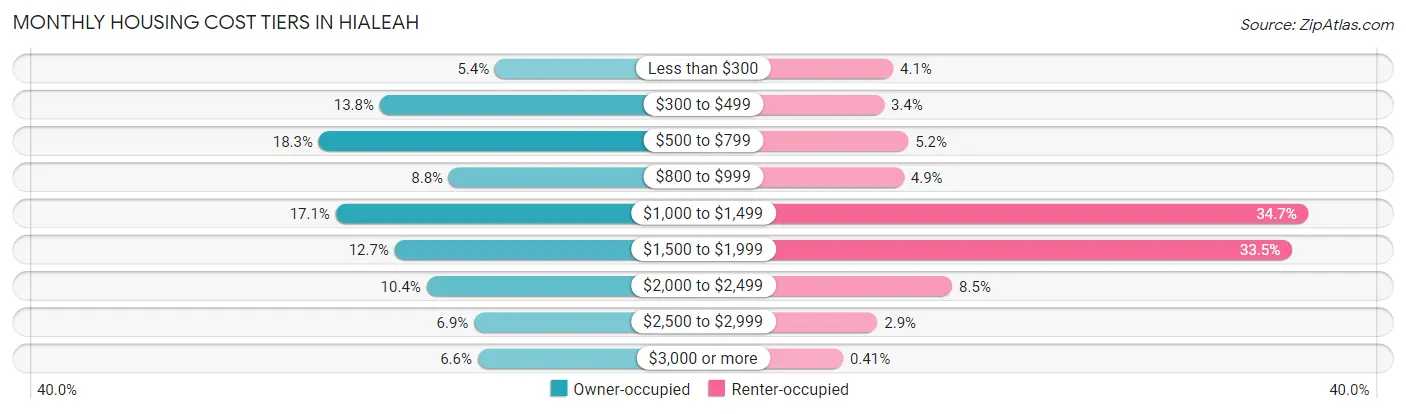
| Monthly Cost | Owner-occupied | Renter-occupied |
| Less than $300 | 1,932 (5.3%) | 1,645 (4.1%) |
| $300 to $499 | 4,996 (13.8%) | 1,376 (3.4%) |
| $500 to $799 | 6,617 (18.3%) | 2,096 (5.2%) |
| $800 to $999 | 3,160 (8.7%) | 1,962 (4.9%) |
| $1,000 to $1,499 | 6,170 (17.1%) | 13,927 (34.7%) |
| $1,500 to $1,999 | 4,602 (12.7%) | 13,441 (33.5%) |
| $2,000 to $2,499 | 3,753 (10.4%) | 3,393 (8.5%) |
| $2,500 to $2,999 | 2,487 (6.9%) | 1,181 (2.9%) |
| $3,000 or more | 2,392 (6.6%) | 165 (0.4%) |
| Total | 36,109 (100.0%) | 40,146 (100.0%) |
Physical Housing Characteristics in Hialeah
Housing Structures in Hialeah
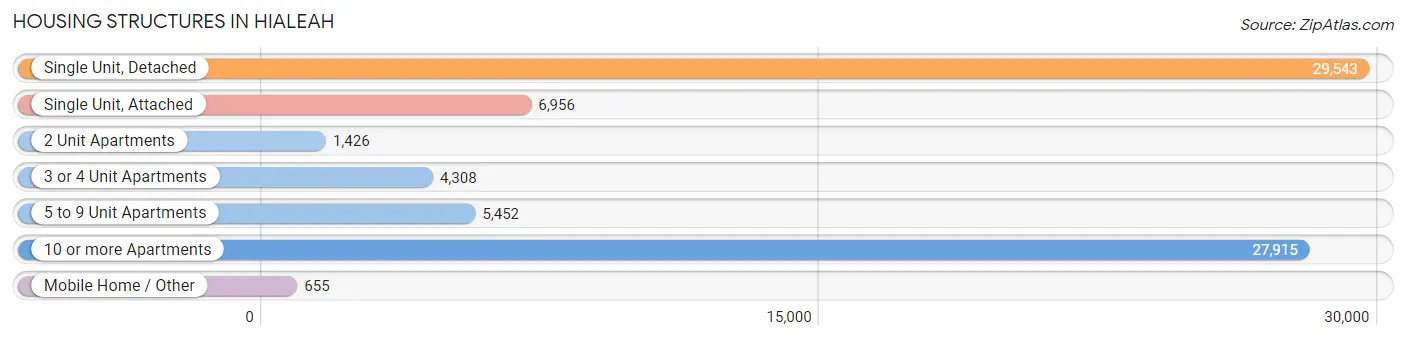
| Structure Type | # Housing Units | % Housing Units |
| Single Unit, Detached | 29,543 | 38.7% |
| Single Unit, Attached | 6,956 | 9.1% |
| 2 Unit Apartments | 1,426 | 1.9% |
| 3 or 4 Unit Apartments | 4,308 | 5.7% |
| 5 to 9 Unit Apartments | 5,452 | 7.1% |
| 10 or more Apartments | 27,915 | 36.6% |
| Mobile Home / Other | 655 | 0.9% |
| Total | 76,255 | 100.0% |
Housing Structures by Occupancy in Hialeah
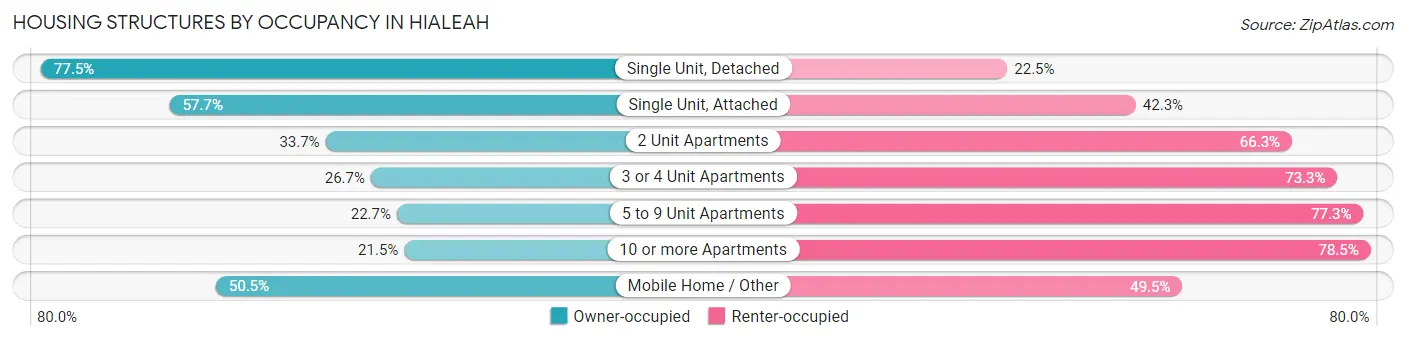
| Structure Type | Owner-occupied | Renter-occupied |
| Single Unit, Detached | 22,889 (77.5%) | 6,654 (22.5%) |
| Single Unit, Attached | 4,012 (57.7%) | 2,944 (42.3%) |
| 2 Unit Apartments | 480 (33.7%) | 946 (66.3%) |
| 3 or 4 Unit Apartments | 1,149 (26.7%) | 3,159 (73.3%) |
| 5 to 9 Unit Apartments | 1,236 (22.7%) | 4,216 (77.3%) |
| 10 or more Apartments | 6,012 (21.5%) | 21,903 (78.5%) |
| Mobile Home / Other | 331 (50.5%) | 324 (49.5%) |
| Total | 36,109 (47.3%) | 40,146 (52.6%) |
Housing Structures by Number of Rooms in Hialeah
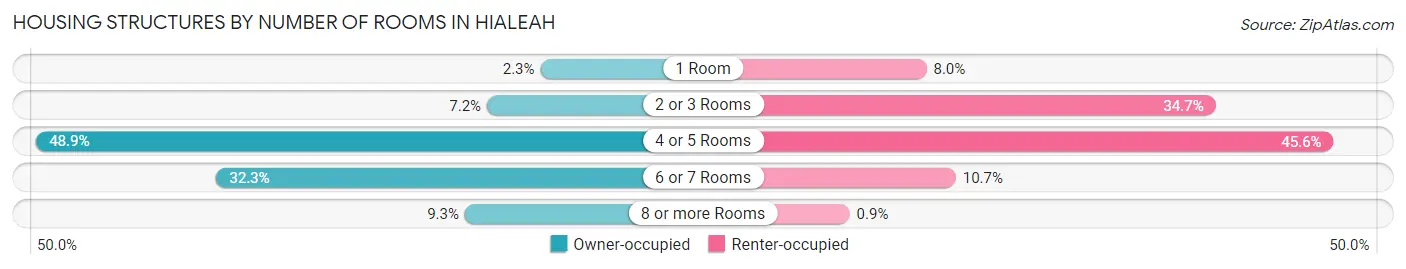
| Number of Rooms | Owner-occupied | Renter-occupied |
| 1 Room | 829 (2.3%) | 3,215 (8.0%) |
| 2 or 3 Rooms | 2,615 (7.2%) | 13,942 (34.7%) |
| 4 or 5 Rooms | 17,663 (48.9%) | 18,323 (45.6%) |
| 6 or 7 Rooms | 11,649 (32.3%) | 4,304 (10.7%) |
| 8 or more Rooms | 3,353 (9.3%) | 362 (0.9%) |
| Total | 36,109 (100.0%) | 40,146 (100.0%) |
Housing Structure by Heating Type in Hialeah
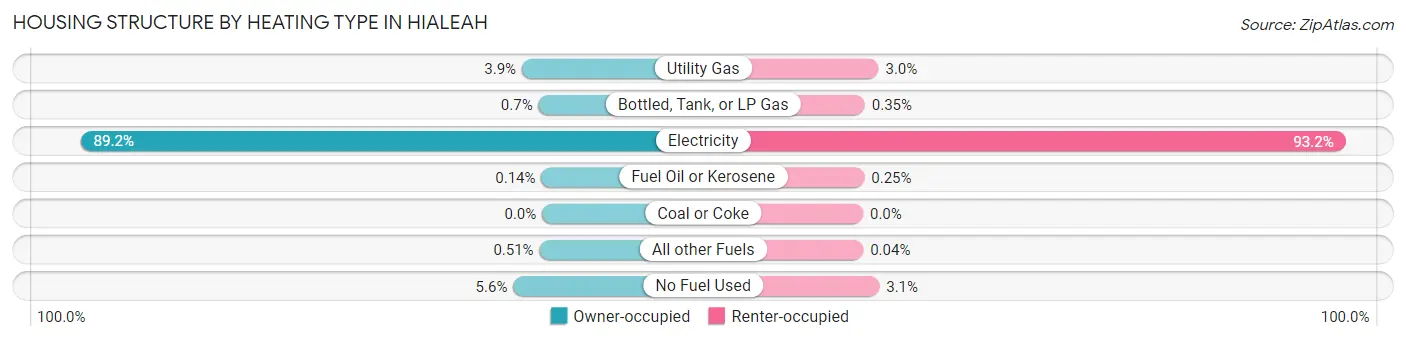
| Heating Type | Owner-occupied | Renter-occupied |
| Utility Gas | 1,408 (3.9%) | 1,199 (3.0%) |
| Bottled, Tank, or LP Gas | 254 (0.7%) | 142 (0.4%) |
| Electricity | 32,195 (89.2%) | 37,425 (93.2%) |
| Fuel Oil or Kerosene | 52 (0.1%) | 101 (0.3%) |
| Coal or Coke | 0 (0.0%) | 0 (0.0%) |
| All other Fuels | 185 (0.5%) | 17 (0.0%) |
| No Fuel Used | 2,015 (5.6%) | 1,262 (3.1%) |
| Total | 36,109 (100.0%) | 40,146 (100.0%) |
Household Vehicle Usage in Hialeah
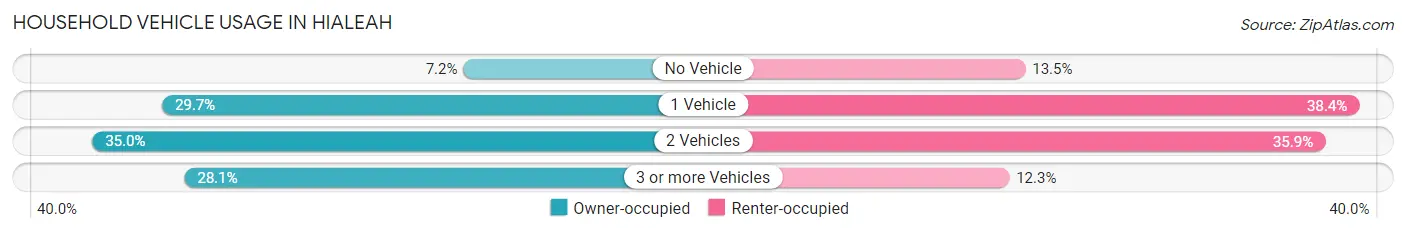
| Vehicles per Household | Owner-occupied | Renter-occupied |
| No Vehicle | 2,613 (7.2%) | 5,408 (13.5%) |
| 1 Vehicle | 10,740 (29.7%) | 15,418 (38.4%) |
| 2 Vehicles | 12,619 (34.9%) | 14,393 (35.8%) |
| 3 or more Vehicles | 10,137 (28.1%) | 4,927 (12.3%) |
| Total | 36,109 (100.0%) | 40,146 (100.0%) |
Real Estate & Mortgages in Hialeah
Real Estate and Mortgage Overview in Hialeah
| Characteristic | Without Mortgage | With Mortgage |
| Housing Units | 16,129 | 19,980 |
| Median Property Value | $307,600 | $335,900 |
| Median Household Income | $41,155 | $3,061 |
| Monthly Housing Costs | $542 | $2,217 |
| Real Estate Taxes | $1,623 | $883 |
Property Value by Mortgage Status in Hialeah
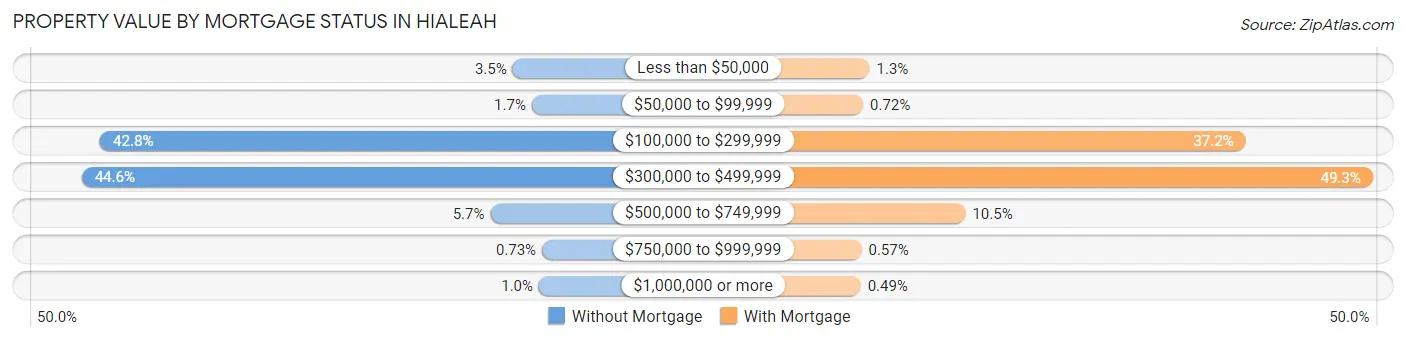
| Property Value | Without Mortgage | With Mortgage |
| Less than $50,000 | 569 (3.5%) | 267 (1.3%) |
| $50,000 to $99,999 | 274 (1.7%) | 144 (0.7%) |
| $100,000 to $299,999 | 6,904 (42.8%) | 7,423 (37.1%) |
| $300,000 to $499,999 | 7,187 (44.6%) | 9,843 (49.3%) |
| $500,000 to $749,999 | 912 (5.7%) | 2,092 (10.5%) |
| $750,000 to $999,999 | 118 (0.7%) | 114 (0.6%) |
| $1,000,000 or more | 165 (1.0%) | 97 (0.5%) |
| Total | 16,129 (100.0%) | 19,980 (100.0%) |
Household Income by Mortgage Status in Hialeah
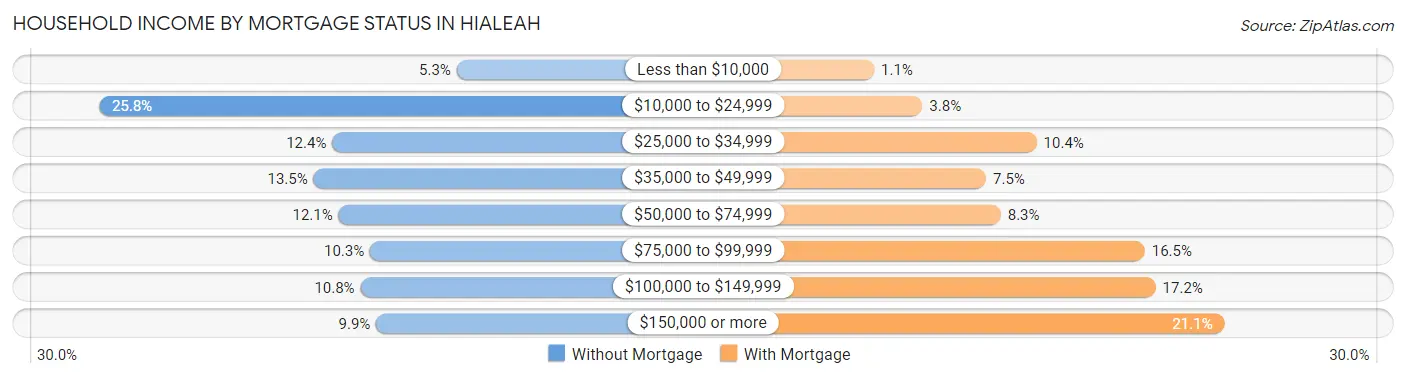
| Household Income | Without Mortgage | With Mortgage |
| Less than $10,000 | 856 (5.3%) | 212 (1.1%) |
| $10,000 to $24,999 | 4,153 (25.8%) | 763 (3.8%) |
| $25,000 to $34,999 | 2,003 (12.4%) | 2,068 (10.3%) |
| $35,000 to $49,999 | 2,176 (13.5%) | 1,490 (7.5%) |
| $50,000 to $74,999 | 1,945 (12.1%) | 1,659 (8.3%) |
| $75,000 to $99,999 | 1,655 (10.3%) | 3,302 (16.5%) |
| $100,000 to $149,999 | 1,743 (10.8%) | 3,426 (17.2%) |
| $150,000 or more | 1,598 (9.9%) | 4,211 (21.1%) |
| Total | 16,129 (100.0%) | 19,980 (100.0%) |
Property Value to Household Income Ratio in Hialeah
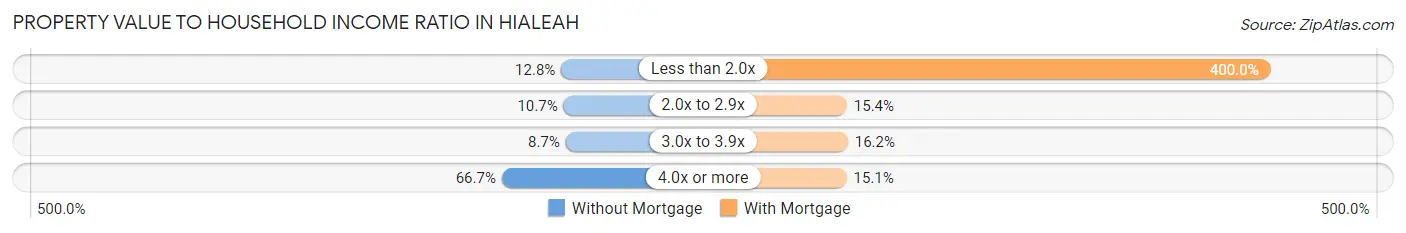
| Value-to-Income Ratio | Without Mortgage | With Mortgage |
| Less than 2.0x | 2,059 (12.8%) | 79,922 (400.0%) |
| 2.0x to 2.9x | 1,721 (10.7%) | 3,070 (15.4%) |
| 3.0x to 3.9x | 1,396 (8.7%) | 3,240 (16.2%) |
| 4.0x or more | 10,763 (66.7%) | 3,018 (15.1%) |
| Total | 16,129 (100.0%) | 19,980 (100.0%) |
Real Estate Taxes by Mortgage Status in Hialeah
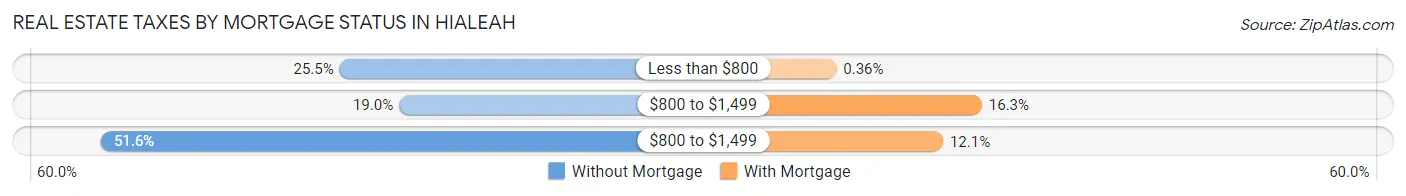
| Property Taxes | Without Mortgage | With Mortgage |
| Less than $800 | 4,111 (25.5%) | 72 (0.4%) |
| $800 to $1,499 | 3,060 (19.0%) | 3,258 (16.3%) |
| $800 to $1,499 | 8,327 (51.6%) | 2,407 (12.0%) |
| Total | 16,129 (100.0%) | 19,980 (100.0%) |
Health & Disability in Hialeah
Health Insurance Coverage by Age in Hialeah
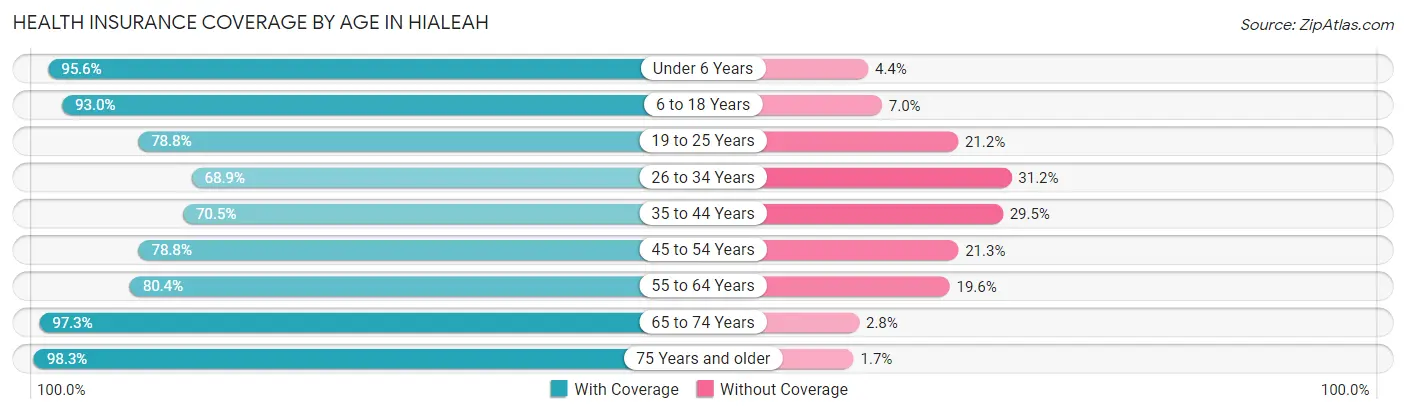
| Age Bracket | With Coverage | Without Coverage |
| Under 6 Years | 11,809 (95.6%) | 548 (4.4%) |
| 6 to 18 Years | 25,539 (93.0%) | 1,925 (7.0%) |
| 19 to 25 Years | 15,035 (78.8%) | 4,046 (21.2%) |
| 26 to 34 Years | 17,122 (68.9%) | 7,748 (31.1%) |
| 35 to 44 Years | 18,041 (70.5%) | 7,563 (29.5%) |
| 45 to 54 Years | 28,338 (78.7%) | 7,649 (21.2%) |
| 55 to 64 Years | 26,066 (80.4%) | 6,367 (19.6%) |
| 65 to 74 Years | 21,203 (97.3%) | 599 (2.8%) |
| 75 Years and older | 21,857 (98.3%) | 387 (1.7%) |
| Total | 185,010 (83.4%) | 36,832 (16.6%) |
Health Insurance Coverage by Citizenship Status in Hialeah
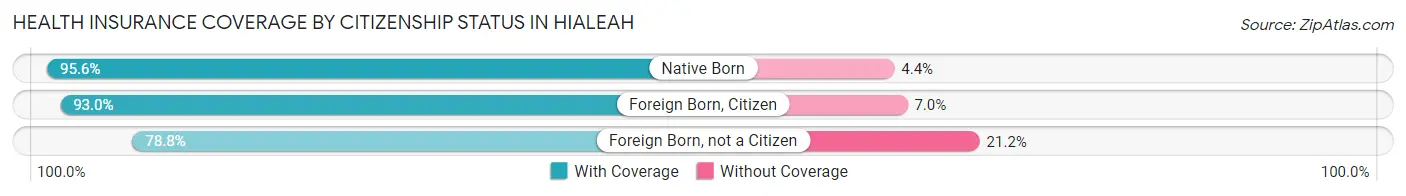
| Citizenship Status | With Coverage | Without Coverage |
| Native Born | 11,809 (95.6%) | 548 (4.4%) |
| Foreign Born, Citizen | 25,539 (93.0%) | 1,925 (7.0%) |
| Foreign Born, not a Citizen | 15,035 (78.8%) | 4,046 (21.2%) |
Health Insurance Coverage by Household Income in Hialeah
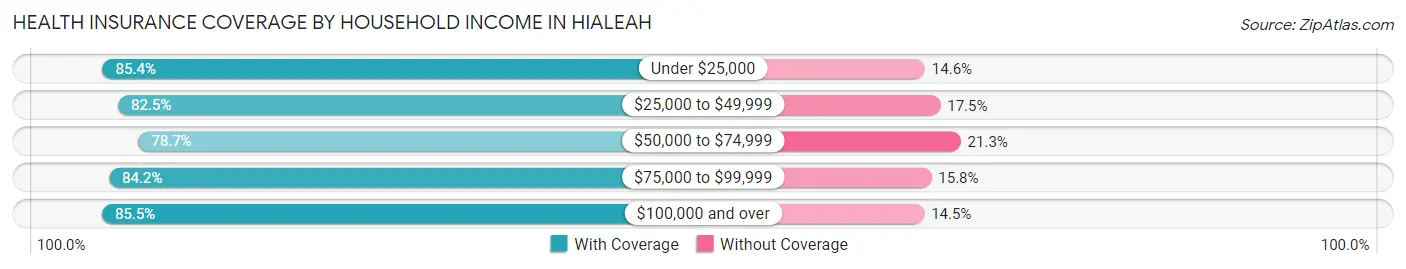
| Household Income | With Coverage | Without Coverage |
| Under $25,000 | 30,899 (85.4%) | 5,295 (14.6%) |
| $25,000 to $49,999 | 38,680 (82.5%) | 8,211 (17.5%) |
| $50,000 to $74,999 | 31,388 (78.7%) | 8,510 (21.3%) |
| $75,000 to $99,999 | 28,044 (84.2%) | 5,279 (15.8%) |
| $100,000 and over | 55,060 (85.5%) | 9,334 (14.5%) |
Public vs Private Health Insurance Coverage by Age in Hialeah
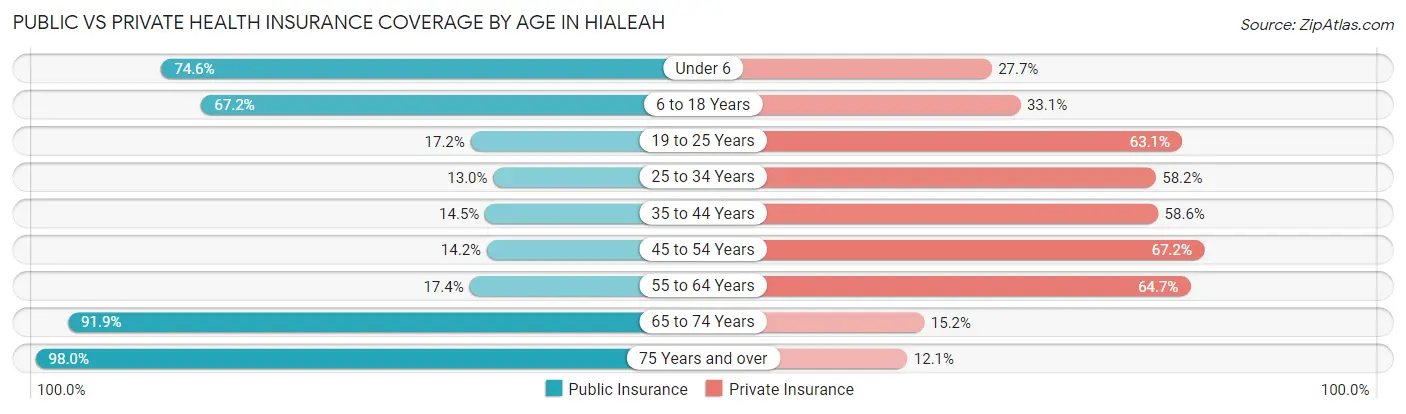
| Age Bracket | Public Insurance | Private Insurance |
| Under 6 | 9,219 (74.6%) | 3,426 (27.7%) |
| 6 to 18 Years | 18,451 (67.2%) | 9,081 (33.1%) |
| 19 to 25 Years | 3,283 (17.2%) | 12,042 (63.1%) |
| 25 to 34 Years | 3,231 (13.0%) | 14,472 (58.2%) |
| 35 to 44 Years | 3,715 (14.5%) | 15,012 (58.6%) |
| 45 to 54 Years | 5,107 (14.2%) | 24,178 (67.2%) |
| 55 to 64 Years | 5,651 (17.4%) | 20,970 (64.7%) |
| 65 to 74 Years | 20,039 (91.9%) | 3,320 (15.2%) |
| 75 Years and over | 21,788 (98.0%) | 2,687 (12.1%) |
| Total | 90,484 (40.8%) | 105,188 (47.4%) |
Disability Status by Sex by Age in Hialeah
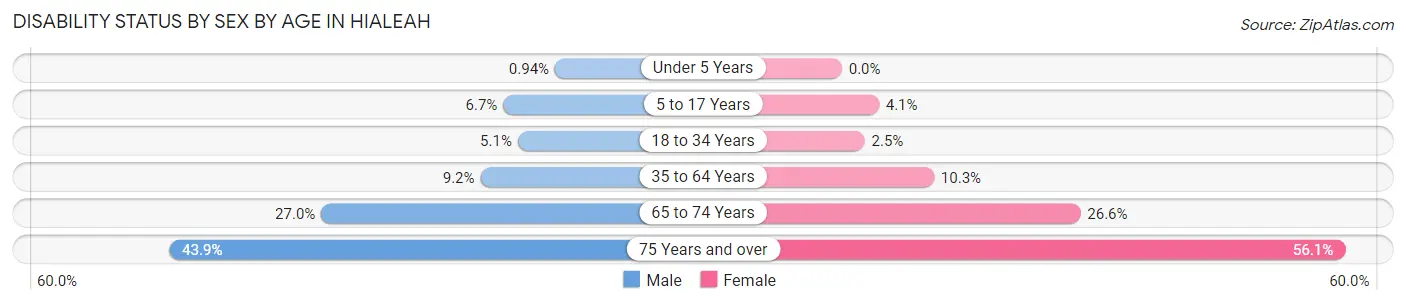
| Age Bracket | Male | Female |
| Under 5 Years | 48 (0.9%) | 0 (0.0%) |
| 5 to 17 Years | 878 (6.7%) | 579 (4.1%) |
| 18 to 34 Years | 1,252 (5.1%) | 547 (2.5%) |
| 35 to 64 Years | 4,322 (9.2%) | 4,844 (10.3%) |
| 65 to 74 Years | 2,587 (27.0%) | 3,244 (26.6%) |
| 75 Years and over | 3,852 (43.9%) | 7,550 (56.0%) |
Disability Class by Sex by Age in Hialeah
Disability Class: Hearing Difficulty
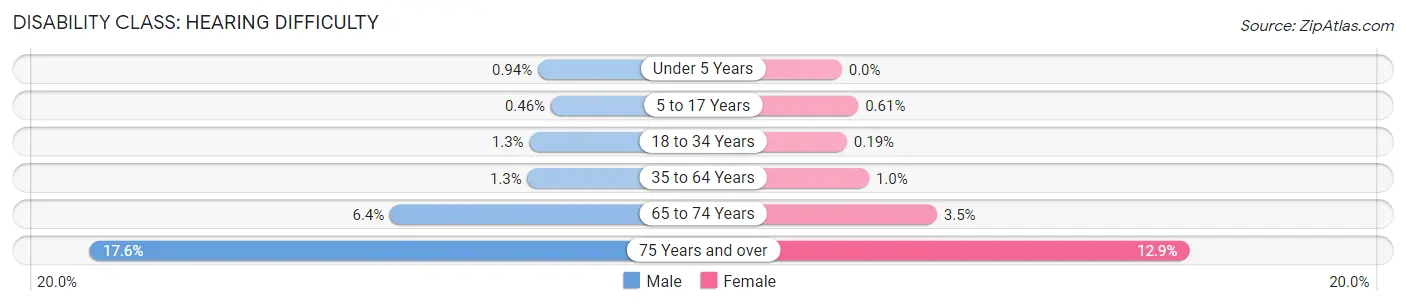
| Age Bracket | Male | Female |
| Under 5 Years | 48 (0.9%) | 0 (0.0%) |
| 5 to 17 Years | 60 (0.5%) | 86 (0.6%) |
| 18 to 34 Years | 311 (1.3%) | 42 (0.2%) |
| 35 to 64 Years | 623 (1.3%) | 476 (1.0%) |
| 65 to 74 Years | 617 (6.4%) | 431 (3.5%) |
| 75 Years and over | 1,542 (17.6%) | 1,737 (12.9%) |
Disability Class: Vision Difficulty
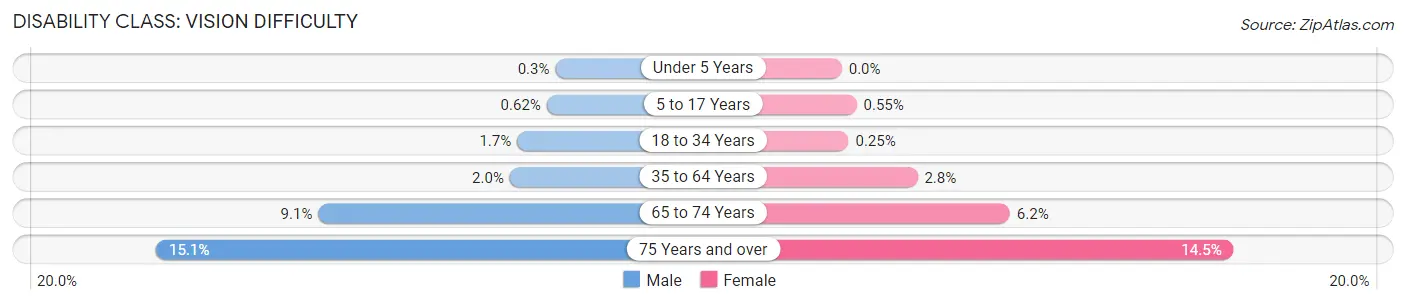
| Age Bracket | Male | Female |
| Under 5 Years | 15 (0.3%) | 0 (0.0%) |
| 5 to 17 Years | 81 (0.6%) | 77 (0.5%) |
| 18 to 34 Years | 423 (1.7%) | 53 (0.3%) |
| 35 to 64 Years | 933 (2.0%) | 1,326 (2.8%) |
| 65 to 74 Years | 873 (9.1%) | 762 (6.2%) |
| 75 Years and over | 1,327 (15.1%) | 1,959 (14.5%) |
Disability Class: Cognitive Difficulty
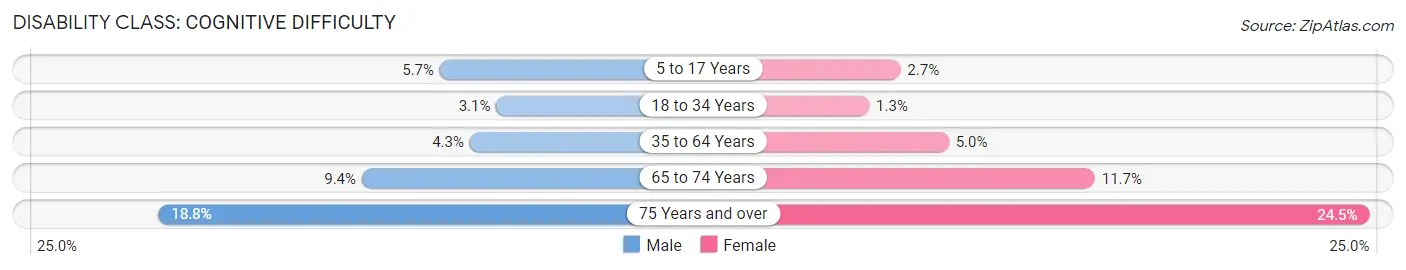
| Age Bracket | Male | Female |
| 5 to 17 Years | 751 (5.7%) | 382 (2.7%) |
| 18 to 34 Years | 766 (3.1%) | 273 (1.3%) |
| 35 to 64 Years | 2,031 (4.3%) | 2,341 (5.0%) |
| 65 to 74 Years | 897 (9.3%) | 1,433 (11.7%) |
| 75 Years and over | 1,649 (18.8%) | 3,297 (24.5%) |
Disability Class: Ambulatory Difficulty
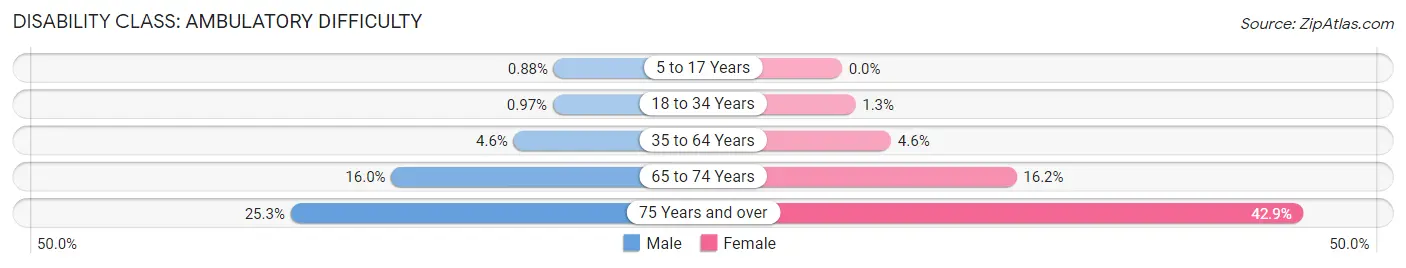
| Age Bracket | Male | Female |
| 5 to 17 Years | 115 (0.9%) | 0 (0.0%) |
| 18 to 34 Years | 239 (1.0%) | 269 (1.3%) |
| 35 to 64 Years | 2,156 (4.6%) | 2,152 (4.6%) |
| 65 to 74 Years | 1,531 (16.0%) | 1,978 (16.2%) |
| 75 Years and over | 2,220 (25.3%) | 5,771 (42.8%) |
Disability Class: Self-Care Difficulty
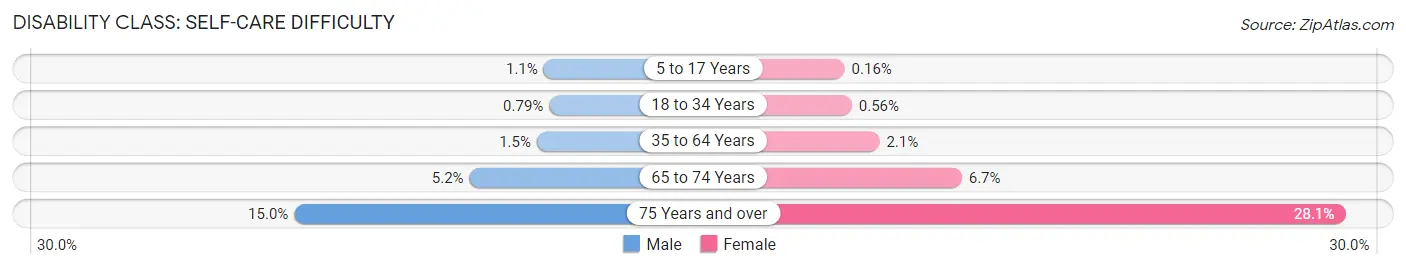
| Age Bracket | Male | Female |
| 5 to 17 Years | 144 (1.1%) | 22 (0.2%) |
| 18 to 34 Years | 194 (0.8%) | 120 (0.6%) |
| 35 to 64 Years | 694 (1.5%) | 994 (2.1%) |
| 65 to 74 Years | 502 (5.2%) | 816 (6.7%) |
| 75 Years and over | 1,315 (15.0%) | 3,782 (28.1%) |
Technology Access in Hialeah
Computing Device Access in Hialeah
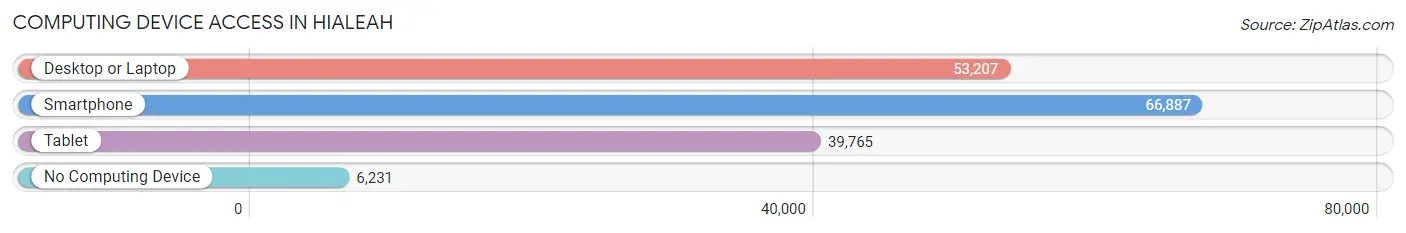
| Device Type | # Households | % Households |
| Desktop or Laptop | 53,207 | 69.8% |
| Smartphone | 66,887 | 87.7% |
| Tablet | 39,765 | 52.1% |
| No Computing Device | 6,231 | 8.2% |
| Total | 76,255 | 100.0% |
Internet Access in Hialeah
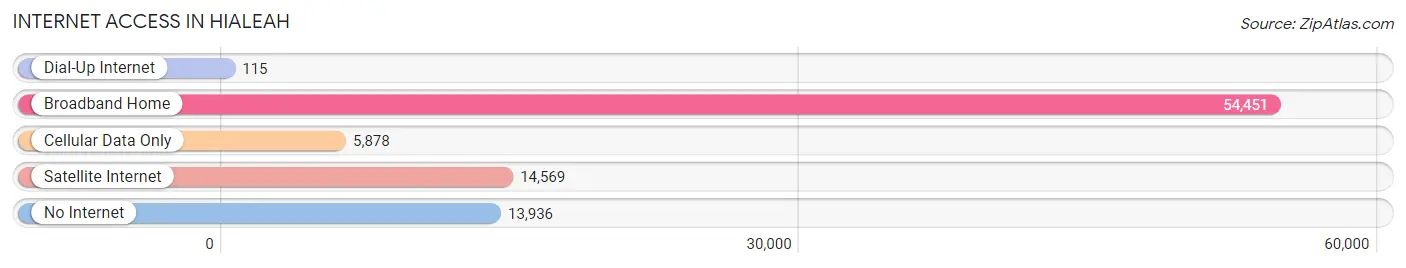
| Internet Type | # Households | % Households |
| Dial-Up Internet | 115 | 0.2% |
| Broadband Home | 54,451 | 71.4% |
| Cellular Data Only | 5,878 | 7.7% |
| Satellite Internet | 14,569 | 19.1% |
| No Internet | 13,936 | 18.3% |
| Total | 76,255 | 100.0% |
Hialeah Summary
Hialeah, Florida is a city located in Miami-Dade County, Florida, United States. It is the sixth-largest city in the state and the fourth-largest city in Miami-Dade County. The city is located just west of Miami and is part of the Miami metropolitan area. As of the 2010 census, the population of Hialeah was 224,669, making it the sixth-largest city in Florida.
History
Hialeah was founded in 1925 by James H. Bright, a real estate developer from Chicago. He named the city after the Seminole Indian word for “pretty prairie”. The city was incorporated in 1925 and was the first city in Miami-Dade County to be incorporated.
In the early years, Hialeah was a farming community, with many of its residents working in the nearby fields. The city was also known for its horse racing track, which opened in 1925 and was the first in the state. The track was a popular destination for tourists and locals alike.
In the 1950s, Hialeah began to experience a population boom, as many people moved to the city from other parts of the country. This influx of people led to the development of many new neighborhoods and businesses.
Geography
Hialeah is located in Miami-Dade County, Florida, United States. It is situated just west of Miami and is part of the Miami metropolitan area. The city is bordered by Miami Springs to the east, Miami Lakes to the north, and West Miami to the south.
The city covers an area of 15.2 square miles and has a population density of 14,845 people per square mile. The city is located at an elevation of 6 feet above sea level.
Economy
Hialeah has a diverse economy, with many different industries represented. The city is home to several large companies, including Telemundo, a Spanish-language television network, and American Airlines, which has its Latin American headquarters in the city.
Hialeah is also home to several shopping centers, including the Westland Mall, which is the largest mall in Miami-Dade County. The city is also home to several industrial parks, which are home to many manufacturing and distribution companies.
Demographics
As of the 2010 census, the population of Hialeah was 224,669. The racial makeup of the city was 79.3% Hispanic or Latino, 14.3% White, 2.2% African American, 0.7% Asian, 0.1% Native American, and 3.4% from other races.
The median household income in Hialeah was $35,945 in 2018, and the median home value was $223,400. The city has a poverty rate of 22.3%, which is higher than the national average.
Conclusion
Hialeah, Florida is a city located in Miami-Dade County, Florida, United States. It is the sixth-largest city in the state and the fourth-largest city in Miami-Dade County. The city was founded in 1925 and has a diverse economy, with many different industries represented. As of the 2010 census, the population of Hialeah was 224,669, with a median household income of $35,945 and a median home value of $223,400. The city has a poverty rate of 22.3%, which is higher than the national average.
Common Questions
What is the Total Population of Hialeah?
Total Population of Hialeah is 222,996.
What is the Total Male Population of Hialeah?
Total Male Population of Hialeah is 108,532.
What is the Total Female Population of Hialeah?
Total Female Population of Hialeah is 114,464.
What is the Ratio of Males per 100 Females in Hialeah?
There are 94.82 Males per 100 Females in Hialeah.
What is the Ratio of Females per 100 Males in Hialeah?
There are 105.47 Females per 100 Males in Hialeah.
What is the Median Population Age in Hialeah?
Median Population Age in Hialeah is 45.5 Years.
What is the Average Family Size in Hialeah
Average Family Size in Hialeah is 3.2 People.
What is the Average Household Size in Hialeah
Average Household Size in Hialeah is 2.9 People.
What is Per Capita Income in Hialeah?
Per Capita income in Hialeah is $24,295.
What is the Median Family Income in Hialeah?
Median Family Income in Hialeah is $55,066.
What is the Median Household income in Hialeah?
Median Household Income in Hialeah is $49,531.
What is Income or Wage Gap in Hialeah?
Income or Wage Gap in Hialeah is 24.2%.
Women in Hialeah earn 75.8 cents for every dollar earned by a man.
What is Family Income Deficit in Hialeah?
Family Income Deficit in Hialeah is $8,386.
Families that are below poverty line in Hialeah earn $8,386 less on average than the poverty threshold level.
What is Inequality or Gini Index in Hialeah?
Inequality or Gini Index in Hialeah is 0.47.
How Large is the Labor Force in Hialeah?
There are 117,073 People in the Labor Forcein in Hialeah.
What is the Percentage of People in the Labor Force in Hialeah?
61.7% of People are in the Labor Force in Hialeah.
What is the Unemployment Rate in Hialeah?
Unemployment Rate in Hialeah is 3.7%.