Coral Gables, FL
Coral Gables Map
Coral Gables Overview
49,696
TOTAL POPULATION
23,139
MALE POPULATION
26,557
FEMALE POPULATION
87.13
MALES / 100 FEMALES
114.77
FEMALES / 100 MALES
39.3
MEDIAN AGE
3.0
AVG FAMILY SIZE
2.3
AVG HOUSEHOLD SIZE
$74,780
PER CAPITA INCOME
$175,295
AVG FAMILY INCOME
$118,203
AVG HOUSEHOLD INCOME
40.5%
WAGE / INCOME GAP [ % ]
59.5¢/ $1
WAGE / INCOME GAP [ $ ]
$12,221
FAMILY INCOME DEFICIT
0.55
INEQUALITY / GINI INDEX
24,387
LABOR FORCE [ PEOPLE ]
57.7%
PERCENT IN LABOR FORCE
4.8%
UNEMPLOYMENT RATE
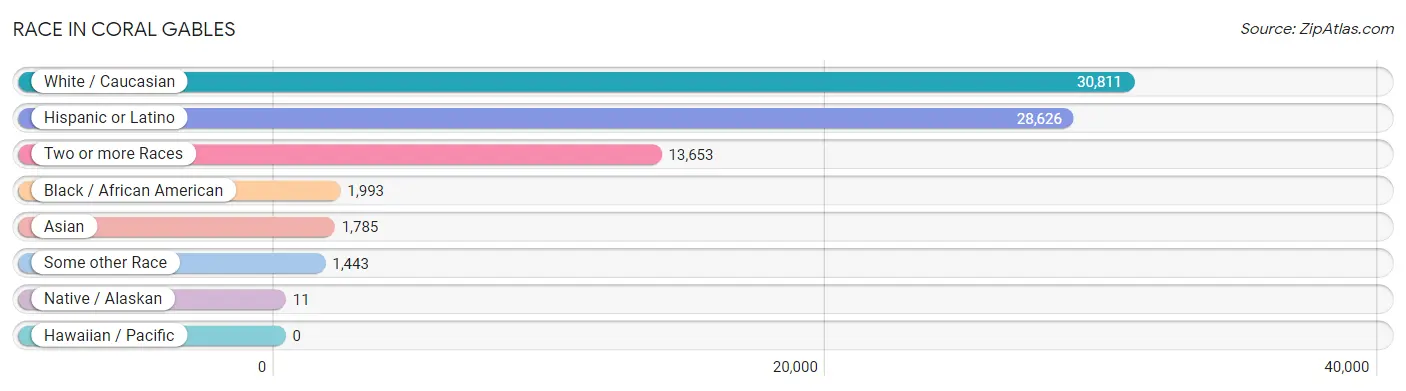
Race in Coral Gables
The most populous races in Coral Gables are White / Caucasian (30,811 | 62.0%), Hispanic or Latino (28,626 | 57.6%), and Two or more Races (13,653 | 27.5%).
| Race | # Population | % Population |
| Asian | 1,785 | 3.6% |
| Black / African American | 1,993 | 4.0% |
| Hawaiian / Pacific | 0 | 0.0% |
| Hispanic or Latino | 28,626 | 57.6% |
| Native / Alaskan | 11 | 0.0% |
| White / Caucasian | 30,811 | 62.0% |
| Two or more Races | 13,653 | 27.5% |
| Some other Race | 1,443 | 2.9% |
| Total | 49,696 | 100.0% |
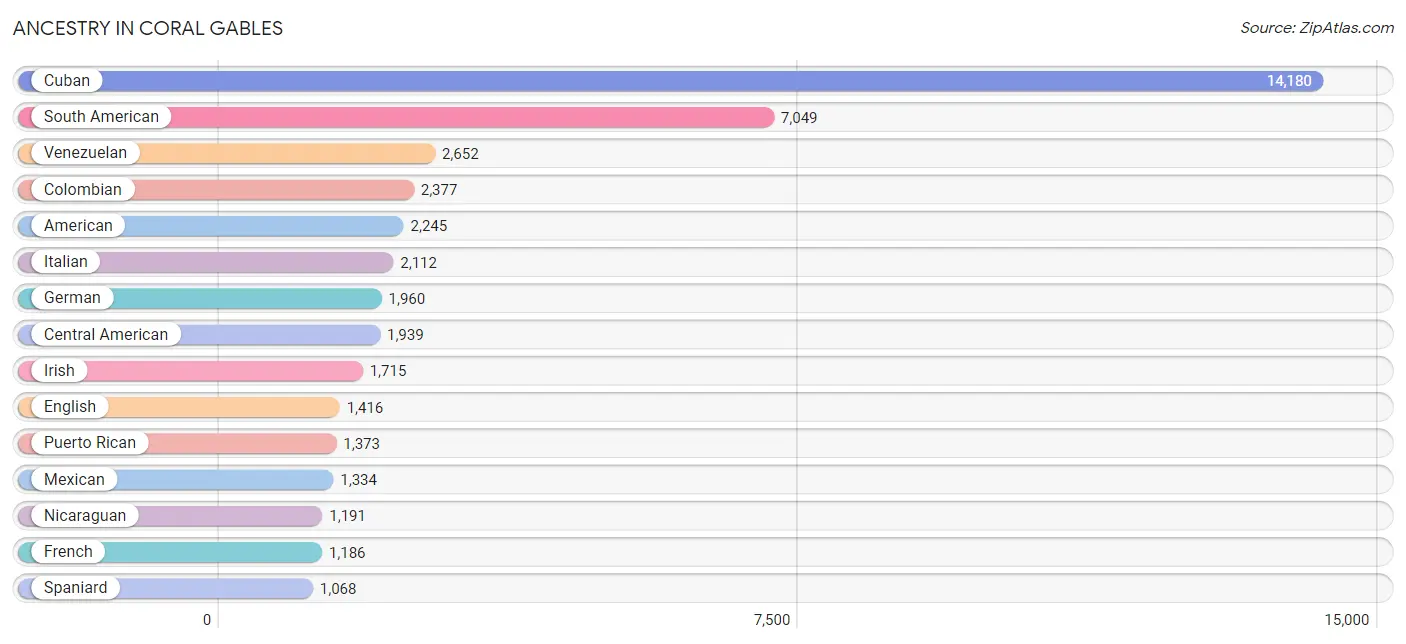
Ancestry in Coral Gables
The most populous ancestries reported in Coral Gables are Cuban (14,180 | 28.5%), South American (7,049 | 14.2%), Venezuelan (2,652 | 5.3%), Colombian (2,377 | 4.8%), and American (2,245 | 4.5%), together accounting for 57.4% of all Coral Gables residents.
| Ancestry | # Population | % Population |
| African | 27 | 0.1% |
| American | 2,245 | 4.5% |
| Arab | 740 | 1.5% |
| Arapaho | 131 | 0.3% |
| Argentinean | 860 | 1.7% |
| Armenian | 105 | 0.2% |
| Austrian | 204 | 0.4% |
| Bahamian | 19 | 0.0% |
| Basque | 9 | 0.0% |
| Belgian | 247 | 0.5% |
| Belizean | 12 | 0.0% |
| Bhutanese | 9 | 0.0% |
| Bolivian | 111 | 0.2% |
| Brazilian | 532 | 1.1% |
| British | 523 | 1.1% |
| British West Indian | 15 | 0.0% |
| Bulgarian | 13 | 0.0% |
| Burmese | 109 | 0.2% |
| Canadian | 52 | 0.1% |
| Celtic | 18 | 0.0% |
| Central American | 1,939 | 3.9% |
| Central American Indian | 2 | 0.0% |
| Cherokee | 17 | 0.0% |
| Chickasaw | 53 | 0.1% |
| Chilean | 127 | 0.3% |
| Colombian | 2,377 | 4.8% |
| Comanche | 11 | 0.0% |
| Costa Rican | 96 | 0.2% |
| Croatian | 23 | 0.1% |
| Cuban | 14,180 | 28.5% |
| Czech | 87 | 0.2% |
| Czechoslovakian | 6 | 0.0% |
| Danish | 153 | 0.3% |
| Dominican | 791 | 1.6% |
| Dutch | 234 | 0.5% |
| Eastern European | 172 | 0.4% |
| Ecuadorian | 336 | 0.7% |
| Egyptian | 14 | 0.0% |
| English | 1,416 | 2.9% |
| European | 547 | 1.1% |
| Filipino | 166 | 0.3% |
| Finnish | 60 | 0.1% |
| French | 1,186 | 2.4% |
| French American Indian | 1 | 0.0% |
| French Canadian | 121 | 0.2% |
| German | 1,960 | 3.9% |
| Greek | 226 | 0.4% |
| Guatemalan | 146 | 0.3% |
| Guyanese | 42 | 0.1% |
| Haitian | 66 | 0.1% |
| Honduran | 147 | 0.3% |
| Hungarian | 150 | 0.3% |
| Indian (Asian) | 814 | 1.6% |
| Iranian | 109 | 0.2% |
| Iraqi | 23 | 0.1% |
| Irish | 1,715 | 3.5% |
| Israeli | 53 | 0.1% |
| Italian | 2,112 | 4.3% |
| Jamaican | 97 | 0.2% |
| Kenyan | 23 | 0.1% |
| Korean | 283 | 0.6% |
| Latvian | 10 | 0.0% |
| Lebanese | 357 | 0.7% |
| Lithuanian | 25 | 0.1% |
| Mexican | 1,334 | 2.7% |
| Moroccan | 90 | 0.2% |
| Nicaraguan | 1,191 | 2.4% |
| Northern European | 174 | 0.4% |
| Norwegian | 116 | 0.2% |
| Pakistani | 15 | 0.0% |
| Palestinian | 8 | 0.0% |
| Panamanian | 184 | 0.4% |
| Paraguayan | 50 | 0.1% |
| Peruvian | 480 | 1.0% |
| Polish | 739 | 1.5% |
| Portuguese | 501 | 1.0% |
| Puerto Rican | 1,373 | 2.8% |
| Romanian | 89 | 0.2% |
| Russian | 885 | 1.8% |
| Salvadoran | 175 | 0.4% |
| Scandinavian | 54 | 0.1% |
| Scotch-Irish | 92 | 0.2% |
| Scottish | 266 | 0.5% |
| Sioux | 5 | 0.0% |
| Slavic | 4 | 0.0% |
| Slovak | 35 | 0.1% |
| South African | 16 | 0.0% |
| South American | 7,049 | 14.2% |
| South American Indian | 12 | 0.0% |
| Spaniard | 1,068 | 2.1% |
| Spanish | 145 | 0.3% |
| Sri Lankan | 79 | 0.2% |
| Subsaharan African | 87 | 0.2% |
| Sudanese | 14 | 0.0% |
| Swedish | 184 | 0.4% |
| Swiss | 121 | 0.2% |
| Syrian | 45 | 0.1% |
| Thai | 594 | 1.2% |
| Trinidadian and Tobagonian | 15 | 0.0% |
| Turkish | 49 | 0.1% |
| Ugandan | 7 | 0.0% |
| Ukrainian | 60 | 0.1% |
| Uruguayan | 56 | 0.1% |
| Venezuelan | 2,652 | 5.3% |
| Vietnamese | 29 | 0.1% |
| Welsh | 197 | 0.4% |
| West Indian | 25 | 0.1% |
| Yugoslavian | 14 | 0.0% | View All 108 Rows |
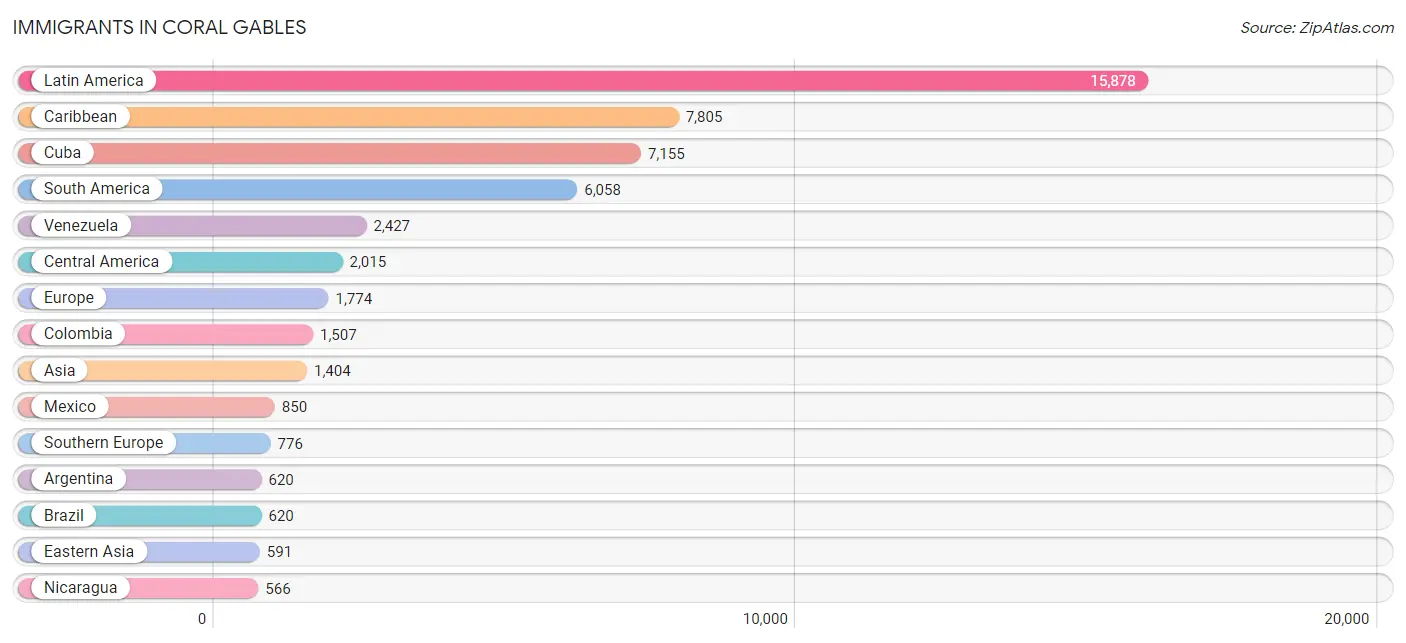
Immigrants in Coral Gables
The most numerous immigrant groups reported in Coral Gables came from Latin America (15,878 | 32.0%), Caribbean (7,805 | 15.7%), Cuba (7,155 | 14.4%), South America (6,058 | 12.2%), and Venezuela (2,427 | 4.9%), together accounting for 79.1% of all Coral Gables residents.
| Immigration Origin | # Population | % Population |
| Africa | 54 | 0.1% |
| Argentina | 620 | 1.3% |
| Asia | 1,404 | 2.8% |
| Australia | 20 | 0.0% |
| Austria | 34 | 0.1% |
| Bahamas | 29 | 0.1% |
| Belgium | 61 | 0.1% |
| Belize | 12 | 0.0% |
| Bolivia | 107 | 0.2% |
| Brazil | 620 | 1.3% |
| Bulgaria | 13 | 0.0% |
| Canada | 228 | 0.5% |
| Caribbean | 7,805 | 15.7% |
| Central America | 2,015 | 4.1% |
| Chile | 127 | 0.3% |
| China | 475 | 1.0% |
| Colombia | 1,507 | 3.0% |
| Costa Rica | 144 | 0.3% |
| Croatia | 7 | 0.0% |
| Cuba | 7,155 | 14.4% |
| Czechoslovakia | 20 | 0.0% |
| Denmark | 32 | 0.1% |
| Dominican Republic | 382 | 0.8% |
| Eastern Africa | 9 | 0.0% |
| Eastern Asia | 591 | 1.2% |
| Eastern Europe | 242 | 0.5% |
| Ecuador | 242 | 0.5% |
| El Salvador | 61 | 0.1% |
| England | 121 | 0.2% |
| Europe | 1,774 | 3.6% |
| France | 214 | 0.4% |
| Germany | 45 | 0.1% |
| Greece | 29 | 0.1% |
| Guatemala | 134 | 0.3% |
| Guyana | 8 | 0.0% |
| Haiti | 30 | 0.1% |
| Honduras | 87 | 0.2% |
| Hungary | 34 | 0.1% |
| India | 296 | 0.6% |
| Indonesia | 27 | 0.1% |
| Iran | 61 | 0.1% |
| Iraq | 23 | 0.1% |
| Ireland | 11 | 0.0% |
| Israel | 40 | 0.1% |
| Italy | 193 | 0.4% |
| Jamaica | 171 | 0.3% |
| Japan | 7 | 0.0% |
| Kenya | 9 | 0.0% |
| Korea | 109 | 0.2% |
| Kuwait | 41 | 0.1% |
| Latin America | 15,878 | 32.0% |
| Lebanon | 58 | 0.1% |
| Malaysia | 2 | 0.0% |
| Mexico | 850 | 1.7% |
| Morocco | 20 | 0.0% |
| Netherlands | 20 | 0.0% |
| Nicaragua | 566 | 1.1% |
| Nigeria | 21 | 0.0% |
| Northern Africa | 20 | 0.0% |
| Northern Europe | 322 | 0.6% |
| Oceania | 20 | 0.0% |
| Panama | 161 | 0.3% |
| Peru | 324 | 0.6% |
| Philippines | 92 | 0.2% |
| Poland | 11 | 0.0% |
| Portugal | 12 | 0.0% |
| Romania | 57 | 0.1% |
| Russia | 70 | 0.1% |
| Saudi Arabia | 7 | 0.0% |
| Scotland | 17 | 0.0% |
| Singapore | 21 | 0.0% |
| South Africa | 4 | 0.0% |
| South America | 6,058 | 12.2% |
| South Central Asia | 357 | 0.7% |
| South Eastern Asia | 202 | 0.4% |
| Southern Europe | 776 | 1.6% |
| Spain | 542 | 1.1% |
| Sweden | 11 | 0.0% |
| Switzerland | 60 | 0.1% |
| Taiwan | 66 | 0.1% |
| Thailand | 15 | 0.0% |
| Trinidad and Tobago | 11 | 0.0% |
| Turkey | 66 | 0.1% |
| Ukraine | 30 | 0.1% |
| Uruguay | 16 | 0.0% |
| Venezuela | 2,427 | 4.9% |
| Vietnam | 45 | 0.1% |
| Western Africa | 21 | 0.0% |
| Western Asia | 254 | 0.5% |
| Western Europe | 434 | 0.9% | View All 90 Rows |
Sex and Age in Coral Gables
Sex and Age in Coral Gables
The most populous age groups in Coral Gables are 15 to 19 Years (2,817 | 12.2%) for men and 15 to 19 Years (3,303 | 12.4%) for women.
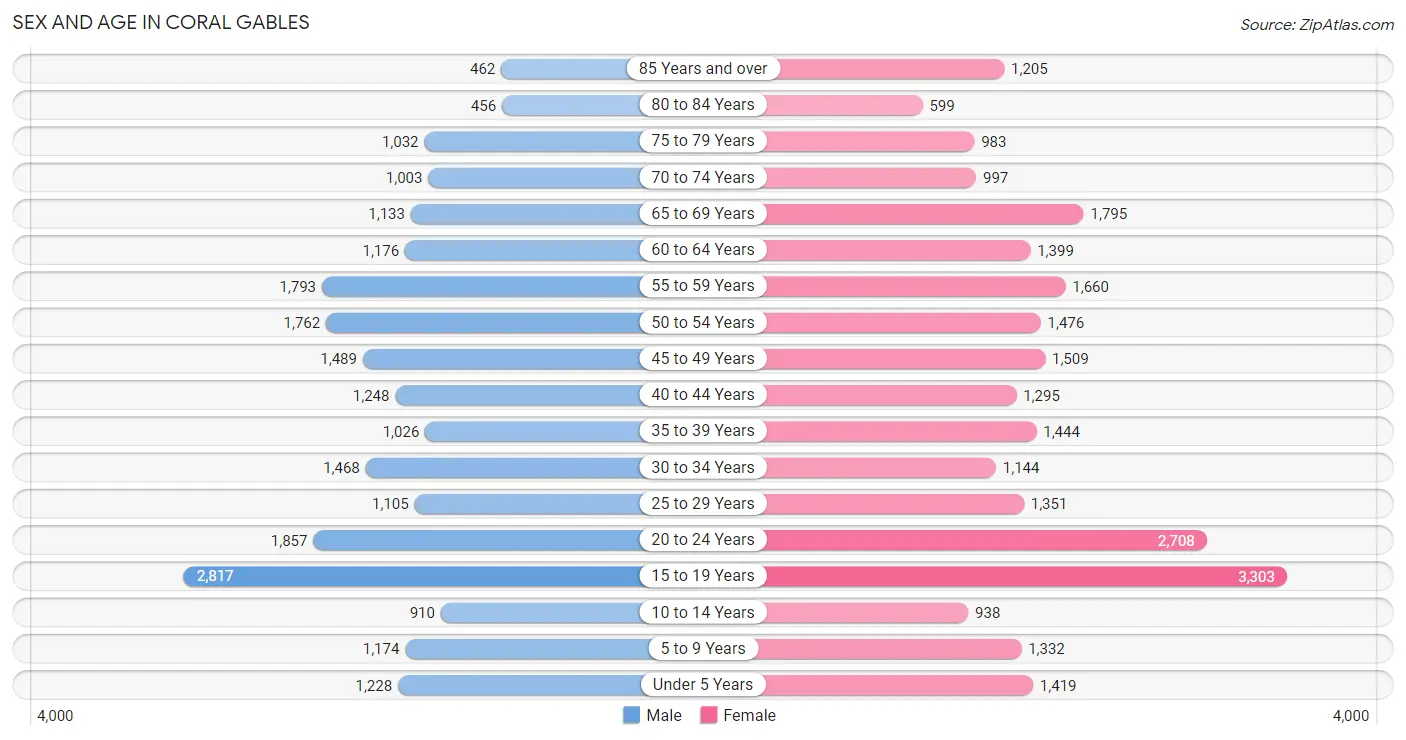
| Age Bracket | Male | Female |
| Under 5 Years | 1,228 (5.3%) | 1,419 (5.3%) |
| 5 to 9 Years | 1,174 (5.1%) | 1,332 (5.0%) |
| 10 to 14 Years | 910 (3.9%) | 938 (3.5%) |
| 15 to 19 Years | 2,817 (12.2%) | 3,303 (12.4%) |
| 20 to 24 Years | 1,857 (8.0%) | 2,708 (10.2%) |
| 25 to 29 Years | 1,105 (4.8%) | 1,351 (5.1%) |
| 30 to 34 Years | 1,468 (6.3%) | 1,144 (4.3%) |
| 35 to 39 Years | 1,026 (4.4%) | 1,444 (5.4%) |
| 40 to 44 Years | 1,248 (5.4%) | 1,295 (4.9%) |
| 45 to 49 Years | 1,489 (6.4%) | 1,509 (5.7%) |
| 50 to 54 Years | 1,762 (7.6%) | 1,476 (5.6%) |
| 55 to 59 Years | 1,793 (7.7%) | 1,660 (6.2%) |
| 60 to 64 Years | 1,176 (5.1%) | 1,399 (5.3%) |
| 65 to 69 Years | 1,133 (4.9%) | 1,795 (6.8%) |
| 70 to 74 Years | 1,003 (4.3%) | 997 (3.7%) |
| 75 to 79 Years | 1,032 (4.5%) | 983 (3.7%) |
| 80 to 84 Years | 456 (2.0%) | 599 (2.3%) |
| 85 Years and over | 462 (2.0%) | 1,205 (4.5%) |
| Total | 23,139 (100.0%) | 26,557 (100.0%) |
Families and Households in Coral Gables
Median Family Size in Coral Gables
The median family size in Coral Gables is 2.98 persons per family, with married-couple families (9,180 | 81.4%) accounting for the largest median family size of 3.06 persons per family. On the other hand, single male/father families (739 | 6.6%) represent the smallest median family size with 2.52 persons per family.
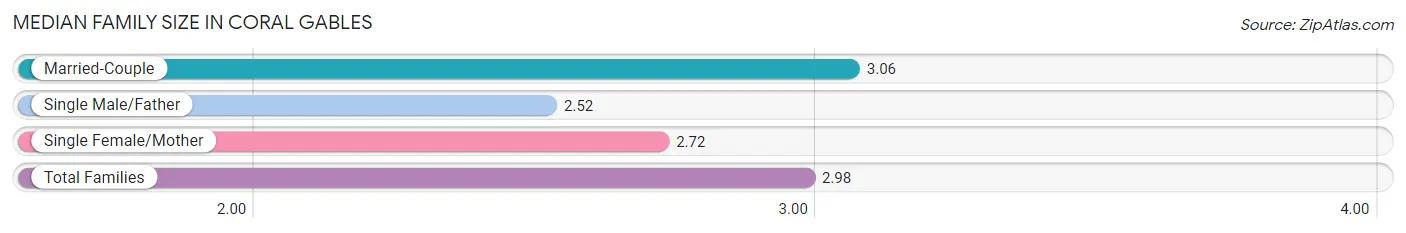
| Family Type | # Families | Family Size |
| Married-Couple | 9,180 (81.4%) | 3.06 |
| Single Male/Father | 739 (6.6%) | 2.52 |
| Single Female/Mother | 1,360 (12.1%) | 2.72 |
| Total Families | 11,279 (100.0%) | 2.98 |
Median Household Size in Coral Gables
The median household size in Coral Gables is 2.30 persons per household, with married-couple households (9,180 | 48.4%) accounting for the largest median household size of 3.09 persons per household. non-family households (7,668 | 40.5%) represent the smallest median household size with 1.20 persons per household.
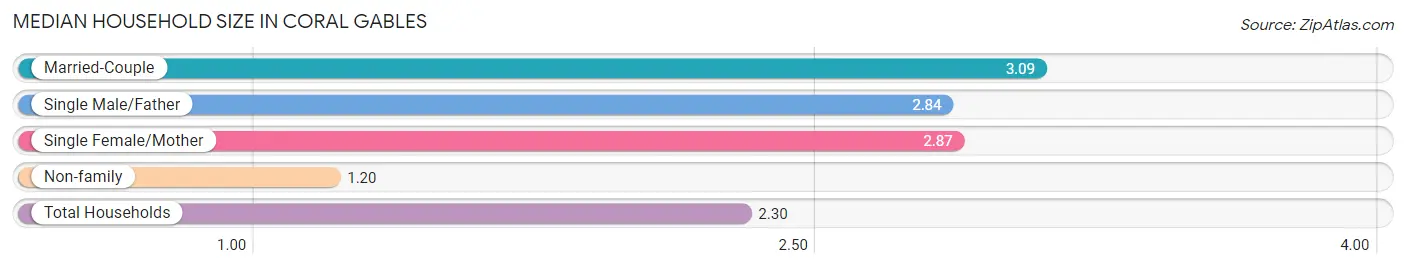
| Household Type | # Households | Household Size |
| Married-Couple | 9,180 (48.4%) | 3.09 |
| Single Male/Father | 739 (3.9%) | 2.84 |
| Single Female/Mother | 1,360 (7.2%) | 2.87 |
| Non-family | 7,668 (40.5%) | 1.20 |
| Total Households | 18,947 (100.0%) | 2.30 |
Household Size by Marriage Status in Coral Gables
Out of a total of 18,947 households in Coral Gables, 11,279 (59.5%) are family households, while 7,668 (40.5%) are nonfamily households. The most numerous type of family households are 2-person households, comprising 5,619, and the most common type of nonfamily households are 1-person households, comprising 6,457.
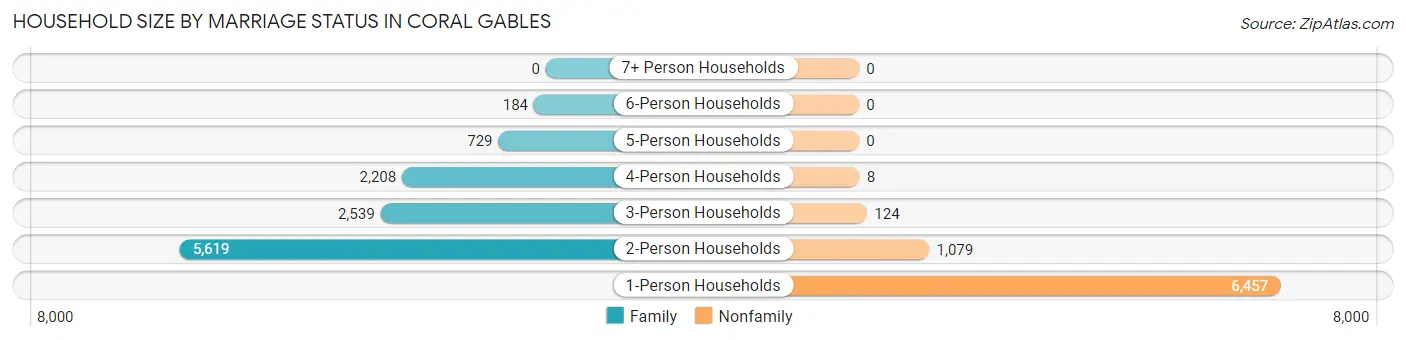
| Household Size | Family Households | Nonfamily Households |
| 1-Person Households | - | 6,457 (34.1%) |
| 2-Person Households | 5,619 (29.7%) | 1,079 (5.7%) |
| 3-Person Households | 2,539 (13.4%) | 124 (0.6%) |
| 4-Person Households | 2,208 (11.7%) | 8 (0.0%) |
| 5-Person Households | 729 (3.8%) | 0 (0.0%) |
| 6-Person Households | 184 (1.0%) | 0 (0.0%) |
| 7+ Person Households | 0 (0.0%) | 0 (0.0%) |
| Total | 11,279 (59.5%) | 7,668 (40.5%) |
Female Fertility in Coral Gables
Fertility by Age in Coral Gables
Average fertility rate in Coral Gables is 26.0 births per 1,000 women. Women in the age bracket of 35 to 50 years have the highest fertility rate with 39.0 births per 1,000 women. Women in the age bracket of 35 to 50 years acount for 51.6% of all women with births.
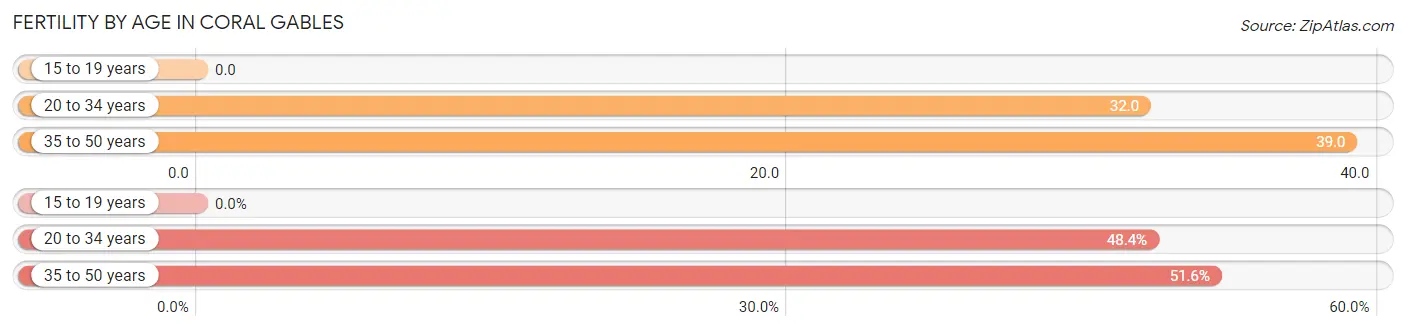
| Age Bracket | Women with Births | Births / 1,000 Women |
| 15 to 19 years | 0 (0.0%) | 0.0 |
| 20 to 34 years | 166 (48.4%) | 32.0 |
| 35 to 50 years | 177 (51.6%) | 39.0 |
| Total | 343 (100.0%) | 26.0 |
Fertility by Age by Marriage Status in Coral Gables
91.3% of women with births (343) in Coral Gables are married. The highest percentage of unmarried women with births falls into 20 to 34 years age bracket with 18.1% of them unmarried at the time of birth, while the lowest percentage of unmarried women with births belong to 35 to 50 years age bracket with 0.0% of them unmarried.
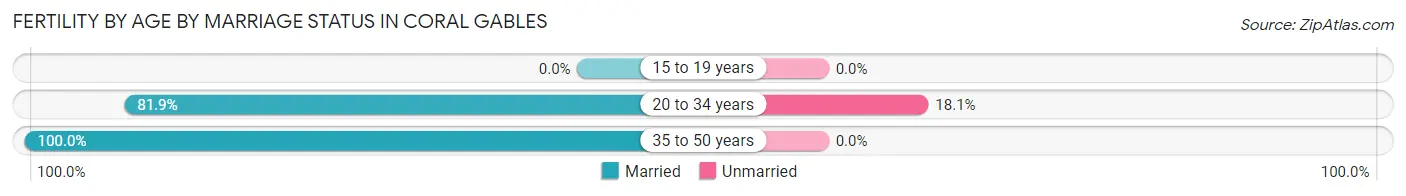
| Age Bracket | Married | Unmarried |
| 15 to 19 years | 0 (0.0%) | 0 (0.0%) |
| 20 to 34 years | 136 (81.9%) | 30 (18.1%) |
| 35 to 50 years | 177 (100.0%) | 0 (0.0%) |
| Total | 313 (91.2%) | 30 (8.7%) |
Fertility by Education in Coral Gables
Average fertility rate in Coral Gables is 26.0 births per 1,000 women. Women with the education attainment of graduate degree have the highest fertility rate of 61.0 births per 1,000 women, while women with the education attainment of college or associate's degree have the lowest fertility at 5.0 births per 1,000 women. Women with the education attainment of graduate degree represent 56.3% of all women with births.
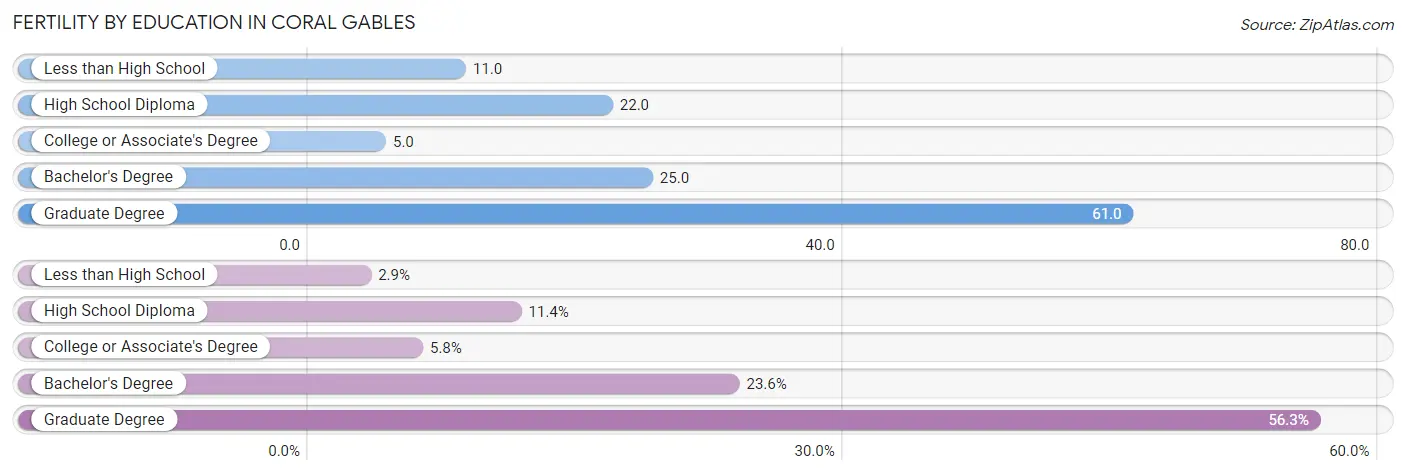
| Educational Attainment | Women with Births | Births / 1,000 Women |
| Less than High School | 10 (2.9%) | 11.0 |
| High School Diploma | 39 (11.4%) | 22.0 |
| College or Associate's Degree | 20 (5.8%) | 5.0 |
| Bachelor's Degree | 81 (23.6%) | 25.0 |
| Graduate Degree | 193 (56.3%) | 61.0 |
| Total | 343 (100.0%) | 26.0 |
Fertility by Education by Marriage Status in Coral Gables
8.7% of women with births in Coral Gables are unmarried. Women with the educational attainment of less than high school are most likely to be married with 100.0% of them married at childbirth, while women with the educational attainment of college or associate's degree are least likely to be married with 100.0% of them unmarried at childbirth.
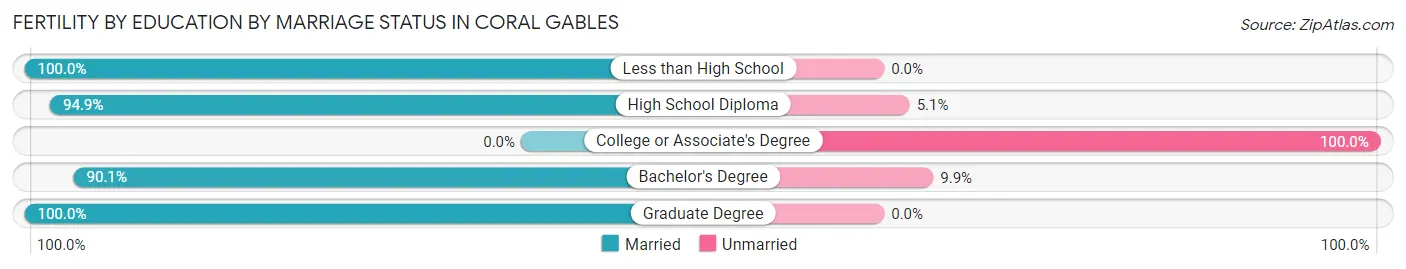
| Educational Attainment | Married | Unmarried |
| Less than High School | 10 (100.0%) | 0 (0.0%) |
| High School Diploma | 37 (94.9%) | 2 (5.1%) |
| College or Associate's Degree | 0 (0.0%) | 20 (100.0%) |
| Bachelor's Degree | 73 (90.1%) | 8 (9.9%) |
| Graduate Degree | 193 (100.0%) | 0 (0.0%) |
| Total | 313 (91.2%) | 30 (8.7%) |
Income in Coral Gables
Income Overview in Coral Gables
Per Capita Income in Coral Gables is $74,780, while median incomes of families and households are $175,295 and $118,203 respectively.
| Characteristic | Number | Measure |
| Per Capita Income | 49,696 | $74,780 |
| Median Family Income | 11,279 | $175,295 |
| Mean Family Income | 11,279 | $249,905 |
| Median Household Income | 18,947 | $118,203 |
| Mean Household Income | 18,947 | $190,744 |
| Income Deficit | 11,279 | $12,221 |
| Wage / Income Gap (%) | 49,696 | 40.55% |
| Wage / Income Gap ($) | 49,696 | 59.45¢ per $1 |
| Gini / Inequality Index | 49,696 | 0.55 |
Earnings by Sex in Coral Gables
Average Earnings in Coral Gables are $64,385, $80,000 for men and $47,563 for women, a difference of 40.6%.
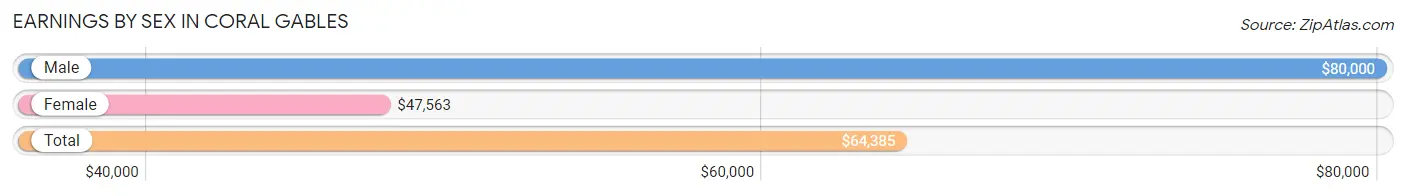
| Sex | Number | Average Earnings |
| Male | 13,618 (52.8%) | $80,000 |
| Female | 12,190 (47.2%) | $47,563 |
| Total | 25,808 (100.0%) | $64,385 |
Earnings by Sex by Income Bracket in Coral Gables
The most common earnings brackets in Coral Gables are $100,000+ for men (5,882 | 43.2%) and $100,000+ for women (3,072 | 25.2%).
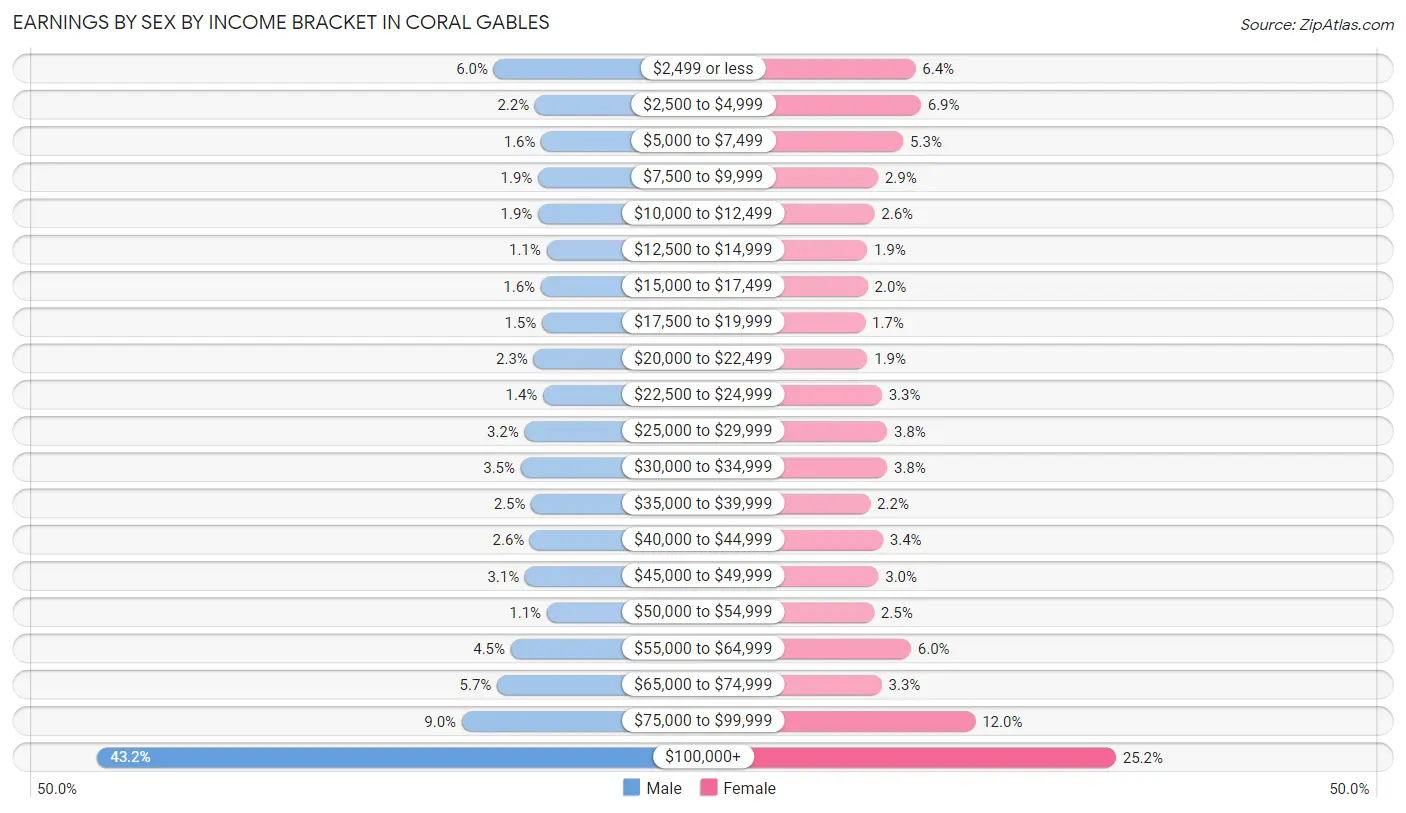
| Income | Male | Female |
| $2,499 or less | 822 (6.0%) | 782 (6.4%) |
| $2,500 to $4,999 | 297 (2.2%) | 845 (6.9%) |
| $5,000 to $7,499 | 217 (1.6%) | 644 (5.3%) |
| $7,500 to $9,999 | 257 (1.9%) | 356 (2.9%) |
| $10,000 to $12,499 | 258 (1.9%) | 315 (2.6%) |
| $12,500 to $14,999 | 150 (1.1%) | 230 (1.9%) |
| $15,000 to $17,499 | 222 (1.6%) | 238 (1.9%) |
| $17,500 to $19,999 | 207 (1.5%) | 209 (1.7%) |
| $20,000 to $22,499 | 314 (2.3%) | 234 (1.9%) |
| $22,500 to $24,999 | 193 (1.4%) | 399 (3.3%) |
| $25,000 to $29,999 | 431 (3.2%) | 460 (3.8%) |
| $30,000 to $34,999 | 478 (3.5%) | 460 (3.8%) |
| $35,000 to $39,999 | 344 (2.5%) | 267 (2.2%) |
| $40,000 to $44,999 | 359 (2.6%) | 412 (3.4%) |
| $45,000 to $49,999 | 425 (3.1%) | 360 (2.9%) |
| $50,000 to $54,999 | 146 (1.1%) | 310 (2.5%) |
| $55,000 to $64,999 | 606 (4.4%) | 732 (6.0%) |
| $65,000 to $74,999 | 780 (5.7%) | 398 (3.3%) |
| $75,000 to $99,999 | 1,230 (9.0%) | 1,467 (12.0%) |
| $100,000+ | 5,882 (43.2%) | 3,072 (25.2%) |
| Total | 13,618 (100.0%) | 12,190 (100.0%) |
Earnings by Sex by Educational Attainment in Coral Gables
Average earnings in Coral Gables are $98,250 for men and $65,636 for women, a difference of 33.2%. Men with an educational attainment of graduate degree enjoy the highest average annual earnings of $150,160, while those with less than high school education earn the least with $28,000. Women with an educational attainment of graduate degree earn the most with the average annual earnings of $86,250, while those with high school diploma education have the smallest earnings of $30,421.
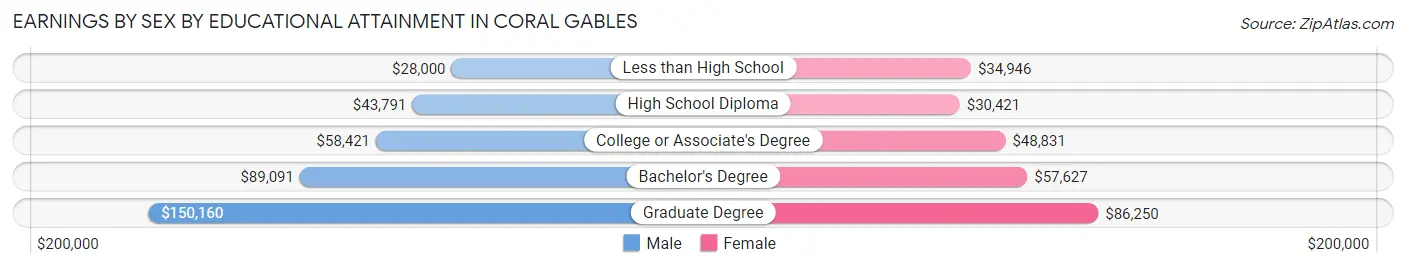
| Educational Attainment | Male Income | Female Income |
| Less than High School | $28,000 | $34,946 |
| High School Diploma | $43,791 | $30,421 |
| College or Associate's Degree | $58,421 | $48,831 |
| Bachelor's Degree | $89,091 | $57,627 |
| Graduate Degree | $150,160 | $86,250 |
| Total | $98,250 | $65,636 |
Family Income in Coral Gables
Family Income Brackets in Coral Gables
According to the Coral Gables family income data, there are 4,929 families falling into the $200,000+ income range, which is the most common income bracket and makes up 43.7% of all families. Conversely, the $10,000 to $14,999 income bracket is the least frequent group with only 68 families (0.6%) belonging to this category.
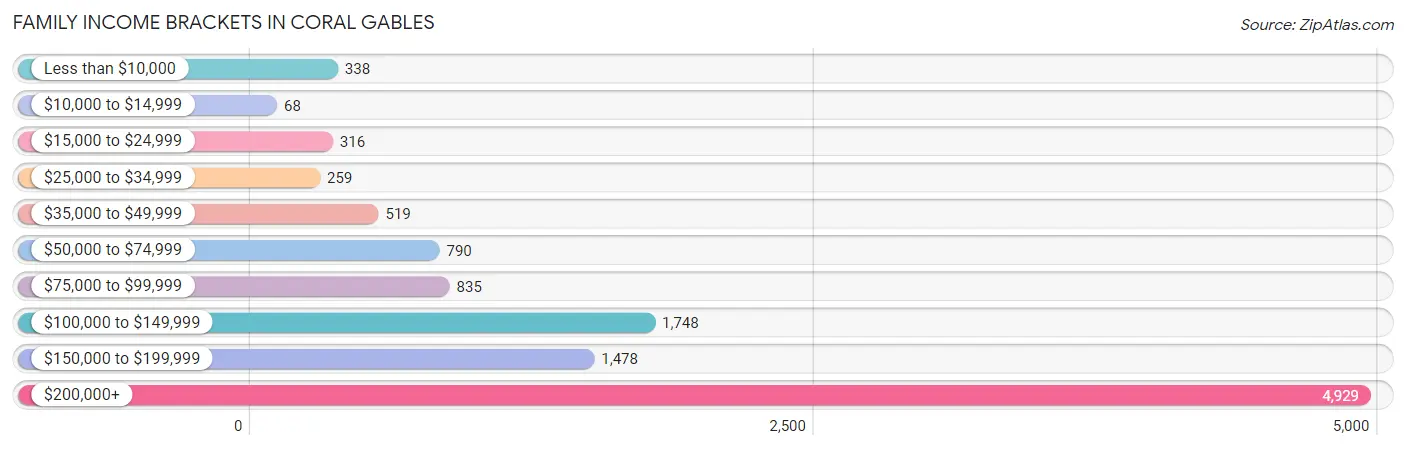
| Income Bracket | # Families | % Families |
| Less than $10,000 | 338 | 3.0% |
| $10,000 to $14,999 | 68 | 0.6% |
| $15,000 to $24,999 | 316 | 2.8% |
| $25,000 to $34,999 | 259 | 2.3% |
| $35,000 to $49,999 | 519 | 4.6% |
| $50,000 to $74,999 | 790 | 7.0% |
| $75,000 to $99,999 | 835 | 7.4% |
| $100,000 to $149,999 | 1,748 | 15.5% |
| $150,000 to $199,999 | 1,478 | 13.1% |
| $200,000+ | 4,929 | 43.7% |
Family Income by Famaliy Size in Coral Gables
6-person families (174 | 1.5%) account for the highest median family income in Coral Gables with $250,001 per family, while 2-person families (5,947 | 52.7%) have the highest median income of $70,625 per family member.
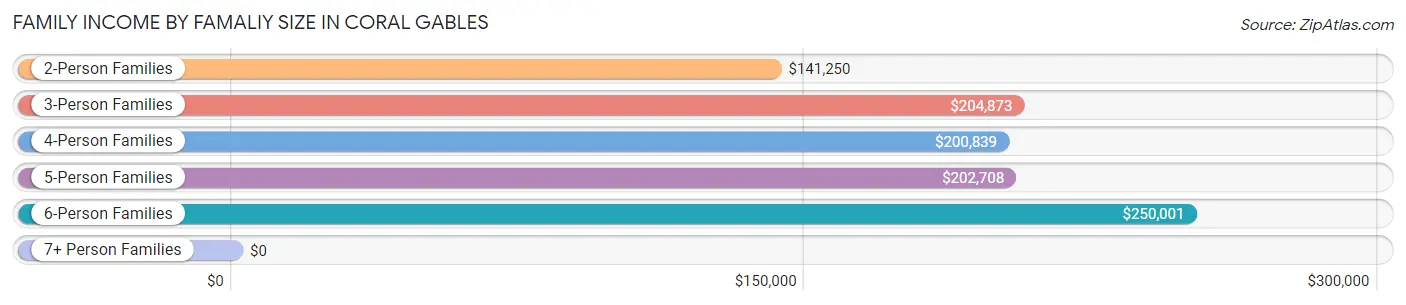
| Income Bracket | # Families | Median Income |
| 2-Person Families | 5,947 (52.7%) | $141,250 |
| 3-Person Families | 2,410 (21.4%) | $204,873 |
| 4-Person Families | 2,107 (18.7%) | $200,839 |
| 5-Person Families | 641 (5.7%) | $202,708 |
| 6-Person Families | 174 (1.5%) | $250,001 |
| 7+ Person Families | 0 (0.0%) | $0 |
| Total | 11,279 (100.0%) | $175,295 |
Family Income by Number of Earners in Coral Gables
The median family income in Coral Gables is $175,295, with families comprising 3+ earners (846) having the highest median family income of $211,667, while families with no earners (1,710) have the lowest median family income of $71,994, accounting for 7.5% and 15.2% of families, respectively.
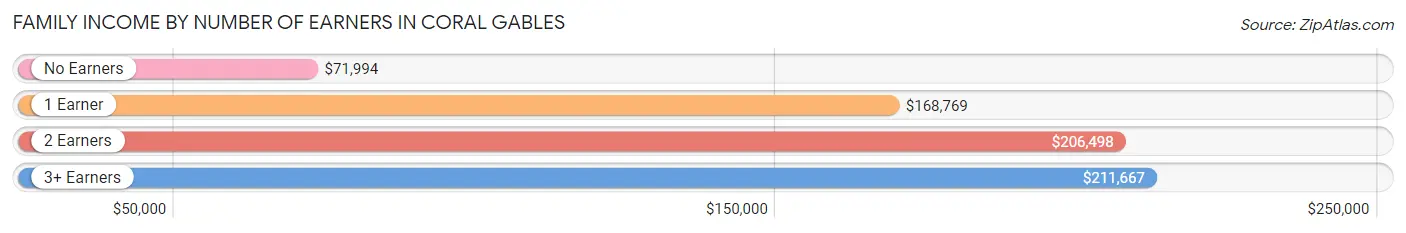
| Number of Earners | # Families | Median Income |
| No Earners | 1,710 (15.2%) | $71,994 |
| 1 Earner | 3,681 (32.6%) | $168,769 |
| 2 Earners | 5,042 (44.7%) | $206,498 |
| 3+ Earners | 846 (7.5%) | $211,667 |
| Total | 11,279 (100.0%) | $175,295 |
Household Income in Coral Gables
Household Income Brackets in Coral Gables
With 5,798 households falling in the category, the $200,000+ income range is the most frequent in Coral Gables, accounting for 30.6% of all households. In contrast, only 398 households (2.1%) fall into the $10,000 to $14,999 income bracket, making it the least populous group.
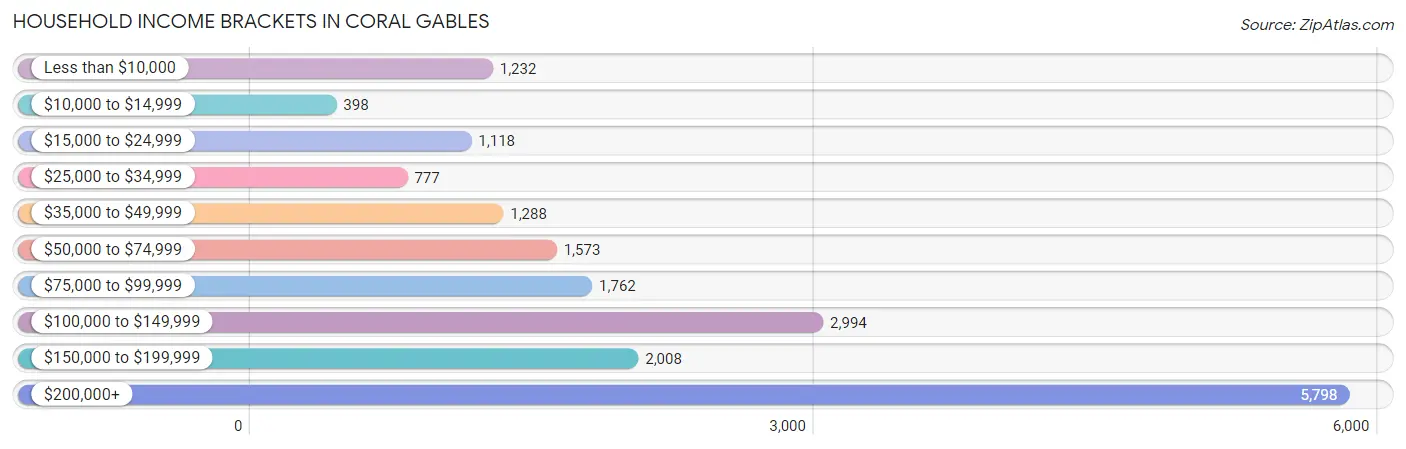
| Income Bracket | # Households | % Households |
| Less than $10,000 | 1,232 | 6.5% |
| $10,000 to $14,999 | 398 | 2.1% |
| $15,000 to $24,999 | 1,118 | 5.9% |
| $25,000 to $34,999 | 777 | 4.1% |
| $35,000 to $49,999 | 1,288 | 6.8% |
| $50,000 to $74,999 | 1,573 | 8.3% |
| $75,000 to $99,999 | 1,762 | 9.3% |
| $100,000 to $149,999 | 2,994 | 15.8% |
| $150,000 to $199,999 | 2,008 | 10.6% |
| $200,000+ | 5,798 | 30.6% |
Household Income by Householder Age in Coral Gables
The median household income in Coral Gables is $118,203, with the highest median household income of $167,175 found in the 45 to 64 years age bracket for the primary householder. A total of 7,094 households (37.4%) fall into this category. Meanwhile, the 15 to 24 years age bracket for the primary householder has the lowest median household income of $0, with 615 households (3.3%) in this group.
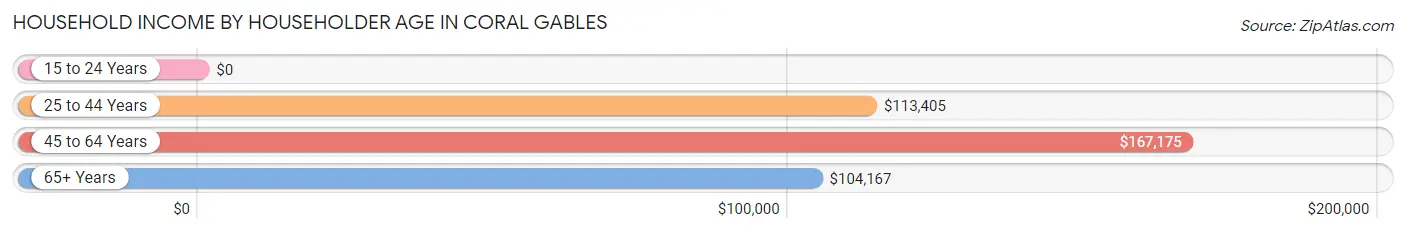
| Income Bracket | # Households | Median Income |
| 15 to 24 Years | 615 (3.3%) | $0 |
| 25 to 44 Years | 5,184 (27.4%) | $113,405 |
| 45 to 64 Years | 7,094 (37.4%) | $167,175 |
| 65+ Years | 6,054 (32.0%) | $104,167 |
| Total | 18,947 (100.0%) | $118,203 |
Poverty in Coral Gables
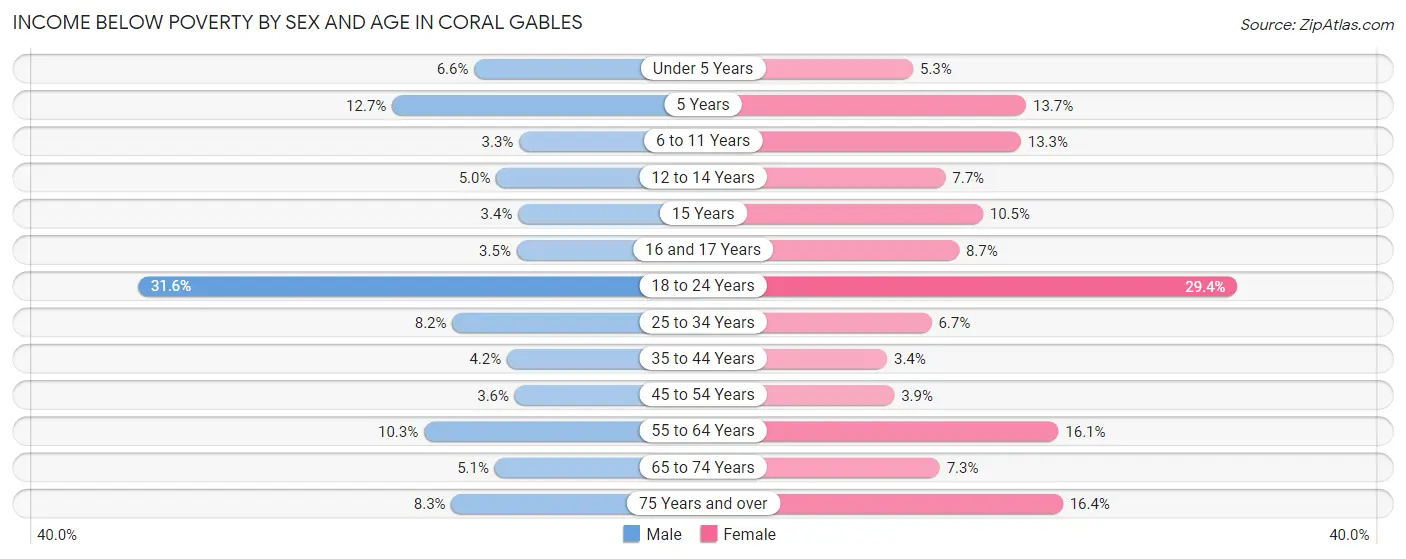
Income Below Poverty by Sex and Age in Coral Gables
With 8.2% poverty level for males and 10.7% for females among the residents of Coral Gables, 18 to 24 year old males and 18 to 24 year old females are the most vulnerable to poverty, with 490 males (31.6%) and 553 females (29.4%) in their respective age groups living below the poverty level.
| Age Bracket | Male | Female |
| Under 5 Years | 79 (6.6%) | 75 (5.3%) |
| 5 Years | 15 (12.7%) | 39 (13.7%) |
| 6 to 11 Years | 48 (3.3%) | 186 (13.3%) |
| 12 to 14 Years | 25 (5.0%) | 45 (7.7%) |
| 15 Years | 8 (3.4%) | 20 (10.5%) |
| 16 and 17 Years | 12 (3.5%) | 51 (8.7%) |
| 18 to 24 Years | 490 (31.6%) | 553 (29.4%) |
| 25 to 34 Years | 210 (8.2%) | 162 (6.7%) |
| 35 to 44 Years | 95 (4.2%) | 92 (3.4%) |
| 45 to 54 Years | 117 (3.6%) | 116 (3.9%) |
| 55 to 64 Years | 307 (10.3%) | 492 (16.1%) |
| 65 to 74 Years | 108 (5.1%) | 203 (7.3%) |
| 75 Years and over | 161 (8.3%) | 451 (16.4%) |
| Total | 1,675 (8.2%) | 2,485 (10.7%) |
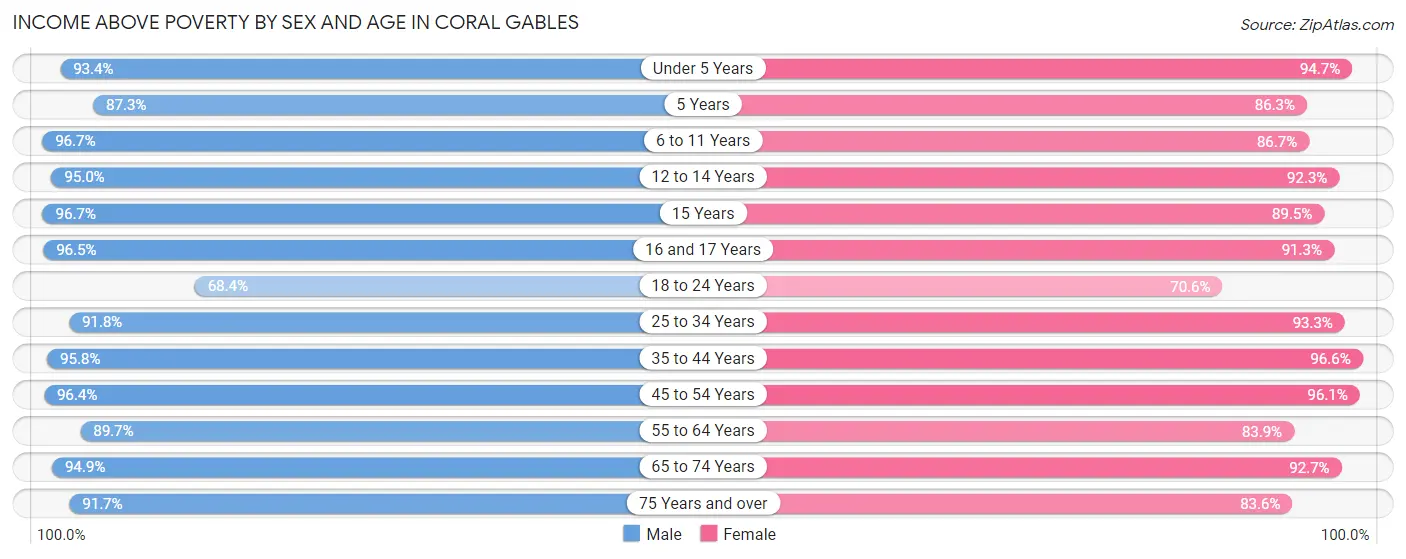
Income Above Poverty by Sex and Age in Coral Gables
According to the poverty statistics in Coral Gables, males aged 6 to 11 years and females aged 35 to 44 years are the age groups that are most secure financially, with 96.7% of males and 96.6% of females in these age groups living above the poverty line.
| Age Bracket | Male | Female |
| Under 5 Years | 1,117 (93.4%) | 1,344 (94.7%) |
| 5 Years | 103 (87.3%) | 246 (86.3%) |
| 6 to 11 Years | 1,416 (96.7%) | 1,214 (86.7%) |
| 12 to 14 Years | 477 (95.0%) | 540 (92.3%) |
| 15 Years | 231 (96.7%) | 171 (89.5%) |
| 16 and 17 Years | 335 (96.5%) | 535 (91.3%) |
| 18 to 24 Years | 1,061 (68.4%) | 1,330 (70.6%) |
| 25 to 34 Years | 2,339 (91.8%) | 2,272 (93.3%) |
| 35 to 44 Years | 2,179 (95.8%) | 2,647 (96.6%) |
| 45 to 54 Years | 3,133 (96.4%) | 2,869 (96.1%) |
| 55 to 64 Years | 2,661 (89.7%) | 2,567 (83.9%) |
| 65 to 74 Years | 2,015 (94.9%) | 2,589 (92.7%) |
| 75 Years and over | 1,776 (91.7%) | 2,299 (83.6%) |
| Total | 18,843 (91.8%) | 20,623 (89.2%) |
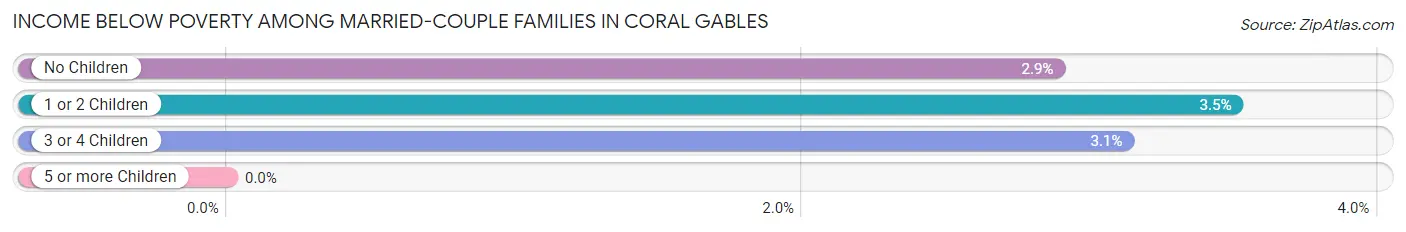
Income Below Poverty Among Married-Couple Families in Coral Gables
The poverty statistics for married-couple families in Coral Gables show that 3.1% or 284 of the total 9,180 families live below the poverty line. Families with 1 or 2 children have the highest poverty rate of 3.5%, comprising of 106 families. On the other hand, families with no children have the lowest poverty rate of 2.9%, which includes 167 families.
| Children | Above Poverty | Below Poverty |
| No Children | 5,629 (97.1%) | 167 (2.9%) |
| 1 or 2 Children | 2,926 (96.5%) | 106 (3.5%) |
| 3 or 4 Children | 341 (96.9%) | 11 (3.1%) |
| 5 or more Children | 0 (0.0%) | 0 (0.0%) |
| Total | 8,896 (96.9%) | 284 (3.1%) |
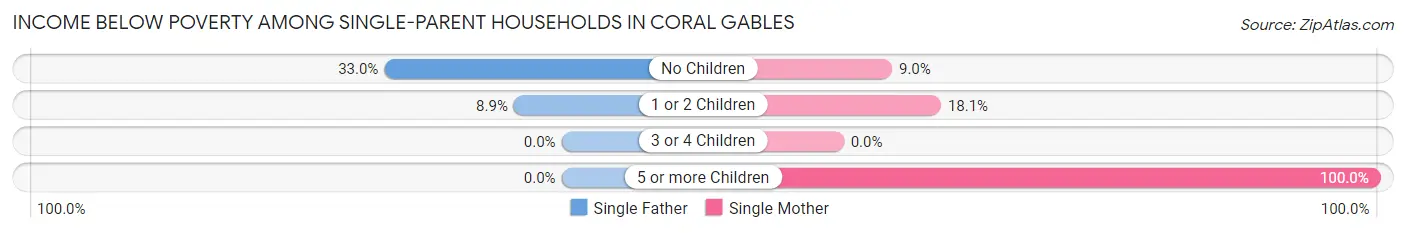
Income Below Poverty Among Single-Parent Households in Coral Gables
According to the poverty data in Coral Gables, 22.7% or 168 single-father households and 15.1% or 206 single-mother households are living below the poverty line. Among single-father households, those with no children have the highest poverty rate, with 140 households (33.0%) experiencing poverty. Likewise, among single-mother households, those with 5 or more children have the highest poverty rate, with 34 households (100.0%) falling below the poverty line.
| Children | Single Father | Single Mother |
| No Children | 140 (33.0%) | 64 (9.0%) |
| 1 or 2 Children | 28 (8.9%) | 108 (18.1%) |
| 3 or 4 Children | 0 (0.0%) | 0 (0.0%) |
| 5 or more Children | 0 (0.0%) | 34 (100.0%) |
| Total | 168 (22.7%) | 206 (15.1%) |
Income Below Poverty Among Married-Couple vs Single-Parent Households in Coral Gables
The poverty data for Coral Gables shows that 284 of the married-couple family households (3.1%) and 374 of the single-parent households (17.8%) are living below the poverty level. Within the married-couple family households, those with 1 or 2 children have the highest poverty rate, with 106 households (3.5%) falling below the poverty line. Among the single-parent households, those with 5 or more children have the highest poverty rate, with 34 household (100.0%) living below poverty.
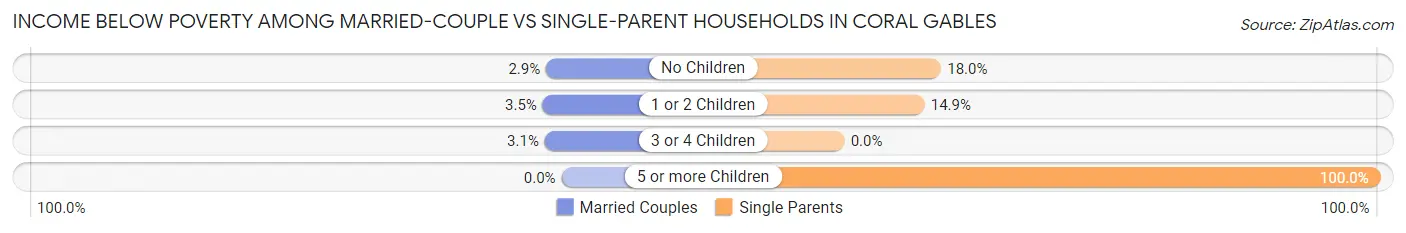
| Children | Married-Couple Families | Single-Parent Households |
| No Children | 167 (2.9%) | 204 (18.0%) |
| 1 or 2 Children | 106 (3.5%) | 136 (14.9%) |
| 3 or 4 Children | 11 (3.1%) | 0 (0.0%) |
| 5 or more Children | 0 (0.0%) | 34 (100.0%) |
| Total | 284 (3.1%) | 374 (17.8%) |
Employment Characteristics in Coral Gables
Employment by Class of Employer in Coral Gables
Among the 22,610 employed individuals in Coral Gables, private company employees (14,177 | 62.7%), self-employed (incorporated) (2,792 | 12.3%), and not-for-profit organizations (2,354 | 10.4%) make up the most common classes of employment.
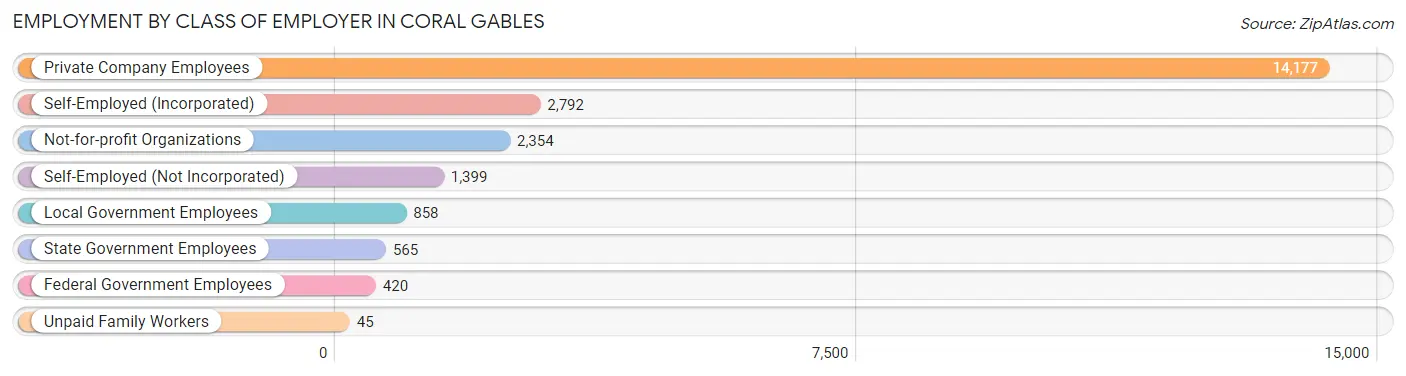
| Employer Class | # Employees | % Employees |
| Private Company Employees | 14,177 | 62.7% |
| Self-Employed (Incorporated) | 2,792 | 12.3% |
| Self-Employed (Not Incorporated) | 1,399 | 6.2% |
| Not-for-profit Organizations | 2,354 | 10.4% |
| Local Government Employees | 858 | 3.8% |
| State Government Employees | 565 | 2.5% |
| Federal Government Employees | 420 | 1.9% |
| Unpaid Family Workers | 45 | 0.2% |
| Total | 22,610 | 100.0% |
Employment Status by Age in Coral Gables
According to the labor force statistics for Coral Gables, out of the total population over 16 years of age (42,265), 57.7% or 24,387 individuals are in the labor force, with 4.8% or 1,171 of them unemployed. The age group with the highest labor force participation rate is 30 to 34 years, with 87.5% or 2,286 individuals in the labor force. Within the labor force, the 16 to 19 years age range has the highest percentage of unemployed individuals, with 36.5% or 499 of them being unemployed.
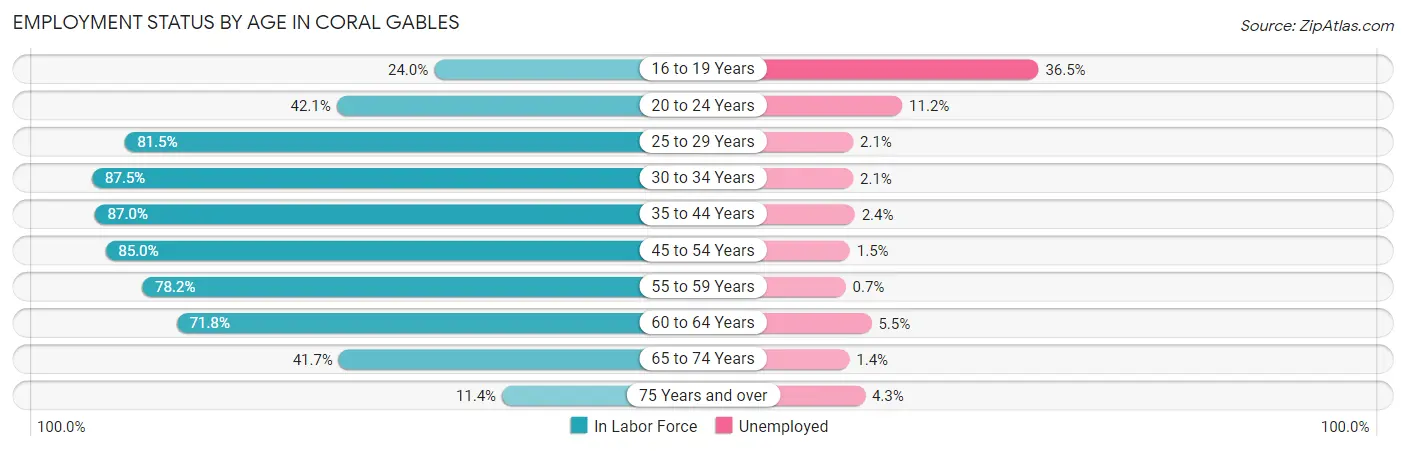
| Age Bracket | In Labor Force | Unemployed |
| 16 to 19 Years | 1,366 (24.0%) | 499 (36.5%) |
| 20 to 24 Years | 1,922 (42.1%) | 215 (11.2%) |
| 25 to 29 Years | 2,002 (81.5%) | 42 (2.1%) |
| 30 to 34 Years | 2,286 (87.5%) | 48 (2.1%) |
| 35 to 44 Years | 4,361 (87.0%) | 105 (2.4%) |
| 45 to 54 Years | 5,301 (85.0%) | 80 (1.5%) |
| 55 to 59 Years | 2,700 (78.2%) | 19 (0.7%) |
| 60 to 64 Years | 1,849 (71.8%) | 102 (5.5%) |
| 65 to 74 Years | 2,055 (41.7%) | 29 (1.4%) |
| 75 Years and over | 540 (11.4%) | 23 (4.3%) |
| Total | 24,387 (57.7%) | 1,171 (4.8%) |
Employment Status by Educational Attainment in Coral Gables
According to labor force statistics for Coral Gables, 82.8% of individuals (18,502) out of the total population between 25 and 64 years of age (22,345) are in the labor force, with 2.1% or 389 of them being unemployed. The group with the highest labor force participation rate are those with the educational attainment of bachelor's degree or higher, with 85.3% or 14,414 individuals in the labor force. Within the labor force, individuals with less than high school education have the highest percentage of unemployment, with 13.2% or 22 of them being unemployed.
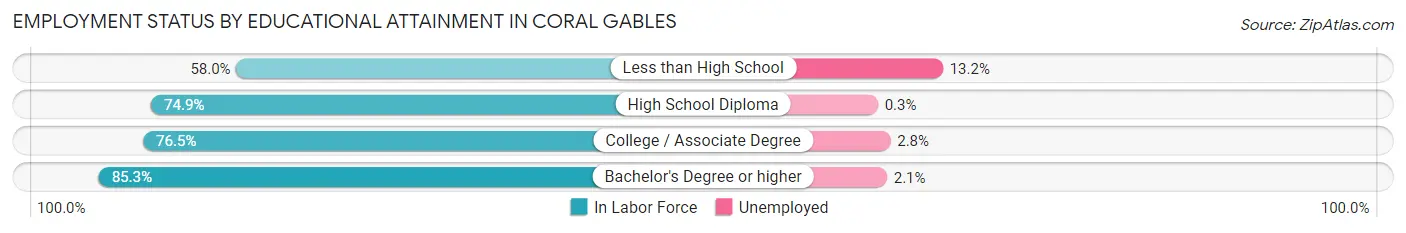
| Educational Attainment | In Labor Force | Unemployed |
| Less than High School | 167 (58.0%) | 38 (13.2%) |
| High School Diploma | 1,578 (74.9%) | 6 (0.3%) |
| College / Associate Degree | 2,335 (76.5%) | 85 (2.8%) |
| Bachelor's Degree or higher | 14,414 (85.3%) | 355 (2.1%) |
| Total | 18,502 (82.8%) | 469 (2.1%) |
Employment Occupations by Sex in Coral Gables
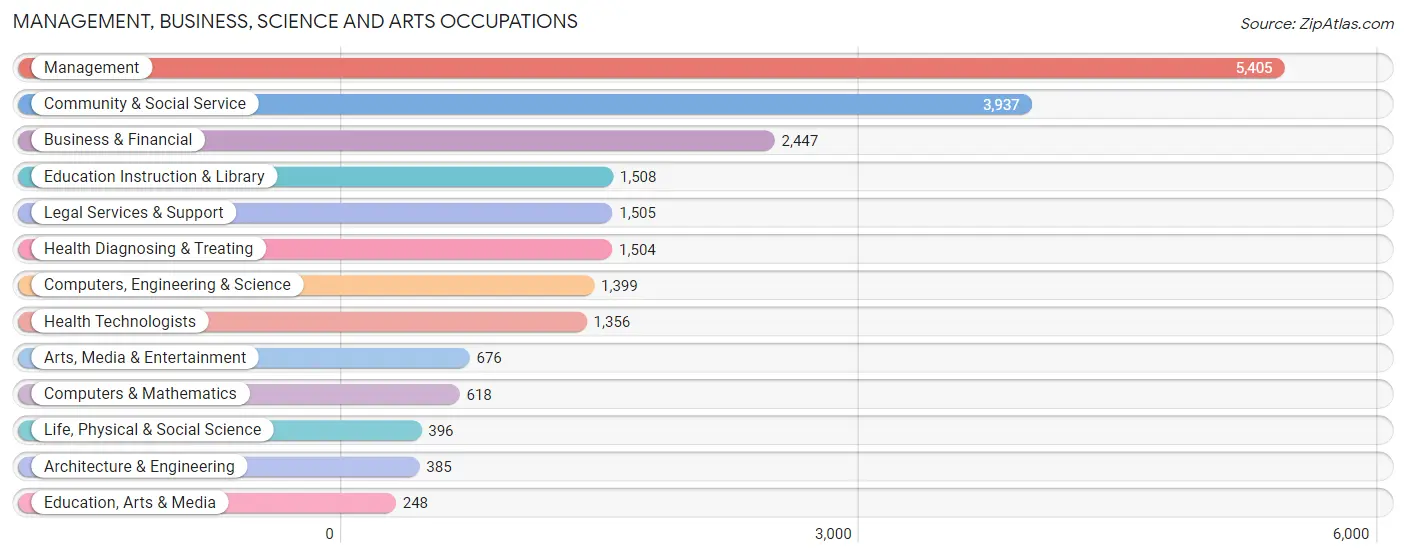
Management, Business, Science and Arts Occupations
The most common Management, Business, Science and Arts occupations in Coral Gables are Management (5,405 | 23.3%), Community & Social Service (3,937 | 17.0%), Business & Financial (2,447 | 10.6%), Education Instruction & Library (1,508 | 6.5%), and Legal Services & Support (1,505 | 6.5%).
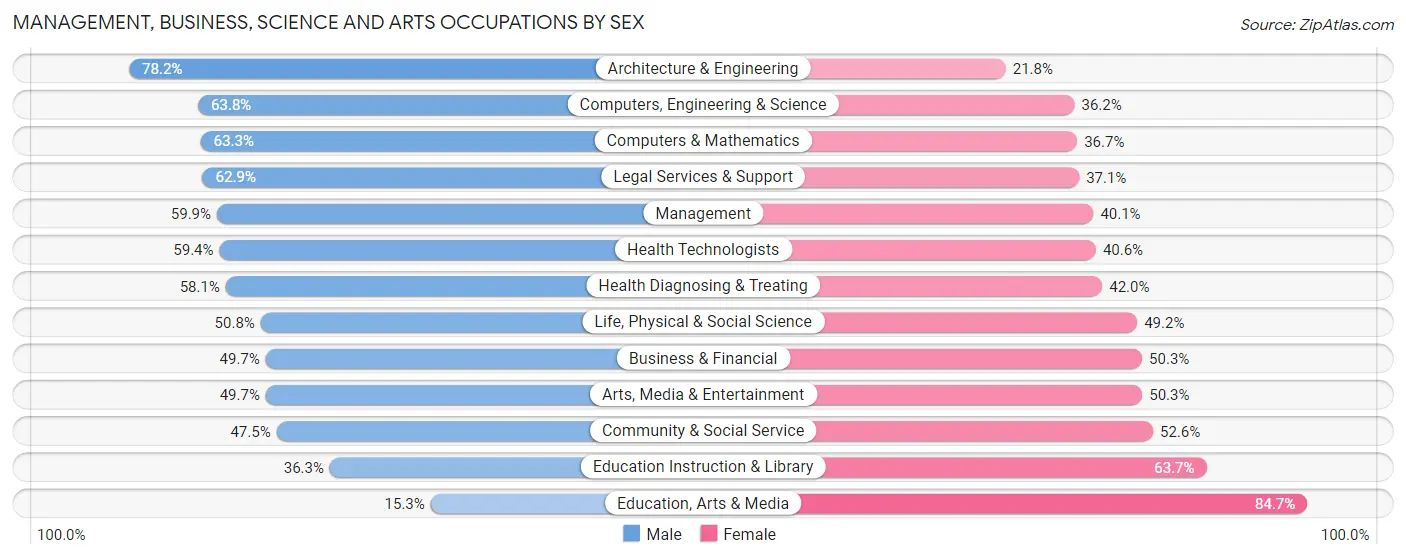
Management, Business, Science and Arts Occupations by Sex
Within the Management, Business, Science and Arts occupations in Coral Gables, the most male-oriented occupations are Architecture & Engineering (78.2%), Computers, Engineering & Science (63.8%), and Computers & Mathematics (63.3%), while the most female-oriented occupations are Education, Arts & Media (84.7%), Education Instruction & Library (63.7%), and Community & Social Service (52.5%).
| Occupation | Male | Female |
| Management | 3,237 (59.9%) | 2,168 (40.1%) |
| Business & Financial | 1,217 (49.7%) | 1,230 (50.3%) |
| Computers, Engineering & Science | 893 (63.8%) | 506 (36.2%) |
| Computers & Mathematics | 391 (63.3%) | 227 (36.7%) |
| Architecture & Engineering | 301 (78.2%) | 84 (21.8%) |
| Life, Physical & Social Science | 201 (50.8%) | 195 (49.2%) |
| Community & Social Service | 1,868 (47.4%) | 2,069 (52.5%) |
| Education, Arts & Media | 38 (15.3%) | 210 (84.7%) |
| Legal Services & Support | 946 (62.9%) | 559 (37.1%) |
| Education Instruction & Library | 548 (36.3%) | 960 (63.7%) |
| Arts, Media & Entertainment | 336 (49.7%) | 340 (50.3%) |
| Health Diagnosing & Treating | 873 (58.1%) | 631 (41.9%) |
| Health Technologists | 805 (59.4%) | 551 (40.6%) |
| Total (Category) | 8,088 (55.0%) | 6,604 (45.0%) |
| Total (Overall) | 12,179 (52.6%) | 10,989 (47.4%) |
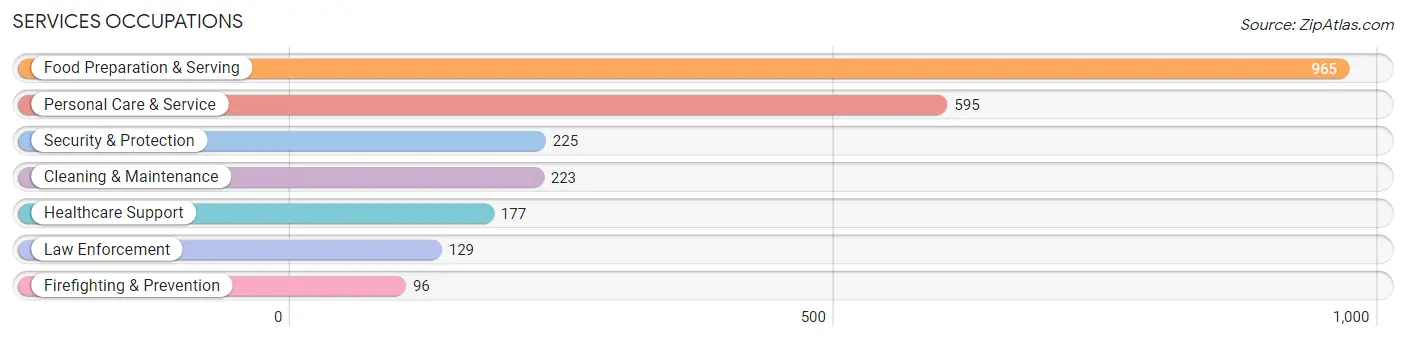
Services Occupations
The most common Services occupations in Coral Gables are Food Preparation & Serving (965 | 4.2%), Personal Care & Service (595 | 2.6%), Security & Protection (225 | 1.0%), Cleaning & Maintenance (223 | 1.0%), and Healthcare Support (177 | 0.8%).
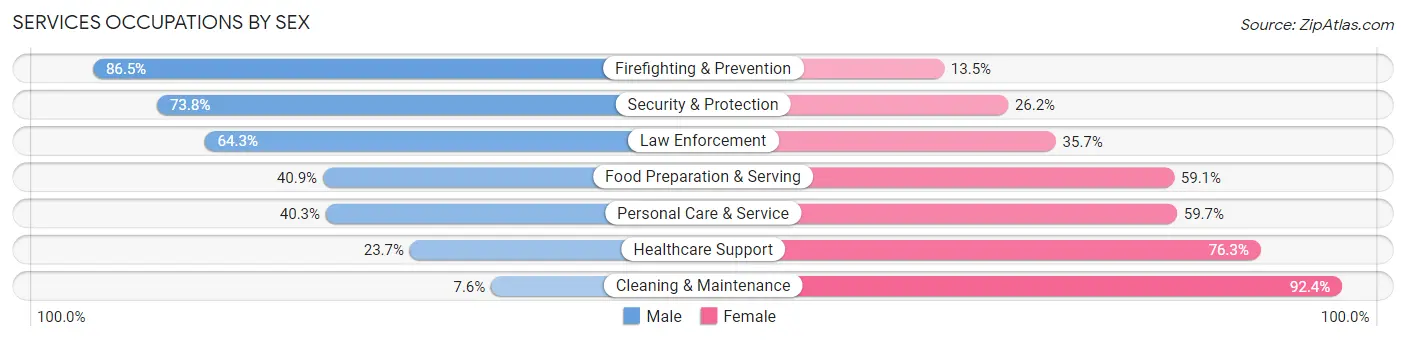
Services Occupations by Sex
Within the Services occupations in Coral Gables, the most male-oriented occupations are Firefighting & Prevention (86.5%), Security & Protection (73.8%), and Law Enforcement (64.3%), while the most female-oriented occupations are Cleaning & Maintenance (92.4%), Healthcare Support (76.3%), and Personal Care & Service (59.7%).
| Occupation | Male | Female |
| Healthcare Support | 42 (23.7%) | 135 (76.3%) |
| Security & Protection | 166 (73.8%) | 59 (26.2%) |
| Firefighting & Prevention | 83 (86.5%) | 13 (13.5%) |
| Law Enforcement | 83 (64.3%) | 46 (35.7%) |
| Food Preparation & Serving | 395 (40.9%) | 570 (59.1%) |
| Cleaning & Maintenance | 17 (7.6%) | 206 (92.4%) |
| Personal Care & Service | 240 (40.3%) | 355 (59.7%) |
| Total (Category) | 860 (39.4%) | 1,325 (60.6%) |
| Total (Overall) | 12,179 (52.6%) | 10,989 (47.4%) |
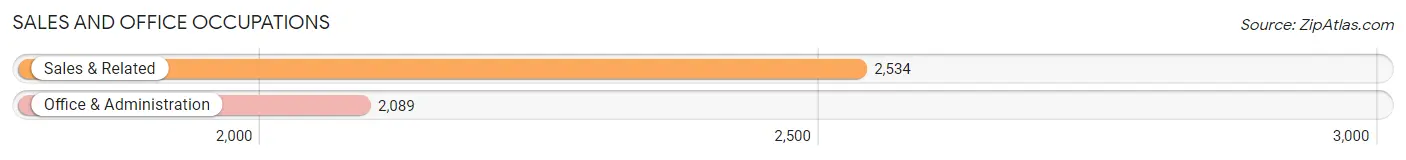
Sales and Office Occupations
The most common Sales and Office occupations in Coral Gables are Sales & Related (2,534 | 10.9%), and Office & Administration (2,089 | 9.0%).
Sales and Office Occupations by Sex
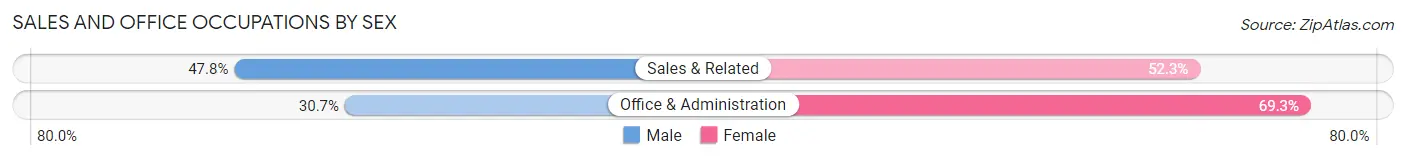
| Occupation | Male | Female |
| Sales & Related | 1,210 (47.7%) | 1,324 (52.2%) |
| Office & Administration | 642 (30.7%) | 1,447 (69.3%) |
| Total (Category) | 1,852 (40.1%) | 2,771 (59.9%) |
| Total (Overall) | 12,179 (52.6%) | 10,989 (47.4%) |
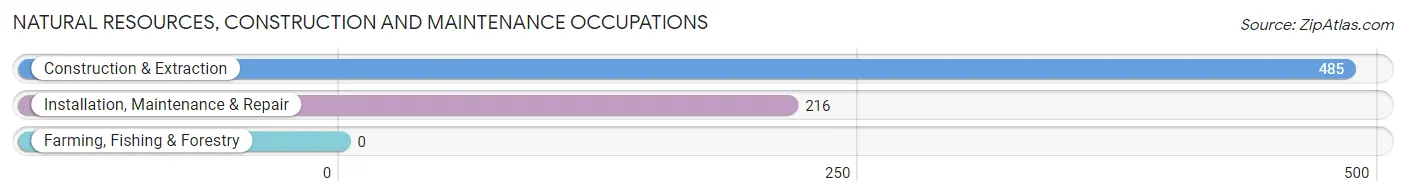
Natural Resources, Construction and Maintenance Occupations
The most common Natural Resources, Construction and Maintenance occupations in Coral Gables are Construction & Extraction (485 | 2.1%), and Installation, Maintenance & Repair (216 | 0.9%).
Natural Resources, Construction and Maintenance Occupations by Sex
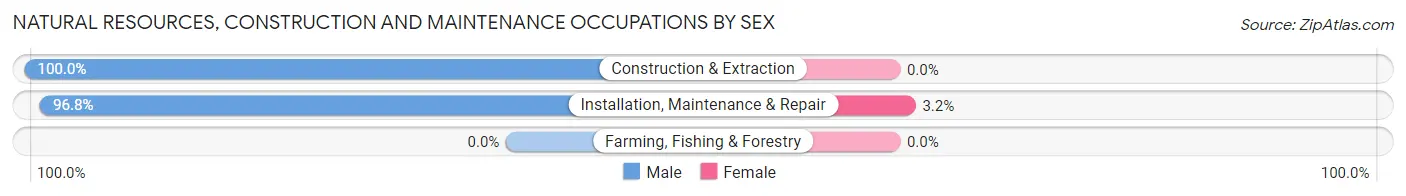
| Occupation | Male | Female |
| Farming, Fishing & Forestry | 0 (0.0%) | 0 (0.0%) |
| Construction & Extraction | 485 (100.0%) | 0 (0.0%) |
| Installation, Maintenance & Repair | 209 (96.8%) | 7 (3.2%) |
| Total (Category) | 694 (99.0%) | 7 (1.0%) |
| Total (Overall) | 12,179 (52.6%) | 10,989 (47.4%) |
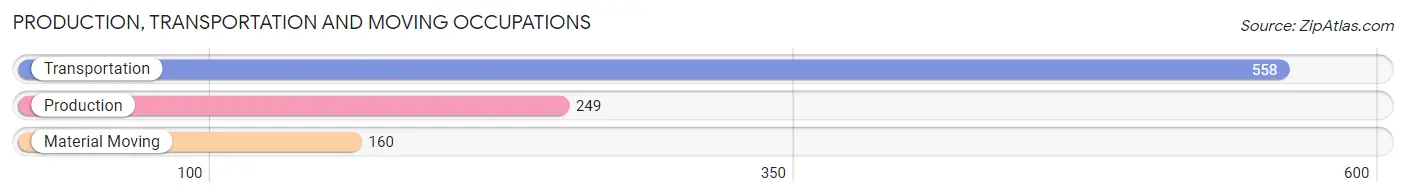
Production, Transportation and Moving Occupations
The most common Production, Transportation and Moving occupations in Coral Gables are Transportation (558 | 2.4%), Production (249 | 1.1%), and Material Moving (160 | 0.7%).
Production, Transportation and Moving Occupations by Sex
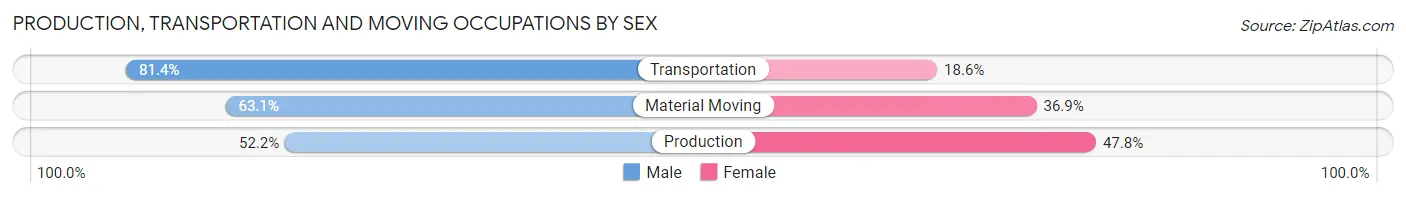
| Occupation | Male | Female |
| Production | 130 (52.2%) | 119 (47.8%) |
| Transportation | 454 (81.4%) | 104 (18.6%) |
| Material Moving | 101 (63.1%) | 59 (36.9%) |
| Total (Category) | 685 (70.8%) | 282 (29.2%) |
| Total (Overall) | 12,179 (52.6%) | 10,989 (47.4%) |
Employment Industries by Sex in Coral Gables
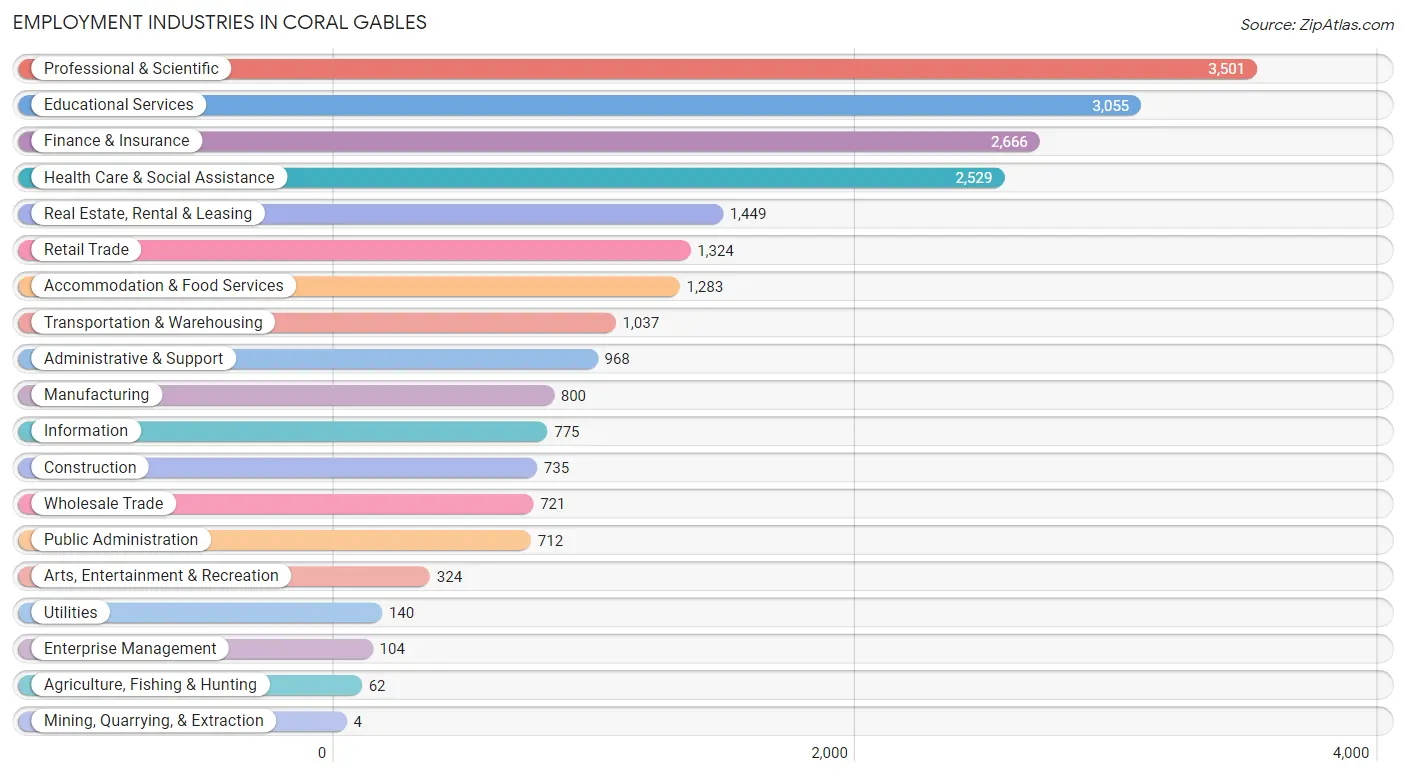
Employment Industries in Coral Gables
The major employment industries in Coral Gables include Professional & Scientific (3,501 | 15.1%), Educational Services (3,055 | 13.2%), Finance & Insurance (2,666 | 11.5%), Health Care & Social Assistance (2,529 | 10.9%), and Real Estate, Rental & Leasing (1,449 | 6.2%).
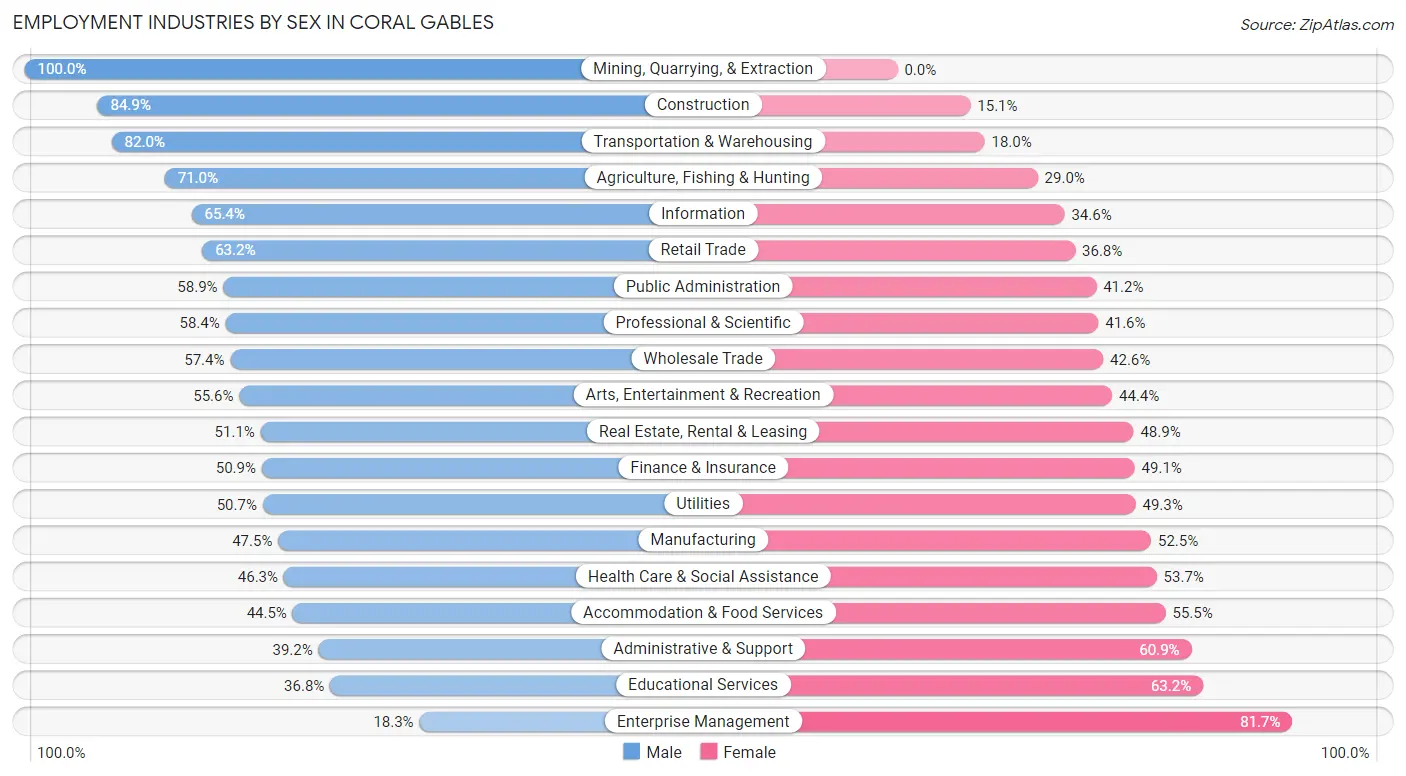
Employment Industries by Sex in Coral Gables
The Coral Gables industries that see more men than women are Mining, Quarrying, & Extraction (100.0%), Construction (84.9%), and Transportation & Warehousing (82.0%), whereas the industries that tend to have a higher number of women are Enterprise Management (81.7%), Educational Services (63.2%), and Administrative & Support (60.9%).
| Industry | Male | Female |
| Agriculture, Fishing & Hunting | 44 (71.0%) | 18 (29.0%) |
| Mining, Quarrying, & Extraction | 4 (100.0%) | 0 (0.0%) |
| Construction | 624 (84.9%) | 111 (15.1%) |
| Manufacturing | 380 (47.5%) | 420 (52.5%) |
| Wholesale Trade | 414 (57.4%) | 307 (42.6%) |
| Retail Trade | 837 (63.2%) | 487 (36.8%) |
| Transportation & Warehousing | 850 (82.0%) | 187 (18.0%) |
| Utilities | 71 (50.7%) | 69 (49.3%) |
| Information | 507 (65.4%) | 268 (34.6%) |
| Finance & Insurance | 1,357 (50.9%) | 1,309 (49.1%) |
| Real Estate, Rental & Leasing | 741 (51.1%) | 708 (48.9%) |
| Professional & Scientific | 2,045 (58.4%) | 1,456 (41.6%) |
| Enterprise Management | 19 (18.3%) | 85 (81.7%) |
| Administrative & Support | 379 (39.2%) | 589 (60.9%) |
| Educational Services | 1,123 (36.8%) | 1,932 (63.2%) |
| Health Care & Social Assistance | 1,172 (46.3%) | 1,357 (53.7%) |
| Arts, Entertainment & Recreation | 180 (55.6%) | 144 (44.4%) |
| Accommodation & Food Services | 571 (44.5%) | 712 (55.5%) |
| Public Administration | 419 (58.9%) | 293 (41.1%) |
| Total | 12,179 (52.6%) | 10,989 (47.4%) |
Education in Coral Gables
School Enrollment in Coral Gables
The most common levels of schooling among the 17,034 students in Coral Gables are college / undergraduate (8,461 | 49.7%), elementary school (2,229 | 13.1%), and high school (1,649 | 9.7%).
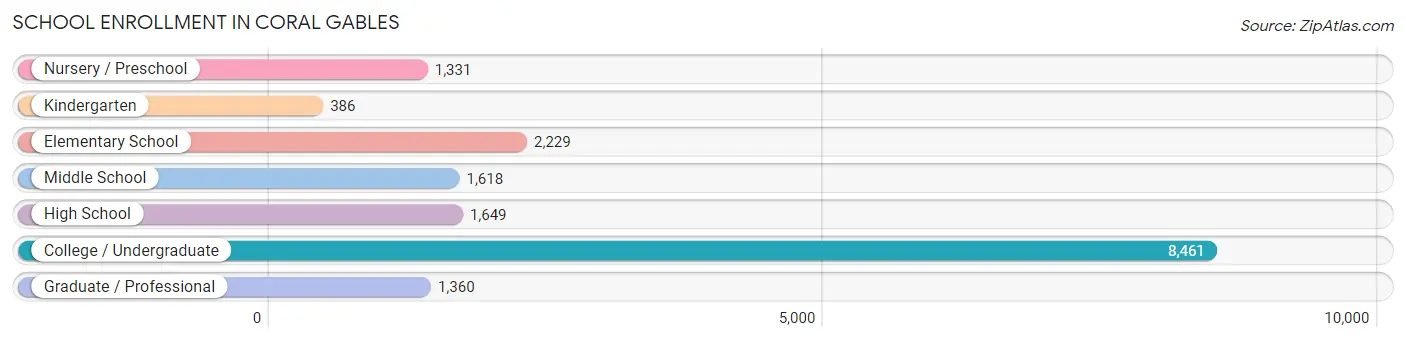
| School Level | # Students | % Students |
| Nursery / Preschool | 1,331 | 7.8% |
| Kindergarten | 386 | 2.3% |
| Elementary School | 2,229 | 13.1% |
| Middle School | 1,618 | 9.5% |
| High School | 1,649 | 9.7% |
| College / Undergraduate | 8,461 | 49.7% |
| Graduate / Professional | 1,360 | 8.0% |
| Total | 17,034 | 100.0% |
School Enrollment by Age by Funding Source in Coral Gables
Out of a total of 17,034 students who are enrolled in schools in Coral Gables, 10,834 (63.6%) attend a private institution, while the remaining 6,200 (36.4%) are enrolled in public schools. The age group of 3 to 4 year olds has the highest likelihood of being enrolled in private schools, with 1,088 (92.1% in the age bracket) enrolled. Conversely, the age group of 10 to 14 year olds has the lowest likelihood of being enrolled in a private school, with 1,092 (59.5% in the age bracket) attending a public institution.
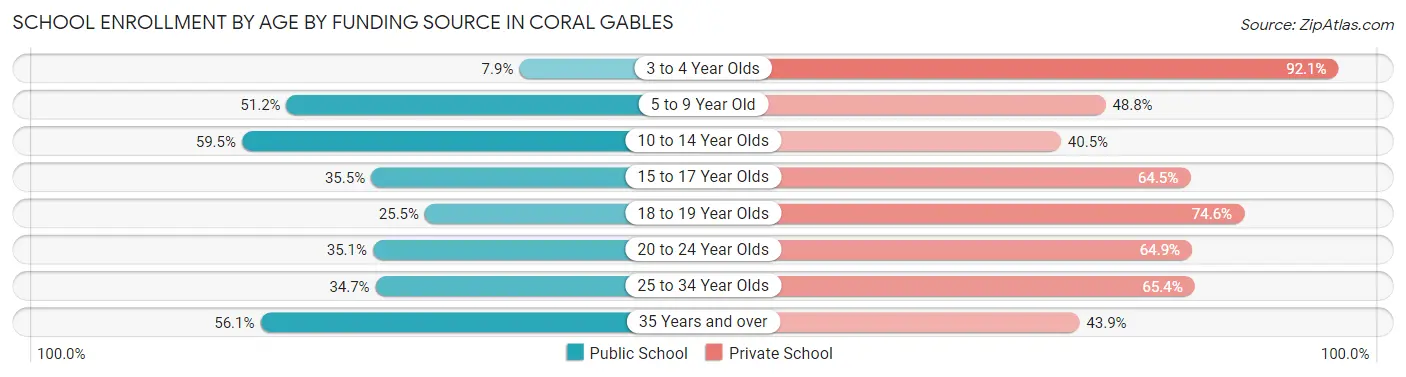
| Age Bracket | Public School | Private School |
| 3 to 4 Year Olds | 93 (7.9%) | 1,088 (92.1%) |
| 5 to 9 Year Old | 1,279 (51.2%) | 1,217 (48.8%) |
| 10 to 14 Year Olds | 1,092 (59.5%) | 742 (40.5%) |
| 15 to 17 Year Olds | 507 (35.5%) | 922 (64.5%) |
| 18 to 19 Year Olds | 1,182 (25.5%) | 3,463 (74.6%) |
| 20 to 24 Year Olds | 1,325 (35.1%) | 2,446 (64.9%) |
| 25 to 34 Year Olds | 351 (34.6%) | 662 (65.3%) |
| 35 Years and over | 373 (56.1%) | 292 (43.9%) |
| Total | 6,200 (36.4%) | 10,834 (63.6%) |
Educational Attainment by Field of Study in Coral Gables
Business (7,284 | 30.2%), social sciences (2,743 | 11.4%), engineering (1,983 | 8.2%), education (1,927 | 8.0%), and communications (1,664 | 6.9%) are the most common fields of study among 24,076 individuals in Coral Gables who have obtained a bachelor's degree or higher.
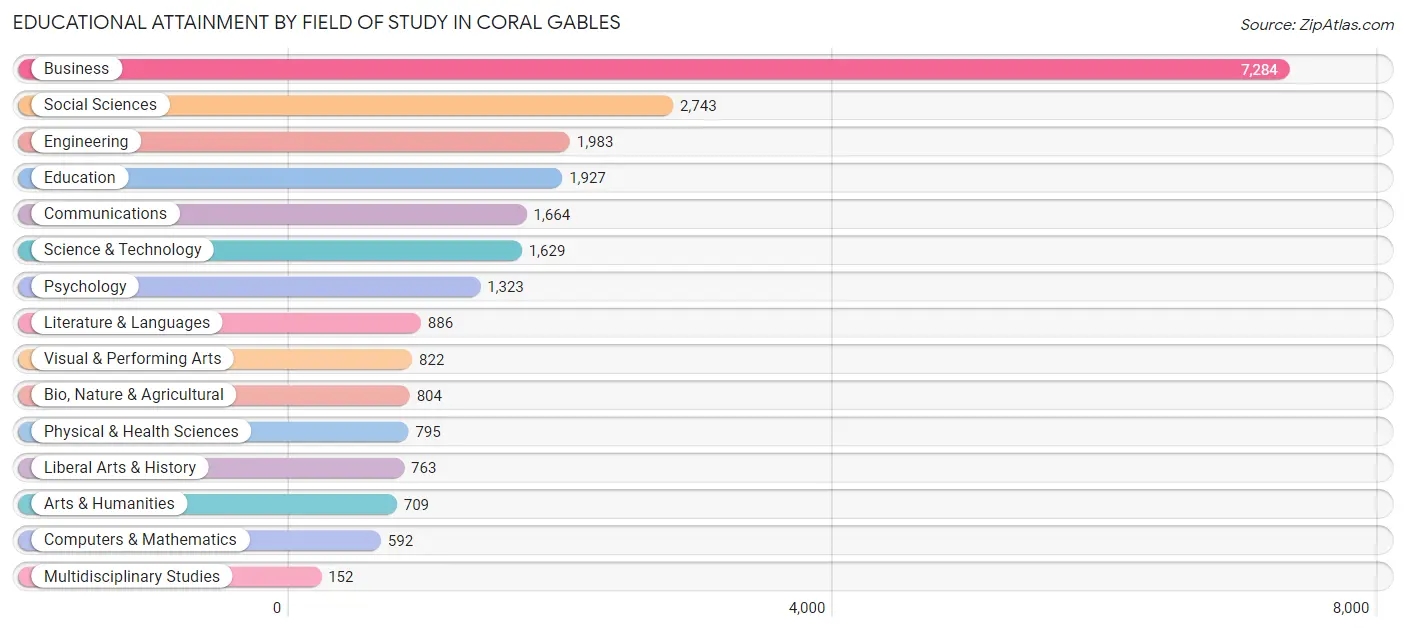
| Field of Study | # Graduates | % Graduates |
| Computers & Mathematics | 592 | 2.5% |
| Bio, Nature & Agricultural | 804 | 3.3% |
| Physical & Health Sciences | 795 | 3.3% |
| Psychology | 1,323 | 5.5% |
| Social Sciences | 2,743 | 11.4% |
| Engineering | 1,983 | 8.2% |
| Multidisciplinary Studies | 152 | 0.6% |
| Science & Technology | 1,629 | 6.8% |
| Business | 7,284 | 30.2% |
| Education | 1,927 | 8.0% |
| Literature & Languages | 886 | 3.7% |
| Liberal Arts & History | 763 | 3.2% |
| Visual & Performing Arts | 822 | 3.4% |
| Communications | 1,664 | 6.9% |
| Arts & Humanities | 709 | 2.9% |
| Total | 24,076 | 100.0% |
Transportation & Commute in Coral Gables
Vehicle Availability by Sex in Coral Gables
The most prevalent vehicle ownership categories in Coral Gables are males with 2 vehicles (5,357, accounting for 46.7%) and females with 2 vehicles (4,323, making up 55.0%).
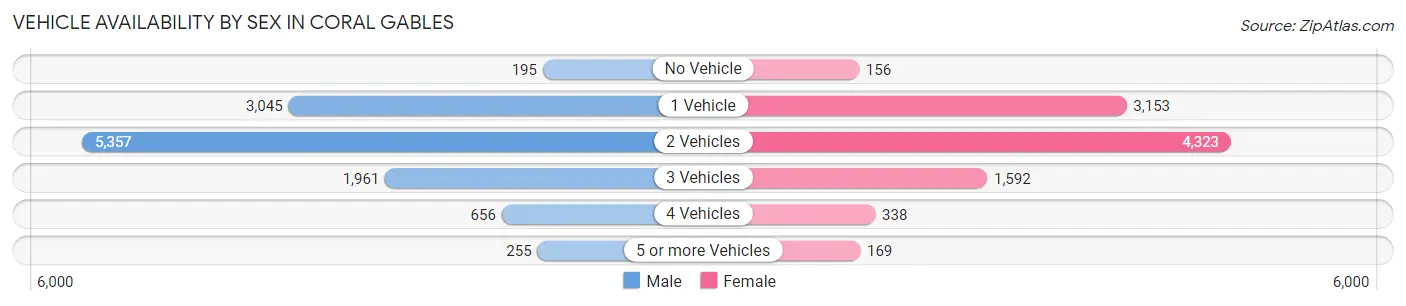
| Vehicles Available | Male | Female |
| No Vehicle | 195 (1.7%) | 156 (1.6%) |
| 1 Vehicle | 3,045 (26.6%) | 3,153 (32.4%) |
| 2 Vehicles | 5,357 (46.7%) | 4,323 (44.4%) |
| 3 Vehicles | 1,961 (17.1%) | 1,592 (16.4%) |
| 4 Vehicles | 656 (5.7%) | 338 (3.5%) |
| 5 or more Vehicles | 255 (2.2%) | 169 (1.7%) |
| Total | 11,469 (100.0%) | 9,731 (100.0%) |
Commute Time in Coral Gables
The most frequently occuring commute durations in Coral Gables are 20 to 24 minutes (3,216 commuters, 17.4%), 30 to 34 minutes (3,140 commuters, 17.0%), and 10 to 14 minutes (2,412 commuters, 13.0%).
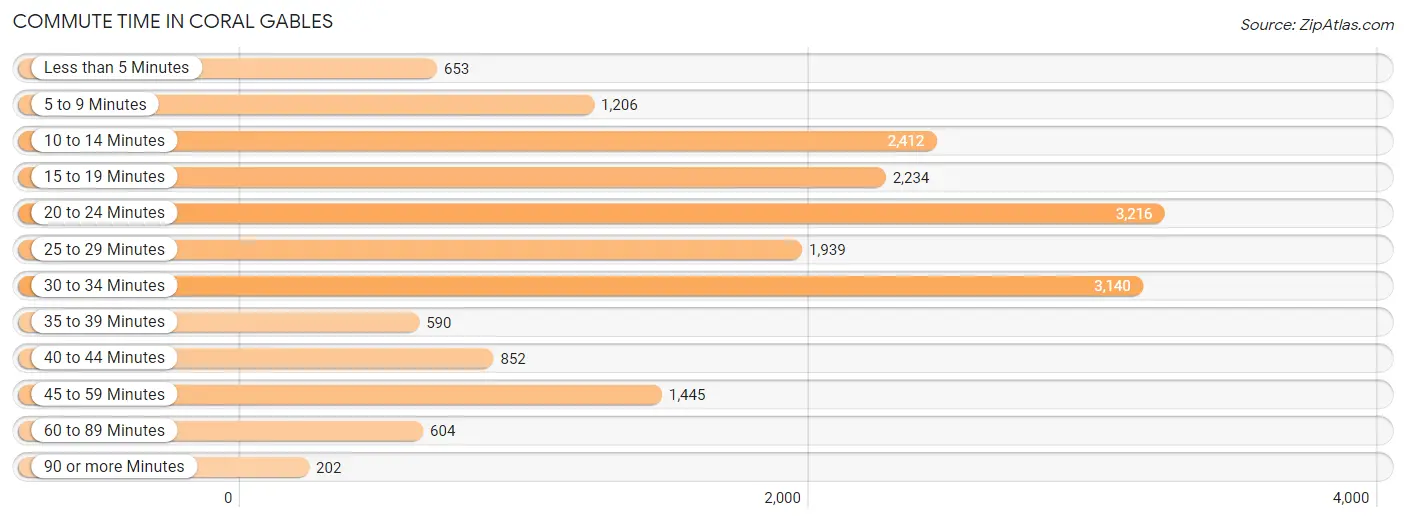
| Commute Time | # Commuters | % Commuters |
| Less than 5 Minutes | 653 | 3.5% |
| 5 to 9 Minutes | 1,206 | 6.5% |
| 10 to 14 Minutes | 2,412 | 13.0% |
| 15 to 19 Minutes | 2,234 | 12.1% |
| 20 to 24 Minutes | 3,216 | 17.4% |
| 25 to 29 Minutes | 1,939 | 10.5% |
| 30 to 34 Minutes | 3,140 | 17.0% |
| 35 to 39 Minutes | 590 | 3.2% |
| 40 to 44 Minutes | 852 | 4.6% |
| 45 to 59 Minutes | 1,445 | 7.8% |
| 60 to 89 Minutes | 604 | 3.3% |
| 90 or more Minutes | 202 | 1.1% |
Commute Time by Sex in Coral Gables
The most common commute times in Coral Gables are 20 to 24 minutes (1,821 commuters, 17.9%) for males and 10 to 14 minutes (1,442 commuters, 17.3%) for females.
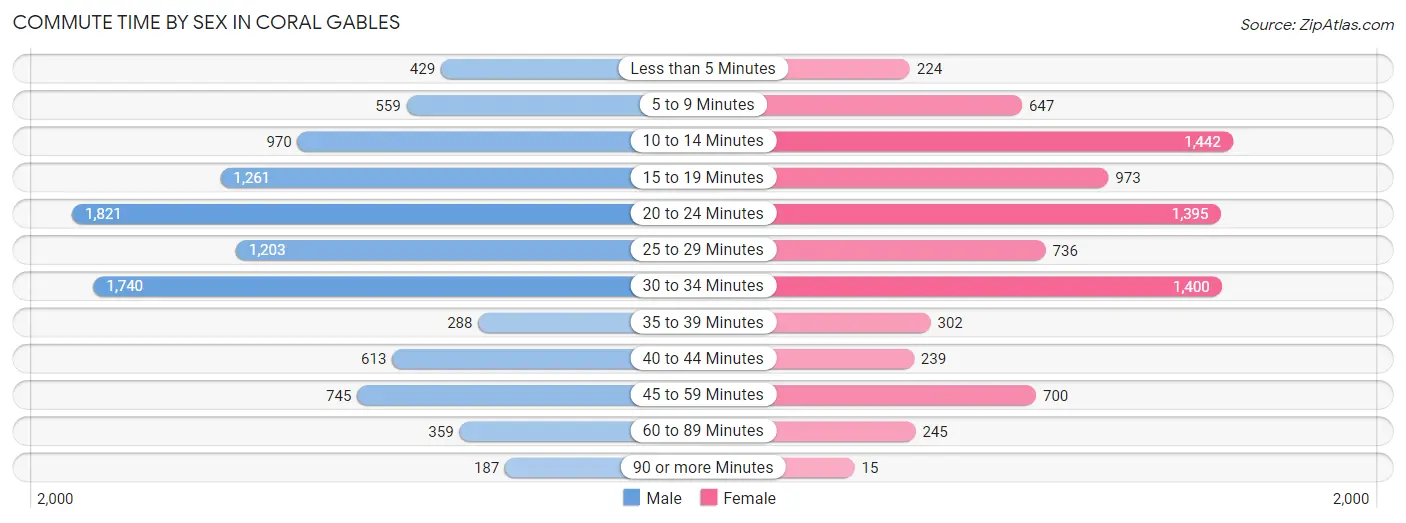
| Commute Time | Male | Female |
| Less than 5 Minutes | 429 (4.2%) | 224 (2.7%) |
| 5 to 9 Minutes | 559 (5.5%) | 647 (7.8%) |
| 10 to 14 Minutes | 970 (9.5%) | 1,442 (17.3%) |
| 15 to 19 Minutes | 1,261 (12.4%) | 973 (11.7%) |
| 20 to 24 Minutes | 1,821 (17.9%) | 1,395 (16.8%) |
| 25 to 29 Minutes | 1,203 (11.8%) | 736 (8.8%) |
| 30 to 34 Minutes | 1,740 (17.1%) | 1,400 (16.8%) |
| 35 to 39 Minutes | 288 (2.8%) | 302 (3.6%) |
| 40 to 44 Minutes | 613 (6.0%) | 239 (2.9%) |
| 45 to 59 Minutes | 745 (7.3%) | 700 (8.4%) |
| 60 to 89 Minutes | 359 (3.5%) | 245 (2.9%) |
| 90 or more Minutes | 187 (1.8%) | 15 (0.2%) |
Time of Departure to Work by Sex in Coral Gables
The most frequent times of departure to work in Coral Gables are 8:00 AM to 8:29 AM (2,155, 21.2%) for males and 8:00 AM to 8:29 AM (1,744, 21.0%) for females.
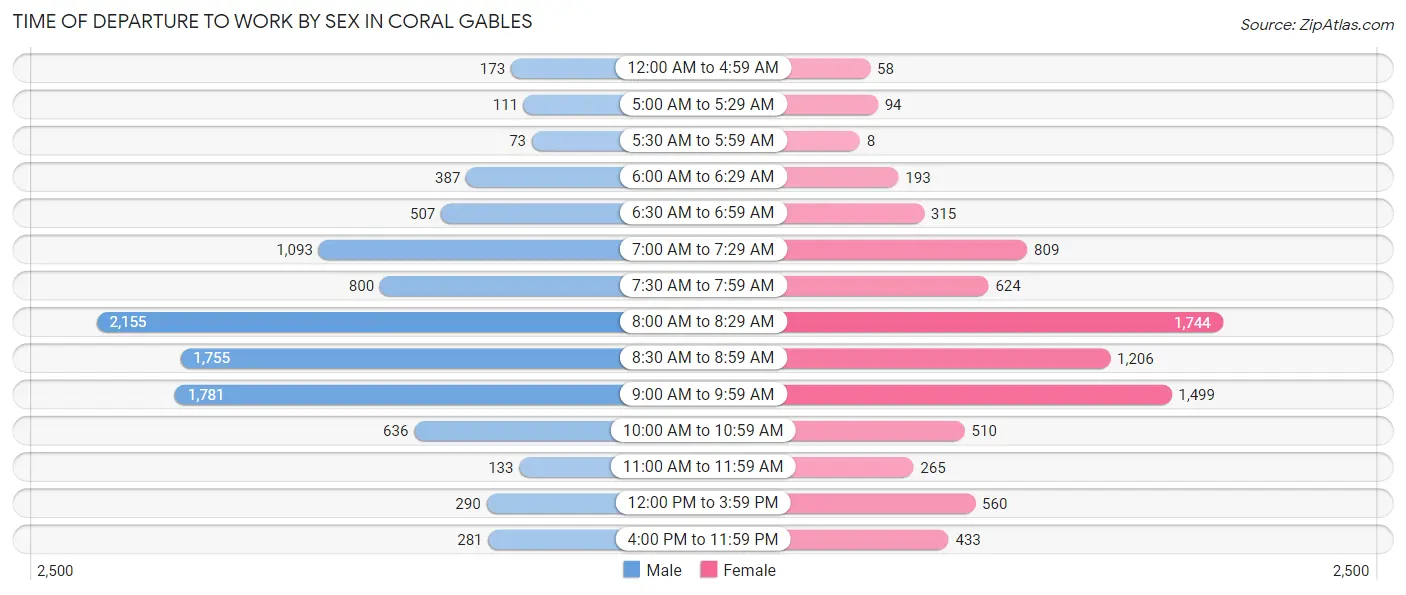
| Time of Departure | Male | Female |
| 12:00 AM to 4:59 AM | 173 (1.7%) | 58 (0.7%) |
| 5:00 AM to 5:29 AM | 111 (1.1%) | 94 (1.1%) |
| 5:30 AM to 5:59 AM | 73 (0.7%) | 8 (0.1%) |
| 6:00 AM to 6:29 AM | 387 (3.8%) | 193 (2.3%) |
| 6:30 AM to 6:59 AM | 507 (5.0%) | 315 (3.8%) |
| 7:00 AM to 7:29 AM | 1,093 (10.7%) | 809 (9.7%) |
| 7:30 AM to 7:59 AM | 800 (7.9%) | 624 (7.5%) |
| 8:00 AM to 8:29 AM | 2,155 (21.2%) | 1,744 (21.0%) |
| 8:30 AM to 8:59 AM | 1,755 (17.2%) | 1,206 (14.5%) |
| 9:00 AM to 9:59 AM | 1,781 (17.5%) | 1,499 (18.0%) |
| 10:00 AM to 10:59 AM | 636 (6.2%) | 510 (6.1%) |
| 11:00 AM to 11:59 AM | 133 (1.3%) | 265 (3.2%) |
| 12:00 PM to 3:59 PM | 290 (2.9%) | 560 (6.7%) |
| 4:00 PM to 11:59 PM | 281 (2.8%) | 433 (5.2%) |
| Total | 10,175 (100.0%) | 8,318 (100.0%) |
Housing Occupancy in Coral Gables
Occupancy by Ownership in Coral Gables
Of the total 18,947 dwellings in Coral Gables, owner-occupied units account for 12,176 (64.3%), while renter-occupied units make up 6,771 (35.7%).
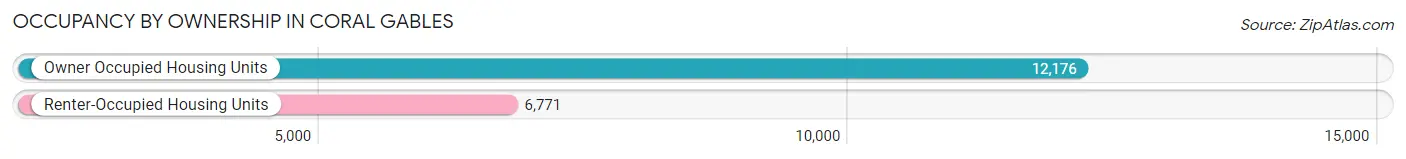
| Occupancy | # Housing Units | % Housing Units |
| Owner Occupied Housing Units | 12,176 | 64.3% |
| Renter-Occupied Housing Units | 6,771 | 35.7% |
| Total Occupied Housing Units | 18,947 | 100.0% |
Occupancy by Household Size in Coral Gables
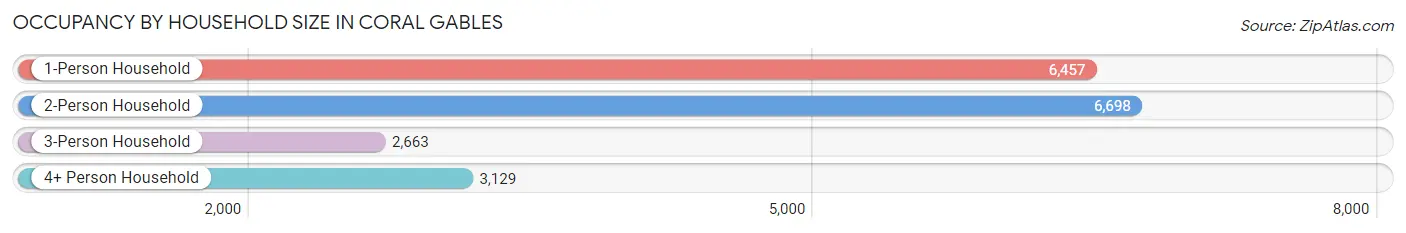
| Household Size | # Housing Units | % Housing Units |
| 1-Person Household | 6,457 | 34.1% |
| 2-Person Household | 6,698 | 35.3% |
| 3-Person Household | 2,663 | 14.1% |
| 4+ Person Household | 3,129 | 16.5% |
| Total Housing Units | 18,947 | 100.0% |
Occupancy by Ownership by Household Size in Coral Gables
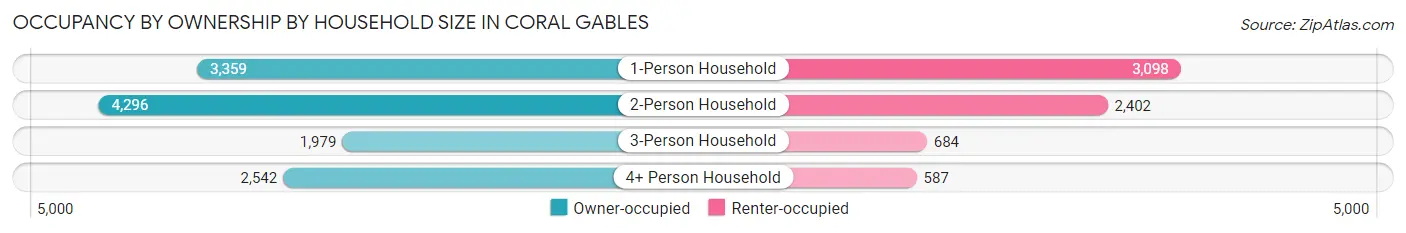
| Household Size | Owner-occupied | Renter-occupied |
| 1-Person Household | 3,359 (52.0%) | 3,098 (48.0%) |
| 2-Person Household | 4,296 (64.1%) | 2,402 (35.9%) |
| 3-Person Household | 1,979 (74.3%) | 684 (25.7%) |
| 4+ Person Household | 2,542 (81.2%) | 587 (18.8%) |
| Total Housing Units | 12,176 (64.3%) | 6,771 (35.7%) |
Occupancy by Educational Attainment in Coral Gables
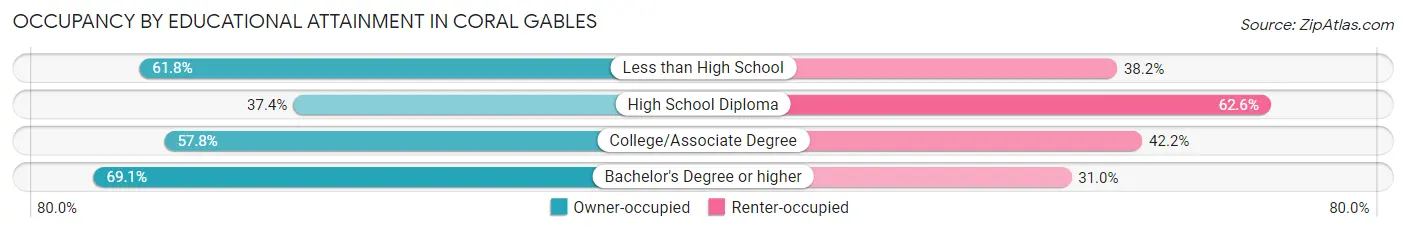
| Household Size | Owner-occupied | Renter-occupied |
| Less than High School | 296 (61.8%) | 183 (38.2%) |
| High School Diploma | 560 (37.4%) | 937 (62.6%) |
| College/Associate Degree | 2,047 (57.8%) | 1,494 (42.2%) |
| Bachelor's Degree or higher | 9,273 (69.1%) | 4,157 (30.9%) |
Occupancy by Age of Householder in Coral Gables
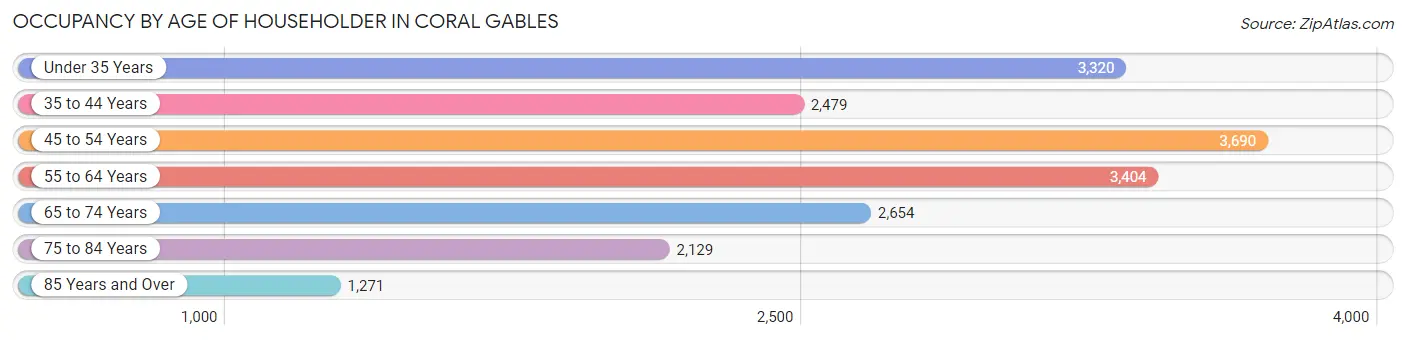
| Age Bracket | # Households | % Households |
| Under 35 Years | 3,320 | 17.5% |
| 35 to 44 Years | 2,479 | 13.1% |
| 45 to 54 Years | 3,690 | 19.5% |
| 55 to 64 Years | 3,404 | 18.0% |
| 65 to 74 Years | 2,654 | 14.0% |
| 75 to 84 Years | 2,129 | 11.2% |
| 85 Years and Over | 1,271 | 6.7% |
| Total | 18,947 | 100.0% |
Housing Finances in Coral Gables
Median Income by Occupancy in Coral Gables
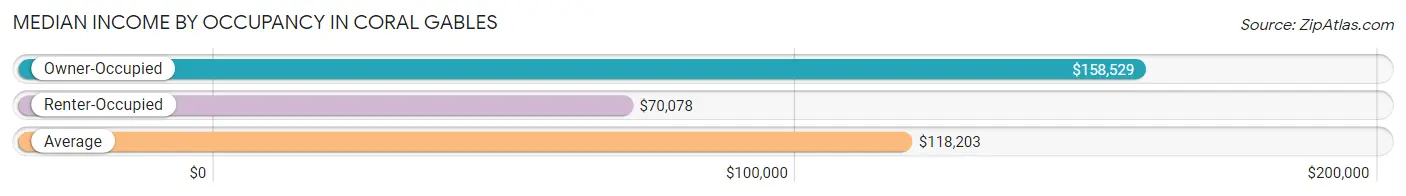
| Occupancy Type | # Households | Median Income |
| Owner-Occupied | 12,176 (64.3%) | $158,529 |
| Renter-Occupied | 6,771 (35.7%) | $70,078 |
| Average | 18,947 (100.0%) | $118,203 |
Occupancy by Householder Income Bracket in Coral Gables
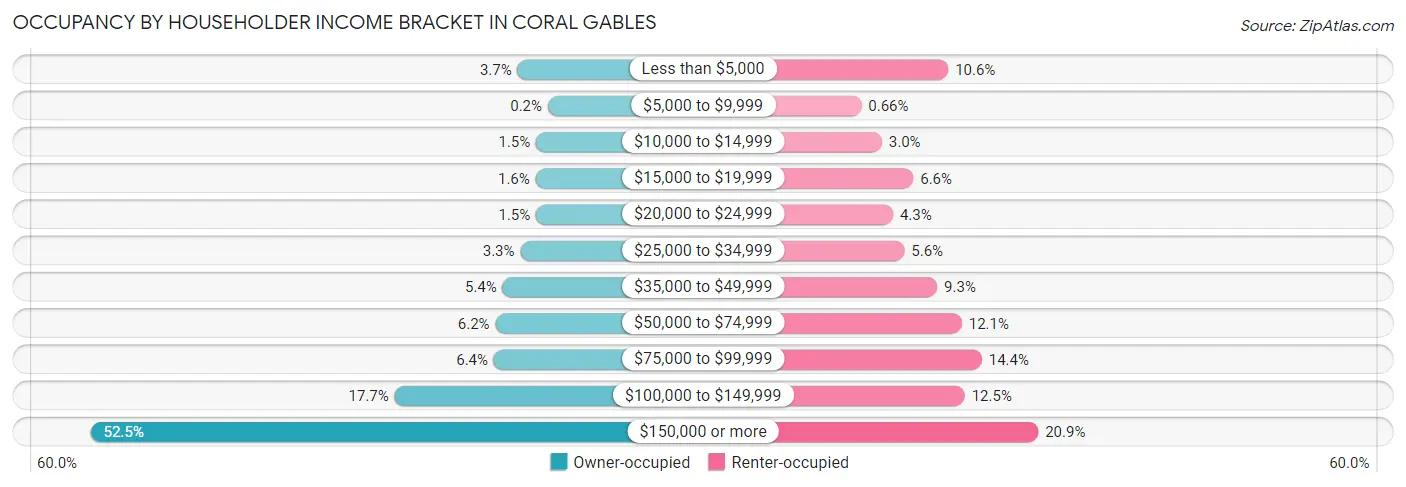
| Income Bracket | Owner-occupied | Renter-occupied |
| Less than $5,000 | 446 (3.7%) | 717 (10.6%) |
| $5,000 to $9,999 | 24 (0.2%) | 45 (0.7%) |
| $10,000 to $14,999 | 187 (1.5%) | 204 (3.0%) |
| $15,000 to $19,999 | 195 (1.6%) | 447 (6.6%) |
| $20,000 to $24,999 | 188 (1.5%) | 290 (4.3%) |
| $25,000 to $34,999 | 407 (3.3%) | 378 (5.6%) |
| $35,000 to $49,999 | 654 (5.4%) | 632 (9.3%) |
| $50,000 to $74,999 | 754 (6.2%) | 822 (12.1%) |
| $75,000 to $99,999 | 776 (6.4%) | 977 (14.4%) |
| $100,000 to $149,999 | 2,158 (17.7%) | 845 (12.5%) |
| $150,000 or more | 6,387 (52.5%) | 1,414 (20.9%) |
| Total | 12,176 (100.0%) | 6,771 (100.0%) |
Monthly Housing Cost Tiers in Coral Gables
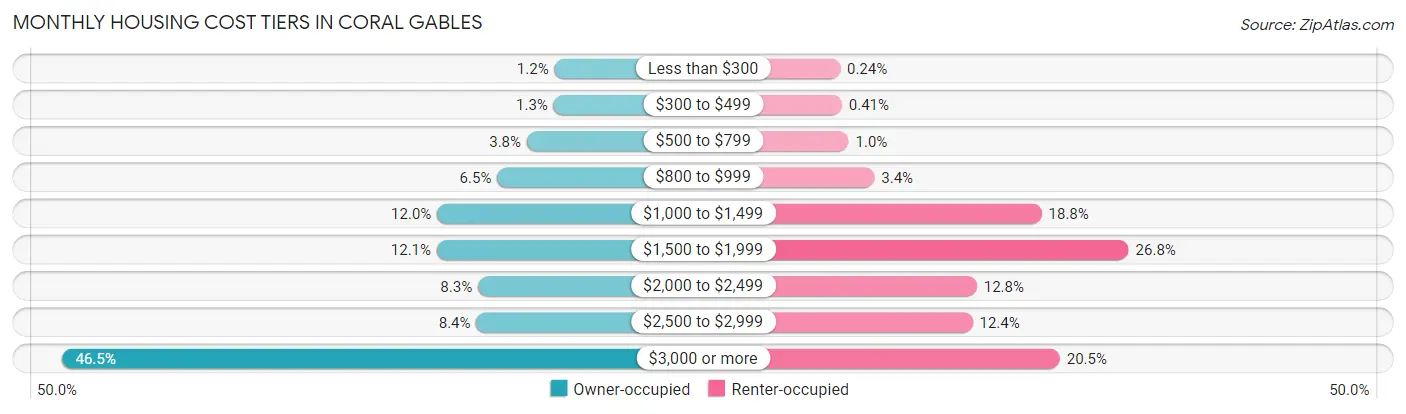
| Monthly Cost | Owner-occupied | Renter-occupied |
| Less than $300 | 148 (1.2%) | 16 (0.2%) |
| $300 to $499 | 157 (1.3%) | 28 (0.4%) |
| $500 to $799 | 458 (3.8%) | 70 (1.0%) |
| $800 to $999 | 790 (6.5%) | 230 (3.4%) |
| $1,000 to $1,499 | 1,463 (12.0%) | 1,273 (18.8%) |
| $1,500 to $1,999 | 1,467 (12.0%) | 1,815 (26.8%) |
| $2,000 to $2,499 | 1,006 (8.3%) | 869 (12.8%) |
| $2,500 to $2,999 | 1,024 (8.4%) | 842 (12.4%) |
| $3,000 or more | 5,663 (46.5%) | 1,386 (20.5%) |
| Total | 12,176 (100.0%) | 6,771 (100.0%) |
Physical Housing Characteristics in Coral Gables
Housing Structures in Coral Gables
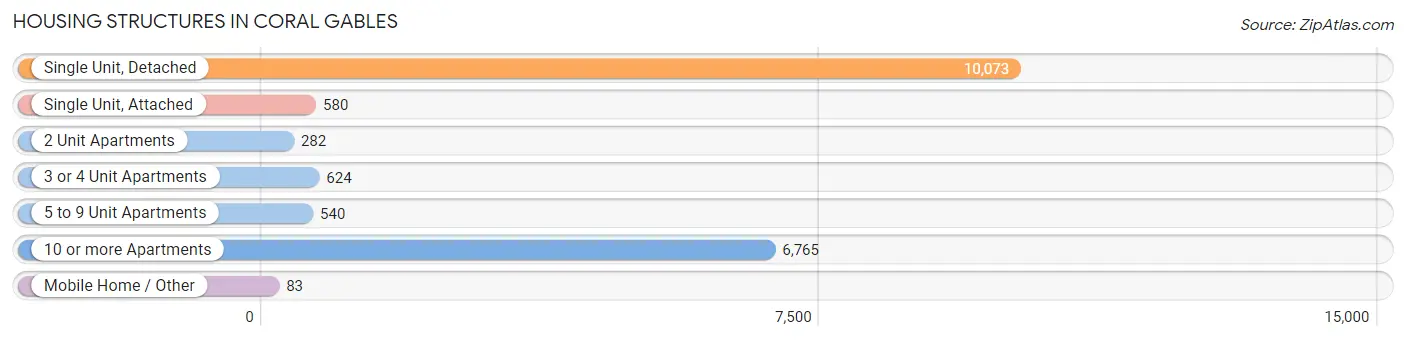
| Structure Type | # Housing Units | % Housing Units |
| Single Unit, Detached | 10,073 | 53.2% |
| Single Unit, Attached | 580 | 3.1% |
| 2 Unit Apartments | 282 | 1.5% |
| 3 or 4 Unit Apartments | 624 | 3.3% |
| 5 to 9 Unit Apartments | 540 | 2.9% |
| 10 or more Apartments | 6,765 | 35.7% |
| Mobile Home / Other | 83 | 0.4% |
| Total | 18,947 | 100.0% |
Housing Structures by Occupancy in Coral Gables
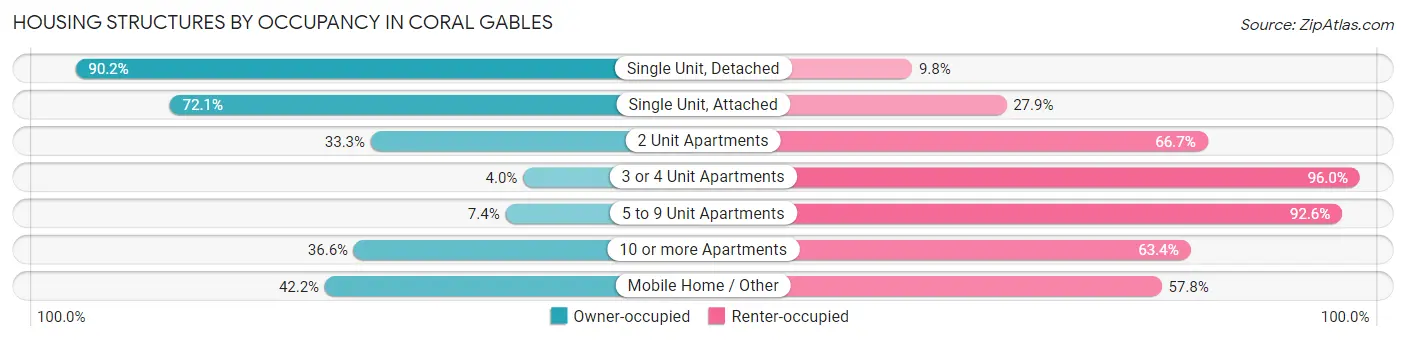
| Structure Type | Owner-occupied | Renter-occupied |
| Single Unit, Detached | 9,088 (90.2%) | 985 (9.8%) |
| Single Unit, Attached | 418 (72.1%) | 162 (27.9%) |
| 2 Unit Apartments | 94 (33.3%) | 188 (66.7%) |
| 3 or 4 Unit Apartments | 25 (4.0%) | 599 (96.0%) |
| 5 to 9 Unit Apartments | 40 (7.4%) | 500 (92.6%) |
| 10 or more Apartments | 2,476 (36.6%) | 4,289 (63.4%) |
| Mobile Home / Other | 35 (42.2%) | 48 (57.8%) |
| Total | 12,176 (64.3%) | 6,771 (35.7%) |
Housing Structures by Number of Rooms in Coral Gables
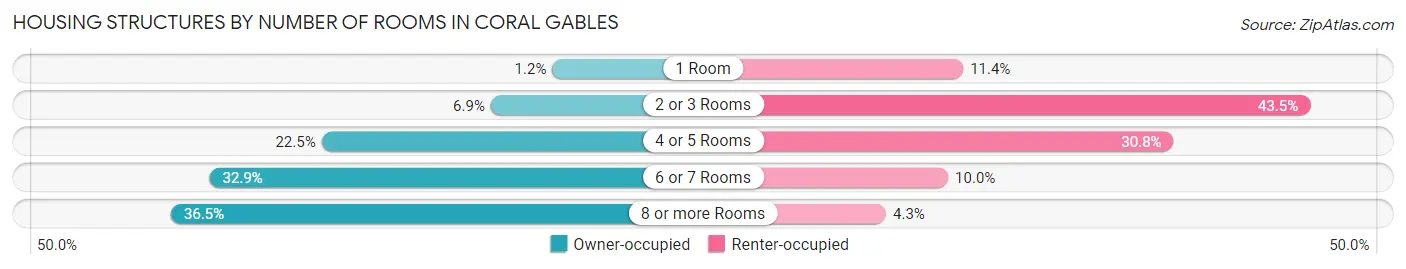
| Number of Rooms | Owner-occupied | Renter-occupied |
| 1 Room | 146 (1.2%) | 772 (11.4%) |
| 2 or 3 Rooms | 839 (6.9%) | 2,944 (43.5%) |
| 4 or 5 Rooms | 2,745 (22.5%) | 2,088 (30.8%) |
| 6 or 7 Rooms | 4,006 (32.9%) | 678 (10.0%) |
| 8 or more Rooms | 4,440 (36.5%) | 289 (4.3%) |
| Total | 12,176 (100.0%) | 6,771 (100.0%) |
Housing Structure by Heating Type in Coral Gables
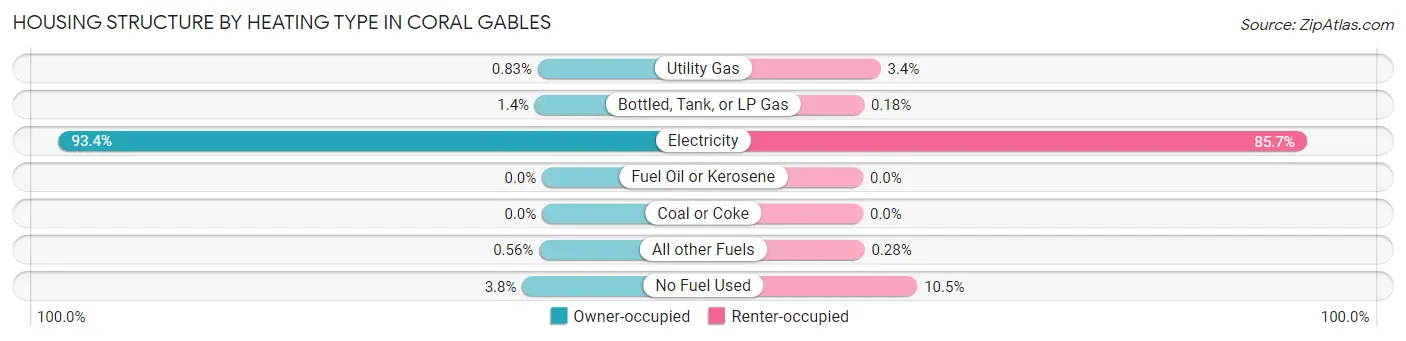
| Heating Type | Owner-occupied | Renter-occupied |
| Utility Gas | 101 (0.8%) | 229 (3.4%) |
| Bottled, Tank, or LP Gas | 168 (1.4%) | 12 (0.2%) |
| Electricity | 11,373 (93.4%) | 5,802 (85.7%) |
| Fuel Oil or Kerosene | 0 (0.0%) | 0 (0.0%) |
| Coal or Coke | 0 (0.0%) | 0 (0.0%) |
| All other Fuels | 68 (0.6%) | 19 (0.3%) |
| No Fuel Used | 466 (3.8%) | 709 (10.5%) |
| Total | 12,176 (100.0%) | 6,771 (100.0%) |
Household Vehicle Usage in Coral Gables
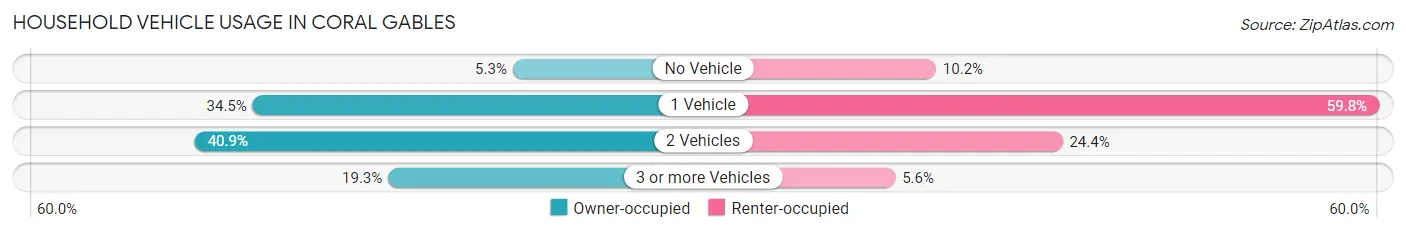
| Vehicles per Household | Owner-occupied | Renter-occupied |
| No Vehicle | 648 (5.3%) | 690 (10.2%) |
| 1 Vehicle | 4,196 (34.5%) | 4,050 (59.8%) |
| 2 Vehicles | 4,985 (40.9%) | 1,650 (24.4%) |
| 3 or more Vehicles | 2,347 (19.3%) | 381 (5.6%) |
| Total | 12,176 (100.0%) | 6,771 (100.0%) |
Real Estate & Mortgages in Coral Gables
Real Estate and Mortgage Overview in Coral Gables
| Characteristic | Without Mortgage | With Mortgage |
| Housing Units | 5,732 | 6,444 |
| Median Property Value | $913,700 | $978,600 |
| Median Household Income | $125,322 | $4,136 |
| Monthly Housing Costs | $1,501 | $4,641 |
| Real Estate Taxes | $7,869 | $64 |
Property Value by Mortgage Status in Coral Gables
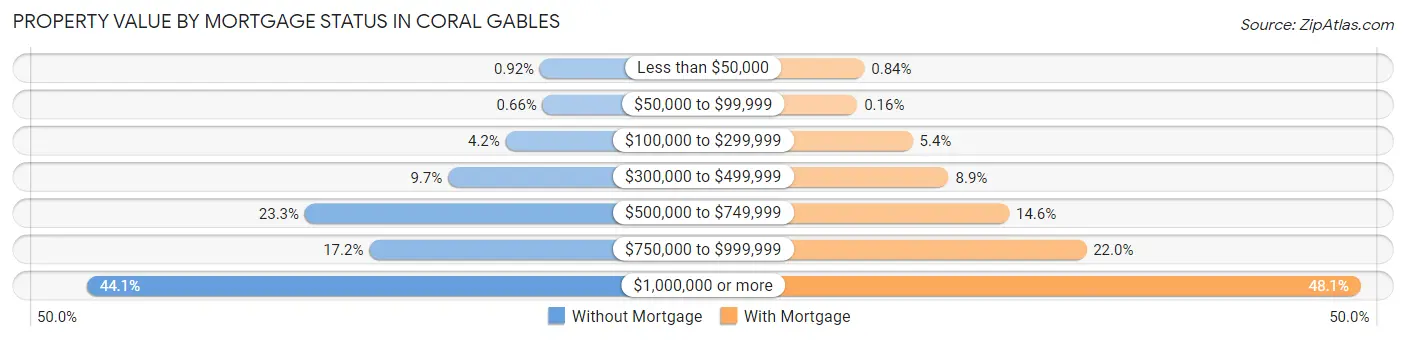
| Property Value | Without Mortgage | With Mortgage |
| Less than $50,000 | 53 (0.9%) | 54 (0.8%) |
| $50,000 to $99,999 | 38 (0.7%) | 10 (0.2%) |
| $100,000 to $299,999 | 240 (4.2%) | 350 (5.4%) |
| $300,000 to $499,999 | 554 (9.7%) | 571 (8.9%) |
| $500,000 to $749,999 | 1,336 (23.3%) | 942 (14.6%) |
| $750,000 to $999,999 | 985 (17.2%) | 1,416 (22.0%) |
| $1,000,000 or more | 2,526 (44.1%) | 3,101 (48.1%) |
| Total | 5,732 (100.0%) | 6,444 (100.0%) |
Household Income by Mortgage Status in Coral Gables
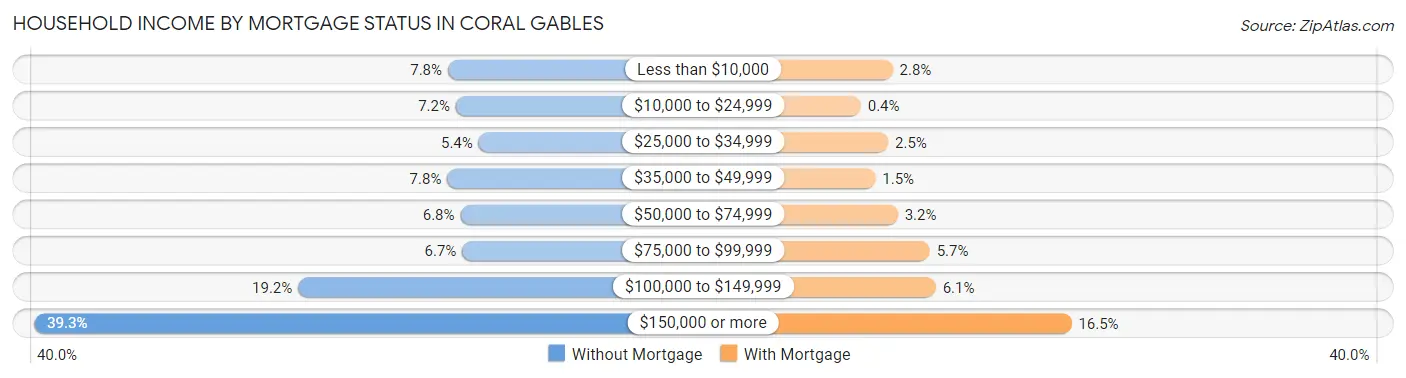
| Household Income | Without Mortgage | With Mortgage |
| Less than $10,000 | 444 (7.7%) | 182 (2.8%) |
| $10,000 to $24,999 | 410 (7.1%) | 26 (0.4%) |
| $25,000 to $34,999 | 310 (5.4%) | 160 (2.5%) |
| $35,000 to $49,999 | 447 (7.8%) | 97 (1.5%) |
| $50,000 to $74,999 | 390 (6.8%) | 207 (3.2%) |
| $75,000 to $99,999 | 382 (6.7%) | 364 (5.7%) |
| $100,000 to $149,999 | 1,098 (19.2%) | 394 (6.1%) |
| $150,000 or more | 2,251 (39.3%) | 1,060 (16.5%) |
| Total | 5,732 (100.0%) | 6,444 (100.0%) |
Property Value to Household Income Ratio in Coral Gables
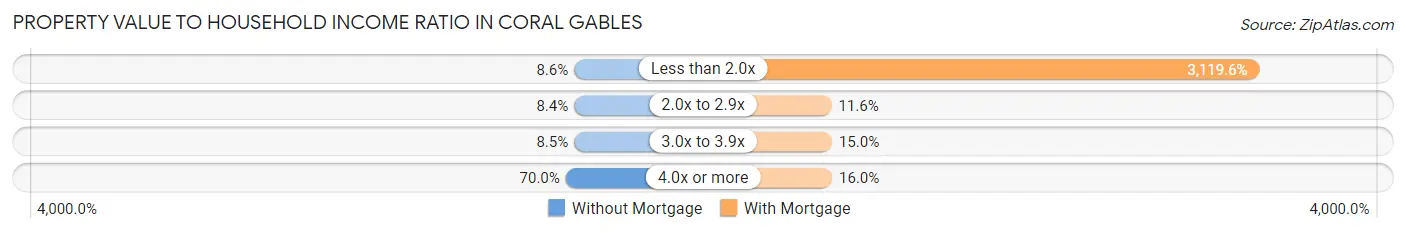
| Value-to-Income Ratio | Without Mortgage | With Mortgage |
| Less than 2.0x | 493 (8.6%) | 201,029 (3,119.6%) |
| 2.0x to 2.9x | 483 (8.4%) | 744 (11.6%) |
| 3.0x to 3.9x | 487 (8.5%) | 968 (15.0%) |
| 4.0x or more | 4,013 (70.0%) | 1,032 (16.0%) |
| Total | 5,732 (100.0%) | 6,444 (100.0%) |
Real Estate Taxes by Mortgage Status in Coral Gables
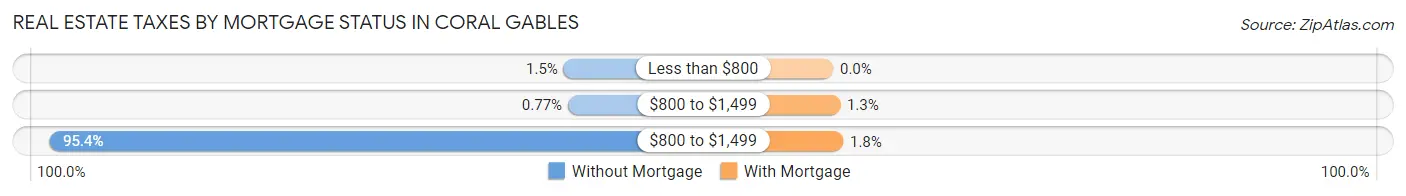
| Property Taxes | Without Mortgage | With Mortgage |
| Less than $800 | 88 (1.5%) | 0 (0.0%) |
| $800 to $1,499 | 44 (0.8%) | 81 (1.3%) |
| $800 to $1,499 | 5,466 (95.4%) | 118 (1.8%) |
| Total | 5,732 (100.0%) | 6,444 (100.0%) |
Health & Disability in Coral Gables
Health Insurance Coverage by Age in Coral Gables
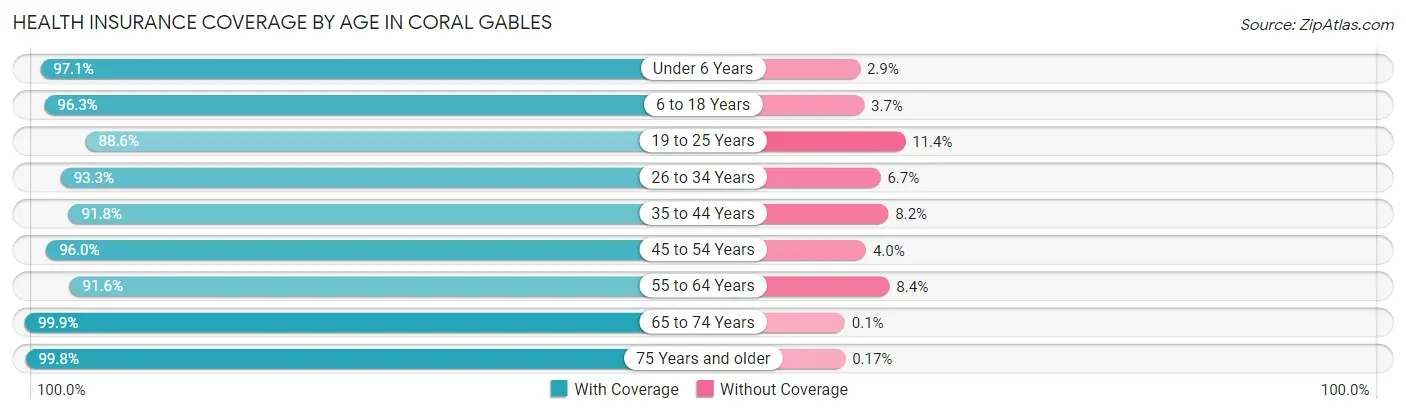
| Age Bracket | With Coverage | Without Coverage |
| Under 6 Years | 2,961 (97.1%) | 89 (2.9%) |
| 6 to 18 Years | 7,262 (96.3%) | 279 (3.7%) |
| 19 to 25 Years | 6,525 (88.6%) | 838 (11.4%) |
| 26 to 34 Years | 4,468 (93.3%) | 323 (6.7%) |
| 35 to 44 Years | 4,601 (91.8%) | 412 (8.2%) |
| 45 to 54 Years | 5,945 (96.0%) | 250 (4.0%) |
| 55 to 64 Years | 5,520 (91.6%) | 507 (8.4%) |
| 65 to 74 Years | 4,910 (99.9%) | 5 (0.1%) |
| 75 Years and older | 4,679 (99.8%) | 8 (0.2%) |
| Total | 46,871 (94.5%) | 2,711 (5.5%) |
Health Insurance Coverage by Citizenship Status in Coral Gables
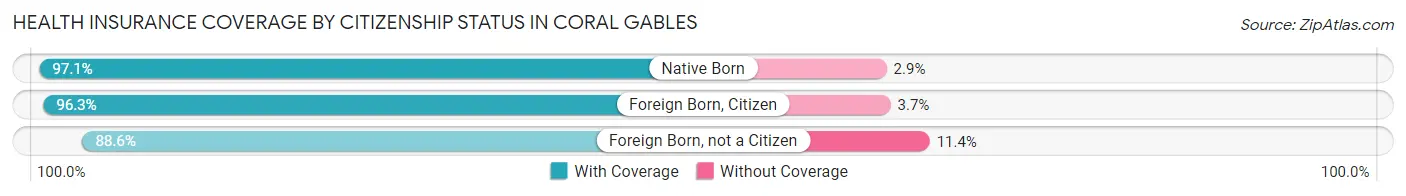
| Citizenship Status | With Coverage | Without Coverage |
| Native Born | 2,961 (97.1%) | 89 (2.9%) |
| Foreign Born, Citizen | 7,262 (96.3%) | 279 (3.7%) |
| Foreign Born, not a Citizen | 6,525 (88.6%) | 838 (11.4%) |
Health Insurance Coverage by Household Income in Coral Gables
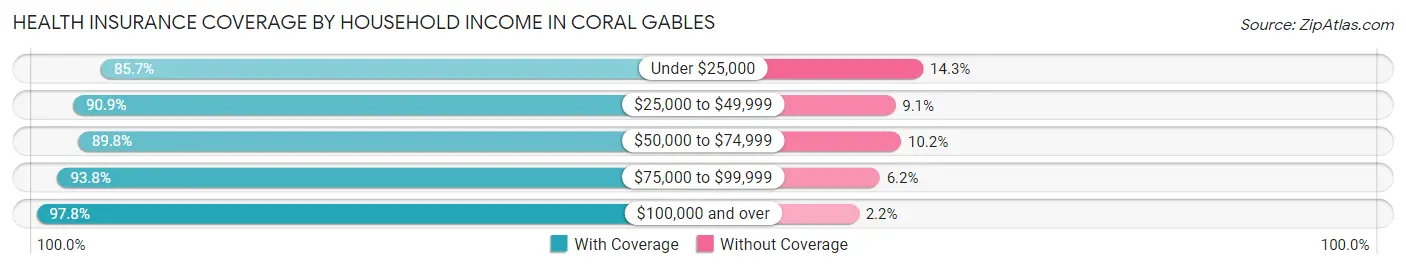
| Household Income | With Coverage | Without Coverage |
| Under $25,000 | 3,807 (85.7%) | 636 (14.3%) |
| $25,000 to $49,999 | 3,163 (90.9%) | 316 (9.1%) |
| $50,000 to $74,999 | 2,772 (89.8%) | 314 (10.2%) |
| $75,000 to $99,999 | 3,511 (93.8%) | 231 (6.2%) |
| $100,000 and over | 28,128 (97.8%) | 642 (2.2%) |
Public vs Private Health Insurance Coverage by Age in Coral Gables
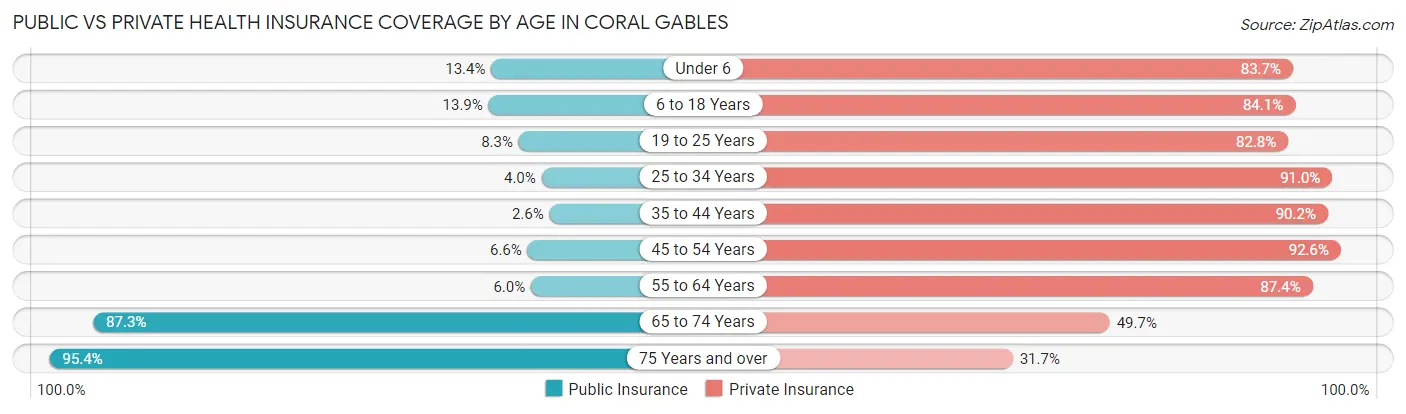
| Age Bracket | Public Insurance | Private Insurance |
| Under 6 | 408 (13.4%) | 2,553 (83.7%) |
| 6 to 18 Years | 1,046 (13.9%) | 6,343 (84.1%) |
| 19 to 25 Years | 609 (8.3%) | 6,099 (82.8%) |
| 25 to 34 Years | 193 (4.0%) | 4,361 (91.0%) |
| 35 to 44 Years | 129 (2.6%) | 4,521 (90.2%) |
| 45 to 54 Years | 411 (6.6%) | 5,737 (92.6%) |
| 55 to 64 Years | 361 (6.0%) | 5,265 (87.4%) |
| 65 to 74 Years | 4,291 (87.3%) | 2,444 (49.7%) |
| 75 Years and over | 4,471 (95.4%) | 1,487 (31.7%) |
| Total | 11,919 (24.0%) | 38,810 (78.3%) |
Disability Status by Sex by Age in Coral Gables
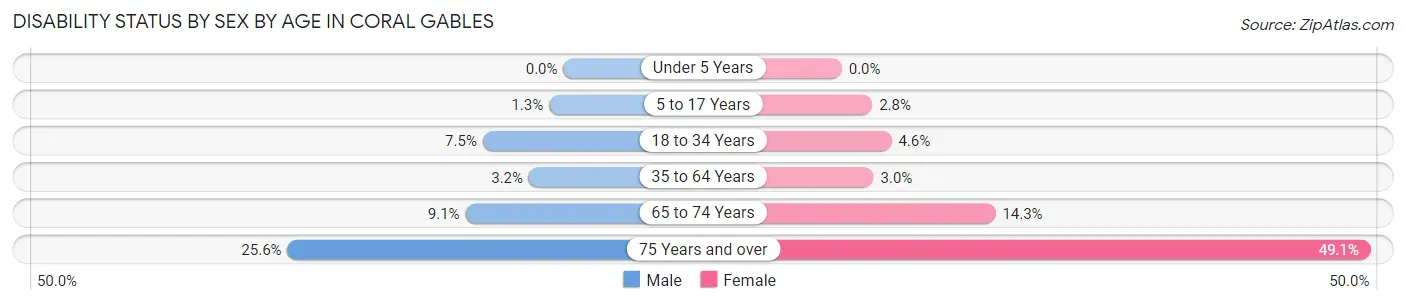
| Age Bracket | Male | Female |
| Under 5 Years | 0 (0.0%) | 0 (0.0%) |
| 5 to 17 Years | 36 (1.3%) | 87 (2.8%) |
| 18 to 34 Years | 495 (7.5%) | 355 (4.6%) |
| 35 to 64 Years | 272 (3.2%) | 258 (2.9%) |
| 65 to 74 Years | 193 (9.1%) | 398 (14.3%) |
| 75 Years and over | 496 (25.6%) | 1,350 (49.1%) |
Disability Class by Sex by Age in Coral Gables
Disability Class: Hearing Difficulty
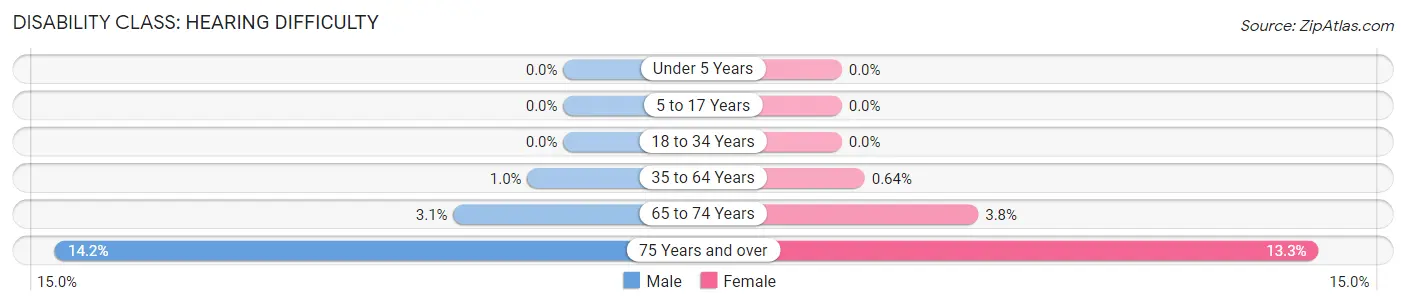
| Age Bracket | Male | Female |
| Under 5 Years | 0 (0.0%) | 0 (0.0%) |
| 5 to 17 Years | 0 (0.0%) | 0 (0.0%) |
| 18 to 34 Years | 0 (0.0%) | 0 (0.0%) |
| 35 to 64 Years | 85 (1.0%) | 56 (0.6%) |
| 65 to 74 Years | 65 (3.1%) | 106 (3.8%) |
| 75 Years and over | 274 (14.1%) | 365 (13.3%) |
Disability Class: Vision Difficulty
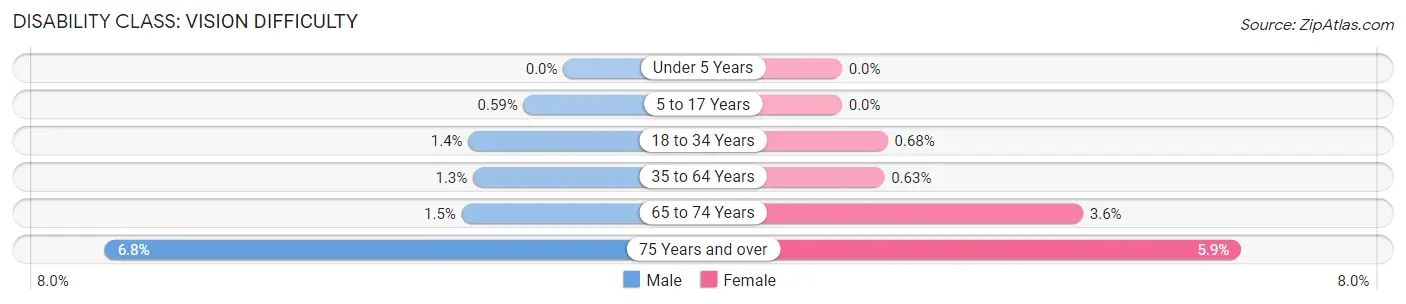
| Age Bracket | Male | Female |
| Under 5 Years | 0 (0.0%) | 0 (0.0%) |
| 5 to 17 Years | 16 (0.6%) | 0 (0.0%) |
| 18 to 34 Years | 93 (1.4%) | 52 (0.7%) |
| 35 to 64 Years | 114 (1.3%) | 55 (0.6%) |
| 65 to 74 Years | 32 (1.5%) | 100 (3.6%) |
| 75 Years and over | 132 (6.8%) | 163 (5.9%) |
Disability Class: Cognitive Difficulty
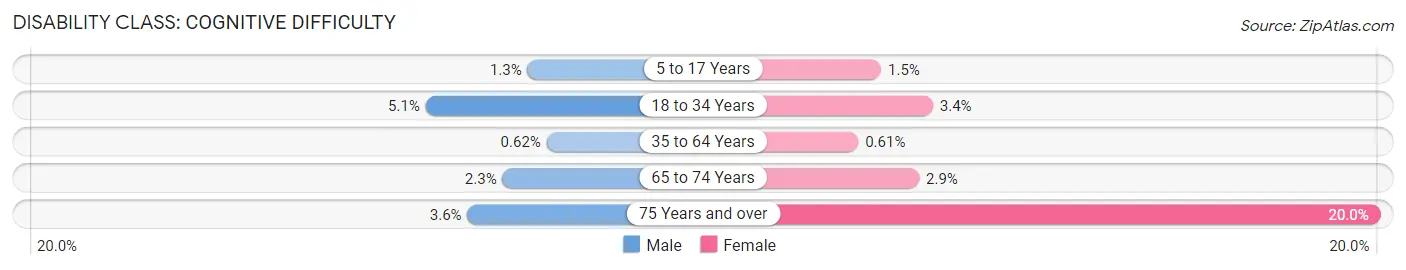
| Age Bracket | Male | Female |
| 5 to 17 Years | 36 (1.3%) | 45 (1.5%) |
| 18 to 34 Years | 338 (5.1%) | 260 (3.4%) |
| 35 to 64 Years | 53 (0.6%) | 53 (0.6%) |
| 65 to 74 Years | 48 (2.3%) | 80 (2.9%) |
| 75 Years and over | 69 (3.6%) | 550 (20.0%) |
Disability Class: Ambulatory Difficulty
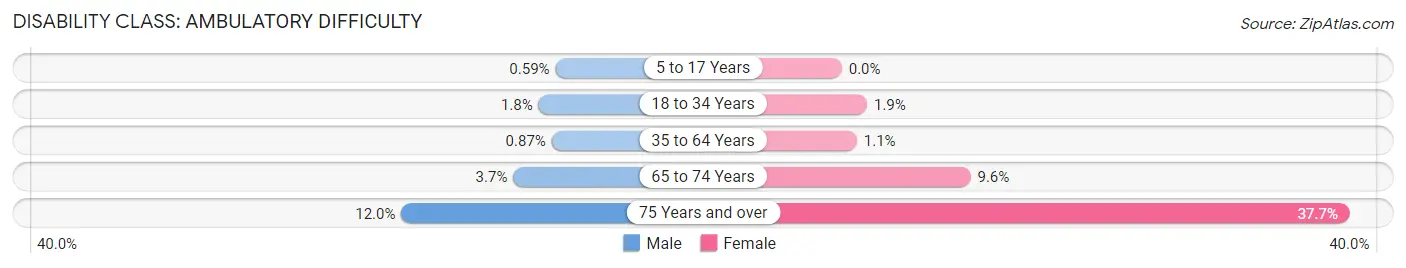
| Age Bracket | Male | Female |
| 5 to 17 Years | 16 (0.6%) | 0 (0.0%) |
| 18 to 34 Years | 122 (1.8%) | 144 (1.9%) |
| 35 to 64 Years | 74 (0.9%) | 98 (1.1%) |
| 65 to 74 Years | 79 (3.7%) | 267 (9.6%) |
| 75 Years and over | 233 (12.0%) | 1,037 (37.7%) |
Disability Class: Self-Care Difficulty
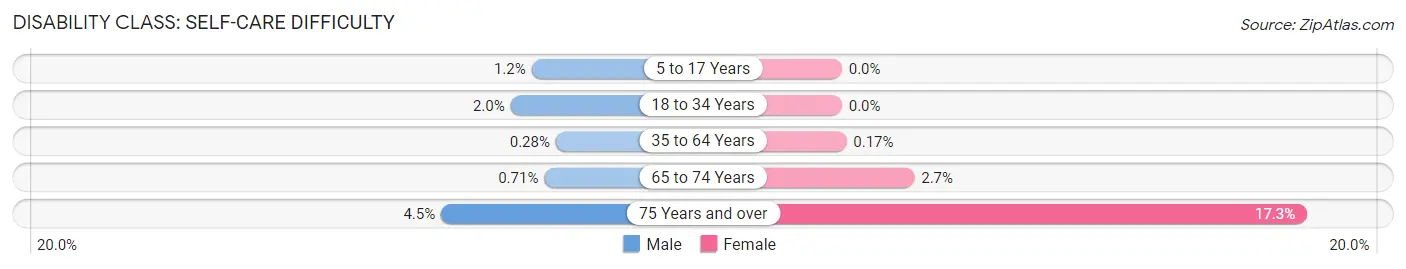
| Age Bracket | Male | Female |
| 5 to 17 Years | 32 (1.2%) | 0 (0.0%) |
| 18 to 34 Years | 130 (2.0%) | 0 (0.0%) |
| 35 to 64 Years | 24 (0.3%) | 15 (0.2%) |
| 65 to 74 Years | 15 (0.7%) | 75 (2.7%) |
| 75 Years and over | 88 (4.5%) | 475 (17.3%) |
Technology Access in Coral Gables
Computing Device Access in Coral Gables
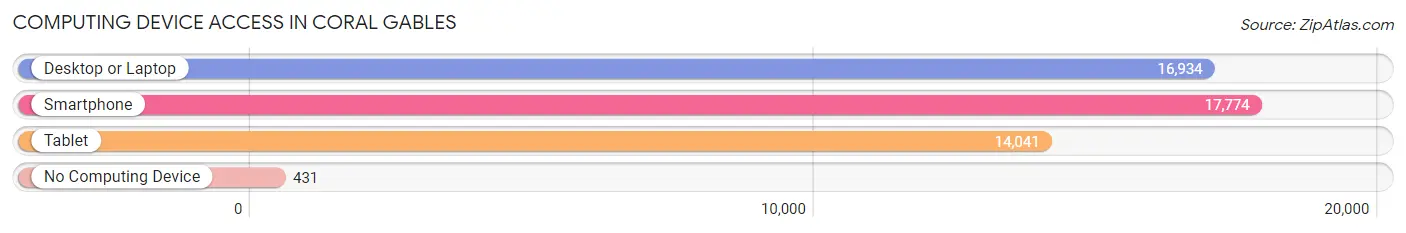
| Device Type | # Households | % Households |
| Desktop or Laptop | 16,934 | 89.4% |
| Smartphone | 17,774 | 93.8% |
| Tablet | 14,041 | 74.1% |
| No Computing Device | 431 | 2.3% |
| Total | 18,947 | 100.0% |
Internet Access in Coral Gables
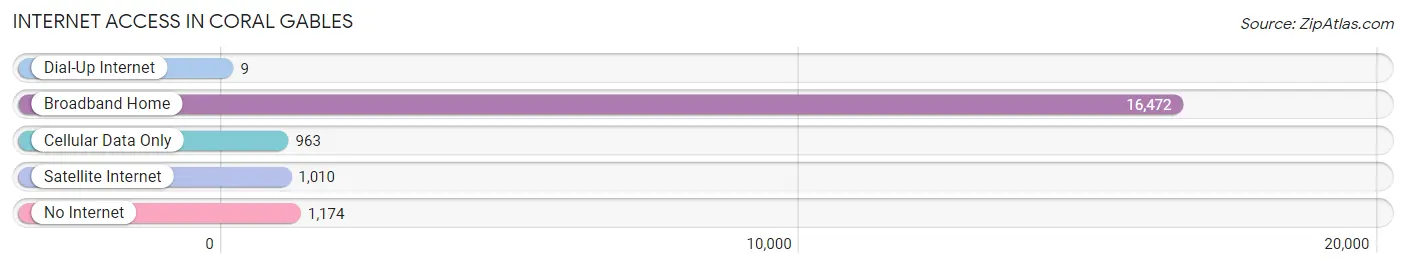
| Internet Type | # Households | % Households |
| Dial-Up Internet | 9 | 0.1% |
| Broadband Home | 16,472 | 86.9% |
| Cellular Data Only | 963 | 5.1% |
| Satellite Internet | 1,010 | 5.3% |
| No Internet | 1,174 | 6.2% |
| Total | 18,947 | 100.0% |
Coral Gables Summary
Coral Gables, Florida is a city located in Miami-Dade County, Florida, United States. It is a suburb of Miami and is located just south of the city. The city is known for its Mediterranean-style architecture, lush landscaping, and tree-lined streets. It is also home to the University of Miami and many other educational institutions.
History
Coral Gables was founded in 1925 by George Merrick, a real estate developer who wanted to create a city that was a “City Beautiful.” He envisioned a city with wide boulevards, lush landscaping, and Mediterranean-style architecture. He also wanted to create a city that was a “City of Homes” and he did this by creating a zoning ordinance that prohibited commercial development in the city.
The city was officially incorporated in 1925 and was named after the coral rock formations that were found in the area. The city quickly grew and by the 1950s, it had become a popular destination for tourists and retirees.
Geography
Coral Gables is located in Miami-Dade County, Florida, United States. It is located just south of the city of Miami and is bordered by the cities of South Miami, Pinecrest, and Coconut Grove. The city covers an area of 8.3 square miles and has a population of approximately 50,000 people.
The city is located on the Atlantic Coastal Ridge, which is a ridge of limestone that runs along the eastern coast of Florida. The city is also located on Biscayne Bay, which is a large bay located off the coast of Miami.
Economy
Coral Gables is a major economic center in Miami-Dade County. The city is home to many corporate headquarters, including Burger King, Bacardi, and Ryder Systems. The city is also home to the University of Miami, which is a major employer in the city.
The city also has a thriving tourism industry, with many hotels, restaurants, and attractions located in the city. The city is also home to many cultural institutions, including the Lowe Art Museum, the Coral Gables Museum, and the Fairchild Tropical Botanic Garden.
Demographics
As of the 2010 census, the population of Coral Gables was 46,780. The racial makeup of the city was 73.3% White, 11.3% African American, 0.2% Native American, 8.3% Asian, 0.1% Pacific Islander, and 6.8% from other races. The median household income in the city was $76,824 and the median family income was $90,890.
Coral Gables is a diverse city with a variety of cultures and backgrounds. The city is home to many immigrants from Latin America, the Caribbean, and other parts of the world. The city is also home to many retirees, as well as students from the University of Miami.
Common Questions
What is the Total Population of Coral Gables?
Total Population of Coral Gables is 49,696.
What is the Total Male Population of Coral Gables?
Total Male Population of Coral Gables is 23,139.
What is the Total Female Population of Coral Gables?
Total Female Population of Coral Gables is 26,557.
What is the Ratio of Males per 100 Females in Coral Gables?
There are 87.13 Males per 100 Females in Coral Gables.
What is the Ratio of Females per 100 Males in Coral Gables?
There are 114.77 Females per 100 Males in Coral Gables.
What is the Median Population Age in Coral Gables?
Median Population Age in Coral Gables is 39.3 Years.
What is the Average Family Size in Coral Gables
Average Family Size in Coral Gables is 3.0 People.
What is the Average Household Size in Coral Gables
Average Household Size in Coral Gables is 2.3 People.
What is Per Capita Income in Coral Gables?
Per Capita income in Coral Gables is $74,780.
What is the Median Family Income in Coral Gables?
Median Family Income in Coral Gables is $175,295.
What is the Median Household income in Coral Gables?
Median Household Income in Coral Gables is $118,203.
What is Income or Wage Gap in Coral Gables?
Income or Wage Gap in Coral Gables is 40.5%.
Women in Coral Gables earn 59.5 cents for every dollar earned by a man.
What is Family Income Deficit in Coral Gables?
Family Income Deficit in Coral Gables is $12,221.
Families that are below poverty line in Coral Gables earn $12,221 less on average than the poverty threshold level.
What is Inequality or Gini Index in Coral Gables?
Inequality or Gini Index in Coral Gables is 0.55.
How Large is the Labor Force in Coral Gables?
There are 24,387 People in the Labor Forcein in Coral Gables.
What is the Percentage of People in the Labor Force in Coral Gables?
57.7% of People are in the Labor Force in Coral Gables.
What is the Unemployment Rate in Coral Gables?
Unemployment Rate in Coral Gables is 4.8%.