Cities with the Most Immigrants from El Salvador in Florida
RELATED REPORTS & OPTIONS
El Salvador
Florida
Compare Cities
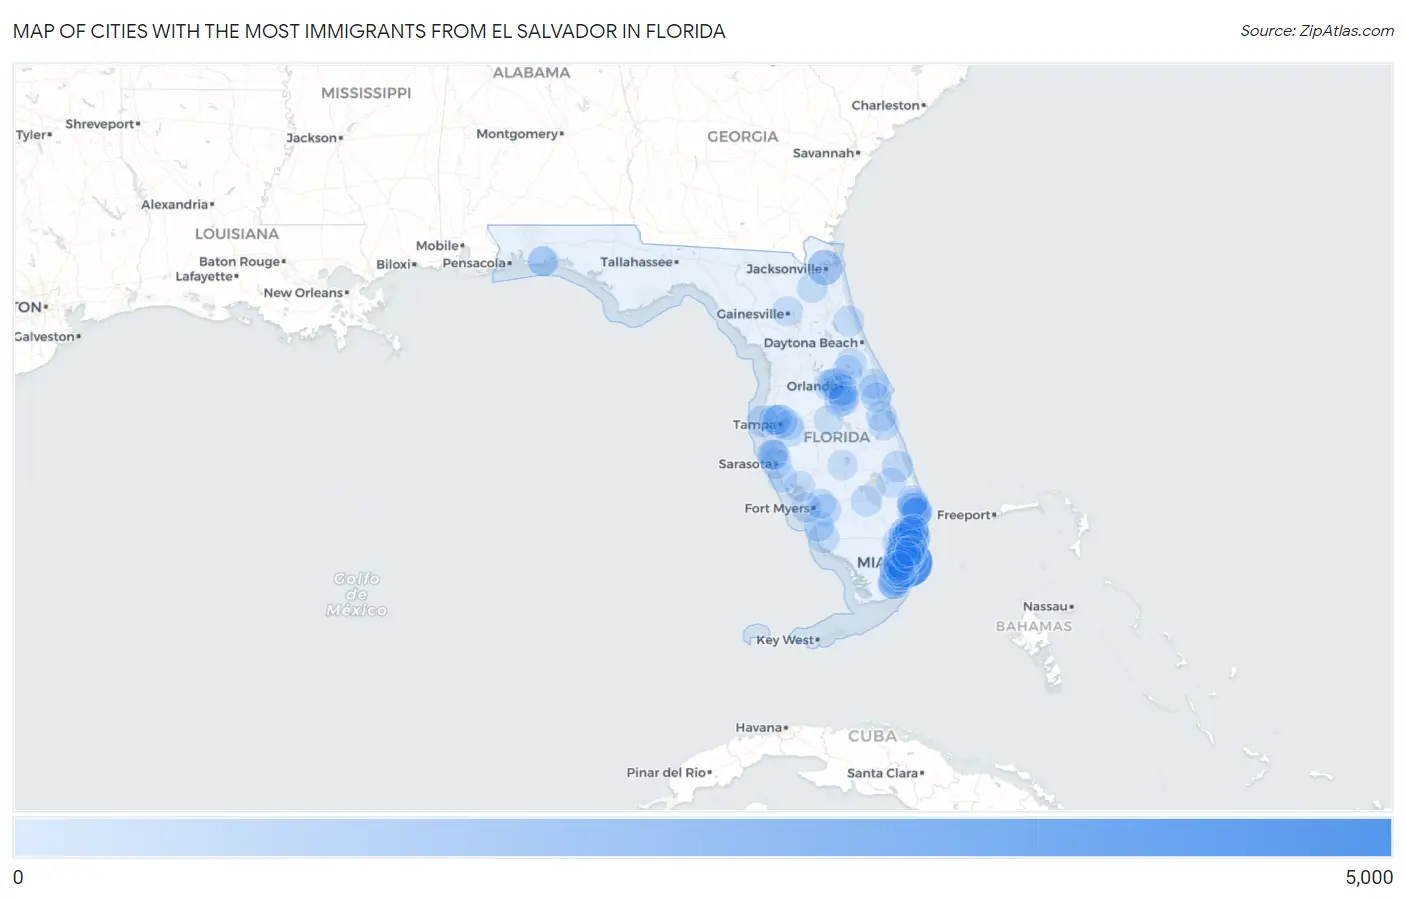
Map of Cities with the Most Immigrants from El Salvador in Florida
0
5,000
Cities with the Most Immigrants from El Salvador in Florida
| City | El Salvador | vs State | vs National | |
| 1. | Miami | 4,518 | 49,838(9.07%)#1 | 1,408,349(0.32%)#27 |
| 2. | Oakland Park | 1,843 | 49,838(3.70%)#2 | 1,408,349(0.13%)#122 |
| 3. | North Lauderdale | 1,690 | 49,838(3.39%)#3 | 1,408,349(0.12%)#131 |
| 4. | Fort Lauderdale | 1,264 | 49,838(2.54%)#4 | 1,408,349(0.09%)#179 |
| 5. | Jacksonville | 1,231 | 49,838(2.47%)#5 | 1,408,349(0.09%)#187 |
| 6. | Hollywood | 1,063 | 49,838(2.13%)#6 | 1,408,349(0.08%)#219 |
| 7. | Hialeah | 949 | 49,838(1.90%)#7 | 1,408,349(0.07%)#238 |
| 8. | Tampa | 866 | 49,838(1.74%)#8 | 1,408,349(0.06%)#253 |
| 9. | Princeton | 773 | 49,838(1.55%)#9 | 1,408,349(0.05%)#278 |
| 10. | Homestead | 756 | 49,838(1.52%)#10 | 1,408,349(0.05%)#285 |
| 11. | Oak Ridge | 642 | 49,838(1.29%)#11 | 1,408,349(0.05%)#317 |
| 12. | Davie | 615 | 49,838(1.23%)#12 | 1,408,349(0.04%)#333 |
| 13. | Pompano Beach | 596 | 49,838(1.20%)#13 | 1,408,349(0.04%)#340 |
| 14. | Lake Worth Beach | 548 | 49,838(1.10%)#14 | 1,408,349(0.04%)#370 |
| 15. | West Little River | 538 | 49,838(1.08%)#15 | 1,408,349(0.04%)#379 |
| 16. | Boynton Beach | 536 | 49,838(1.08%)#16 | 1,408,349(0.04%)#383 |
| 17. | Leisure City | 529 | 49,838(1.06%)#17 | 1,408,349(0.04%)#390 |
| 18. | South Miami Heights | 504 | 49,838(1.01%)#18 | 1,408,349(0.04%)#402 |
| 19. | Lehigh Acres | 491 | 49,838(0.99%)#19 | 1,408,349(0.03%)#407 |
| 20. | Clearwater | 482 | 49,838(0.97%)#20 | 1,408,349(0.03%)#413 |
| 21. | Lauderhill | 455 | 49,838(0.91%)#21 | 1,408,349(0.03%)#439 |
| 22. | Pembroke Pines | 425 | 49,838(0.85%)#22 | 1,408,349(0.03%)#456 |
| 23. | Fountainebleau | 409 | 49,838(0.82%)#23 | 1,408,349(0.03%)#479 |
| 24. | Greenacres | 388 | 49,838(0.78%)#24 | 1,408,349(0.03%)#509 |
| 25. | Kissimmee | 380 | 49,838(0.76%)#25 | 1,408,349(0.03%)#520 |
| 26. | Pine Hills | 377 | 49,838(0.76%)#26 | 1,408,349(0.03%)#523 |
| 27. | Port St Lucie | 375 | 49,838(0.75%)#27 | 1,408,349(0.03%)#527 |
| 28. | Palm Springs | 358 | 49,838(0.72%)#28 | 1,408,349(0.03%)#548 |
| 29. | Kendall West | 347 | 49,838(0.70%)#29 | 1,408,349(0.02%)#564 |
| 30. | West Palm Beach | 333 | 49,838(0.67%)#30 | 1,408,349(0.02%)#585 |
| 31. | Palm Coast | 330 | 49,838(0.66%)#31 | 1,408,349(0.02%)#588 |
| 32. | Miami Beach | 315 | 49,838(0.63%)#32 | 1,408,349(0.02%)#624 |
| 33. | Deltona | 310 | 49,838(0.62%)#33 | 1,408,349(0.02%)#627 |
| 34. | Golden Gate | 308 | 49,838(0.62%)#34 | 1,408,349(0.02%)#629 |
| 35. | Clewiston | 299 | 49,838(0.60%)#35 | 1,408,349(0.02%)#650 |
| 36. | Orlando | 287 | 49,838(0.58%)#36 | 1,408,349(0.02%)#667 |
| 37. | Buenaventura Lakes | 286 | 49,838(0.57%)#37 | 1,408,349(0.02%)#670 |
| 38. | Port St John | 281 | 49,838(0.56%)#38 | 1,408,349(0.02%)#681 |
| 39. | Palm Bay | 267 | 49,838(0.54%)#39 | 1,408,349(0.02%)#704 |
| 40. | The Hammocks | 260 | 49,838(0.52%)#40 | 1,408,349(0.02%)#717 |
| 41. | Florida City | 260 | 49,838(0.52%)#41 | 1,408,349(0.02%)#720 |
| 42. | Middleburg | 256 | 49,838(0.51%)#42 | 1,408,349(0.02%)#725 |
| 43. | West Melbourne | 255 | 49,838(0.51%)#43 | 1,408,349(0.02%)#727 |
| 44. | Country Walk | 239 | 49,838(0.48%)#44 | 1,408,349(0.02%)#759 |
| 45. | Tamiami | 238 | 49,838(0.48%)#45 | 1,408,349(0.02%)#762 |
| 46. | Doral | 237 | 49,838(0.48%)#46 | 1,408,349(0.02%)#764 |
| 47. | Weston | 237 | 49,838(0.48%)#47 | 1,408,349(0.02%)#765 |
| 48. | Bonita Springs | 237 | 49,838(0.48%)#48 | 1,408,349(0.02%)#766 |
| 49. | Ocean City | 235 | 49,838(0.47%)#49 | 1,408,349(0.02%)#776 |
| 50. | Town N Country | 230 | 49,838(0.46%)#50 | 1,408,349(0.02%)#784 |
| 51. | University Cdp Hillsborough County | 230 | 49,838(0.46%)#51 | 1,408,349(0.02%)#785 |
| 52. | Port Charlotte | 229 | 49,838(0.46%)#52 | 1,408,349(0.02%)#786 |
| 53. | Three Lakes | 225 | 49,838(0.45%)#53 | 1,408,349(0.02%)#793 |
| 54. | Margate | 222 | 49,838(0.45%)#54 | 1,408,349(0.02%)#800 |
| 55. | Sarasota | 219 | 49,838(0.44%)#55 | 1,408,349(0.02%)#806 |
| 56. | Sunrise | 209 | 49,838(0.42%)#56 | 1,408,349(0.01%)#824 |
| 57. | Tamarac | 208 | 49,838(0.42%)#57 | 1,408,349(0.01%)#828 |
| 58. | Riverview | 207 | 49,838(0.42%)#58 | 1,408,349(0.01%)#830 |
| 59. | Lantana | 199 | 49,838(0.40%)#59 | 1,408,349(0.01%)#852 |
| 60. | San Castle | 196 | 49,838(0.39%)#60 | 1,408,349(0.01%)#860 |
| 61. | Miramar | 194 | 49,838(0.39%)#61 | 1,408,349(0.01%)#862 |
| 62. | Kendale Lakes | 194 | 49,838(0.39%)#62 | 1,408,349(0.01%)#864 |
| 63. | Cutler Bay | 193 | 49,838(0.39%)#63 | 1,408,349(0.01%)#866 |
| 64. | Plantation Mobile Home Park | 188 | 49,838(0.38%)#64 | 1,408,349(0.01%)#883 |
| 65. | Bradenton | 178 | 49,838(0.36%)#65 | 1,408,349(0.01%)#914 |
| 66. | Gainesville | 170 | 49,838(0.34%)#66 | 1,408,349(0.01%)#947 |
| 67. | Winter Garden | 170 | 49,838(0.34%)#67 | 1,408,349(0.01%)#948 |
| 68. | Hallandale Beach | 168 | 49,838(0.34%)#68 | 1,408,349(0.01%)#956 |
| 69. | Liberty Triangle | 168 | 49,838(0.34%)#69 | 1,408,349(0.01%)#959 |
| 70. | Ocoee | 167 | 49,838(0.34%)#70 | 1,408,349(0.01%)#964 |
| 71. | Miami Gardens | 166 | 49,838(0.33%)#71 | 1,408,349(0.01%)#969 |
| 72. | Brownsville | 158 | 49,838(0.32%)#72 | 1,408,349(0.01%)#998 |
| 73. | Sweetwater | 157 | 49,838(0.32%)#73 | 1,408,349(0.01%)#1,001 |
| 74. | Titusville | 154 | 49,838(0.31%)#74 | 1,408,349(0.01%)#1,017 |
| 75. | Meadow Woods | 154 | 49,838(0.31%)#75 | 1,408,349(0.01%)#1,018 |
| 76. | Brandon | 153 | 49,838(0.31%)#76 | 1,408,349(0.01%)#1,021 |
| 77. | Deerfield Beach | 149 | 49,838(0.30%)#77 | 1,408,349(0.01%)#1,033 |
| 78. | Palmetto Bay | 147 | 49,838(0.29%)#78 | 1,408,349(0.01%)#1,044 |
| 79. | Lake Placid | 145 | 49,838(0.29%)#79 | 1,408,349(0.01%)#1,058 |
| 80. | Coral Terrace | 142 | 49,838(0.28%)#80 | 1,408,349(0.01%)#1,065 |
| 81. | Dania Beach | 138 | 49,838(0.28%)#81 | 1,408,349(0.01%)#1,084 |
| 82. | Sanford | 137 | 49,838(0.27%)#82 | 1,408,349(0.01%)#1,087 |
| 83. | South Bradenton | 136 | 49,838(0.27%)#83 | 1,408,349(0.01%)#1,096 |
| 84. | Indiantown | 126 | 49,838(0.25%)#84 | 1,408,349(0.01%)#1,147 |
| 85. | Cape Coral | 121 | 49,838(0.24%)#85 | 1,408,349(0.01%)#1,164 |
| 86. | Fort Myers Shores | 119 | 49,838(0.24%)#86 | 1,408,349(0.01%)#1,185 |
| 87. | Cocoa West | 118 | 49,838(0.24%)#87 | 1,408,349(0.01%)#1,192 |
| 88. | North Miami Beach | 117 | 49,838(0.23%)#88 | 1,408,349(0.01%)#1,196 |
| 89. | Samoset | 107 | 49,838(0.21%)#89 | 1,408,349(0.01%)#1,258 |
| 90. | Kendall | 102 | 49,838(0.20%)#90 | 1,408,349(0.01%)#1,282 |
| 91. | Dundee | 102 | 49,838(0.20%)#91 | 1,408,349(0.01%)#1,290 |
| 92. | Pinewood | 100 | 49,838(0.20%)#92 | 1,408,349(0.01%)#1,304 |
| 93. | Egypt Lake Leto | 99 | 49,838(0.20%)#93 | 1,408,349(0.01%)#1,309 |
| 94. | Wright | 99 | 49,838(0.20%)#94 | 1,408,349(0.01%)#1,310 |
| 95. | Country Club | 98 | 49,838(0.20%)#95 | 1,408,349(0.01%)#1,314 |
| 96. | Westview | 98 | 49,838(0.20%)#96 | 1,408,349(0.01%)#1,320 |
| 97. | Westwood Lakes | 92 | 49,838(0.18%)#97 | 1,408,349(0.01%)#1,367 |
| 98. | Coconut Creek | 90 | 49,838(0.18%)#98 | 1,408,349(0.01%)#1,383 |
| 99. | Ives Estates | 90 | 49,838(0.18%)#99 | 1,408,349(0.01%)#1,388 |
| 100. | Venice | 88 | 49,838(0.18%)#100 | 1,408,349(0.01%)#1,398 |
Common Questions
What are the Top 10 Cities with the Most Immigrants from El Salvador in Florida?
Top 10 Cities with the Most Immigrants from El Salvador in Florida are:
#1
4,518
#2
1,843
#3
1,690
#4
1,264
#5
1,231
#6
1,063
#7
949
#8
866
#9
773
#10
756
What city has the Most Immigrants from El Salvador in Florida?
Miami has the Most Immigrants from El Salvador in Florida with 4,518.
What is the Total Immigrants from El Salvador in the State of Florida?
Total Immigrants from El Salvador in Florida is 49,838.
What is the Total Immigrants from El Salvador in the United States?
Total Immigrants from El Salvador in the United States is 1,408,349.