Lakewood Park, FL
Lakewood Park Map
Lakewood Park Overview
14,119
TOTAL POPULATION
7,084
MALE POPULATION
7,035
FEMALE POPULATION
100.70
MALES / 100 FEMALES
99.31
FEMALES / 100 MALES
50.6
MEDIAN AGE
3.1
AVG FAMILY SIZE
2.5
AVG HOUSEHOLD SIZE
$28,831
PER CAPITA INCOME
$63,158
AVG FAMILY INCOME
$58,004
AVG HOUSEHOLD INCOME
25.1%
WAGE / INCOME GAP [ % ]
74.9¢/ $1
WAGE / INCOME GAP [ $ ]
0.38
INEQUALITY / GINI INDEX
6,561
LABOR FORCE [ PEOPLE ]
54.8%
PERCENT IN LABOR FORCE
3.8%
UNEMPLOYMENT RATE
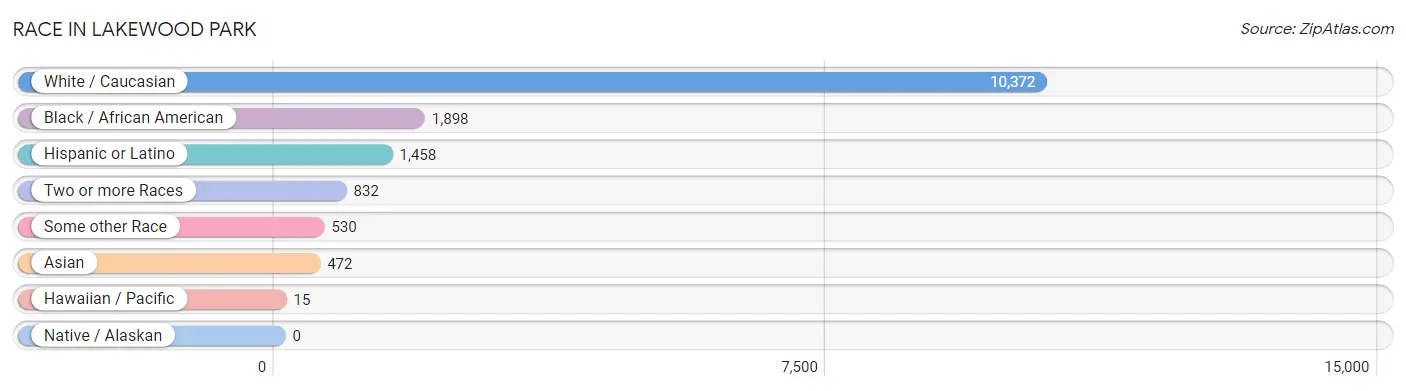
Race in Lakewood Park
The most populous races in Lakewood Park are White / Caucasian (10,372 | 73.5%), Black / African American (1,898 | 13.4%), and Hispanic or Latino (1,458 | 10.3%).
| Race | # Population | % Population |
| Asian | 472 | 3.3% |
| Black / African American | 1,898 | 13.4% |
| Hawaiian / Pacific | 15 | 0.1% |
| Hispanic or Latino | 1,458 | 10.3% |
| Native / Alaskan | 0 | 0.0% |
| White / Caucasian | 10,372 | 73.5% |
| Two or more Races | 832 | 5.9% |
| Some other Race | 530 | 3.7% |
| Total | 14,119 | 100.0% |
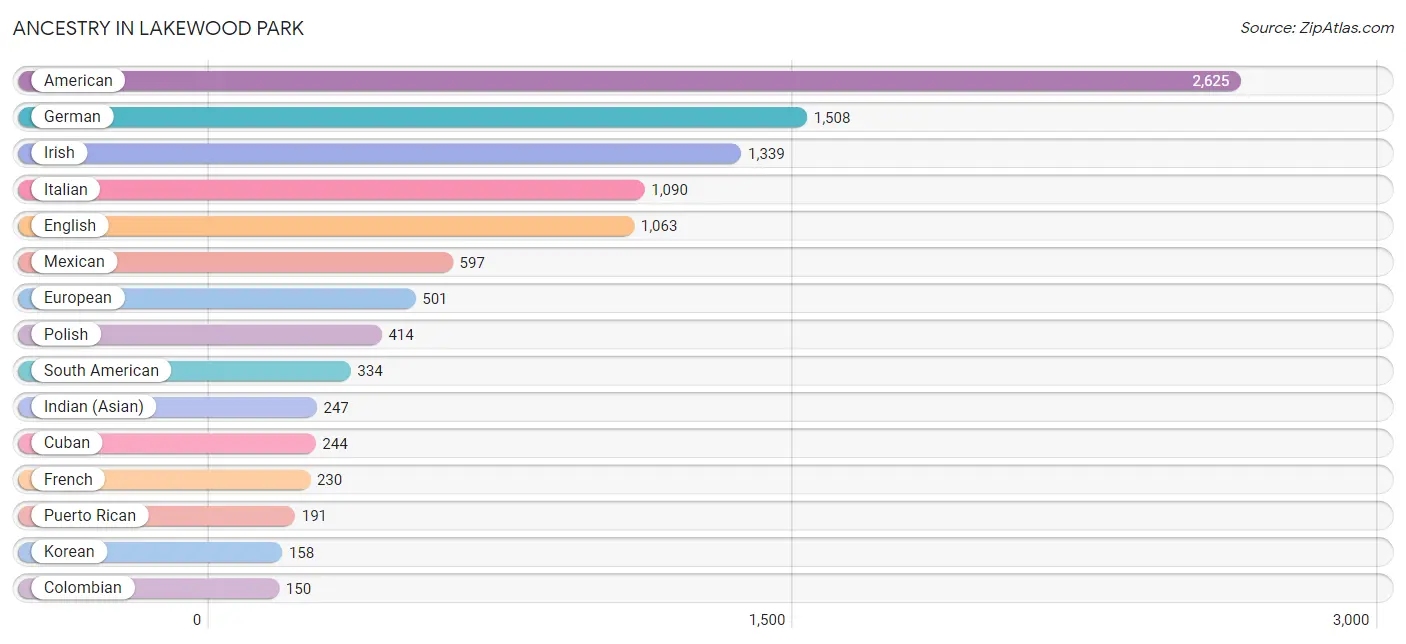
Ancestry in Lakewood Park
The most populous ancestries reported in Lakewood Park are American (2,625 | 18.6%), German (1,508 | 10.7%), Irish (1,339 | 9.5%), Italian (1,090 | 7.7%), and English (1,063 | 7.5%), together accounting for 54.0% of all Lakewood Park residents.
| Ancestry | # Population | % Population |
| American | 2,625 | 18.6% |
| Apache | 22 | 0.2% |
| Argentinean | 24 | 0.2% |
| Austrian | 68 | 0.5% |
| Belgian | 8 | 0.1% |
| Bhutanese | 11 | 0.1% |
| Bolivian | 58 | 0.4% |
| British | 38 | 0.3% |
| Canadian | 53 | 0.4% |
| Central American | 80 | 0.6% |
| Cherokee | 5 | 0.0% |
| Colombian | 150 | 1.1% |
| Cuban | 244 | 1.7% |
| Czech | 62 | 0.4% |
| Danish | 14 | 0.1% |
| Dutch | 131 | 0.9% |
| Ecuadorian | 21 | 0.2% |
| English | 1,063 | 7.5% |
| Ethiopian | 140 | 1.0% |
| European | 501 | 3.5% |
| French | 230 | 1.6% |
| French Canadian | 134 | 0.9% |
| German | 1,508 | 10.7% |
| Greek | 40 | 0.3% |
| Haitian | 76 | 0.5% |
| Hungarian | 40 | 0.3% |
| Indian (Asian) | 247 | 1.8% |
| Irish | 1,339 | 9.5% |
| Italian | 1,090 | 7.7% |
| Jamaican | 13 | 0.1% |
| Korean | 158 | 1.1% |
| Mexican | 597 | 4.2% |
| Native Hawaiian | 9 | 0.1% |
| Norwegian | 23 | 0.2% |
| Panamanian | 63 | 0.4% |
| Pennsylvania German | 26 | 0.2% |
| Polish | 414 | 2.9% |
| Portuguese | 42 | 0.3% |
| Puerto Rican | 191 | 1.3% |
| Romanian | 17 | 0.1% |
| Russian | 9 | 0.1% |
| Salvadoran | 17 | 0.1% |
| Scotch-Irish | 86 | 0.6% |
| Scottish | 109 | 0.8% |
| Slovak | 42 | 0.3% |
| South American | 334 | 2.4% |
| Spaniard | 12 | 0.1% |
| Sri Lankan | 56 | 0.4% |
| Subsaharan African | 140 | 1.0% |
| Swedish | 89 | 0.6% |
| Ukrainian | 82 | 0.6% |
| Uruguayan | 36 | 0.3% |
| Venezuelan | 45 | 0.3% |
| Welsh | 97 | 0.7% |
| West Indian | 58 | 0.4% | View All 55 Rows |
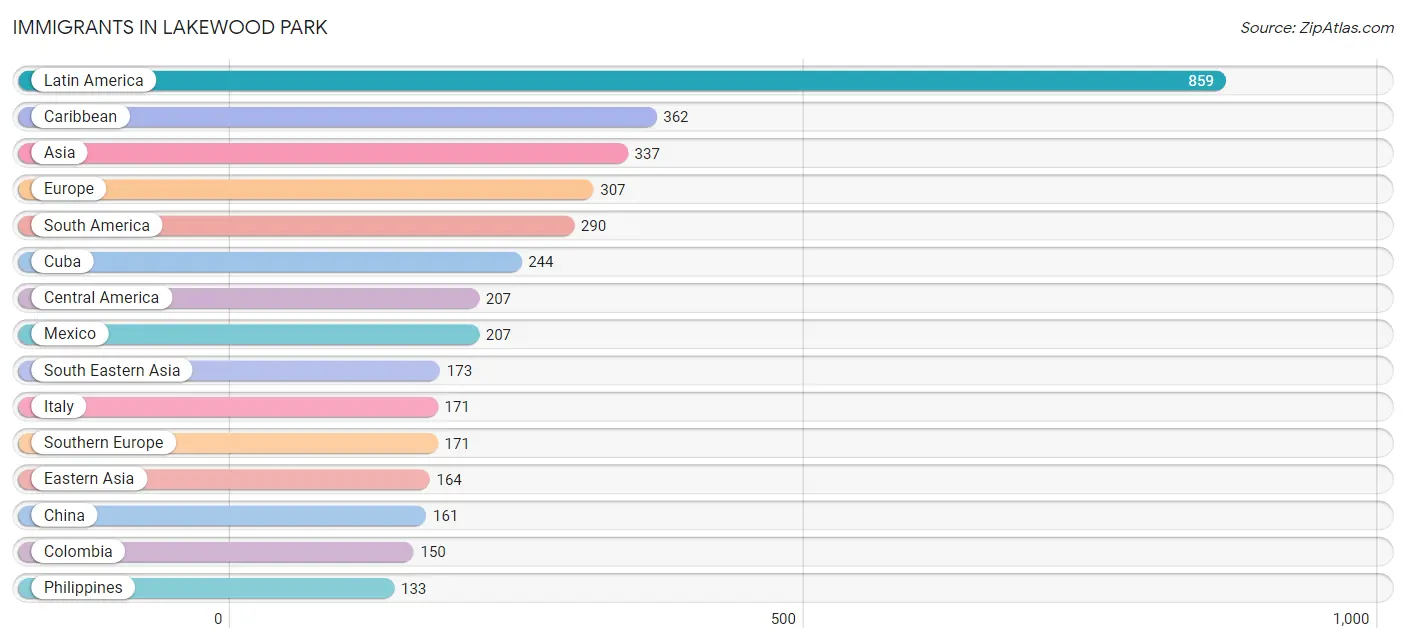
Immigrants in Lakewood Park
The most numerous immigrant groups reported in Lakewood Park came from Latin America (859 | 6.1%), Caribbean (362 | 2.6%), Asia (337 | 2.4%), Europe (307 | 2.2%), and South America (290 | 2.1%), together accounting for 15.2% of all Lakewood Park residents.
| Immigration Origin | # Population | % Population |
| Africa | 58 | 0.4% |
| Asia | 337 | 2.4% |
| Bahamas | 20 | 0.1% |
| Bolivia | 58 | 0.4% |
| Canada | 115 | 0.8% |
| Caribbean | 362 | 2.6% |
| Central America | 207 | 1.5% |
| China | 161 | 1.1% |
| Colombia | 150 | 1.1% |
| Cuba | 244 | 1.7% |
| Eastern Africa | 47 | 0.3% |
| Eastern Asia | 164 | 1.2% |
| Eastern Europe | 26 | 0.2% |
| Ecuador | 21 | 0.2% |
| England | 16 | 0.1% |
| Ethiopia | 47 | 0.3% |
| Europe | 307 | 2.2% |
| Germany | 7 | 0.1% |
| Haiti | 35 | 0.3% |
| Ireland | 78 | 0.5% |
| Italy | 171 | 1.2% |
| Jamaica | 5 | 0.0% |
| Korea | 3 | 0.0% |
| Latin America | 859 | 6.1% |
| Mexico | 207 | 1.5% |
| Morocco | 11 | 0.1% |
| Northern Africa | 11 | 0.1% |
| Northern Europe | 103 | 0.7% |
| Philippines | 133 | 0.9% |
| Poland | 21 | 0.2% |
| Romania | 5 | 0.0% |
| South America | 290 | 2.1% |
| South Eastern Asia | 173 | 1.2% |
| Southern Europe | 171 | 1.2% |
| Trinidad and Tobago | 58 | 0.4% |
| Uruguay | 36 | 0.3% |
| Venezuela | 25 | 0.2% |
| Vietnam | 40 | 0.3% |
| Western Europe | 7 | 0.1% | View All 39 Rows |
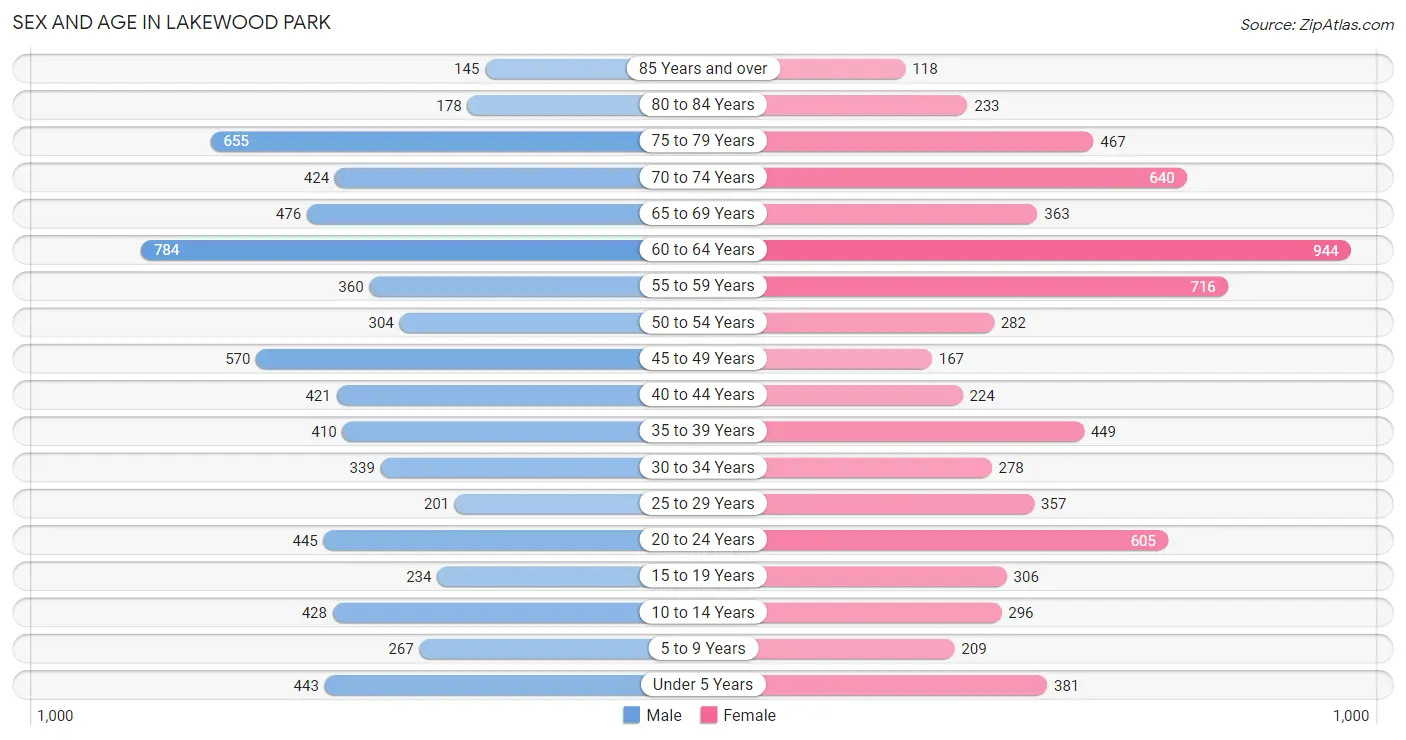
Sex and Age in Lakewood Park
Sex and Age in Lakewood Park
The most populous age groups in Lakewood Park are 60 to 64 Years (784 | 11.1%) for men and 60 to 64 Years (944 | 13.4%) for women.
| Age Bracket | Male | Female |
| Under 5 Years | 443 (6.2%) | 381 (5.4%) |
| 5 to 9 Years | 267 (3.8%) | 209 (3.0%) |
| 10 to 14 Years | 428 (6.0%) | 296 (4.2%) |
| 15 to 19 Years | 234 (3.3%) | 306 (4.3%) |
| 20 to 24 Years | 445 (6.3%) | 605 (8.6%) |
| 25 to 29 Years | 201 (2.8%) | 357 (5.1%) |
| 30 to 34 Years | 339 (4.8%) | 278 (4.0%) |
| 35 to 39 Years | 410 (5.8%) | 449 (6.4%) |
| 40 to 44 Years | 421 (5.9%) | 224 (3.2%) |
| 45 to 49 Years | 570 (8.1%) | 167 (2.4%) |
| 50 to 54 Years | 304 (4.3%) | 282 (4.0%) |
| 55 to 59 Years | 360 (5.1%) | 716 (10.2%) |
| 60 to 64 Years | 784 (11.1%) | 944 (13.4%) |
| 65 to 69 Years | 476 (6.7%) | 363 (5.2%) |
| 70 to 74 Years | 424 (6.0%) | 640 (9.1%) |
| 75 to 79 Years | 655 (9.2%) | 467 (6.6%) |
| 80 to 84 Years | 178 (2.5%) | 233 (3.3%) |
| 85 Years and over | 145 (2.1%) | 118 (1.7%) |
| Total | 7,084 (100.0%) | 7,035 (100.0%) |
Families and Households in Lakewood Park
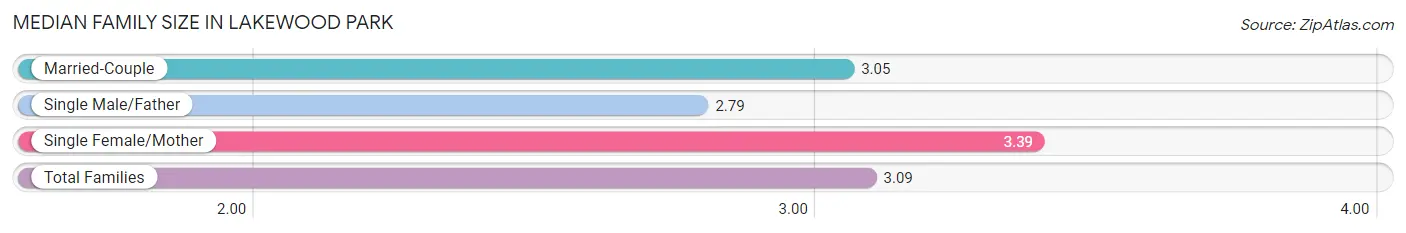
Median Family Size in Lakewood Park
The median family size in Lakewood Park is 3.09 persons per family, with single female/mother families (637 | 19.1%) accounting for the largest median family size of 3.39 persons per family. On the other hand, single male/father families (291 | 8.7%) represent the smallest median family size with 2.79 persons per family.
| Family Type | # Families | Family Size |
| Married-Couple | 2,407 (72.2%) | 3.05 |
| Single Male/Father | 291 (8.7%) | 2.79 |
| Single Female/Mother | 637 (19.1%) | 3.39 |
| Total Families | 3,335 (100.0%) | 3.09 |
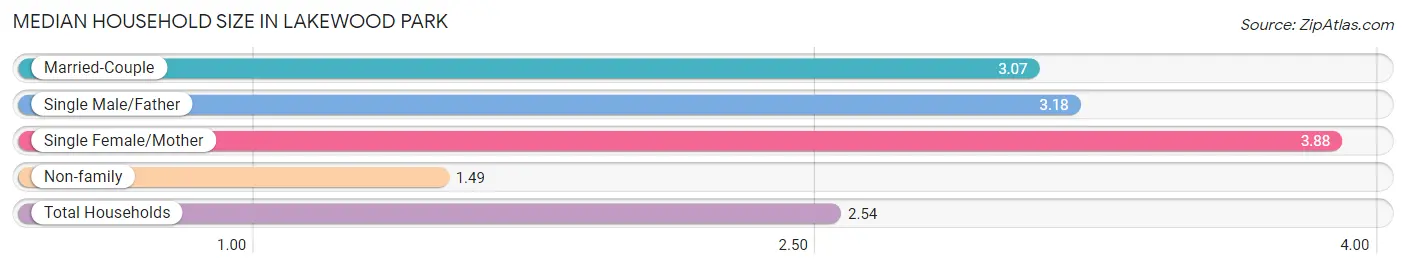
Median Household Size in Lakewood Park
The median household size in Lakewood Park is 2.54 persons per household, with single female/mother households (637 | 11.5%) accounting for the largest median household size of 3.88 persons per household. non-family households (2,216 | 39.9%) represent the smallest median household size with 1.49 persons per household.
| Household Type | # Households | Household Size |
| Married-Couple | 2,407 (43.4%) | 3.07 |
| Single Male/Father | 291 (5.2%) | 3.18 |
| Single Female/Mother | 637 (11.5%) | 3.88 |
| Non-family | 2,216 (39.9%) | 1.49 |
| Total Households | 5,551 (100.0%) | 2.54 |
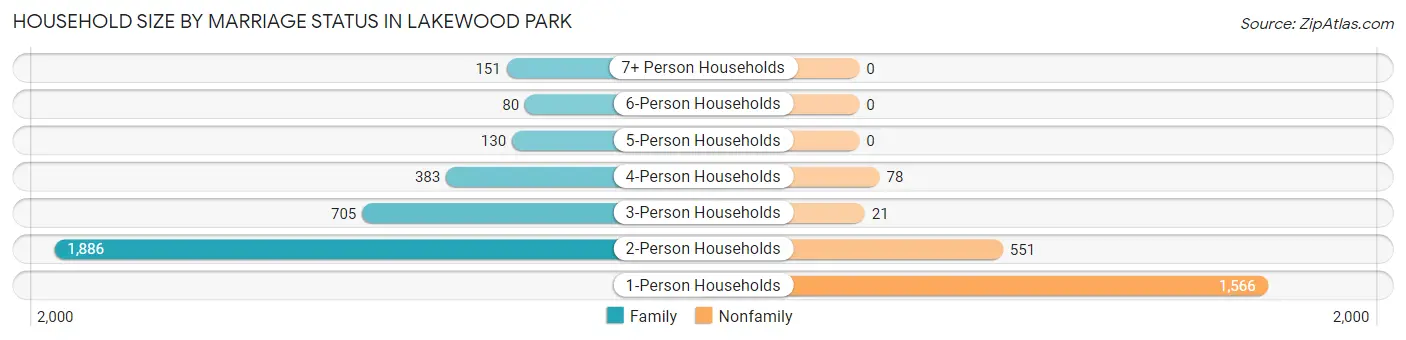
Household Size by Marriage Status in Lakewood Park
Out of a total of 5,551 households in Lakewood Park, 3,335 (60.1%) are family households, while 2,216 (39.9%) are nonfamily households. The most numerous type of family households are 2-person households, comprising 1,886, and the most common type of nonfamily households are 1-person households, comprising 1,566.
| Household Size | Family Households | Nonfamily Households |
| 1-Person Households | - | 1,566 (28.2%) |
| 2-Person Households | 1,886 (34.0%) | 551 (9.9%) |
| 3-Person Households | 705 (12.7%) | 21 (0.4%) |
| 4-Person Households | 383 (6.9%) | 78 (1.4%) |
| 5-Person Households | 130 (2.3%) | 0 (0.0%) |
| 6-Person Households | 80 (1.4%) | 0 (0.0%) |
| 7+ Person Households | 151 (2.7%) | 0 (0.0%) |
| Total | 3,335 (60.1%) | 2,216 (39.9%) |
Female Fertility in Lakewood Park
Fertility by Age in Lakewood Park
Average fertility rate in Lakewood Park is 78.0 births per 1,000 women. Women in the age bracket of 20 to 34 years have the highest fertility rate with 118.0 births per 1,000 women. Women in the age bracket of 20 to 34 years acount for 77.2% of all women with births.
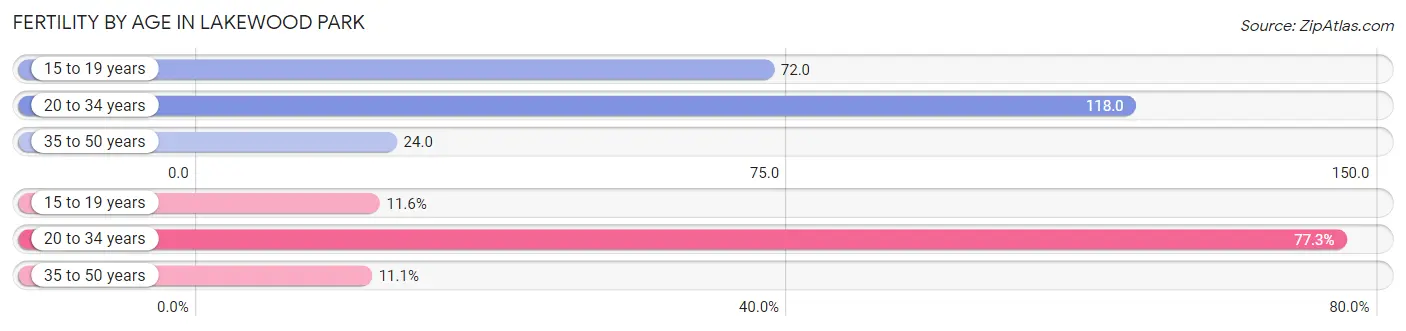
| Age Bracket | Women with Births | Births / 1,000 Women |
| 15 to 19 years | 22 (11.6%) | 72.0 |
| 20 to 34 years | 146 (77.2%) | 118.0 |
| 35 to 50 years | 21 (11.1%) | 24.0 |
| Total | 189 (100.0%) | 78.0 |
Fertility by Age by Marriage Status in Lakewood Park
31.7% of women with births (189) in Lakewood Park are married. The highest percentage of unmarried women with births falls into 15 to 19 years age bracket with 100.0% of them unmarried at the time of birth, while the lowest percentage of unmarried women with births belong to 35 to 50 years age bracket with 0.0% of them unmarried.
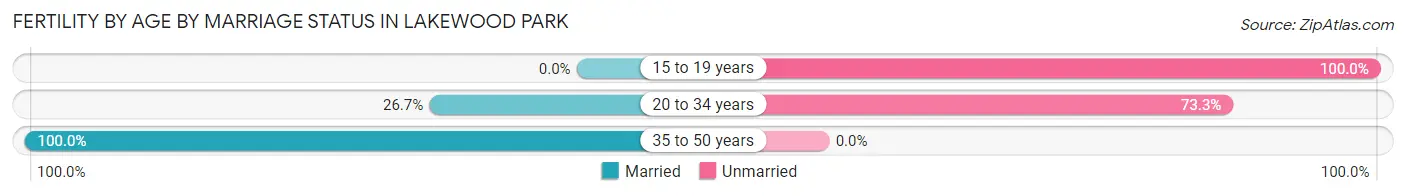
| Age Bracket | Married | Unmarried |
| 15 to 19 years | 0 (0.0%) | 22 (100.0%) |
| 20 to 34 years | 39 (26.7%) | 107 (73.3%) |
| 35 to 50 years | 21 (100.0%) | 0 (0.0%) |
| Total | 60 (31.8%) | 129 (68.2%) |
Fertility by Education in Lakewood Park
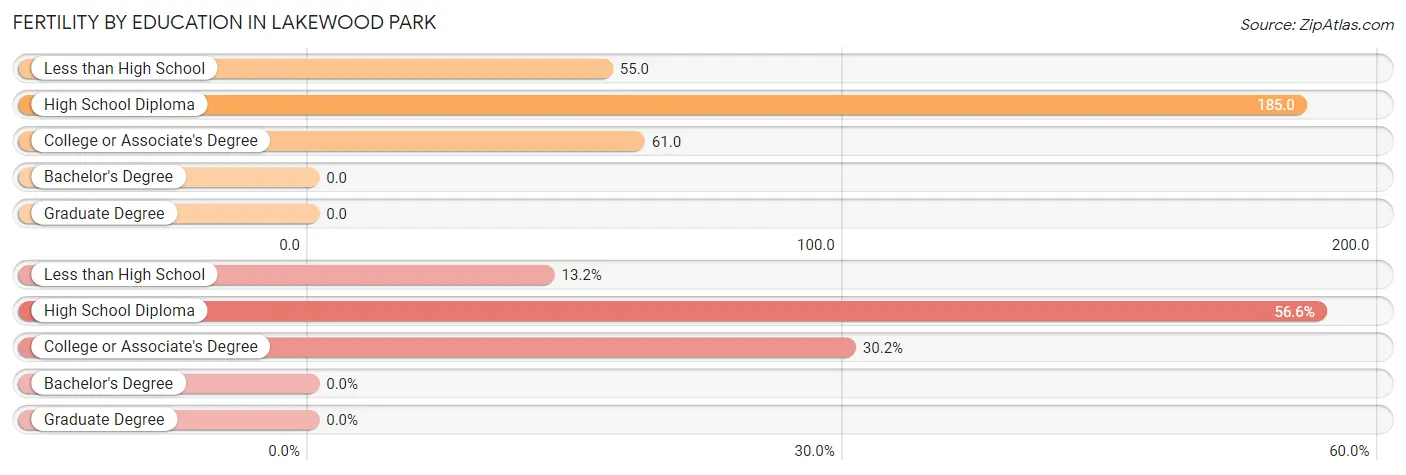
| Educational Attainment | Women with Births | Births / 1,000 Women |
| Less than High School | 25 (13.2%) | 55.0 |
| High School Diploma | 107 (56.6%) | 185.0 |
| College or Associate's Degree | 57 (30.2%) | 61.0 |
| Bachelor's Degree | 0 (0.0%) | 0.0 |
| Graduate Degree | 0 (0.0%) | 0.0 |
| Total | 189 (100.0%) | 78.0 |
Fertility by Education by Marriage Status in Lakewood Park
68.2% of women with births in Lakewood Park are unmarried. Women with the educational attainment of college or associate's degree are most likely to be married with 100.0% of them married at childbirth, while women with the educational attainment of high school diploma are least likely to be married with 100.0% of them unmarried at childbirth.
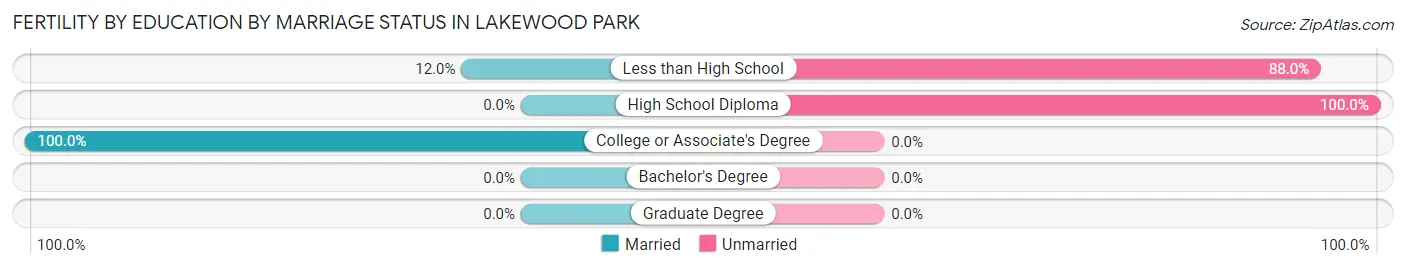
| Educational Attainment | Married | Unmarried |
| Less than High School | 3 (12.0%) | 22 (88.0%) |
| High School Diploma | 0 (0.0%) | 107 (100.0%) |
| College or Associate's Degree | 57 (100.0%) | 0 (0.0%) |
| Bachelor's Degree | 0 (0.0%) | 0 (0.0%) |
| Graduate Degree | 0 (0.0%) | 0 (0.0%) |
| Total | 60 (31.8%) | 129 (68.2%) |
Income in Lakewood Park
Income Overview in Lakewood Park
Per Capita Income in Lakewood Park is $28,831, while median incomes of families and households are $63,158 and $58,004 respectively.
| Characteristic | Number | Measure |
| Per Capita Income | 14,119 | $28,831 |
| Median Family Income | 3,335 | $63,158 |
| Mean Family Income | 3,335 | $75,724 |
| Median Household Income | 5,551 | $58,004 |
| Mean Household Income | 5,551 | $68,115 |
| Income Deficit | 3,335 | $0 |
| Wage / Income Gap (%) | 14,119 | 25.11% |
| Wage / Income Gap ($) | 14,119 | 74.89¢ per $1 |
| Gini / Inequality Index | 14,119 | 0.38 |
Earnings by Sex in Lakewood Park
Average Earnings in Lakewood Park are $34,199, $39,495 for men and $29,577 for women, a difference of 25.1%.
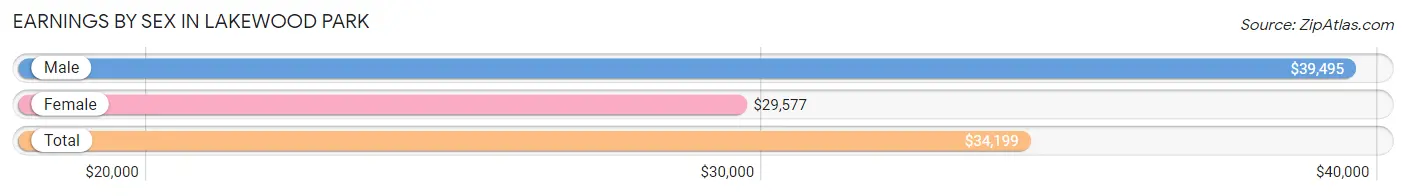
| Sex | Number | Average Earnings |
| Male | 3,458 (51.0%) | $39,495 |
| Female | 3,326 (49.0%) | $29,577 |
| Total | 6,784 (100.0%) | $34,199 |
Earnings by Sex by Income Bracket in Lakewood Park
The most common earnings brackets in Lakewood Park are $75,000 to $99,999 for men (401 | 11.6%) and $35,000 to $39,999 for women (470 | 14.1%).
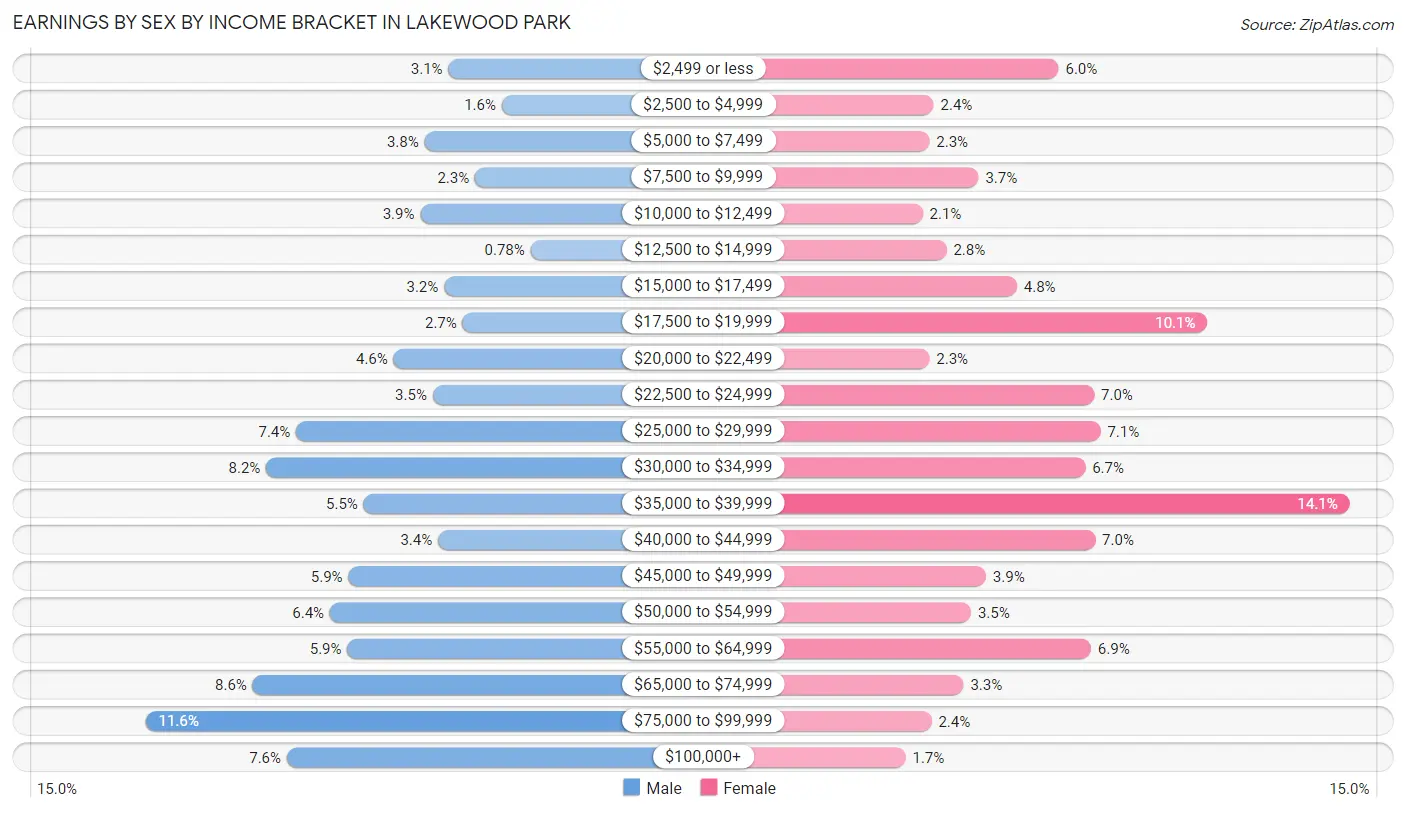
| Income | Male | Female |
| $2,499 or less | 107 (3.1%) | 198 (5.9%) |
| $2,500 to $4,999 | 55 (1.6%) | 81 (2.4%) |
| $5,000 to $7,499 | 130 (3.8%) | 77 (2.3%) |
| $7,500 to $9,999 | 81 (2.3%) | 123 (3.7%) |
| $10,000 to $12,499 | 134 (3.9%) | 71 (2.1%) |
| $12,500 to $14,999 | 27 (0.8%) | 93 (2.8%) |
| $15,000 to $17,499 | 111 (3.2%) | 159 (4.8%) |
| $17,500 to $19,999 | 93 (2.7%) | 337 (10.1%) |
| $20,000 to $22,499 | 160 (4.6%) | 77 (2.3%) |
| $22,500 to $24,999 | 122 (3.5%) | 231 (7.0%) |
| $25,000 to $29,999 | 255 (7.4%) | 237 (7.1%) |
| $30,000 to $34,999 | 284 (8.2%) | 223 (6.7%) |
| $35,000 to $39,999 | 189 (5.5%) | 470 (14.1%) |
| $40,000 to $44,999 | 117 (3.4%) | 232 (7.0%) |
| $45,000 to $49,999 | 204 (5.9%) | 130 (3.9%) |
| $50,000 to $54,999 | 222 (6.4%) | 116 (3.5%) |
| $55,000 to $64,999 | 205 (5.9%) | 228 (6.9%) |
| $65,000 to $74,999 | 297 (8.6%) | 109 (3.3%) |
| $75,000 to $99,999 | 401 (11.6%) | 79 (2.4%) |
| $100,000+ | 264 (7.6%) | 55 (1.7%) |
| Total | 3,458 (100.0%) | 3,326 (100.0%) |
Earnings by Sex by Educational Attainment in Lakewood Park
Average earnings in Lakewood Park are $46,695 for men and $36,896 for women, a difference of 21.0%. Men with an educational attainment of graduate degree enjoy the highest average annual earnings of $79,698, while those with bachelor's degree education earn the least with $34,648. Women with an educational attainment of bachelor's degree earn the most with the average annual earnings of $40,161, while those with less than high school education have the smallest earnings of $28,438.
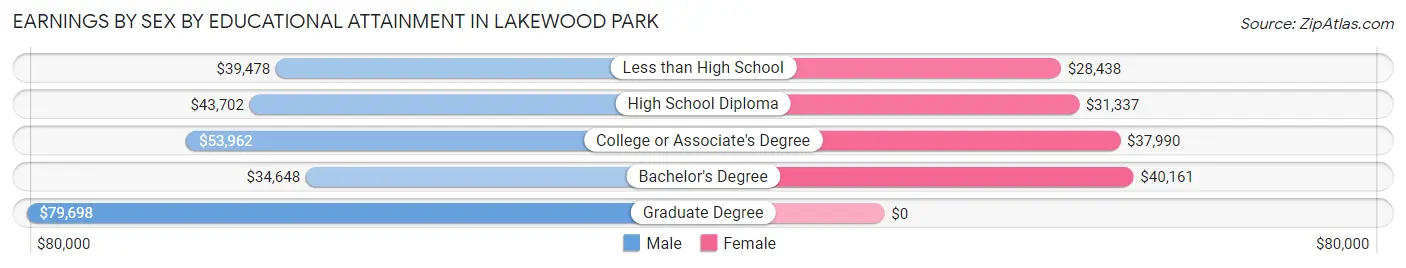
| Educational Attainment | Male Income | Female Income |
| Less than High School | $39,478 | $28,438 |
| High School Diploma | $43,702 | $31,337 |
| College or Associate's Degree | $53,962 | $37,990 |
| Bachelor's Degree | $34,648 | $40,161 |
| Graduate Degree | $79,698 | $0 |
| Total | $46,695 | $36,896 |
Family Income in Lakewood Park
Family Income Brackets in Lakewood Park
According to the Lakewood Park family income data, there are 904 families falling into the $50,000 to $74,999 income range, which is the most common income bracket and makes up 27.1% of all families. Conversely, the $10,000 to $14,999 income bracket is the least frequent group with only 43 families (1.3%) belonging to this category.
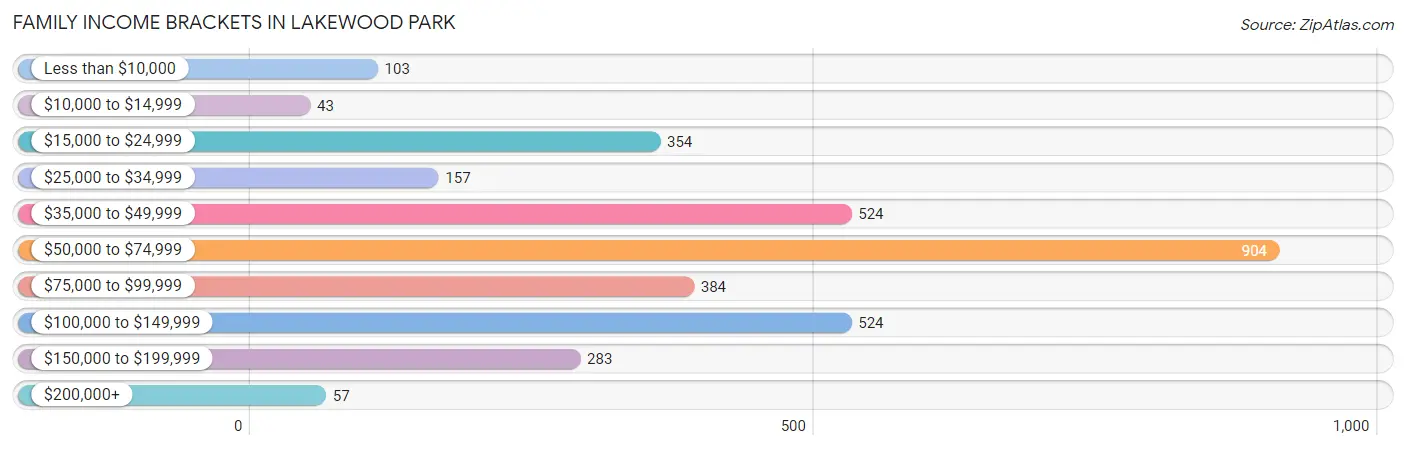
| Income Bracket | # Families | % Families |
| Less than $10,000 | 103 | 3.1% |
| $10,000 to $14,999 | 43 | 1.3% |
| $15,000 to $24,999 | 354 | 10.6% |
| $25,000 to $34,999 | 157 | 4.7% |
| $35,000 to $49,999 | 524 | 15.7% |
| $50,000 to $74,999 | 904 | 27.1% |
| $75,000 to $99,999 | 384 | 11.5% |
| $100,000 to $149,999 | 524 | 15.7% |
| $150,000 to $199,999 | 283 | 8.5% |
| $200,000+ | 57 | 1.7% |
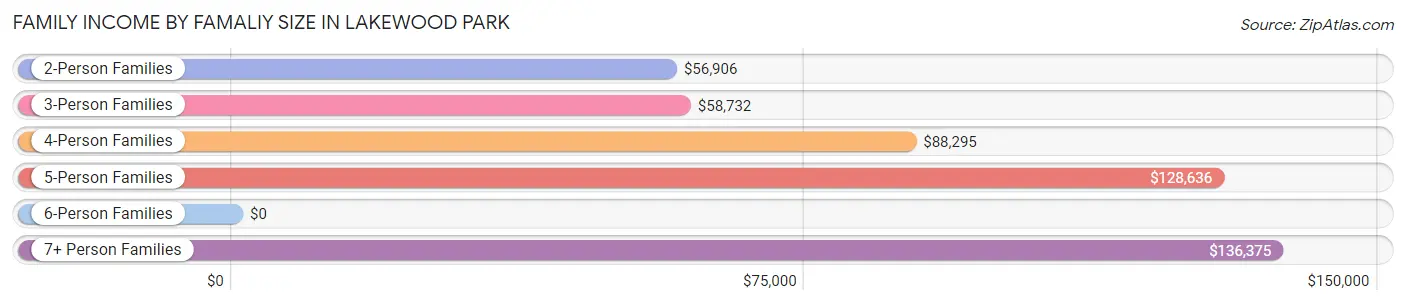
Family Income by Famaliy Size in Lakewood Park
7+ person families (115 | 3.5%) account for the highest median family income in Lakewood Park with $136,375 per family, while 2-person families (2,039 | 61.1%) have the highest median income of $28,453 per family member.
| Income Bracket | # Families | Median Income |
| 2-Person Families | 2,039 (61.1%) | $56,906 |
| 3-Person Families | 681 (20.4%) | $58,732 |
| 4-Person Families | 262 (7.9%) | $88,295 |
| 5-Person Families | 162 (4.9%) | $128,636 |
| 6-Person Families | 76 (2.3%) | $0 |
| 7+ Person Families | 115 (3.5%) | $136,375 |
| Total | 3,335 (100.0%) | $63,158 |
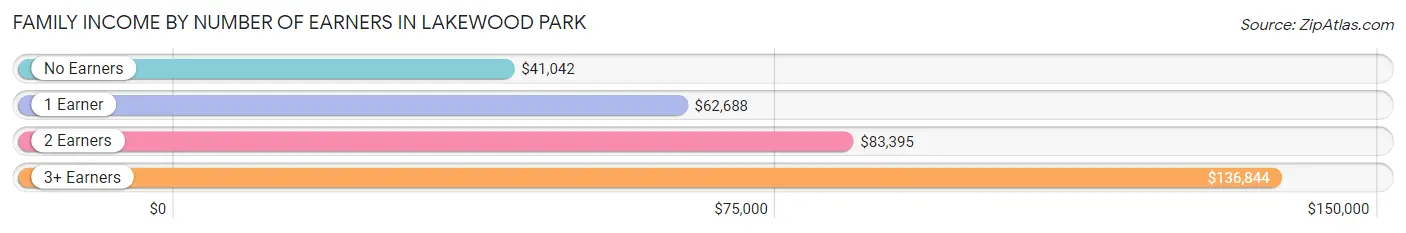
Family Income by Number of Earners in Lakewood Park
The median family income in Lakewood Park is $63,158, with families comprising 3+ earners (496) having the highest median family income of $136,844, while families with no earners (792) have the lowest median family income of $41,042, accounting for 14.9% and 23.7% of families, respectively.
| Number of Earners | # Families | Median Income |
| No Earners | 792 (23.7%) | $41,042 |
| 1 Earner | 1,303 (39.1%) | $62,688 |
| 2 Earners | 744 (22.3%) | $83,395 |
| 3+ Earners | 496 (14.9%) | $136,844 |
| Total | 3,335 (100.0%) | $63,158 |
Household Income in Lakewood Park
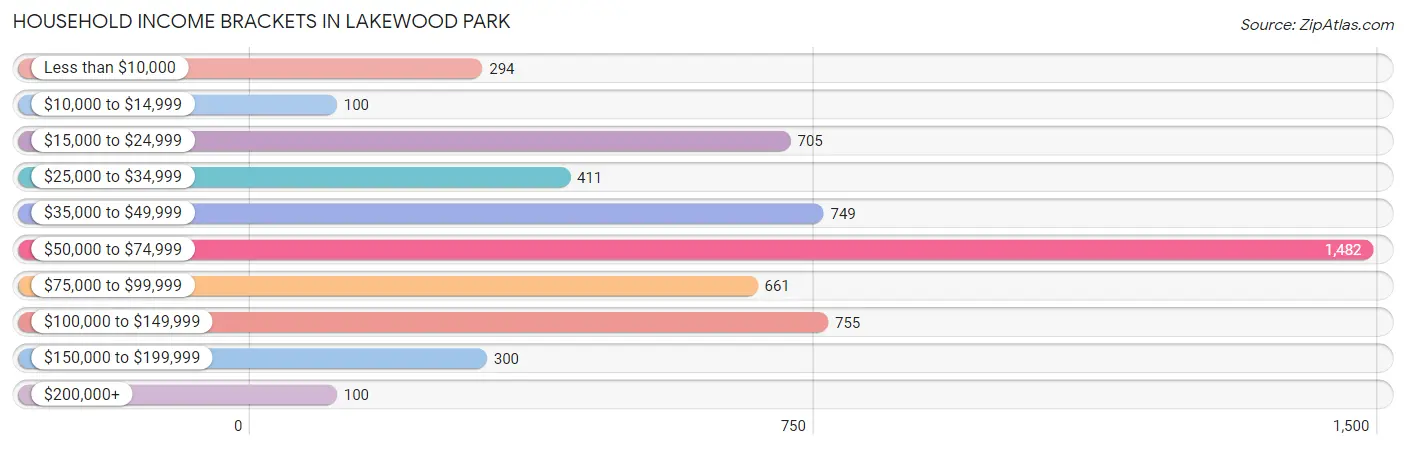
Household Income Brackets in Lakewood Park
With 1,482 households falling in the category, the $50,000 to $74,999 income range is the most frequent in Lakewood Park, accounting for 26.7% of all households. In contrast, only 100 households (1.8%) fall into the $10,000 to $14,999 income bracket, making it the least populous group.
| Income Bracket | # Households | % Households |
| Less than $10,000 | 294 | 5.3% |
| $10,000 to $14,999 | 100 | 1.8% |
| $15,000 to $24,999 | 705 | 12.7% |
| $25,000 to $34,999 | 411 | 7.4% |
| $35,000 to $49,999 | 749 | 13.5% |
| $50,000 to $74,999 | 1,482 | 26.7% |
| $75,000 to $99,999 | 661 | 11.9% |
| $100,000 to $149,999 | 755 | 13.6% |
| $150,000 to $199,999 | 300 | 5.4% |
| $200,000+ | 100 | 1.8% |
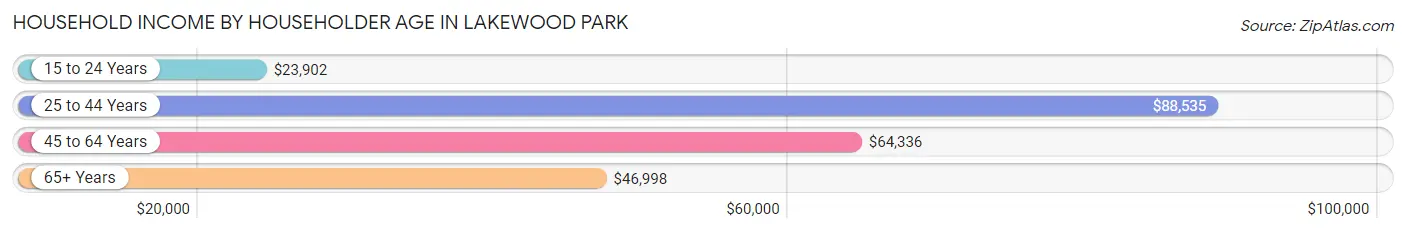
Household Income by Householder Age in Lakewood Park
The median household income in Lakewood Park is $58,004, with the highest median household income of $88,535 found in the 25 to 44 years age bracket for the primary householder. A total of 1,035 households (18.6%) fall into this category. Meanwhile, the 15 to 24 years age bracket for the primary householder has the lowest median household income of $23,902, with 257 households (4.6%) in this group.
| Income Bracket | # Households | Median Income |
| 15 to 24 Years | 257 (4.6%) | $23,902 |
| 25 to 44 Years | 1,035 (18.6%) | $88,535 |
| 45 to 64 Years | 1,856 (33.4%) | $64,336 |
| 65+ Years | 2,403 (43.3%) | $46,998 |
| Total | 5,551 (100.0%) | $58,004 |
Poverty in Lakewood Park
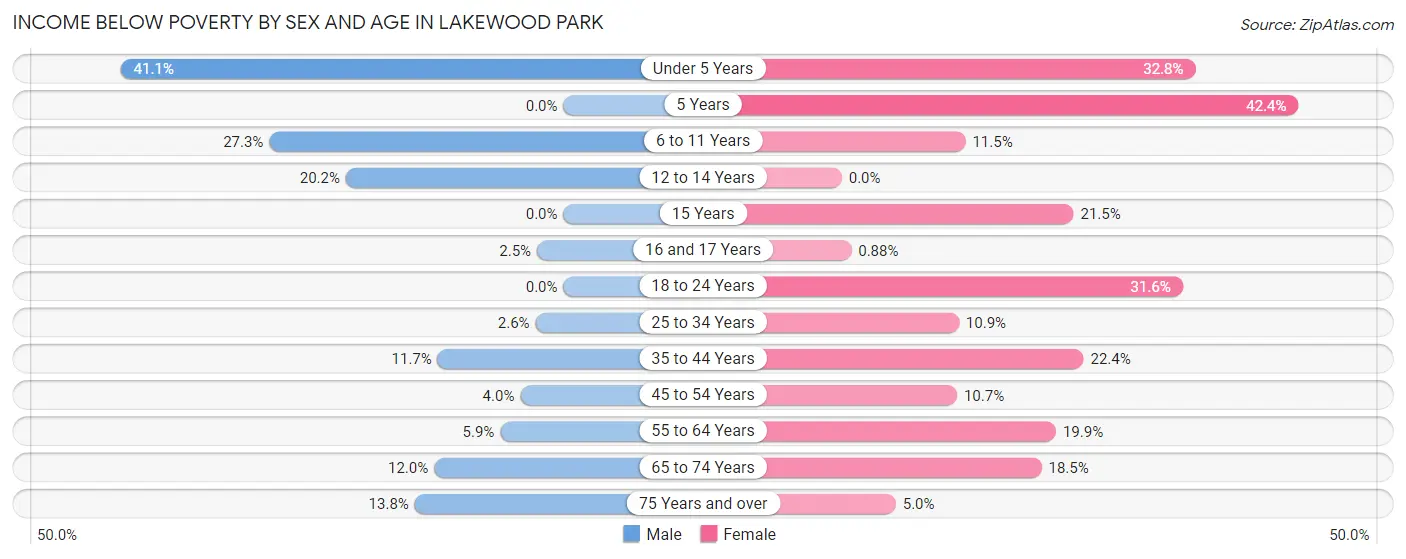
Income Below Poverty by Sex and Age in Lakewood Park
With 10.9% poverty level for males and 17.7% for females among the residents of Lakewood Park, under 5 year old males and 5 year old females are the most vulnerable to poverty, with 182 males (41.1%) and 25 females (42.4%) in their respective age groups living below the poverty level.
| Age Bracket | Male | Female |
| Under 5 Years | 182 (41.1%) | 125 (32.8%) |
| 5 Years | 0 (0.0%) | 25 (42.4%) |
| 6 to 11 Years | 83 (27.3%) | 28 (11.5%) |
| 12 to 14 Years | 42 (20.2%) | 0 (0.0%) |
| 15 Years | 0 (0.0%) | 20 (21.5%) |
| 16 and 17 Years | 4 (2.5%) | 1 (0.9%) |
| 18 to 24 Years | 0 (0.0%) | 223 (31.6%) |
| 25 to 34 Years | 14 (2.6%) | 69 (10.9%) |
| 35 to 44 Years | 97 (11.7%) | 151 (22.4%) |
| 45 to 54 Years | 35 (4.0%) | 48 (10.7%) |
| 55 to 64 Years | 67 (5.9%) | 330 (19.9%) |
| 65 to 74 Years | 108 (12.0%) | 186 (18.5%) |
| 75 Years and over | 135 (13.8%) | 41 (5.0%) |
| Total | 767 (10.9%) | 1,247 (17.7%) |
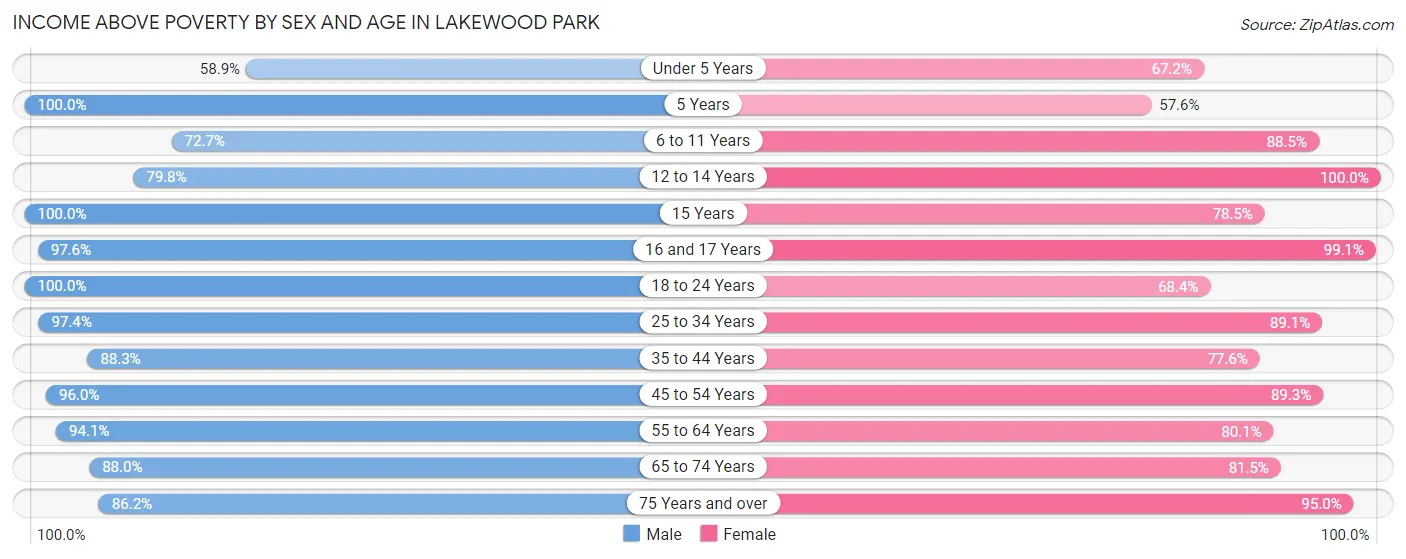
Income Above Poverty by Sex and Age in Lakewood Park
According to the poverty statistics in Lakewood Park, males aged 5 years and females aged 12 to 14 years are the age groups that are most secure financially, with 100.0% of males and 100.0% of females in these age groups living above the poverty line.
| Age Bracket | Male | Female |
| Under 5 Years | 261 (58.9%) | 256 (67.2%) |
| 5 Years | 118 (100.0%) | 34 (57.6%) |
| 6 to 11 Years | 221 (72.7%) | 216 (88.5%) |
| 12 to 14 Years | 166 (79.8%) | 202 (100.0%) |
| 15 Years | 30 (100.0%) | 73 (78.5%) |
| 16 and 17 Years | 159 (97.6%) | 112 (99.1%) |
| 18 to 24 Years | 486 (100.0%) | 482 (68.4%) |
| 25 to 34 Years | 526 (97.4%) | 566 (89.1%) |
| 35 to 44 Years | 734 (88.3%) | 522 (77.6%) |
| 45 to 54 Years | 839 (96.0%) | 401 (89.3%) |
| 55 to 64 Years | 1,077 (94.1%) | 1,330 (80.1%) |
| 65 to 74 Years | 792 (88.0%) | 817 (81.5%) |
| 75 Years and over | 843 (86.2%) | 777 (95.0%) |
| Total | 6,252 (89.1%) | 5,788 (82.3%) |
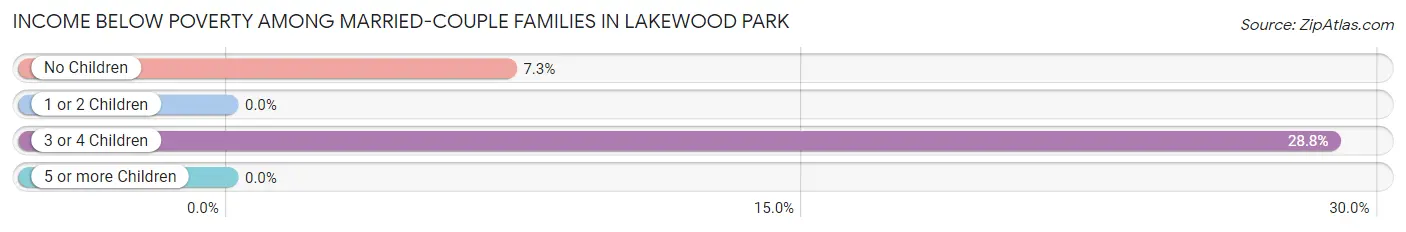
Income Below Poverty Among Married-Couple Families in Lakewood Park
The poverty statistics for married-couple families in Lakewood Park show that 7.4% or 179 of the total 2,407 families live below the poverty line. Families with 3 or 4 children have the highest poverty rate of 28.8%, comprising of 40 families. On the other hand, families with 1 or 2 children have the lowest poverty rate of 0.0%, which includes 0 families.
| Children | Above Poverty | Below Poverty |
| No Children | 1,773 (92.7%) | 139 (7.3%) |
| 1 or 2 Children | 329 (100.0%) | 0 (0.0%) |
| 3 or 4 Children | 99 (71.2%) | 40 (28.8%) |
| 5 or more Children | 27 (100.0%) | 0 (0.0%) |
| Total | 2,228 (92.6%) | 179 (7.4%) |
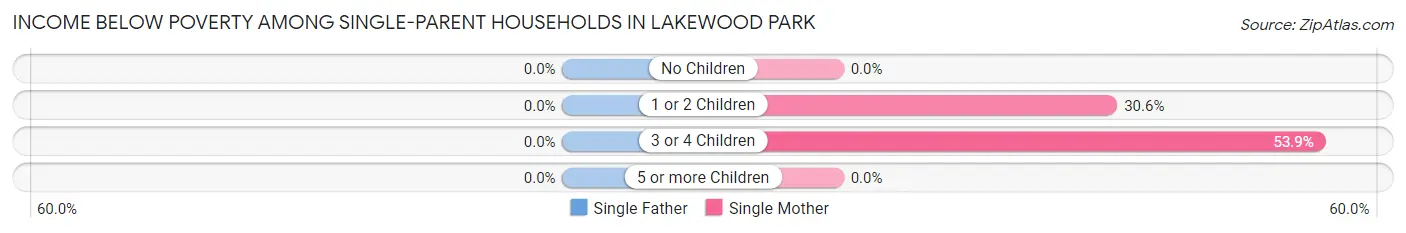
Income Below Poverty Among Single-Parent Households in Lakewood Park
| Children | Single Father | Single Mother |
| No Children | 0 (0.0%) | 0 (0.0%) |
| 1 or 2 Children | 0 (0.0%) | 107 (30.6%) |
| 3 or 4 Children | 0 (0.0%) | 21 (53.8%) |
| 5 or more Children | 0 (0.0%) | 0 (0.0%) |
| Total | 0 (0.0%) | 128 (20.1%) |
Income Below Poverty Among Married-Couple vs Single-Parent Households in Lakewood Park
The poverty data for Lakewood Park shows that 179 of the married-couple family households (7.4%) and 128 of the single-parent households (13.8%) are living below the poverty level. Within the married-couple family households, those with 3 or 4 children have the highest poverty rate, with 40 households (28.8%) falling below the poverty line. Among the single-parent households, those with 3 or 4 children have the highest poverty rate, with 21 household (53.8%) living below poverty.
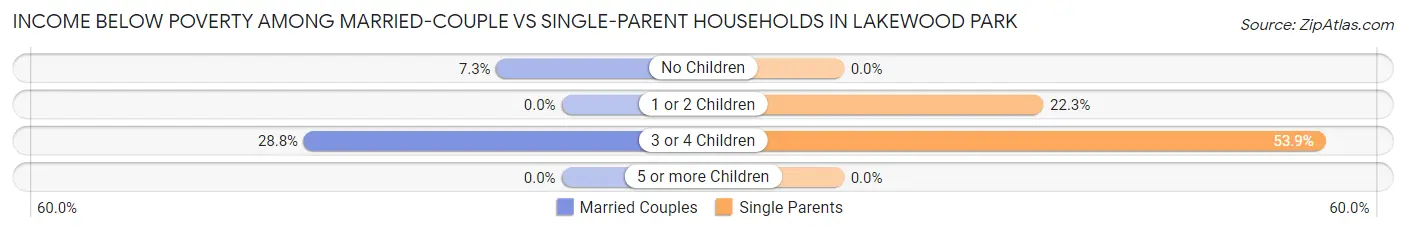
| Children | Married-Couple Families | Single-Parent Households |
| No Children | 139 (7.3%) | 0 (0.0%) |
| 1 or 2 Children | 0 (0.0%) | 107 (22.3%) |
| 3 or 4 Children | 40 (28.8%) | 21 (53.8%) |
| 5 or more Children | 0 (0.0%) | 0 (0.0%) |
| Total | 179 (7.4%) | 128 (13.8%) |
Employment Characteristics in Lakewood Park
Employment by Class of Employer in Lakewood Park
Among the 6,092 employed individuals in Lakewood Park, private company employees (3,850 | 63.2%), not-for-profit organizations (713 | 11.7%), and local government employees (575 | 9.4%) make up the most common classes of employment.
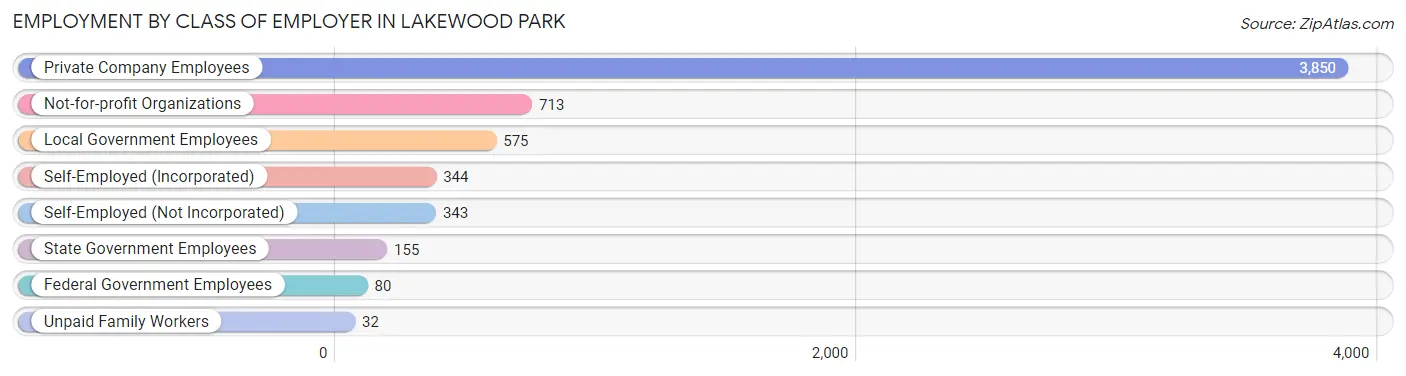
| Employer Class | # Employees | % Employees |
| Private Company Employees | 3,850 | 63.2% |
| Self-Employed (Incorporated) | 344 | 5.7% |
| Self-Employed (Not Incorporated) | 343 | 5.6% |
| Not-for-profit Organizations | 713 | 11.7% |
| Local Government Employees | 575 | 9.4% |
| State Government Employees | 155 | 2.5% |
| Federal Government Employees | 80 | 1.3% |
| Unpaid Family Workers | 32 | 0.5% |
| Total | 6,092 | 100.0% |
Employment Status by Age in Lakewood Park
According to the labor force statistics for Lakewood Park, out of the total population over 16 years of age (11,972), 54.8% or 6,561 individuals are in the labor force, with 3.8% or 249 of them unemployed. The age group with the highest labor force participation rate is 25 to 29 years, with 95.7% or 534 individuals in the labor force. Within the labor force, the 16 to 19 years age range has the highest percentage of unemployed individuals, with 48.0% or 61 of them being unemployed.
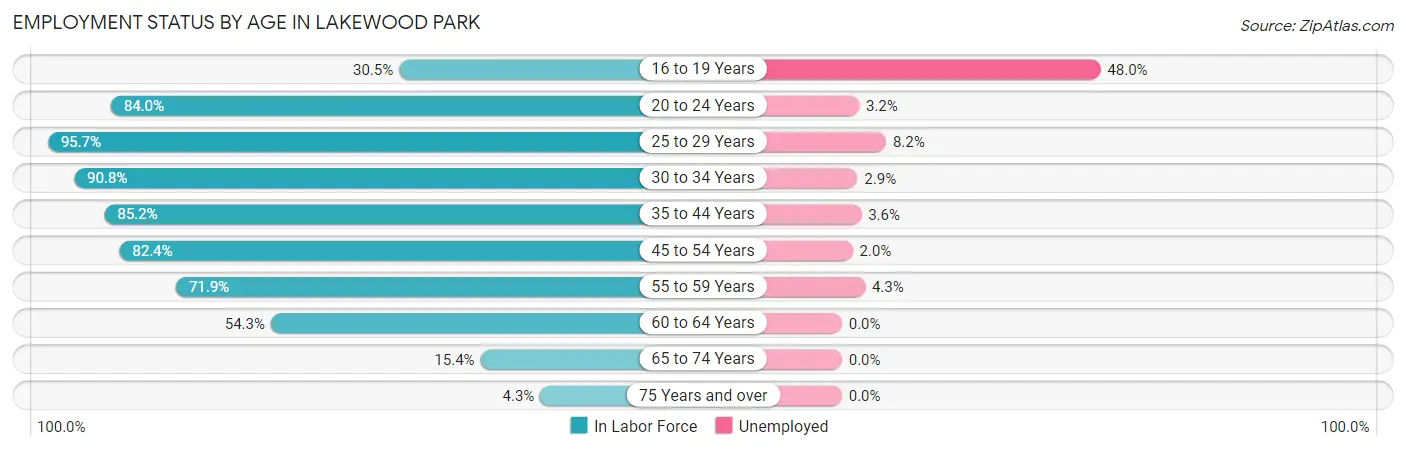
| Age Bracket | In Labor Force | Unemployed |
| 16 to 19 Years | 127 (30.5%) | 61 (48.0%) |
| 20 to 24 Years | 882 (84.0%) | 28 (3.2%) |
| 25 to 29 Years | 534 (95.7%) | 44 (8.2%) |
| 30 to 34 Years | 560 (90.8%) | 16 (2.9%) |
| 35 to 44 Years | 1,281 (85.2%) | 46 (3.6%) |
| 45 to 54 Years | 1,090 (82.4%) | 22 (2.0%) |
| 55 to 59 Years | 774 (71.9%) | 33 (4.3%) |
| 60 to 64 Years | 938 (54.3%) | 0 (0.0%) |
| 65 to 74 Years | 293 (15.4%) | 0 (0.0%) |
| 75 Years and over | 77 (4.3%) | 0 (0.0%) |
| Total | 6,561 (54.8%) | 249 (3.8%) |
Employment Status by Educational Attainment in Lakewood Park
According to labor force statistics for Lakewood Park, 76.1% of individuals (5,179) out of the total population between 25 and 64 years of age (6,806) are in the labor force, with 3.1% or 161 of them being unemployed. The group with the highest labor force participation rate are those with the educational attainment of bachelor's degree or higher, with 89.7% or 1,055 individuals in the labor force. Within the labor force, individuals with less than high school education have the highest percentage of unemployment, with 12.2% or 62 of them being unemployed.
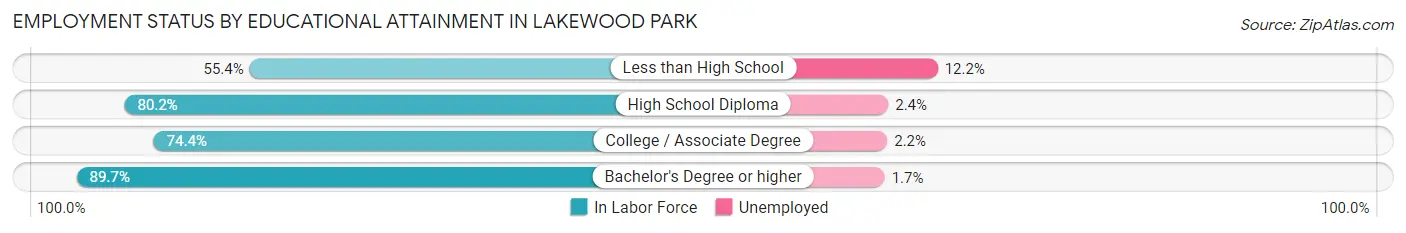
| Educational Attainment | In Labor Force | Unemployed |
| Less than High School | 508 (55.4%) | 112 (12.2%) |
| High School Diploma | 1,478 (80.2%) | 44 (2.4%) |
| College / Associate Degree | 2,135 (74.4%) | 63 (2.2%) |
| Bachelor's Degree or higher | 1,055 (89.7%) | 20 (1.7%) |
| Total | 5,179 (76.1%) | 211 (3.1%) |
Employment Occupations by Sex in Lakewood Park
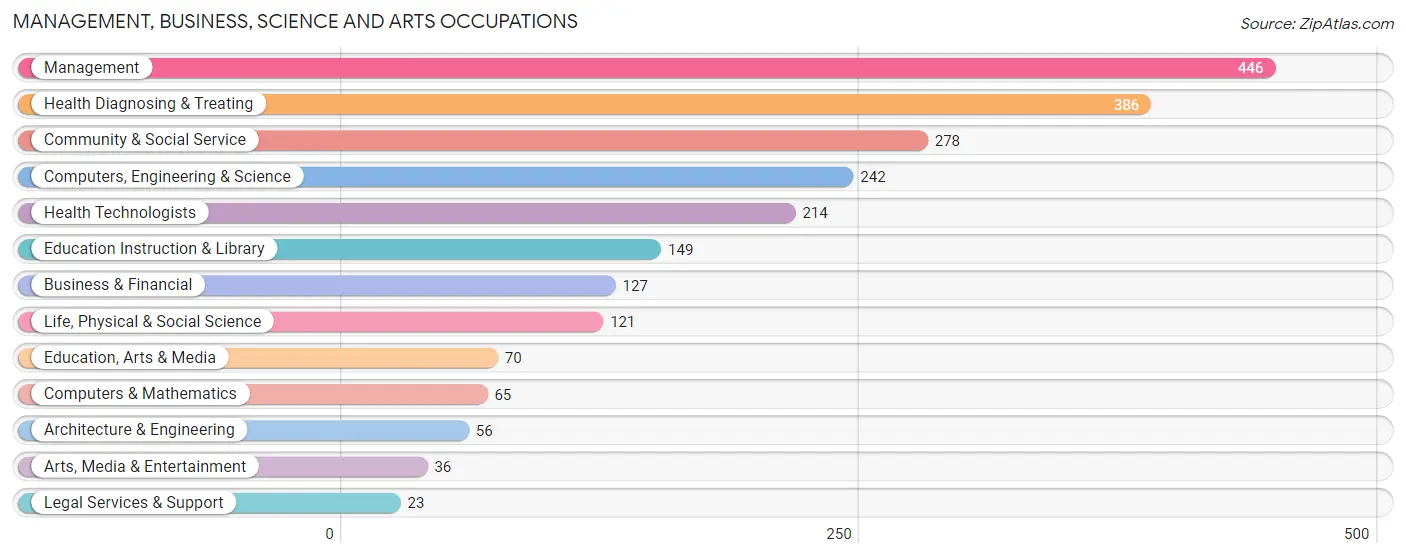
Management, Business, Science and Arts Occupations
The most common Management, Business, Science and Arts occupations in Lakewood Park are Management (446 | 7.1%), Health Diagnosing & Treating (386 | 6.1%), Community & Social Service (278 | 4.4%), Computers, Engineering & Science (242 | 3.8%), and Health Technologists (214 | 3.4%).
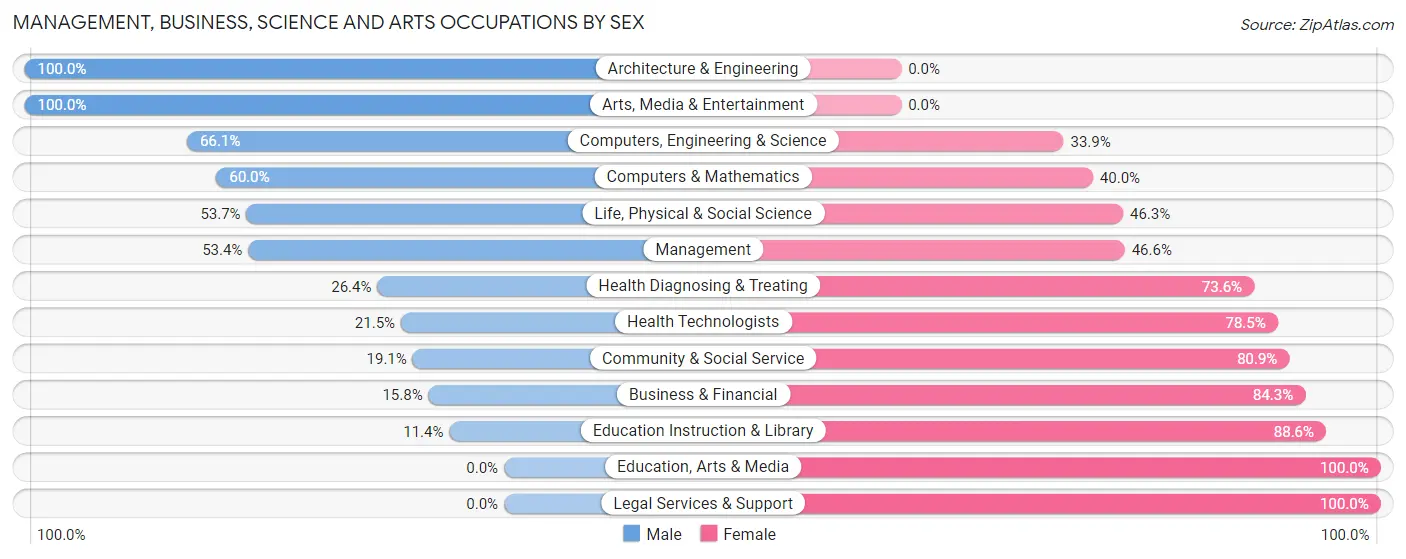
Management, Business, Science and Arts Occupations by Sex
Within the Management, Business, Science and Arts occupations in Lakewood Park, the most male-oriented occupations are Architecture & Engineering (100.0%), Arts, Media & Entertainment (100.0%), and Computers, Engineering & Science (66.1%), while the most female-oriented occupations are Education, Arts & Media (100.0%), Legal Services & Support (100.0%), and Education Instruction & Library (88.6%).
| Occupation | Male | Female |
| Management | 238 (53.4%) | 208 (46.6%) |
| Business & Financial | 20 (15.8%) | 107 (84.3%) |
| Computers, Engineering & Science | 160 (66.1%) | 82 (33.9%) |
| Computers & Mathematics | 39 (60.0%) | 26 (40.0%) |
| Architecture & Engineering | 56 (100.0%) | 0 (0.0%) |
| Life, Physical & Social Science | 65 (53.7%) | 56 (46.3%) |
| Community & Social Service | 53 (19.1%) | 225 (80.9%) |
| Education, Arts & Media | 0 (0.0%) | 70 (100.0%) |
| Legal Services & Support | 0 (0.0%) | 23 (100.0%) |
| Education Instruction & Library | 17 (11.4%) | 132 (88.6%) |
| Arts, Media & Entertainment | 36 (100.0%) | 0 (0.0%) |
| Health Diagnosing & Treating | 102 (26.4%) | 284 (73.6%) |
| Health Technologists | 46 (21.5%) | 168 (78.5%) |
| Total (Category) | 573 (38.7%) | 906 (61.3%) |
| Total (Overall) | 3,176 (50.5%) | 3,107 (49.4%) |
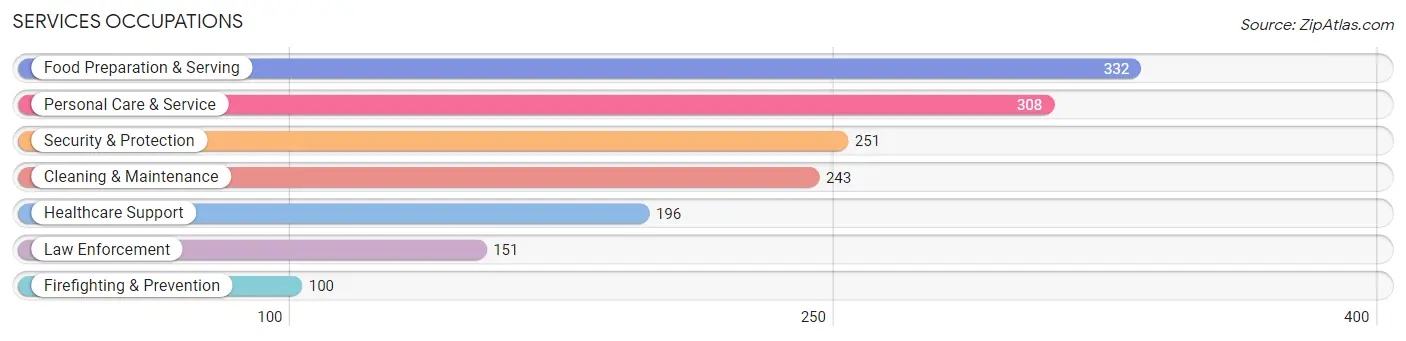
Services Occupations
The most common Services occupations in Lakewood Park are Food Preparation & Serving (332 | 5.3%), Personal Care & Service (308 | 4.9%), Security & Protection (251 | 4.0%), Cleaning & Maintenance (243 | 3.9%), and Healthcare Support (196 | 3.1%).
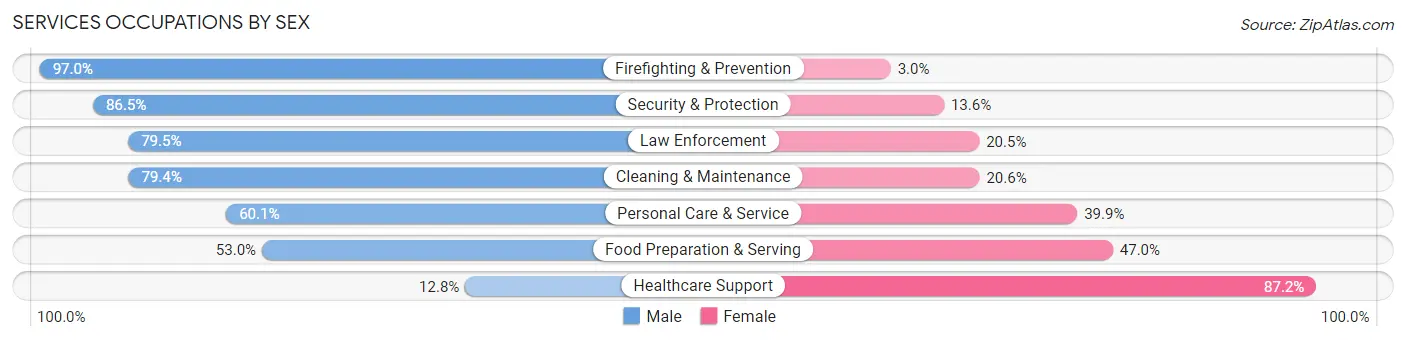
Services Occupations by Sex
Within the Services occupations in Lakewood Park, the most male-oriented occupations are Firefighting & Prevention (97.0%), Security & Protection (86.5%), and Law Enforcement (79.5%), while the most female-oriented occupations are Healthcare Support (87.2%), Food Preparation & Serving (47.0%), and Personal Care & Service (39.9%).
| Occupation | Male | Female |
| Healthcare Support | 25 (12.8%) | 171 (87.2%) |
| Security & Protection | 217 (86.5%) | 34 (13.6%) |
| Firefighting & Prevention | 97 (97.0%) | 3 (3.0%) |
| Law Enforcement | 120 (79.5%) | 31 (20.5%) |
| Food Preparation & Serving | 176 (53.0%) | 156 (47.0%) |
| Cleaning & Maintenance | 193 (79.4%) | 50 (20.6%) |
| Personal Care & Service | 185 (60.1%) | 123 (39.9%) |
| Total (Category) | 796 (59.9%) | 534 (40.2%) |
| Total (Overall) | 3,176 (50.5%) | 3,107 (49.4%) |
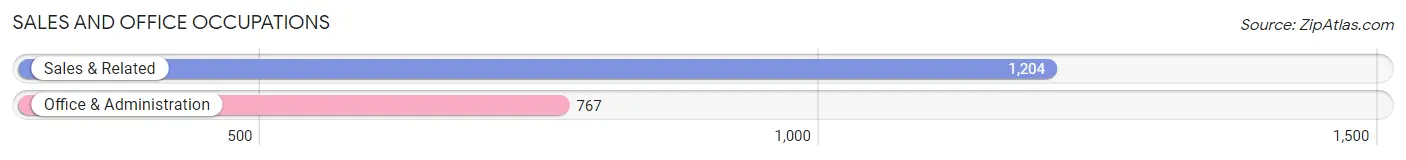
Sales and Office Occupations
The most common Sales and Office occupations in Lakewood Park are Sales & Related (1,204 | 19.2%), and Office & Administration (767 | 12.2%).
Sales and Office Occupations by Sex
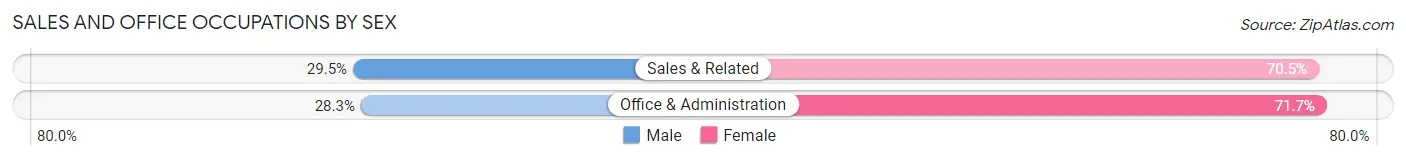
| Occupation | Male | Female |
| Sales & Related | 355 (29.5%) | 849 (70.5%) |
| Office & Administration | 217 (28.3%) | 550 (71.7%) |
| Total (Category) | 572 (29.0%) | 1,399 (71.0%) |
| Total (Overall) | 3,176 (50.5%) | 3,107 (49.4%) |
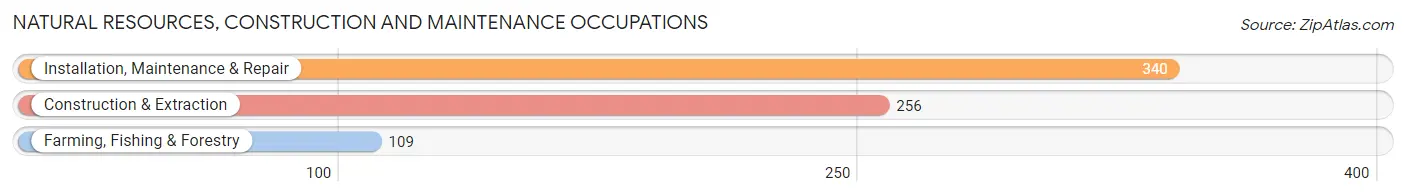
Natural Resources, Construction and Maintenance Occupations
The most common Natural Resources, Construction and Maintenance occupations in Lakewood Park are Installation, Maintenance & Repair (340 | 5.4%), Construction & Extraction (256 | 4.1%), and Farming, Fishing & Forestry (109 | 1.7%).
Natural Resources, Construction and Maintenance Occupations by Sex
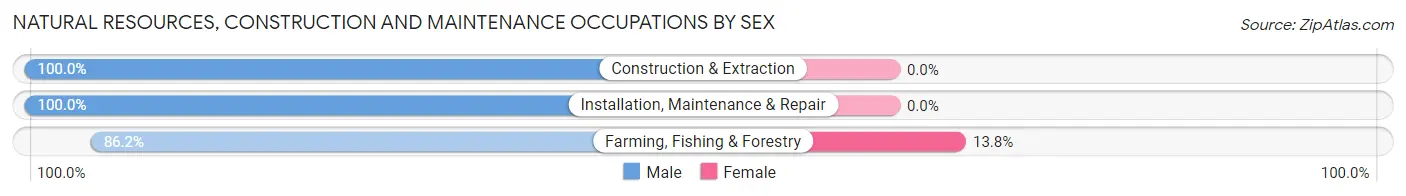
| Occupation | Male | Female |
| Farming, Fishing & Forestry | 94 (86.2%) | 15 (13.8%) |
| Construction & Extraction | 256 (100.0%) | 0 (0.0%) |
| Installation, Maintenance & Repair | 340 (100.0%) | 0 (0.0%) |
| Total (Category) | 690 (97.9%) | 15 (2.1%) |
| Total (Overall) | 3,176 (50.5%) | 3,107 (49.4%) |
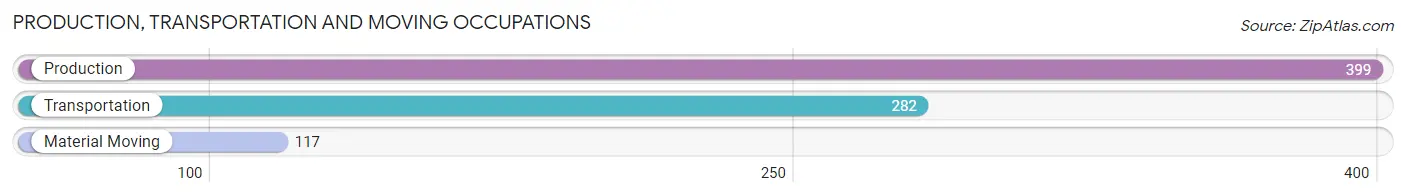
Production, Transportation and Moving Occupations
The most common Production, Transportation and Moving occupations in Lakewood Park are Production (399 | 6.4%), Transportation (282 | 4.5%), and Material Moving (117 | 1.9%).
Production, Transportation and Moving Occupations by Sex
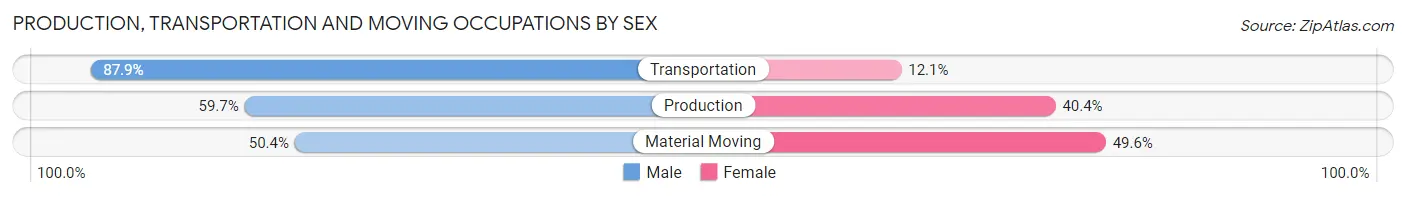
| Occupation | Male | Female |
| Production | 238 (59.7%) | 161 (40.4%) |
| Transportation | 248 (87.9%) | 34 (12.1%) |
| Material Moving | 59 (50.4%) | 58 (49.6%) |
| Total (Category) | 545 (68.3%) | 253 (31.7%) |
| Total (Overall) | 3,176 (50.5%) | 3,107 (49.4%) |
Employment Industries by Sex in Lakewood Park
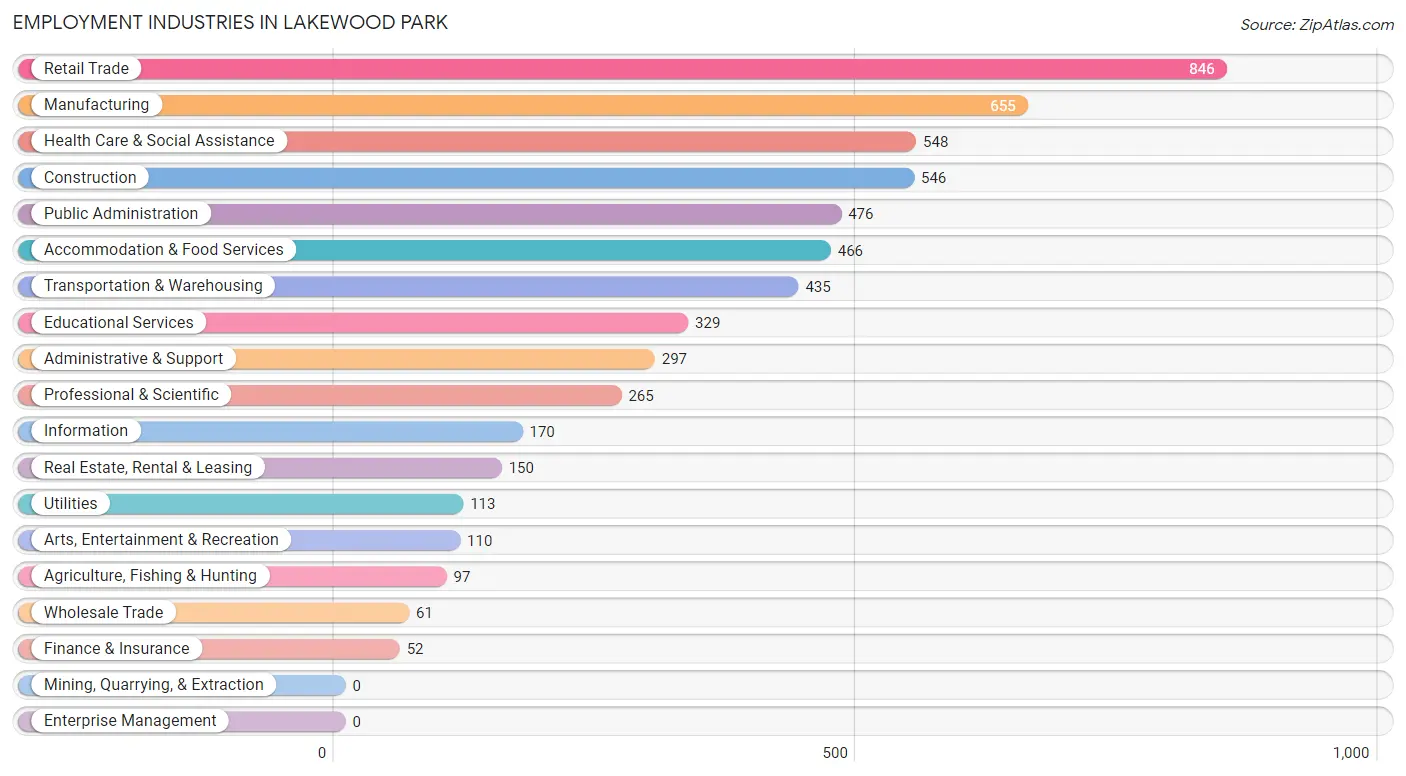
Employment Industries in Lakewood Park
The major employment industries in Lakewood Park include Retail Trade (846 | 13.5%), Manufacturing (655 | 10.4%), Health Care & Social Assistance (548 | 8.7%), Construction (546 | 8.7%), and Public Administration (476 | 7.6%).
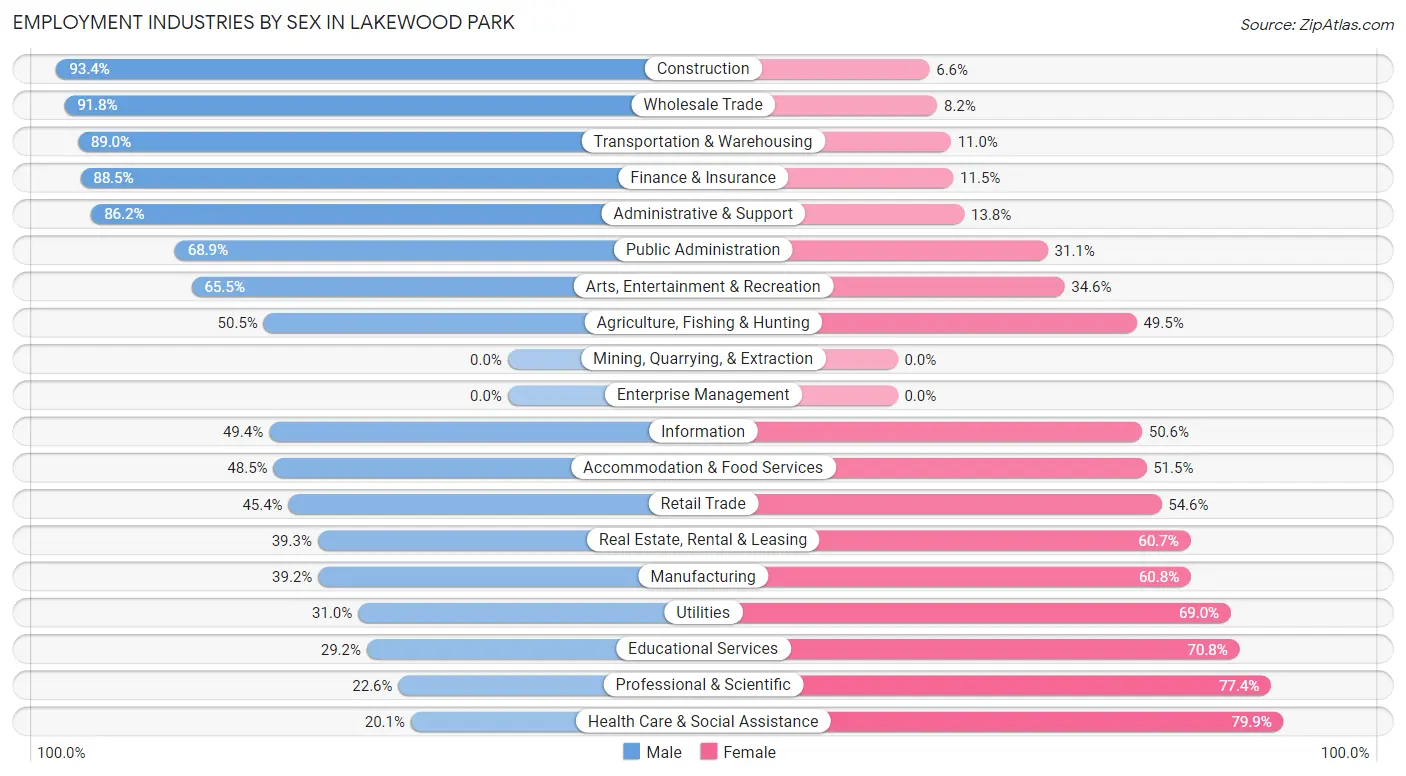
Employment Industries by Sex in Lakewood Park
The Lakewood Park industries that see more men than women are Construction (93.4%), Wholesale Trade (91.8%), and Transportation & Warehousing (89.0%), whereas the industries that tend to have a higher number of women are Health Care & Social Assistance (79.9%), Professional & Scientific (77.4%), and Educational Services (70.8%).
| Industry | Male | Female |
| Agriculture, Fishing & Hunting | 49 (50.5%) | 48 (49.5%) |
| Mining, Quarrying, & Extraction | 0 (0.0%) | 0 (0.0%) |
| Construction | 510 (93.4%) | 36 (6.6%) |
| Manufacturing | 257 (39.2%) | 398 (60.8%) |
| Wholesale Trade | 56 (91.8%) | 5 (8.2%) |
| Retail Trade | 384 (45.4%) | 462 (54.6%) |
| Transportation & Warehousing | 387 (89.0%) | 48 (11.0%) |
| Utilities | 35 (31.0%) | 78 (69.0%) |
| Information | 84 (49.4%) | 86 (50.6%) |
| Finance & Insurance | 46 (88.5%) | 6 (11.5%) |
| Real Estate, Rental & Leasing | 59 (39.3%) | 91 (60.7%) |
| Professional & Scientific | 60 (22.6%) | 205 (77.4%) |
| Enterprise Management | 0 (0.0%) | 0 (0.0%) |
| Administrative & Support | 256 (86.2%) | 41 (13.8%) |
| Educational Services | 96 (29.2%) | 233 (70.8%) |
| Health Care & Social Assistance | 110 (20.1%) | 438 (79.9%) |
| Arts, Entertainment & Recreation | 72 (65.4%) | 38 (34.5%) |
| Accommodation & Food Services | 226 (48.5%) | 240 (51.5%) |
| Public Administration | 328 (68.9%) | 148 (31.1%) |
| Total | 3,176 (50.5%) | 3,107 (49.4%) |
Education in Lakewood Park
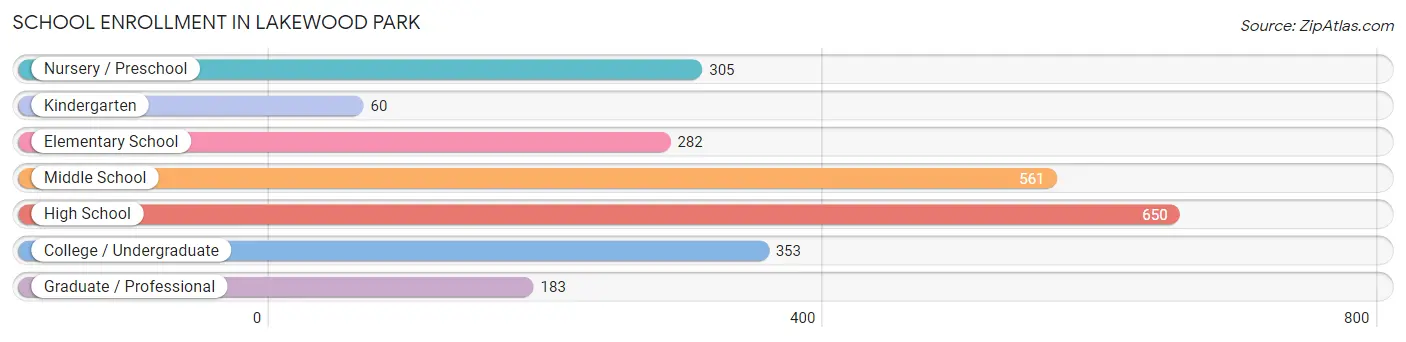
School Enrollment in Lakewood Park
The most common levels of schooling among the 2,394 students in Lakewood Park are high school (650 | 27.2%), middle school (561 | 23.4%), and college / undergraduate (353 | 14.7%).
| School Level | # Students | % Students |
| Nursery / Preschool | 305 | 12.7% |
| Kindergarten | 60 | 2.5% |
| Elementary School | 282 | 11.8% |
| Middle School | 561 | 23.4% |
| High School | 650 | 27.2% |
| College / Undergraduate | 353 | 14.7% |
| Graduate / Professional | 183 | 7.6% |
| Total | 2,394 | 100.0% |
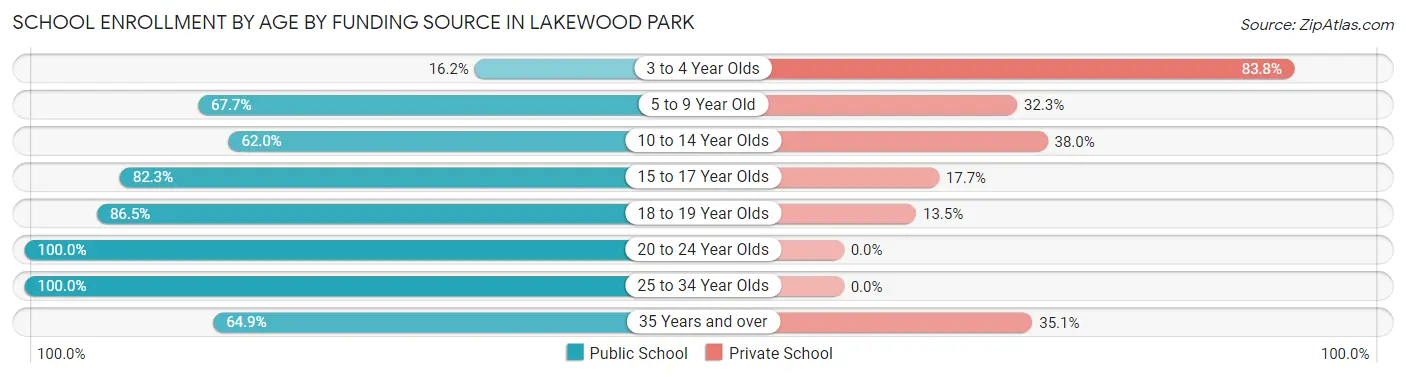
School Enrollment by Age by Funding Source in Lakewood Park
Out of a total of 2,394 students who are enrolled in schools in Lakewood Park, 730 (30.5%) attend a private institution, while the remaining 1,664 (69.5%) are enrolled in public schools. The age group of 3 to 4 year olds has the highest likelihood of being enrolled in private schools, with 192 (83.8% in the age bracket) enrolled. Conversely, the age group of 20 to 24 year olds has the lowest likelihood of being enrolled in a private school, with 258 (100.0% in the age bracket) attending a public institution.
| Age Bracket | Public School | Private School |
| 3 to 4 Year Olds | 37 (16.2%) | 192 (83.8%) |
| 5 to 9 Year Old | 283 (67.7%) | 135 (32.3%) |
| 10 to 14 Year Olds | 449 (62.0%) | 275 (38.0%) |
| 15 to 17 Year Olds | 320 (82.3%) | 69 (17.7%) |
| 18 to 19 Year Olds | 122 (86.5%) | 19 (13.5%) |
| 20 to 24 Year Olds | 258 (100.0%) | 0 (0.0%) |
| 25 to 34 Year Olds | 124 (100.0%) | 0 (0.0%) |
| 35 Years and over | 72 (64.9%) | 39 (35.1%) |
| Total | 1,664 (69.5%) | 730 (30.5%) |
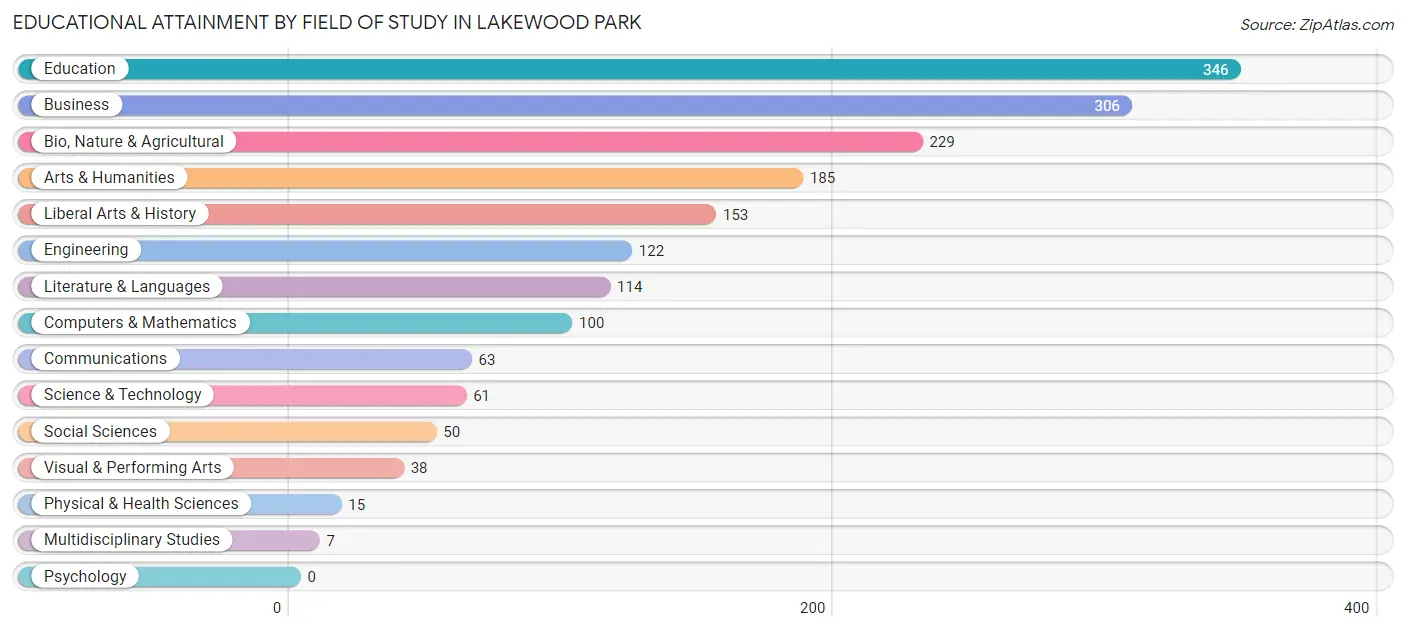
Educational Attainment by Field of Study in Lakewood Park
Education (346 | 19.3%), business (306 | 17.1%), bio, nature & agricultural (229 | 12.8%), arts & humanities (185 | 10.3%), and liberal arts & history (153 | 8.6%) are the most common fields of study among 1,789 individuals in Lakewood Park who have obtained a bachelor's degree or higher.
| Field of Study | # Graduates | % Graduates |
| Computers & Mathematics | 100 | 5.6% |
| Bio, Nature & Agricultural | 229 | 12.8% |
| Physical & Health Sciences | 15 | 0.8% |
| Psychology | 0 | 0.0% |
| Social Sciences | 50 | 2.8% |
| Engineering | 122 | 6.8% |
| Multidisciplinary Studies | 7 | 0.4% |
| Science & Technology | 61 | 3.4% |
| Business | 306 | 17.1% |
| Education | 346 | 19.3% |
| Literature & Languages | 114 | 6.4% |
| Liberal Arts & History | 153 | 8.6% |
| Visual & Performing Arts | 38 | 2.1% |
| Communications | 63 | 3.5% |
| Arts & Humanities | 185 | 10.3% |
| Total | 1,789 | 100.0% |
Transportation & Commute in Lakewood Park
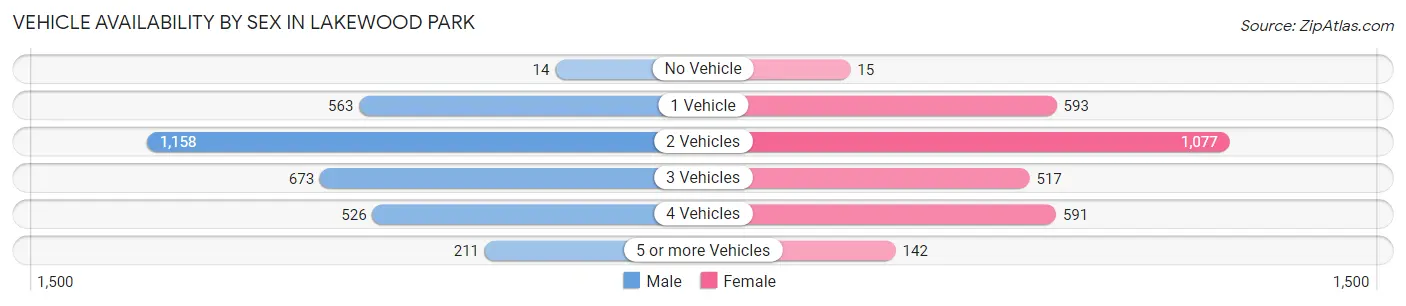
Vehicle Availability by Sex in Lakewood Park
The most prevalent vehicle ownership categories in Lakewood Park are males with 2 vehicles (1,158, accounting for 36.8%) and females with 2 vehicles (1,077, making up 39.5%).
| Vehicles Available | Male | Female |
| No Vehicle | 14 (0.4%) | 15 (0.5%) |
| 1 Vehicle | 563 (17.9%) | 593 (20.2%) |
| 2 Vehicles | 1,158 (36.8%) | 1,077 (36.7%) |
| 3 Vehicles | 673 (21.4%) | 517 (17.6%) |
| 4 Vehicles | 526 (16.7%) | 591 (20.1%) |
| 5 or more Vehicles | 211 (6.7%) | 142 (4.8%) |
| Total | 3,145 (100.0%) | 2,935 (100.0%) |
Commute Time in Lakewood Park
The most frequently occuring commute durations in Lakewood Park are 20 to 24 minutes (1,257 commuters, 21.4%), 30 to 34 minutes (1,018 commuters, 17.4%), and 15 to 19 minutes (805 commuters, 13.7%).
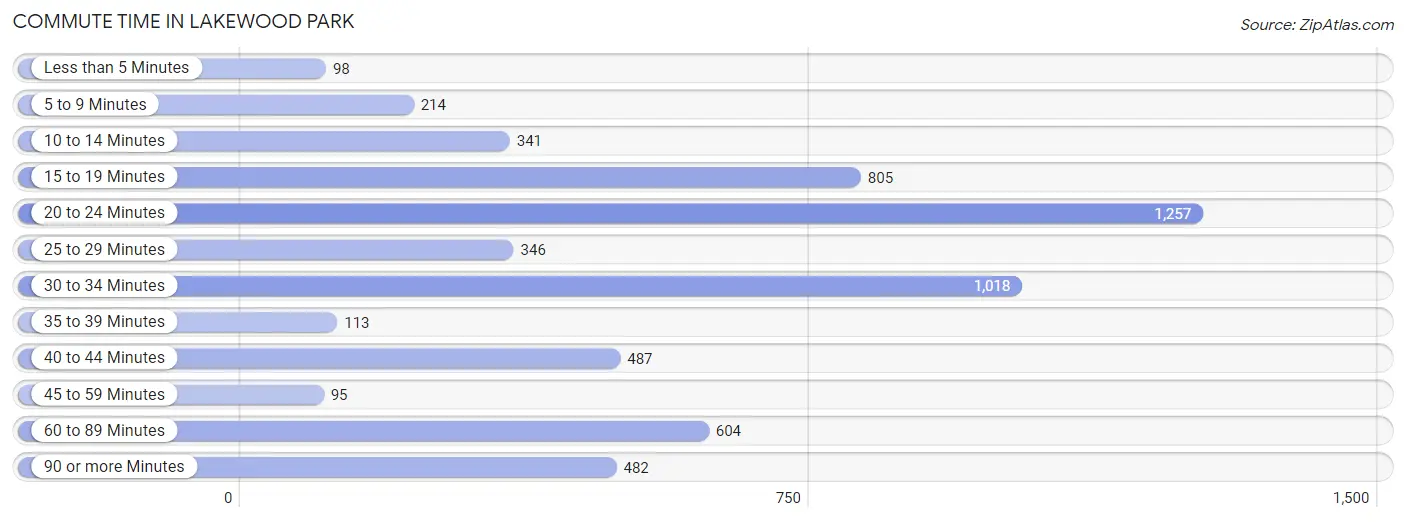
| Commute Time | # Commuters | % Commuters |
| Less than 5 Minutes | 98 | 1.7% |
| 5 to 9 Minutes | 214 | 3.6% |
| 10 to 14 Minutes | 341 | 5.8% |
| 15 to 19 Minutes | 805 | 13.7% |
| 20 to 24 Minutes | 1,257 | 21.4% |
| 25 to 29 Minutes | 346 | 5.9% |
| 30 to 34 Minutes | 1,018 | 17.4% |
| 35 to 39 Minutes | 113 | 1.9% |
| 40 to 44 Minutes | 487 | 8.3% |
| 45 to 59 Minutes | 95 | 1.6% |
| 60 to 89 Minutes | 604 | 10.3% |
| 90 or more Minutes | 482 | 8.2% |
Commute Time by Sex in Lakewood Park
The most common commute times in Lakewood Park are 30 to 34 minutes (757 commuters, 24.9%) for males and 20 to 24 minutes (864 commuters, 30.6%) for females.
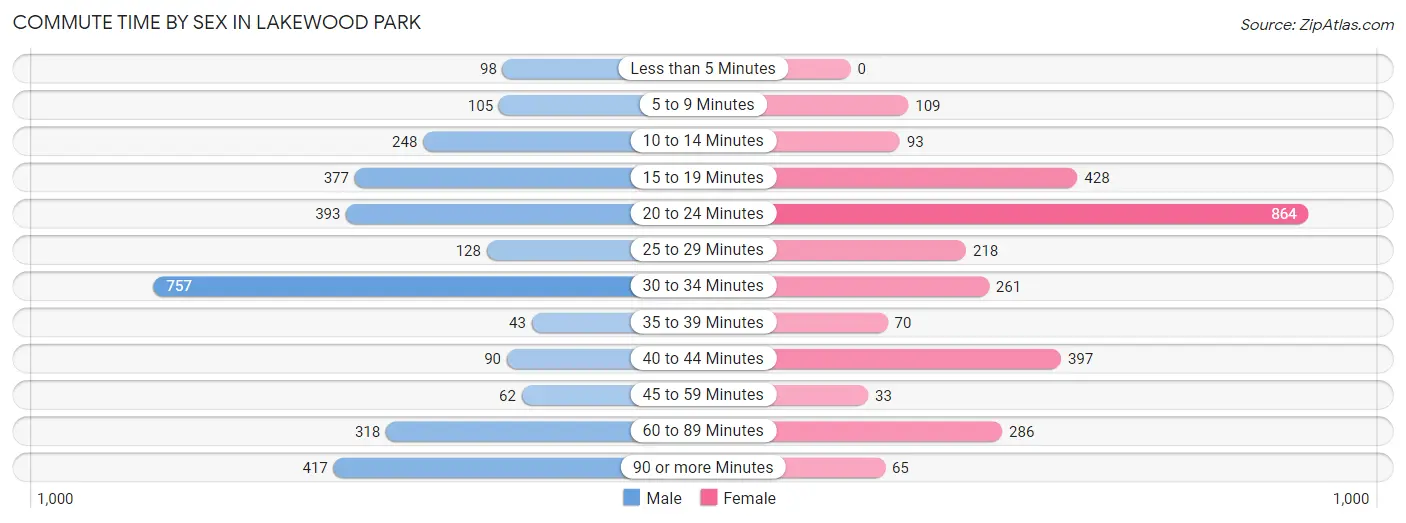
| Commute Time | Male | Female |
| Less than 5 Minutes | 98 (3.2%) | 0 (0.0%) |
| 5 to 9 Minutes | 105 (3.5%) | 109 (3.9%) |
| 10 to 14 Minutes | 248 (8.2%) | 93 (3.3%) |
| 15 to 19 Minutes | 377 (12.4%) | 428 (15.2%) |
| 20 to 24 Minutes | 393 (12.9%) | 864 (30.6%) |
| 25 to 29 Minutes | 128 (4.2%) | 218 (7.7%) |
| 30 to 34 Minutes | 757 (24.9%) | 261 (9.2%) |
| 35 to 39 Minutes | 43 (1.4%) | 70 (2.5%) |
| 40 to 44 Minutes | 90 (3.0%) | 397 (14.1%) |
| 45 to 59 Minutes | 62 (2.0%) | 33 (1.2%) |
| 60 to 89 Minutes | 318 (10.5%) | 286 (10.1%) |
| 90 or more Minutes | 417 (13.7%) | 65 (2.3%) |
Time of Departure to Work by Sex in Lakewood Park
The most frequent times of departure to work in Lakewood Park are 7:00 AM to 7:29 AM (458, 15.1%) for males and 7:00 AM to 7:29 AM (642, 22.7%) for females.
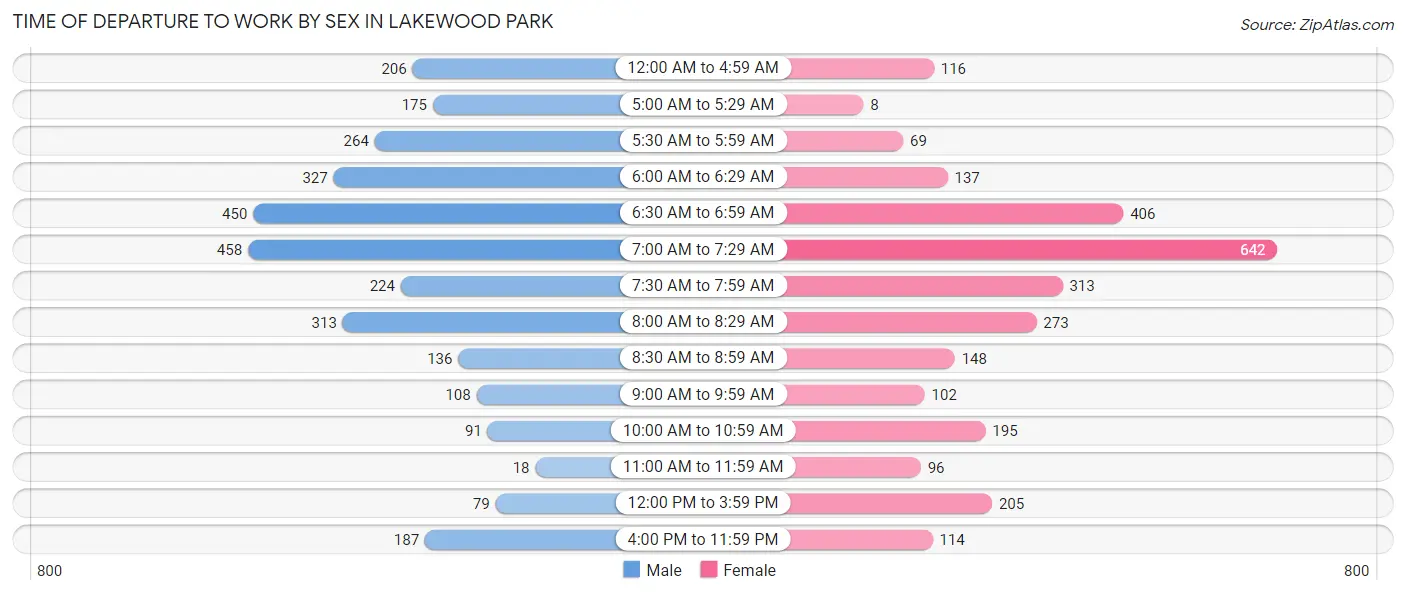
| Time of Departure | Male | Female |
| 12:00 AM to 4:59 AM | 206 (6.8%) | 116 (4.1%) |
| 5:00 AM to 5:29 AM | 175 (5.8%) | 8 (0.3%) |
| 5:30 AM to 5:59 AM | 264 (8.7%) | 69 (2.4%) |
| 6:00 AM to 6:29 AM | 327 (10.8%) | 137 (4.9%) |
| 6:30 AM to 6:59 AM | 450 (14.8%) | 406 (14.4%) |
| 7:00 AM to 7:29 AM | 458 (15.1%) | 642 (22.7%) |
| 7:30 AM to 7:59 AM | 224 (7.4%) | 313 (11.1%) |
| 8:00 AM to 8:29 AM | 313 (10.3%) | 273 (9.7%) |
| 8:30 AM to 8:59 AM | 136 (4.5%) | 148 (5.2%) |
| 9:00 AM to 9:59 AM | 108 (3.6%) | 102 (3.6%) |
| 10:00 AM to 10:59 AM | 91 (3.0%) | 195 (6.9%) |
| 11:00 AM to 11:59 AM | 18 (0.6%) | 96 (3.4%) |
| 12:00 PM to 3:59 PM | 79 (2.6%) | 205 (7.3%) |
| 4:00 PM to 11:59 PM | 187 (6.2%) | 114 (4.0%) |
| Total | 3,036 (100.0%) | 2,824 (100.0%) |
Housing Occupancy in Lakewood Park
Occupancy by Ownership in Lakewood Park
Of the total 5,551 dwellings in Lakewood Park, owner-occupied units account for 4,594 (82.8%), while renter-occupied units make up 957 (17.2%).
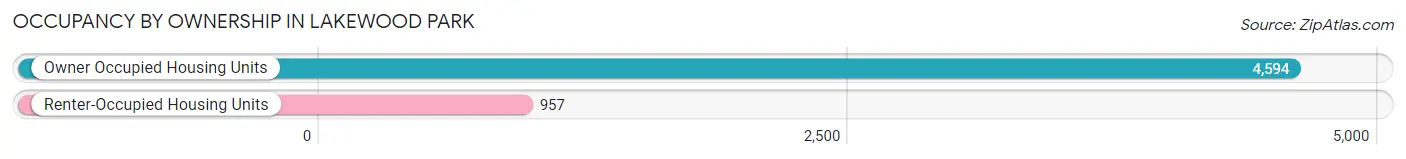
| Occupancy | # Housing Units | % Housing Units |
| Owner Occupied Housing Units | 4,594 | 82.8% |
| Renter-Occupied Housing Units | 957 | 17.2% |
| Total Occupied Housing Units | 5,551 | 100.0% |
Occupancy by Household Size in Lakewood Park
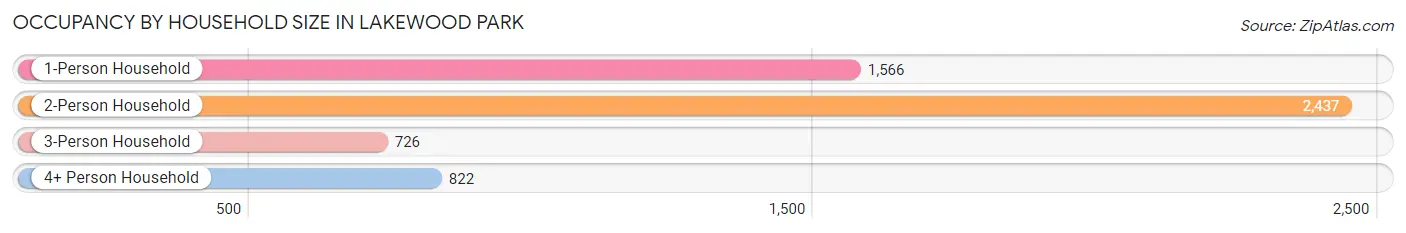
| Household Size | # Housing Units | % Housing Units |
| 1-Person Household | 1,566 | 28.2% |
| 2-Person Household | 2,437 | 43.9% |
| 3-Person Household | 726 | 13.1% |
| 4+ Person Household | 822 | 14.8% |
| Total Housing Units | 5,551 | 100.0% |
Occupancy by Ownership by Household Size in Lakewood Park
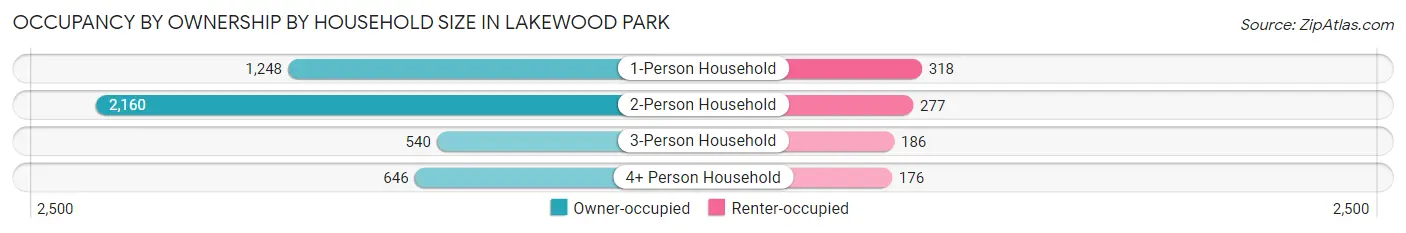
| Household Size | Owner-occupied | Renter-occupied |
| 1-Person Household | 1,248 (79.7%) | 318 (20.3%) |
| 2-Person Household | 2,160 (88.6%) | 277 (11.4%) |
| 3-Person Household | 540 (74.4%) | 186 (25.6%) |
| 4+ Person Household | 646 (78.6%) | 176 (21.4%) |
| Total Housing Units | 4,594 (82.8%) | 957 (17.2%) |
Occupancy by Educational Attainment in Lakewood Park
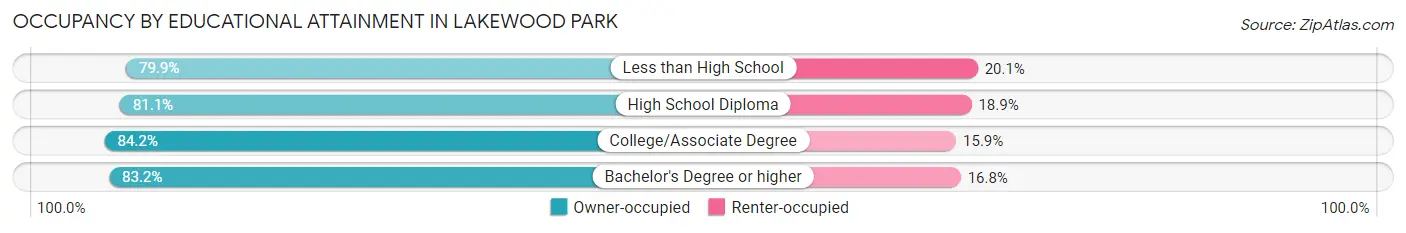
| Household Size | Owner-occupied | Renter-occupied |
| Less than High School | 369 (79.9%) | 93 (20.1%) |
| High School Diploma | 1,322 (81.1%) | 308 (18.9%) |
| College/Associate Degree | 2,193 (84.2%) | 413 (15.9%) |
| Bachelor's Degree or higher | 710 (83.2%) | 143 (16.8%) |
Occupancy by Age of Householder in Lakewood Park
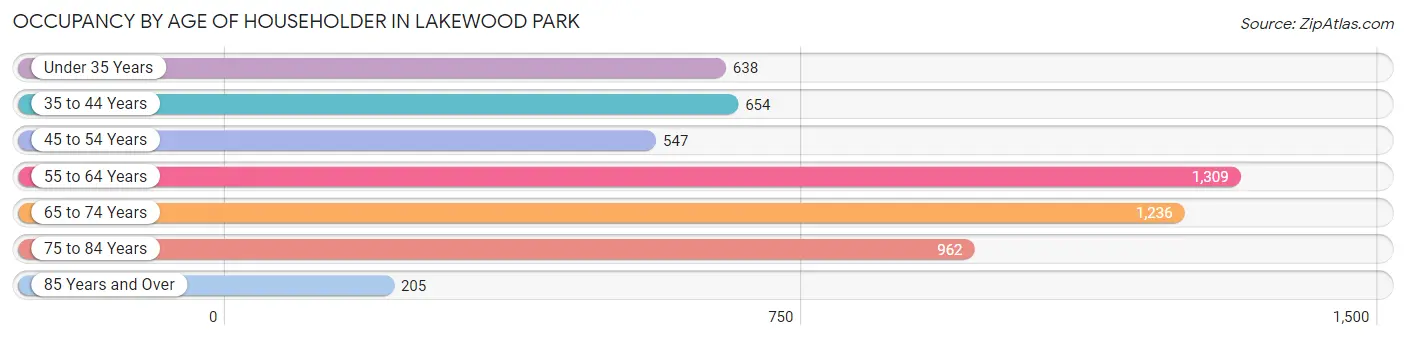
| Age Bracket | # Households | % Households |
| Under 35 Years | 638 | 11.5% |
| 35 to 44 Years | 654 | 11.8% |
| 45 to 54 Years | 547 | 9.9% |
| 55 to 64 Years | 1,309 | 23.6% |
| 65 to 74 Years | 1,236 | 22.3% |
| 75 to 84 Years | 962 | 17.3% |
| 85 Years and Over | 205 | 3.7% |
| Total | 5,551 | 100.0% |
Housing Finances in Lakewood Park
Median Income by Occupancy in Lakewood Park
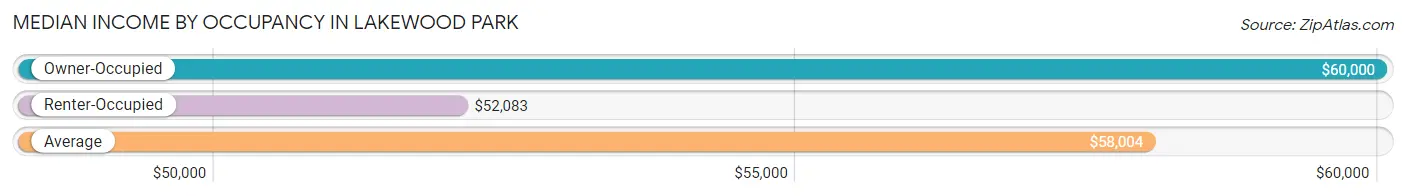
| Occupancy Type | # Households | Median Income |
| Owner-Occupied | 4,594 (82.8%) | $60,000 |
| Renter-Occupied | 957 (17.2%) | $52,083 |
| Average | 5,551 (100.0%) | $58,004 |
Occupancy by Householder Income Bracket in Lakewood Park
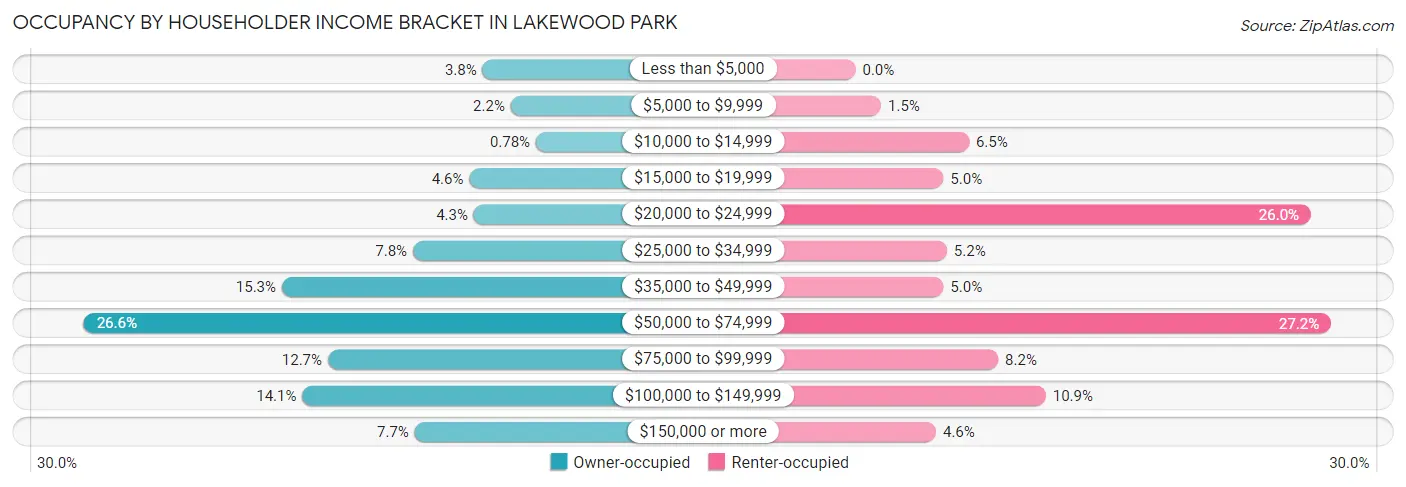
| Income Bracket | Owner-occupied | Renter-occupied |
| Less than $5,000 | 176 (3.8%) | 0 (0.0%) |
| $5,000 to $9,999 | 102 (2.2%) | 14 (1.5%) |
| $10,000 to $14,999 | 36 (0.8%) | 62 (6.5%) |
| $15,000 to $19,999 | 211 (4.6%) | 48 (5.0%) |
| $20,000 to $24,999 | 199 (4.3%) | 249 (26.0%) |
| $25,000 to $34,999 | 359 (7.8%) | 50 (5.2%) |
| $35,000 to $49,999 | 703 (15.3%) | 48 (5.0%) |
| $50,000 to $74,999 | 1,223 (26.6%) | 260 (27.2%) |
| $75,000 to $99,999 | 582 (12.7%) | 78 (8.2%) |
| $100,000 to $149,999 | 649 (14.1%) | 104 (10.9%) |
| $150,000 or more | 354 (7.7%) | 44 (4.6%) |
| Total | 4,594 (100.0%) | 957 (100.0%) |
Monthly Housing Cost Tiers in Lakewood Park
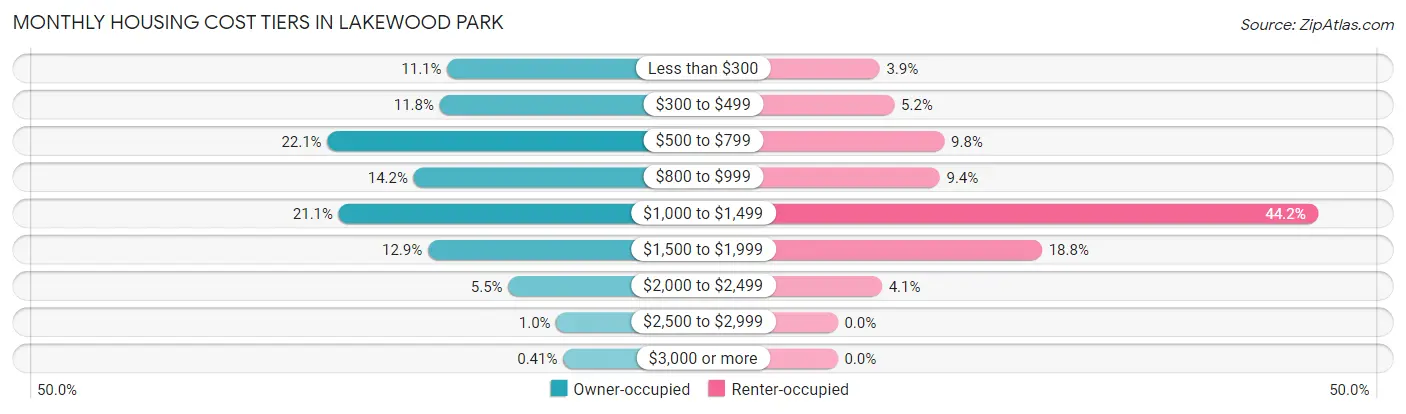
| Monthly Cost | Owner-occupied | Renter-occupied |
| Less than $300 | 509 (11.1%) | 37 (3.9%) |
| $300 to $499 | 541 (11.8%) | 50 (5.2%) |
| $500 to $799 | 1,016 (22.1%) | 94 (9.8%) |
| $800 to $999 | 651 (14.2%) | 90 (9.4%) |
| $1,000 to $1,499 | 968 (21.1%) | 423 (44.2%) |
| $1,500 to $1,999 | 591 (12.9%) | 180 (18.8%) |
| $2,000 to $2,499 | 251 (5.5%) | 39 (4.1%) |
| $2,500 to $2,999 | 48 (1.0%) | 0 (0.0%) |
| $3,000 or more | 19 (0.4%) | 0 (0.0%) |
| Total | 4,594 (100.0%) | 957 (100.0%) |
Physical Housing Characteristics in Lakewood Park
Housing Structures in Lakewood Park
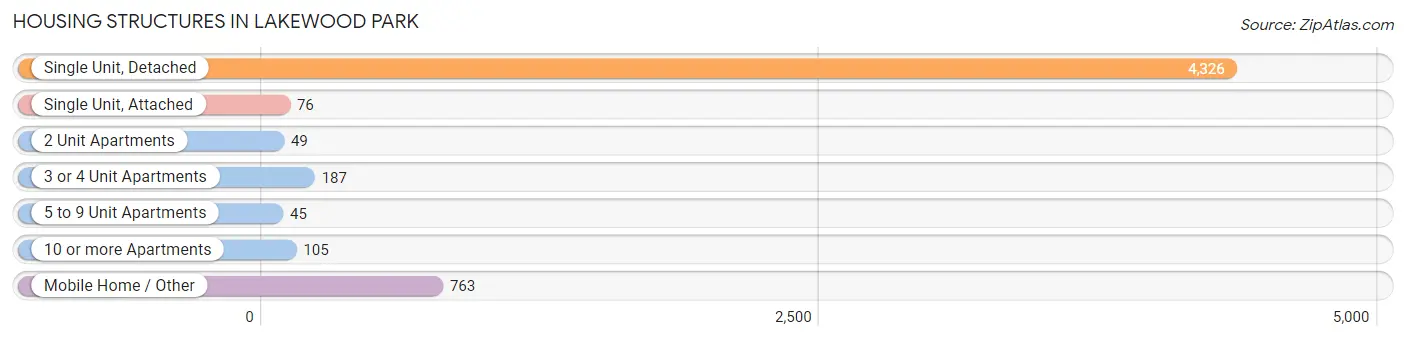
| Structure Type | # Housing Units | % Housing Units |
| Single Unit, Detached | 4,326 | 77.9% |
| Single Unit, Attached | 76 | 1.4% |
| 2 Unit Apartments | 49 | 0.9% |
| 3 or 4 Unit Apartments | 187 | 3.4% |
| 5 to 9 Unit Apartments | 45 | 0.8% |
| 10 or more Apartments | 105 | 1.9% |
| Mobile Home / Other | 763 | 13.8% |
| Total | 5,551 | 100.0% |
Housing Structures by Occupancy in Lakewood Park
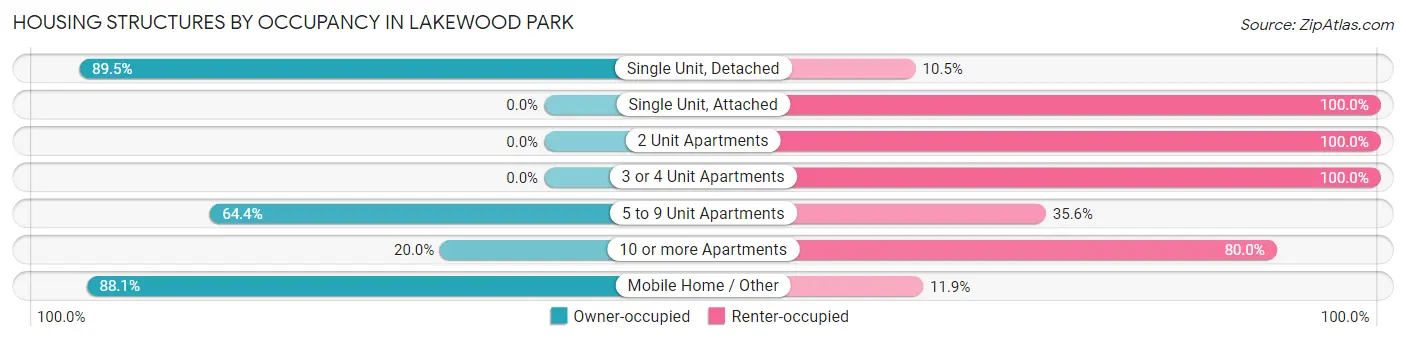
| Structure Type | Owner-occupied | Renter-occupied |
| Single Unit, Detached | 3,872 (89.5%) | 454 (10.5%) |
| Single Unit, Attached | 0 (0.0%) | 76 (100.0%) |
| 2 Unit Apartments | 0 (0.0%) | 49 (100.0%) |
| 3 or 4 Unit Apartments | 0 (0.0%) | 187 (100.0%) |
| 5 to 9 Unit Apartments | 29 (64.4%) | 16 (35.6%) |
| 10 or more Apartments | 21 (20.0%) | 84 (80.0%) |
| Mobile Home / Other | 672 (88.1%) | 91 (11.9%) |
| Total | 4,594 (82.8%) | 957 (17.2%) |
Housing Structures by Number of Rooms in Lakewood Park
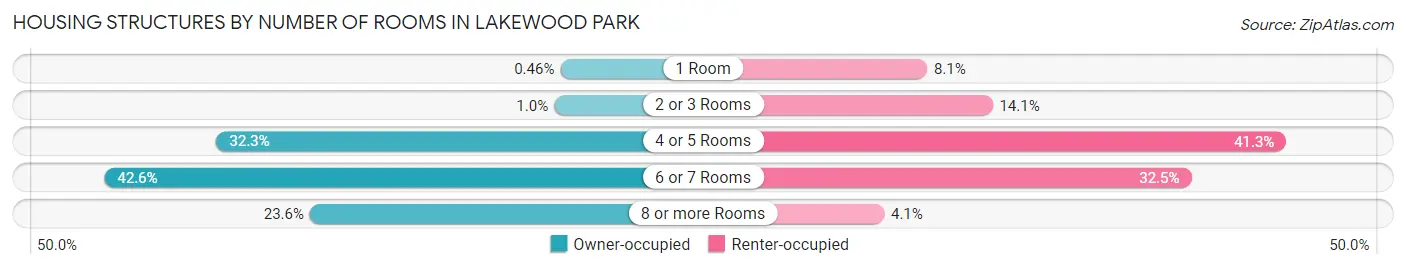
| Number of Rooms | Owner-occupied | Renter-occupied |
| 1 Room | 21 (0.5%) | 77 (8.1%) |
| 2 or 3 Rooms | 48 (1.0%) | 135 (14.1%) |
| 4 or 5 Rooms | 1,482 (32.3%) | 395 (41.3%) |
| 6 or 7 Rooms | 1,958 (42.6%) | 311 (32.5%) |
| 8 or more Rooms | 1,085 (23.6%) | 39 (4.1%) |
| Total | 4,594 (100.0%) | 957 (100.0%) |
Housing Structure by Heating Type in Lakewood Park
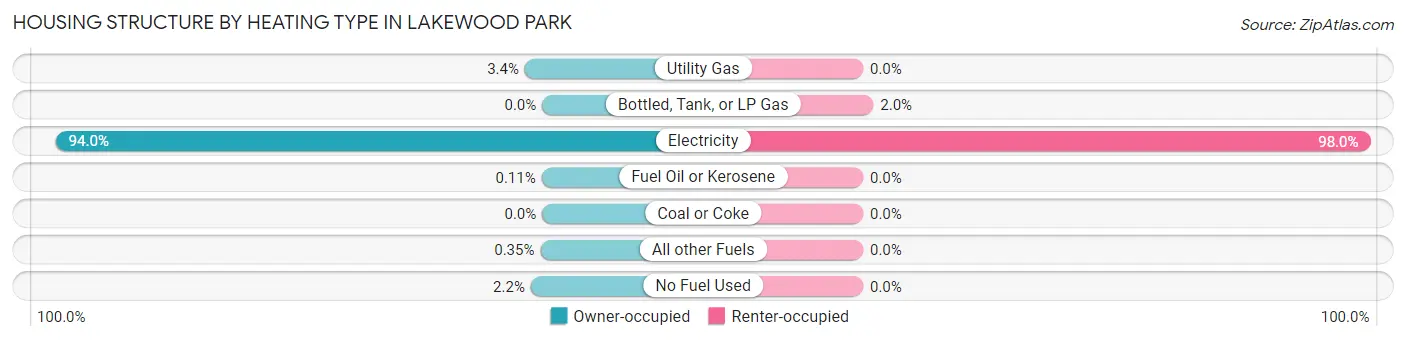
| Heating Type | Owner-occupied | Renter-occupied |
| Utility Gas | 154 (3.4%) | 0 (0.0%) |
| Bottled, Tank, or LP Gas | 0 (0.0%) | 19 (2.0%) |
| Electricity | 4,318 (94.0%) | 938 (98.0%) |
| Fuel Oil or Kerosene | 5 (0.1%) | 0 (0.0%) |
| Coal or Coke | 0 (0.0%) | 0 (0.0%) |
| All other Fuels | 16 (0.4%) | 0 (0.0%) |
| No Fuel Used | 101 (2.2%) | 0 (0.0%) |
| Total | 4,594 (100.0%) | 957 (100.0%) |
Household Vehicle Usage in Lakewood Park
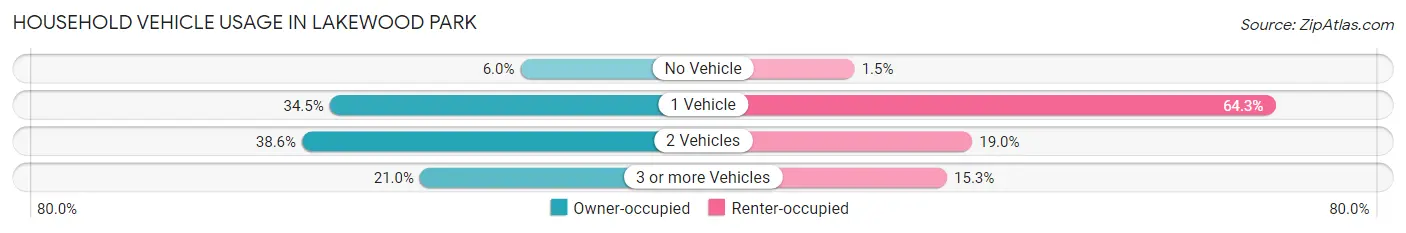
| Vehicles per Household | Owner-occupied | Renter-occupied |
| No Vehicle | 274 (6.0%) | 14 (1.5%) |
| 1 Vehicle | 1,583 (34.5%) | 615 (64.3%) |
| 2 Vehicles | 1,773 (38.6%) | 182 (19.0%) |
| 3 or more Vehicles | 964 (21.0%) | 146 (15.3%) |
| Total | 4,594 (100.0%) | 957 (100.0%) |
Real Estate & Mortgages in Lakewood Park
Real Estate and Mortgage Overview in Lakewood Park
| Characteristic | Without Mortgage | With Mortgage |
| Housing Units | 2,244 | 2,350 |
| Median Property Value | $206,000 | $237,700 |
| Median Household Income | $49,572 | $257 |
| Monthly Housing Costs | $550 | $13 |
| Real Estate Taxes | $1,378 | $67 |
Property Value by Mortgage Status in Lakewood Park
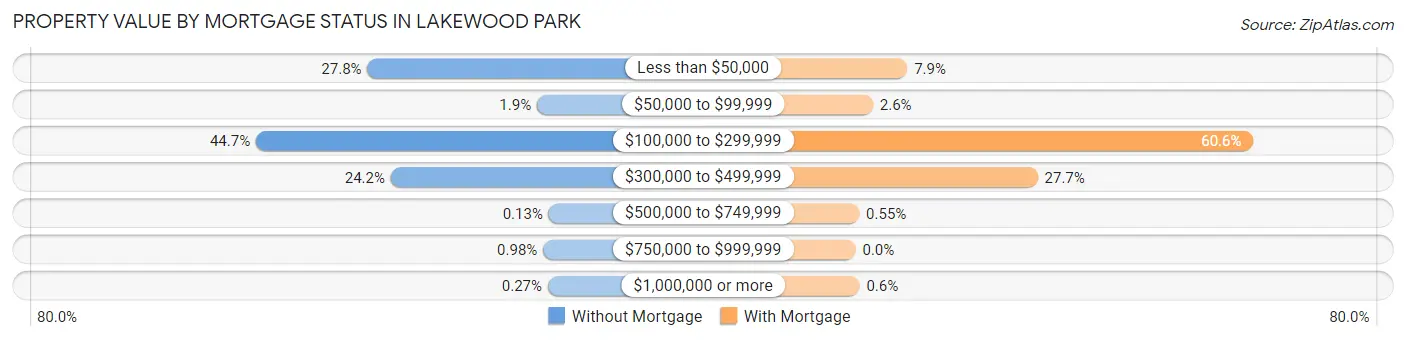
| Property Value | Without Mortgage | With Mortgage |
| Less than $50,000 | 623 (27.8%) | 185 (7.9%) |
| $50,000 to $99,999 | 43 (1.9%) | 62 (2.6%) |
| $100,000 to $299,999 | 1,004 (44.7%) | 1,424 (60.6%) |
| $300,000 to $499,999 | 543 (24.2%) | 652 (27.7%) |
| $500,000 to $749,999 | 3 (0.1%) | 13 (0.5%) |
| $750,000 to $999,999 | 22 (1.0%) | 0 (0.0%) |
| $1,000,000 or more | 6 (0.3%) | 14 (0.6%) |
| Total | 2,244 (100.0%) | 2,350 (100.0%) |
Household Income by Mortgage Status in Lakewood Park
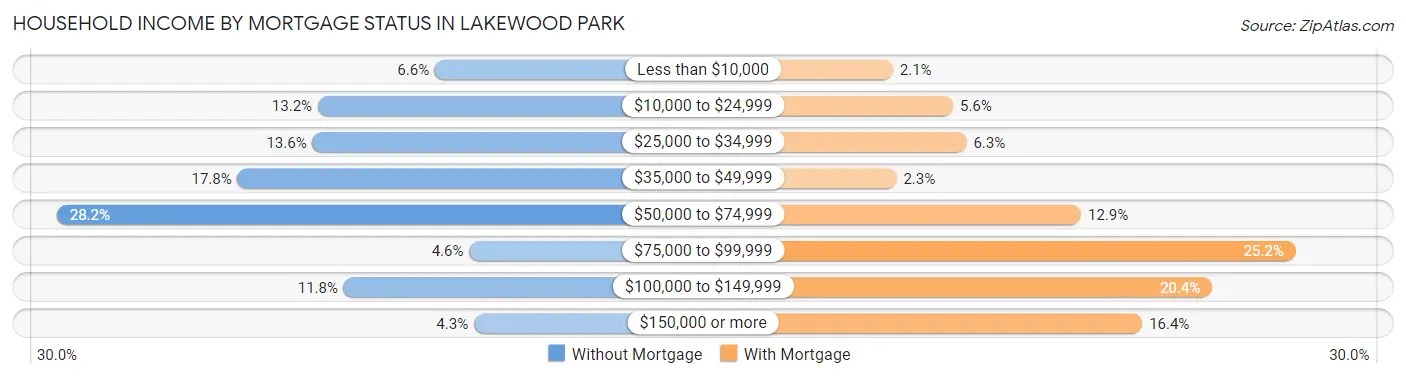
| Household Income | Without Mortgage | With Mortgage |
| Less than $10,000 | 147 (6.6%) | 50 (2.1%) |
| $10,000 to $24,999 | 297 (13.2%) | 131 (5.6%) |
| $25,000 to $34,999 | 304 (13.6%) | 149 (6.3%) |
| $35,000 to $49,999 | 400 (17.8%) | 55 (2.3%) |
| $50,000 to $74,999 | 632 (28.2%) | 303 (12.9%) |
| $75,000 to $99,999 | 103 (4.6%) | 591 (25.2%) |
| $100,000 to $149,999 | 264 (11.8%) | 479 (20.4%) |
| $150,000 or more | 97 (4.3%) | 385 (16.4%) |
| Total | 2,244 (100.0%) | 2,350 (100.0%) |
Property Value to Household Income Ratio in Lakewood Park
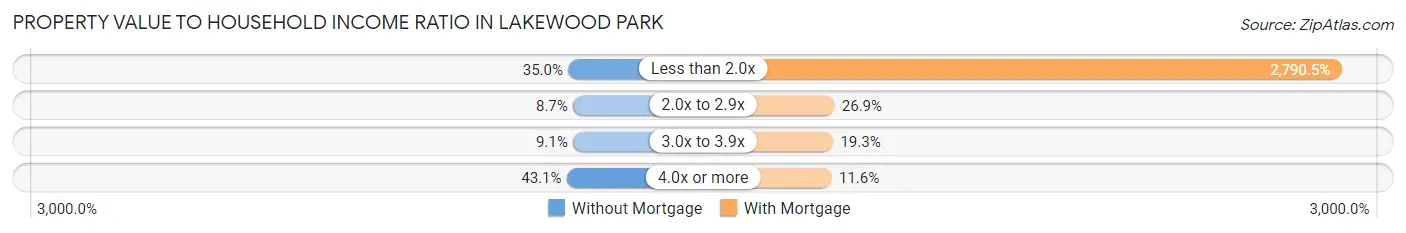
| Value-to-Income Ratio | Without Mortgage | With Mortgage |
| Less than 2.0x | 786 (35.0%) | 65,577 (2,790.5%) |
| 2.0x to 2.9x | 195 (8.7%) | 633 (26.9%) |
| 3.0x to 3.9x | 205 (9.1%) | 453 (19.3%) |
| 4.0x or more | 966 (43.0%) | 273 (11.6%) |
| Total | 2,244 (100.0%) | 2,350 (100.0%) |
Real Estate Taxes by Mortgage Status in Lakewood Park
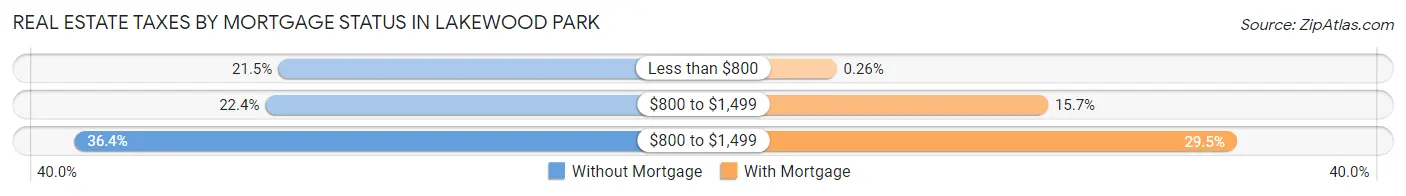
| Property Taxes | Without Mortgage | With Mortgage |
| Less than $800 | 482 (21.5%) | 6 (0.3%) |
| $800 to $1,499 | 503 (22.4%) | 369 (15.7%) |
| $800 to $1,499 | 816 (36.4%) | 693 (29.5%) |
| Total | 2,244 (100.0%) | 2,350 (100.0%) |
Health & Disability in Lakewood Park
Health Insurance Coverage by Age in Lakewood Park
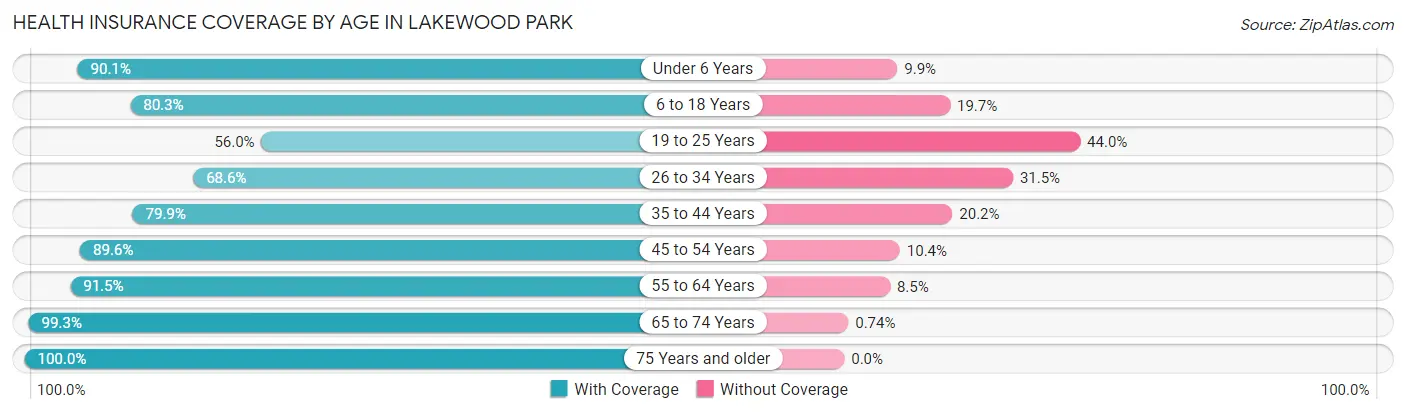
| Age Bracket | With Coverage | Without Coverage |
| Under 6 Years | 902 (90.1%) | 99 (9.9%) |
| 6 to 18 Years | 1,197 (80.3%) | 294 (19.7%) |
| 19 to 25 Years | 637 (56.0%) | 500 (44.0%) |
| 26 to 34 Years | 778 (68.5%) | 357 (31.5%) |
| 35 to 44 Years | 1,201 (79.8%) | 303 (20.2%) |
| 45 to 54 Years | 1,186 (89.6%) | 137 (10.4%) |
| 55 to 64 Years | 2,565 (91.5%) | 239 (8.5%) |
| 65 to 74 Years | 1,889 (99.3%) | 14 (0.7%) |
| 75 Years and older | 1,796 (100.0%) | 0 (0.0%) |
| Total | 12,151 (86.2%) | 1,943 (13.8%) |
Health Insurance Coverage by Citizenship Status in Lakewood Park
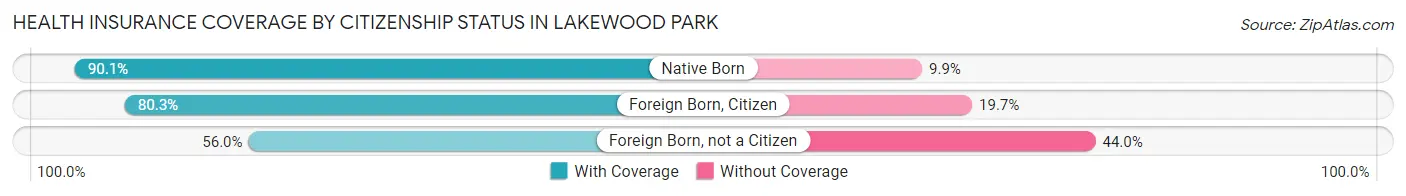
| Citizenship Status | With Coverage | Without Coverage |
| Native Born | 902 (90.1%) | 99 (9.9%) |
| Foreign Born, Citizen | 1,197 (80.3%) | 294 (19.7%) |
| Foreign Born, not a Citizen | 637 (56.0%) | 500 (44.0%) |
Health Insurance Coverage by Household Income in Lakewood Park
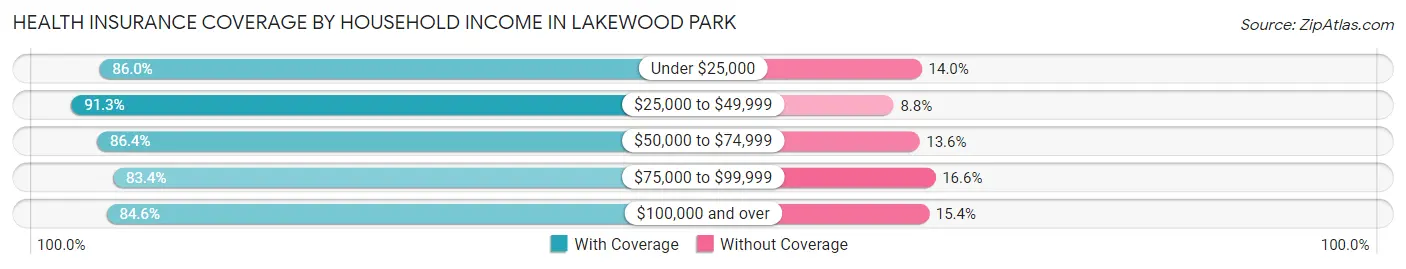
| Household Income | With Coverage | Without Coverage |
| Under $25,000 | 1,834 (86.0%) | 299 (14.0%) |
| $25,000 to $49,999 | 2,106 (91.2%) | 202 (8.7%) |
| $50,000 to $74,999 | 2,907 (86.4%) | 457 (13.6%) |
| $75,000 to $99,999 | 1,596 (83.4%) | 317 (16.6%) |
| $100,000 and over | 3,670 (84.6%) | 666 (15.4%) |
Public vs Private Health Insurance Coverage by Age in Lakewood Park
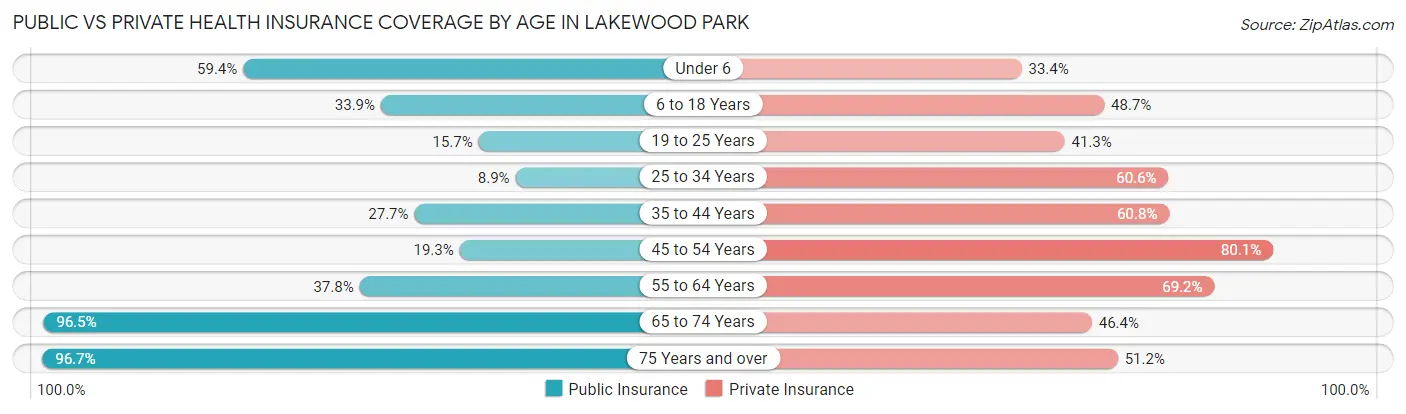
| Age Bracket | Public Insurance | Private Insurance |
| Under 6 | 595 (59.4%) | 334 (33.4%) |
| 6 to 18 Years | 505 (33.9%) | 726 (48.7%) |
| 19 to 25 Years | 179 (15.7%) | 470 (41.3%) |
| 25 to 34 Years | 101 (8.9%) | 688 (60.6%) |
| 35 to 44 Years | 416 (27.7%) | 914 (60.8%) |
| 45 to 54 Years | 255 (19.3%) | 1,059 (80.0%) |
| 55 to 64 Years | 1,061 (37.8%) | 1,939 (69.2%) |
| 65 to 74 Years | 1,837 (96.5%) | 883 (46.4%) |
| 75 Years and over | 1,737 (96.7%) | 920 (51.2%) |
| Total | 6,686 (47.4%) | 7,933 (56.3%) |
Disability Status by Sex by Age in Lakewood Park
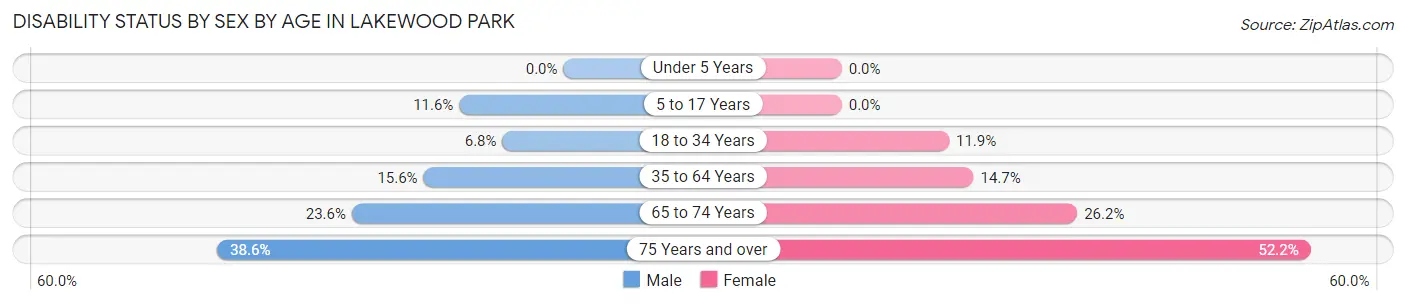
| Age Bracket | Male | Female |
| Under 5 Years | 0 (0.0%) | 0 (0.0%) |
| 5 to 17 Years | 103 (11.6%) | 0 (0.0%) |
| 18 to 34 Years | 68 (6.8%) | 160 (11.9%) |
| 35 to 64 Years | 444 (15.6%) | 408 (14.7%) |
| 65 to 74 Years | 212 (23.6%) | 263 (26.2%) |
| 75 Years and over | 377 (38.6%) | 427 (52.2%) |
Disability Class by Sex by Age in Lakewood Park
Disability Class: Hearing Difficulty
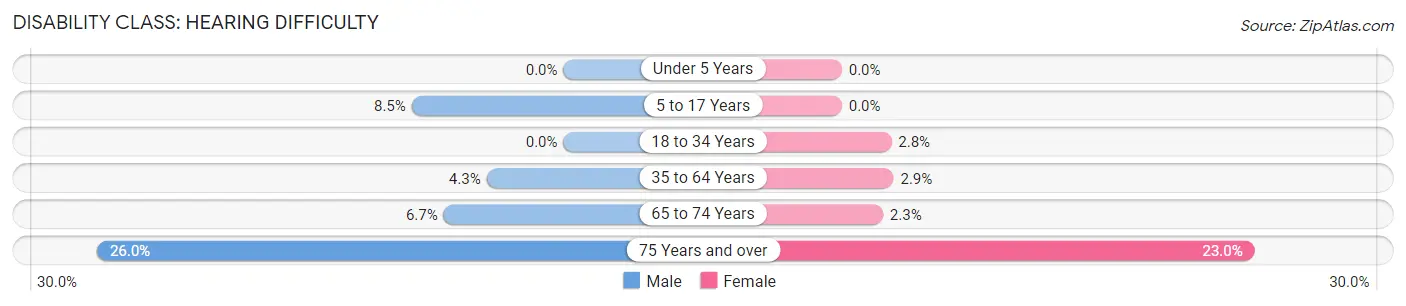
| Age Bracket | Male | Female |
| Under 5 Years | 0 (0.0%) | 0 (0.0%) |
| 5 to 17 Years | 75 (8.5%) | 0 (0.0%) |
| 18 to 34 Years | 0 (0.0%) | 37 (2.8%) |
| 35 to 64 Years | 122 (4.3%) | 80 (2.9%) |
| 65 to 74 Years | 60 (6.7%) | 23 (2.3%) |
| 75 Years and over | 254 (26.0%) | 188 (23.0%) |
Disability Class: Vision Difficulty
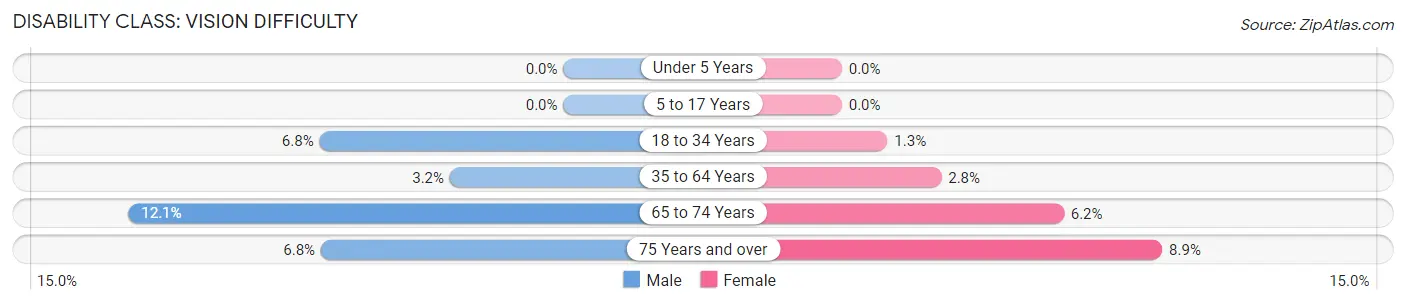
| Age Bracket | Male | Female |
| Under 5 Years | 0 (0.0%) | 0 (0.0%) |
| 5 to 17 Years | 0 (0.0%) | 0 (0.0%) |
| 18 to 34 Years | 68 (6.8%) | 17 (1.3%) |
| 35 to 64 Years | 90 (3.2%) | 77 (2.8%) |
| 65 to 74 Years | 109 (12.1%) | 62 (6.2%) |
| 75 Years and over | 66 (6.8%) | 73 (8.9%) |
Disability Class: Cognitive Difficulty
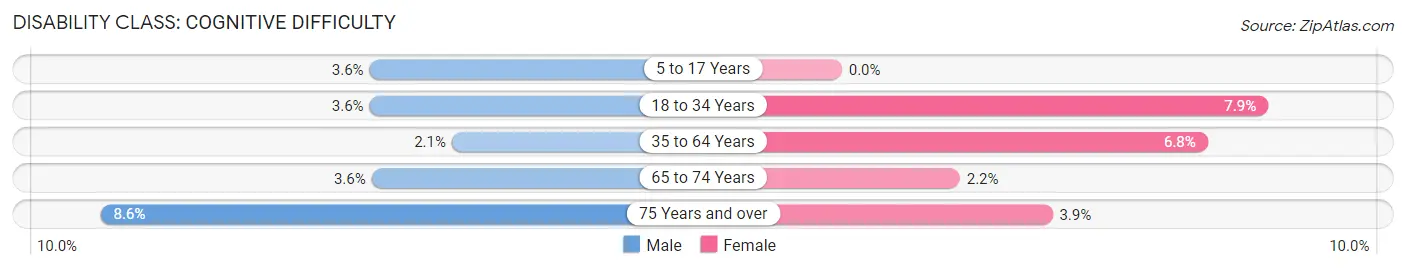
| Age Bracket | Male | Female |
| 5 to 17 Years | 32 (3.6%) | 0 (0.0%) |
| 18 to 34 Years | 36 (3.6%) | 106 (7.9%) |
| 35 to 64 Years | 59 (2.1%) | 189 (6.8%) |
| 65 to 74 Years | 32 (3.6%) | 22 (2.2%) |
| 75 Years and over | 84 (8.6%) | 32 (3.9%) |
Disability Class: Ambulatory Difficulty
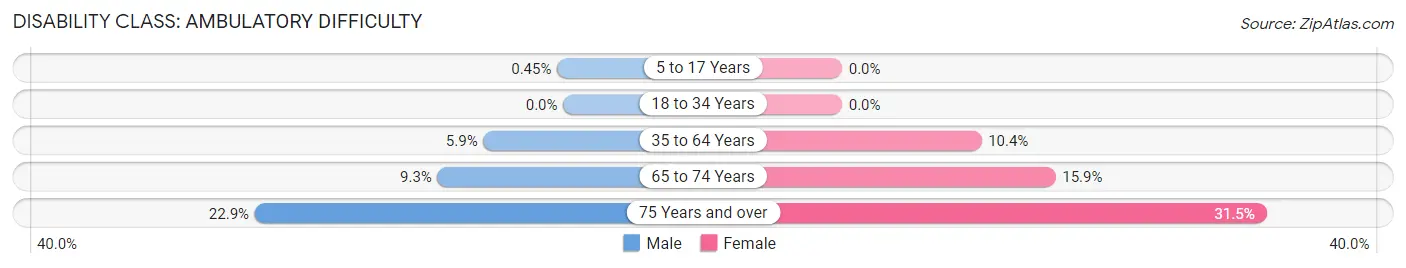
| Age Bracket | Male | Female |
| 5 to 17 Years | 4 (0.4%) | 0 (0.0%) |
| 18 to 34 Years | 0 (0.0%) | 0 (0.0%) |
| 35 to 64 Years | 169 (5.9%) | 288 (10.3%) |
| 65 to 74 Years | 84 (9.3%) | 159 (15.9%) |
| 75 Years and over | 224 (22.9%) | 258 (31.5%) |
Disability Class: Self-Care Difficulty
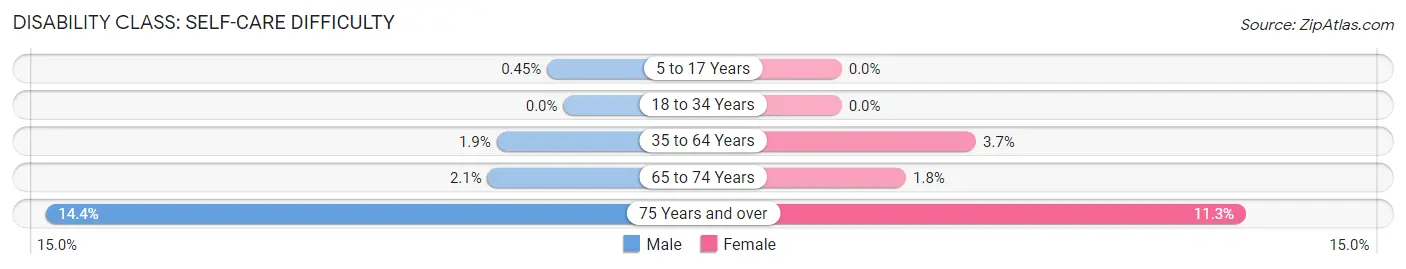
| Age Bracket | Male | Female |
| 5 to 17 Years | 4 (0.4%) | 0 (0.0%) |
| 18 to 34 Years | 0 (0.0%) | 0 (0.0%) |
| 35 to 64 Years | 53 (1.9%) | 104 (3.7%) |
| 65 to 74 Years | 19 (2.1%) | 18 (1.8%) |
| 75 Years and over | 141 (14.4%) | 92 (11.3%) |
Technology Access in Lakewood Park
Computing Device Access in Lakewood Park
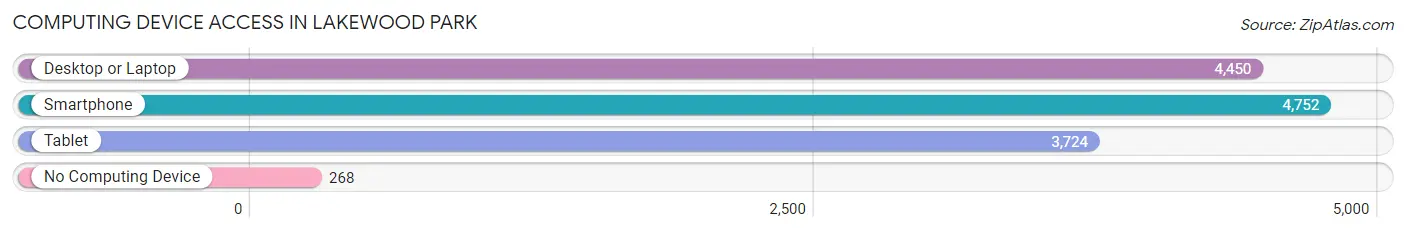
| Device Type | # Households | % Households |
| Desktop or Laptop | 4,450 | 80.2% |
| Smartphone | 4,752 | 85.6% |
| Tablet | 3,724 | 67.1% |
| No Computing Device | 268 | 4.8% |
| Total | 5,551 | 100.0% |
Internet Access in Lakewood Park
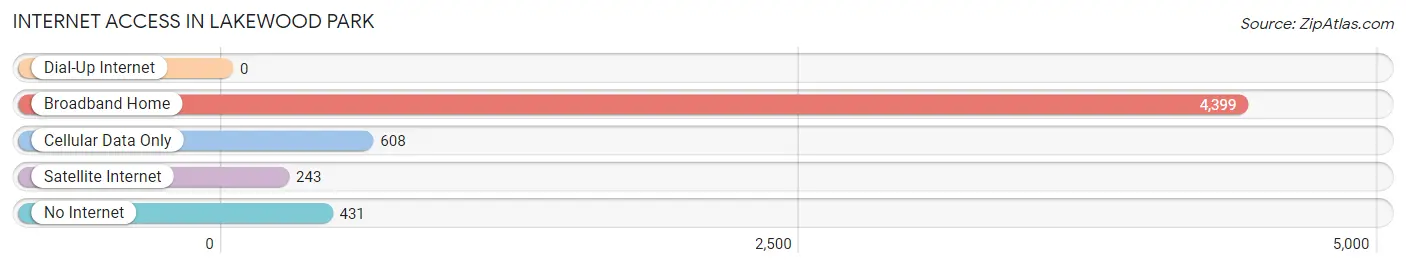
| Internet Type | # Households | % Households |
| Dial-Up Internet | 0 | 0.0% |
| Broadband Home | 4,399 | 79.2% |
| Cellular Data Only | 608 | 11.0% |
| Satellite Internet | 243 | 4.4% |
| No Internet | 431 | 7.8% |
| Total | 5,551 | 100.0% |
Lakewood Park Summary
Introduction
Lakewood Park is a census-designated place (CDP) located in St. Lucie County, Florida. It is situated on the east coast of Florida, approximately halfway between the cities of Fort Pierce and Vero Beach. The population of Lakewood Park was 8,845 at the 2010 census. The CDP is part of the Port St. Lucie Metropolitan Statistical Area.
History
The area that is now Lakewood Park was originally inhabited by the Ais Indians, who were part of the Seminole tribe. The Ais Indians lived in the area for centuries before the arrival of European settlers in the late 19th century. The first settlers in the area were farmers, who established small farms and citrus groves.
In the early 20th century, the area began to develop as a residential community. The first subdivision in the area was established in the 1920s, and the community was officially incorporated as the Town of Lakewood Park in 1925. The town was named after the nearby Lakewood Park, which was established in the late 19th century.
The town grew steadily throughout the 20th century, and in 2000, it was reincorporated as a census-designated place (CDP).
Geography
Lakewood Park is located in St. Lucie County, Florida. It is situated on the east coast of Florida, approximately halfway between the cities of Fort Pierce and Vero Beach. The CDP has a total area of 8.3 square miles, of which 8.2 square miles is land and 0.1 square miles is water.
The CDP is located in a flat, low-lying area, with an elevation of just 10 feet above sea level. The area is mostly residential, with some commercial and industrial development.
Economy
The economy of Lakewood Park is largely based on tourism and services. The area is home to several hotels and resorts, as well as a variety of restaurants and retail stores. The CDP is also home to several industrial and manufacturing businesses, as well as a number of medical and healthcare facilities.
Demographics
As of the 2010 census, the population of Lakewood Park was 8,845. The racial makeup of the CDP was 79.3% White, 11.2% African American, 0.5% Native American, 1.3% Asian, 0.1% Pacific Islander, 5.2% from other races, and 2.4% from two or more races. Hispanic or Latino of any race were 13.2% of the population.
The median income for a household in the CDP was $41,944, and the median income for a family was $50,919. The per capita income for the CDP was $20,945. About 11.2% of families and 14.2% of the population were below the poverty line, including 19.2% of those under age 18 and 8.2% of those age 65 or over.
Conclusion
Lakewood Park is a census-designated place located in St. Lucie County, Florida. It is situated on the east coast of Florida, approximately halfway between the cities of Fort Pierce and Vero Beach. The population of Lakewood Park was 8,845 at the 2010 census. The CDP is part of the Port St. Lucie Metropolitan Statistical Area. The economy of Lakewood Park is largely based on tourism and services, and the population is diverse, with a median income of $41,944.
Common Questions
What is the Total Population of Lakewood Park?
Total Population of Lakewood Park is 14,119.
What is the Total Male Population of Lakewood Park?
Total Male Population of Lakewood Park is 7,084.
What is the Total Female Population of Lakewood Park?
Total Female Population of Lakewood Park is 7,035.
What is the Ratio of Males per 100 Females in Lakewood Park?
There are 100.70 Males per 100 Females in Lakewood Park.
What is the Ratio of Females per 100 Males in Lakewood Park?
There are 99.31 Females per 100 Males in Lakewood Park.
What is the Median Population Age in Lakewood Park?
Median Population Age in Lakewood Park is 50.6 Years.
What is the Average Family Size in Lakewood Park
Average Family Size in Lakewood Park is 3.1 People.
What is the Average Household Size in Lakewood Park
Average Household Size in Lakewood Park is 2.5 People.
What is Per Capita Income in Lakewood Park?
Per Capita income in Lakewood Park is $28,831.
What is the Median Family Income in Lakewood Park?
Median Family Income in Lakewood Park is $63,158.
What is the Median Household income in Lakewood Park?
Median Household Income in Lakewood Park is $58,004.
What is Income or Wage Gap in Lakewood Park?
Income or Wage Gap in Lakewood Park is 25.1%.
Women in Lakewood Park earn 74.9 cents for every dollar earned by a man.
What is Inequality or Gini Index in Lakewood Park?
Inequality or Gini Index in Lakewood Park is 0.38.
How Large is the Labor Force in Lakewood Park?
There are 6,561 People in the Labor Forcein in Lakewood Park.
What is the Percentage of People in the Labor Force in Lakewood Park?
54.8% of People are in the Labor Force in Lakewood Park.
What is the Unemployment Rate in Lakewood Park?
Unemployment Rate in Lakewood Park is 3.8%.