Williamsburg, FL
Williamsburg Map
Williamsburg Overview
6,908
TOTAL POPULATION
3,449
MALE POPULATION
3,459
FEMALE POPULATION
99.71
MALES / 100 FEMALES
100.29
FEMALES / 100 MALES
46.3
MEDIAN AGE
2.8
AVG FAMILY SIZE
2.2
AVG HOUSEHOLD SIZE
$39,602
PER CAPITA INCOME
$93,295
AVG FAMILY INCOME
$71,853
AVG HOUSEHOLD INCOME
27.3%
WAGE / INCOME GAP [ % ]
72.7¢/ $1
WAGE / INCOME GAP [ $ ]
$10,113
FAMILY INCOME DEFICIT
0.41
INEQUALITY / GINI INDEX
3,718
LABOR FORCE [ PEOPLE ]
61.3%
PERCENT IN LABOR FORCE
3.6%
UNEMPLOYMENT RATE
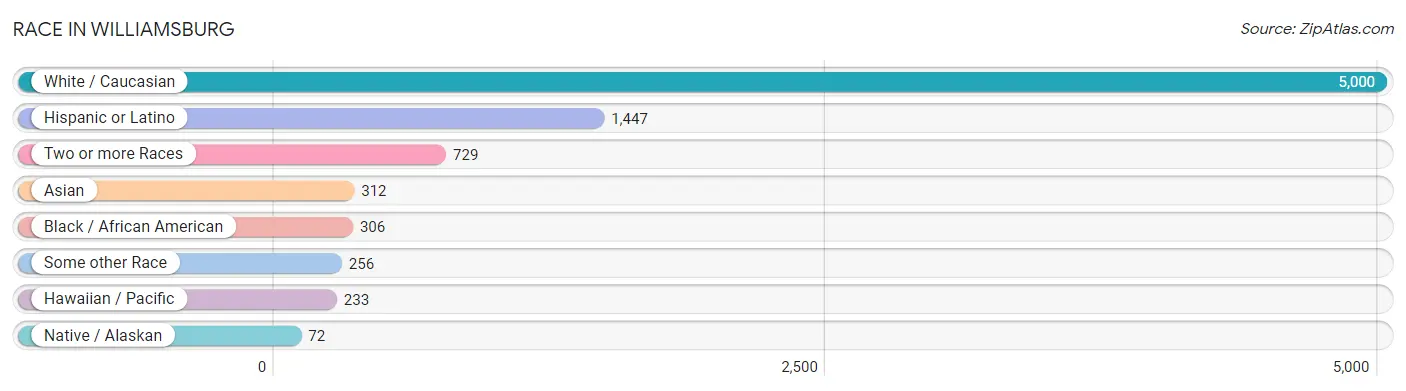
Race in Williamsburg
The most populous races in Williamsburg are White / Caucasian (5,000 | 72.4%), Hispanic or Latino (1,447 | 20.9%), and Two or more Races (729 | 10.5%).
| Race | # Population | % Population |
| Asian | 312 | 4.5% |
| Black / African American | 306 | 4.4% |
| Hawaiian / Pacific | 233 | 3.4% |
| Hispanic or Latino | 1,447 | 20.9% |
| Native / Alaskan | 72 | 1.0% |
| White / Caucasian | 5,000 | 72.4% |
| Two or more Races | 729 | 10.5% |
| Some other Race | 256 | 3.7% |
| Total | 6,908 | 100.0% |
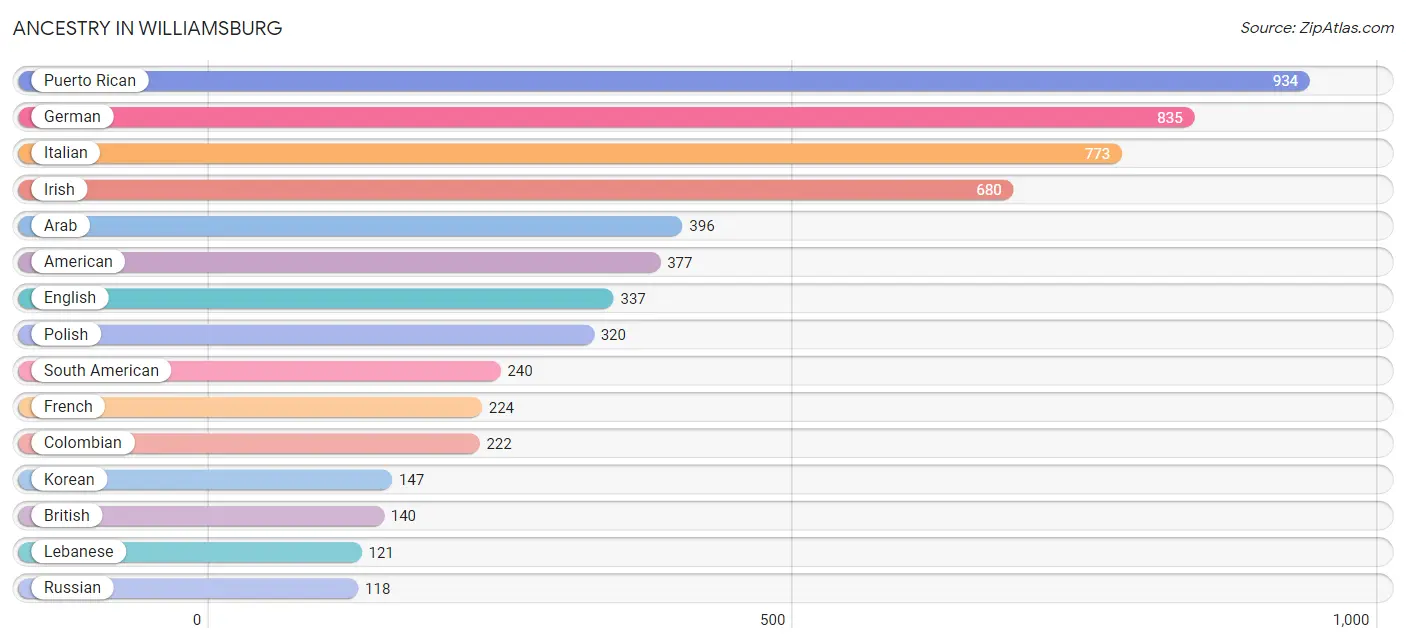
Ancestry in Williamsburg
The most populous ancestries reported in Williamsburg are Puerto Rican (934 | 13.5%), German (835 | 12.1%), Italian (773 | 11.2%), Irish (680 | 9.8%), and Arab (396 | 5.7%), together accounting for 52.4% of all Williamsburg residents.
| Ancestry | # Population | % Population |
| American | 377 | 5.5% |
| Arab | 396 | 5.7% |
| Armenian | 21 | 0.3% |
| Austrian | 7 | 0.1% |
| Belgian | 55 | 0.8% |
| Brazilian | 98 | 1.4% |
| British | 140 | 2.0% |
| Bulgarian | 67 | 1.0% |
| Burmese | 14 | 0.2% |
| Canadian | 46 | 0.7% |
| Central American | 5 | 0.1% |
| Cherokee | 7 | 0.1% |
| Colombian | 222 | 3.2% |
| Cuban | 32 | 0.5% |
| Danish | 91 | 1.3% |
| Dominican | 16 | 0.2% |
| Dutch | 38 | 0.5% |
| Eastern European | 4 | 0.1% |
| English | 337 | 4.9% |
| European | 32 | 0.5% |
| French | 224 | 3.2% |
| French Canadian | 32 | 0.5% |
| German | 835 | 12.1% |
| Greek | 45 | 0.6% |
| Haitian | 87 | 1.3% |
| Indian (Asian) | 112 | 1.6% |
| Iranian | 5 | 0.1% |
| Irish | 680 | 9.8% |
| Italian | 773 | 11.2% |
| Jamaican | 19 | 0.3% |
| Korean | 147 | 2.1% |
| Laotian | 50 | 0.7% |
| Lebanese | 121 | 1.8% |
| Lithuanian | 30 | 0.4% |
| Lumbee | 72 | 1.0% |
| Mexican | 113 | 1.6% |
| Moroccan | 44 | 0.6% |
| Native Hawaiian | 25 | 0.4% |
| Norwegian | 89 | 1.3% |
| Polish | 320 | 4.6% |
| Portuguese | 23 | 0.3% |
| Puerto Rican | 934 | 13.5% |
| Romanian | 32 | 0.5% |
| Russian | 118 | 1.7% |
| Salvadoran | 5 | 0.1% |
| Samoan | 42 | 0.6% |
| Scandinavian | 37 | 0.5% |
| Scotch-Irish | 86 | 1.2% |
| Scottish | 8 | 0.1% |
| Slovak | 43 | 0.6% |
| South American | 240 | 3.5% |
| Spaniard | 53 | 0.8% |
| Spanish | 34 | 0.5% |
| Spanish American | 11 | 0.2% |
| Sri Lankan | 71 | 1.0% |
| Swedish | 86 | 1.2% |
| Swiss | 15 | 0.2% |
| Trinidadian and Tobagonian | 10 | 0.1% |
| Turkish | 67 | 1.0% |
| Ukrainian | 26 | 0.4% |
| Venezuelan | 18 | 0.3% |
| Welsh | 51 | 0.7% |
| West Indian | 9 | 0.1% |
| Yugoslavian | 27 | 0.4% | View All 64 Rows |
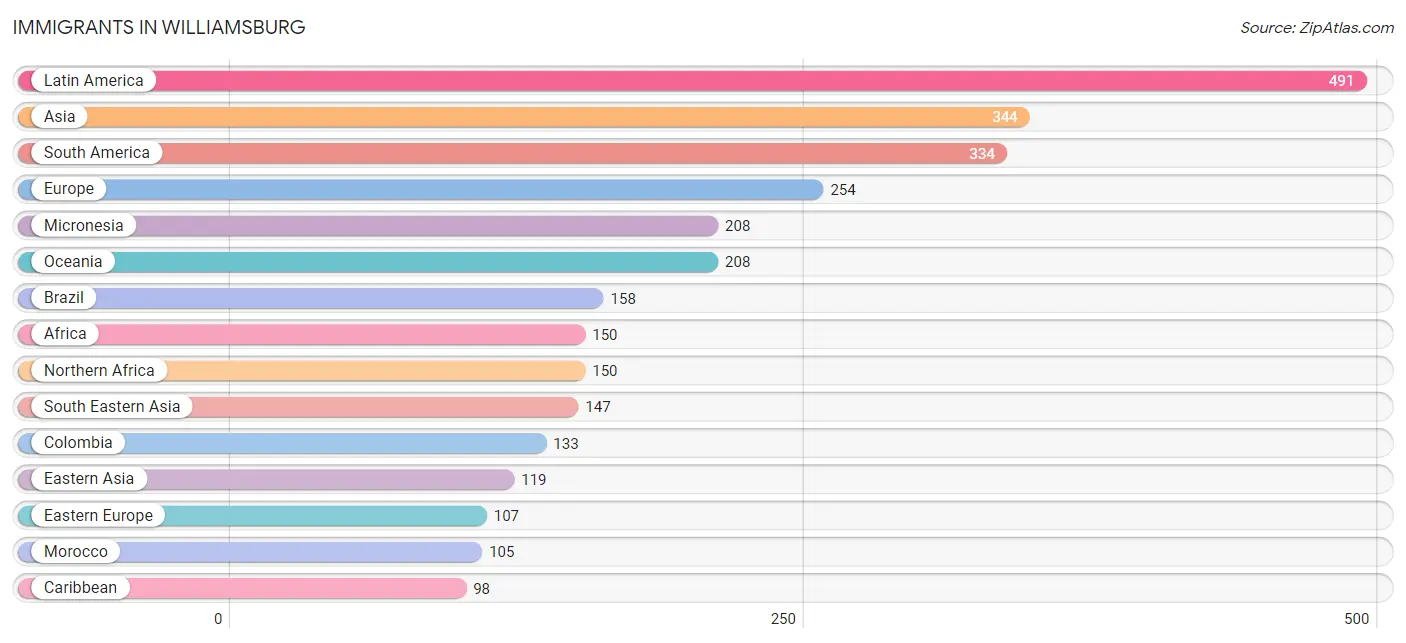
Immigrants in Williamsburg
The most numerous immigrant groups reported in Williamsburg came from Latin America (491 | 7.1%), Asia (344 | 5.0%), South America (334 | 4.8%), Europe (254 | 3.7%), and Micronesia (208 | 3.0%), together accounting for 23.6% of all Williamsburg residents.
| Immigration Origin | # Population | % Population |
| Africa | 150 | 2.2% |
| Asia | 344 | 5.0% |
| Brazil | 158 | 2.3% |
| Bulgaria | 30 | 0.4% |
| Canada | 21 | 0.3% |
| Caribbean | 98 | 1.4% |
| Central America | 59 | 0.9% |
| China | 67 | 1.0% |
| Colombia | 133 | 1.9% |
| Cuba | 32 | 0.5% |
| Dominican Republic | 25 | 0.4% |
| Eastern Asia | 119 | 1.7% |
| Eastern Europe | 107 | 1.5% |
| England | 20 | 0.3% |
| Europe | 254 | 3.7% |
| France | 13 | 0.2% |
| Germany | 55 | 0.8% |
| Haiti | 22 | 0.3% |
| Iran | 5 | 0.1% |
| Jamaica | 19 | 0.3% |
| Japan | 45 | 0.6% |
| Korea | 7 | 0.1% |
| Latin America | 491 | 7.1% |
| Lebanon | 36 | 0.5% |
| Mexico | 43 | 0.6% |
| Micronesia | 208 | 3.0% |
| Morocco | 105 | 1.5% |
| Northern Africa | 150 | 2.2% |
| Northern Europe | 52 | 0.7% |
| Norway | 24 | 0.4% |
| Oceania | 208 | 3.0% |
| Panama | 16 | 0.2% |
| Philippines | 76 | 1.1% |
| Romania | 32 | 0.5% |
| Russia | 45 | 0.6% |
| South America | 334 | 4.8% |
| South Central Asia | 5 | 0.1% |
| South Eastern Asia | 147 | 2.1% |
| Southern Europe | 27 | 0.4% |
| Spain | 27 | 0.4% |
| Turkey | 37 | 0.5% |
| Venezuela | 43 | 0.6% |
| Vietnam | 71 | 1.0% |
| Western Asia | 73 | 1.1% |
| Western Europe | 68 | 1.0% | View All 45 Rows |
Sex and Age in Williamsburg
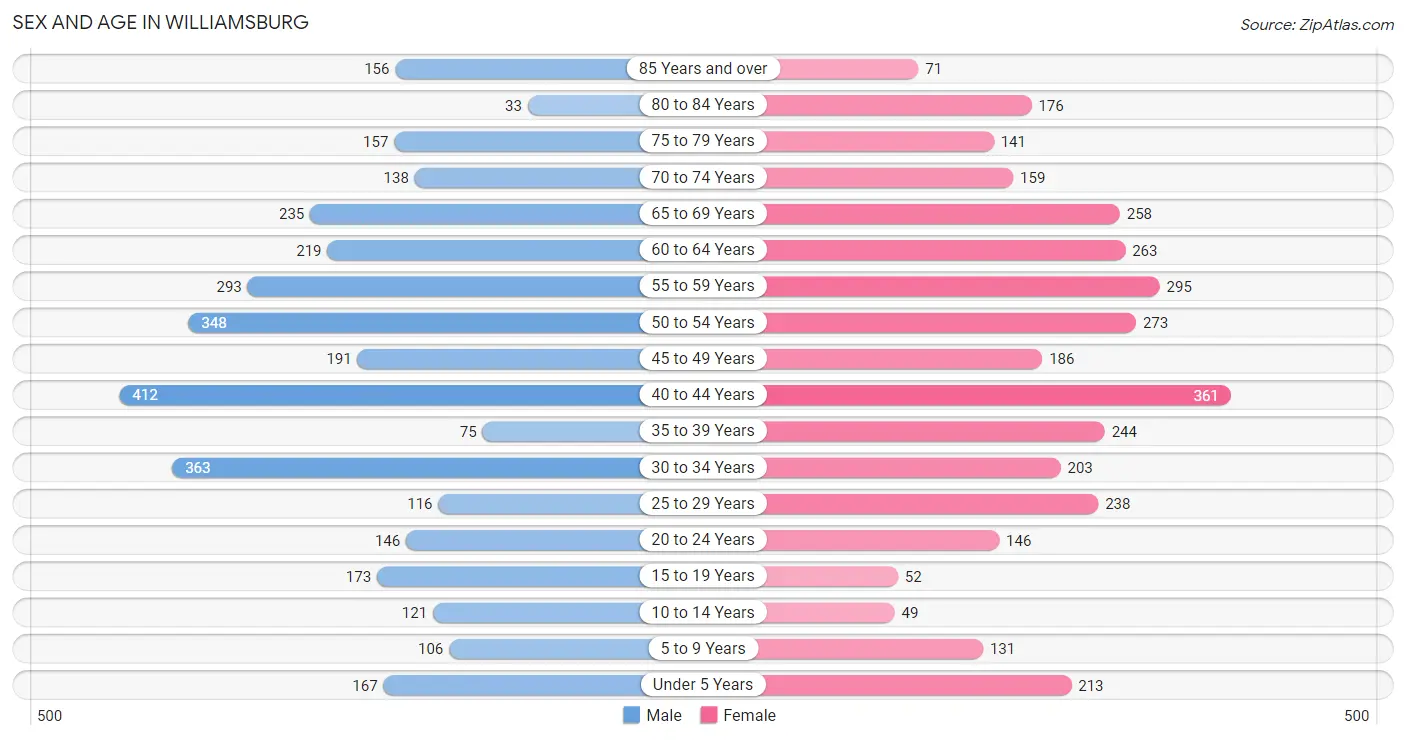
Sex and Age in Williamsburg
The most populous age groups in Williamsburg are 40 to 44 Years (412 | 11.9%) for men and 40 to 44 Years (361 | 10.4%) for women.
| Age Bracket | Male | Female |
| Under 5 Years | 167 (4.8%) | 213 (6.2%) |
| 5 to 9 Years | 106 (3.1%) | 131 (3.8%) |
| 10 to 14 Years | 121 (3.5%) | 49 (1.4%) |
| 15 to 19 Years | 173 (5.0%) | 52 (1.5%) |
| 20 to 24 Years | 146 (4.2%) | 146 (4.2%) |
| 25 to 29 Years | 116 (3.4%) | 238 (6.9%) |
| 30 to 34 Years | 363 (10.5%) | 203 (5.9%) |
| 35 to 39 Years | 75 (2.2%) | 244 (7.0%) |
| 40 to 44 Years | 412 (11.9%) | 361 (10.4%) |
| 45 to 49 Years | 191 (5.5%) | 186 (5.4%) |
| 50 to 54 Years | 348 (10.1%) | 273 (7.9%) |
| 55 to 59 Years | 293 (8.5%) | 295 (8.5%) |
| 60 to 64 Years | 219 (6.4%) | 263 (7.6%) |
| 65 to 69 Years | 235 (6.8%) | 258 (7.5%) |
| 70 to 74 Years | 138 (4.0%) | 159 (4.6%) |
| 75 to 79 Years | 157 (4.5%) | 141 (4.1%) |
| 80 to 84 Years | 33 (1.0%) | 176 (5.1%) |
| 85 Years and over | 156 (4.5%) | 71 (2.1%) |
| Total | 3,449 (100.0%) | 3,459 (100.0%) |
Families and Households in Williamsburg
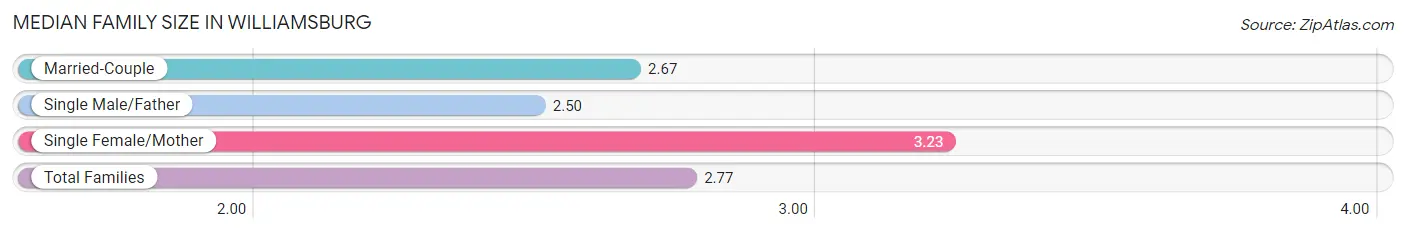
Median Family Size in Williamsburg
The median family size in Williamsburg is 2.77 persons per family, with single female/mother families (332 | 18.4%) accounting for the largest median family size of 3.23 persons per family. On the other hand, single male/father families (60 | 3.3%) represent the smallest median family size with 2.50 persons per family.
| Family Type | # Families | Family Size |
| Married-Couple | 1,415 (78.3%) | 2.67 |
| Single Male/Father | 60 (3.3%) | 2.50 |
| Single Female/Mother | 332 (18.4%) | 3.23 |
| Total Families | 1,807 (100.0%) | 2.77 |
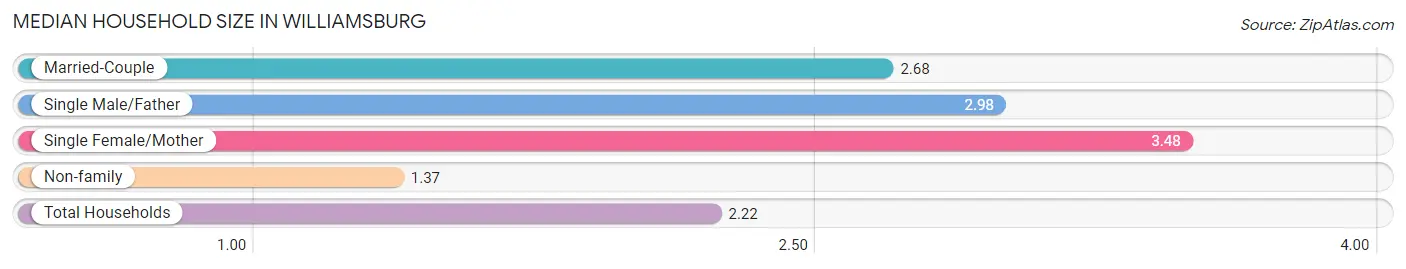
Median Household Size in Williamsburg
The median household size in Williamsburg is 2.22 persons per household, with single female/mother households (332 | 10.7%) accounting for the largest median household size of 3.48 persons per household. non-family households (1,299 | 41.8%) represent the smallest median household size with 1.37 persons per household.
| Household Type | # Households | Household Size |
| Married-Couple | 1,415 (45.6%) | 2.68 |
| Single Male/Father | 60 (1.9%) | 2.98 |
| Single Female/Mother | 332 (10.7%) | 3.48 |
| Non-family | 1,299 (41.8%) | 1.37 |
| Total Households | 3,106 (100.0%) | 2.22 |
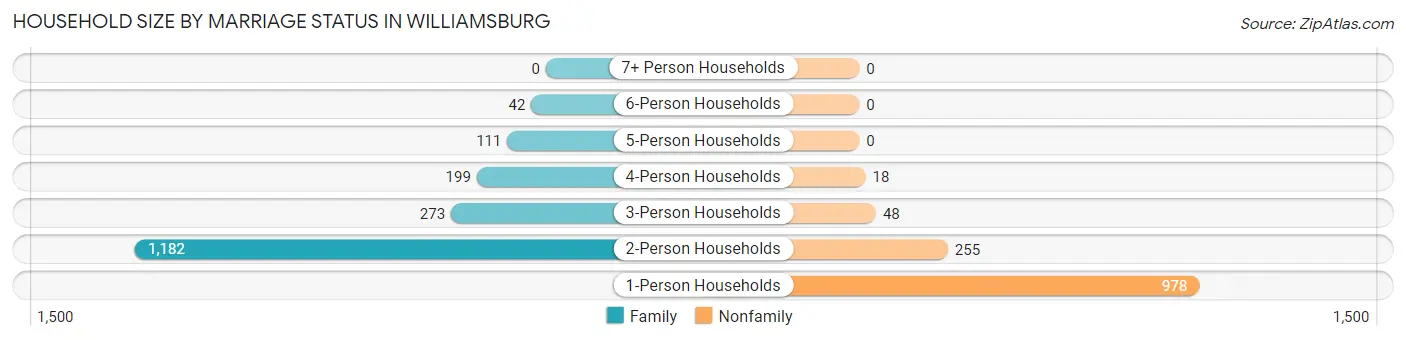
Household Size by Marriage Status in Williamsburg
Out of a total of 3,106 households in Williamsburg, 1,807 (58.2%) are family households, while 1,299 (41.8%) are nonfamily households. The most numerous type of family households are 2-person households, comprising 1,182, and the most common type of nonfamily households are 1-person households, comprising 978.
| Household Size | Family Households | Nonfamily Households |
| 1-Person Households | - | 978 (31.5%) |
| 2-Person Households | 1,182 (38.1%) | 255 (8.2%) |
| 3-Person Households | 273 (8.8%) | 48 (1.5%) |
| 4-Person Households | 199 (6.4%) | 18 (0.6%) |
| 5-Person Households | 111 (3.6%) | 0 (0.0%) |
| 6-Person Households | 42 (1.3%) | 0 (0.0%) |
| 7+ Person Households | 0 (0.0%) | 0 (0.0%) |
| Total | 1,807 (58.2%) | 1,299 (41.8%) |
Female Fertility in Williamsburg
Fertility by Age in Williamsburg
Average fertility rate in Williamsburg is 29.0 births per 1,000 women. Women in the age bracket of 35 to 50 years have the highest fertility rate with 37.0 births per 1,000 women. Women in the age bracket of 35 to 50 years acount for 71.4% of all women with births.
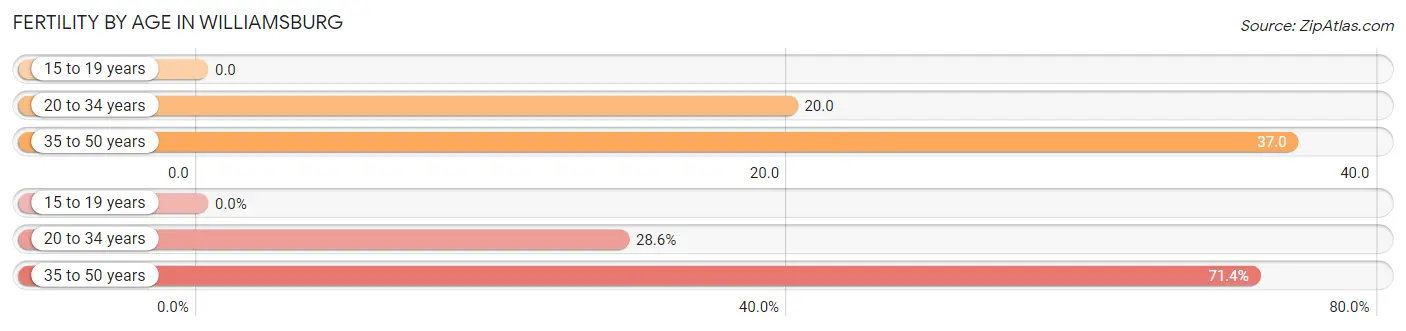
| Age Bracket | Women with Births | Births / 1,000 Women |
| 15 to 19 years | 0 (0.0%) | 0.0 |
| 20 to 34 years | 12 (28.6%) | 20.0 |
| 35 to 50 years | 30 (71.4%) | 37.0 |
| Total | 42 (100.0%) | 29.0 |
Fertility by Age by Marriage Status in Williamsburg
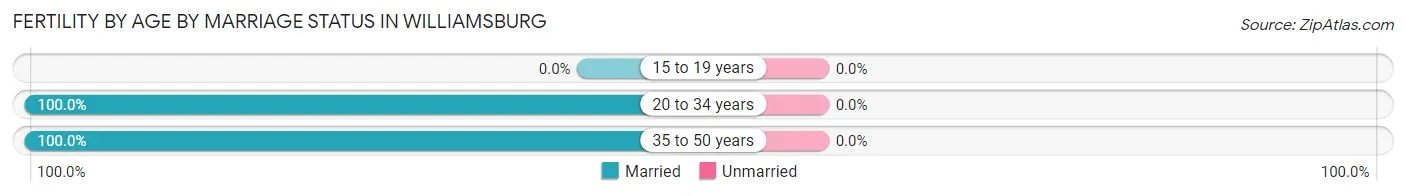
| Age Bracket | Married | Unmarried |
| 15 to 19 years | 0 (0.0%) | 0 (0.0%) |
| 20 to 34 years | 12 (100.0%) | 0 (0.0%) |
| 35 to 50 years | 30 (100.0%) | 0 (0.0%) |
| Total | 42 (100.0%) | 0 (0.0%) |
Fertility by Education in Williamsburg
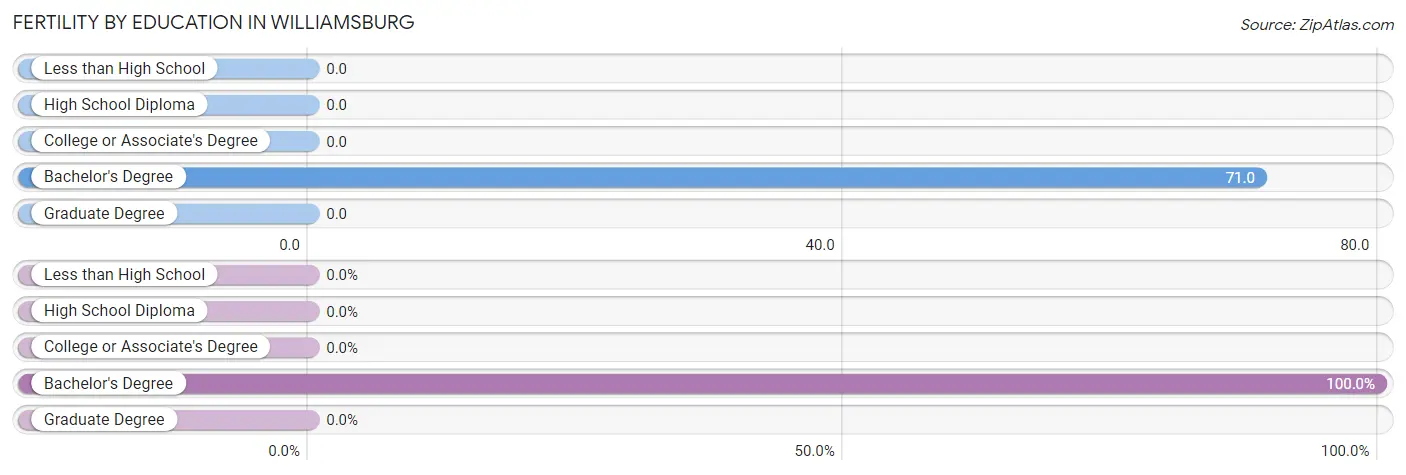
| Educational Attainment | Women with Births | Births / 1,000 Women |
| Less than High School | 0 (0.0%) | 0.0 |
| High School Diploma | 0 (0.0%) | 0.0 |
| College or Associate's Degree | 0 (0.0%) | 0.0 |
| Bachelor's Degree | 42 (100.0%) | 71.0 |
| Graduate Degree | 0 (0.0%) | 0.0 |
| Total | 42 (100.0%) | 29.0 |
Fertility by Education by Marriage Status in Williamsburg
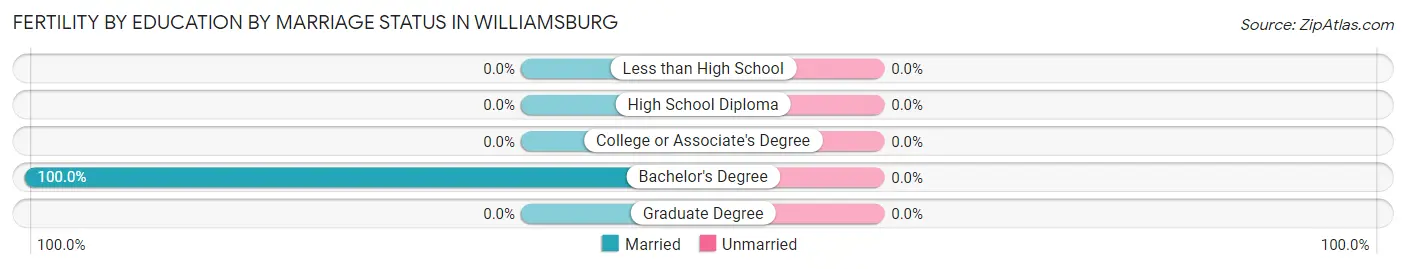
| Educational Attainment | Married | Unmarried |
| Less than High School | 0 (0.0%) | 0 (0.0%) |
| High School Diploma | 0 (0.0%) | 0 (0.0%) |
| College or Associate's Degree | 0 (0.0%) | 0 (0.0%) |
| Bachelor's Degree | 42 (100.0%) | 0 (0.0%) |
| Graduate Degree | 0 (0.0%) | 0 (0.0%) |
| Total | 42 (100.0%) | 0 (0.0%) |
Income in Williamsburg
Income Overview in Williamsburg
Per Capita Income in Williamsburg is $39,602, while median incomes of families and households are $93,295 and $71,853 respectively.
| Characteristic | Number | Measure |
| Per Capita Income | 6,908 | $39,602 |
| Median Family Income | 1,807 | $93,295 |
| Mean Family Income | 1,807 | $95,837 |
| Median Household Income | 3,106 | $71,853 |
| Mean Household Income | 3,106 | $84,189 |
| Income Deficit | 1,807 | $10,113 |
| Wage / Income Gap (%) | 6,908 | 27.28% |
| Wage / Income Gap ($) | 6,908 | 72.72¢ per $1 |
| Gini / Inequality Index | 6,908 | 0.41 |
Earnings by Sex in Williamsburg
Average Earnings in Williamsburg are $45,099, $50,714 for men and $36,881 for women, a difference of 27.3%.
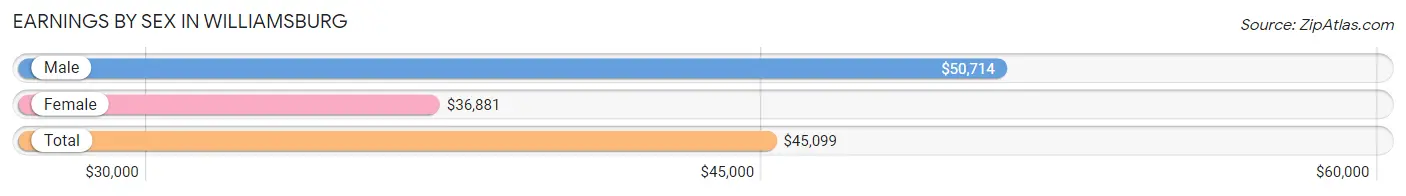
| Sex | Number | Average Earnings |
| Male | 1,828 (47.0%) | $50,714 |
| Female | 2,057 (52.9%) | $36,881 |
| Total | 3,885 (100.0%) | $45,099 |
Earnings by Sex by Income Bracket in Williamsburg
The most common earnings brackets in Williamsburg are $35,000 to $39,999 for men (254 | 13.9%) and $50,000 to $54,999 for women (227 | 11.0%).
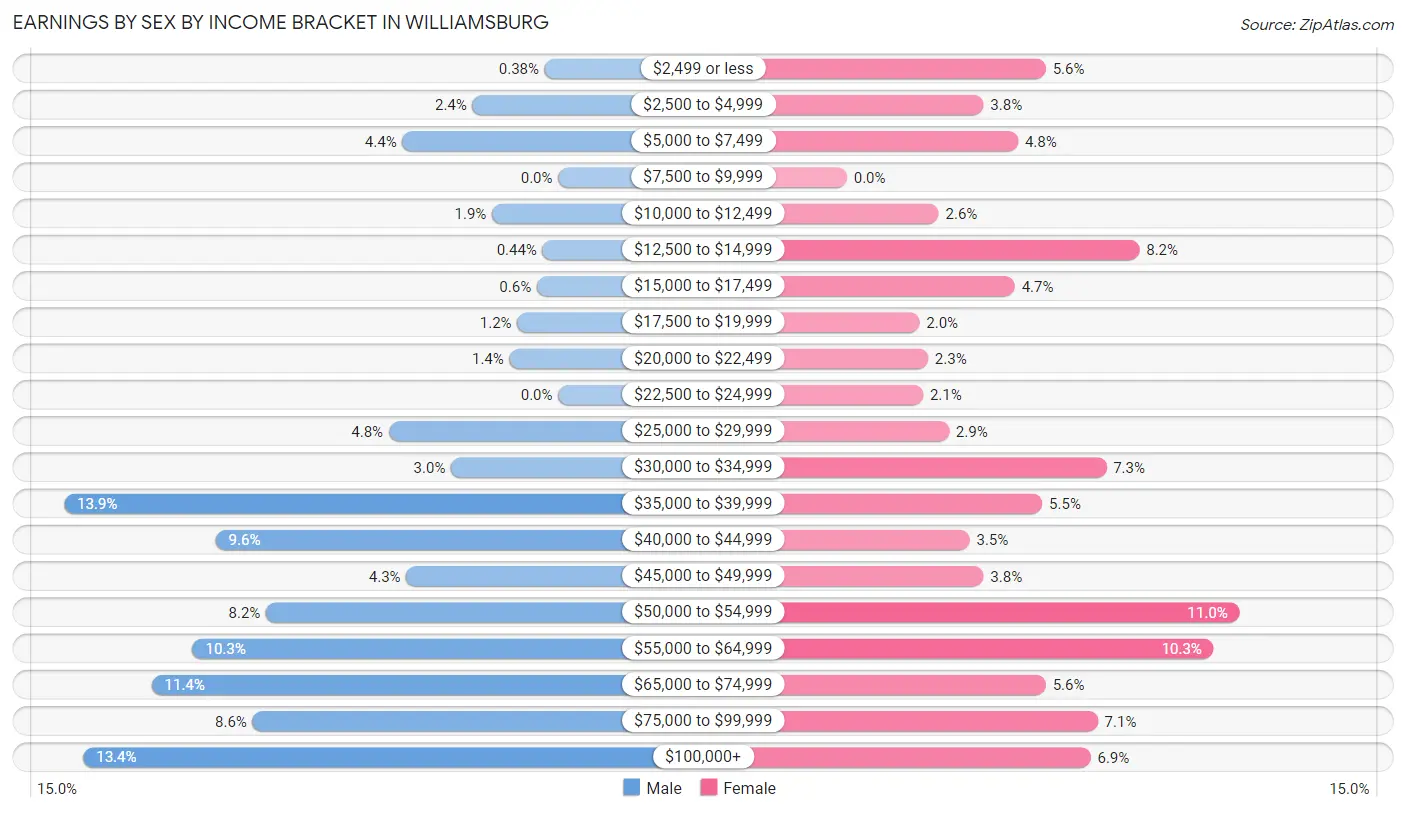
| Income | Male | Female |
| $2,499 or less | 7 (0.4%) | 115 (5.6%) |
| $2,500 to $4,999 | 44 (2.4%) | 79 (3.8%) |
| $5,000 to $7,499 | 80 (4.4%) | 99 (4.8%) |
| $7,500 to $9,999 | 0 (0.0%) | 0 (0.0%) |
| $10,000 to $12,499 | 34 (1.9%) | 53 (2.6%) |
| $12,500 to $14,999 | 8 (0.4%) | 169 (8.2%) |
| $15,000 to $17,499 | 11 (0.6%) | 97 (4.7%) |
| $17,500 to $19,999 | 21 (1.1%) | 42 (2.0%) |
| $20,000 to $22,499 | 25 (1.4%) | 47 (2.3%) |
| $22,500 to $24,999 | 0 (0.0%) | 44 (2.1%) |
| $25,000 to $29,999 | 87 (4.8%) | 59 (2.9%) |
| $30,000 to $34,999 | 55 (3.0%) | 150 (7.3%) |
| $35,000 to $39,999 | 254 (13.9%) | 113 (5.5%) |
| $40,000 to $44,999 | 176 (9.6%) | 71 (3.5%) |
| $45,000 to $49,999 | 78 (4.3%) | 79 (3.8%) |
| $50,000 to $54,999 | 150 (8.2%) | 227 (11.0%) |
| $55,000 to $64,999 | 188 (10.3%) | 212 (10.3%) |
| $65,000 to $74,999 | 209 (11.4%) | 115 (5.6%) |
| $75,000 to $99,999 | 157 (8.6%) | 145 (7.0%) |
| $100,000+ | 244 (13.4%) | 141 (6.9%) |
| Total | 1,828 (100.0%) | 2,057 (100.0%) |
Earnings by Sex by Educational Attainment in Williamsburg
Average earnings in Williamsburg are $51,618 for men and $41,250 for women, a difference of 20.1%. Men with an educational attainment of graduate degree enjoy the highest average annual earnings of $77,279, while those with high school diploma education earn the least with $43,271. Women with an educational attainment of graduate degree earn the most with the average annual earnings of $68,875, while those with college or associate's degree education have the smallest earnings of $32,127.
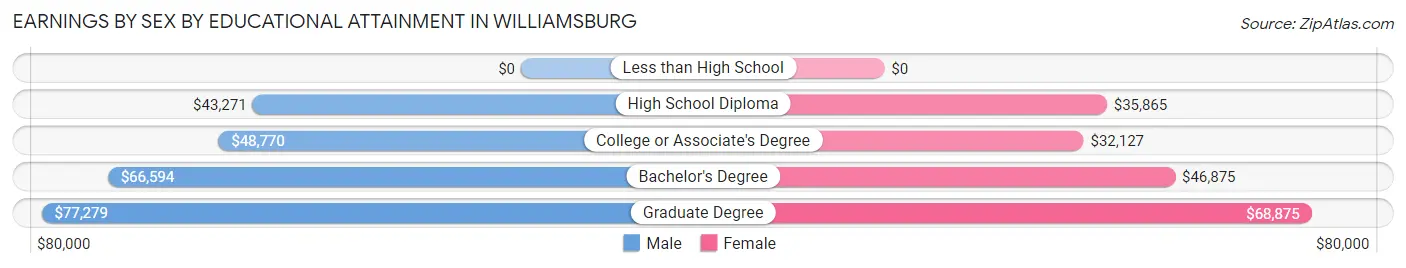
| Educational Attainment | Male Income | Female Income |
| Less than High School | - | - |
| High School Diploma | $43,271 | $35,865 |
| College or Associate's Degree | $48,770 | $32,127 |
| Bachelor's Degree | $66,594 | $46,875 |
| Graduate Degree | $77,279 | $68,875 |
| Total | $51,618 | $41,250 |
Family Income in Williamsburg
Family Income Brackets in Williamsburg
According to the Williamsburg family income data, there are 537 families falling into the $100,000 to $149,999 income range, which is the most common income bracket and makes up 29.7% of all families.
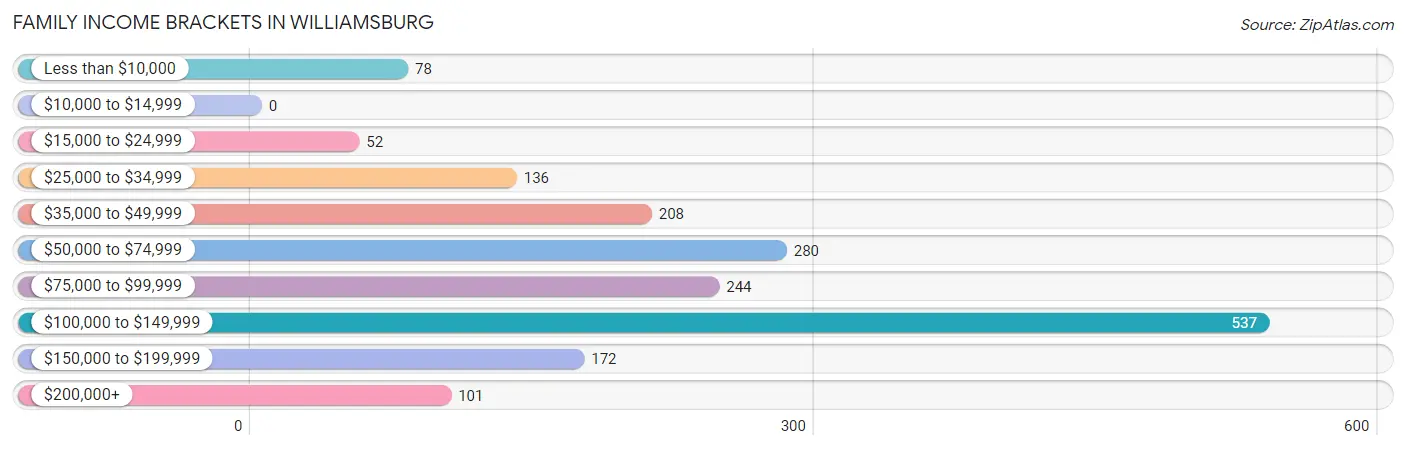
| Income Bracket | # Families | % Families |
| Less than $10,000 | 78 | 4.3% |
| $10,000 to $14,999 | 0 | 0.0% |
| $15,000 to $24,999 | 52 | 2.9% |
| $25,000 to $34,999 | 136 | 7.5% |
| $35,000 to $49,999 | 208 | 11.5% |
| $50,000 to $74,999 | 280 | 15.5% |
| $75,000 to $99,999 | 244 | 13.5% |
| $100,000 to $149,999 | 537 | 29.7% |
| $150,000 to $199,999 | 172 | 9.5% |
| $200,000+ | 101 | 5.6% |
Family Income by Famaliy Size in Williamsburg
5-person families (116 | 6.4%) account for the highest median family income in Williamsburg with $116,371 per family, while 2-person families (1,202 | 66.5%) have the highest median income of $35,673 per family member.
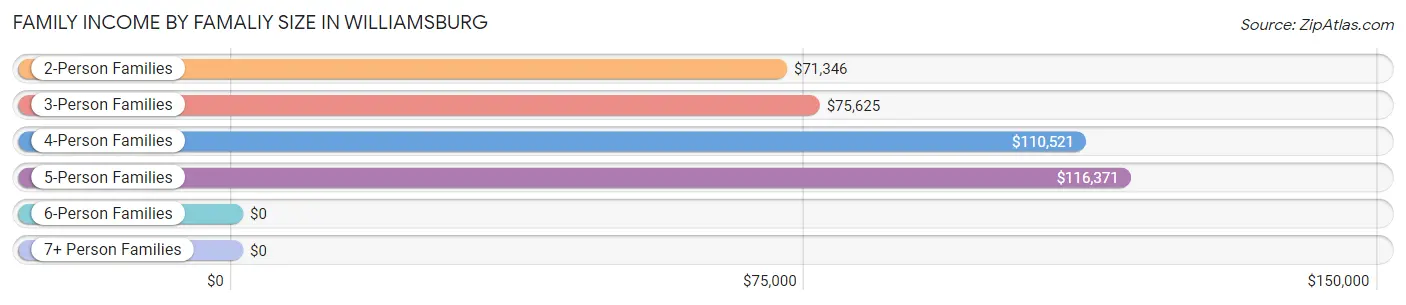
| Income Bracket | # Families | Median Income |
| 2-Person Families | 1,202 (66.5%) | $71,346 |
| 3-Person Families | 253 (14.0%) | $75,625 |
| 4-Person Families | 224 (12.4%) | $110,521 |
| 5-Person Families | 116 (6.4%) | $116,371 |
| 6-Person Families | 12 (0.7%) | $0 |
| 7+ Person Families | 0 (0.0%) | $0 |
| Total | 1,807 (100.0%) | $93,295 |
Family Income by Number of Earners in Williamsburg
The median family income in Williamsburg is $93,295, with families comprising 3+ earners (43) having the highest median family income of $141,750, while families with no earners (397) have the lowest median family income of $35,653, accounting for 2.4% and 22.0% of families, respectively.
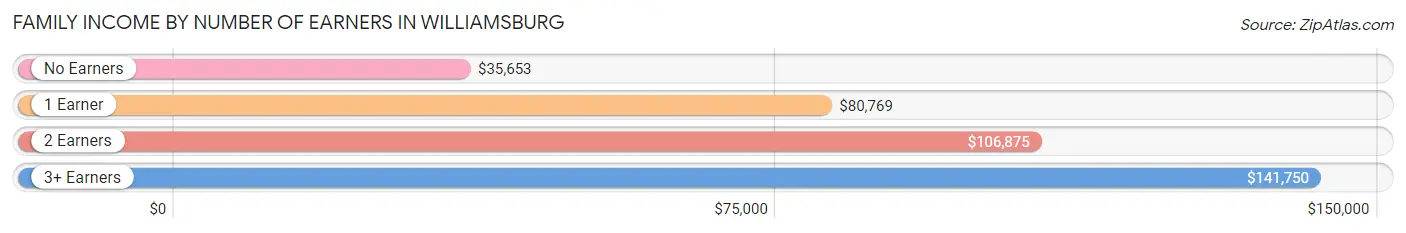
| Number of Earners | # Families | Median Income |
| No Earners | 397 (22.0%) | $35,653 |
| 1 Earner | 432 (23.9%) | $80,769 |
| 2 Earners | 935 (51.7%) | $106,875 |
| 3+ Earners | 43 (2.4%) | $141,750 |
| Total | 1,807 (100.0%) | $93,295 |
Household Income in Williamsburg
Household Income Brackets in Williamsburg
With 739 households falling in the category, the $100,000 to $149,999 income range is the most frequent in Williamsburg, accounting for 23.8% of all households. In contrast, only 102 households (3.3%) fall into the $10,000 to $14,999 income bracket, making it the least populous group.
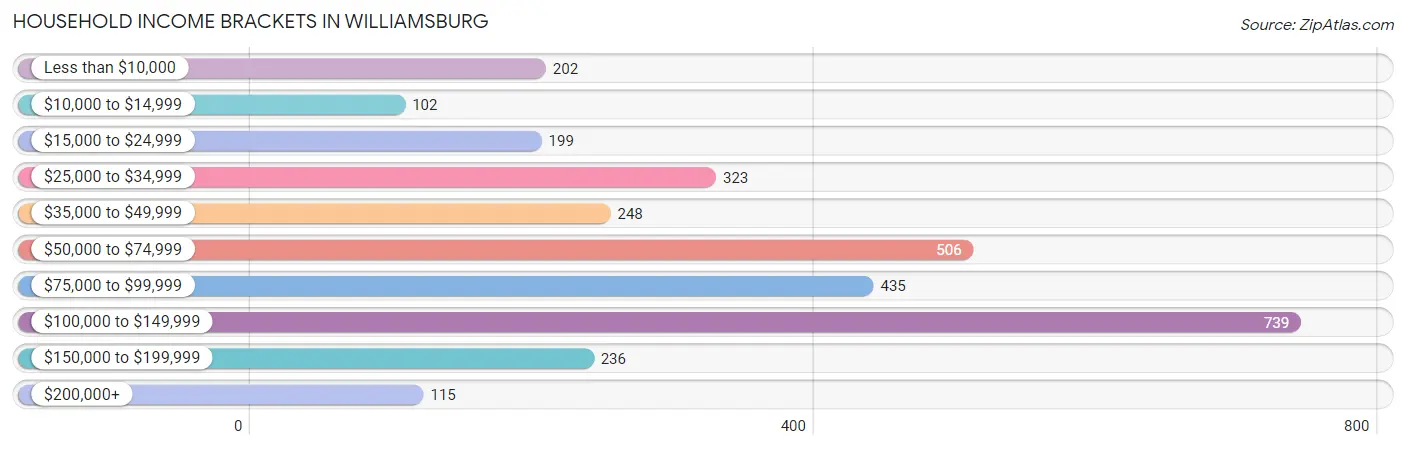
| Income Bracket | # Households | % Households |
| Less than $10,000 | 202 | 6.5% |
| $10,000 to $14,999 | 102 | 3.3% |
| $15,000 to $24,999 | 199 | 6.4% |
| $25,000 to $34,999 | 323 | 10.4% |
| $35,000 to $49,999 | 248 | 8.0% |
| $50,000 to $74,999 | 506 | 16.3% |
| $75,000 to $99,999 | 435 | 14.0% |
| $100,000 to $149,999 | 739 | 23.8% |
| $150,000 to $199,999 | 236 | 7.6% |
| $200,000+ | 115 | 3.7% |
Household Income by Householder Age in Williamsburg
The median household income in Williamsburg is $71,853, with the highest median household income of $91,607 found in the 25 to 44 years age bracket for the primary householder. A total of 980 households (31.6%) fall into this category. Meanwhile, the 15 to 24 years age bracket for the primary householder has the lowest median household income of $0, with 15 households (0.5%) in this group.
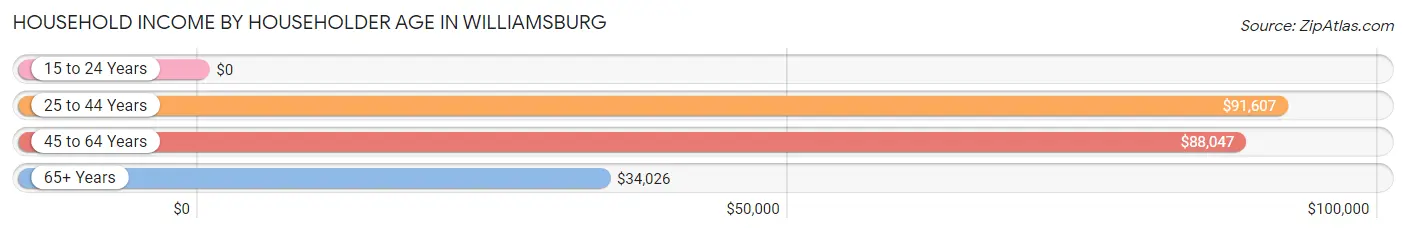
| Income Bracket | # Households | Median Income |
| 15 to 24 Years | 15 (0.5%) | $0 |
| 25 to 44 Years | 980 (31.6%) | $91,607 |
| 45 to 64 Years | 1,119 (36.0%) | $88,047 |
| 65+ Years | 992 (31.9%) | $34,026 |
| Total | 3,106 (100.0%) | $71,853 |
Poverty in Williamsburg
Income Below Poverty by Sex and Age in Williamsburg
With 9.5% poverty level for males and 5.0% for females among the residents of Williamsburg, 65 to 74 year old males and 25 to 34 year old females are the most vulnerable to poverty, with 67 males (18.0%) and 61 females (13.8%) in their respective age groups living below the poverty level.
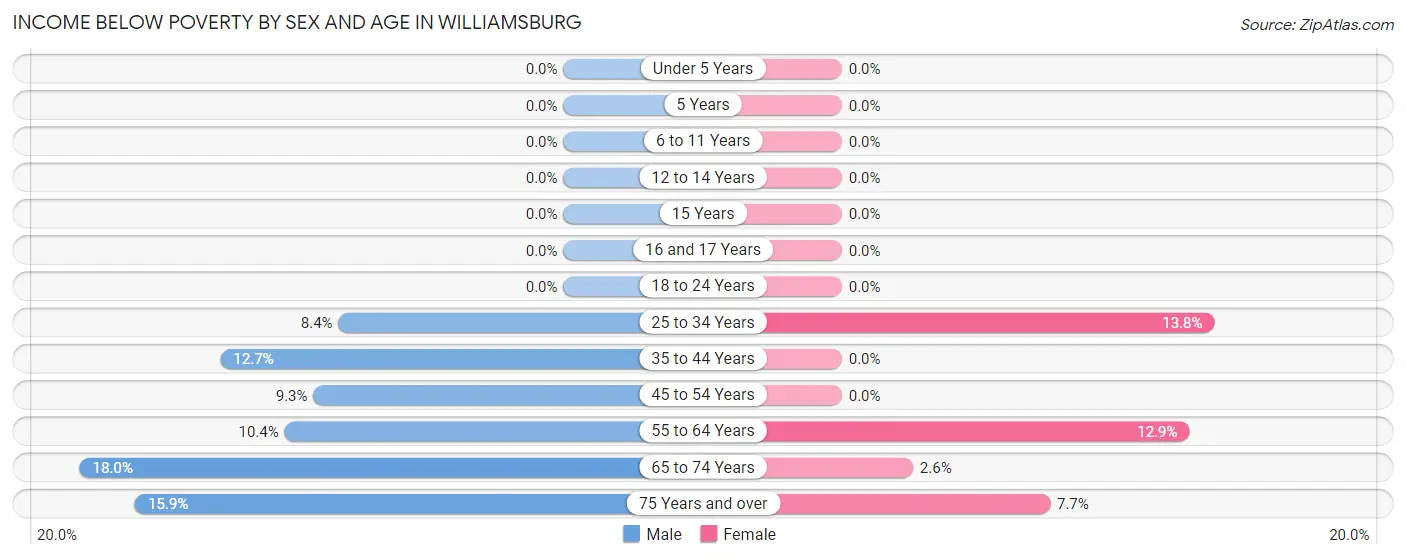
| Age Bracket | Male | Female |
| Under 5 Years | 0 (0.0%) | 0 (0.0%) |
| 5 Years | 0 (0.0%) | 0 (0.0%) |
| 6 to 11 Years | 0 (0.0%) | 0 (0.0%) |
| 12 to 14 Years | 0 (0.0%) | 0 (0.0%) |
| 15 Years | 0 (0.0%) | 0 (0.0%) |
| 16 and 17 Years | 0 (0.0%) | 0 (0.0%) |
| 18 to 24 Years | 0 (0.0%) | 0 (0.0%) |
| 25 to 34 Years | 40 (8.4%) | 61 (13.8%) |
| 35 to 44 Years | 62 (12.7%) | 0 (0.0%) |
| 45 to 54 Years | 50 (9.3%) | 0 (0.0%) |
| 55 to 64 Years | 53 (10.3%) | 72 (12.9%) |
| 65 to 74 Years | 67 (18.0%) | 11 (2.6%) |
| 75 Years and over | 55 (15.9%) | 30 (7.7%) |
| Total | 327 (9.5%) | 174 (5.0%) |
Income Above Poverty by Sex and Age in Williamsburg
According to the poverty statistics in Williamsburg, males aged under 5 years and females aged under 5 years are the age groups that are most secure financially, with 100.0% of males and 100.0% of females in these age groups living above the poverty line.
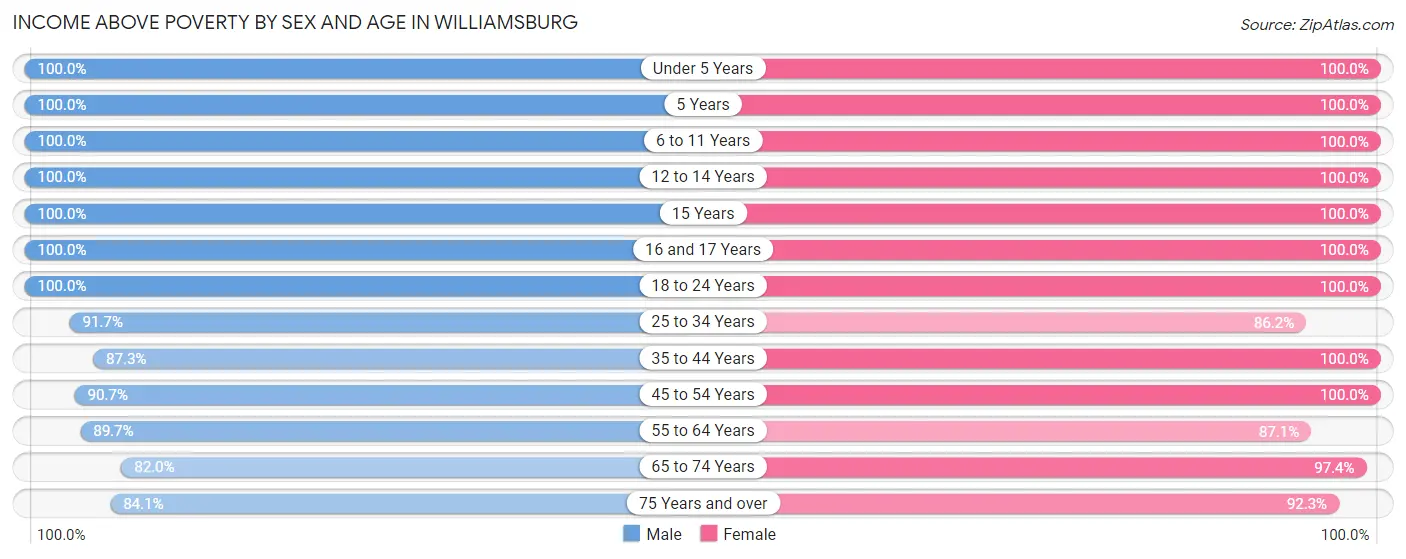
| Age Bracket | Male | Female |
| Under 5 Years | 167 (100.0%) | 213 (100.0%) |
| 5 Years | 18 (100.0%) | 12 (100.0%) |
| 6 to 11 Years | 175 (100.0%) | 119 (100.0%) |
| 12 to 14 Years | 34 (100.0%) | 49 (100.0%) |
| 15 Years | 31 (100.0%) | 25 (100.0%) |
| 16 and 17 Years | 109 (100.0%) | 27 (100.0%) |
| 18 to 24 Years | 179 (100.0%) | 146 (100.0%) |
| 25 to 34 Years | 439 (91.6%) | 380 (86.2%) |
| 35 to 44 Years | 425 (87.3%) | 605 (100.0%) |
| 45 to 54 Years | 489 (90.7%) | 459 (100.0%) |
| 55 to 64 Years | 459 (89.6%) | 486 (87.1%) |
| 65 to 74 Years | 306 (82.0%) | 406 (97.4%) |
| 75 Years and over | 291 (84.1%) | 358 (92.3%) |
| Total | 3,122 (90.5%) | 3,285 (95.0%) |
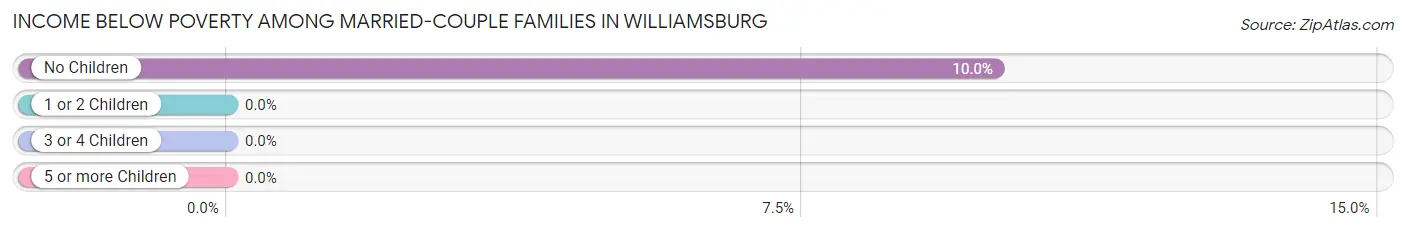
Income Below Poverty Among Married-Couple Families in Williamsburg
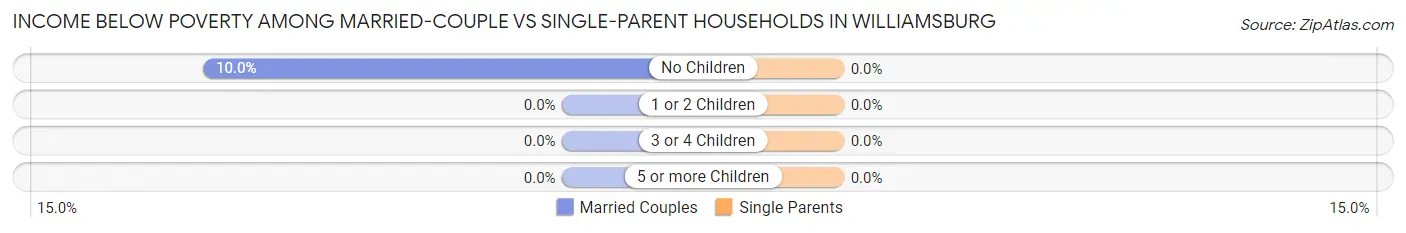
The poverty statistics for married-couple families in Williamsburg show that 7.1% or 101 of the total 1,415 families live below the poverty line. Families with no children have the highest poverty rate of 10.0%, comprising of 101 families. On the other hand, families with 1 or 2 children have the lowest poverty rate of 0.0%, which includes 0 families.
| Children | Above Poverty | Below Poverty |
| No Children | 908 (90.0%) | 101 (10.0%) |
| 1 or 2 Children | 338 (100.0%) | 0 (0.0%) |
| 3 or 4 Children | 68 (100.0%) | 0 (0.0%) |
| 5 or more Children | 0 (0.0%) | 0 (0.0%) |
| Total | 1,314 (92.9%) | 101 (7.1%) |
Income Below Poverty Among Single-Parent Households in Williamsburg
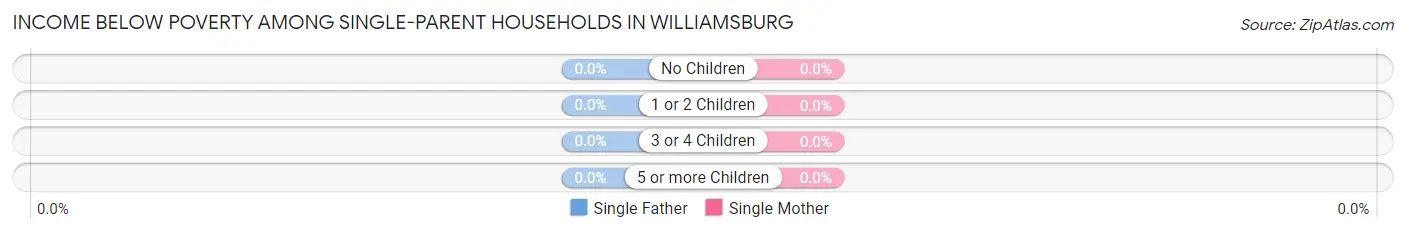
| Children | Single Father | Single Mother |
| No Children | 0 (0.0%) | 0 (0.0%) |
| 1 or 2 Children | 0 (0.0%) | 0 (0.0%) |
| 3 or 4 Children | 0 (0.0%) | 0 (0.0%) |
| 5 or more Children | 0 (0.0%) | 0 (0.0%) |
| Total | 0 (0.0%) | 0 (0.0%) |
Income Below Poverty Among Married-Couple vs Single-Parent Households in Williamsburg
| Children | Married-Couple Families | Single-Parent Households |
| No Children | 101 (10.0%) | 0 (0.0%) |
| 1 or 2 Children | 0 (0.0%) | 0 (0.0%) |
| 3 or 4 Children | 0 (0.0%) | 0 (0.0%) |
| 5 or more Children | 0 (0.0%) | 0 (0.0%) |
| Total | 101 (7.1%) | 0 (0.0%) |
Employment Characteristics in Williamsburg
Employment by Class of Employer in Williamsburg
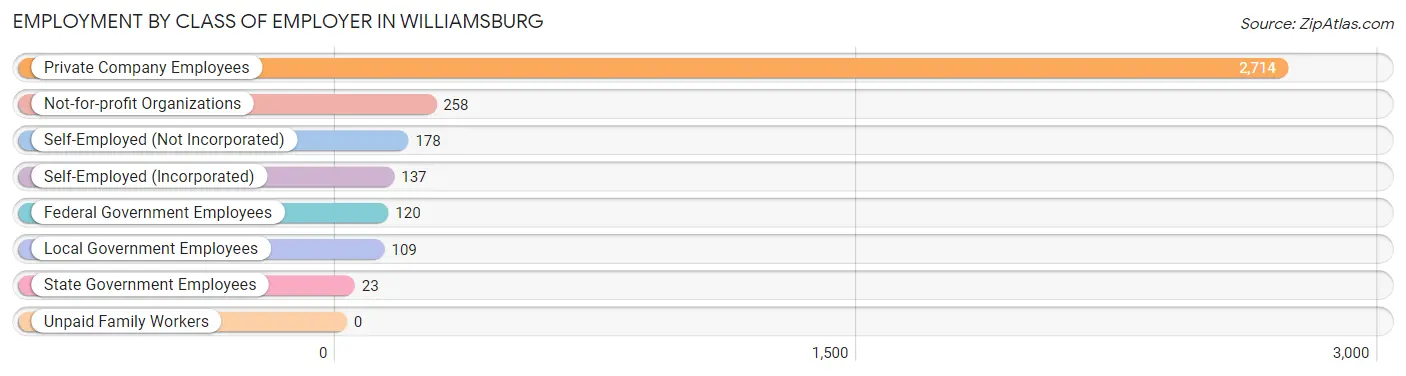
Among the 3,539 employed individuals in Williamsburg, private company employees (2,714 | 76.7%), not-for-profit organizations (258 | 7.3%), and self-employed (not incorporated) (178 | 5.0%) make up the most common classes of employment.
| Employer Class | # Employees | % Employees |
| Private Company Employees | 2,714 | 76.7% |
| Self-Employed (Incorporated) | 137 | 3.9% |
| Self-Employed (Not Incorporated) | 178 | 5.0% |
| Not-for-profit Organizations | 258 | 7.3% |
| Local Government Employees | 109 | 3.1% |
| State Government Employees | 23 | 0.6% |
| Federal Government Employees | 120 | 3.4% |
| Unpaid Family Workers | 0 | 0.0% |
| Total | 3,539 | 100.0% |
Employment Status by Age in Williamsburg
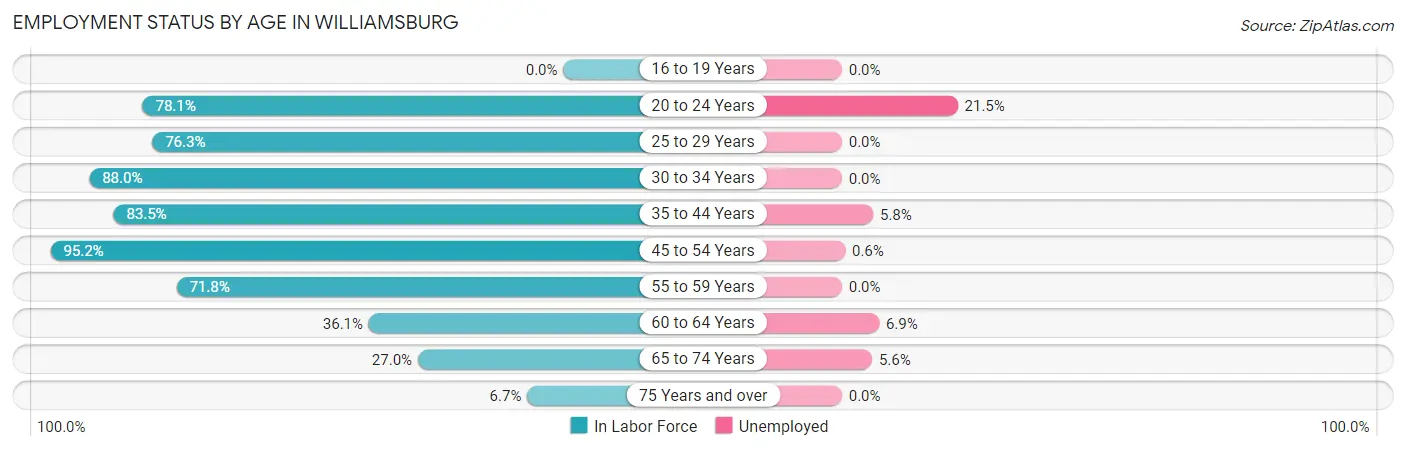
According to the labor force statistics for Williamsburg, out of the total population over 16 years of age (6,065), 61.3% or 3,718 individuals are in the labor force, with 3.6% or 134 of them unemployed. The age group with the highest labor force participation rate is 45 to 54 years, with 95.2% or 950 individuals in the labor force. Within the labor force, the 20 to 24 years age range has the highest percentage of unemployed individuals, with 21.5% or 49 of them being unemployed.
| Age Bracket | In Labor Force | Unemployed |
| 16 to 19 Years | 0 (0.0%) | 0 (0.0%) |
| 20 to 24 Years | 228 (78.1%) | 49 (21.5%) |
| 25 to 29 Years | 270 (76.3%) | 0 (0.0%) |
| 30 to 34 Years | 498 (88.0%) | 0 (0.0%) |
| 35 to 44 Years | 912 (83.5%) | 53 (5.8%) |
| 45 to 54 Years | 950 (95.2%) | 6 (0.6%) |
| 55 to 59 Years | 422 (71.8%) | 0 (0.0%) |
| 60 to 64 Years | 174 (36.1%) | 12 (6.9%) |
| 65 to 74 Years | 213 (27.0%) | 12 (5.6%) |
| 75 Years and over | 49 (6.7%) | 0 (0.0%) |
| Total | 3,718 (61.3%) | 134 (3.6%) |
Employment Status by Educational Attainment in Williamsburg
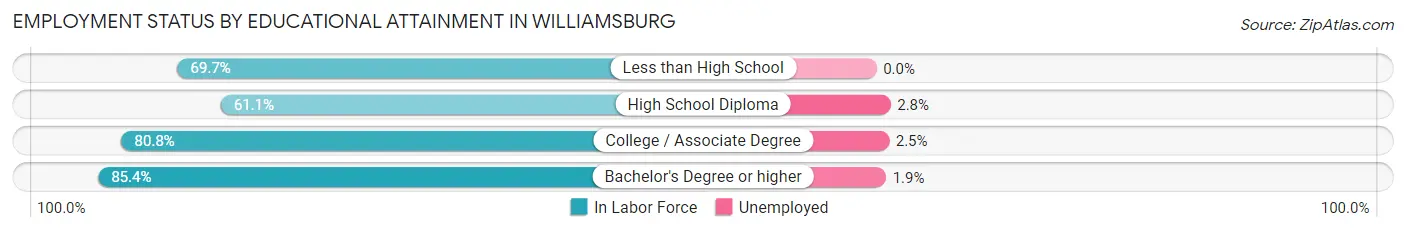
According to labor force statistics for Williamsburg, 79.1% of individuals (3,227) out of the total population between 25 and 64 years of age (4,080) are in the labor force, with 2.2% or 71 of them being unemployed. The group with the highest labor force participation rate are those with the educational attainment of bachelor's degree or higher, with 85.4% or 1,496 individuals in the labor force. Within the labor force, individuals with high school diploma education have the highest percentage of unemployment, with 2.8% or 12 of them being unemployed.
| Educational Attainment | In Labor Force | Unemployed |
| Less than High School | 83 (69.7%) | 0 (0.0%) |
| High School Diploma | 425 (61.1%) | 19 (2.8%) |
| College / Associate Degree | 1,223 (80.8%) | 38 (2.5%) |
| Bachelor's Degree or higher | 1,496 (85.4%) | 33 (1.9%) |
| Total | 3,227 (79.1%) | 90 (2.2%) |
Employment Occupations by Sex in Williamsburg
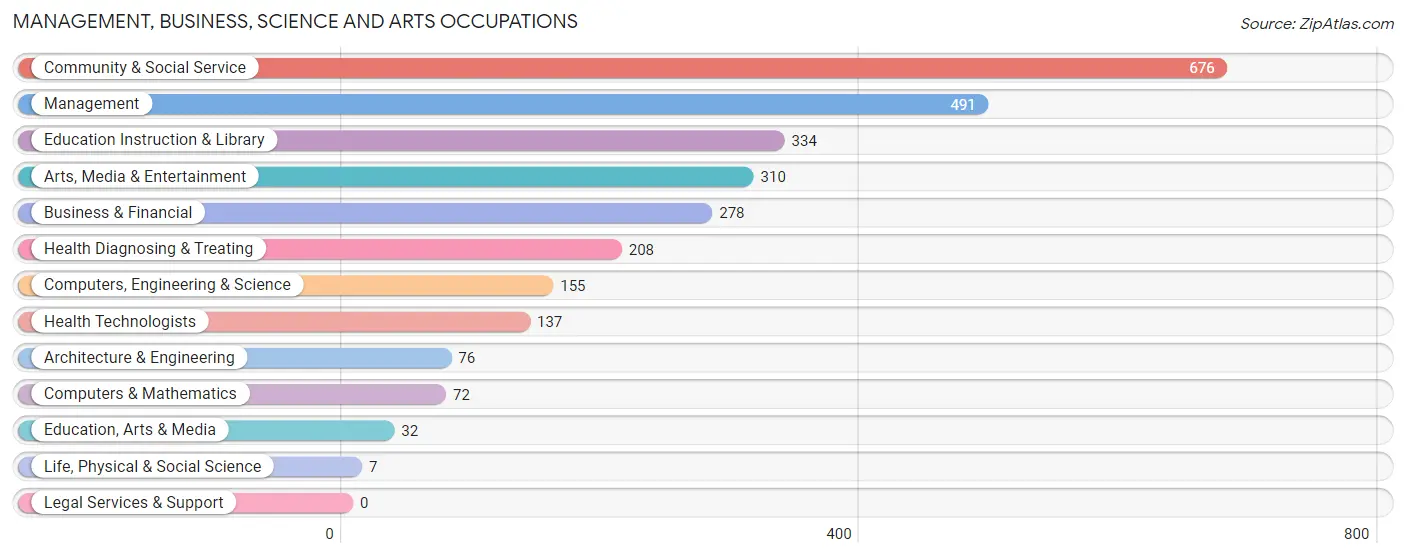
Management, Business, Science and Arts Occupations
The most common Management, Business, Science and Arts occupations in Williamsburg are Community & Social Service (676 | 18.9%), Management (491 | 13.7%), Education Instruction & Library (334 | 9.3%), Arts, Media & Entertainment (310 | 8.6%), and Business & Financial (278 | 7.8%).
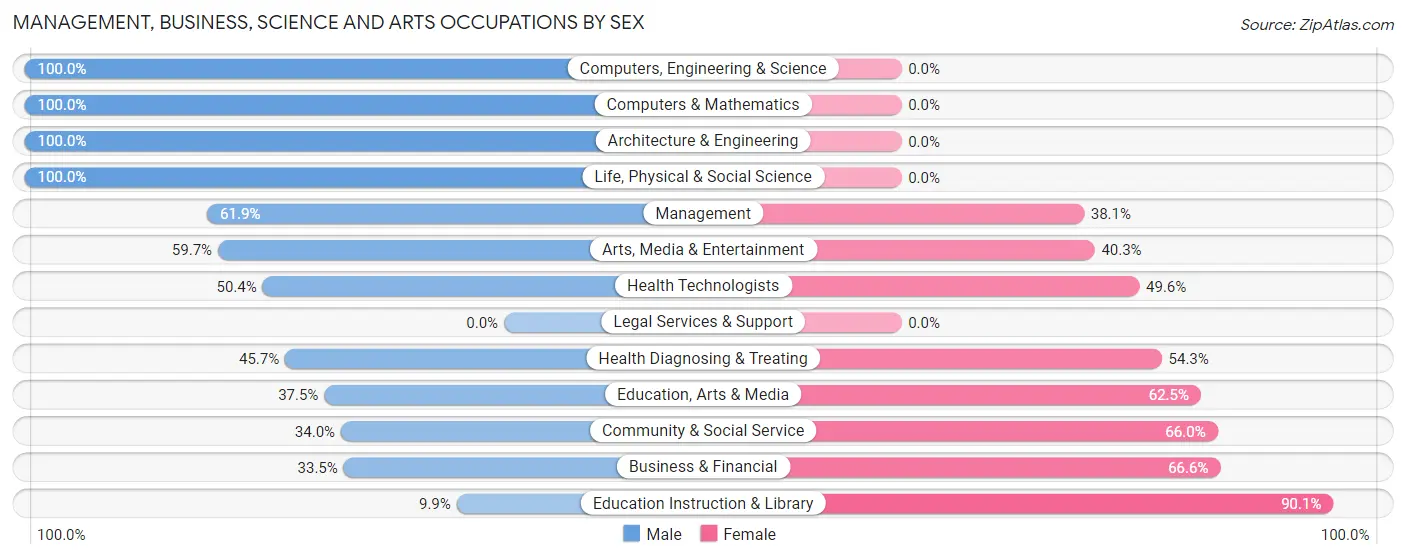
Management, Business, Science and Arts Occupations by Sex
Within the Management, Business, Science and Arts occupations in Williamsburg, the most male-oriented occupations are Computers, Engineering & Science (100.0%), Computers & Mathematics (100.0%), and Architecture & Engineering (100.0%), while the most female-oriented occupations are Education Instruction & Library (90.1%), Business & Financial (66.5%), and Community & Social Service (66.0%).
| Occupation | Male | Female |
| Management | 304 (61.9%) | 187 (38.1%) |
| Business & Financial | 93 (33.5%) | 185 (66.5%) |
| Computers, Engineering & Science | 155 (100.0%) | 0 (0.0%) |
| Computers & Mathematics | 72 (100.0%) | 0 (0.0%) |
| Architecture & Engineering | 76 (100.0%) | 0 (0.0%) |
| Life, Physical & Social Science | 7 (100.0%) | 0 (0.0%) |
| Community & Social Service | 230 (34.0%) | 446 (66.0%) |
| Education, Arts & Media | 12 (37.5%) | 20 (62.5%) |
| Legal Services & Support | 0 (0.0%) | 0 (0.0%) |
| Education Instruction & Library | 33 (9.9%) | 301 (90.1%) |
| Arts, Media & Entertainment | 185 (59.7%) | 125 (40.3%) |
| Health Diagnosing & Treating | 95 (45.7%) | 113 (54.3%) |
| Health Technologists | 69 (50.4%) | 68 (49.6%) |
| Total (Category) | 877 (48.5%) | 931 (51.5%) |
| Total (Overall) | 1,699 (47.4%) | 1,885 (52.6%) |
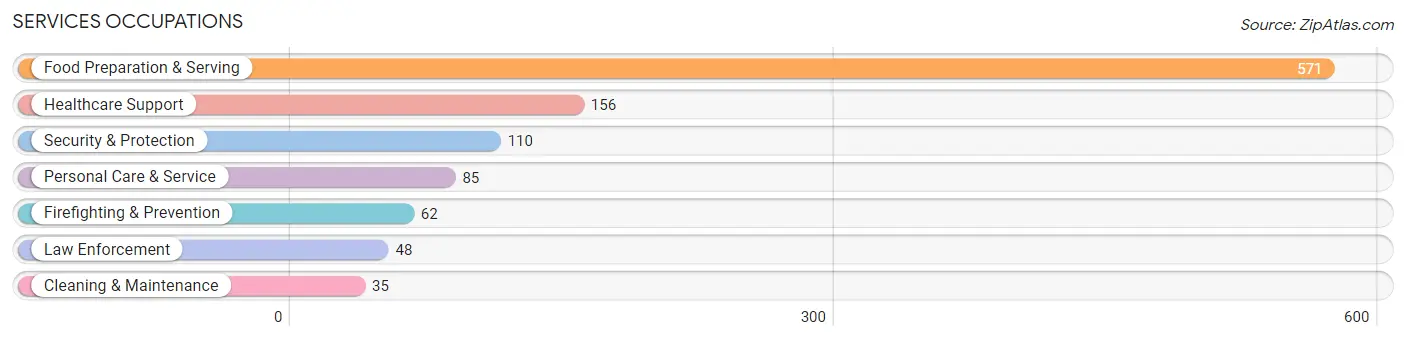
Services Occupations
The most common Services occupations in Williamsburg are Food Preparation & Serving (571 | 15.9%), Healthcare Support (156 | 4.3%), Security & Protection (110 | 3.1%), Personal Care & Service (85 | 2.4%), and Firefighting & Prevention (62 | 1.7%).
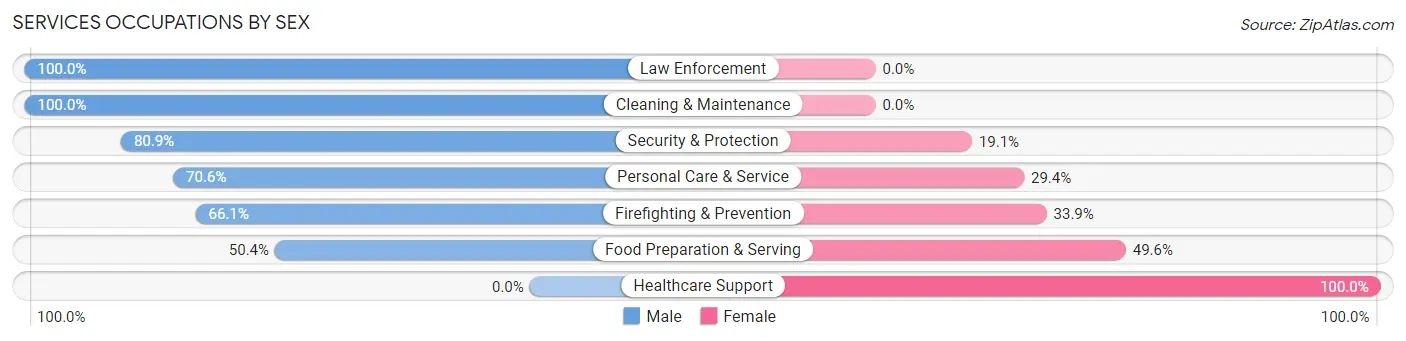
Services Occupations by Sex
Within the Services occupations in Williamsburg, the most male-oriented occupations are Law Enforcement (100.0%), Cleaning & Maintenance (100.0%), and Security & Protection (80.9%), while the most female-oriented occupations are Healthcare Support (100.0%), Food Preparation & Serving (49.6%), and Firefighting & Prevention (33.9%).
| Occupation | Male | Female |
| Healthcare Support | 0 (0.0%) | 156 (100.0%) |
| Security & Protection | 89 (80.9%) | 21 (19.1%) |
| Firefighting & Prevention | 41 (66.1%) | 21 (33.9%) |
| Law Enforcement | 48 (100.0%) | 0 (0.0%) |
| Food Preparation & Serving | 288 (50.4%) | 283 (49.6%) |
| Cleaning & Maintenance | 35 (100.0%) | 0 (0.0%) |
| Personal Care & Service | 60 (70.6%) | 25 (29.4%) |
| Total (Category) | 472 (49.3%) | 485 (50.7%) |
| Total (Overall) | 1,699 (47.4%) | 1,885 (52.6%) |
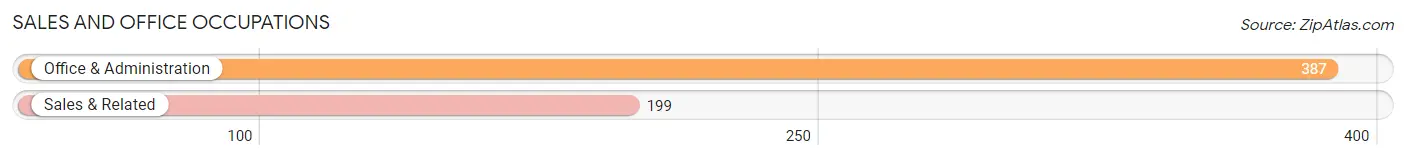
Sales and Office Occupations
The most common Sales and Office occupations in Williamsburg are Office & Administration (387 | 10.8%), and Sales & Related (199 | 5.6%).
Sales and Office Occupations by Sex
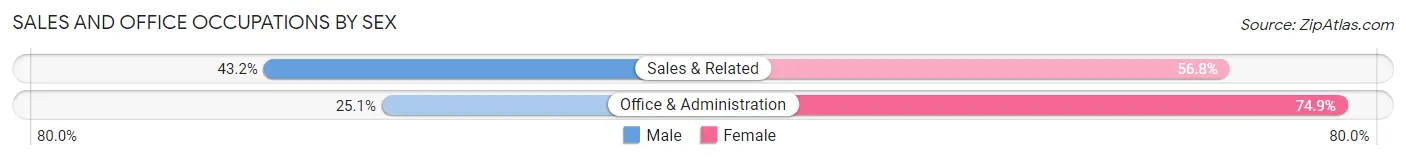
| Occupation | Male | Female |
| Sales & Related | 86 (43.2%) | 113 (56.8%) |
| Office & Administration | 97 (25.1%) | 290 (74.9%) |
| Total (Category) | 183 (31.2%) | 403 (68.8%) |
| Total (Overall) | 1,699 (47.4%) | 1,885 (52.6%) |
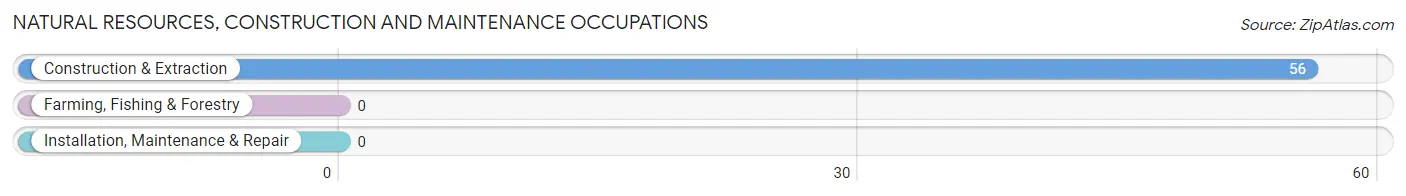
Natural Resources, Construction and Maintenance Occupations
The most common Natural Resources, Construction and Maintenance occupations in Williamsburg are , and Construction & Extraction (56 | 1.6%).
Natural Resources, Construction and Maintenance Occupations by Sex
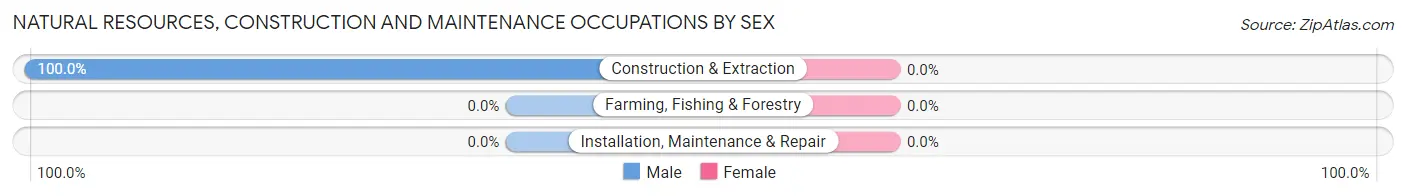
| Occupation | Male | Female |
| Farming, Fishing & Forestry | 0 (0.0%) | 0 (0.0%) |
| Construction & Extraction | 56 (100.0%) | 0 (0.0%) |
| Installation, Maintenance & Repair | 0 (0.0%) | 0 (0.0%) |
| Total (Category) | 56 (100.0%) | 0 (0.0%) |
| Total (Overall) | 1,699 (47.4%) | 1,885 (52.6%) |
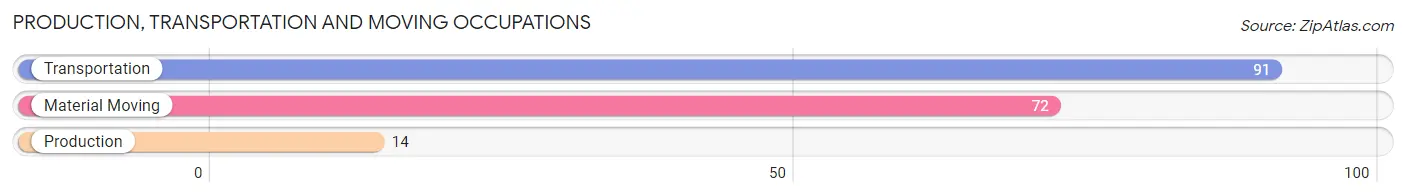
Production, Transportation and Moving Occupations
The most common Production, Transportation and Moving occupations in Williamsburg are Transportation (91 | 2.5%), Material Moving (72 | 2.0%), and Production (14 | 0.4%).
Production, Transportation and Moving Occupations by Sex
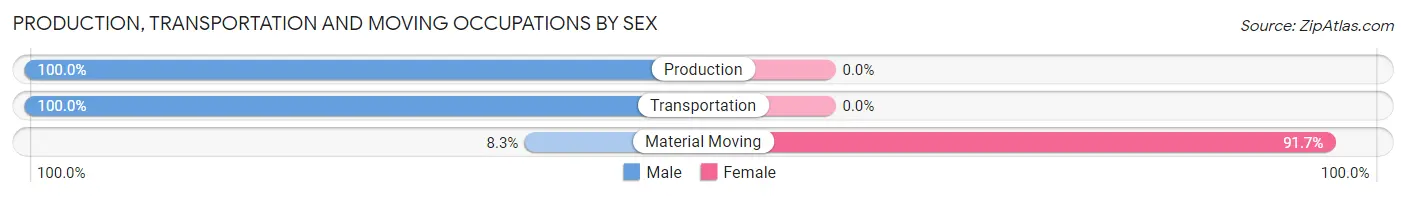
| Occupation | Male | Female |
| Production | 14 (100.0%) | 0 (0.0%) |
| Transportation | 91 (100.0%) | 0 (0.0%) |
| Material Moving | 6 (8.3%) | 66 (91.7%) |
| Total (Category) | 111 (62.7%) | 66 (37.3%) |
| Total (Overall) | 1,699 (47.4%) | 1,885 (52.6%) |
Employment Industries by Sex in Williamsburg
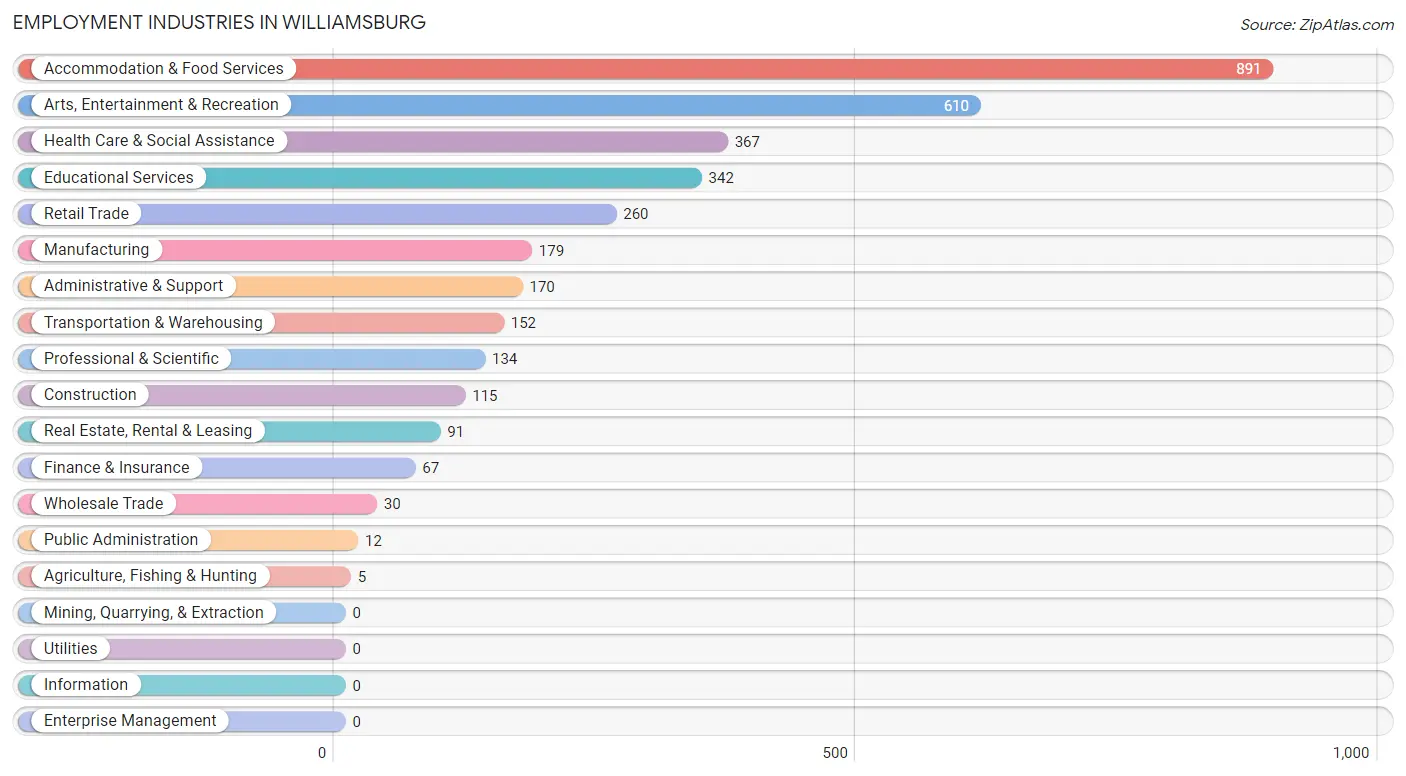
Employment Industries in Williamsburg
The major employment industries in Williamsburg include Accommodation & Food Services (891 | 24.9%), Arts, Entertainment & Recreation (610 | 17.0%), Health Care & Social Assistance (367 | 10.2%), Educational Services (342 | 9.5%), and Retail Trade (260 | 7.2%).
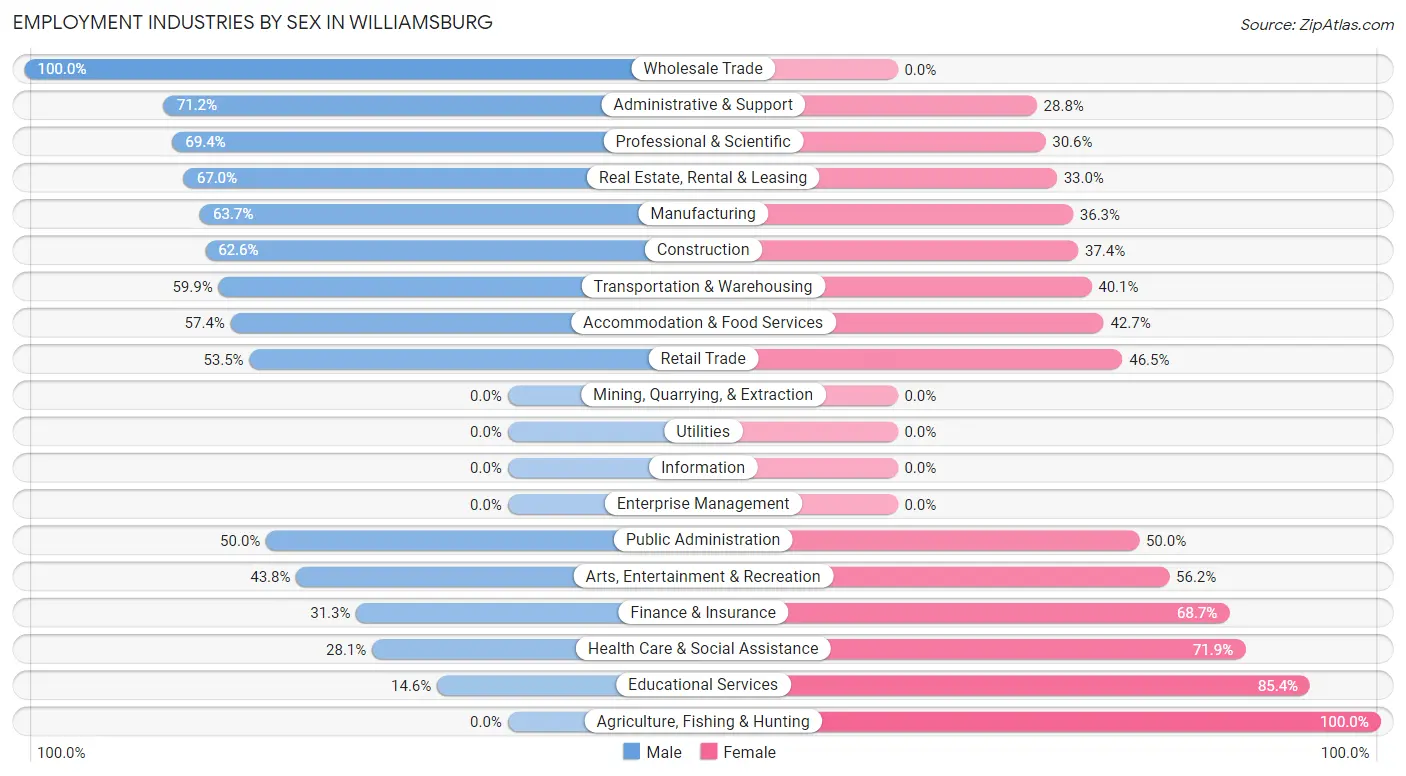
Employment Industries by Sex in Williamsburg
The Williamsburg industries that see more men than women are Wholesale Trade (100.0%), Administrative & Support (71.2%), and Professional & Scientific (69.4%), whereas the industries that tend to have a higher number of women are Agriculture, Fishing & Hunting (100.0%), Educational Services (85.4%), and Health Care & Social Assistance (71.9%).
| Industry | Male | Female |
| Agriculture, Fishing & Hunting | 0 (0.0%) | 5 (100.0%) |
| Mining, Quarrying, & Extraction | 0 (0.0%) | 0 (0.0%) |
| Construction | 72 (62.6%) | 43 (37.4%) |
| Manufacturing | 114 (63.7%) | 65 (36.3%) |
| Wholesale Trade | 30 (100.0%) | 0 (0.0%) |
| Retail Trade | 139 (53.5%) | 121 (46.5%) |
| Transportation & Warehousing | 91 (59.9%) | 61 (40.1%) |
| Utilities | 0 (0.0%) | 0 (0.0%) |
| Information | 0 (0.0%) | 0 (0.0%) |
| Finance & Insurance | 21 (31.3%) | 46 (68.7%) |
| Real Estate, Rental & Leasing | 61 (67.0%) | 30 (33.0%) |
| Professional & Scientific | 93 (69.4%) | 41 (30.6%) |
| Enterprise Management | 0 (0.0%) | 0 (0.0%) |
| Administrative & Support | 121 (71.2%) | 49 (28.8%) |
| Educational Services | 50 (14.6%) | 292 (85.4%) |
| Health Care & Social Assistance | 103 (28.1%) | 264 (71.9%) |
| Arts, Entertainment & Recreation | 267 (43.8%) | 343 (56.2%) |
| Accommodation & Food Services | 511 (57.4%) | 380 (42.6%) |
| Public Administration | 6 (50.0%) | 6 (50.0%) |
| Total | 1,699 (47.4%) | 1,885 (52.6%) |
Education in Williamsburg
School Enrollment in Williamsburg
The most common levels of schooling among the 1,060 students in Williamsburg are college / undergraduate (353 | 33.3%), high school (192 | 18.1%), and elementary school (180 | 17.0%).
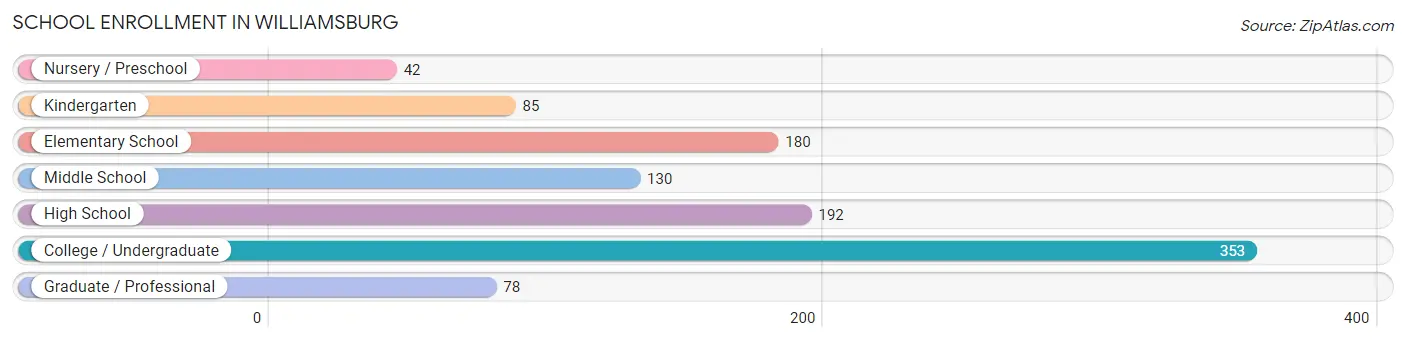
| School Level | # Students | % Students |
| Nursery / Preschool | 42 | 4.0% |
| Kindergarten | 85 | 8.0% |
| Elementary School | 180 | 17.0% |
| Middle School | 130 | 12.3% |
| High School | 192 | 18.1% |
| College / Undergraduate | 353 | 33.3% |
| Graduate / Professional | 78 | 7.4% |
| Total | 1,060 | 100.0% |
School Enrollment by Age by Funding Source in Williamsburg
Out of a total of 1,060 students who are enrolled in schools in Williamsburg, 205 (19.3%) attend a private institution, while the remaining 855 (80.7%) are enrolled in public schools. The age group of 3 to 4 year olds has the highest likelihood of being enrolled in private schools, with 30 (100.0% in the age bracket) enrolled. Conversely, the age group of 10 to 14 year olds has the lowest likelihood of being enrolled in a private school, with 170 (100.0% in the age bracket) attending a public institution.
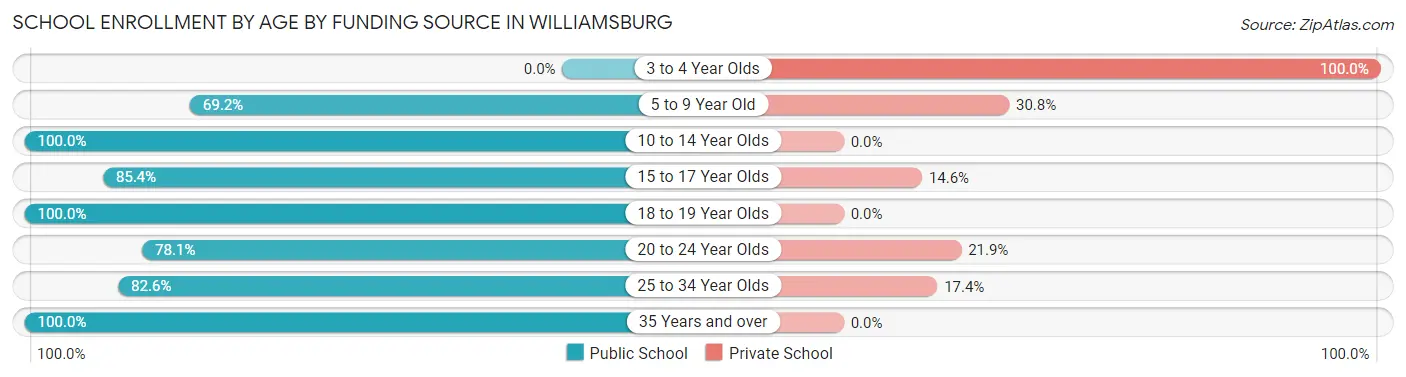
| Age Bracket | Public School | Private School |
| 3 to 4 Year Olds | 0 (0.0%) | 30 (100.0%) |
| 5 to 9 Year Old | 164 (69.2%) | 73 (30.8%) |
| 10 to 14 Year Olds | 170 (100.0%) | 0 (0.0%) |
| 15 to 17 Year Olds | 164 (85.4%) | 28 (14.6%) |
| 18 to 19 Year Olds | 33 (100.0%) | 0 (0.0%) |
| 20 to 24 Year Olds | 182 (78.1%) | 51 (21.9%) |
| 25 to 34 Year Olds | 109 (82.6%) | 23 (17.4%) |
| 35 Years and over | 33 (100.0%) | 0 (0.0%) |
| Total | 855 (80.7%) | 205 (19.3%) |
Educational Attainment by Field of Study in Williamsburg
Business (633 | 27.4%), engineering (248 | 10.7%), education (245 | 10.6%), visual & performing arts (197 | 8.5%), and literature & languages (194 | 8.4%) are the most common fields of study among 2,310 individuals in Williamsburg who have obtained a bachelor's degree or higher.
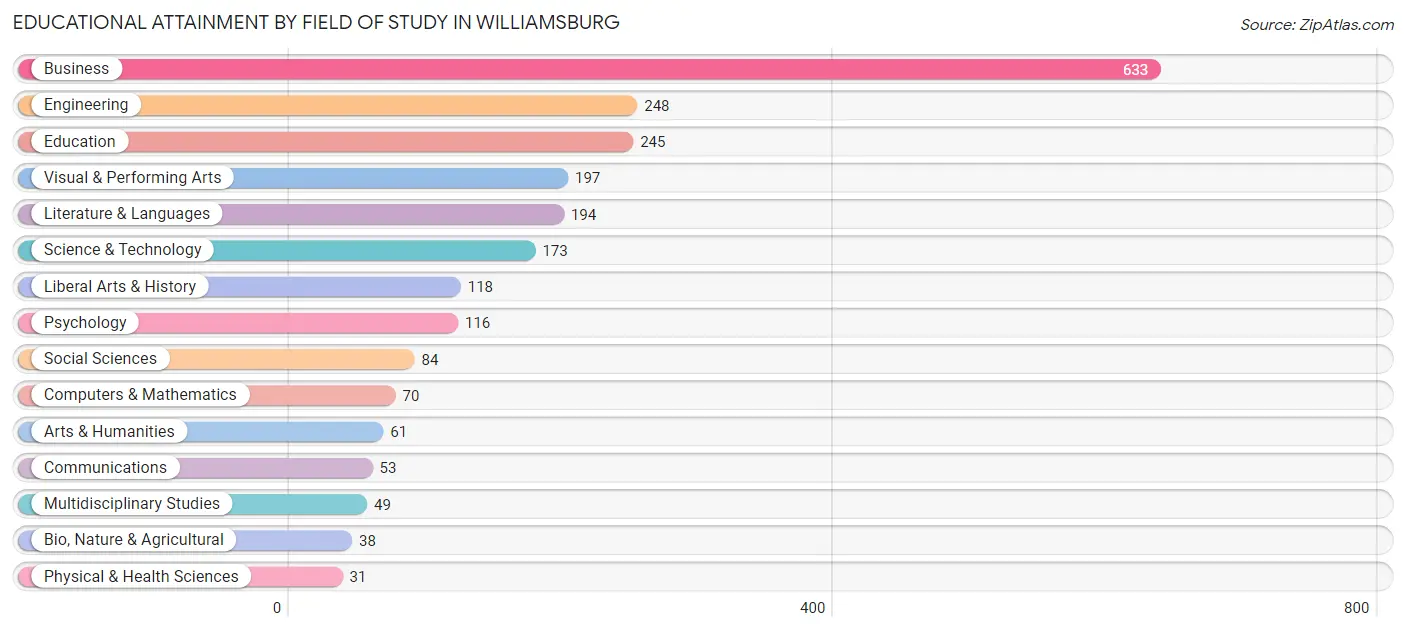
| Field of Study | # Graduates | % Graduates |
| Computers & Mathematics | 70 | 3.0% |
| Bio, Nature & Agricultural | 38 | 1.7% |
| Physical & Health Sciences | 31 | 1.3% |
| Psychology | 116 | 5.0% |
| Social Sciences | 84 | 3.6% |
| Engineering | 248 | 10.7% |
| Multidisciplinary Studies | 49 | 2.1% |
| Science & Technology | 173 | 7.5% |
| Business | 633 | 27.4% |
| Education | 245 | 10.6% |
| Literature & Languages | 194 | 8.4% |
| Liberal Arts & History | 118 | 5.1% |
| Visual & Performing Arts | 197 | 8.5% |
| Communications | 53 | 2.3% |
| Arts & Humanities | 61 | 2.6% |
| Total | 2,310 | 100.0% |
Transportation & Commute in Williamsburg
Vehicle Availability by Sex in Williamsburg
The most prevalent vehicle ownership categories in Williamsburg are males with 2 vehicles (1,004, accounting for 59.1%) and females with 2 vehicles (1,061, making up 54.6%).
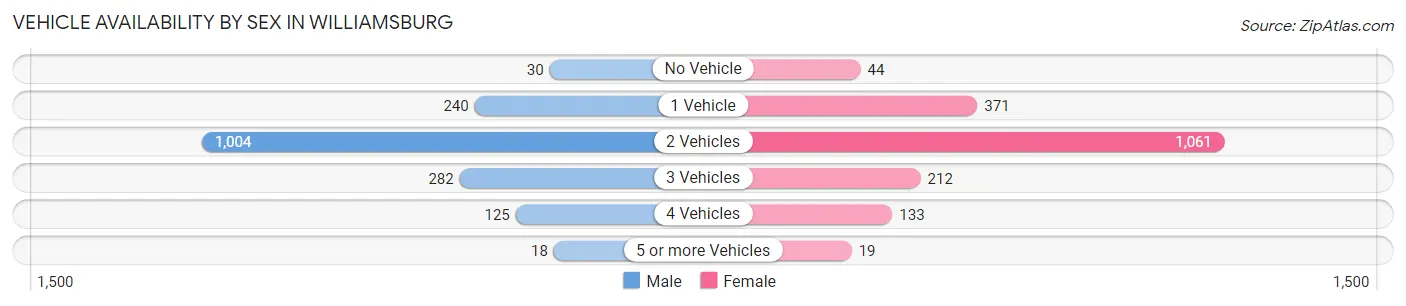
| Vehicles Available | Male | Female |
| No Vehicle | 30 (1.8%) | 44 (2.4%) |
| 1 Vehicle | 240 (14.1%) | 371 (20.2%) |
| 2 Vehicles | 1,004 (59.1%) | 1,061 (57.7%) |
| 3 Vehicles | 282 (16.6%) | 212 (11.5%) |
| 4 Vehicles | 125 (7.4%) | 133 (7.2%) |
| 5 or more Vehicles | 18 (1.1%) | 19 (1.0%) |
| Total | 1,699 (100.0%) | 1,840 (100.0%) |
Commute Time in Williamsburg
The most frequently occuring commute durations in Williamsburg are 30 to 34 minutes (728 commuters, 23.0%), 20 to 24 minutes (639 commuters, 20.2%), and 15 to 19 minutes (503 commuters, 15.9%).
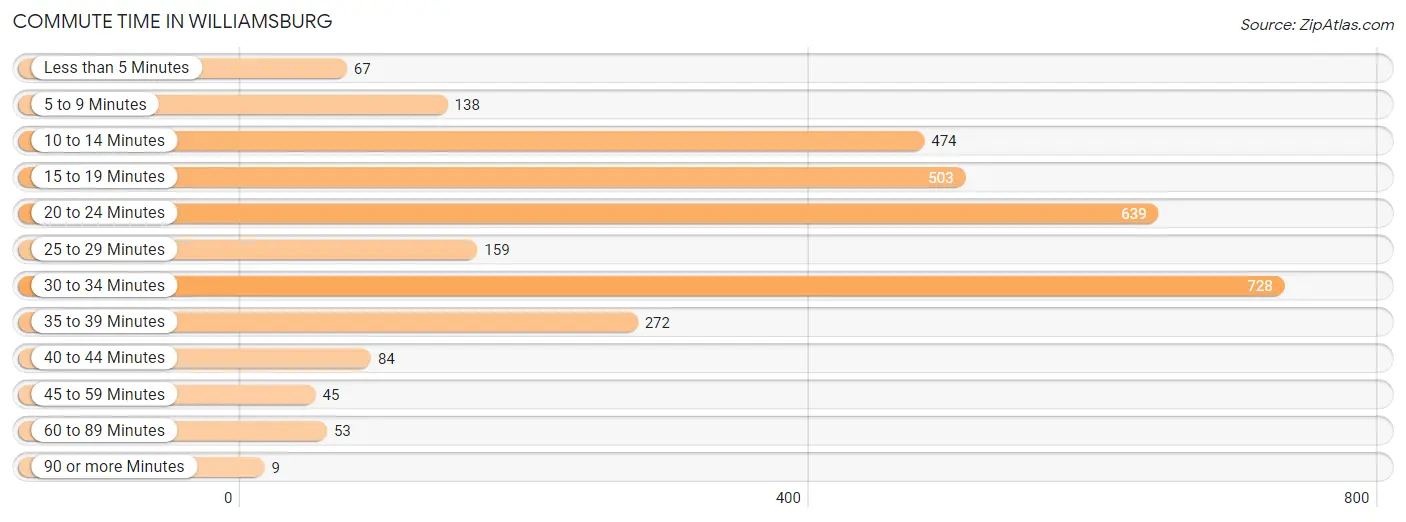
| Commute Time | # Commuters | % Commuters |
| Less than 5 Minutes | 67 | 2.1% |
| 5 to 9 Minutes | 138 | 4.3% |
| 10 to 14 Minutes | 474 | 14.9% |
| 15 to 19 Minutes | 503 | 15.9% |
| 20 to 24 Minutes | 639 | 20.2% |
| 25 to 29 Minutes | 159 | 5.0% |
| 30 to 34 Minutes | 728 | 23.0% |
| 35 to 39 Minutes | 272 | 8.6% |
| 40 to 44 Minutes | 84 | 2.6% |
| 45 to 59 Minutes | 45 | 1.4% |
| 60 to 89 Minutes | 53 | 1.7% |
| 90 or more Minutes | 9 | 0.3% |
Commute Time by Sex in Williamsburg
The most common commute times in Williamsburg are 15 to 19 minutes (328 commuters, 21.7%) for males and 30 to 34 minutes (539 commuters, 32.5%) for females.
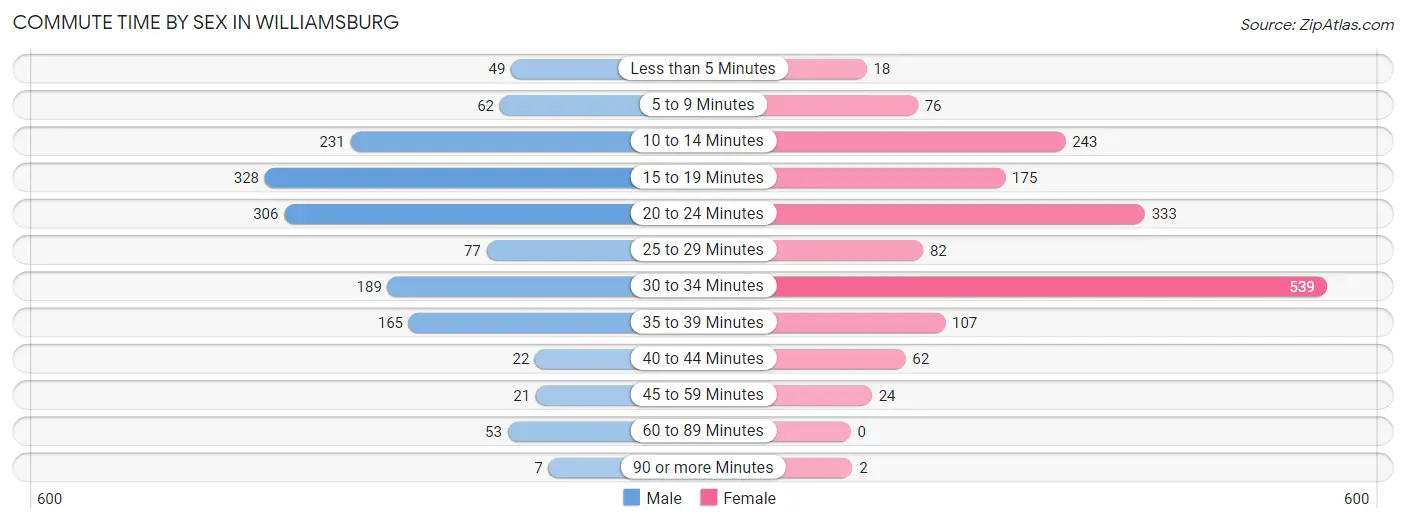
| Commute Time | Male | Female |
| Less than 5 Minutes | 49 (3.3%) | 18 (1.1%) |
| 5 to 9 Minutes | 62 (4.1%) | 76 (4.6%) |
| 10 to 14 Minutes | 231 (15.3%) | 243 (14.6%) |
| 15 to 19 Minutes | 328 (21.7%) | 175 (10.5%) |
| 20 to 24 Minutes | 306 (20.3%) | 333 (20.1%) |
| 25 to 29 Minutes | 77 (5.1%) | 82 (4.9%) |
| 30 to 34 Minutes | 189 (12.5%) | 539 (32.5%) |
| 35 to 39 Minutes | 165 (10.9%) | 107 (6.4%) |
| 40 to 44 Minutes | 22 (1.5%) | 62 (3.7%) |
| 45 to 59 Minutes | 21 (1.4%) | 24 (1.4%) |
| 60 to 89 Minutes | 53 (3.5%) | 0 (0.0%) |
| 90 or more Minutes | 7 (0.5%) | 2 (0.1%) |
Time of Departure to Work by Sex in Williamsburg
The most frequent times of departure to work in Williamsburg are 12:00 PM to 3:59 PM (255, 16.9%) for males and 6:30 AM to 6:59 AM (312, 18.8%) for females.
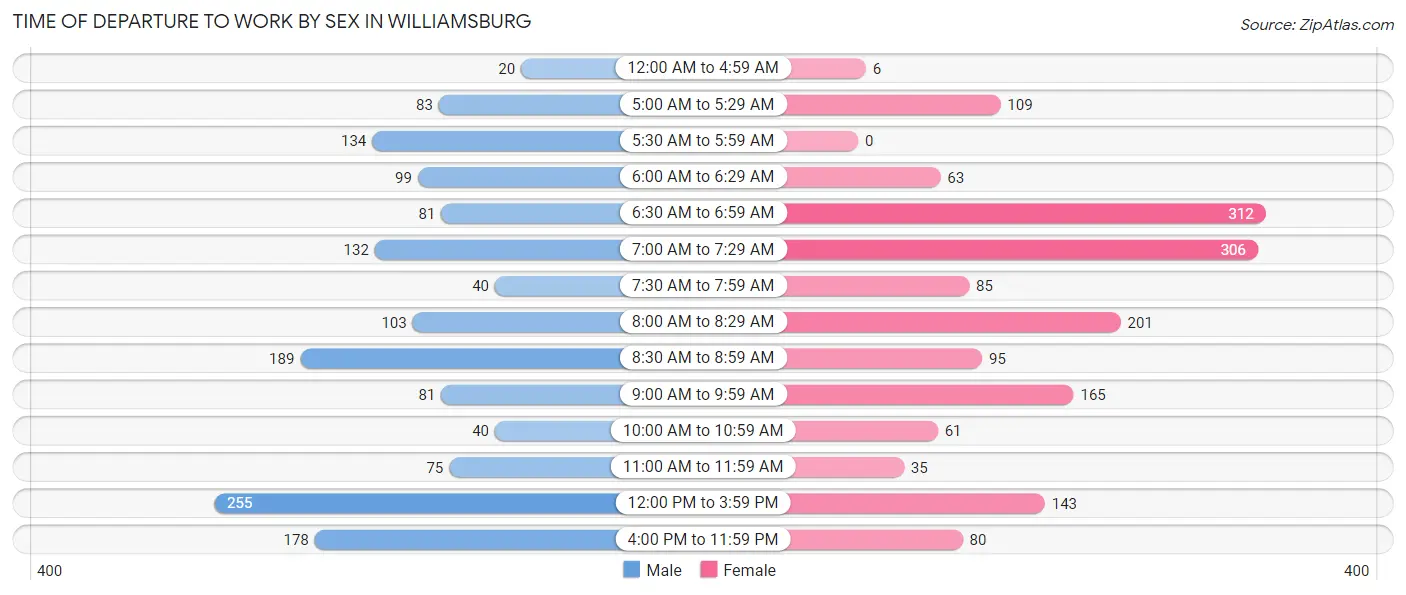
| Time of Departure | Male | Female |
| 12:00 AM to 4:59 AM | 20 (1.3%) | 6 (0.4%) |
| 5:00 AM to 5:29 AM | 83 (5.5%) | 109 (6.6%) |
| 5:30 AM to 5:59 AM | 134 (8.9%) | 0 (0.0%) |
| 6:00 AM to 6:29 AM | 99 (6.6%) | 63 (3.8%) |
| 6:30 AM to 6:59 AM | 81 (5.4%) | 312 (18.8%) |
| 7:00 AM to 7:29 AM | 132 (8.7%) | 306 (18.4%) |
| 7:30 AM to 7:59 AM | 40 (2.6%) | 85 (5.1%) |
| 8:00 AM to 8:29 AM | 103 (6.8%) | 201 (12.1%) |
| 8:30 AM to 8:59 AM | 189 (12.5%) | 95 (5.7%) |
| 9:00 AM to 9:59 AM | 81 (5.4%) | 165 (9.9%) |
| 10:00 AM to 10:59 AM | 40 (2.6%) | 61 (3.7%) |
| 11:00 AM to 11:59 AM | 75 (5.0%) | 35 (2.1%) |
| 12:00 PM to 3:59 PM | 255 (16.9%) | 143 (8.6%) |
| 4:00 PM to 11:59 PM | 178 (11.8%) | 80 (4.8%) |
| Total | 1,510 (100.0%) | 1,661 (100.0%) |
Housing Occupancy in Williamsburg
Occupancy by Ownership in Williamsburg
Of the total 3,106 dwellings in Williamsburg, owner-occupied units account for 2,621 (84.4%), while renter-occupied units make up 485 (15.6%).
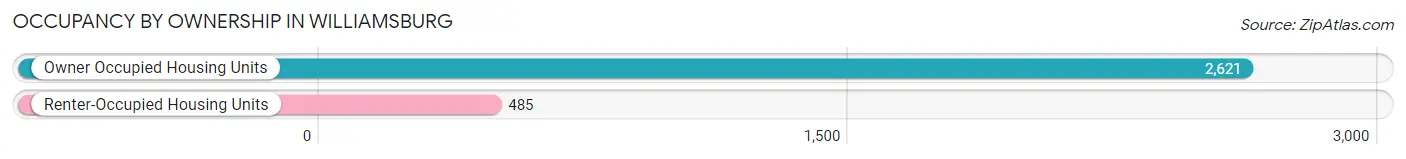
| Occupancy | # Housing Units | % Housing Units |
| Owner Occupied Housing Units | 2,621 | 84.4% |
| Renter-Occupied Housing Units | 485 | 15.6% |
| Total Occupied Housing Units | 3,106 | 100.0% |
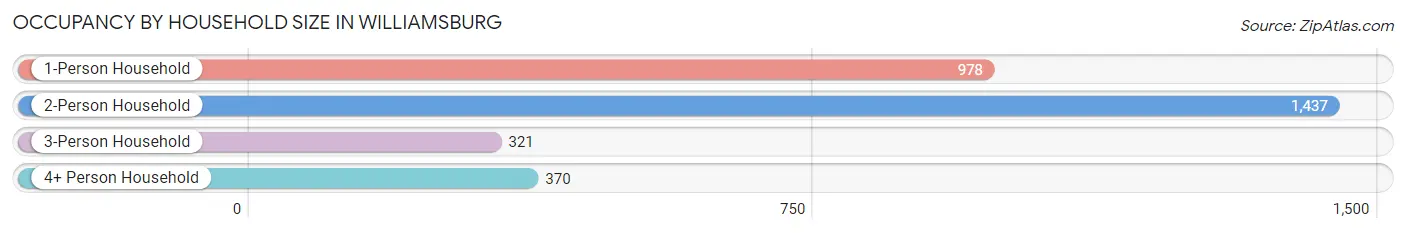
Occupancy by Household Size in Williamsburg
| Household Size | # Housing Units | % Housing Units |
| 1-Person Household | 978 | 31.5% |
| 2-Person Household | 1,437 | 46.3% |
| 3-Person Household | 321 | 10.3% |
| 4+ Person Household | 370 | 11.9% |
| Total Housing Units | 3,106 | 100.0% |
Occupancy by Ownership by Household Size in Williamsburg
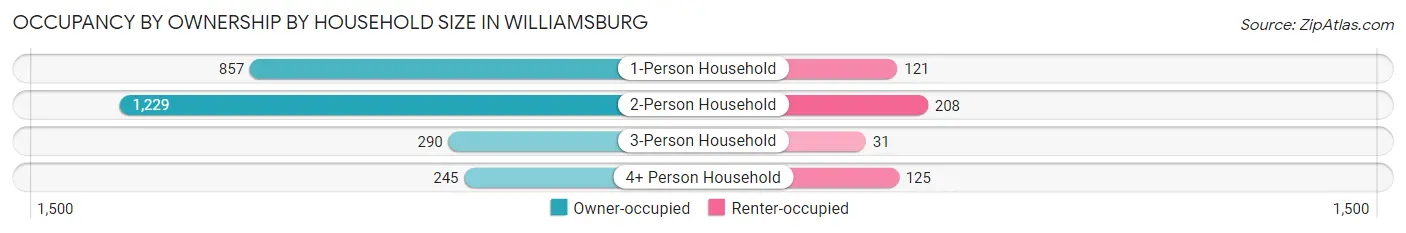
| Household Size | Owner-occupied | Renter-occupied |
| 1-Person Household | 857 (87.6%) | 121 (12.4%) |
| 2-Person Household | 1,229 (85.5%) | 208 (14.5%) |
| 3-Person Household | 290 (90.3%) | 31 (9.7%) |
| 4+ Person Household | 245 (66.2%) | 125 (33.8%) |
| Total Housing Units | 2,621 (84.4%) | 485 (15.6%) |
Occupancy by Educational Attainment in Williamsburg
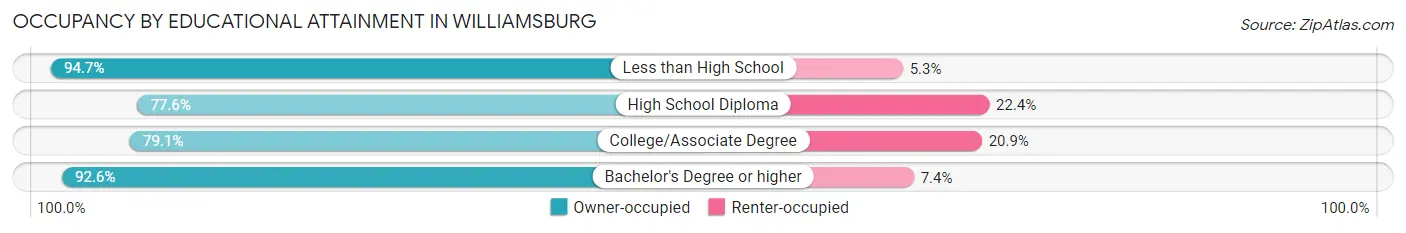
| Household Size | Owner-occupied | Renter-occupied |
| Less than High School | 90 (94.7%) | 5 (5.3%) |
| High School Diploma | 506 (77.6%) | 146 (22.4%) |
| College/Associate Degree | 930 (79.1%) | 246 (20.9%) |
| Bachelor's Degree or higher | 1,095 (92.6%) | 88 (7.4%) |
Occupancy by Age of Householder in Williamsburg
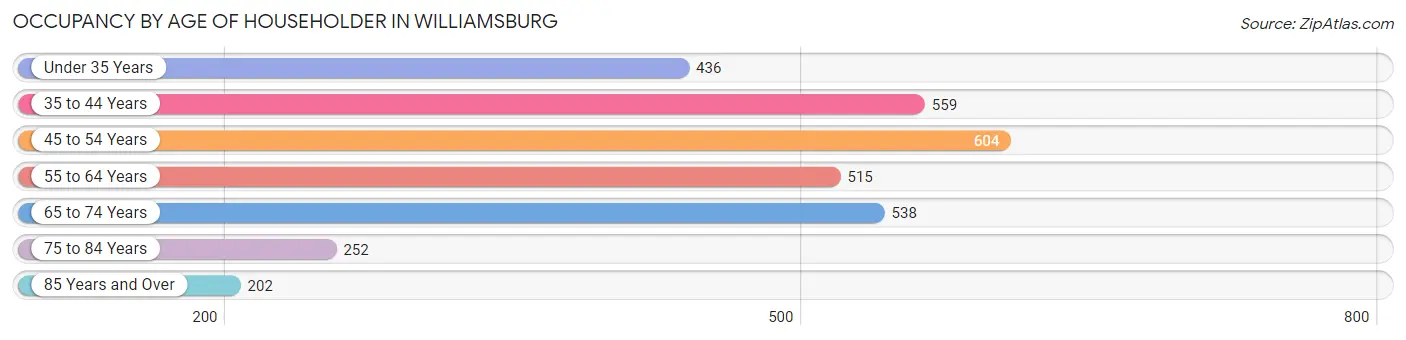
| Age Bracket | # Households | % Households |
| Under 35 Years | 436 | 14.0% |
| 35 to 44 Years | 559 | 18.0% |
| 45 to 54 Years | 604 | 19.5% |
| 55 to 64 Years | 515 | 16.6% |
| 65 to 74 Years | 538 | 17.3% |
| 75 to 84 Years | 252 | 8.1% |
| 85 Years and Over | 202 | 6.5% |
| Total | 3,106 | 100.0% |
Housing Finances in Williamsburg
Median Income by Occupancy in Williamsburg
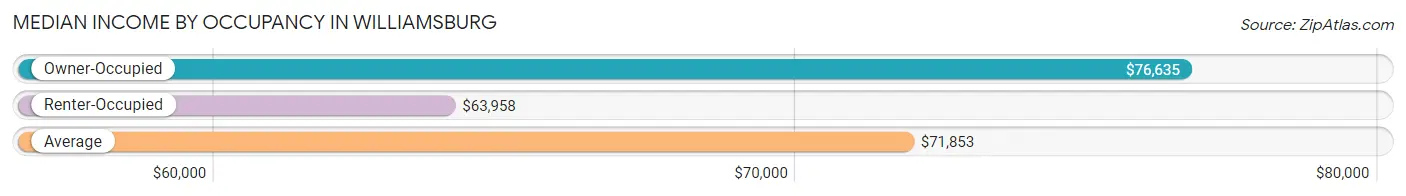
| Occupancy Type | # Households | Median Income |
| Owner-Occupied | 2,621 (84.4%) | $76,635 |
| Renter-Occupied | 485 (15.6%) | $63,958 |
| Average | 3,106 (100.0%) | $71,853 |
Occupancy by Householder Income Bracket in Williamsburg
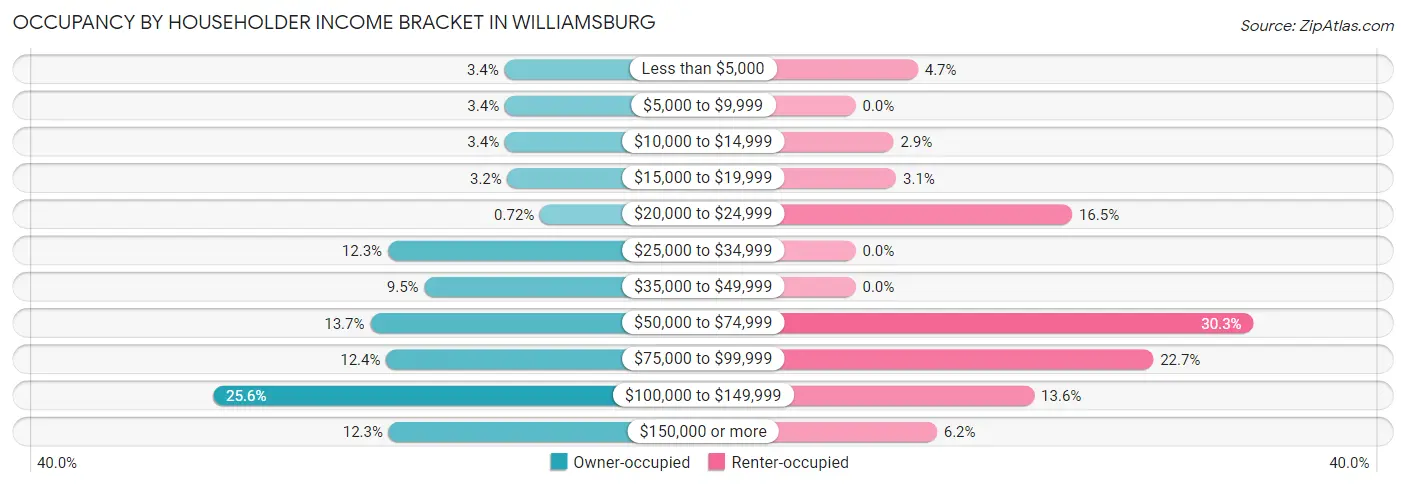
| Income Bracket | Owner-occupied | Renter-occupied |
| Less than $5,000 | 90 (3.4%) | 23 (4.7%) |
| $5,000 to $9,999 | 89 (3.4%) | 0 (0.0%) |
| $10,000 to $14,999 | 89 (3.4%) | 14 (2.9%) |
| $15,000 to $19,999 | 84 (3.2%) | 15 (3.1%) |
| $20,000 to $24,999 | 19 (0.7%) | 80 (16.5%) |
| $25,000 to $34,999 | 323 (12.3%) | 0 (0.0%) |
| $35,000 to $49,999 | 250 (9.5%) | 0 (0.0%) |
| $50,000 to $74,999 | 358 (13.7%) | 147 (30.3%) |
| $75,000 to $99,999 | 326 (12.4%) | 110 (22.7%) |
| $100,000 to $149,999 | 672 (25.6%) | 66 (13.6%) |
| $150,000 or more | 321 (12.2%) | 30 (6.2%) |
| Total | 2,621 (100.0%) | 485 (100.0%) |
Monthly Housing Cost Tiers in Williamsburg
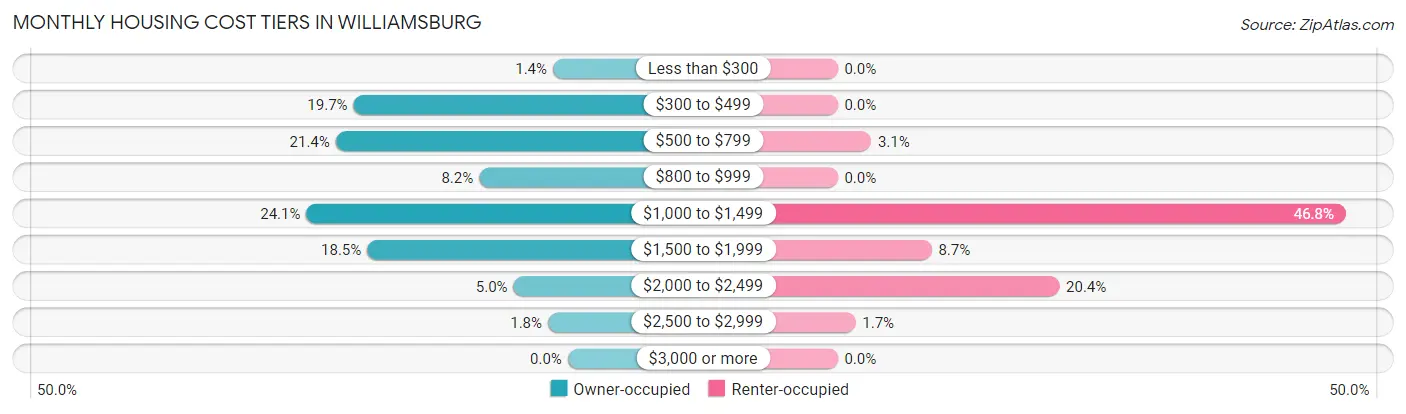
| Monthly Cost | Owner-occupied | Renter-occupied |
| Less than $300 | 36 (1.4%) | 0 (0.0%) |
| $300 to $499 | 517 (19.7%) | 0 (0.0%) |
| $500 to $799 | 560 (21.4%) | 15 (3.1%) |
| $800 to $999 | 214 (8.2%) | 0 (0.0%) |
| $1,000 to $1,499 | 631 (24.1%) | 227 (46.8%) |
| $1,500 to $1,999 | 484 (18.5%) | 42 (8.7%) |
| $2,000 to $2,499 | 131 (5.0%) | 99 (20.4%) |
| $2,500 to $2,999 | 48 (1.8%) | 8 (1.7%) |
| $3,000 or more | 0 (0.0%) | 0 (0.0%) |
| Total | 2,621 (100.0%) | 485 (100.0%) |
Physical Housing Characteristics in Williamsburg
Housing Structures in Williamsburg
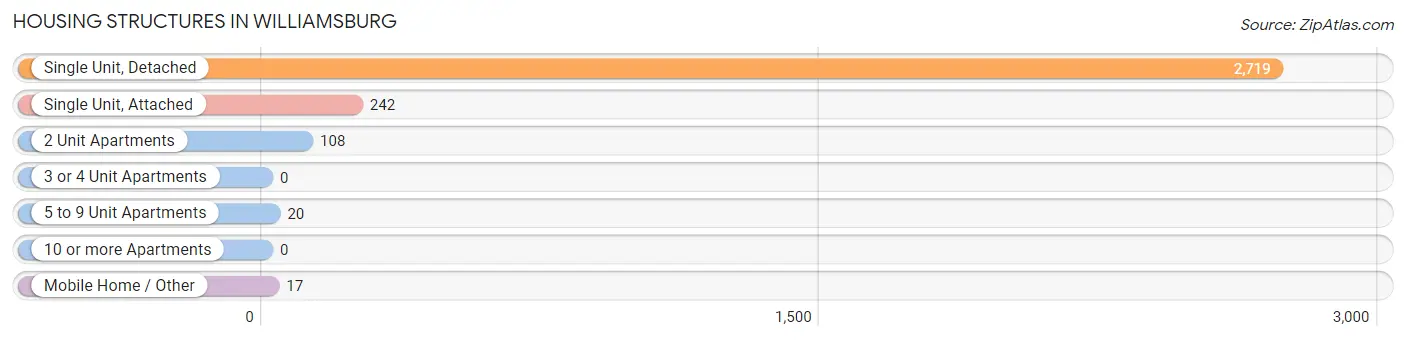
| Structure Type | # Housing Units | % Housing Units |
| Single Unit, Detached | 2,719 | 87.5% |
| Single Unit, Attached | 242 | 7.8% |
| 2 Unit Apartments | 108 | 3.5% |
| 3 or 4 Unit Apartments | 0 | 0.0% |
| 5 to 9 Unit Apartments | 20 | 0.6% |
| 10 or more Apartments | 0 | 0.0% |
| Mobile Home / Other | 17 | 0.5% |
| Total | 3,106 | 100.0% |
Housing Structures by Occupancy in Williamsburg
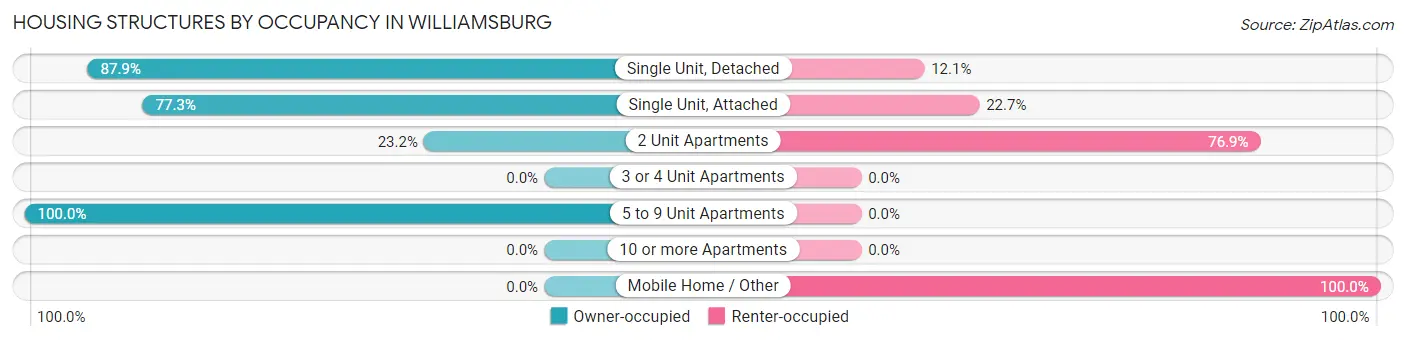
| Structure Type | Owner-occupied | Renter-occupied |
| Single Unit, Detached | 2,389 (87.9%) | 330 (12.1%) |
| Single Unit, Attached | 187 (77.3%) | 55 (22.7%) |
| 2 Unit Apartments | 25 (23.2%) | 83 (76.8%) |
| 3 or 4 Unit Apartments | 0 (0.0%) | 0 (0.0%) |
| 5 to 9 Unit Apartments | 20 (100.0%) | 0 (0.0%) |
| 10 or more Apartments | 0 (0.0%) | 0 (0.0%) |
| Mobile Home / Other | 0 (0.0%) | 17 (100.0%) |
| Total | 2,621 (84.4%) | 485 (15.6%) |
Housing Structures by Number of Rooms in Williamsburg
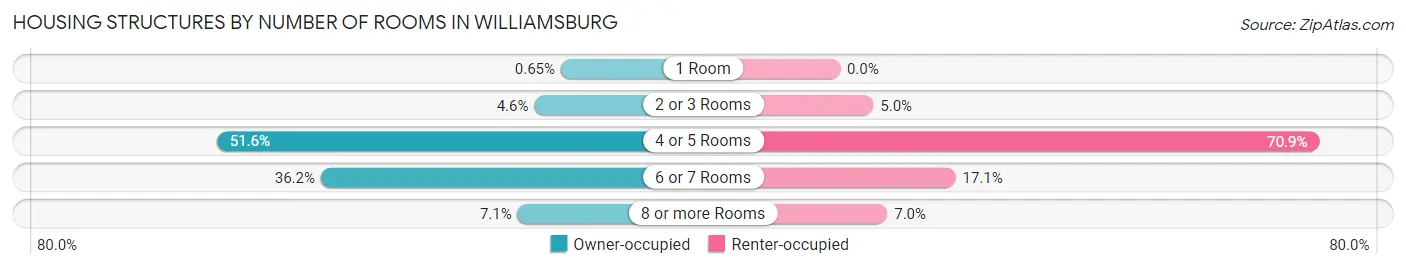
| Number of Rooms | Owner-occupied | Renter-occupied |
| 1 Room | 17 (0.6%) | 0 (0.0%) |
| 2 or 3 Rooms | 120 (4.6%) | 24 (5.0%) |
| 4 or 5 Rooms | 1,351 (51.5%) | 344 (70.9%) |
| 6 or 7 Rooms | 948 (36.2%) | 83 (17.1%) |
| 8 or more Rooms | 185 (7.1%) | 34 (7.0%) |
| Total | 2,621 (100.0%) | 485 (100.0%) |
Housing Structure by Heating Type in Williamsburg
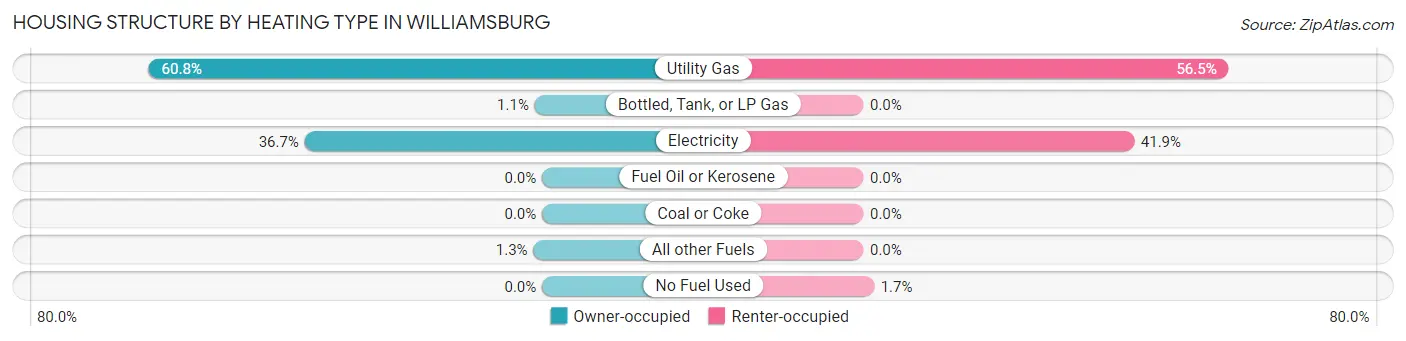
| Heating Type | Owner-occupied | Renter-occupied |
| Utility Gas | 1,594 (60.8%) | 274 (56.5%) |
| Bottled, Tank, or LP Gas | 30 (1.1%) | 0 (0.0%) |
| Electricity | 962 (36.7%) | 203 (41.9%) |
| Fuel Oil or Kerosene | 0 (0.0%) | 0 (0.0%) |
| Coal or Coke | 0 (0.0%) | 0 (0.0%) |
| All other Fuels | 35 (1.3%) | 0 (0.0%) |
| No Fuel Used | 0 (0.0%) | 8 (1.7%) |
| Total | 2,621 (100.0%) | 485 (100.0%) |
Household Vehicle Usage in Williamsburg
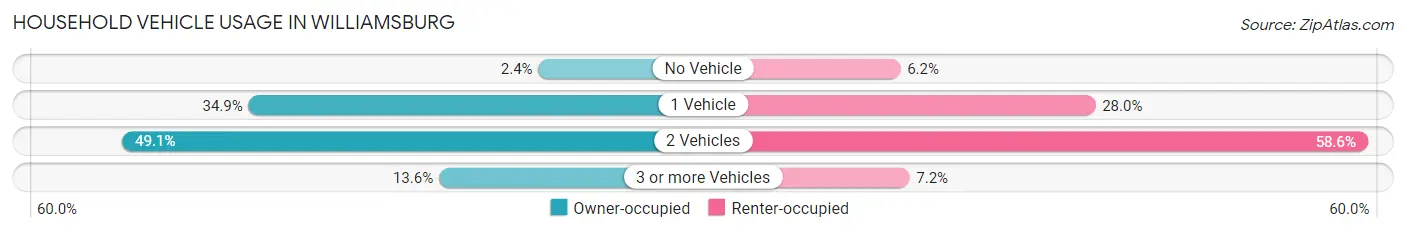
| Vehicles per Household | Owner-occupied | Renter-occupied |
| No Vehicle | 64 (2.4%) | 30 (6.2%) |
| 1 Vehicle | 915 (34.9%) | 136 (28.0%) |
| 2 Vehicles | 1,286 (49.1%) | 284 (58.6%) |
| 3 or more Vehicles | 356 (13.6%) | 35 (7.2%) |
| Total | 2,621 (100.0%) | 485 (100.0%) |
Real Estate & Mortgages in Williamsburg
Real Estate and Mortgage Overview in Williamsburg
| Characteristic | Without Mortgage | With Mortgage |
| Housing Units | 1,180 | 1,441 |
| Median Property Value | $297,000 | $276,400 |
| Median Household Income | $75,385 | $159 |
| Monthly Housing Costs | $511 | $0 |
| Real Estate Taxes | $2,056 | $85 |
Property Value by Mortgage Status in Williamsburg
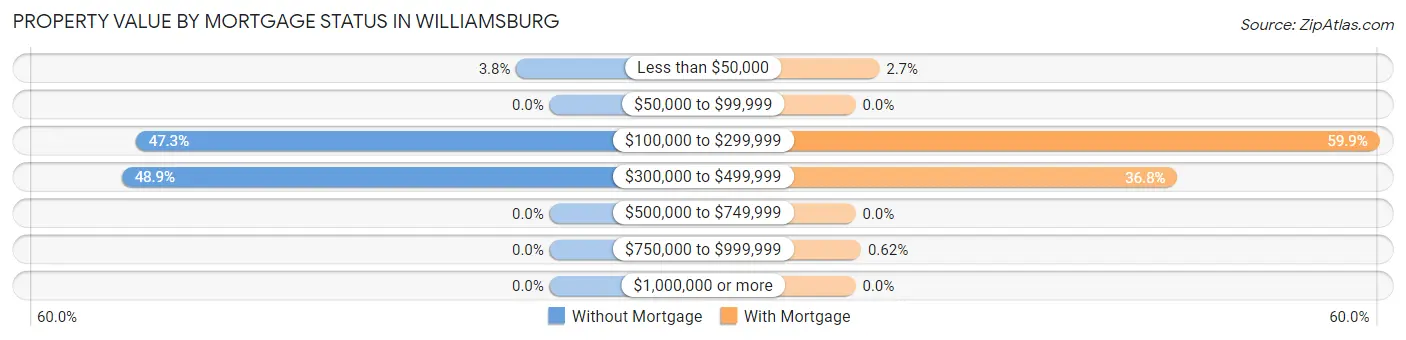
| Property Value | Without Mortgage | With Mortgage |
| Less than $50,000 | 45 (3.8%) | 39 (2.7%) |
| $50,000 to $99,999 | 0 (0.0%) | 0 (0.0%) |
| $100,000 to $299,999 | 558 (47.3%) | 863 (59.9%) |
| $300,000 to $499,999 | 577 (48.9%) | 530 (36.8%) |
| $500,000 to $749,999 | 0 (0.0%) | 0 (0.0%) |
| $750,000 to $999,999 | 0 (0.0%) | 9 (0.6%) |
| $1,000,000 or more | 0 (0.0%) | 0 (0.0%) |
| Total | 1,180 (100.0%) | 1,441 (100.0%) |
Household Income by Mortgage Status in Williamsburg
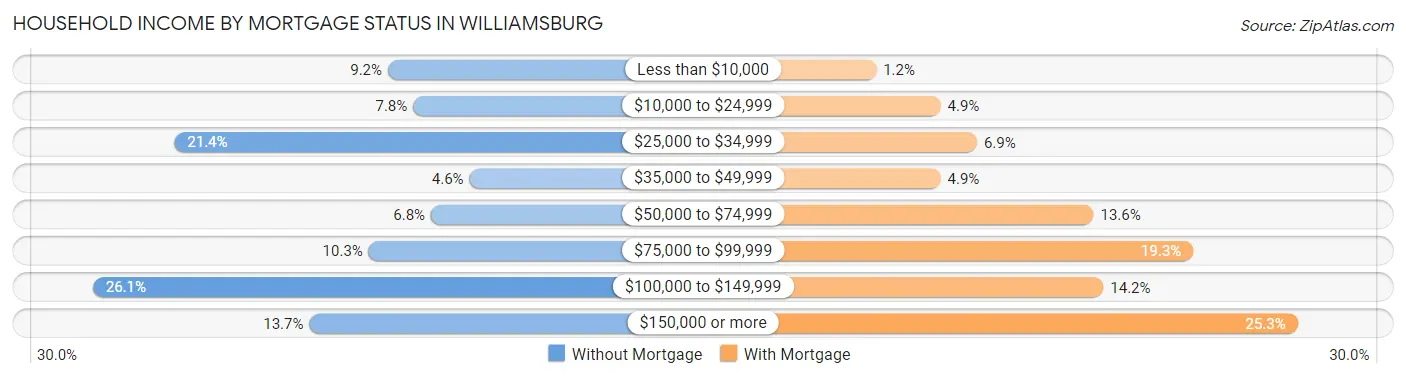
| Household Income | Without Mortgage | With Mortgage |
| Less than $10,000 | 109 (9.2%) | 17 (1.2%) |
| $10,000 to $24,999 | 92 (7.8%) | 70 (4.9%) |
| $25,000 to $34,999 | 253 (21.4%) | 100 (6.9%) |
| $35,000 to $49,999 | 54 (4.6%) | 70 (4.9%) |
| $50,000 to $74,999 | 80 (6.8%) | 196 (13.6%) |
| $75,000 to $99,999 | 122 (10.3%) | 278 (19.3%) |
| $100,000 to $149,999 | 308 (26.1%) | 204 (14.2%) |
| $150,000 or more | 162 (13.7%) | 364 (25.3%) |
| Total | 1,180 (100.0%) | 1,441 (100.0%) |
Property Value to Household Income Ratio in Williamsburg
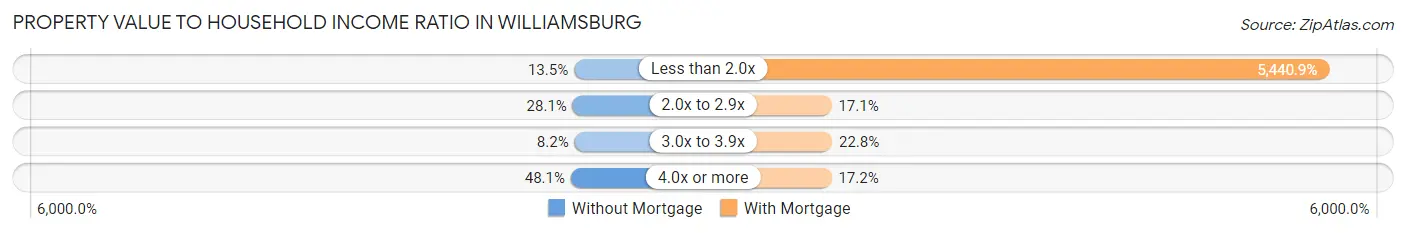
| Value-to-Income Ratio | Without Mortgage | With Mortgage |
| Less than 2.0x | 159 (13.5%) | 78,403 (5,440.9%) |
| 2.0x to 2.9x | 331 (28.1%) | 247 (17.1%) |
| 3.0x to 3.9x | 97 (8.2%) | 329 (22.8%) |
| 4.0x or more | 567 (48.0%) | 248 (17.2%) |
| Total | 1,180 (100.0%) | 1,441 (100.0%) |
Real Estate Taxes by Mortgage Status in Williamsburg
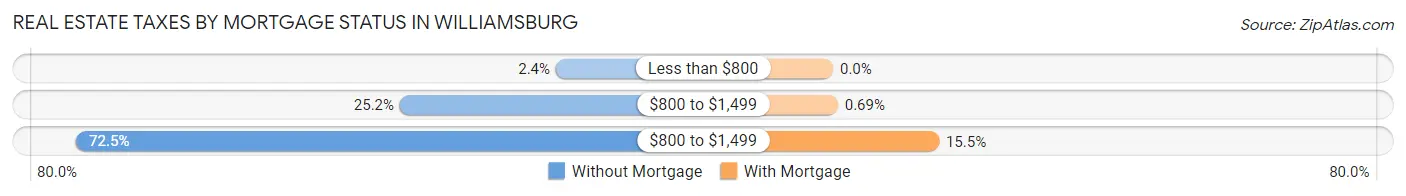
| Property Taxes | Without Mortgage | With Mortgage |
| Less than $800 | 28 (2.4%) | 0 (0.0%) |
| $800 to $1,499 | 297 (25.2%) | 10 (0.7%) |
| $800 to $1,499 | 855 (72.5%) | 223 (15.5%) |
| Total | 1,180 (100.0%) | 1,441 (100.0%) |
Health & Disability in Williamsburg
Health Insurance Coverage by Age in Williamsburg
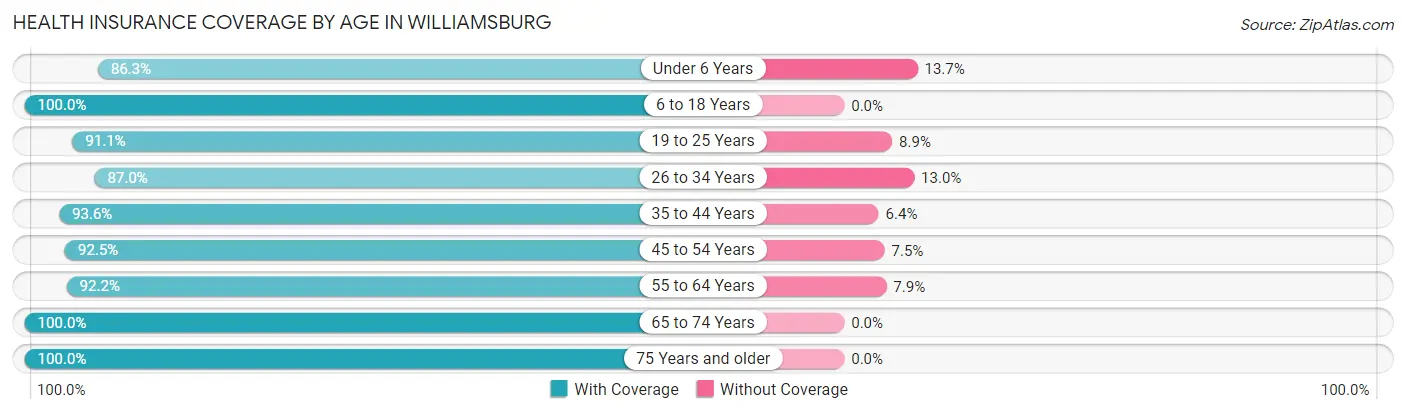
| Age Bracket | With Coverage | Without Coverage |
| Under 6 Years | 354 (86.3%) | 56 (13.7%) |
| 6 to 18 Years | 569 (100.0%) | 0 (0.0%) |
| 19 to 25 Years | 337 (91.1%) | 33 (8.9%) |
| 26 to 34 Years | 761 (87.0%) | 114 (13.0%) |
| 35 to 44 Years | 1,022 (93.6%) | 70 (6.4%) |
| 45 to 54 Years | 923 (92.5%) | 75 (7.5%) |
| 55 to 64 Years | 986 (92.1%) | 84 (7.9%) |
| 65 to 74 Years | 790 (100.0%) | 0 (0.0%) |
| 75 Years and older | 734 (100.0%) | 0 (0.0%) |
| Total | 6,476 (93.8%) | 432 (6.2%) |
Health Insurance Coverage by Citizenship Status in Williamsburg
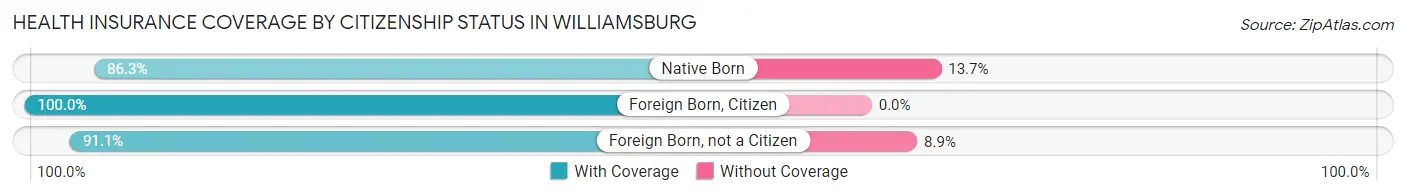
| Citizenship Status | With Coverage | Without Coverage |
| Native Born | 354 (86.3%) | 56 (13.7%) |
| Foreign Born, Citizen | 569 (100.0%) | 0 (0.0%) |
| Foreign Born, not a Citizen | 337 (91.1%) | 33 (8.9%) |
Health Insurance Coverage by Household Income in Williamsburg
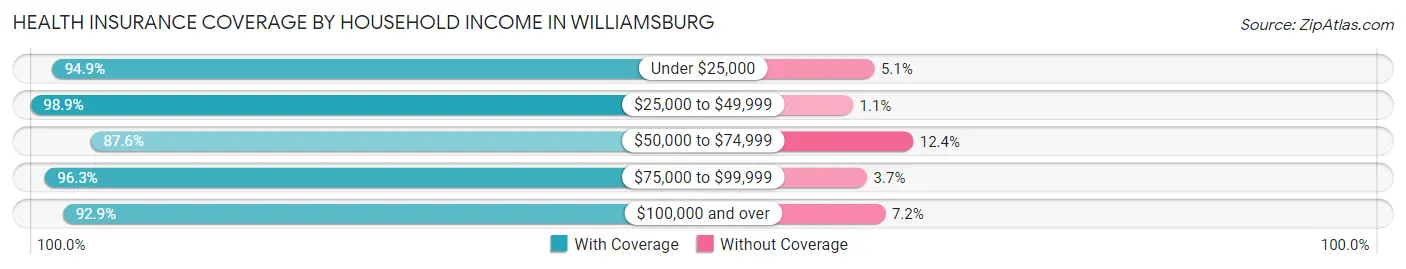
| Household Income | With Coverage | Without Coverage |
| Under $25,000 | 615 (94.9%) | 33 (5.1%) |
| $25,000 to $49,999 | 1,005 (98.9%) | 11 (1.1%) |
| $50,000 to $74,999 | 822 (87.6%) | 116 (12.4%) |
| $75,000 to $99,999 | 1,008 (96.3%) | 39 (3.7%) |
| $100,000 and over | 3,026 (92.8%) | 233 (7.1%) |
Public vs Private Health Insurance Coverage by Age in Williamsburg
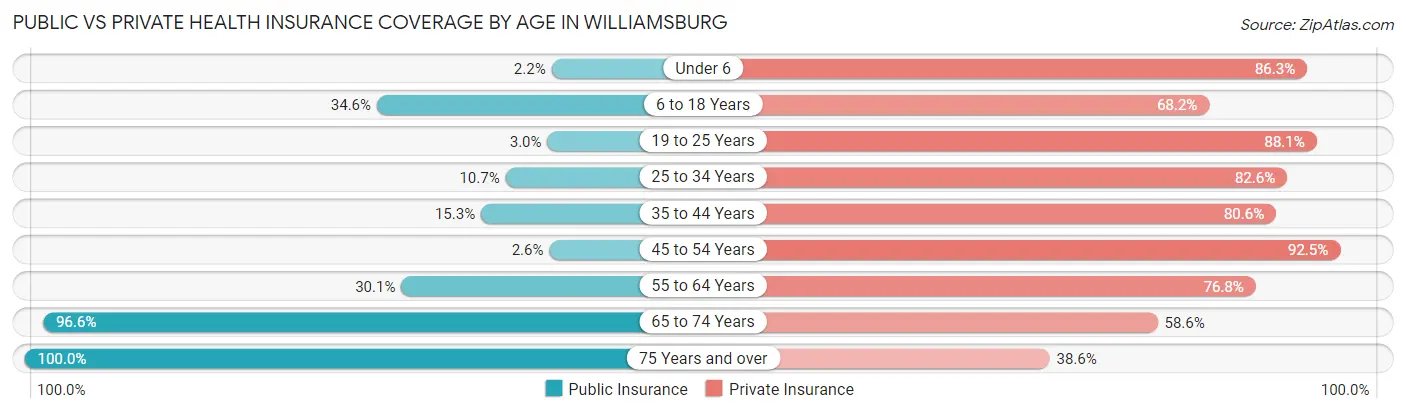
| Age Bracket | Public Insurance | Private Insurance |
| Under 6 | 9 (2.2%) | 354 (86.3%) |
| 6 to 18 Years | 197 (34.6%) | 388 (68.2%) |
| 19 to 25 Years | 11 (3.0%) | 326 (88.1%) |
| 25 to 34 Years | 94 (10.7%) | 723 (82.6%) |
| 35 to 44 Years | 167 (15.3%) | 880 (80.6%) |
| 45 to 54 Years | 26 (2.6%) | 923 (92.5%) |
| 55 to 64 Years | 322 (30.1%) | 822 (76.8%) |
| 65 to 74 Years | 763 (96.6%) | 463 (58.6%) |
| 75 Years and over | 734 (100.0%) | 283 (38.6%) |
| Total | 2,323 (33.6%) | 5,162 (74.7%) |
Disability Status by Sex by Age in Williamsburg
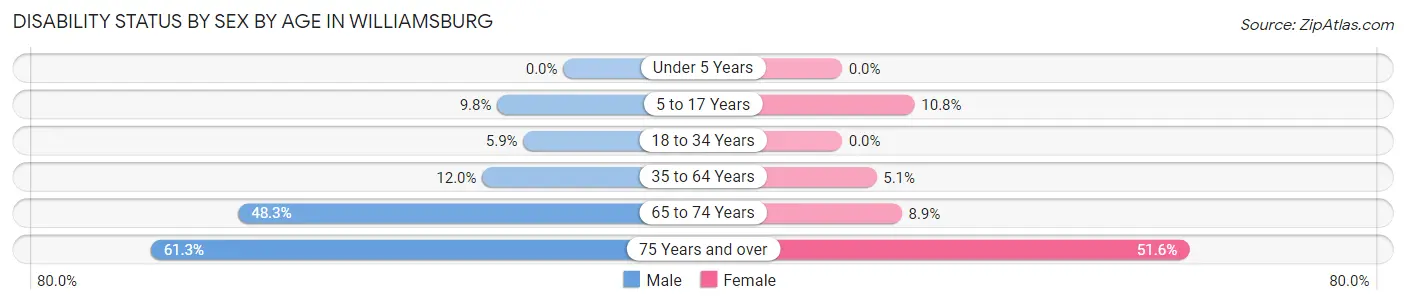
| Age Bracket | Male | Female |
| Under 5 Years | 0 (0.0%) | 0 (0.0%) |
| 5 to 17 Years | 36 (9.8%) | 25 (10.8%) |
| 18 to 34 Years | 39 (5.9%) | 0 (0.0%) |
| 35 to 64 Years | 185 (12.0%) | 83 (5.1%) |
| 65 to 74 Years | 180 (48.3%) | 37 (8.9%) |
| 75 Years and over | 212 (61.3%) | 200 (51.5%) |
Disability Class by Sex by Age in Williamsburg
Disability Class: Hearing Difficulty
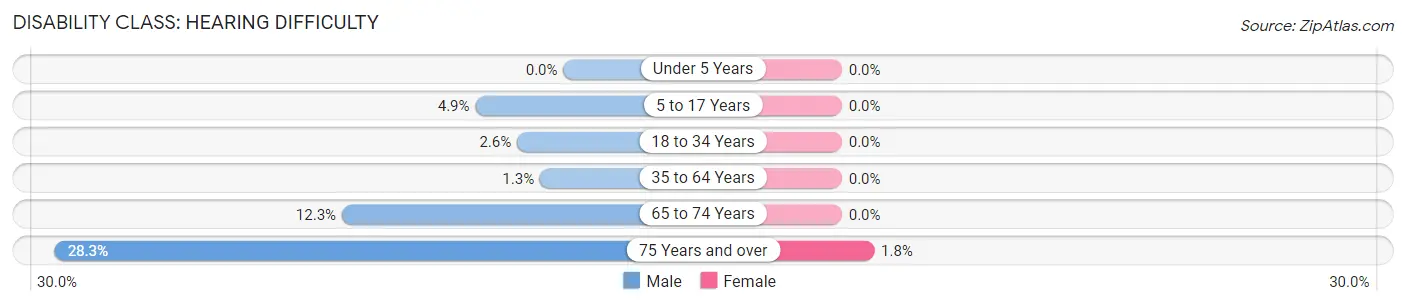
| Age Bracket | Male | Female |
| Under 5 Years | 0 (0.0%) | 0 (0.0%) |
| 5 to 17 Years | 18 (4.9%) | 0 (0.0%) |
| 18 to 34 Years | 17 (2.6%) | 0 (0.0%) |
| 35 to 64 Years | 20 (1.3%) | 0 (0.0%) |
| 65 to 74 Years | 46 (12.3%) | 0 (0.0%) |
| 75 Years and over | 98 (28.3%) | 7 (1.8%) |
Disability Class: Vision Difficulty
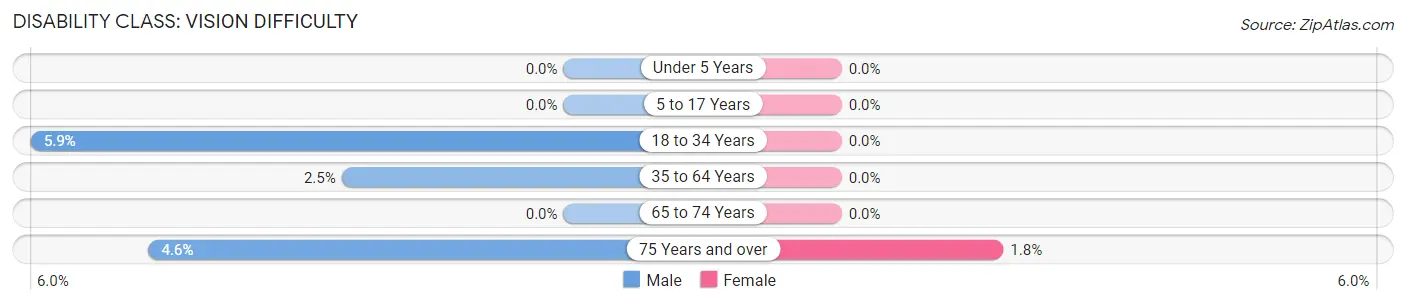
| Age Bracket | Male | Female |
| Under 5 Years | 0 (0.0%) | 0 (0.0%) |
| 5 to 17 Years | 0 (0.0%) | 0 (0.0%) |
| 18 to 34 Years | 39 (5.9%) | 0 (0.0%) |
| 35 to 64 Years | 38 (2.5%) | 0 (0.0%) |
| 65 to 74 Years | 0 (0.0%) | 0 (0.0%) |
| 75 Years and over | 16 (4.6%) | 7 (1.8%) |
Disability Class: Cognitive Difficulty
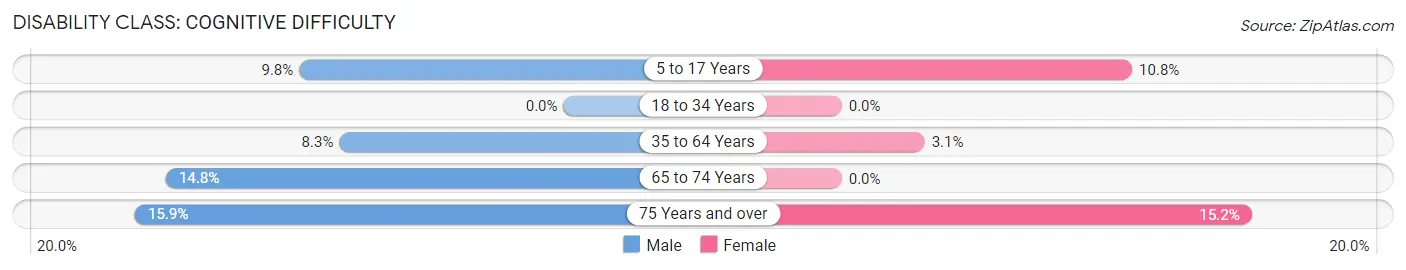
| Age Bracket | Male | Female |
| 5 to 17 Years | 36 (9.8%) | 25 (10.8%) |
| 18 to 34 Years | 0 (0.0%) | 0 (0.0%) |
| 35 to 64 Years | 128 (8.3%) | 50 (3.1%) |
| 65 to 74 Years | 55 (14.7%) | 0 (0.0%) |
| 75 Years and over | 55 (15.9%) | 59 (15.2%) |
Disability Class: Ambulatory Difficulty
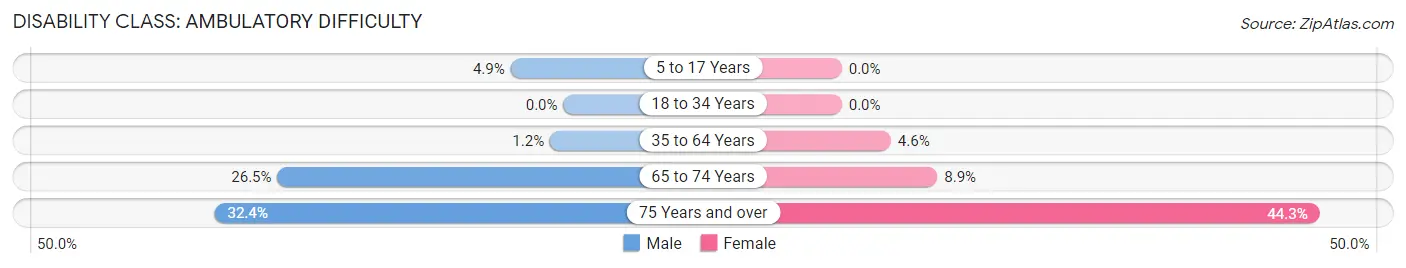
| Age Bracket | Male | Female |
| 5 to 17 Years | 18 (4.9%) | 0 (0.0%) |
| 18 to 34 Years | 0 (0.0%) | 0 (0.0%) |
| 35 to 64 Years | 19 (1.2%) | 74 (4.6%) |
| 65 to 74 Years | 99 (26.5%) | 37 (8.9%) |
| 75 Years and over | 112 (32.4%) | 172 (44.3%) |
Disability Class: Self-Care Difficulty
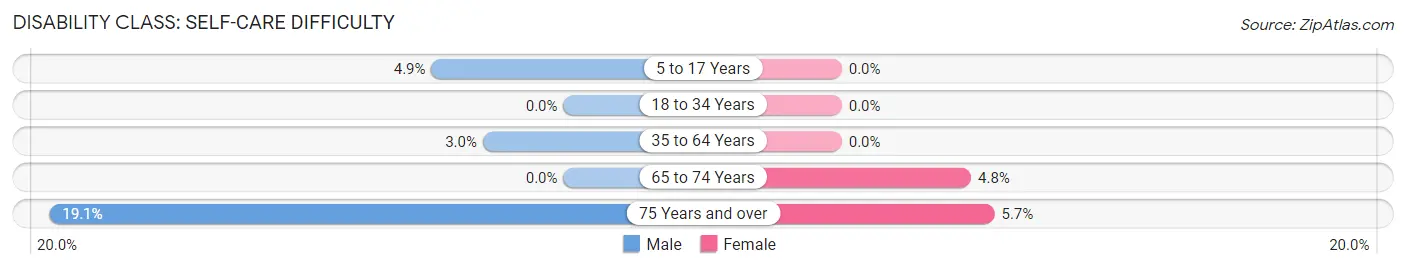
| Age Bracket | Male | Female |
| 5 to 17 Years | 18 (4.9%) | 0 (0.0%) |
| 18 to 34 Years | 0 (0.0%) | 0 (0.0%) |
| 35 to 64 Years | 46 (3.0%) | 0 (0.0%) |
| 65 to 74 Years | 0 (0.0%) | 20 (4.8%) |
| 75 Years and over | 66 (19.1%) | 22 (5.7%) |
Technology Access in Williamsburg
Computing Device Access in Williamsburg
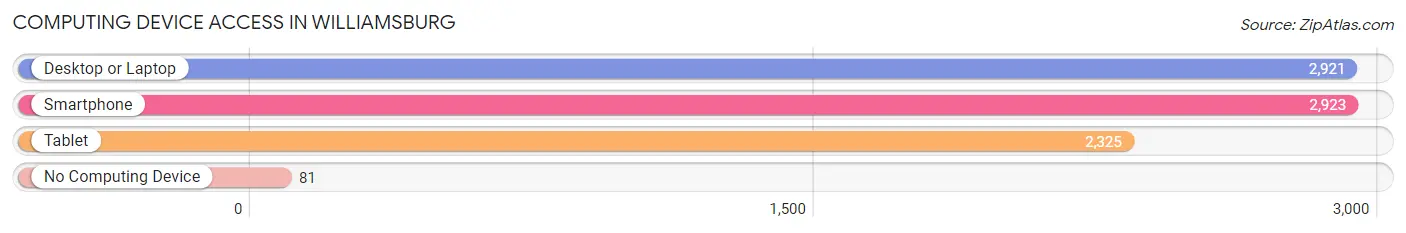
| Device Type | # Households | % Households |
| Desktop or Laptop | 2,921 | 94.0% |
| Smartphone | 2,923 | 94.1% |
| Tablet | 2,325 | 74.9% |
| No Computing Device | 81 | 2.6% |
| Total | 3,106 | 100.0% |
Internet Access in Williamsburg
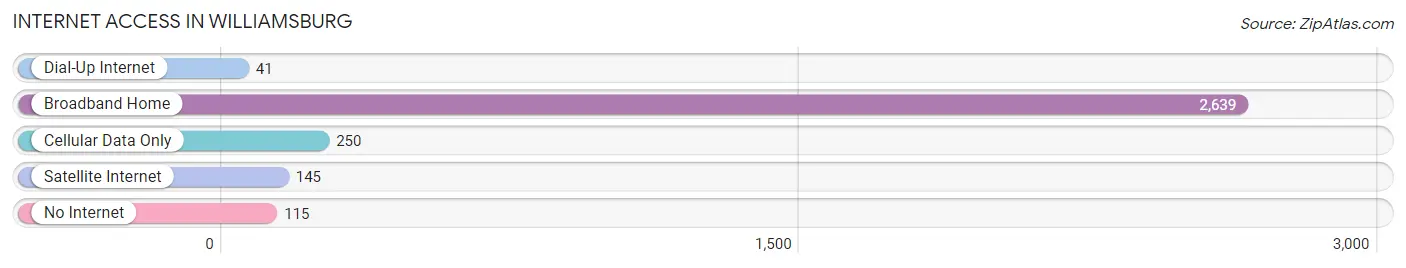
| Internet Type | # Households | % Households |
| Dial-Up Internet | 41 | 1.3% |
| Broadband Home | 2,639 | 85.0% |
| Cellular Data Only | 250 | 8.1% |
| Satellite Internet | 145 | 4.7% |
| No Internet | 115 | 3.7% |
| Total | 3,106 | 100.0% |
Williamsburg Summary
Williamsburg is a small town located in the state of Florida, United States. It is situated in the northern part of the state, in the county of Columbia. The town has a population of approximately 1,000 people, and is located about 20 miles south of the state capital, Tallahassee.
History
The area that is now Williamsburg was first settled in the early 1800s by settlers from Georgia and South Carolina. The town was originally known as “Williamsburg Plantation”, and was named after the plantation owner, William Williams. The town was officially incorporated in 1883, and was named after the plantation owner.
The town was a small farming community for many years, and the main crops grown were cotton, corn, and peanuts. In the early 1900s, the town began to grow and develop, and the population increased. The town was also home to several businesses, including a sawmill, a grist mill, and a general store.
Geography
Williamsburg is located in the northern part of the state of Florida, in the county of Columbia. The town is situated on the banks of the Suwannee River, and is surrounded by forests and wetlands. The town is located about 20 miles south of the state capital, Tallahassee.
The town has a total area of 1.2 square miles, all of which is land. The town has a humid subtropical climate, with hot, humid summers and mild winters. The average temperature in the summer is around 90 degrees Fahrenheit, and the average temperature in the winter is around 60 degrees Fahrenheit.
Economy
The economy of Williamsburg is largely based on agriculture and tourism. The town is home to several farms, which produce a variety of crops, including cotton, corn, and peanuts. The town is also home to several tourist attractions, including the Suwannee River State Park, which offers camping, fishing, and other outdoor activities.
The town is also home to several small businesses, including restaurants, shops, and other services. The town is also home to a few manufacturing companies, which produce a variety of products, including furniture and clothing.
Demographics
As of the 2010 census, the population of Williamsburg was 1,000 people. The racial makeup of the town was 97.2% White, 0.7% African American, 0.2% Native American, 0.2% Asian, 0.2% from other races, and 1.7% from two or more races. Hispanic or Latino of any race were 1.7% of the population.
The median income for a household in the town was $30,000, and the median income for a family was $35,000. The per capita income for the town was $14,000. About 15.7% of families and 18.2% of the population were below the poverty line, including 25.7% of those under the age of 18 and none of those 65 and older.
Common Questions
What is the Total Population of Williamsburg?
Total Population of Williamsburg is 6,908.
What is the Total Male Population of Williamsburg?
Total Male Population of Williamsburg is 3,449.
What is the Total Female Population of Williamsburg?
Total Female Population of Williamsburg is 3,459.
What is the Ratio of Males per 100 Females in Williamsburg?
There are 99.71 Males per 100 Females in Williamsburg.
What is the Ratio of Females per 100 Males in Williamsburg?
There are 100.29 Females per 100 Males in Williamsburg.
What is the Median Population Age in Williamsburg?
Median Population Age in Williamsburg is 46.3 Years.
What is the Average Family Size in Williamsburg
Average Family Size in Williamsburg is 2.8 People.
What is the Average Household Size in Williamsburg
Average Household Size in Williamsburg is 2.2 People.
What is Per Capita Income in Williamsburg?
Per Capita income in Williamsburg is $39,602.
What is the Median Family Income in Williamsburg?
Median Family Income in Williamsburg is $93,295.
What is the Median Household income in Williamsburg?
Median Household Income in Williamsburg is $71,853.
What is Income or Wage Gap in Williamsburg?
Income or Wage Gap in Williamsburg is 27.3%.
Women in Williamsburg earn 72.7 cents for every dollar earned by a man.
What is Family Income Deficit in Williamsburg?
Family Income Deficit in Williamsburg is $10,113.
Families that are below poverty line in Williamsburg earn $10,113 less on average than the poverty threshold level.
What is Inequality or Gini Index in Williamsburg?
Inequality or Gini Index in Williamsburg is 0.41.
How Large is the Labor Force in Williamsburg?
There are 3,718 People in the Labor Forcein in Williamsburg.
What is the Percentage of People in the Labor Force in Williamsburg?
61.3% of People are in the Labor Force in Williamsburg.
What is the Unemployment Rate in Williamsburg?
Unemployment Rate in Williamsburg is 3.6%.