Chiefland, FL
Chiefland Map
Chiefland Overview
2,016
TOTAL POPULATION
969
MALE POPULATION
1,047
FEMALE POPULATION
92.55
MALES / 100 FEMALES
108.05
FEMALES / 100 MALES
37.3
MEDIAN AGE
3.1
AVG FAMILY SIZE
2.5
AVG HOUSEHOLD SIZE
$27,003
PER CAPITA INCOME
$46,131
AVG FAMILY INCOME
$38,536
AVG HOUSEHOLD INCOME
26.7%
WAGE / INCOME GAP [ % ]
73.3¢/ $1
WAGE / INCOME GAP [ $ ]
0.49
INEQUALITY / GINI INDEX
748
LABOR FORCE [ PEOPLE ]
48.5%
PERCENT IN LABOR FORCE
3.5%
UNEMPLOYMENT RATE
Chiefland Zip Codes
Chiefland Area Codes
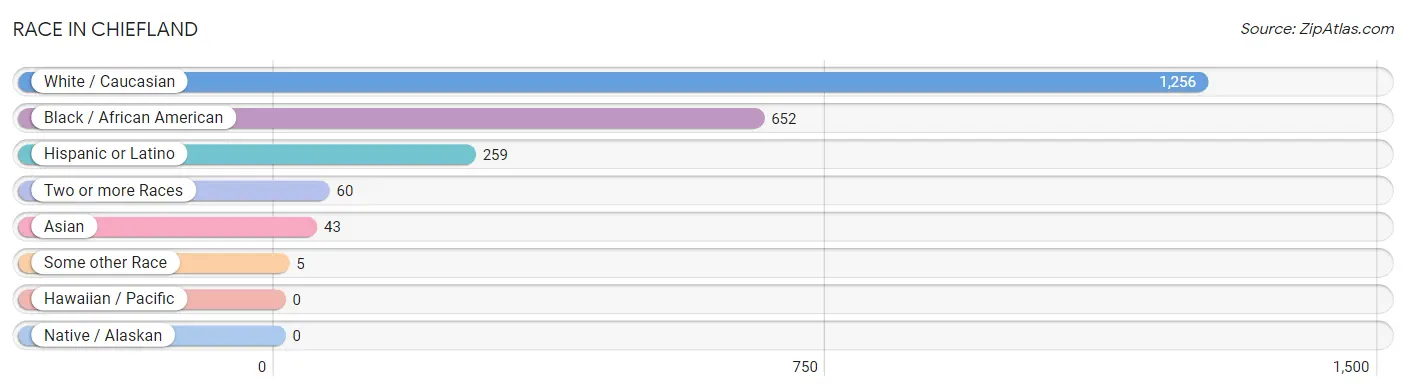
Race in Chiefland
The most populous races in Chiefland are White / Caucasian (1,256 | 62.3%), Black / African American (652 | 32.3%), and Hispanic or Latino (259 | 12.9%).
| Race | # Population | % Population |
| Asian | 43 | 2.1% |
| Black / African American | 652 | 32.3% |
| Hawaiian / Pacific | 0 | 0.0% |
| Hispanic or Latino | 259 | 12.9% |
| Native / Alaskan | 0 | 0.0% |
| White / Caucasian | 1,256 | 62.3% |
| Two or more Races | 60 | 3.0% |
| Some other Race | 5 | 0.3% |
| Total | 2,016 | 100.0% |
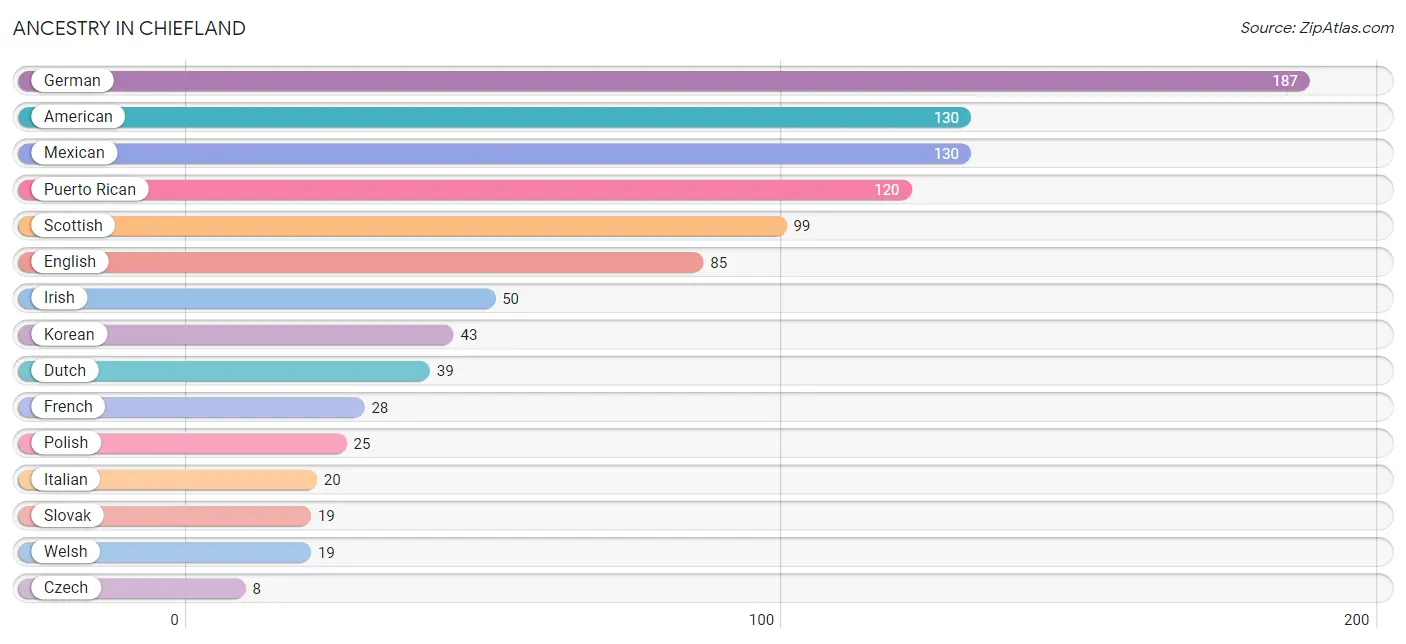
Ancestry in Chiefland
The most populous ancestries reported in Chiefland are German (187 | 9.3%), American (130 | 6.5%), Mexican (130 | 6.5%), Puerto Rican (120 | 5.9%), and Scottish (99 | 4.9%), together accounting for 33.0% of all Chiefland residents.
| Ancestry | # Population | % Population |
| American | 130 | 6.5% |
| Czech | 8 | 0.4% |
| Dutch | 39 | 1.9% |
| English | 85 | 4.2% |
| French | 28 | 1.4% |
| German | 187 | 9.3% |
| Irish | 50 | 2.5% |
| Italian | 20 | 1.0% |
| Korean | 43 | 2.1% |
| Mexican | 130 | 6.5% |
| Norwegian | 7 | 0.4% |
| Polish | 25 | 1.2% |
| Puerto Rican | 120 | 5.9% |
| Russian | 5 | 0.3% |
| Scotch-Irish | 6 | 0.3% |
| Scottish | 99 | 4.9% |
| Slovak | 19 | 0.9% |
| Spaniard | 5 | 0.3% |
| Spanish | 4 | 0.2% |
| Welsh | 19 | 0.9% | View All 20 Rows |
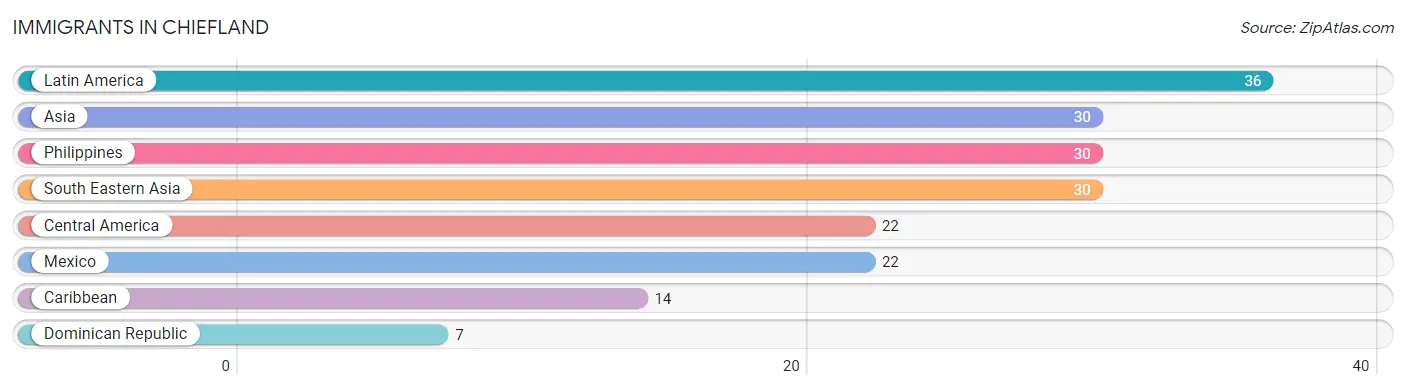
Immigrants in Chiefland
The most numerous immigrant groups reported in Chiefland came from Latin America (36 | 1.8%), Asia (30 | 1.5%), Philippines (30 | 1.5%), South Eastern Asia (30 | 1.5%), and Central America (22 | 1.1%), together accounting for 7.3% of all Chiefland residents.
| Immigration Origin | # Population | % Population |
| Asia | 30 | 1.5% |
| Caribbean | 14 | 0.7% |
| Central America | 22 | 1.1% |
| Dominican Republic | 7 | 0.4% |
| Latin America | 36 | 1.8% |
| Mexico | 22 | 1.1% |
| Philippines | 30 | 1.5% |
| South Eastern Asia | 30 | 1.5% | View All 8 Rows |
Sex and Age in Chiefland
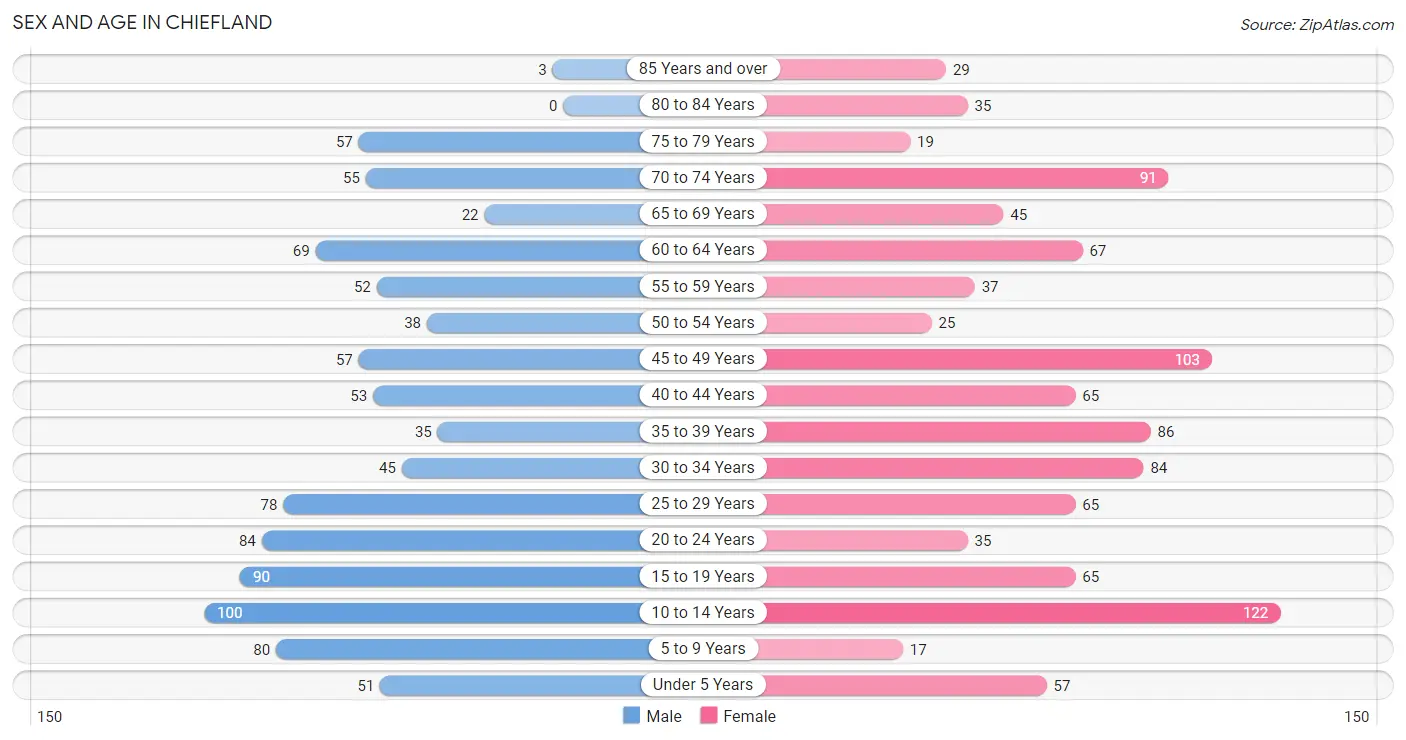
Sex and Age in Chiefland
The most populous age groups in Chiefland are 10 to 14 Years (100 | 10.3%) for men and 10 to 14 Years (122 | 11.7%) for women.
| Age Bracket | Male | Female |
| Under 5 Years | 51 (5.3%) | 57 (5.4%) |
| 5 to 9 Years | 80 (8.3%) | 17 (1.6%) |
| 10 to 14 Years | 100 (10.3%) | 122 (11.7%) |
| 15 to 19 Years | 90 (9.3%) | 65 (6.2%) |
| 20 to 24 Years | 84 (8.7%) | 35 (3.3%) |
| 25 to 29 Years | 78 (8.1%) | 65 (6.2%) |
| 30 to 34 Years | 45 (4.6%) | 84 (8.0%) |
| 35 to 39 Years | 35 (3.6%) | 86 (8.2%) |
| 40 to 44 Years | 53 (5.5%) | 65 (6.2%) |
| 45 to 49 Years | 57 (5.9%) | 103 (9.8%) |
| 50 to 54 Years | 38 (3.9%) | 25 (2.4%) |
| 55 to 59 Years | 52 (5.4%) | 37 (3.5%) |
| 60 to 64 Years | 69 (7.1%) | 67 (6.4%) |
| 65 to 69 Years | 22 (2.3%) | 45 (4.3%) |
| 70 to 74 Years | 55 (5.7%) | 91 (8.7%) |
| 75 to 79 Years | 57 (5.9%) | 19 (1.8%) |
| 80 to 84 Years | 0 (0.0%) | 35 (3.3%) |
| 85 Years and over | 3 (0.3%) | 29 (2.8%) |
| Total | 969 (100.0%) | 1,047 (100.0%) |
Families and Households in Chiefland
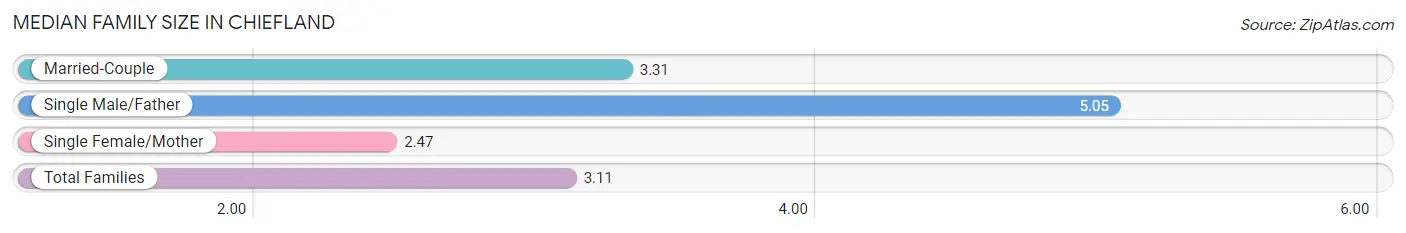
Median Family Size in Chiefland
The median family size in Chiefland is 3.11 persons per family, with single male/father families (37 | 8.0%) accounting for the largest median family size of 5.05 persons per family. On the other hand, single female/mother families (185 | 40.0%) represent the smallest median family size with 2.47 persons per family.
| Family Type | # Families | Family Size |
| Married-Couple | 241 (52.0%) | 3.31 |
| Single Male/Father | 37 (8.0%) | 5.05 |
| Single Female/Mother | 185 (40.0%) | 2.47 |
| Total Families | 463 (100.0%) | 3.11 |
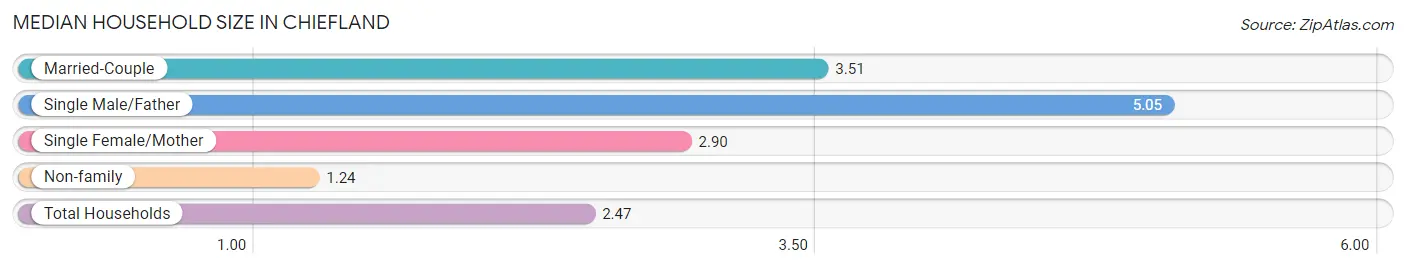
Median Household Size in Chiefland
The median household size in Chiefland is 2.47 persons per household, with single male/father households (37 | 4.6%) accounting for the largest median household size of 5.05 persons per household. non-family households (348 | 42.9%) represent the smallest median household size with 1.24 persons per household.
| Household Type | # Households | Household Size |
| Married-Couple | 241 (29.7%) | 3.51 |
| Single Male/Father | 37 (4.6%) | 5.05 |
| Single Female/Mother | 185 (22.8%) | 2.90 |
| Non-family | 348 (42.9%) | 1.24 |
| Total Households | 811 (100.0%) | 2.47 |
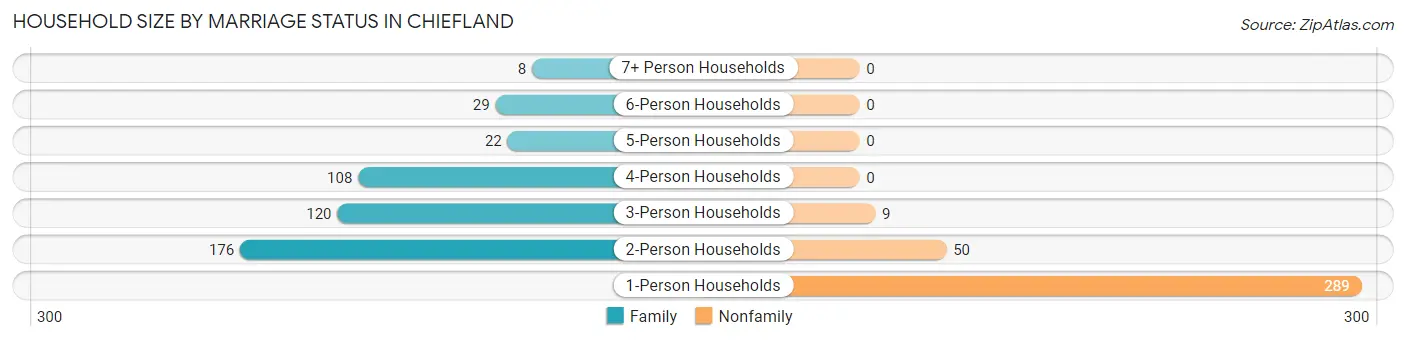
Household Size by Marriage Status in Chiefland
Out of a total of 811 households in Chiefland, 463 (57.1%) are family households, while 348 (42.9%) are nonfamily households. The most numerous type of family households are 2-person households, comprising 176, and the most common type of nonfamily households are 1-person households, comprising 289.
| Household Size | Family Households | Nonfamily Households |
| 1-Person Households | - | 289 (35.6%) |
| 2-Person Households | 176 (21.7%) | 50 (6.2%) |
| 3-Person Households | 120 (14.8%) | 9 (1.1%) |
| 4-Person Households | 108 (13.3%) | 0 (0.0%) |
| 5-Person Households | 22 (2.7%) | 0 (0.0%) |
| 6-Person Households | 29 (3.6%) | 0 (0.0%) |
| 7+ Person Households | 8 (1.0%) | 0 (0.0%) |
| Total | 463 (57.1%) | 348 (42.9%) |
Female Fertility in Chiefland
Fertility by Age in Chiefland
Average fertility rate in Chiefland is 48.0 births per 1,000 women. Women in the age bracket of 20 to 34 years have the highest fertility rate with 120.0 births per 1,000 women. Women in the age bracket of 20 to 34 years acount for 88.0% of all women with births.
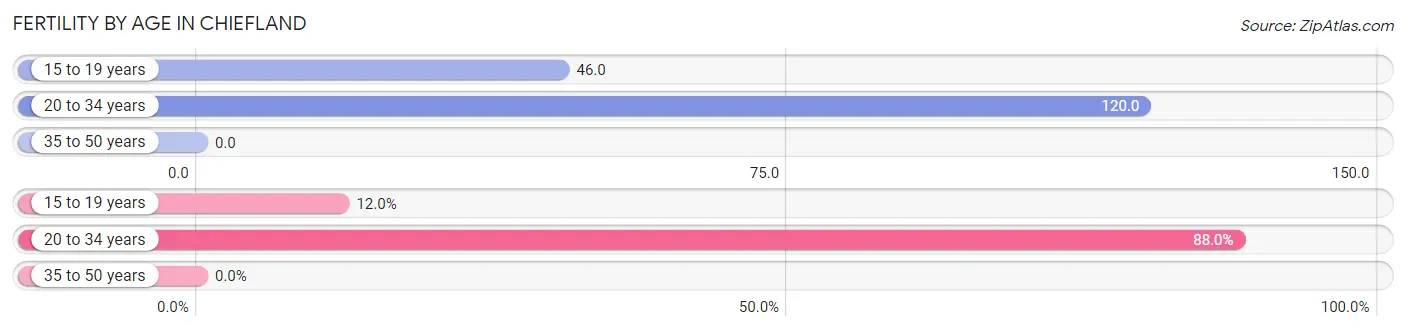
| Age Bracket | Women with Births | Births / 1,000 Women |
| 15 to 19 years | 3 (12.0%) | 46.0 |
| 20 to 34 years | 22 (88.0%) | 120.0 |
| 35 to 50 years | 0 (0.0%) | 0.0 |
| Total | 25 (100.0%) | 48.0 |
Fertility by Age by Marriage Status in Chiefland
20.0% of women with births (25) in Chiefland are married. The highest percentage of unmarried women with births falls into 15 to 19 years age bracket with 100.0% of them unmarried at the time of birth, while the lowest percentage of unmarried women with births belong to 20 to 34 years age bracket with 77.3% of them unmarried.
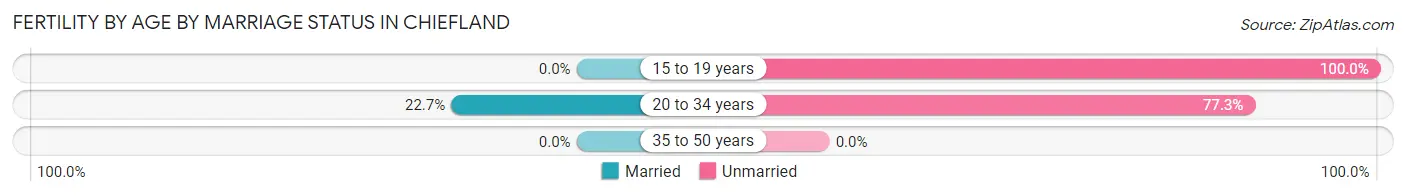
| Age Bracket | Married | Unmarried |
| 15 to 19 years | 0 (0.0%) | 3 (100.0%) |
| 20 to 34 years | 5 (22.7%) | 17 (77.3%) |
| 35 to 50 years | 0 (0.0%) | 0 (0.0%) |
| Total | 5 (20.0%) | 20 (80.0%) |
Fertility by Education in Chiefland
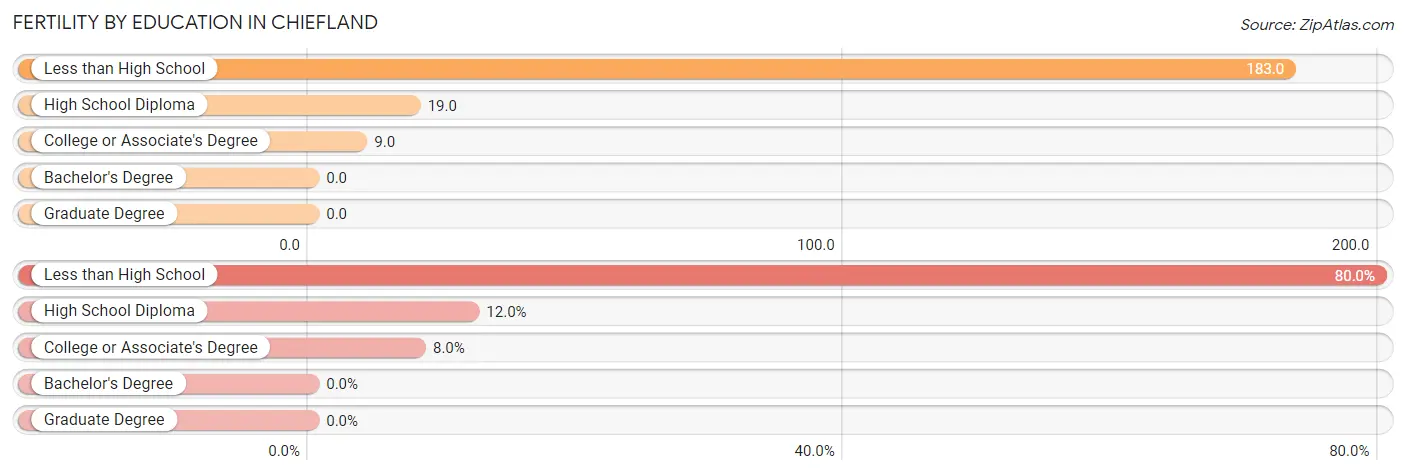
| Educational Attainment | Women with Births | Births / 1,000 Women |
| Less than High School | 20 (80.0%) | 183.0 |
| High School Diploma | 3 (12.0%) | 19.0 |
| College or Associate's Degree | 2 (8.0%) | 9.0 |
| Bachelor's Degree | 0 (0.0%) | 0.0 |
| Graduate Degree | 0 (0.0%) | 0.0 |
| Total | 25 (100.0%) | 48.0 |
Fertility by Education by Marriage Status in Chiefland
80.0% of women with births in Chiefland are unmarried. Women with the educational attainment of high school diploma are most likely to be married with 100.0% of them married at childbirth, while women with the educational attainment of less than high school are least likely to be married with 100.0% of them unmarried at childbirth.
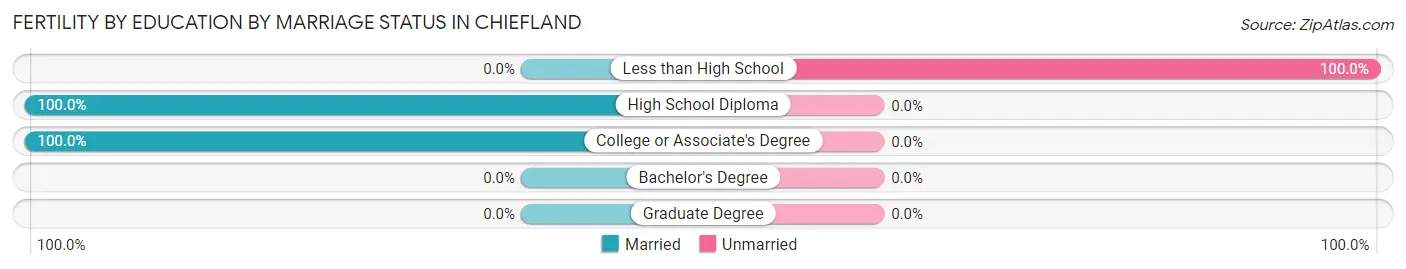
| Educational Attainment | Married | Unmarried |
| Less than High School | 0 (0.0%) | 20 (100.0%) |
| High School Diploma | 3 (100.0%) | 0 (0.0%) |
| College or Associate's Degree | 2 (100.0%) | 0 (0.0%) |
| Bachelor's Degree | 0 (0.0%) | 0 (0.0%) |
| Graduate Degree | 0 (0.0%) | 0 (0.0%) |
| Total | 5 (20.0%) | 20 (80.0%) |
Income in Chiefland
Income Overview in Chiefland
Per Capita Income in Chiefland is $27,003, while median incomes of families and households are $46,131 and $38,536 respectively.
| Characteristic | Number | Measure |
| Per Capita Income | 2,016 | $27,003 |
| Median Family Income | 463 | $46,131 |
| Mean Family Income | 463 | $59,286 |
| Median Household Income | 811 | $38,536 |
| Mean Household Income | 811 | $62,476 |
| Income Deficit | 463 | $0 |
| Wage / Income Gap (%) | 2,016 | 26.73% |
| Wage / Income Gap ($) | 2,016 | 73.27¢ per $1 |
| Gini / Inequality Index | 2,016 | 0.49 |
Earnings by Sex in Chiefland
Average Earnings in Chiefland are $35,731, $42,865 for men and $31,406 for women, a difference of 26.7%.
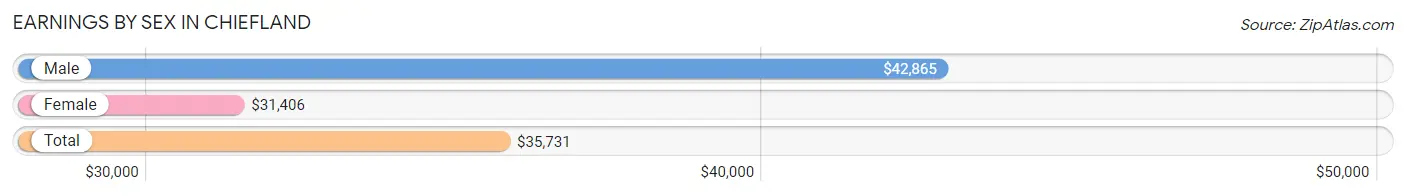
| Sex | Number | Average Earnings |
| Male | 400 (49.4%) | $42,865 |
| Female | 410 (50.6%) | $31,406 |
| Total | 810 (100.0%) | $35,731 |
Earnings by Sex by Income Bracket in Chiefland
The most common earnings brackets in Chiefland are $20,000 to $22,499 for men (59 | 14.7%) and $5,000 to $7,499 for women (52 | 12.7%).
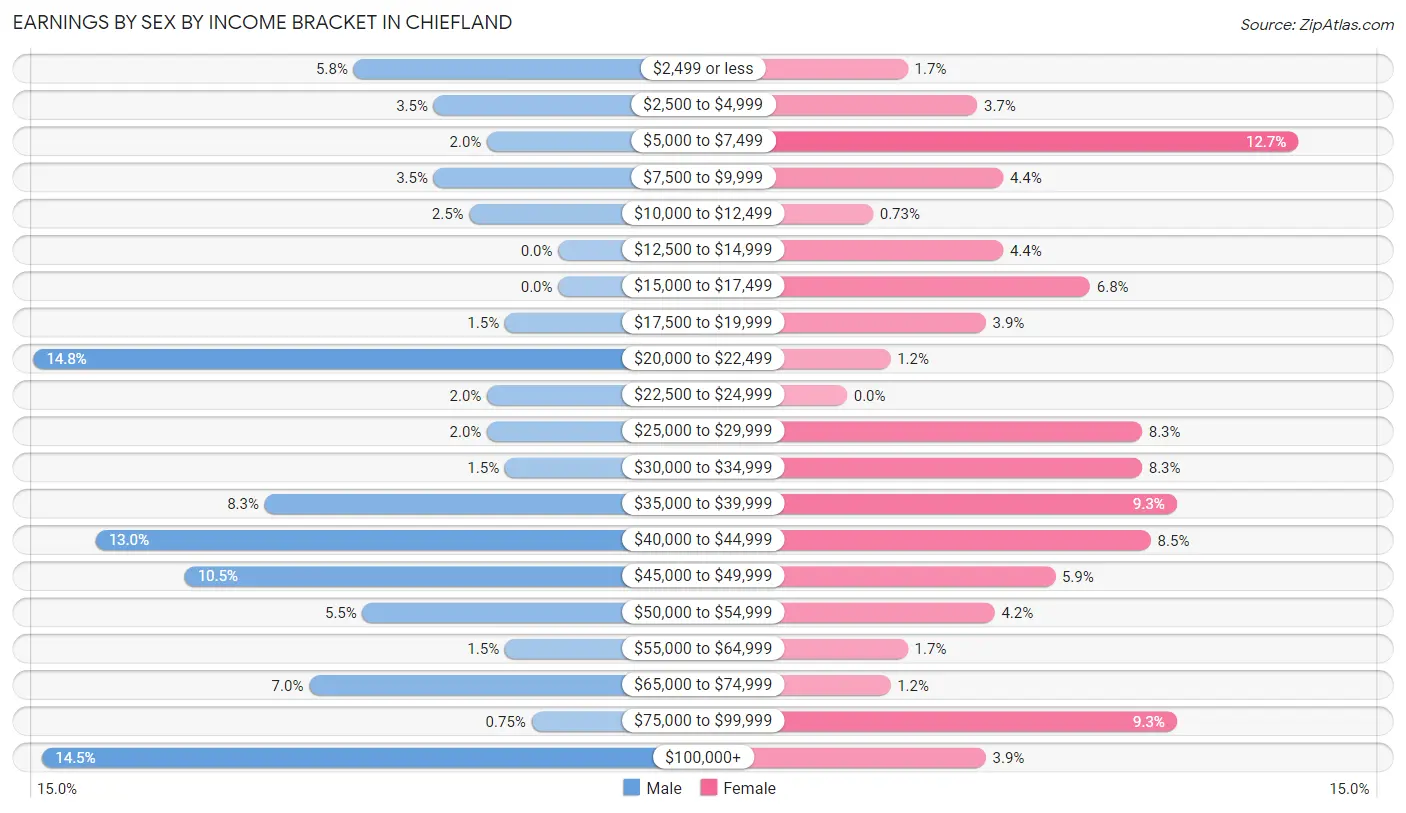
| Income | Male | Female |
| $2,499 or less | 23 (5.8%) | 7 (1.7%) |
| $2,500 to $4,999 | 14 (3.5%) | 15 (3.7%) |
| $5,000 to $7,499 | 8 (2.0%) | 52 (12.7%) |
| $7,500 to $9,999 | 14 (3.5%) | 18 (4.4%) |
| $10,000 to $12,499 | 10 (2.5%) | 3 (0.7%) |
| $12,500 to $14,999 | 0 (0.0%) | 18 (4.4%) |
| $15,000 to $17,499 | 0 (0.0%) | 28 (6.8%) |
| $17,500 to $19,999 | 6 (1.5%) | 16 (3.9%) |
| $20,000 to $22,499 | 59 (14.7%) | 5 (1.2%) |
| $22,500 to $24,999 | 8 (2.0%) | 0 (0.0%) |
| $25,000 to $29,999 | 8 (2.0%) | 34 (8.3%) |
| $30,000 to $34,999 | 6 (1.5%) | 34 (8.3%) |
| $35,000 to $39,999 | 33 (8.3%) | 38 (9.3%) |
| $40,000 to $44,999 | 52 (13.0%) | 35 (8.5%) |
| $45,000 to $49,999 | 42 (10.5%) | 24 (5.9%) |
| $50,000 to $54,999 | 22 (5.5%) | 17 (4.2%) |
| $55,000 to $64,999 | 6 (1.5%) | 7 (1.7%) |
| $65,000 to $74,999 | 28 (7.0%) | 5 (1.2%) |
| $75,000 to $99,999 | 3 (0.7%) | 38 (9.3%) |
| $100,000+ | 58 (14.5%) | 16 (3.9%) |
| Total | 400 (100.0%) | 410 (100.0%) |
Earnings by Sex by Educational Attainment in Chiefland
Average earnings in Chiefland are $43,073 for men and $34,792 for women, a difference of 19.2%. Men with an educational attainment of bachelor's degree enjoy the highest average annual earnings of $100,172, while those with high school diploma education earn the least with $36,591. Women with an educational attainment of bachelor's degree earn the most with the average annual earnings of $63,929, while those with less than high school education have the smallest earnings of $32,708.
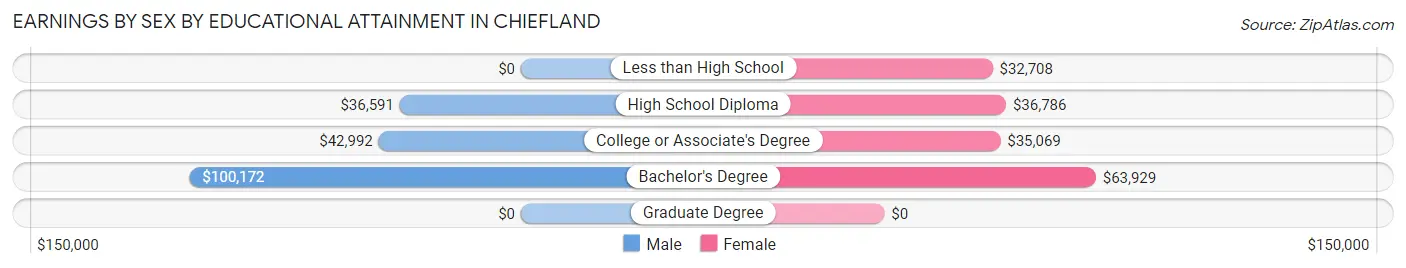
| Educational Attainment | Male Income | Female Income |
| Less than High School | - | - |
| High School Diploma | $36,591 | $36,786 |
| College or Associate's Degree | $42,992 | $35,069 |
| Bachelor's Degree | $100,172 | $63,929 |
| Graduate Degree | - | - |
| Total | $43,073 | $34,792 |
Family Income in Chiefland
Family Income Brackets in Chiefland
According to the Chiefland family income data, there are 100 families falling into the $50,000 to $74,999 income range, which is the most common income bracket and makes up 21.6% of all families. Conversely, the $200,000+ income bracket is the least frequent group with only 6 families (1.3%) belonging to this category.
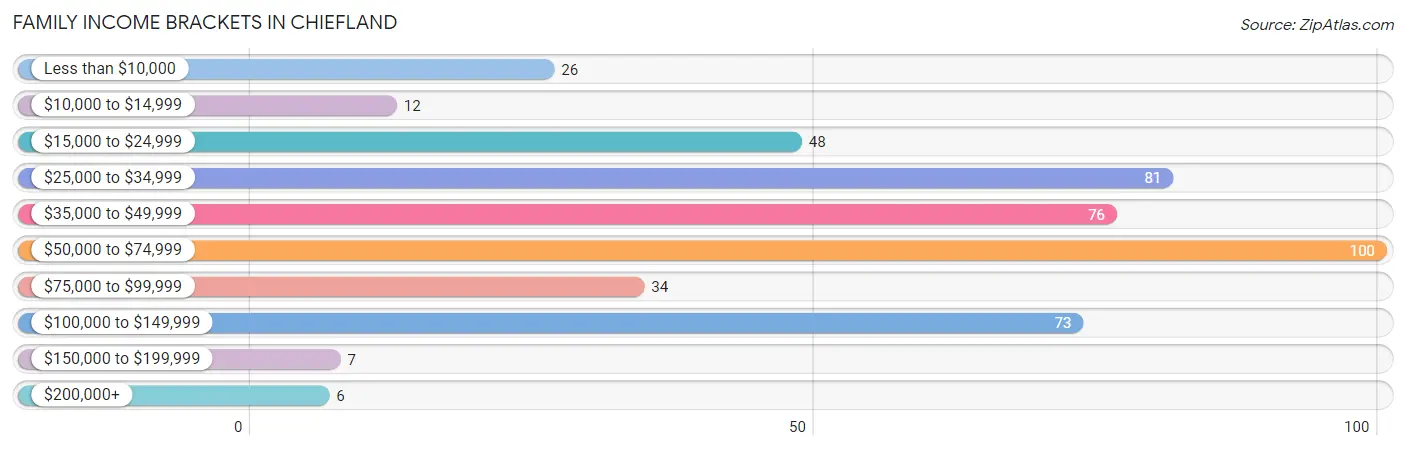
| Income Bracket | # Families | % Families |
| Less than $10,000 | 26 | 5.6% |
| $10,000 to $14,999 | 12 | 2.6% |
| $15,000 to $24,999 | 48 | 10.4% |
| $25,000 to $34,999 | 81 | 17.5% |
| $35,000 to $49,999 | 76 | 16.4% |
| $50,000 to $74,999 | 100 | 21.6% |
| $75,000 to $99,999 | 34 | 7.3% |
| $100,000 to $149,999 | 73 | 15.8% |
| $150,000 to $199,999 | 7 | 1.5% |
| $200,000+ | 6 | 1.3% |
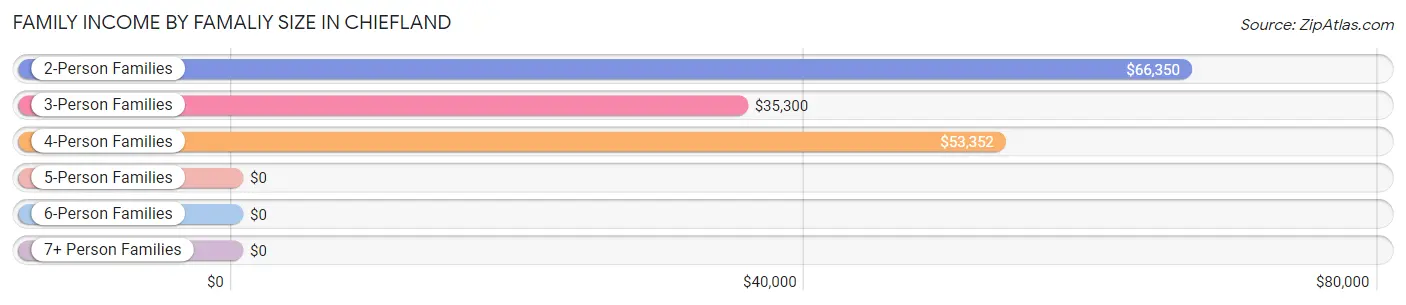
Family Income by Famaliy Size in Chiefland
2-person families (235 | 50.8%) account for the highest median family income in Chiefland with $66,350 per family, while 2-person families (235 | 50.8%) have the highest median income of $33,175 per family member.
| Income Bracket | # Families | Median Income |
| 2-Person Families | 235 (50.8%) | $66,350 |
| 3-Person Families | 106 (22.9%) | $35,300 |
| 4-Person Families | 63 (13.6%) | $53,352 |
| 5-Person Families | 22 (4.8%) | $0 |
| 6-Person Families | 29 (6.3%) | $0 |
| 7+ Person Families | 8 (1.7%) | $0 |
| Total | 463 (100.0%) | $46,131 |
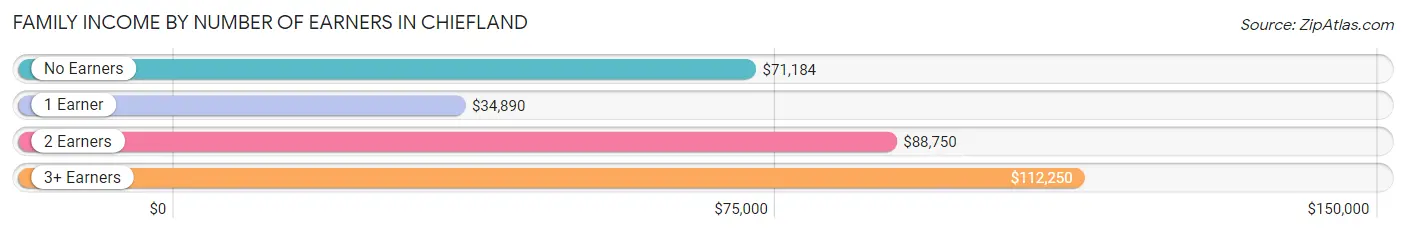
Family Income by Number of Earners in Chiefland
The median family income in Chiefland is $46,131, with families comprising 3+ earners (19) having the highest median family income of $112,250, while families with 1 earner (233) have the lowest median family income of $34,890, accounting for 4.1% and 50.3% of families, respectively.
| Number of Earners | # Families | Median Income |
| No Earners | 118 (25.5%) | $71,184 |
| 1 Earner | 233 (50.3%) | $34,890 |
| 2 Earners | 93 (20.1%) | $88,750 |
| 3+ Earners | 19 (4.1%) | $112,250 |
| Total | 463 (100.0%) | $46,131 |
Household Income in Chiefland
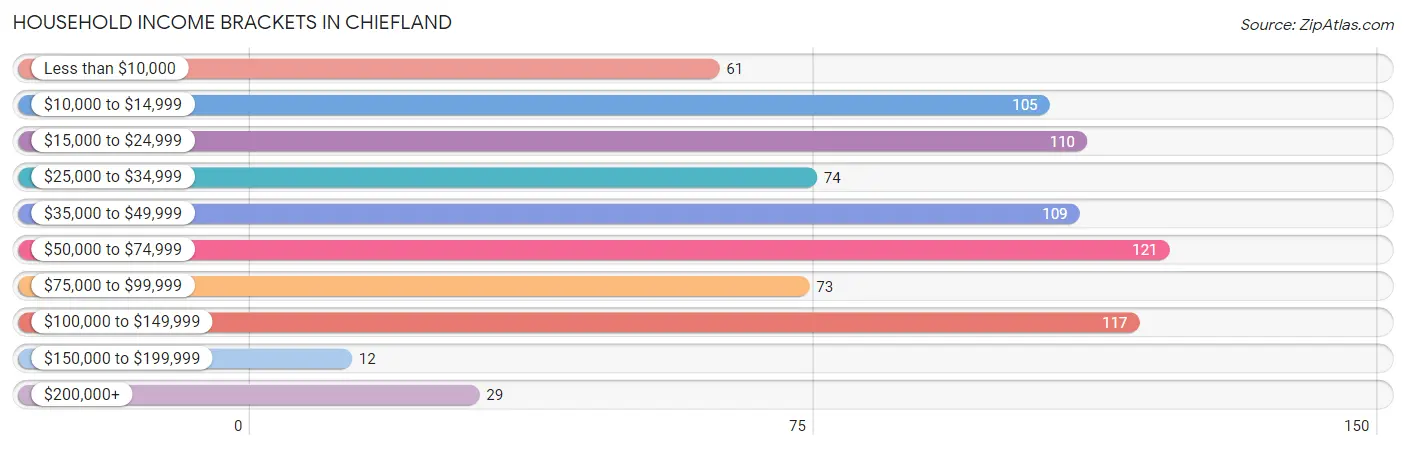
Household Income Brackets in Chiefland
With 121 households falling in the category, the $50,000 to $74,999 income range is the most frequent in Chiefland, accounting for 14.9% of all households. In contrast, only 12 households (1.5%) fall into the $150,000 to $199,999 income bracket, making it the least populous group.
| Income Bracket | # Households | % Households |
| Less than $10,000 | 61 | 7.5% |
| $10,000 to $14,999 | 105 | 12.9% |
| $15,000 to $24,999 | 110 | 13.6% |
| $25,000 to $34,999 | 74 | 9.1% |
| $35,000 to $49,999 | 109 | 13.4% |
| $50,000 to $74,999 | 121 | 14.9% |
| $75,000 to $99,999 | 73 | 9.0% |
| $100,000 to $149,999 | 117 | 14.4% |
| $150,000 to $199,999 | 12 | 1.5% |
| $200,000+ | 29 | 3.6% |
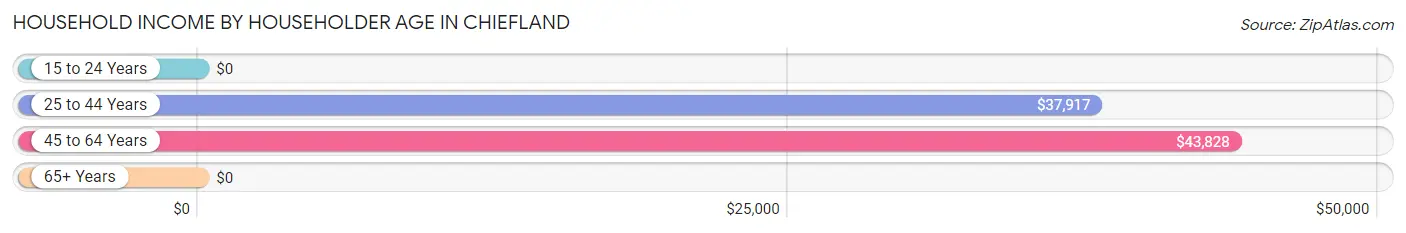
Household Income by Householder Age in Chiefland
The median household income in Chiefland is $38,536, with the highest median household income of $43,828 found in the 45 to 64 years age bracket for the primary householder. A total of 237 households (29.2%) fall into this category. Meanwhile, the 15 to 24 years age bracket for the primary householder has the lowest median household income of $0, with 38 households (4.7%) in this group.
| Income Bracket | # Households | Median Income |
| 15 to 24 Years | 38 (4.7%) | $0 |
| 25 to 44 Years | 271 (33.4%) | $37,917 |
| 45 to 64 Years | 237 (29.2%) | $43,828 |
| 65+ Years | 265 (32.7%) | $0 |
| Total | 811 (100.0%) | $38,536 |
Poverty in Chiefland
Income Below Poverty by Sex and Age in Chiefland
With 29.0% poverty level for males and 26.5% for females among the residents of Chiefland, 18 to 24 year old males and under 5 year old females are the most vulnerable to poverty, with 107 males (94.7%) and 34 females (68.0%) in their respective age groups living below the poverty level.
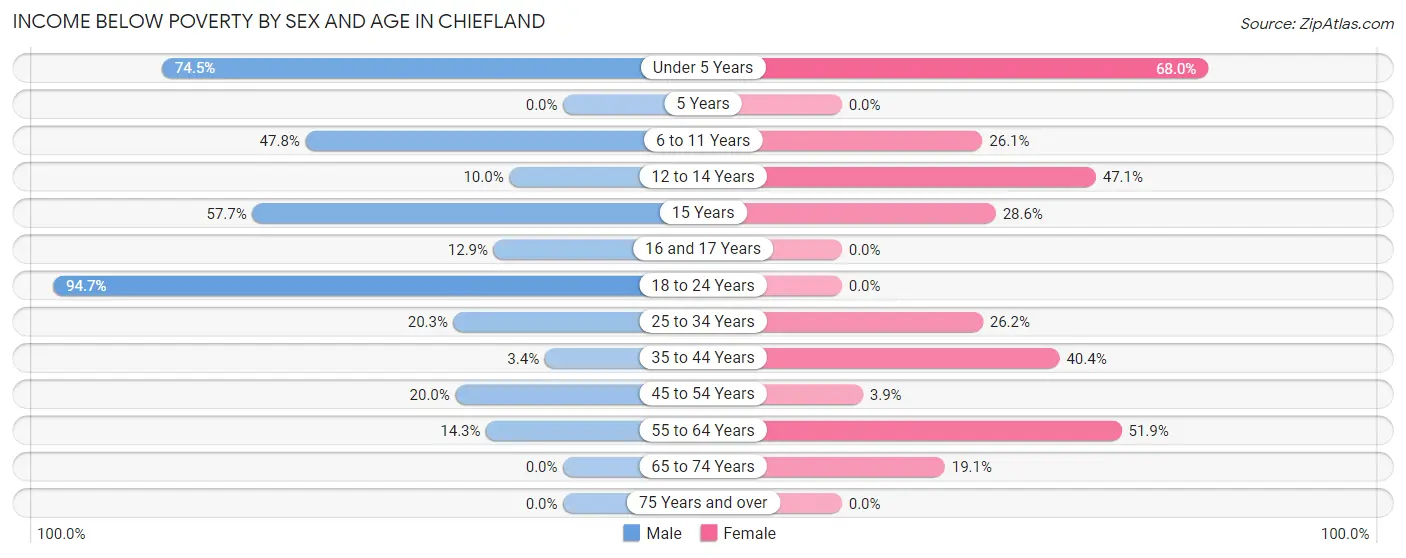
| Age Bracket | Male | Female |
| Under 5 Years | 38 (74.5%) | 34 (68.0%) |
| 5 Years | 0 (0.0%) | 0 (0.0%) |
| 6 to 11 Years | 44 (47.8%) | 18 (26.1%) |
| 12 to 14 Years | 6 (10.0%) | 33 (47.1%) |
| 15 Years | 15 (57.7%) | 6 (28.6%) |
| 16 and 17 Years | 4 (12.9%) | 0 (0.0%) |
| 18 to 24 Years | 107 (94.7%) | 0 (0.0%) |
| 25 to 34 Years | 25 (20.3%) | 39 (26.2%) |
| 35 to 44 Years | 3 (3.4%) | 59 (40.4%) |
| 45 to 54 Years | 19 (20.0%) | 5 (3.9%) |
| 55 to 64 Years | 17 (14.3%) | 54 (51.9%) |
| 65 to 74 Years | 0 (0.0%) | 26 (19.1%) |
| 75 Years and over | 0 (0.0%) | 0 (0.0%) |
| Total | 278 (29.0%) | 274 (26.5%) |
Income Above Poverty by Sex and Age in Chiefland
According to the poverty statistics in Chiefland, males aged 5 years and females aged 16 and 17 years are the age groups that are most secure financially, with 100.0% of males and 100.0% of females in these age groups living above the poverty line.
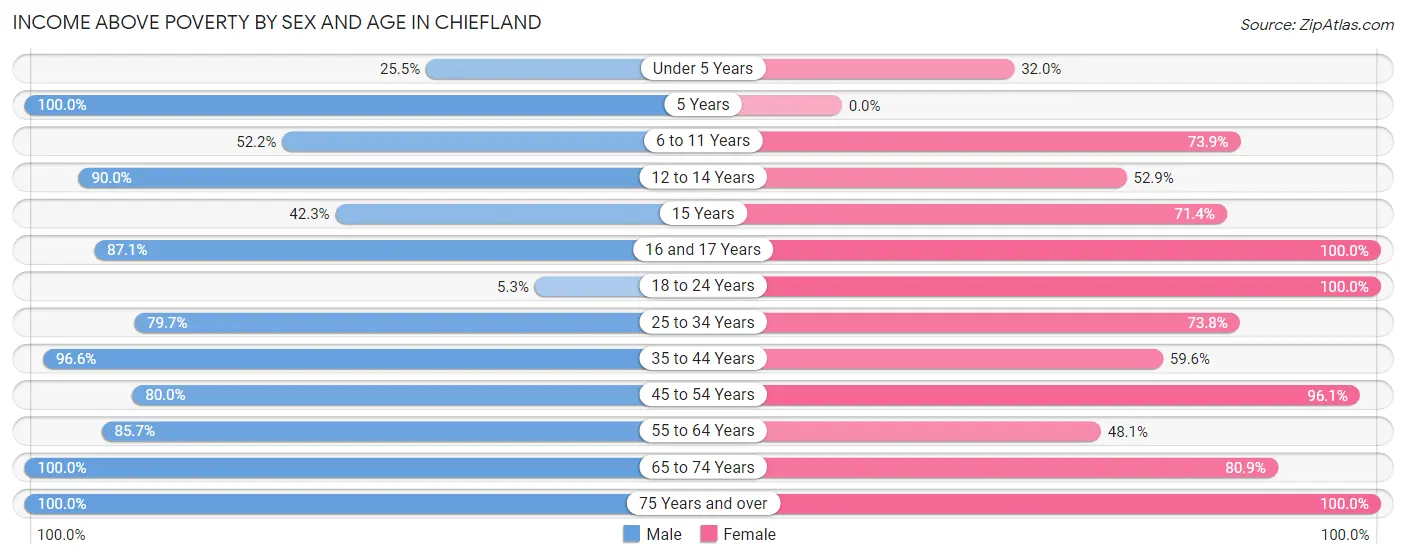
| Age Bracket | Male | Female |
| Under 5 Years | 13 (25.5%) | 16 (32.0%) |
| 5 Years | 28 (100.0%) | 0 (0.0%) |
| 6 to 11 Years | 48 (52.2%) | 51 (73.9%) |
| 12 to 14 Years | 54 (90.0%) | 37 (52.9%) |
| 15 Years | 11 (42.3%) | 15 (71.4%) |
| 16 and 17 Years | 27 (87.1%) | 27 (100.0%) |
| 18 to 24 Years | 6 (5.3%) | 52 (100.0%) |
| 25 to 34 Years | 98 (79.7%) | 110 (73.8%) |
| 35 to 44 Years | 85 (96.6%) | 87 (59.6%) |
| 45 to 54 Years | 76 (80.0%) | 123 (96.1%) |
| 55 to 64 Years | 102 (85.7%) | 50 (48.1%) |
| 65 to 74 Years | 77 (100.0%) | 110 (80.9%) |
| 75 Years and over | 57 (100.0%) | 83 (100.0%) |
| Total | 682 (71.0%) | 761 (73.5%) |
Income Below Poverty Among Married-Couple Families in Chiefland
The poverty statistics for married-couple families in Chiefland show that 6.2% or 15 of the total 241 families live below the poverty line. Families with 1 or 2 children have the highest poverty rate of 28.8%, comprising of 15 families. On the other hand, families with no children have the lowest poverty rate of 0.0%, which includes 0 families.
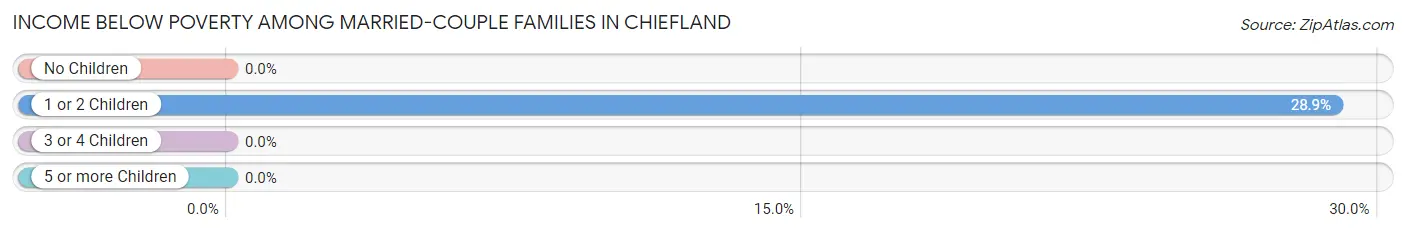
| Children | Above Poverty | Below Poverty |
| No Children | 154 (100.0%) | 0 (0.0%) |
| 1 or 2 Children | 37 (71.2%) | 15 (28.8%) |
| 3 or 4 Children | 35 (100.0%) | 0 (0.0%) |
| 5 or more Children | 0 (0.0%) | 0 (0.0%) |
| Total | 226 (93.8%) | 15 (6.2%) |
Income Below Poverty Among Single-Parent Households in Chiefland
According to the poverty data in Chiefland, 21.6% or 8 single-father households and 35.1% or 65 single-mother households are living below the poverty line. Among single-father households, those with 5 or more children have the highest poverty rate, with 8 households (100.0%) experiencing poverty. Likewise, among single-mother households, those with 3 or 4 children have the highest poverty rate, with 20 households (100.0%) falling below the poverty line.
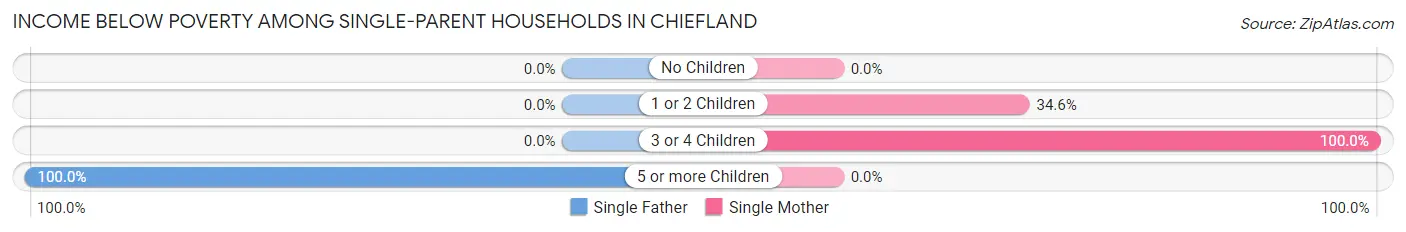
| Children | Single Father | Single Mother |
| No Children | 0 (0.0%) | 0 (0.0%) |
| 1 or 2 Children | 0 (0.0%) | 45 (34.6%) |
| 3 or 4 Children | 0 (0.0%) | 20 (100.0%) |
| 5 or more Children | 8 (100.0%) | 0 (0.0%) |
| Total | 8 (21.6%) | 65 (35.1%) |
Income Below Poverty Among Married-Couple vs Single-Parent Households in Chiefland
The poverty data for Chiefland shows that 15 of the married-couple family households (6.2%) and 73 of the single-parent households (32.9%) are living below the poverty level. Within the married-couple family households, those with 1 or 2 children have the highest poverty rate, with 15 households (28.8%) falling below the poverty line. Among the single-parent households, those with 5 or more children have the highest poverty rate, with 8 household (100.0%) living below poverty.
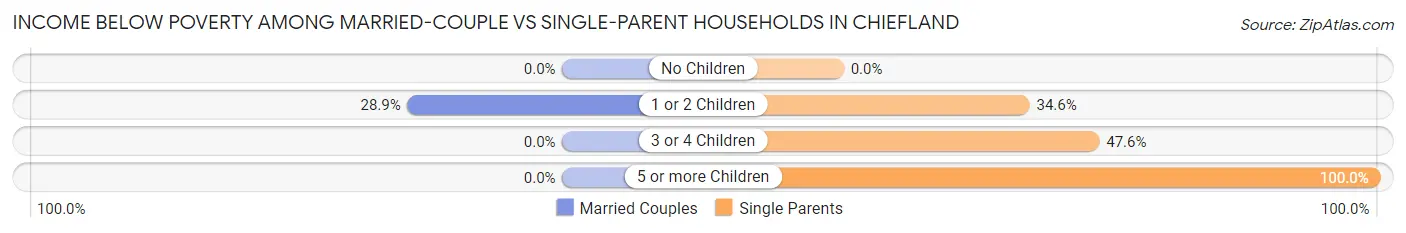
| Children | Married-Couple Families | Single-Parent Households |
| No Children | 0 (0.0%) | 0 (0.0%) |
| 1 or 2 Children | 15 (28.8%) | 45 (34.6%) |
| 3 or 4 Children | 0 (0.0%) | 20 (47.6%) |
| 5 or more Children | 0 (0.0%) | 8 (100.0%) |
| Total | 15 (6.2%) | 73 (32.9%) |
Employment Characteristics in Chiefland
Employment by Class of Employer in Chiefland
Among the 701 employed individuals in Chiefland, private company employees (409 | 58.4%), local government employees (84 | 12.0%), and state government employees (74 | 10.6%) make up the most common classes of employment.
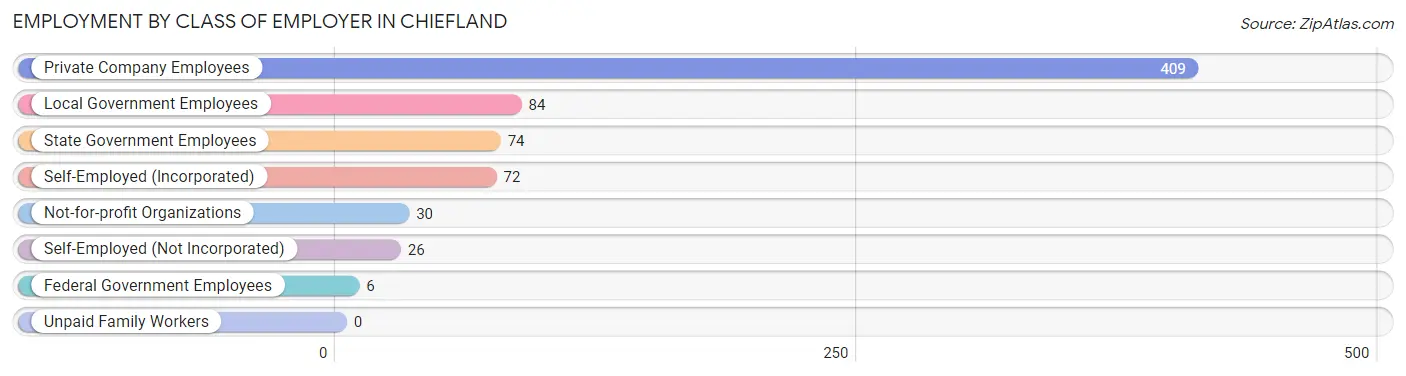
| Employer Class | # Employees | % Employees |
| Private Company Employees | 409 | 58.4% |
| Self-Employed (Incorporated) | 72 | 10.3% |
| Self-Employed (Not Incorporated) | 26 | 3.7% |
| Not-for-profit Organizations | 30 | 4.3% |
| Local Government Employees | 84 | 12.0% |
| State Government Employees | 74 | 10.6% |
| Federal Government Employees | 6 | 0.9% |
| Unpaid Family Workers | 0 | 0.0% |
| Total | 701 | 100.0% |
Employment Status by Age in Chiefland
According to the labor force statistics for Chiefland, out of the total population over 16 years of age (1,542), 48.5% or 748 individuals are in the labor force, with 3.5% or 26 of them unemployed. The age group with the highest labor force participation rate is 45 to 54 years, with 91.5% or 204 individuals in the labor force. Within the labor force, the 25 to 29 years age range has the highest percentage of unemployed individuals, with 12.3% or 15 of them being unemployed.
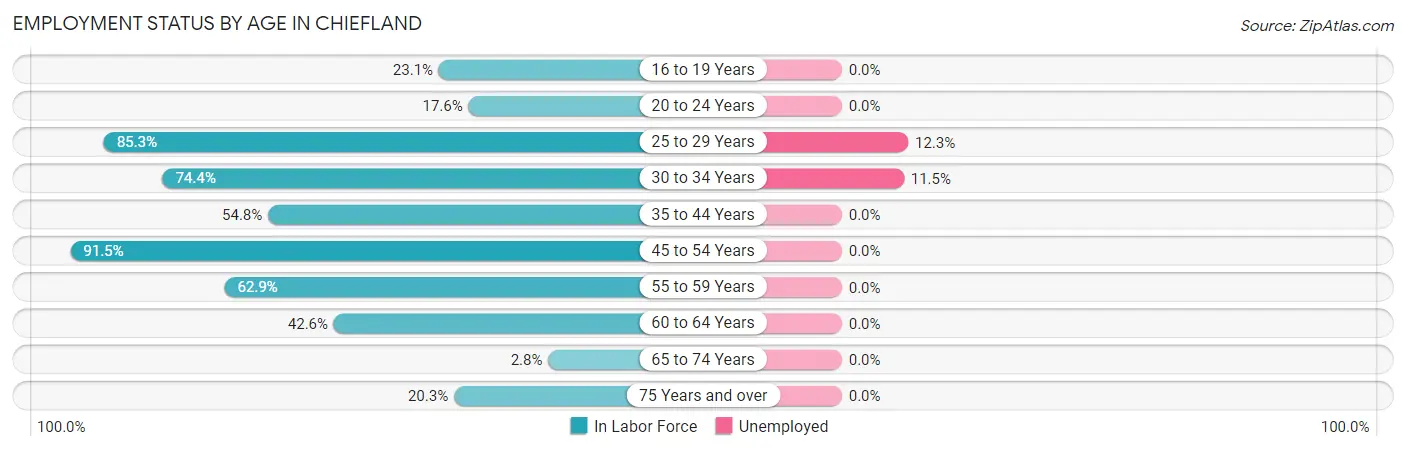
| Age Bracket | In Labor Force | Unemployed |
| 16 to 19 Years | 25 (23.1%) | 0 (0.0%) |
| 20 to 24 Years | 21 (17.6%) | 0 (0.0%) |
| 25 to 29 Years | 122 (85.3%) | 15 (12.3%) |
| 30 to 34 Years | 96 (74.4%) | 11 (11.5%) |
| 35 to 44 Years | 131 (54.8%) | 0 (0.0%) |
| 45 to 54 Years | 204 (91.5%) | 0 (0.0%) |
| 55 to 59 Years | 56 (62.9%) | 0 (0.0%) |
| 60 to 64 Years | 58 (42.6%) | 0 (0.0%) |
| 65 to 74 Years | 6 (2.8%) | 0 (0.0%) |
| 75 Years and over | 29 (20.3%) | 0 (0.0%) |
| Total | 748 (48.5%) | 26 (3.5%) |
Employment Status by Educational Attainment in Chiefland
According to labor force statistics for Chiefland, 69.6% of individuals (667) out of the total population between 25 and 64 years of age (959) are in the labor force, with 3.9% or 26 of them being unemployed. The group with the highest labor force participation rate are those with the educational attainment of bachelor's degree or higher, with 94.1% or 80 individuals in the labor force. Within the labor force, individuals with less than high school education have the highest percentage of unemployment, with 12.2% or 11 of them being unemployed.
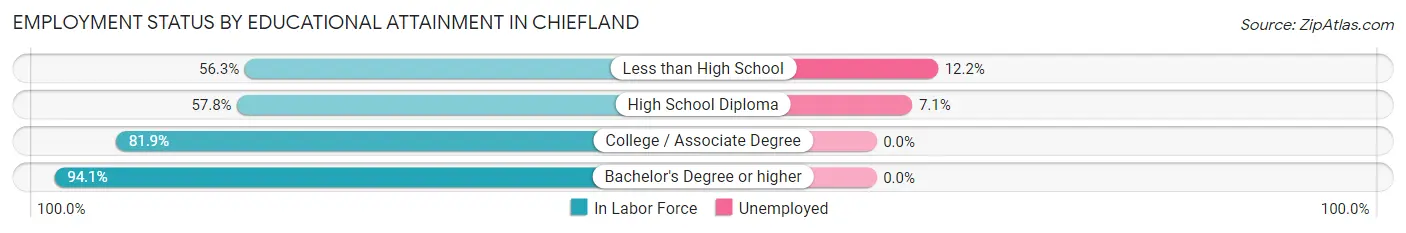
| Educational Attainment | In Labor Force | Unemployed |
| Less than High School | 90 (56.3%) | 20 (12.2%) |
| High School Diploma | 211 (57.8%) | 26 (7.1%) |
| College / Associate Degree | 286 (81.9%) | 0 (0.0%) |
| Bachelor's Degree or higher | 80 (94.1%) | 0 (0.0%) |
| Total | 667 (69.6%) | 37 (3.9%) |
Employment Occupations by Sex in Chiefland
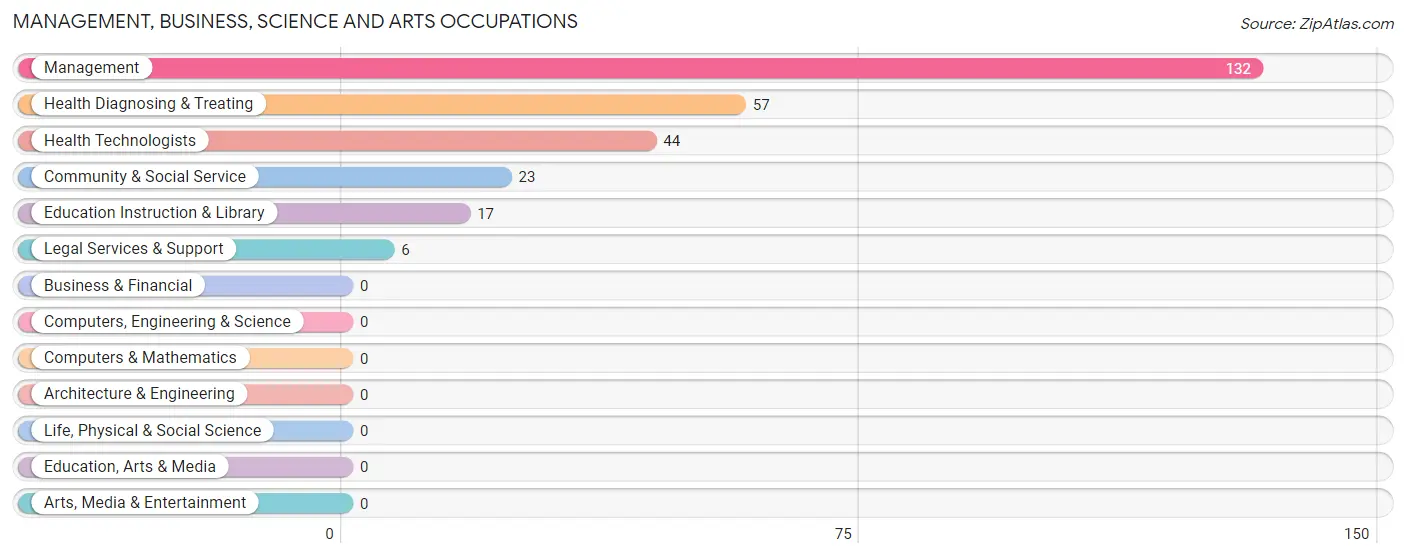
Management, Business, Science and Arts Occupations
The most common Management, Business, Science and Arts occupations in Chiefland are Management (132 | 18.3%), Health Diagnosing & Treating (57 | 7.9%), Health Technologists (44 | 6.1%), Community & Social Service (23 | 3.2%), and Education Instruction & Library (17 | 2.4%).
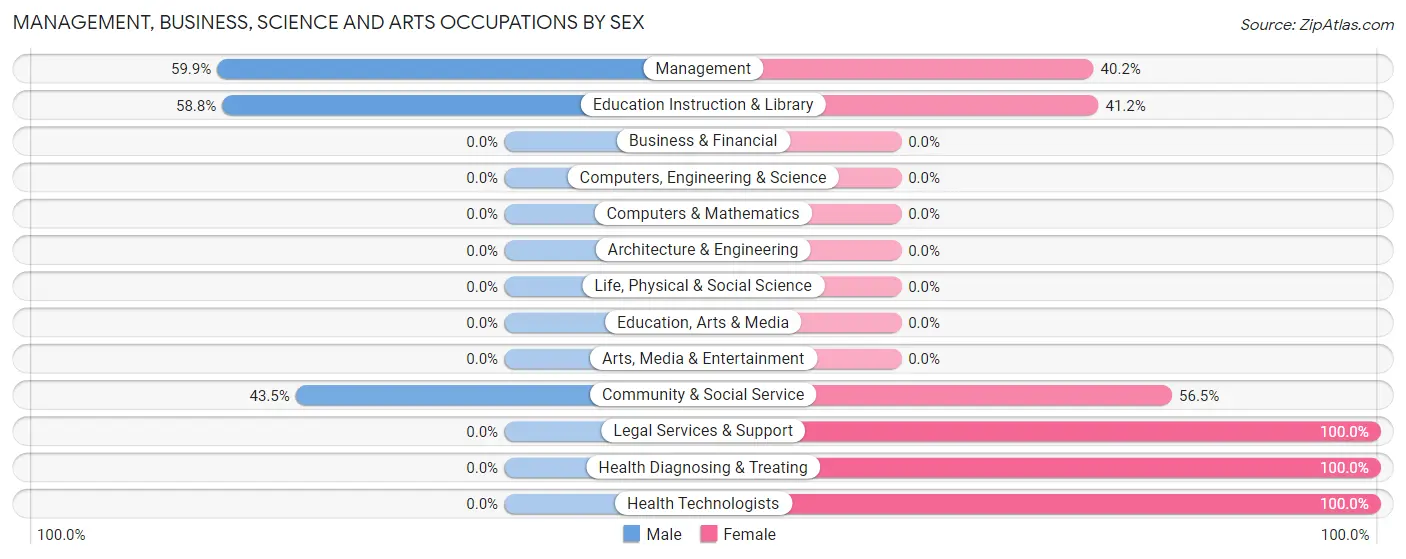
Management, Business, Science and Arts Occupations by Sex
Within the Management, Business, Science and Arts occupations in Chiefland, the most male-oriented occupations are Management (59.9%), Education Instruction & Library (58.8%), and Community & Social Service (43.5%), while the most female-oriented occupations are Legal Services & Support (100.0%), Health Diagnosing & Treating (100.0%), and Health Technologists (100.0%).
| Occupation | Male | Female |
| Management | 79 (59.9%) | 53 (40.2%) |
| Business & Financial | 0 (0.0%) | 0 (0.0%) |
| Computers, Engineering & Science | 0 (0.0%) | 0 (0.0%) |
| Computers & Mathematics | 0 (0.0%) | 0 (0.0%) |
| Architecture & Engineering | 0 (0.0%) | 0 (0.0%) |
| Life, Physical & Social Science | 0 (0.0%) | 0 (0.0%) |
| Community & Social Service | 10 (43.5%) | 13 (56.5%) |
| Education, Arts & Media | 0 (0.0%) | 0 (0.0%) |
| Legal Services & Support | 0 (0.0%) | 6 (100.0%) |
| Education Instruction & Library | 10 (58.8%) | 7 (41.2%) |
| Arts, Media & Entertainment | 0 (0.0%) | 0 (0.0%) |
| Health Diagnosing & Treating | 0 (0.0%) | 57 (100.0%) |
| Health Technologists | 0 (0.0%) | 44 (100.0%) |
| Total (Category) | 89 (42.0%) | 123 (58.0%) |
| Total (Overall) | 381 (52.8%) | 341 (47.2%) |
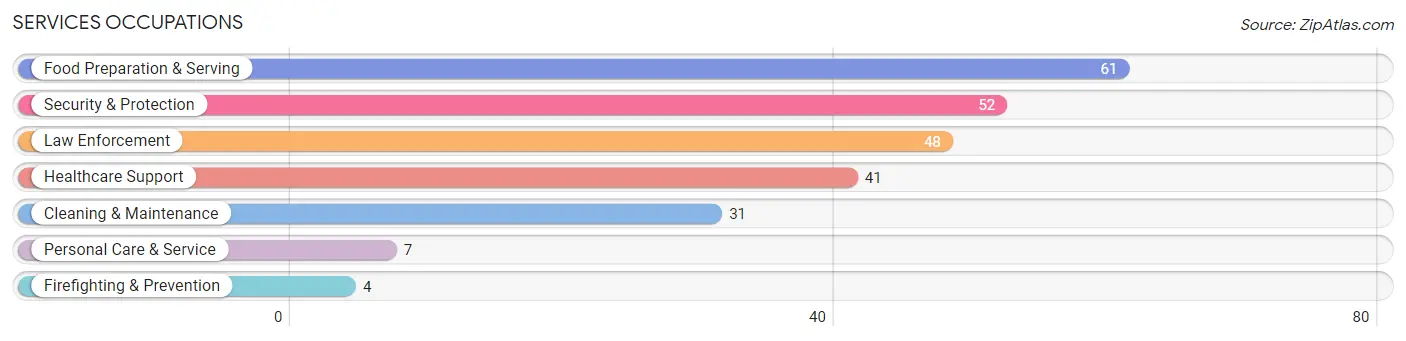
Services Occupations
The most common Services occupations in Chiefland are Food Preparation & Serving (61 | 8.5%), Security & Protection (52 | 7.2%), Law Enforcement (48 | 6.7%), Healthcare Support (41 | 5.7%), and Cleaning & Maintenance (31 | 4.3%).
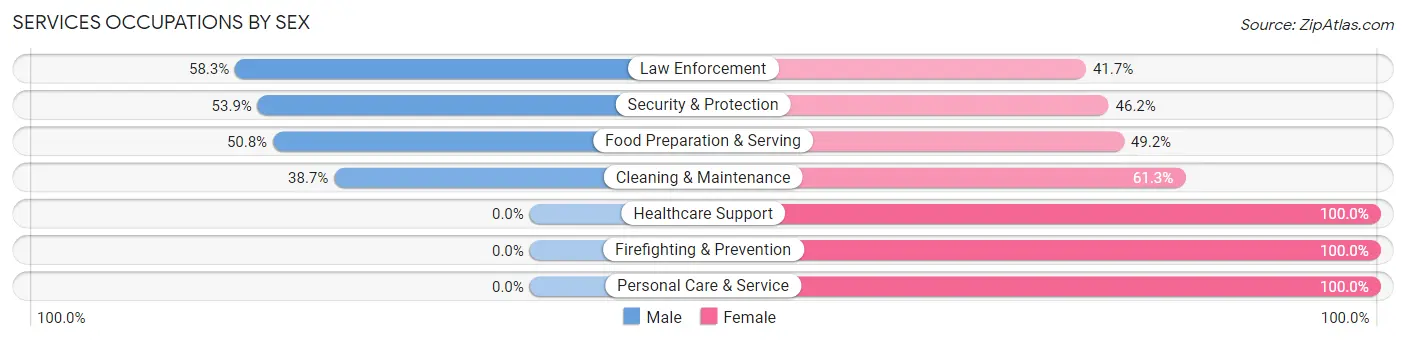
Services Occupations by Sex
Within the Services occupations in Chiefland, the most male-oriented occupations are Law Enforcement (58.3%), Security & Protection (53.8%), and Food Preparation & Serving (50.8%), while the most female-oriented occupations are Healthcare Support (100.0%), Firefighting & Prevention (100.0%), and Personal Care & Service (100.0%).
| Occupation | Male | Female |
| Healthcare Support | 0 (0.0%) | 41 (100.0%) |
| Security & Protection | 28 (53.8%) | 24 (46.2%) |
| Firefighting & Prevention | 0 (0.0%) | 4 (100.0%) |
| Law Enforcement | 28 (58.3%) | 20 (41.7%) |
| Food Preparation & Serving | 31 (50.8%) | 30 (49.2%) |
| Cleaning & Maintenance | 12 (38.7%) | 19 (61.3%) |
| Personal Care & Service | 0 (0.0%) | 7 (100.0%) |
| Total (Category) | 71 (37.0%) | 121 (63.0%) |
| Total (Overall) | 381 (52.8%) | 341 (47.2%) |
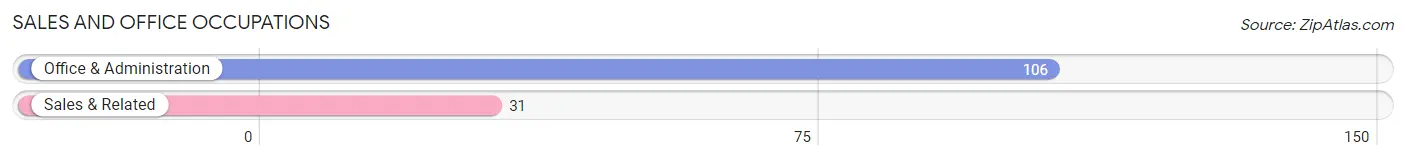
Sales and Office Occupations
The most common Sales and Office occupations in Chiefland are Office & Administration (106 | 14.7%), and Sales & Related (31 | 4.3%).
Sales and Office Occupations by Sex
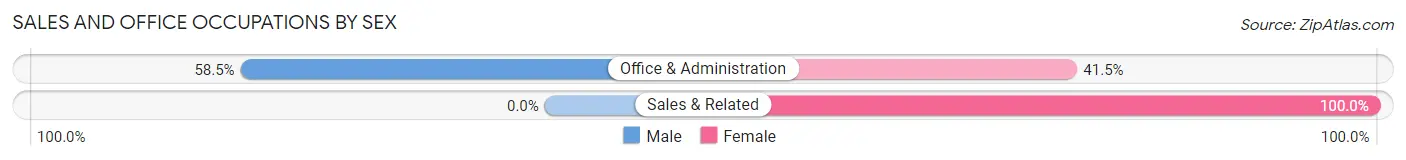
| Occupation | Male | Female |
| Sales & Related | 0 (0.0%) | 31 (100.0%) |
| Office & Administration | 62 (58.5%) | 44 (41.5%) |
| Total (Category) | 62 (45.3%) | 75 (54.7%) |
| Total (Overall) | 381 (52.8%) | 341 (47.2%) |
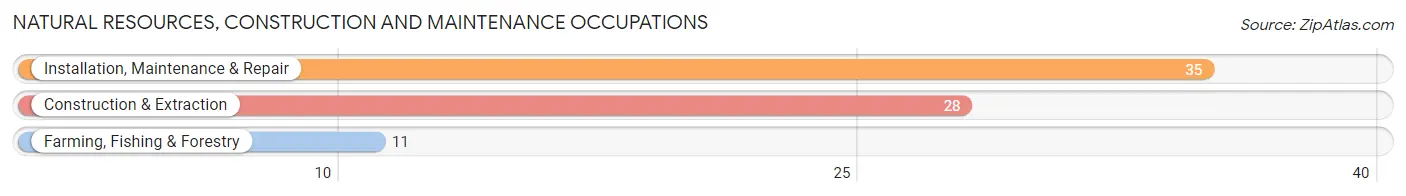
Natural Resources, Construction and Maintenance Occupations
The most common Natural Resources, Construction and Maintenance occupations in Chiefland are Installation, Maintenance & Repair (35 | 4.9%), Construction & Extraction (28 | 3.9%), and Farming, Fishing & Forestry (11 | 1.5%).
Natural Resources, Construction and Maintenance Occupations by Sex
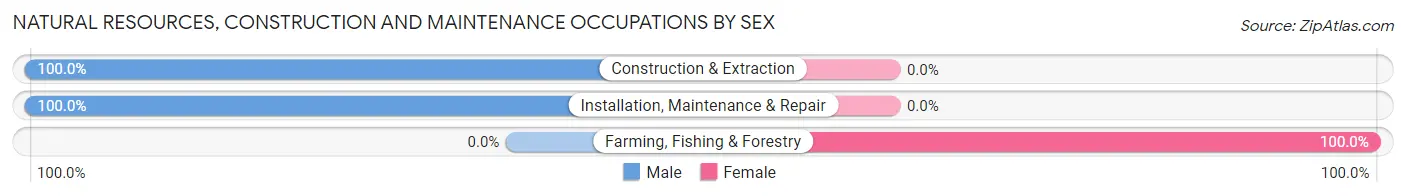
| Occupation | Male | Female |
| Farming, Fishing & Forestry | 0 (0.0%) | 11 (100.0%) |
| Construction & Extraction | 28 (100.0%) | 0 (0.0%) |
| Installation, Maintenance & Repair | 35 (100.0%) | 0 (0.0%) |
| Total (Category) | 63 (85.1%) | 11 (14.9%) |
| Total (Overall) | 381 (52.8%) | 341 (47.2%) |
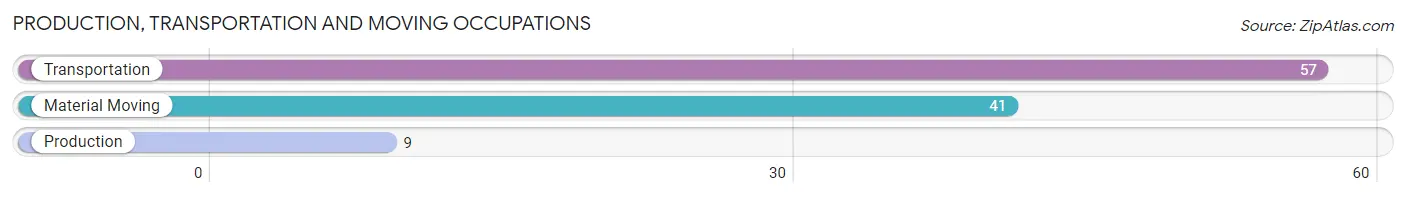
Production, Transportation and Moving Occupations
The most common Production, Transportation and Moving occupations in Chiefland are Transportation (57 | 7.9%), Material Moving (41 | 5.7%), and Production (9 | 1.3%).
Production, Transportation and Moving Occupations by Sex
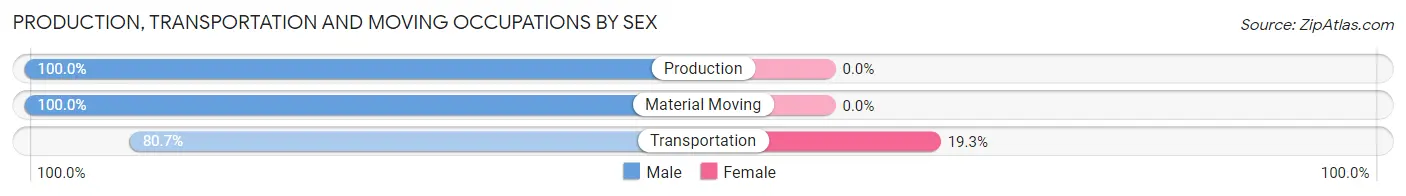
| Occupation | Male | Female |
| Production | 9 (100.0%) | 0 (0.0%) |
| Transportation | 46 (80.7%) | 11 (19.3%) |
| Material Moving | 41 (100.0%) | 0 (0.0%) |
| Total (Category) | 96 (89.7%) | 11 (10.3%) |
| Total (Overall) | 381 (52.8%) | 341 (47.2%) |
Employment Industries by Sex in Chiefland
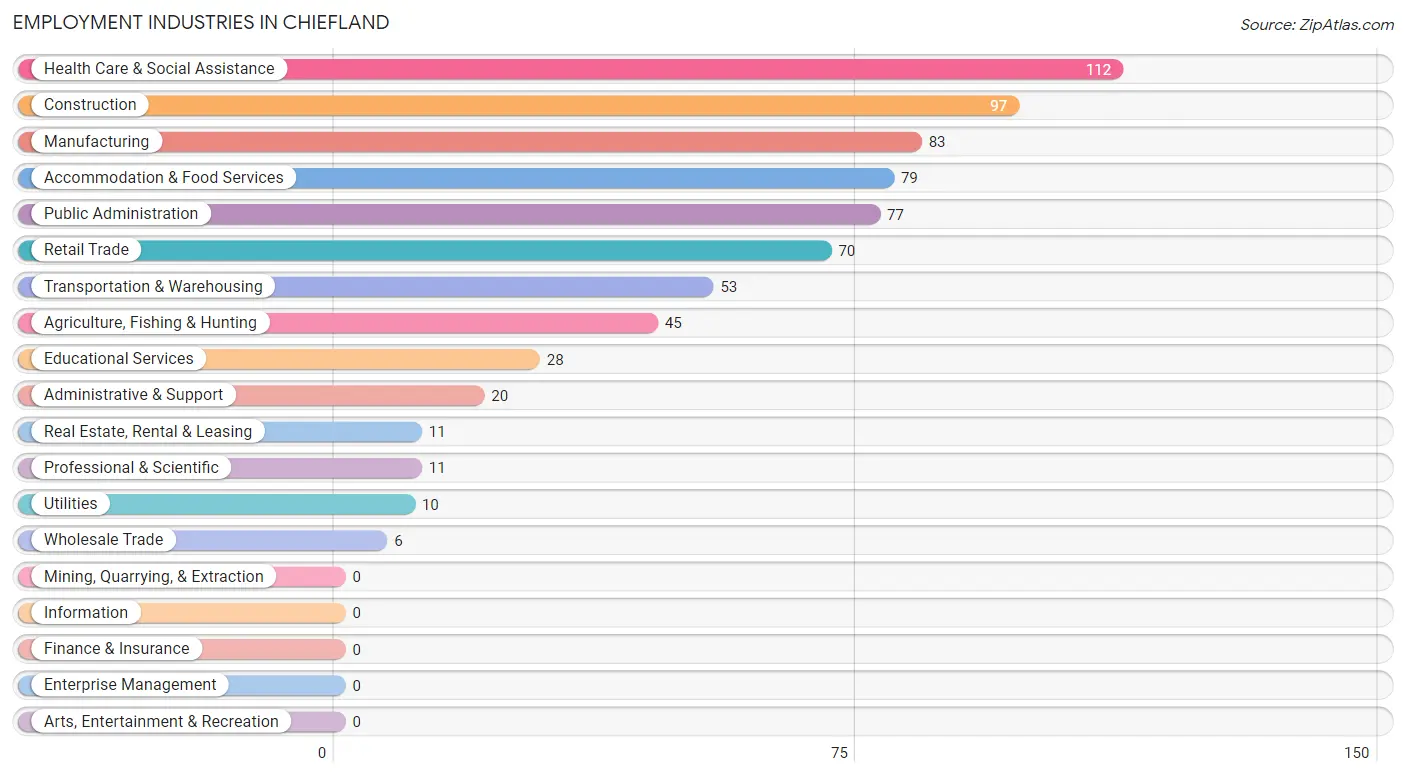
Employment Industries in Chiefland
The major employment industries in Chiefland include Health Care & Social Assistance (112 | 15.5%), Construction (97 | 13.4%), Manufacturing (83 | 11.5%), Accommodation & Food Services (79 | 10.9%), and Public Administration (77 | 10.7%).
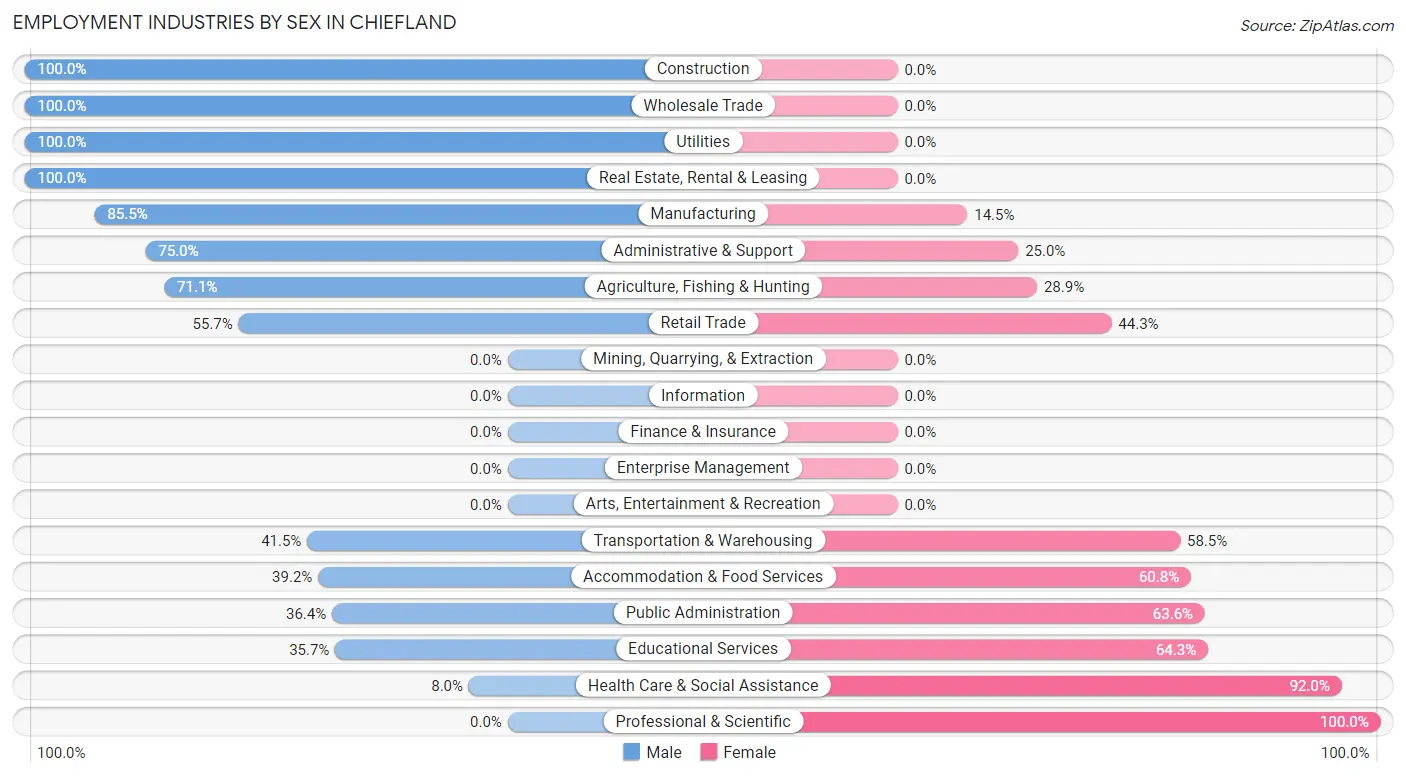
Employment Industries by Sex in Chiefland
The Chiefland industries that see more men than women are Construction (100.0%), Wholesale Trade (100.0%), and Utilities (100.0%), whereas the industries that tend to have a higher number of women are Professional & Scientific (100.0%), Health Care & Social Assistance (92.0%), and Educational Services (64.3%).
| Industry | Male | Female |
| Agriculture, Fishing & Hunting | 32 (71.1%) | 13 (28.9%) |
| Mining, Quarrying, & Extraction | 0 (0.0%) | 0 (0.0%) |
| Construction | 97 (100.0%) | 0 (0.0%) |
| Manufacturing | 71 (85.5%) | 12 (14.5%) |
| Wholesale Trade | 6 (100.0%) | 0 (0.0%) |
| Retail Trade | 39 (55.7%) | 31 (44.3%) |
| Transportation & Warehousing | 22 (41.5%) | 31 (58.5%) |
| Utilities | 10 (100.0%) | 0 (0.0%) |
| Information | 0 (0.0%) | 0 (0.0%) |
| Finance & Insurance | 0 (0.0%) | 0 (0.0%) |
| Real Estate, Rental & Leasing | 11 (100.0%) | 0 (0.0%) |
| Professional & Scientific | 0 (0.0%) | 11 (100.0%) |
| Enterprise Management | 0 (0.0%) | 0 (0.0%) |
| Administrative & Support | 15 (75.0%) | 5 (25.0%) |
| Educational Services | 10 (35.7%) | 18 (64.3%) |
| Health Care & Social Assistance | 9 (8.0%) | 103 (92.0%) |
| Arts, Entertainment & Recreation | 0 (0.0%) | 0 (0.0%) |
| Accommodation & Food Services | 31 (39.2%) | 48 (60.8%) |
| Public Administration | 28 (36.4%) | 49 (63.6%) |
| Total | 381 (52.8%) | 341 (47.2%) |
Education in Chiefland
School Enrollment in Chiefland
The most common levels of schooling among the 530 students in Chiefland are middle school (185 | 34.9%), high school (125 | 23.6%), and elementary school (77 | 14.5%).
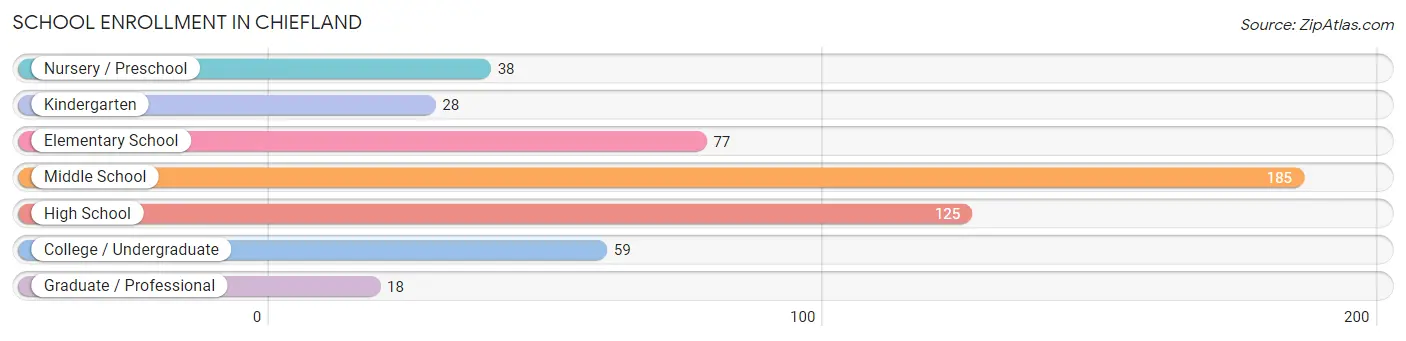
| School Level | # Students | % Students |
| Nursery / Preschool | 38 | 7.2% |
| Kindergarten | 28 | 5.3% |
| Elementary School | 77 | 14.5% |
| Middle School | 185 | 34.9% |
| High School | 125 | 23.6% |
| College / Undergraduate | 59 | 11.1% |
| Graduate / Professional | 18 | 3.4% |
| Total | 530 | 100.0% |
School Enrollment by Age by Funding Source in Chiefland
Out of a total of 530 students who are enrolled in schools in Chiefland, 43 (8.1%) attend a private institution, while the remaining 487 (91.9%) are enrolled in public schools. The age group of 5 to 9 year old has the highest likelihood of being enrolled in private schools, with 14 (14.4% in the age bracket) enrolled. Conversely, the age group of 18 to 19 year olds has the lowest likelihood of being enrolled in a private school, with 21 (100.0% in the age bracket) attending a public institution.
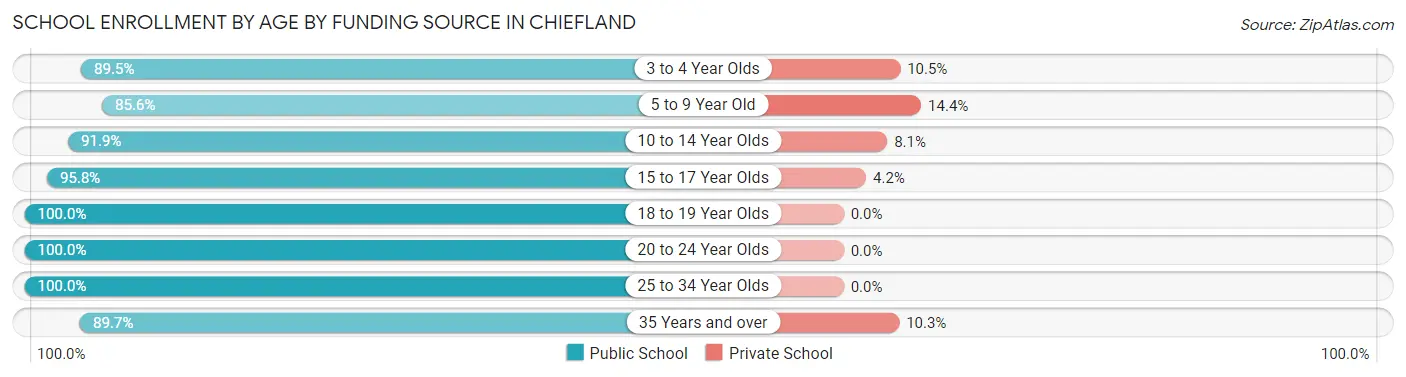
| Age Bracket | Public School | Private School |
| 3 to 4 Year Olds | 34 (89.5%) | 4 (10.5%) |
| 5 to 9 Year Old | 83 (85.6%) | 14 (14.4%) |
| 10 to 14 Year Olds | 204 (91.9%) | 18 (8.1%) |
| 15 to 17 Year Olds | 92 (95.8%) | 4 (4.2%) |
| 18 to 19 Year Olds | 21 (100.0%) | 0 (0.0%) |
| 20 to 24 Year Olds | 17 (100.0%) | 0 (0.0%) |
| 25 to 34 Year Olds | 10 (100.0%) | 0 (0.0%) |
| 35 Years and over | 26 (89.7%) | 3 (10.3%) |
| Total | 487 (91.9%) | 43 (8.1%) |
Educational Attainment by Field of Study in Chiefland
Social sciences (46 | 31.1%), science & technology (28 | 18.9%), psychology (20 | 13.5%), business (18 | 12.2%), and education (18 | 12.2%) are the most common fields of study among 148 individuals in Chiefland who have obtained a bachelor's degree or higher.
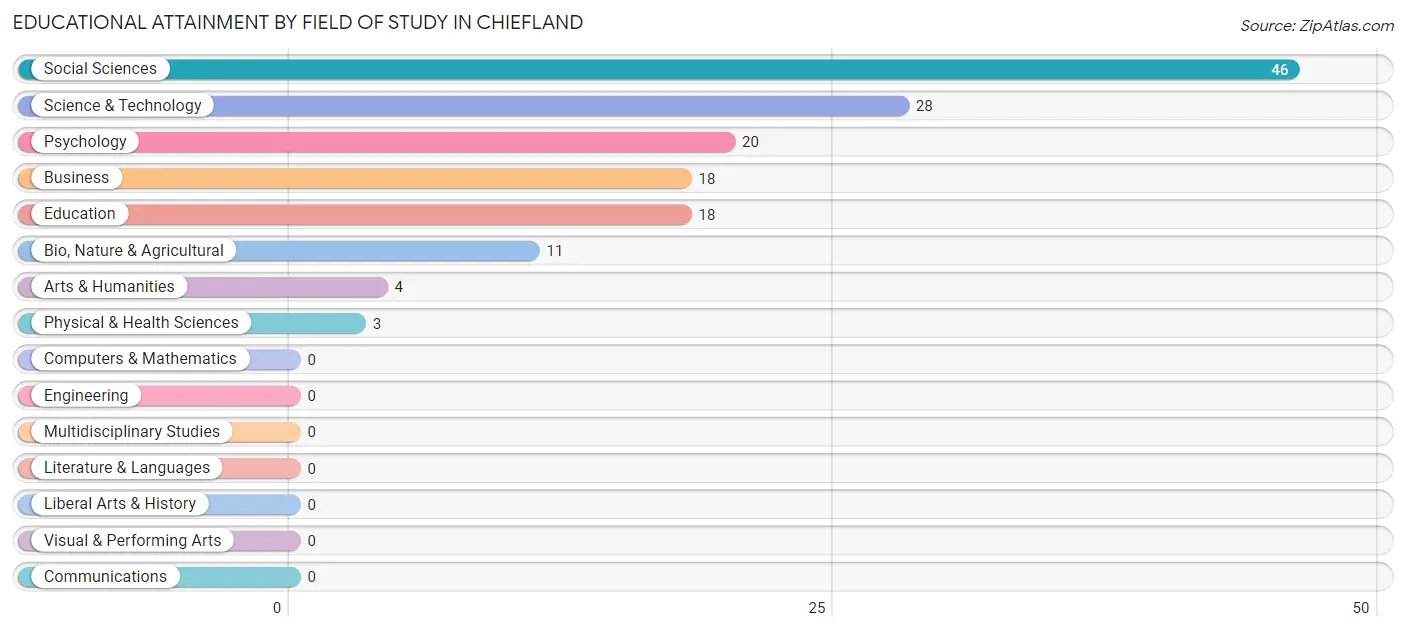
| Field of Study | # Graduates | % Graduates |
| Computers & Mathematics | 0 | 0.0% |
| Bio, Nature & Agricultural | 11 | 7.4% |
| Physical & Health Sciences | 3 | 2.0% |
| Psychology | 20 | 13.5% |
| Social Sciences | 46 | 31.1% |
| Engineering | 0 | 0.0% |
| Multidisciplinary Studies | 0 | 0.0% |
| Science & Technology | 28 | 18.9% |
| Business | 18 | 12.2% |
| Education | 18 | 12.2% |
| Literature & Languages | 0 | 0.0% |
| Liberal Arts & History | 0 | 0.0% |
| Visual & Performing Arts | 0 | 0.0% |
| Communications | 0 | 0.0% |
| Arts & Humanities | 4 | 2.7% |
| Total | 148 | 100.0% |
Transportation & Commute in Chiefland
Vehicle Availability by Sex in Chiefland
The most prevalent vehicle ownership categories in Chiefland are males with 2 vehicles (177, accounting for 47.6%) and females with 2 vehicles (96, making up 53.8%).
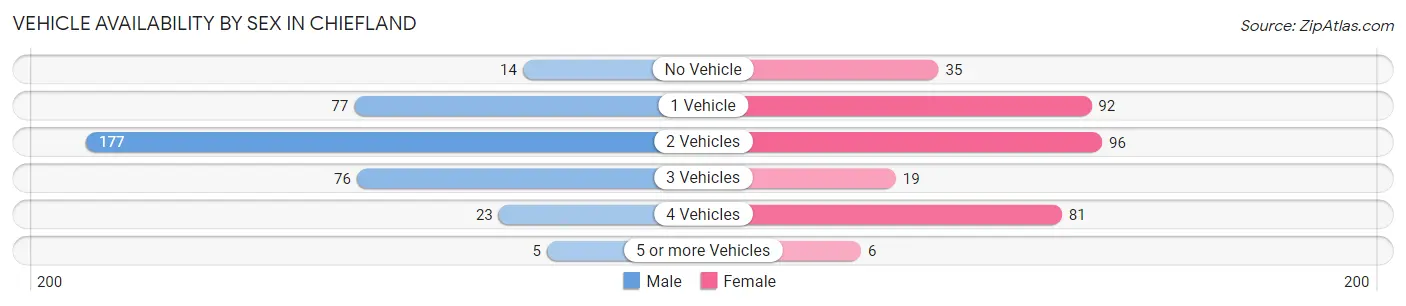
| Vehicles Available | Male | Female |
| No Vehicle | 14 (3.8%) | 35 (10.6%) |
| 1 Vehicle | 77 (20.7%) | 92 (28.0%) |
| 2 Vehicles | 177 (47.6%) | 96 (29.2%) |
| 3 Vehicles | 76 (20.4%) | 19 (5.8%) |
| 4 Vehicles | 23 (6.2%) | 81 (24.6%) |
| 5 or more Vehicles | 5 (1.3%) | 6 (1.8%) |
| Total | 372 (100.0%) | 329 (100.0%) |
Commute Time in Chiefland
The most frequently occuring commute durations in Chiefland are 10 to 14 minutes (122 commuters, 19.4%), 5 to 9 minutes (112 commuters, 17.8%), and 60 to 89 minutes (78 commuters, 12.4%).
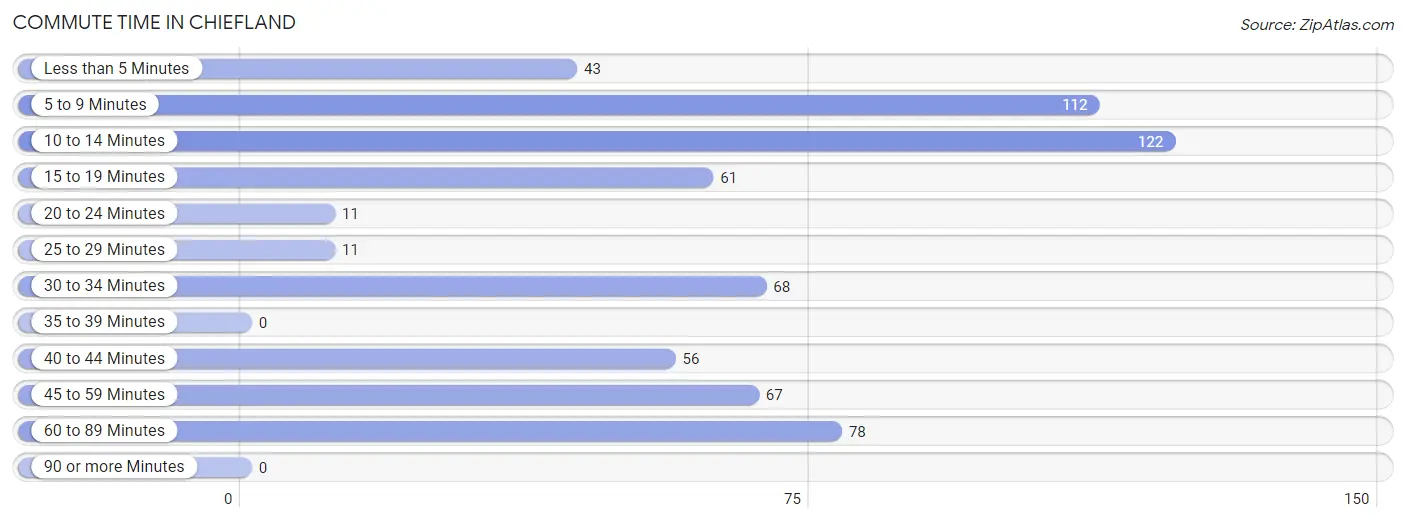
| Commute Time | # Commuters | % Commuters |
| Less than 5 Minutes | 43 | 6.8% |
| 5 to 9 Minutes | 112 | 17.8% |
| 10 to 14 Minutes | 122 | 19.4% |
| 15 to 19 Minutes | 61 | 9.7% |
| 20 to 24 Minutes | 11 | 1.8% |
| 25 to 29 Minutes | 11 | 1.8% |
| 30 to 34 Minutes | 68 | 10.8% |
| 35 to 39 Minutes | 0 | 0.0% |
| 40 to 44 Minutes | 56 | 8.9% |
| 45 to 59 Minutes | 67 | 10.6% |
| 60 to 89 Minutes | 78 | 12.4% |
| 90 or more Minutes | 0 | 0.0% |
Commute Time by Sex in Chiefland
The most common commute times in Chiefland are 5 to 9 minutes (70 commuters, 21.5%) for males and 10 to 14 minutes (62 commuters, 20.4%) for females.
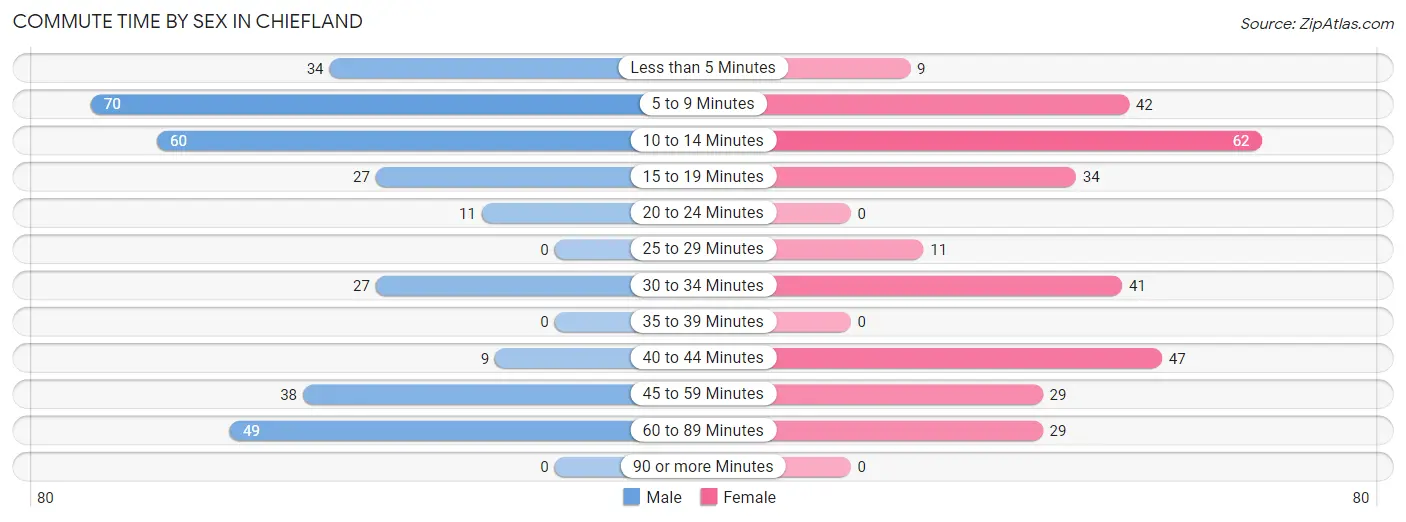
| Commute Time | Male | Female |
| Less than 5 Minutes | 34 (10.5%) | 9 (3.0%) |
| 5 to 9 Minutes | 70 (21.5%) | 42 (13.8%) |
| 10 to 14 Minutes | 60 (18.5%) | 62 (20.4%) |
| 15 to 19 Minutes | 27 (8.3%) | 34 (11.2%) |
| 20 to 24 Minutes | 11 (3.4%) | 0 (0.0%) |
| 25 to 29 Minutes | 0 (0.0%) | 11 (3.6%) |
| 30 to 34 Minutes | 27 (8.3%) | 41 (13.5%) |
| 35 to 39 Minutes | 0 (0.0%) | 0 (0.0%) |
| 40 to 44 Minutes | 9 (2.8%) | 47 (15.5%) |
| 45 to 59 Minutes | 38 (11.7%) | 29 (9.5%) |
| 60 to 89 Minutes | 49 (15.1%) | 29 (9.5%) |
| 90 or more Minutes | 0 (0.0%) | 0 (0.0%) |
Time of Departure to Work by Sex in Chiefland
The most frequent times of departure to work in Chiefland are 6:30 AM to 6:59 AM (59, 18.1%) for males and 5:30 AM to 5:59 AM (60, 19.7%) for females.
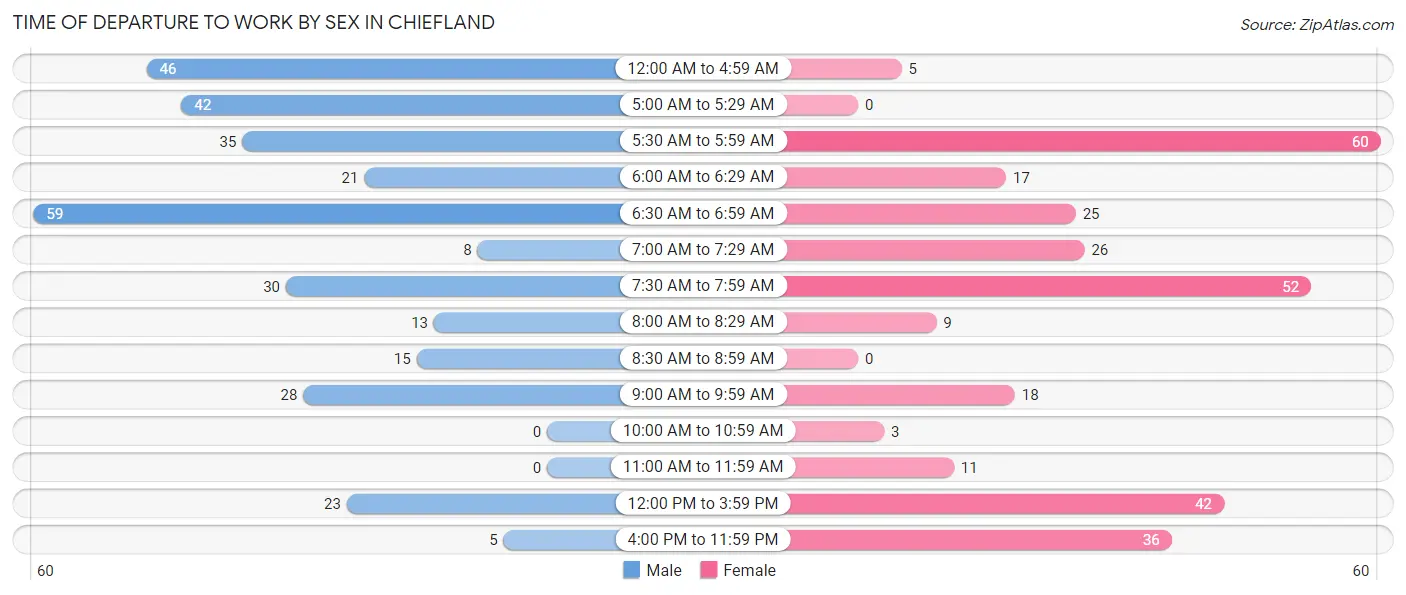
| Time of Departure | Male | Female |
| 12:00 AM to 4:59 AM | 46 (14.1%) | 5 (1.6%) |
| 5:00 AM to 5:29 AM | 42 (12.9%) | 0 (0.0%) |
| 5:30 AM to 5:59 AM | 35 (10.8%) | 60 (19.7%) |
| 6:00 AM to 6:29 AM | 21 (6.5%) | 17 (5.6%) |
| 6:30 AM to 6:59 AM | 59 (18.1%) | 25 (8.2%) |
| 7:00 AM to 7:29 AM | 8 (2.5%) | 26 (8.6%) |
| 7:30 AM to 7:59 AM | 30 (9.2%) | 52 (17.1%) |
| 8:00 AM to 8:29 AM | 13 (4.0%) | 9 (3.0%) |
| 8:30 AM to 8:59 AM | 15 (4.6%) | 0 (0.0%) |
| 9:00 AM to 9:59 AM | 28 (8.6%) | 18 (5.9%) |
| 10:00 AM to 10:59 AM | 0 (0.0%) | 3 (1.0%) |
| 11:00 AM to 11:59 AM | 0 (0.0%) | 11 (3.6%) |
| 12:00 PM to 3:59 PM | 23 (7.1%) | 42 (13.8%) |
| 4:00 PM to 11:59 PM | 5 (1.5%) | 36 (11.8%) |
| Total | 325 (100.0%) | 304 (100.0%) |
Housing Occupancy in Chiefland
Occupancy by Ownership in Chiefland
Of the total 811 dwellings in Chiefland, owner-occupied units account for 347 (42.8%), while renter-occupied units make up 464 (57.2%).
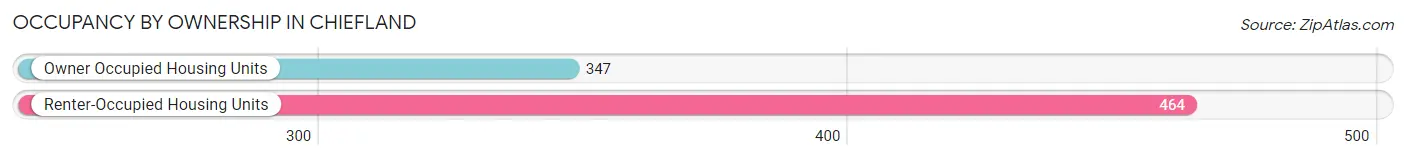
| Occupancy | # Housing Units | % Housing Units |
| Owner Occupied Housing Units | 347 | 42.8% |
| Renter-Occupied Housing Units | 464 | 57.2% |
| Total Occupied Housing Units | 811 | 100.0% |
Occupancy by Household Size in Chiefland
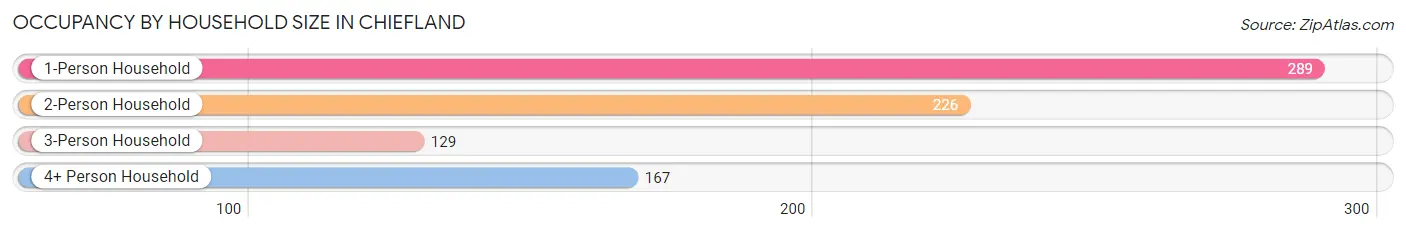
| Household Size | # Housing Units | % Housing Units |
| 1-Person Household | 289 | 35.6% |
| 2-Person Household | 226 | 27.9% |
| 3-Person Household | 129 | 15.9% |
| 4+ Person Household | 167 | 20.6% |
| Total Housing Units | 811 | 100.0% |
Occupancy by Ownership by Household Size in Chiefland
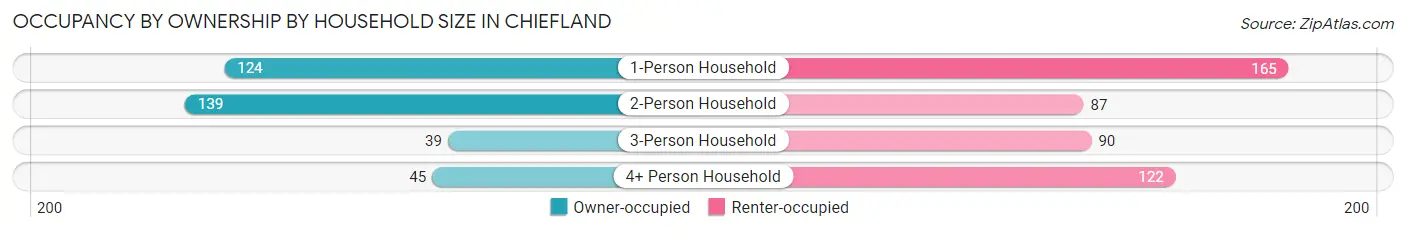
| Household Size | Owner-occupied | Renter-occupied |
| 1-Person Household | 124 (42.9%) | 165 (57.1%) |
| 2-Person Household | 139 (61.5%) | 87 (38.5%) |
| 3-Person Household | 39 (30.2%) | 90 (69.8%) |
| 4+ Person Household | 45 (27.0%) | 122 (73.1%) |
| Total Housing Units | 347 (42.8%) | 464 (57.2%) |
Occupancy by Educational Attainment in Chiefland
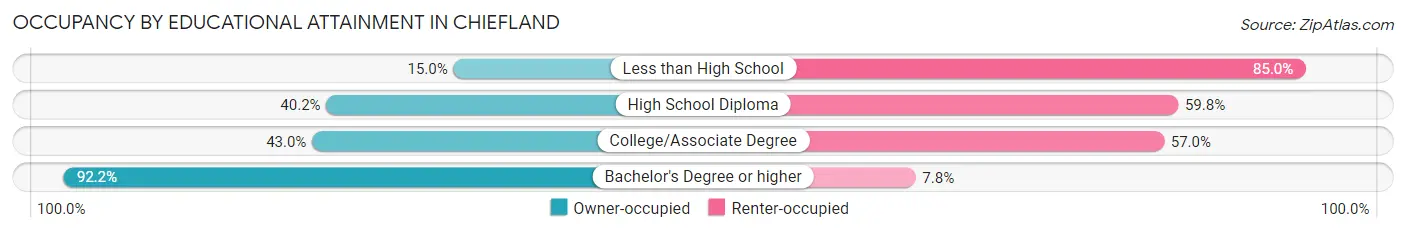
| Household Size | Owner-occupied | Renter-occupied |
| Less than High School | 19 (15.0%) | 108 (85.0%) |
| High School Diploma | 147 (40.2%) | 219 (59.8%) |
| College/Associate Degree | 98 (43.0%) | 130 (57.0%) |
| Bachelor's Degree or higher | 83 (92.2%) | 7 (7.8%) |
Occupancy by Age of Householder in Chiefland
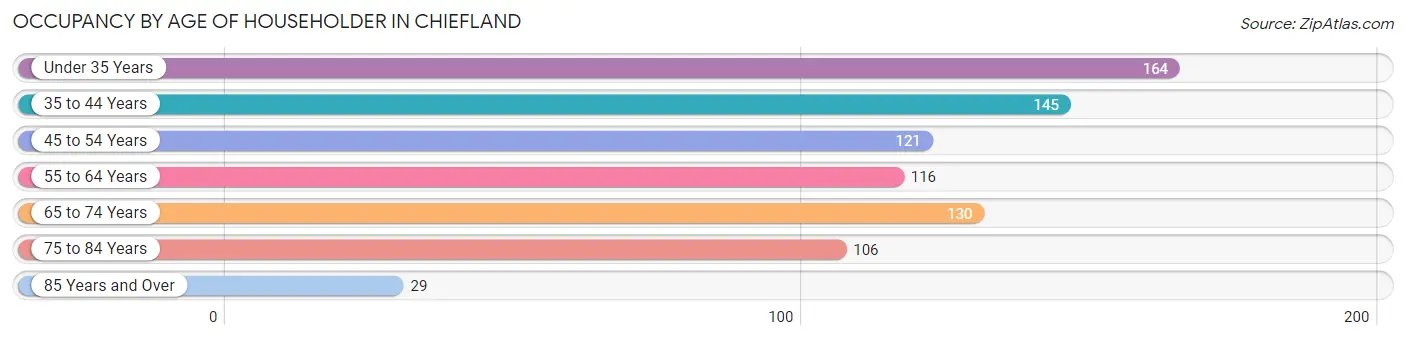
| Age Bracket | # Households | % Households |
| Under 35 Years | 164 | 20.2% |
| 35 to 44 Years | 145 | 17.9% |
| 45 to 54 Years | 121 | 14.9% |
| 55 to 64 Years | 116 | 14.3% |
| 65 to 74 Years | 130 | 16.0% |
| 75 to 84 Years | 106 | 13.1% |
| 85 Years and Over | 29 | 3.6% |
| Total | 811 | 100.0% |
Housing Finances in Chiefland
Median Income by Occupancy in Chiefland
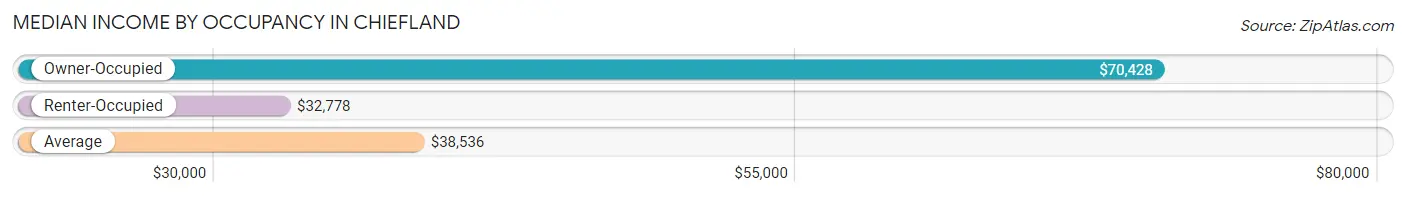
| Occupancy Type | # Households | Median Income |
| Owner-Occupied | 347 (42.8%) | $70,428 |
| Renter-Occupied | 464 (57.2%) | $32,778 |
| Average | 811 (100.0%) | $38,536 |
Occupancy by Householder Income Bracket in Chiefland
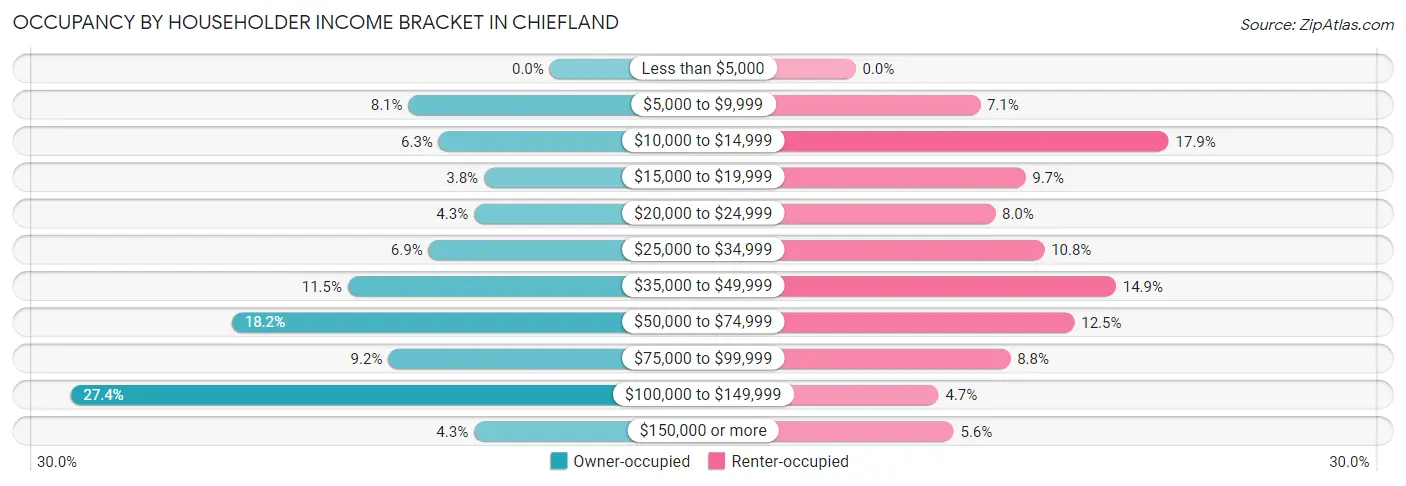
| Income Bracket | Owner-occupied | Renter-occupied |
| Less than $5,000 | 0 (0.0%) | 0 (0.0%) |
| $5,000 to $9,999 | 28 (8.1%) | 33 (7.1%) |
| $10,000 to $14,999 | 22 (6.3%) | 83 (17.9%) |
| $15,000 to $19,999 | 13 (3.7%) | 45 (9.7%) |
| $20,000 to $24,999 | 15 (4.3%) | 37 (8.0%) |
| $25,000 to $34,999 | 24 (6.9%) | 50 (10.8%) |
| $35,000 to $49,999 | 40 (11.5%) | 69 (14.9%) |
| $50,000 to $74,999 | 63 (18.2%) | 58 (12.5%) |
| $75,000 to $99,999 | 32 (9.2%) | 41 (8.8%) |
| $100,000 to $149,999 | 95 (27.4%) | 22 (4.7%) |
| $150,000 or more | 15 (4.3%) | 26 (5.6%) |
| Total | 347 (100.0%) | 464 (100.0%) |
Monthly Housing Cost Tiers in Chiefland
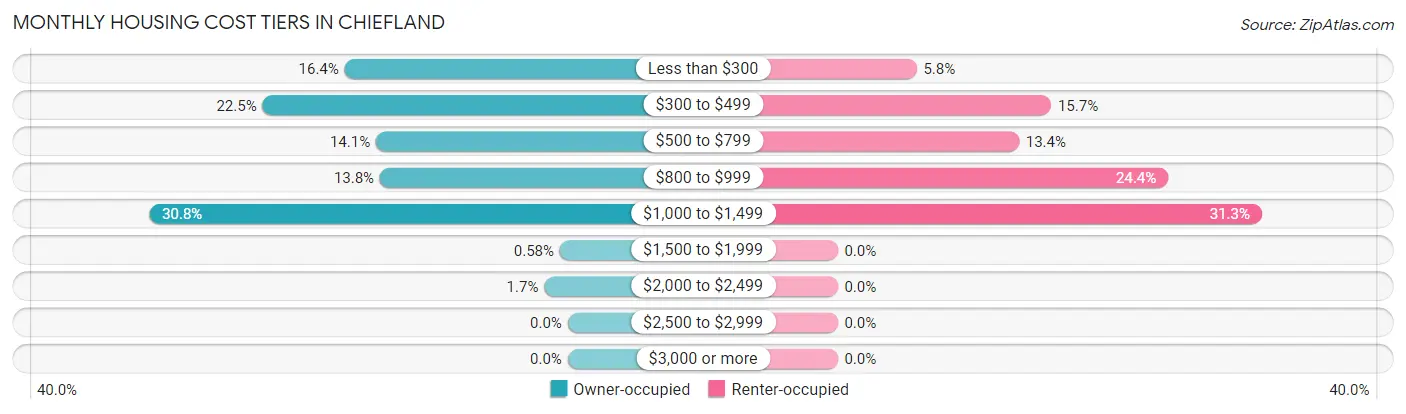
| Monthly Cost | Owner-occupied | Renter-occupied |
| Less than $300 | 57 (16.4%) | 27 (5.8%) |
| $300 to $499 | 78 (22.5%) | 73 (15.7%) |
| $500 to $799 | 49 (14.1%) | 62 (13.4%) |
| $800 to $999 | 48 (13.8%) | 113 (24.3%) |
| $1,000 to $1,499 | 107 (30.8%) | 145 (31.2%) |
| $1,500 to $1,999 | 2 (0.6%) | 0 (0.0%) |
| $2,000 to $2,499 | 6 (1.7%) | 0 (0.0%) |
| $2,500 to $2,999 | 0 (0.0%) | 0 (0.0%) |
| $3,000 or more | 0 (0.0%) | 0 (0.0%) |
| Total | 347 (100.0%) | 464 (100.0%) |
Physical Housing Characteristics in Chiefland
Housing Structures in Chiefland
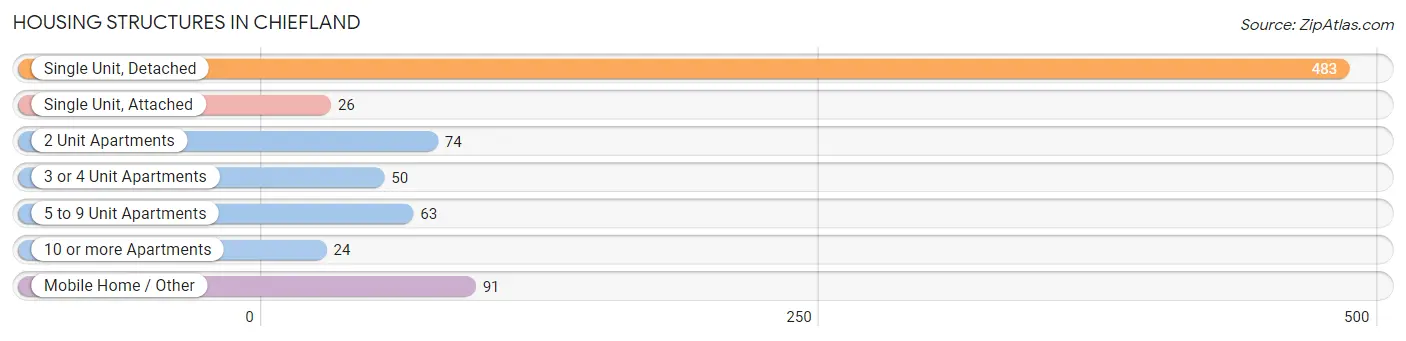
| Structure Type | # Housing Units | % Housing Units |
| Single Unit, Detached | 483 | 59.6% |
| Single Unit, Attached | 26 | 3.2% |
| 2 Unit Apartments | 74 | 9.1% |
| 3 or 4 Unit Apartments | 50 | 6.2% |
| 5 to 9 Unit Apartments | 63 | 7.8% |
| 10 or more Apartments | 24 | 3.0% |
| Mobile Home / Other | 91 | 11.2% |
| Total | 811 | 100.0% |
Housing Structures by Occupancy in Chiefland
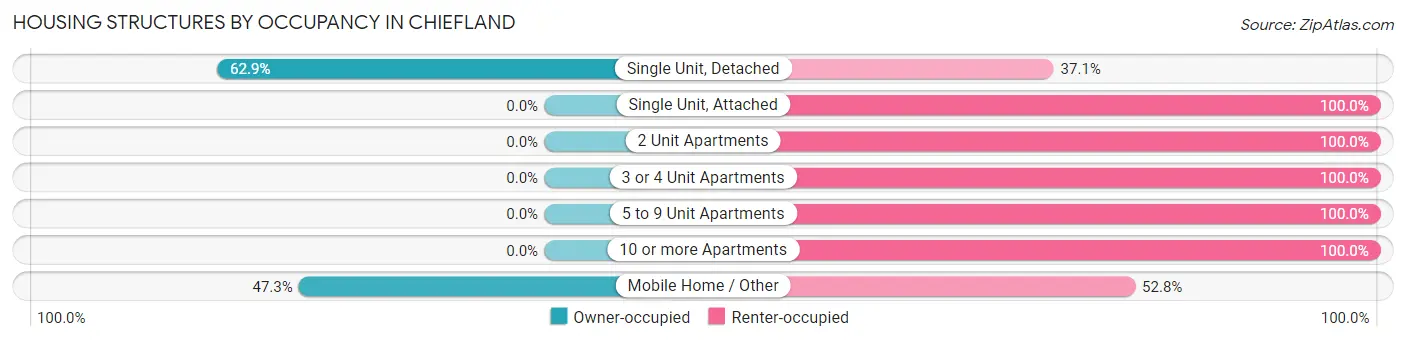
| Structure Type | Owner-occupied | Renter-occupied |
| Single Unit, Detached | 304 (62.9%) | 179 (37.1%) |
| Single Unit, Attached | 0 (0.0%) | 26 (100.0%) |
| 2 Unit Apartments | 0 (0.0%) | 74 (100.0%) |
| 3 or 4 Unit Apartments | 0 (0.0%) | 50 (100.0%) |
| 5 to 9 Unit Apartments | 0 (0.0%) | 63 (100.0%) |
| 10 or more Apartments | 0 (0.0%) | 24 (100.0%) |
| Mobile Home / Other | 43 (47.2%) | 48 (52.7%) |
| Total | 347 (42.8%) | 464 (57.2%) |
Housing Structures by Number of Rooms in Chiefland
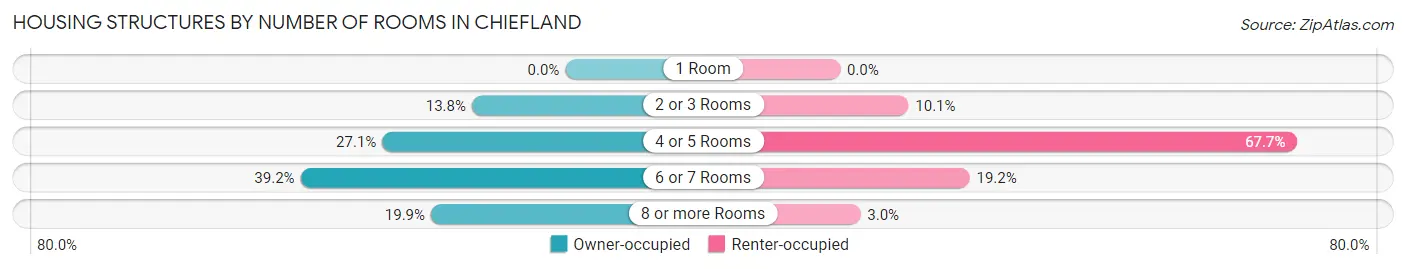
| Number of Rooms | Owner-occupied | Renter-occupied |
| 1 Room | 0 (0.0%) | 0 (0.0%) |
| 2 or 3 Rooms | 48 (13.8%) | 47 (10.1%) |
| 4 or 5 Rooms | 94 (27.1%) | 314 (67.7%) |
| 6 or 7 Rooms | 136 (39.2%) | 89 (19.2%) |
| 8 or more Rooms | 69 (19.9%) | 14 (3.0%) |
| Total | 347 (100.0%) | 464 (100.0%) |
Housing Structure by Heating Type in Chiefland
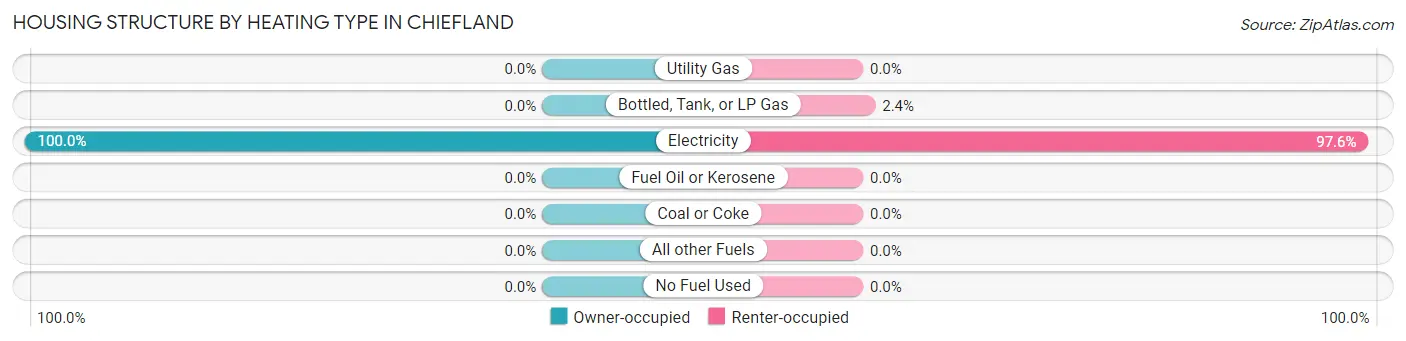
| Heating Type | Owner-occupied | Renter-occupied |
| Utility Gas | 0 (0.0%) | 0 (0.0%) |
| Bottled, Tank, or LP Gas | 0 (0.0%) | 11 (2.4%) |
| Electricity | 347 (100.0%) | 453 (97.6%) |
| Fuel Oil or Kerosene | 0 (0.0%) | 0 (0.0%) |
| Coal or Coke | 0 (0.0%) | 0 (0.0%) |
| All other Fuels | 0 (0.0%) | 0 (0.0%) |
| No Fuel Used | 0 (0.0%) | 0 (0.0%) |
| Total | 347 (100.0%) | 464 (100.0%) |
Household Vehicle Usage in Chiefland
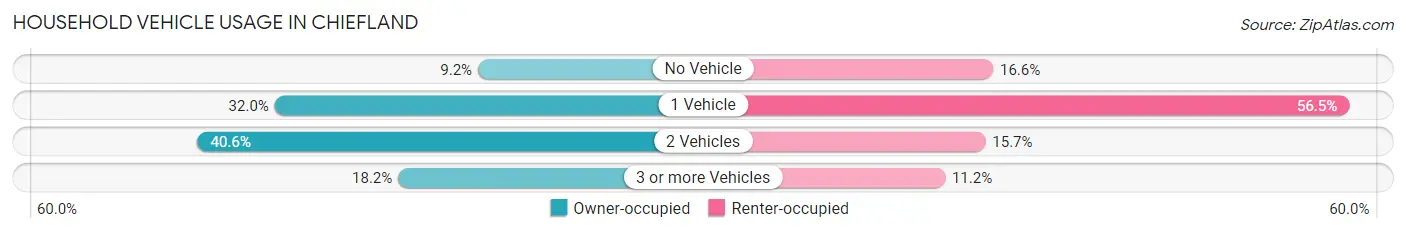
| Vehicles per Household | Owner-occupied | Renter-occupied |
| No Vehicle | 32 (9.2%) | 77 (16.6%) |
| 1 Vehicle | 111 (32.0%) | 262 (56.5%) |
| 2 Vehicles | 141 (40.6%) | 73 (15.7%) |
| 3 or more Vehicles | 63 (18.2%) | 52 (11.2%) |
| Total | 347 (100.0%) | 464 (100.0%) |
Real Estate & Mortgages in Chiefland
Real Estate and Mortgage Overview in Chiefland
| Characteristic | Without Mortgage | With Mortgage |
| Housing Units | 187 | 160 |
| Median Property Value | $157,500 | $130,200 |
| Median Household Income | - | - |
| Monthly Housing Costs | $331 | $0 |
| Real Estate Taxes | $868 | $0 |
Property Value by Mortgage Status in Chiefland
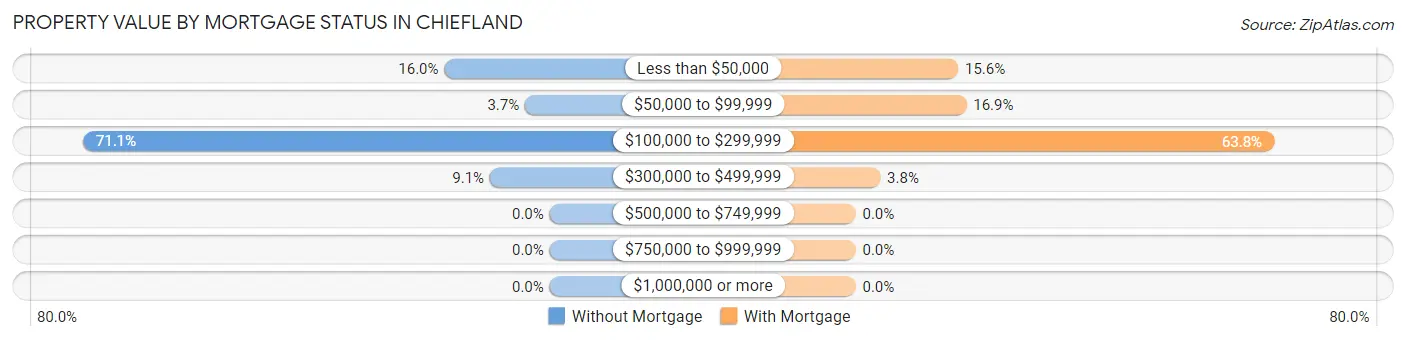
| Property Value | Without Mortgage | With Mortgage |
| Less than $50,000 | 30 (16.0%) | 25 (15.6%) |
| $50,000 to $99,999 | 7 (3.7%) | 27 (16.9%) |
| $100,000 to $299,999 | 133 (71.1%) | 102 (63.7%) |
| $300,000 to $499,999 | 17 (9.1%) | 6 (3.7%) |
| $500,000 to $749,999 | 0 (0.0%) | 0 (0.0%) |
| $750,000 to $999,999 | 0 (0.0%) | 0 (0.0%) |
| $1,000,000 or more | 0 (0.0%) | 0 (0.0%) |
| Total | 187 (100.0%) | 160 (100.0%) |
Household Income by Mortgage Status in Chiefland
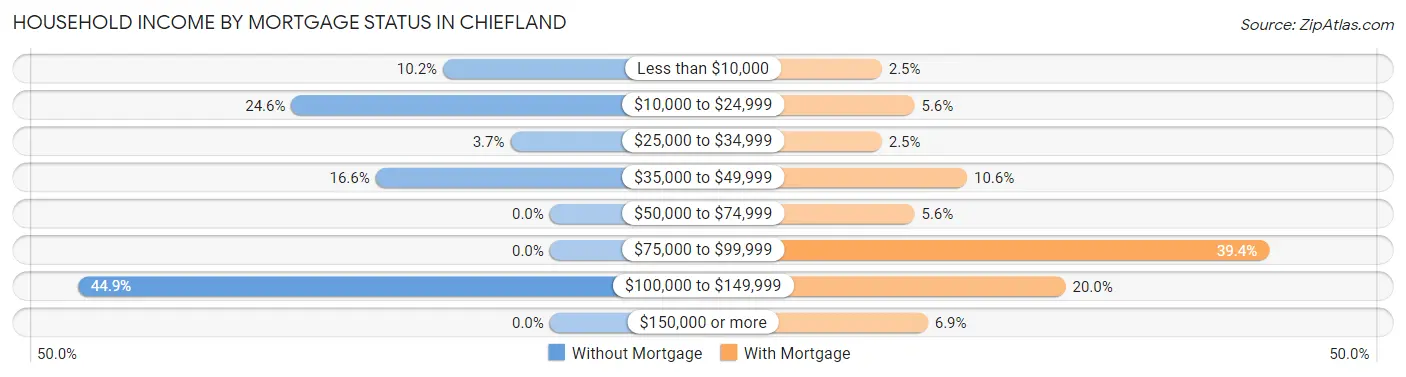
| Household Income | Without Mortgage | With Mortgage |
| Less than $10,000 | 19 (10.2%) | 4 (2.5%) |
| $10,000 to $24,999 | 46 (24.6%) | 9 (5.6%) |
| $25,000 to $34,999 | 7 (3.7%) | 4 (2.5%) |
| $35,000 to $49,999 | 31 (16.6%) | 17 (10.6%) |
| $50,000 to $74,999 | 0 (0.0%) | 9 (5.6%) |
| $75,000 to $99,999 | 0 (0.0%) | 63 (39.4%) |
| $100,000 to $149,999 | 84 (44.9%) | 32 (20.0%) |
| $150,000 or more | 0 (0.0%) | 11 (6.9%) |
| Total | 187 (100.0%) | 160 (100.0%) |
Property Value to Household Income Ratio in Chiefland
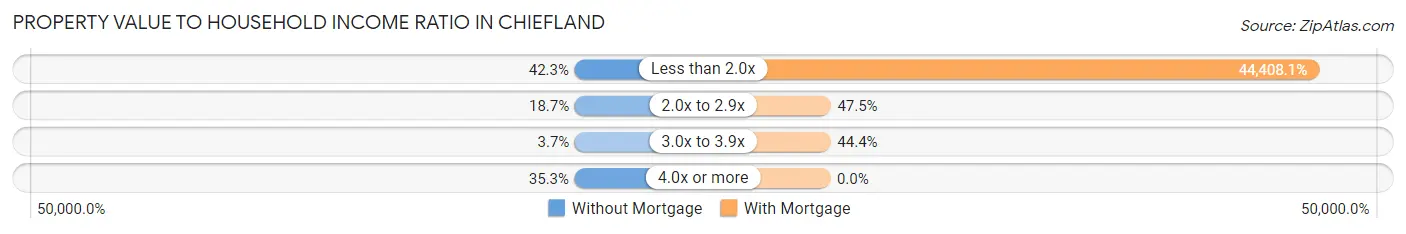
| Value-to-Income Ratio | Without Mortgage | With Mortgage |
| Less than 2.0x | 79 (42.2%) | 71,053 (44,408.1%) |
| 2.0x to 2.9x | 35 (18.7%) | 76 (47.5%) |
| 3.0x to 3.9x | 7 (3.7%) | 71 (44.4%) |
| 4.0x or more | 66 (35.3%) | 0 (0.0%) |
| Total | 187 (100.0%) | 160 (100.0%) |
Real Estate Taxes by Mortgage Status in Chiefland
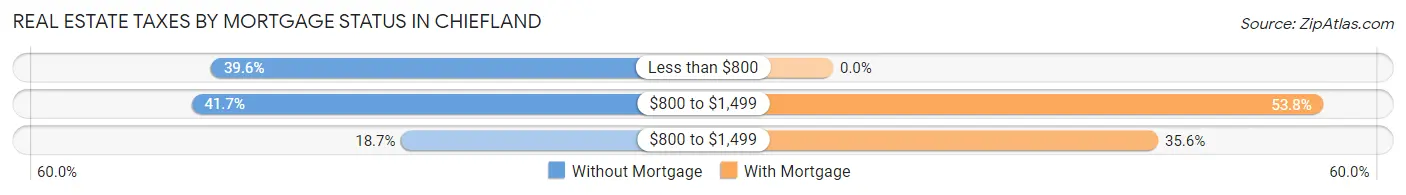
| Property Taxes | Without Mortgage | With Mortgage |
| Less than $800 | 74 (39.6%) | 0 (0.0%) |
| $800 to $1,499 | 78 (41.7%) | 86 (53.7%) |
| $800 to $1,499 | 35 (18.7%) | 57 (35.6%) |
| Total | 187 (100.0%) | 160 (100.0%) |
Health & Disability in Chiefland
Health Insurance Coverage by Age in Chiefland
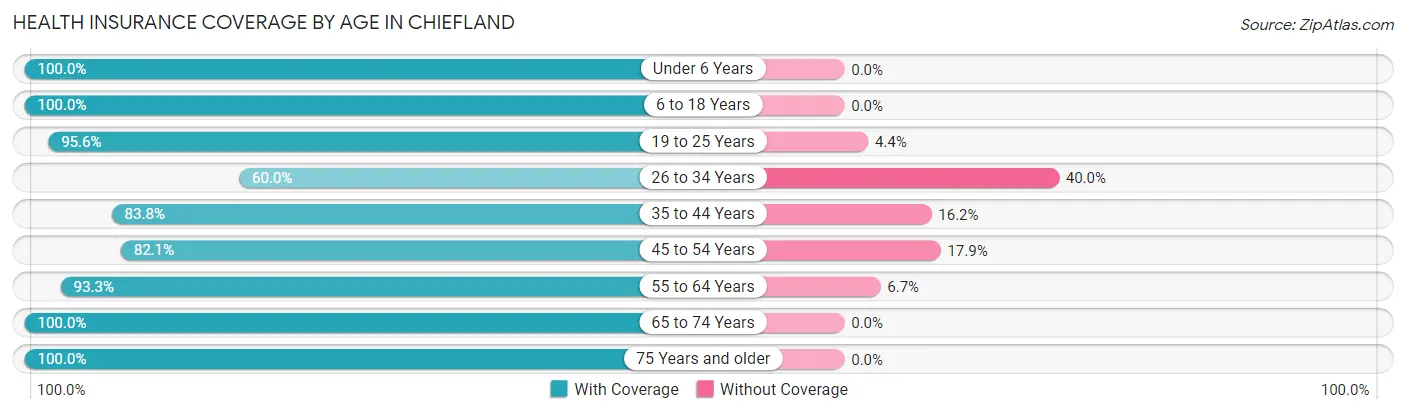
| Age Bracket | With Coverage | Without Coverage |
| Under 6 Years | 136 (100.0%) | 0 (0.0%) |
| 6 to 18 Years | 427 (100.0%) | 0 (0.0%) |
| 19 to 25 Years | 130 (95.6%) | 6 (4.4%) |
| 26 to 34 Years | 162 (60.0%) | 108 (40.0%) |
| 35 to 44 Years | 196 (83.8%) | 38 (16.2%) |
| 45 to 54 Years | 183 (82.1%) | 40 (17.9%) |
| 55 to 64 Years | 208 (93.3%) | 15 (6.7%) |
| 65 to 74 Years | 213 (100.0%) | 0 (0.0%) |
| 75 Years and older | 140 (100.0%) | 0 (0.0%) |
| Total | 1,795 (89.7%) | 207 (10.3%) |
Health Insurance Coverage by Citizenship Status in Chiefland
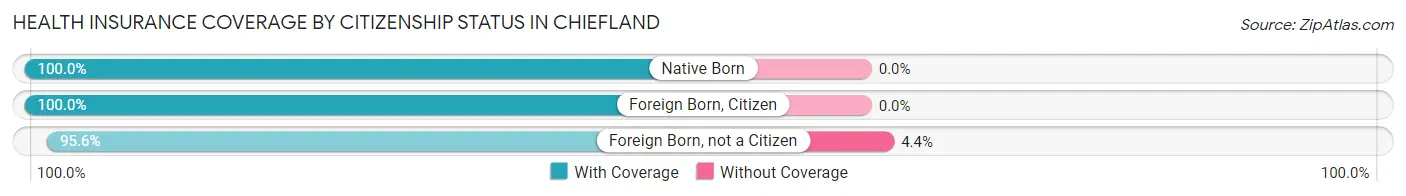
| Citizenship Status | With Coverage | Without Coverage |
| Native Born | 136 (100.0%) | 0 (0.0%) |
| Foreign Born, Citizen | 427 (100.0%) | 0 (0.0%) |
| Foreign Born, not a Citizen | 130 (95.6%) | 6 (4.4%) |
Health Insurance Coverage by Household Income in Chiefland
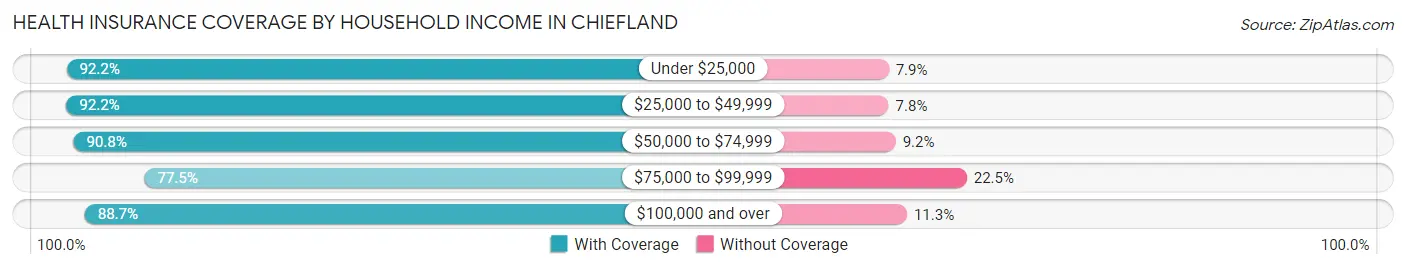
| Household Income | With Coverage | Without Coverage |
| Under $25,000 | 399 (92.1%) | 34 (7.9%) |
| $25,000 to $49,999 | 576 (92.2%) | 49 (7.8%) |
| $50,000 to $74,999 | 297 (90.8%) | 30 (9.2%) |
| $75,000 to $99,999 | 169 (77.5%) | 49 (22.5%) |
| $100,000 and over | 354 (88.7%) | 45 (11.3%) |
Public vs Private Health Insurance Coverage by Age in Chiefland
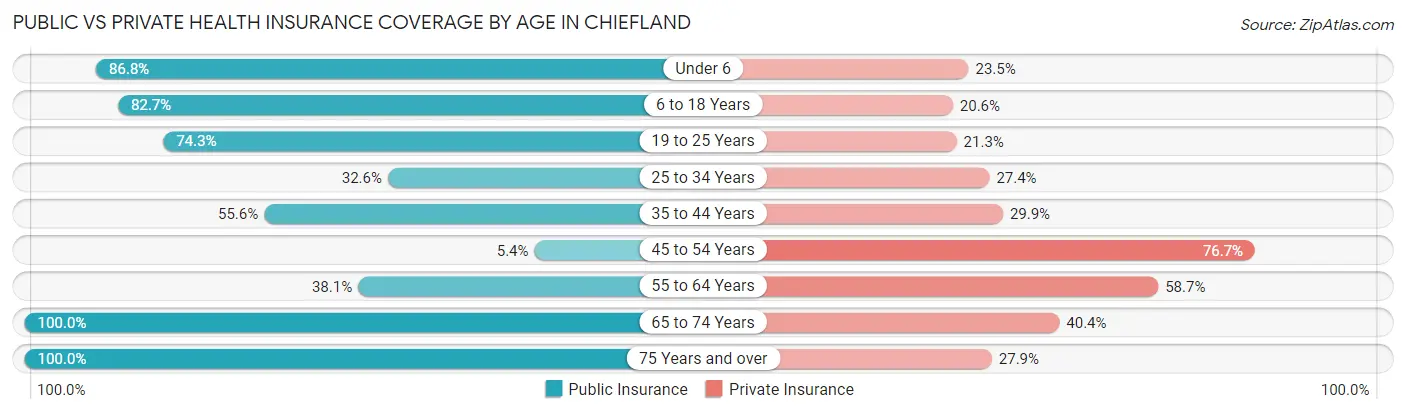
| Age Bracket | Public Insurance | Private Insurance |
| Under 6 | 118 (86.8%) | 32 (23.5%) |
| 6 to 18 Years | 353 (82.7%) | 88 (20.6%) |
| 19 to 25 Years | 101 (74.3%) | 29 (21.3%) |
| 25 to 34 Years | 88 (32.6%) | 74 (27.4%) |
| 35 to 44 Years | 130 (55.6%) | 70 (29.9%) |
| 45 to 54 Years | 12 (5.4%) | 171 (76.7%) |
| 55 to 64 Years | 85 (38.1%) | 131 (58.7%) |
| 65 to 74 Years | 213 (100.0%) | 86 (40.4%) |
| 75 Years and over | 140 (100.0%) | 39 (27.9%) |
| Total | 1,240 (61.9%) | 720 (36.0%) |
Disability Status by Sex by Age in Chiefland
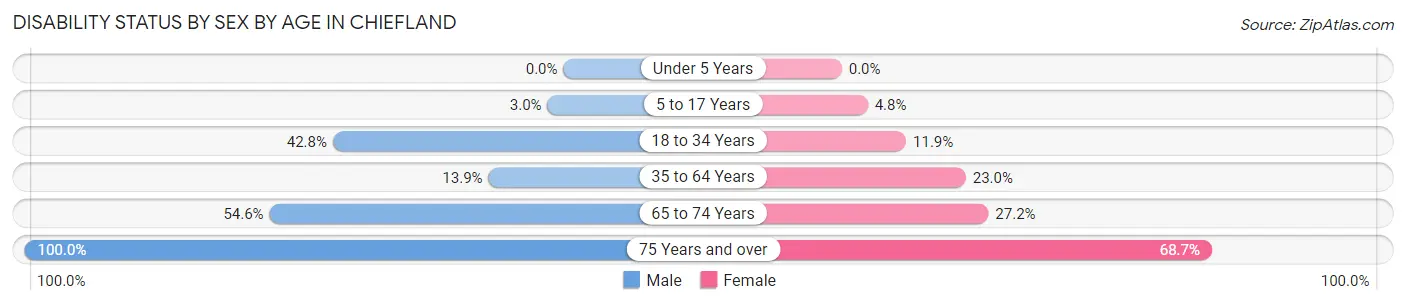
| Age Bracket | Male | Female |
| Under 5 Years | 0 (0.0%) | 0 (0.0%) |
| 5 to 17 Years | 7 (2.9%) | 9 (4.8%) |
| 18 to 34 Years | 101 (42.8%) | 24 (11.9%) |
| 35 to 64 Years | 42 (13.9%) | 87 (23.0%) |
| 65 to 74 Years | 42 (54.5%) | 37 (27.2%) |
| 75 Years and over | 57 (100.0%) | 57 (68.7%) |
Disability Class by Sex by Age in Chiefland
Disability Class: Hearing Difficulty
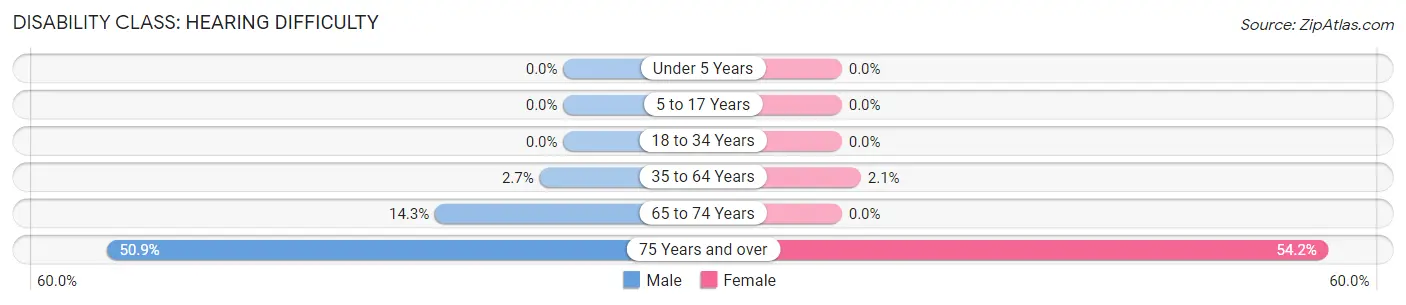
| Age Bracket | Male | Female |
| Under 5 Years | 0 (0.0%) | 0 (0.0%) |
| 5 to 17 Years | 0 (0.0%) | 0 (0.0%) |
| 18 to 34 Years | 0 (0.0%) | 0 (0.0%) |
| 35 to 64 Years | 8 (2.6%) | 8 (2.1%) |
| 65 to 74 Years | 11 (14.3%) | 0 (0.0%) |
| 75 Years and over | 29 (50.9%) | 45 (54.2%) |
Disability Class: Vision Difficulty
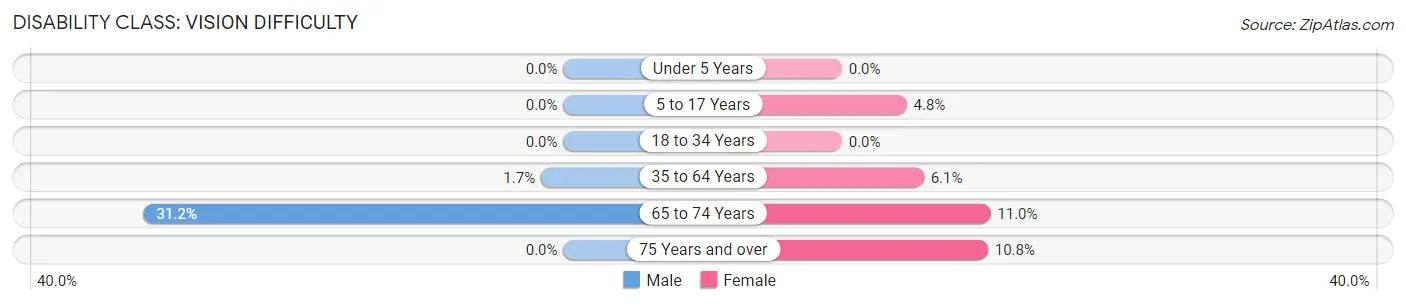
| Age Bracket | Male | Female |
| Under 5 Years | 0 (0.0%) | 0 (0.0%) |
| 5 to 17 Years | 0 (0.0%) | 9 (4.8%) |
| 18 to 34 Years | 0 (0.0%) | 0 (0.0%) |
| 35 to 64 Years | 5 (1.7%) | 23 (6.1%) |
| 65 to 74 Years | 24 (31.2%) | 15 (11.0%) |
| 75 Years and over | 0 (0.0%) | 9 (10.8%) |
Disability Class: Cognitive Difficulty
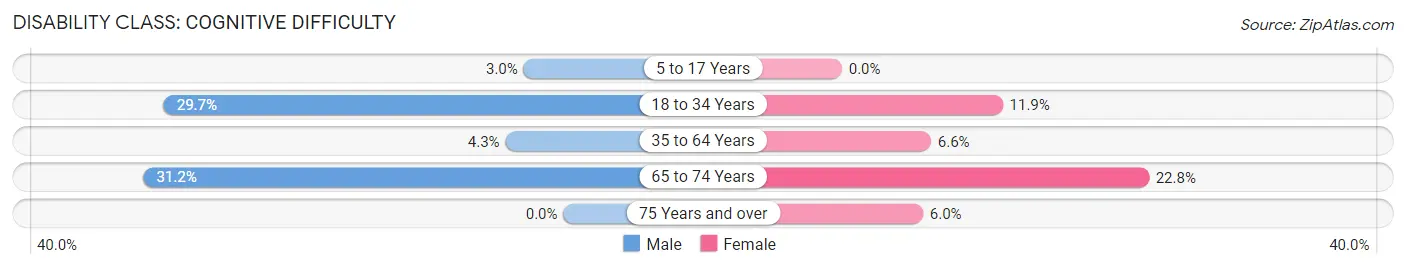
| Age Bracket | Male | Female |
| 5 to 17 Years | 7 (2.9%) | 0 (0.0%) |
| 18 to 34 Years | 70 (29.7%) | 24 (11.9%) |
| 35 to 64 Years | 13 (4.3%) | 25 (6.6%) |
| 65 to 74 Years | 24 (31.2%) | 31 (22.8%) |
| 75 Years and over | 0 (0.0%) | 5 (6.0%) |
Disability Class: Ambulatory Difficulty
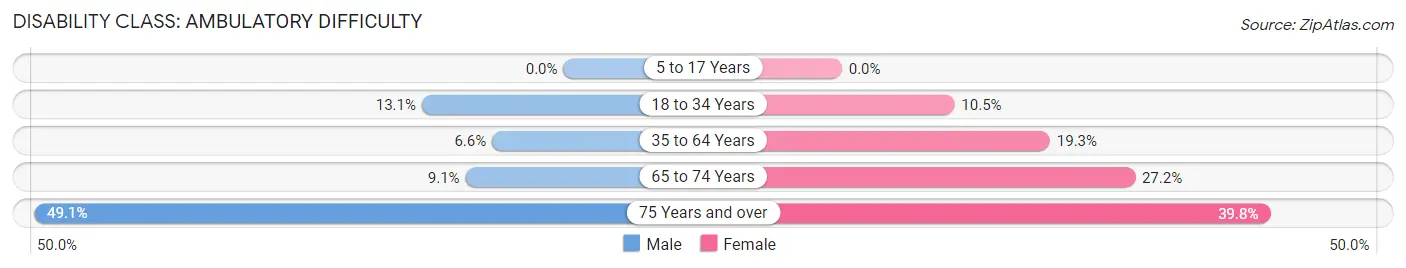
| Age Bracket | Male | Female |
| 5 to 17 Years | 0 (0.0%) | 0 (0.0%) |
| 18 to 34 Years | 31 (13.1%) | 21 (10.4%) |
| 35 to 64 Years | 20 (6.6%) | 73 (19.3%) |
| 65 to 74 Years | 7 (9.1%) | 37 (27.2%) |
| 75 Years and over | 28 (49.1%) | 33 (39.8%) |
Disability Class: Self-Care Difficulty
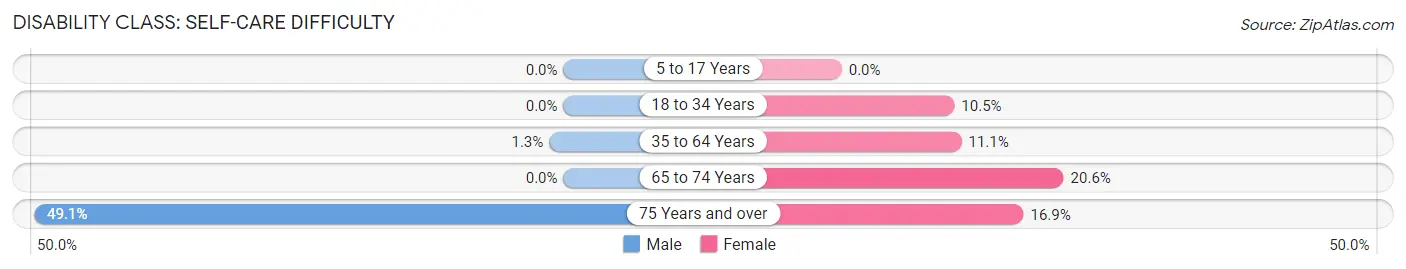
| Age Bracket | Male | Female |
| 5 to 17 Years | 0 (0.0%) | 0 (0.0%) |
| 18 to 34 Years | 0 (0.0%) | 21 (10.4%) |
| 35 to 64 Years | 4 (1.3%) | 42 (11.1%) |
| 65 to 74 Years | 0 (0.0%) | 28 (20.6%) |
| 75 Years and over | 28 (49.1%) | 14 (16.9%) |
Technology Access in Chiefland
Computing Device Access in Chiefland
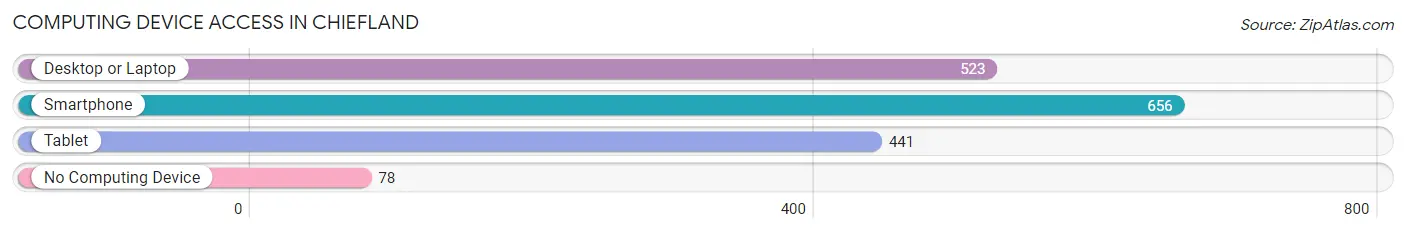
| Device Type | # Households | % Households |
| Desktop or Laptop | 523 | 64.5% |
| Smartphone | 656 | 80.9% |
| Tablet | 441 | 54.4% |
| No Computing Device | 78 | 9.6% |
| Total | 811 | 100.0% |
Internet Access in Chiefland
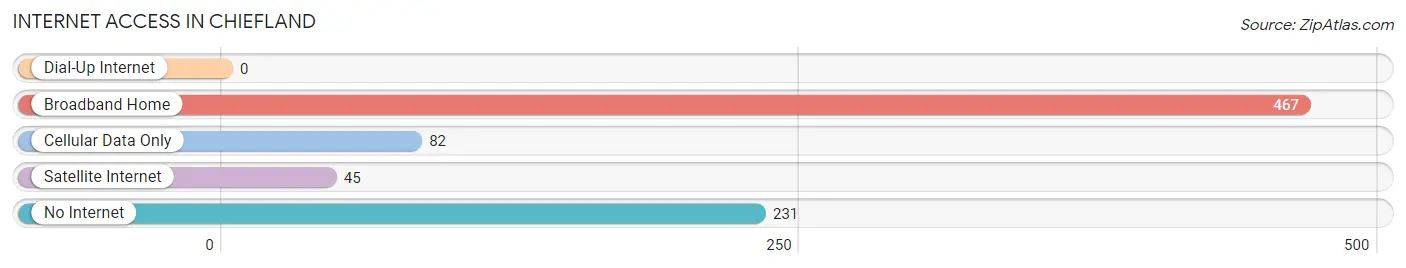
| Internet Type | # Households | % Households |
| Dial-Up Internet | 0 | 0.0% |
| Broadband Home | 467 | 57.6% |
| Cellular Data Only | 82 | 10.1% |
| Satellite Internet | 45 | 5.6% |
| No Internet | 231 | 28.5% |
| Total | 811 | 100.0% |
Chiefland Summary
History
Chiefland is a small city located in Levy County, Florida. It is the county seat of Levy County and is located in the heart of the Nature Coast region of Florida. The city was founded in 1854 and was originally known as “Chiefland” due to the presence of a Seminole Indian chief in the area. The city was officially incorporated in 1887 and has since grown to a population of approximately 2,000 people.
The city of Chiefland has a rich history that dates back to the early 1800s. The area was originally inhabited by the Seminole Indians, who were forced to relocate to the area after the Second Seminole War. The Seminoles were eventually forced to move again in 1842, when the United States government created the Levy County Reservation. The reservation was created to provide a safe haven for the Seminoles, and it was here that Chiefland was founded.
The city of Chiefland was named after the Seminole chief who lived in the area. The chief was known as “Chiefland” and the city was named in his honor. The city was officially incorporated in 1887 and has since grown to a population of approximately 2,000 people.
Geography
Chiefland is located in Levy County, Florida, in the heart of the Nature Coast region of the state. The city is situated on the banks of the Suwannee River, which is a major tributary of the Gulf of Mexico. The city is located approximately 30 miles west of Gainesville and approximately 50 miles east of Tallahassee.
The city of Chiefland is located in a humid subtropical climate zone, which is characterized by hot, humid summers and mild winters. The average temperature in the summer months is around 90 degrees Fahrenheit, while the average temperature in the winter months is around 60 degrees Fahrenheit. The city receives an average of 54 inches of rain per year, with most of the rain falling in the summer months.
Economy
The economy of Chiefland is largely based on agriculture and tourism. The city is home to several farms and ranches, which produce a variety of crops, including corn, soybeans, cotton, and peanuts. The city is also home to several tourist attractions, including the Chiefland Museum, the Chiefland Nature Park, and the Chiefland Golf Course.
The city is also home to several businesses, including restaurants, retail stores, and service providers. The city is also home to several manufacturing companies, including a paper mill and a woodworking plant.
Demographics
As of the 2010 census, the population of Chiefland was 2,039. The racial makeup of the city was 79.3% White, 15.2% African American, 0.3% Native American, 0.7% Asian, 0.1% Pacific Islander, and 4.4% from other races. The median household income in the city was $30,938, and the median family income was $37,813. The per capita income in the city was $17,845.
Conclusion
Chiefland is a small city located in Levy County, Florida. It is the county seat of Levy County and is located in the heart of the Nature Coast region of Florida. The city was founded in 1854 and was originally known as “Chiefland” due to the presence of a Seminole Indian chief in the area. The city has a rich history and is home to several farms and ranches, tourist attractions, businesses, and manufacturing companies. The population of Chiefland was 2,039 as of the 2010 census, and the median household income was $30,938.
Common Questions
What is the Total Population of Chiefland?
Total Population of Chiefland is 2,016.
What is the Total Male Population of Chiefland?
Total Male Population of Chiefland is 969.
What is the Total Female Population of Chiefland?
Total Female Population of Chiefland is 1,047.
What is the Ratio of Males per 100 Females in Chiefland?
There are 92.55 Males per 100 Females in Chiefland.
What is the Ratio of Females per 100 Males in Chiefland?
There are 108.05 Females per 100 Males in Chiefland.
What is the Median Population Age in Chiefland?
Median Population Age in Chiefland is 37.3 Years.
What is the Average Family Size in Chiefland
Average Family Size in Chiefland is 3.1 People.
What is the Average Household Size in Chiefland
Average Household Size in Chiefland is 2.5 People.
What is Per Capita Income in Chiefland?
Per Capita income in Chiefland is $27,003.
What is the Median Family Income in Chiefland?
Median Family Income in Chiefland is $46,131.
What is the Median Household income in Chiefland?
Median Household Income in Chiefland is $38,536.
What is Income or Wage Gap in Chiefland?
Income or Wage Gap in Chiefland is 26.7%.
Women in Chiefland earn 73.3 cents for every dollar earned by a man.
What is Inequality or Gini Index in Chiefland?
Inequality or Gini Index in Chiefland is 0.49.
How Large is the Labor Force in Chiefland?
There are 748 People in the Labor Forcein in Chiefland.
What is the Percentage of People in the Labor Force in Chiefland?
48.5% of People are in the Labor Force in Chiefland.
What is the Unemployment Rate in Chiefland?
Unemployment Rate in Chiefland is 3.5%.