East Lake Orient Park, FL
East Lake Orient Park Map
East Lake Orient Park Overview
29,243
TOTAL POPULATION
14,000
MALE POPULATION
15,243
FEMALE POPULATION
91.85
MALES / 100 FEMALES
108.88
FEMALES / 100 MALES
33.2
MEDIAN AGE
3.4
AVG FAMILY SIZE
2.7
AVG HOUSEHOLD SIZE
$25,204
PER CAPITA INCOME
$59,369
AVG FAMILY INCOME
$56,401
AVG HOUSEHOLD INCOME
11.2%
WAGE / INCOME GAP [ % ]
88.8¢/ $1
WAGE / INCOME GAP [ $ ]
$14,196
FAMILY INCOME DEFICIT
0.40
INEQUALITY / GINI INDEX
15,655
LABOR FORCE [ PEOPLE ]
69.9%
PERCENT IN LABOR FORCE
7.2%
UNEMPLOYMENT RATE
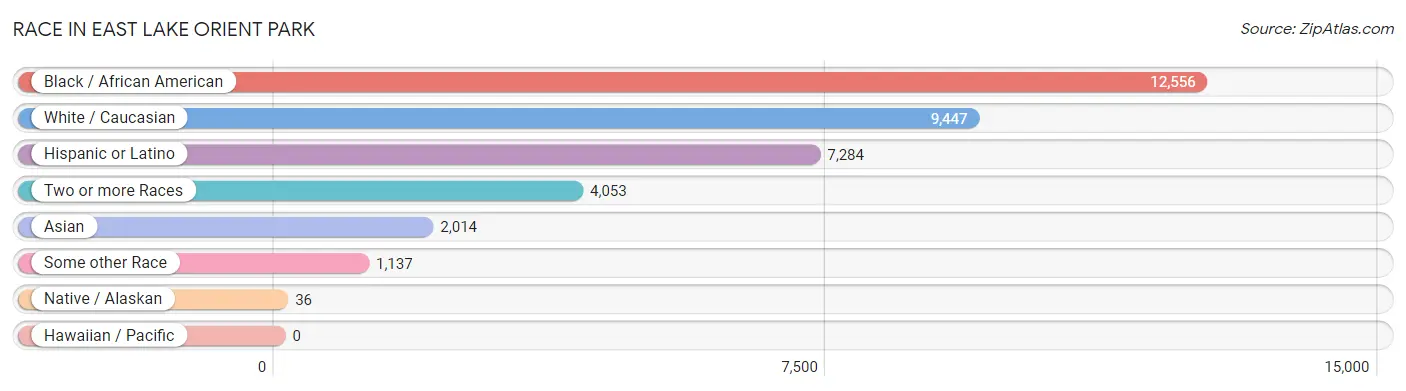
Race in East Lake Orient Park
The most populous races in East Lake Orient Park are Black / African American (12,556 | 42.9%), White / Caucasian (9,447 | 32.3%), and Hispanic or Latino (7,284 | 24.9%).
| Race | # Population | % Population |
| Asian | 2,014 | 6.9% |
| Black / African American | 12,556 | 42.9% |
| Hawaiian / Pacific | 0 | 0.0% |
| Hispanic or Latino | 7,284 | 24.9% |
| Native / Alaskan | 36 | 0.1% |
| White / Caucasian | 9,447 | 32.3% |
| Two or more Races | 4,053 | 13.9% |
| Some other Race | 1,137 | 3.9% |
| Total | 29,243 | 100.0% |
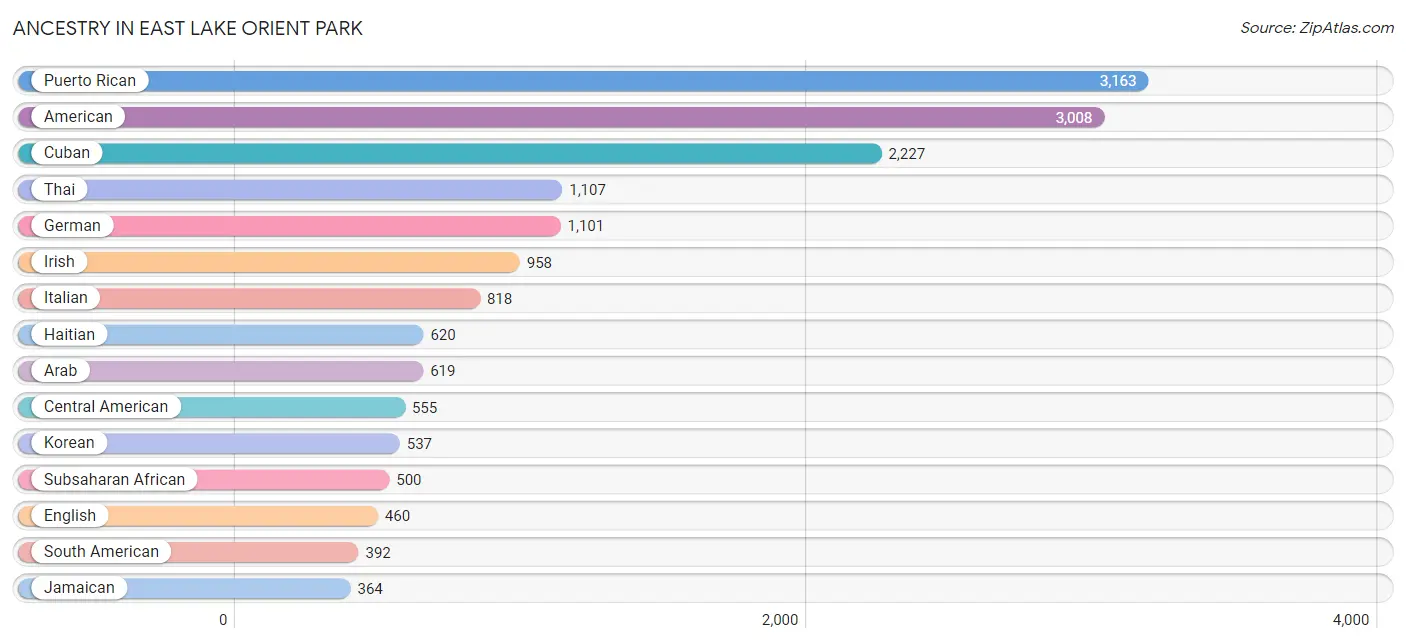
Ancestry in East Lake Orient Park
The most populous ancestries reported in East Lake Orient Park are Puerto Rican (3,163 | 10.8%), American (3,008 | 10.3%), Cuban (2,227 | 7.6%), Thai (1,107 | 3.8%), and German (1,101 | 3.8%), together accounting for 36.3% of all East Lake Orient Park residents.
| Ancestry | # Population | % Population |
| African | 242 | 0.8% |
| Albanian | 16 | 0.1% |
| American | 3,008 | 10.3% |
| Arab | 619 | 2.1% |
| Argentinean | 23 | 0.1% |
| Bahamian | 108 | 0.4% |
| Bhutanese | 88 | 0.3% |
| Blackfeet | 8 | 0.0% |
| British | 85 | 0.3% |
| British West Indian | 29 | 0.1% |
| Burmese | 33 | 0.1% |
| Canadian | 11 | 0.0% |
| Celtic | 11 | 0.0% |
| Central American | 555 | 1.9% |
| Central American Indian | 31 | 0.1% |
| Cherokee | 30 | 0.1% |
| Chippewa | 4 | 0.0% |
| Colombian | 199 | 0.7% |
| Croatian | 35 | 0.1% |
| Cuban | 2,227 | 7.6% |
| Czechoslovakian | 12 | 0.0% |
| Danish | 18 | 0.1% |
| Dominican | 227 | 0.8% |
| Dutch | 63 | 0.2% |
| Eastern European | 34 | 0.1% |
| Ecuadorian | 9 | 0.0% |
| English | 460 | 1.6% |
| European | 88 | 0.3% |
| French | 341 | 1.2% |
| French Canadian | 24 | 0.1% |
| German | 1,101 | 3.8% |
| Ghanaian | 194 | 0.7% |
| Greek | 42 | 0.1% |
| Guatemalan | 353 | 1.2% |
| Guyanese | 28 | 0.1% |
| Haitian | 620 | 2.1% |
| Honduran | 20 | 0.1% |
| Hungarian | 16 | 0.1% |
| Indian (Asian) | 23 | 0.1% |
| Iraqi | 34 | 0.1% |
| Irish | 958 | 3.3% |
| Italian | 818 | 2.8% |
| Jamaican | 364 | 1.2% |
| Jordanian | 84 | 0.3% |
| Korean | 537 | 1.8% |
| Liberian | 19 | 0.1% |
| Lithuanian | 10 | 0.0% |
| Malaysian | 17 | 0.1% |
| Mexican | 220 | 0.7% |
| Moroccan | 65 | 0.2% |
| Native Hawaiian | 1 | 0.0% |
| Nigerian | 24 | 0.1% |
| Norwegian | 85 | 0.3% |
| Palestinian | 40 | 0.1% |
| Panamanian | 104 | 0.4% |
| Pennsylvania German | 17 | 0.1% |
| Peruvian | 32 | 0.1% |
| Polish | 190 | 0.6% |
| Puerto Rican | 3,163 | 10.8% |
| Russian | 1 | 0.0% |
| Salvadoran | 78 | 0.3% |
| Scotch-Irish | 46 | 0.2% |
| Scottish | 325 | 1.1% |
| South American | 392 | 1.3% |
| Spaniard | 130 | 0.4% |
| Spanish | 71 | 0.2% |
| Sri Lankan | 343 | 1.2% |
| Subsaharan African | 500 | 1.7% |
| Sudanese | 21 | 0.1% |
| Swedish | 15 | 0.1% |
| Swiss | 9 | 0.0% |
| Syrian | 74 | 0.3% |
| Thai | 1,107 | 3.8% |
| Trinidadian and Tobagonian | 39 | 0.1% |
| Turkish | 51 | 0.2% |
| Ukrainian | 8 | 0.0% |
| Venezuelan | 129 | 0.4% |
| Vietnamese | 128 | 0.4% |
| Welsh | 36 | 0.1% |
| West Indian | 8 | 0.0% | View All 80 Rows |
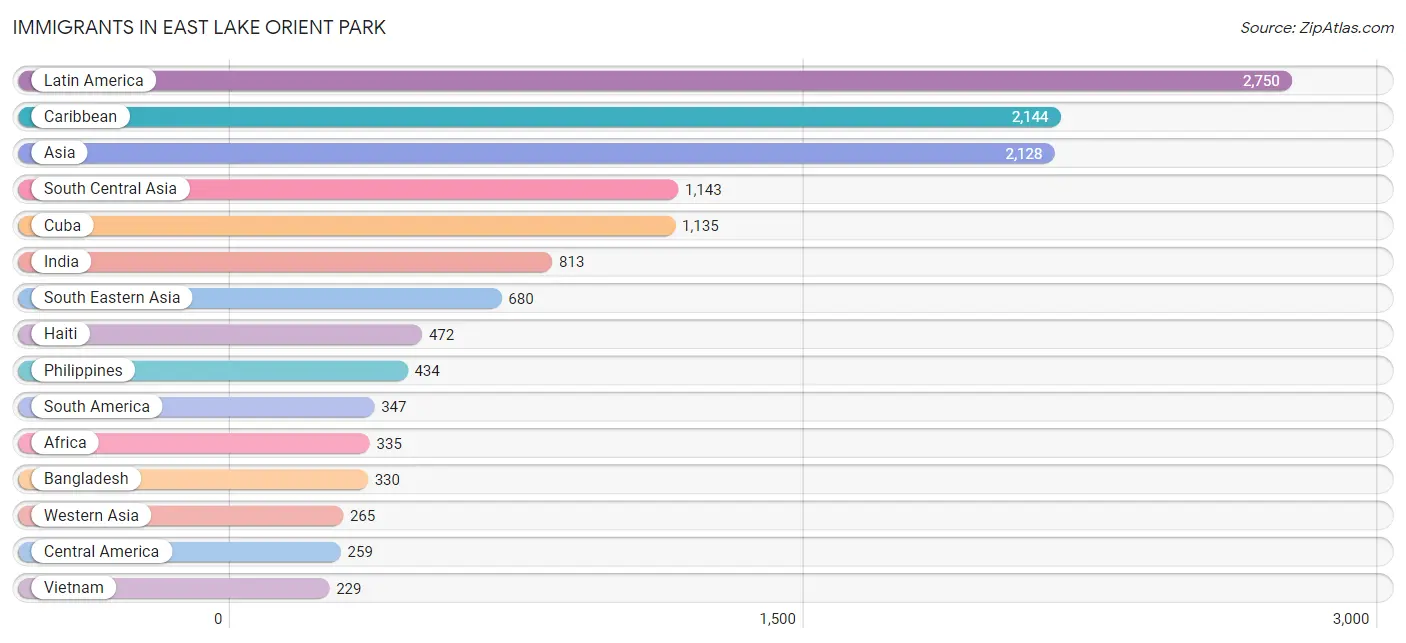
Immigrants in East Lake Orient Park
The most numerous immigrant groups reported in East Lake Orient Park came from Latin America (2,750 | 9.4%), Caribbean (2,144 | 7.3%), Asia (2,128 | 7.3%), South Central Asia (1,143 | 3.9%), and Cuba (1,135 | 3.9%), together accounting for 31.8% of all East Lake Orient Park residents.
| Immigration Origin | # Population | % Population |
| Africa | 335 | 1.1% |
| Albania | 16 | 0.1% |
| Argentina | 23 | 0.1% |
| Asia | 2,128 | 7.3% |
| Bahamas | 119 | 0.4% |
| Bangladesh | 330 | 1.1% |
| Cameroon | 10 | 0.0% |
| Canada | 31 | 0.1% |
| Caribbean | 2,144 | 7.3% |
| Central America | 259 | 0.9% |
| Colombia | 169 | 0.6% |
| Cuba | 1,135 | 3.9% |
| Dominican Republic | 211 | 0.7% |
| Eastern Africa | 55 | 0.2% |
| Eastern Asia | 40 | 0.1% |
| Eastern Europe | 16 | 0.1% |
| Ecuador | 9 | 0.0% |
| Egypt | 37 | 0.1% |
| England | 23 | 0.1% |
| Europe | 120 | 0.4% |
| Germany | 11 | 0.0% |
| Ghana | 89 | 0.3% |
| Guatemala | 194 | 0.7% |
| Guyana | 28 | 0.1% |
| Haiti | 472 | 1.6% |
| Honduras | 29 | 0.1% |
| India | 813 | 2.8% |
| Iraq | 34 | 0.1% |
| Israel | 14 | 0.1% |
| Italy | 33 | 0.1% |
| Jamaica | 146 | 0.5% |
| Japan | 20 | 0.1% |
| Jordan | 84 | 0.3% |
| Korea | 20 | 0.1% |
| Kuwait | 43 | 0.2% |
| Latin America | 2,750 | 9.4% |
| Mexico | 36 | 0.1% |
| Middle Africa | 10 | 0.0% |
| Morocco | 40 | 0.1% |
| Northern Africa | 146 | 0.5% |
| Northern Europe | 23 | 0.1% |
| Philippines | 434 | 1.5% |
| South America | 347 | 1.2% |
| South Central Asia | 1,143 | 3.9% |
| South Eastern Asia | 680 | 2.3% |
| Southern Europe | 70 | 0.2% |
| Spain | 37 | 0.1% |
| Sudan | 21 | 0.1% |
| Syria | 74 | 0.3% |
| Thailand | 17 | 0.1% |
| Trinidad and Tobago | 32 | 0.1% |
| Turkey | 16 | 0.1% |
| Uganda | 33 | 0.1% |
| Venezuela | 118 | 0.4% |
| Vietnam | 229 | 0.8% |
| Western Africa | 124 | 0.4% |
| Western Asia | 265 | 0.9% |
| Western Europe | 11 | 0.0% |
| Zimbabwe | 22 | 0.1% | View All 59 Rows |
Sex and Age in East Lake Orient Park
Sex and Age in East Lake Orient Park
The most populous age groups in East Lake Orient Park are 25 to 29 Years (1,334 | 9.5%) for men and 5 to 9 Years (1,457 | 9.6%) for women.
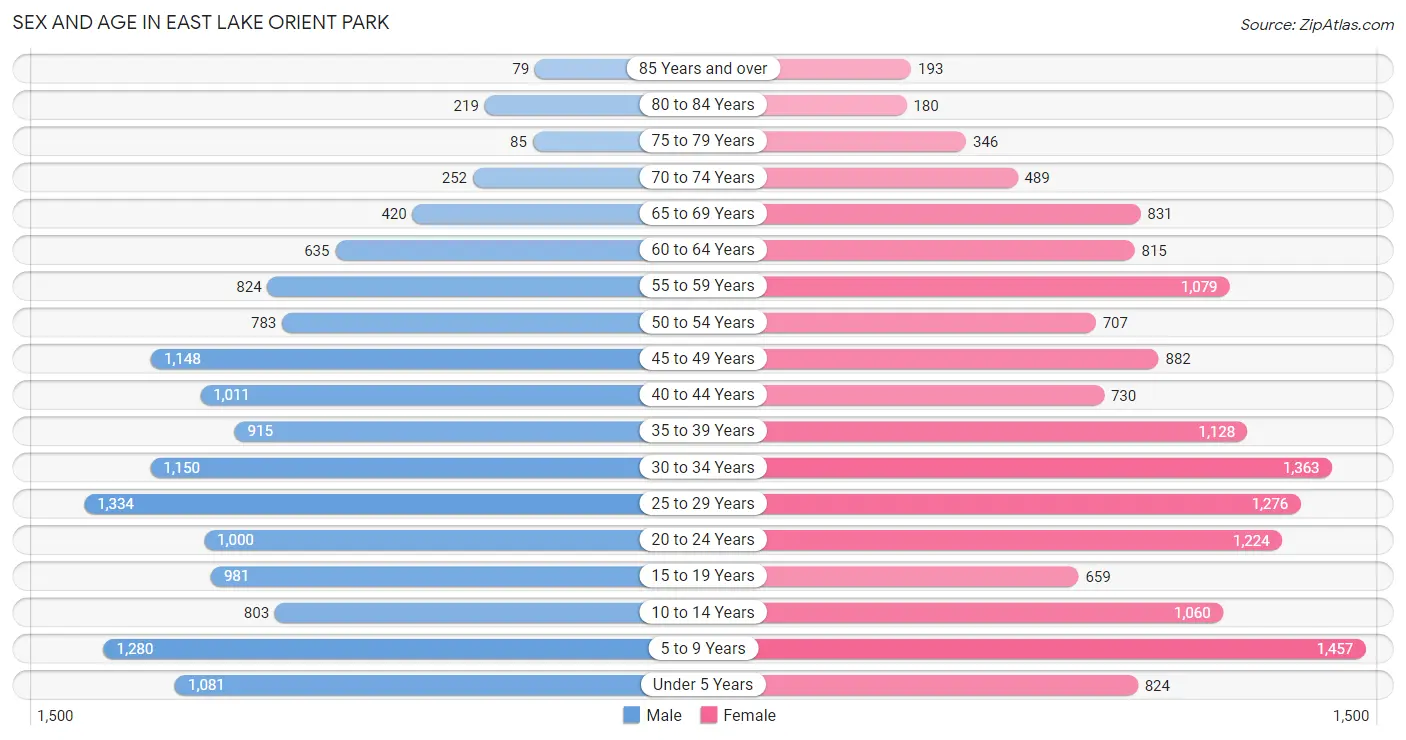
| Age Bracket | Male | Female |
| Under 5 Years | 1,081 (7.7%) | 824 (5.4%) |
| 5 to 9 Years | 1,280 (9.1%) | 1,457 (9.6%) |
| 10 to 14 Years | 803 (5.7%) | 1,060 (7.0%) |
| 15 to 19 Years | 981 (7.0%) | 659 (4.3%) |
| 20 to 24 Years | 1,000 (7.1%) | 1,224 (8.0%) |
| 25 to 29 Years | 1,334 (9.5%) | 1,276 (8.4%) |
| 30 to 34 Years | 1,150 (8.2%) | 1,363 (8.9%) |
| 35 to 39 Years | 915 (6.5%) | 1,128 (7.4%) |
| 40 to 44 Years | 1,011 (7.2%) | 730 (4.8%) |
| 45 to 49 Years | 1,148 (8.2%) | 882 (5.8%) |
| 50 to 54 Years | 783 (5.6%) | 707 (4.6%) |
| 55 to 59 Years | 824 (5.9%) | 1,079 (7.1%) |
| 60 to 64 Years | 635 (4.5%) | 815 (5.3%) |
| 65 to 69 Years | 420 (3.0%) | 831 (5.4%) |
| 70 to 74 Years | 252 (1.8%) | 489 (3.2%) |
| 75 to 79 Years | 85 (0.6%) | 346 (2.3%) |
| 80 to 84 Years | 219 (1.6%) | 180 (1.2%) |
| 85 Years and over | 79 (0.6%) | 193 (1.3%) |
| Total | 14,000 (100.0%) | 15,243 (100.0%) |
Families and Households in East Lake Orient Park
Median Family Size in East Lake Orient Park
The median family size in East Lake Orient Park is 3.43 persons per family, with single female/mother families (2,640 | 40.6%) accounting for the largest median family size of 3.55 persons per family. On the other hand, single male/father families (865 | 13.3%) represent the smallest median family size with 2.71 persons per family.
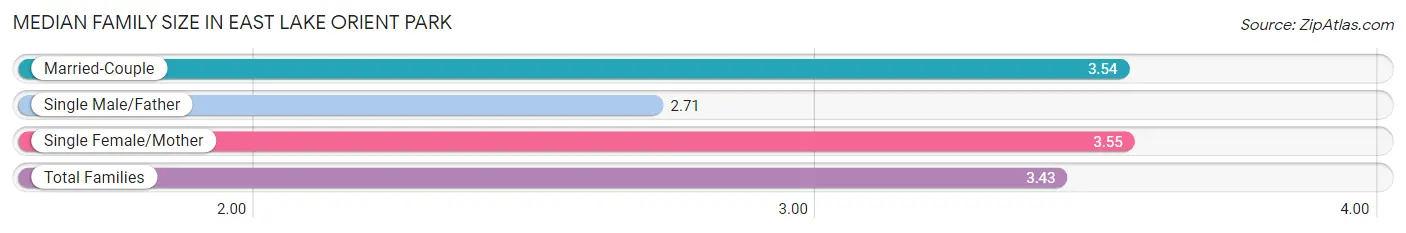
| Family Type | # Families | Family Size |
| Married-Couple | 3,001 (46.1%) | 3.54 |
| Single Male/Father | 865 (13.3%) | 2.71 |
| Single Female/Mother | 2,640 (40.6%) | 3.55 |
| Total Families | 6,506 (100.0%) | 3.43 |
Median Household Size in East Lake Orient Park
The median household size in East Lake Orient Park is 2.67 persons per household, with single female/mother households (2,640 | 24.1%) accounting for the largest median household size of 3.69 persons per household. non-family households (4,434 | 40.5%) represent the smallest median household size with 1.36 persons per household.
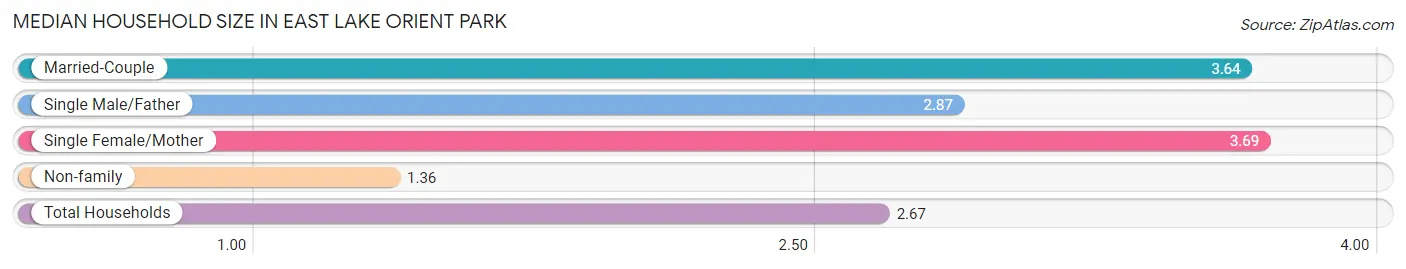
| Household Type | # Households | Household Size |
| Married-Couple | 3,001 (27.4%) | 3.64 |
| Single Male/Father | 865 (7.9%) | 2.87 |
| Single Female/Mother | 2,640 (24.1%) | 3.69 |
| Non-family | 4,434 (40.5%) | 1.36 |
| Total Households | 10,940 (100.0%) | 2.67 |
Household Size by Marriage Status in East Lake Orient Park
Out of a total of 10,940 households in East Lake Orient Park, 6,506 (59.5%) are family households, while 4,434 (40.5%) are nonfamily households. The most numerous type of family households are 3-person households, comprising 2,195, and the most common type of nonfamily households are 1-person households, comprising 3,228.
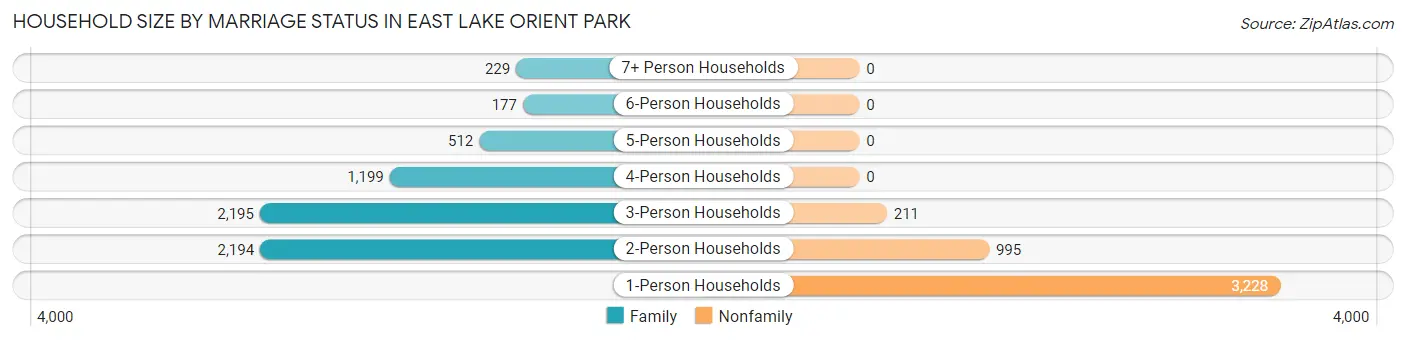
| Household Size | Family Households | Nonfamily Households |
| 1-Person Households | - | 3,228 (29.5%) |
| 2-Person Households | 2,194 (20.1%) | 995 (9.1%) |
| 3-Person Households | 2,195 (20.1%) | 211 (1.9%) |
| 4-Person Households | 1,199 (11.0%) | 0 (0.0%) |
| 5-Person Households | 512 (4.7%) | 0 (0.0%) |
| 6-Person Households | 177 (1.6%) | 0 (0.0%) |
| 7+ Person Households | 229 (2.1%) | 0 (0.0%) |
| Total | 6,506 (59.5%) | 4,434 (40.5%) |
Female Fertility in East Lake Orient Park
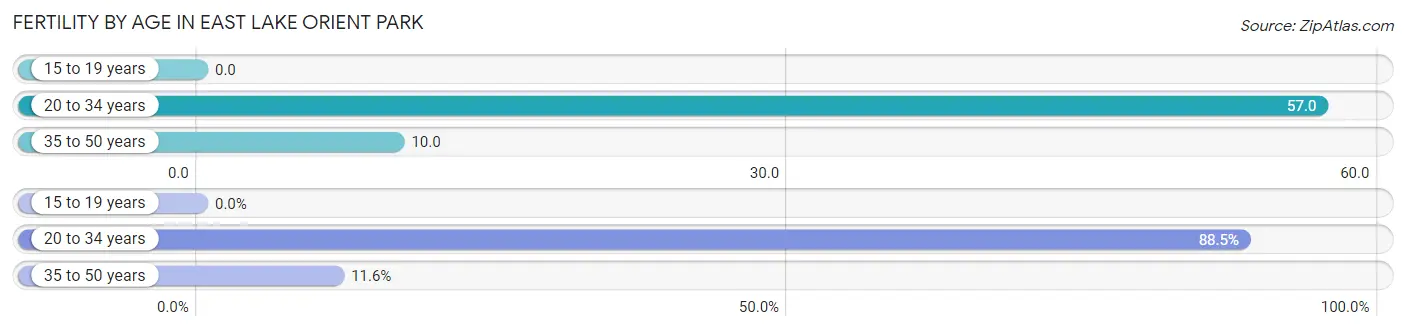
Fertility by Age in East Lake Orient Park
Average fertility rate in East Lake Orient Park is 34.0 births per 1,000 women. Women in the age bracket of 20 to 34 years have the highest fertility rate with 57.0 births per 1,000 women. Women in the age bracket of 20 to 34 years acount for 88.4% of all women with births.
| Age Bracket | Women with Births | Births / 1,000 Women |
| 15 to 19 years | 0 (0.0%) | 0.0 |
| 20 to 34 years | 222 (88.4%) | 57.0 |
| 35 to 50 years | 29 (11.6%) | 10.0 |
| Total | 251 (100.0%) | 34.0 |
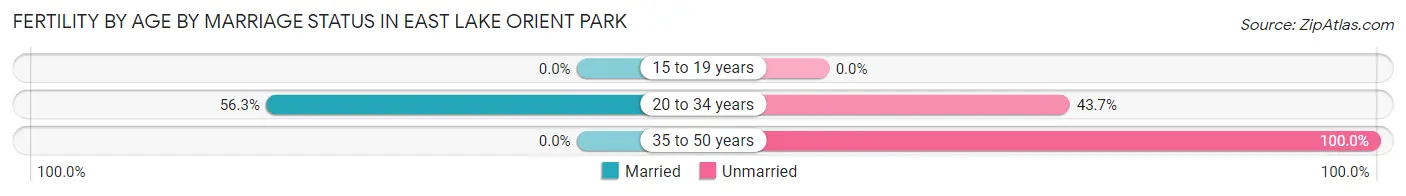
Fertility by Age by Marriage Status in East Lake Orient Park
49.8% of women with births (251) in East Lake Orient Park are married. The highest percentage of unmarried women with births falls into 35 to 50 years age bracket with 100.0% of them unmarried at the time of birth, while the lowest percentage of unmarried women with births belong to 20 to 34 years age bracket with 43.7% of them unmarried.
| Age Bracket | Married | Unmarried |
| 15 to 19 years | 0 (0.0%) | 0 (0.0%) |
| 20 to 34 years | 125 (56.3%) | 97 (43.7%) |
| 35 to 50 years | 0 (0.0%) | 29 (100.0%) |
| Total | 125 (49.8%) | 126 (50.2%) |
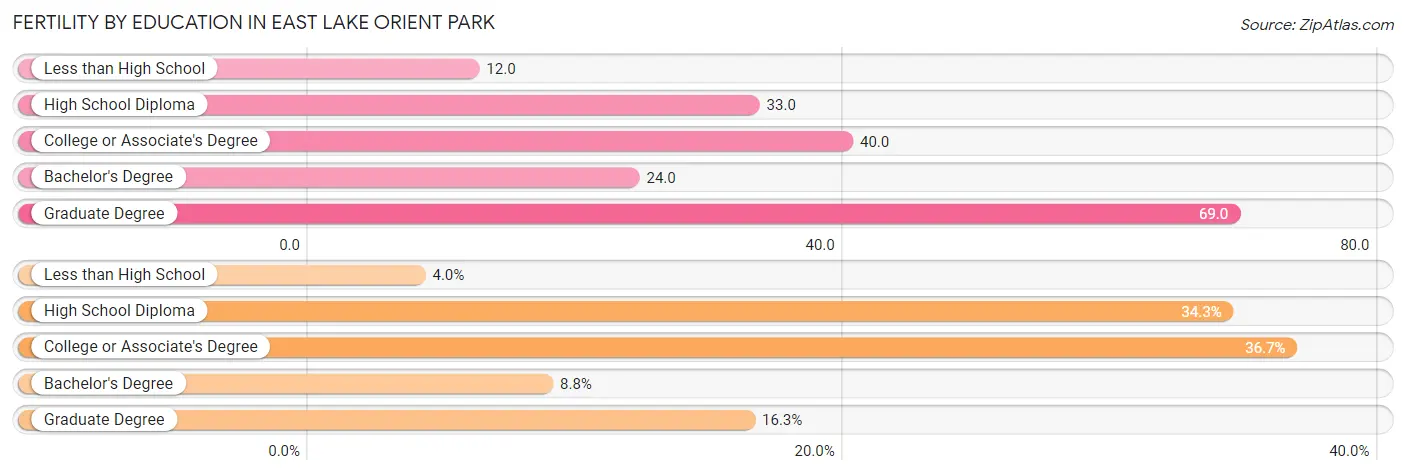
Fertility by Education in East Lake Orient Park
Average fertility rate in East Lake Orient Park is 34.0 births per 1,000 women. Women with the education attainment of graduate degree have the highest fertility rate of 69.0 births per 1,000 women, while women with the education attainment of less than high school have the lowest fertility at 12.0 births per 1,000 women. Women with the education attainment of college or associate's degree represent 36.6% of all women with births.
| Educational Attainment | Women with Births | Births / 1,000 Women |
| Less than High School | 10 (4.0%) | 12.0 |
| High School Diploma | 86 (34.3%) | 33.0 |
| College or Associate's Degree | 92 (36.6%) | 40.0 |
| Bachelor's Degree | 22 (8.8%) | 24.0 |
| Graduate Degree | 41 (16.3%) | 69.0 |
| Total | 251 (100.0%) | 34.0 |
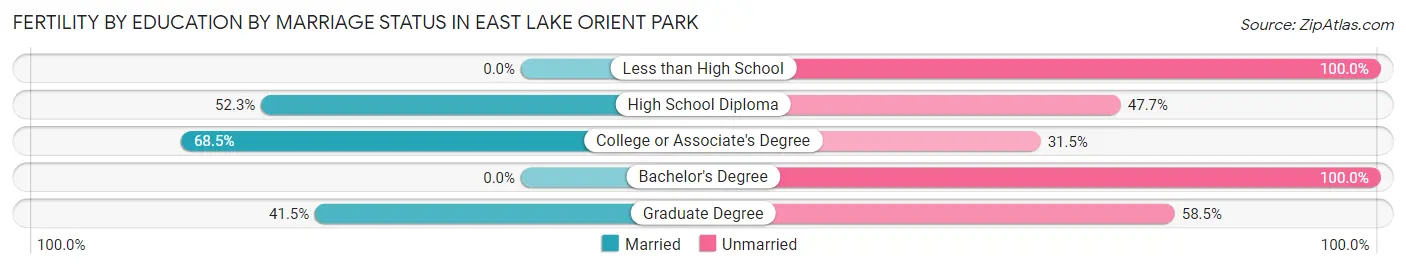
Fertility by Education by Marriage Status in East Lake Orient Park
50.2% of women with births in East Lake Orient Park are unmarried. Women with the educational attainment of college or associate's degree are most likely to be married with 68.5% of them married at childbirth, while women with the educational attainment of less than high school are least likely to be married with 100.0% of them unmarried at childbirth.
| Educational Attainment | Married | Unmarried |
| Less than High School | 0 (0.0%) | 10 (100.0%) |
| High School Diploma | 45 (52.3%) | 41 (47.7%) |
| College or Associate's Degree | 63 (68.5%) | 29 (31.5%) |
| Bachelor's Degree | 0 (0.0%) | 22 (100.0%) |
| Graduate Degree | 17 (41.5%) | 24 (58.5%) |
| Total | 125 (49.8%) | 126 (50.2%) |
Income in East Lake Orient Park
Income Overview in East Lake Orient Park
Per Capita Income in East Lake Orient Park is $25,204, while median incomes of families and households are $59,369 and $56,401 respectively.
| Characteristic | Number | Measure |
| Per Capita Income | 29,243 | $25,204 |
| Median Family Income | 6,506 | $59,369 |
| Mean Family Income | 6,506 | $67,712 |
| Median Household Income | 10,940 | $56,401 |
| Mean Household Income | 10,940 | $64,458 |
| Income Deficit | 6,506 | $14,196 |
| Wage / Income Gap (%) | 29,243 | 11.23% |
| Wage / Income Gap ($) | 29,243 | 88.77¢ per $1 |
| Gini / Inequality Index | 29,243 | 0.40 |
Earnings by Sex in East Lake Orient Park
Average Earnings in East Lake Orient Park are $33,123, $36,029 for men and $31,984 for women, a difference of 11.2%.
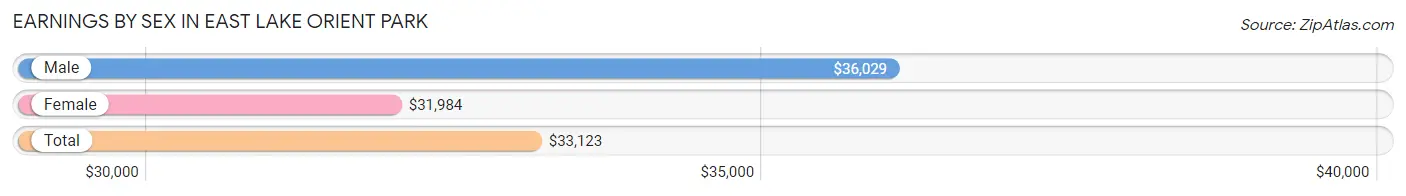
| Sex | Number | Average Earnings |
| Male | 7,451 (47.5%) | $36,029 |
| Female | 8,250 (52.5%) | $31,984 |
| Total | 15,701 (100.0%) | $33,123 |
Earnings by Sex by Income Bracket in East Lake Orient Park
The most common earnings brackets in East Lake Orient Park are $25,000 to $29,999 for men (796 | 10.7%) and $30,000 to $34,999 for women (1,219 | 14.8%).
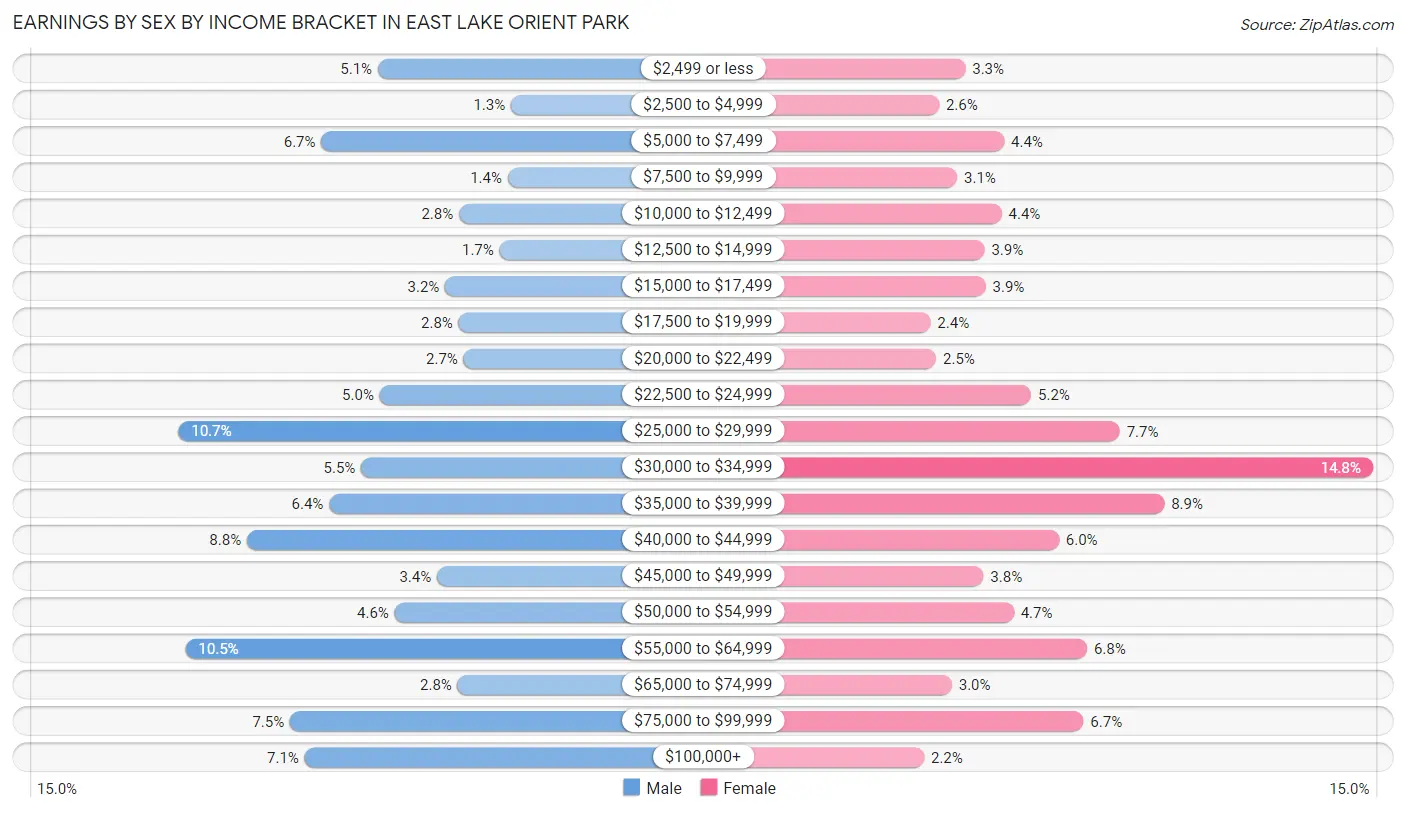
| Income | Male | Female |
| $2,499 or less | 378 (5.1%) | 275 (3.3%) |
| $2,500 to $4,999 | 99 (1.3%) | 214 (2.6%) |
| $5,000 to $7,499 | 496 (6.7%) | 365 (4.4%) |
| $7,500 to $9,999 | 106 (1.4%) | 256 (3.1%) |
| $10,000 to $12,499 | 208 (2.8%) | 359 (4.3%) |
| $12,500 to $14,999 | 123 (1.7%) | 319 (3.9%) |
| $15,000 to $17,499 | 237 (3.2%) | 322 (3.9%) |
| $17,500 to $19,999 | 209 (2.8%) | 194 (2.4%) |
| $20,000 to $22,499 | 198 (2.7%) | 207 (2.5%) |
| $22,500 to $24,999 | 374 (5.0%) | 427 (5.2%) |
| $25,000 to $29,999 | 796 (10.7%) | 633 (7.7%) |
| $30,000 to $34,999 | 413 (5.5%) | 1,219 (14.8%) |
| $35,000 to $39,999 | 480 (6.4%) | 736 (8.9%) |
| $40,000 to $44,999 | 652 (8.7%) | 492 (6.0%) |
| $45,000 to $49,999 | 254 (3.4%) | 317 (3.8%) |
| $50,000 to $54,999 | 343 (4.6%) | 387 (4.7%) |
| $55,000 to $64,999 | 781 (10.5%) | 557 (6.8%) |
| $65,000 to $74,999 | 211 (2.8%) | 243 (2.9%) |
| $75,000 to $99,999 | 562 (7.5%) | 549 (6.7%) |
| $100,000+ | 531 (7.1%) | 179 (2.2%) |
| Total | 7,451 (100.0%) | 8,250 (100.0%) |
Earnings by Sex by Educational Attainment in East Lake Orient Park
Average earnings in East Lake Orient Park are $40,143 for men and $32,984 for women, a difference of 17.8%. Men with an educational attainment of graduate degree enjoy the highest average annual earnings of $92,188, while those with less than high school education earn the least with $32,118. Women with an educational attainment of graduate degree earn the most with the average annual earnings of $71,115, while those with less than high school education have the smallest earnings of $26,250.
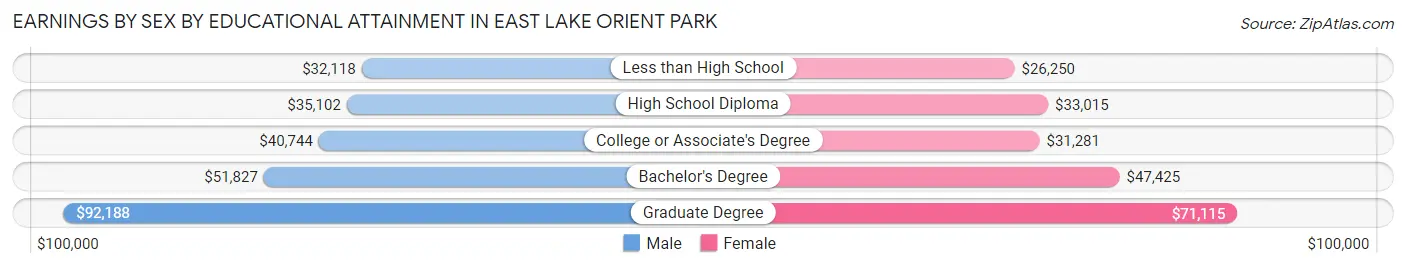
| Educational Attainment | Male Income | Female Income |
| Less than High School | $32,118 | $26,250 |
| High School Diploma | $35,102 | $33,015 |
| College or Associate's Degree | $40,744 | $31,281 |
| Bachelor's Degree | $51,827 | $47,425 |
| Graduate Degree | $92,188 | $71,115 |
| Total | $40,143 | $32,984 |
Family Income in East Lake Orient Park
Family Income Brackets in East Lake Orient Park
According to the East Lake Orient Park family income data, there are 1,425 families falling into the $50,000 to $74,999 income range, which is the most common income bracket and makes up 21.9% of all families. Conversely, the $200,000+ income bracket is the least frequent group with only 130 families (2.0%) belonging to this category.
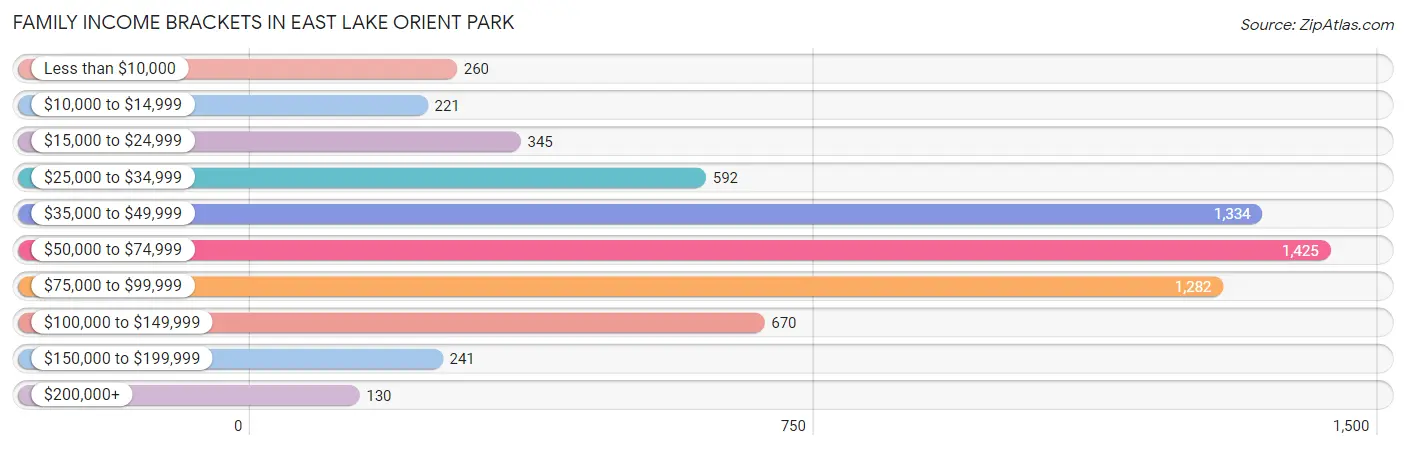
| Income Bracket | # Families | % Families |
| Less than $10,000 | 260 | 4.0% |
| $10,000 to $14,999 | 221 | 3.4% |
| $15,000 to $24,999 | 345 | 5.3% |
| $25,000 to $34,999 | 592 | 9.1% |
| $35,000 to $49,999 | 1,334 | 20.5% |
| $50,000 to $74,999 | 1,425 | 21.9% |
| $75,000 to $99,999 | 1,282 | 19.7% |
| $100,000 to $149,999 | 670 | 10.3% |
| $150,000 to $199,999 | 241 | 3.7% |
| $200,000+ | 130 | 2.0% |
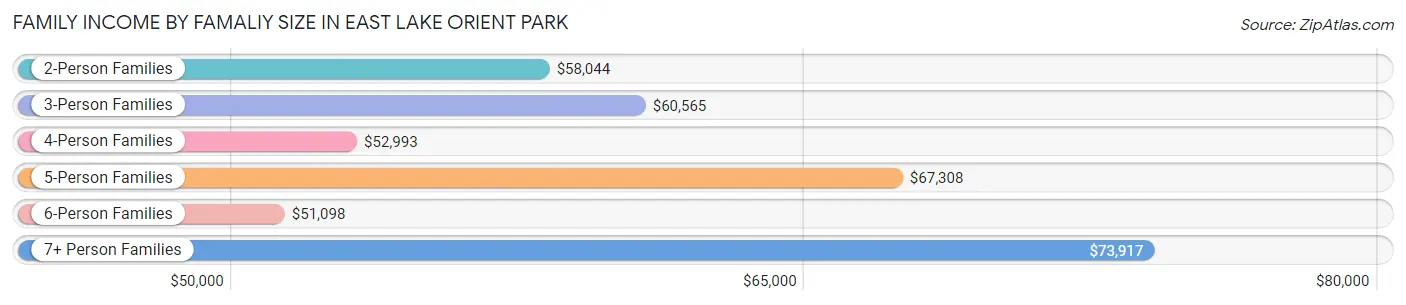
Family Income by Famaliy Size in East Lake Orient Park
7+ person families (229 | 3.5%) account for the highest median family income in East Lake Orient Park with $73,917 per family, while 2-person families (2,537 | 39.0%) have the highest median income of $29,022 per family member.
| Income Bracket | # Families | Median Income |
| 2-Person Families | 2,537 (39.0%) | $58,044 |
| 3-Person Families | 2,052 (31.5%) | $60,565 |
| 4-Person Families | 1,059 (16.3%) | $52,993 |
| 5-Person Families | 468 (7.2%) | $67,308 |
| 6-Person Families | 161 (2.5%) | $51,098 |
| 7+ Person Families | 229 (3.5%) | $73,917 |
| Total | 6,506 (100.0%) | $59,369 |
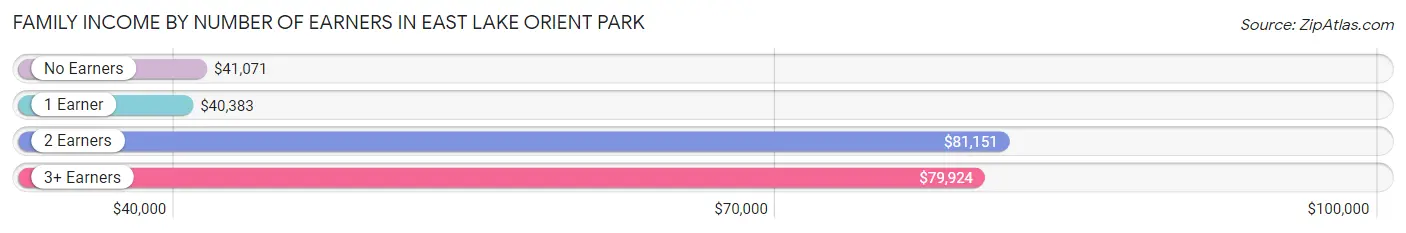
Family Income by Number of Earners in East Lake Orient Park
The median family income in East Lake Orient Park is $59,369, with families comprising 2 earners (2,179) having the highest median family income of $81,151, while families with 1 earner (2,755) have the lowest median family income of $40,383, accounting for 33.5% and 42.3% of families, respectively.
| Number of Earners | # Families | Median Income |
| No Earners | 738 (11.3%) | $41,071 |
| 1 Earner | 2,755 (42.3%) | $40,383 |
| 2 Earners | 2,179 (33.5%) | $81,151 |
| 3+ Earners | 834 (12.8%) | $79,924 |
| Total | 6,506 (100.0%) | $59,369 |
Household Income in East Lake Orient Park
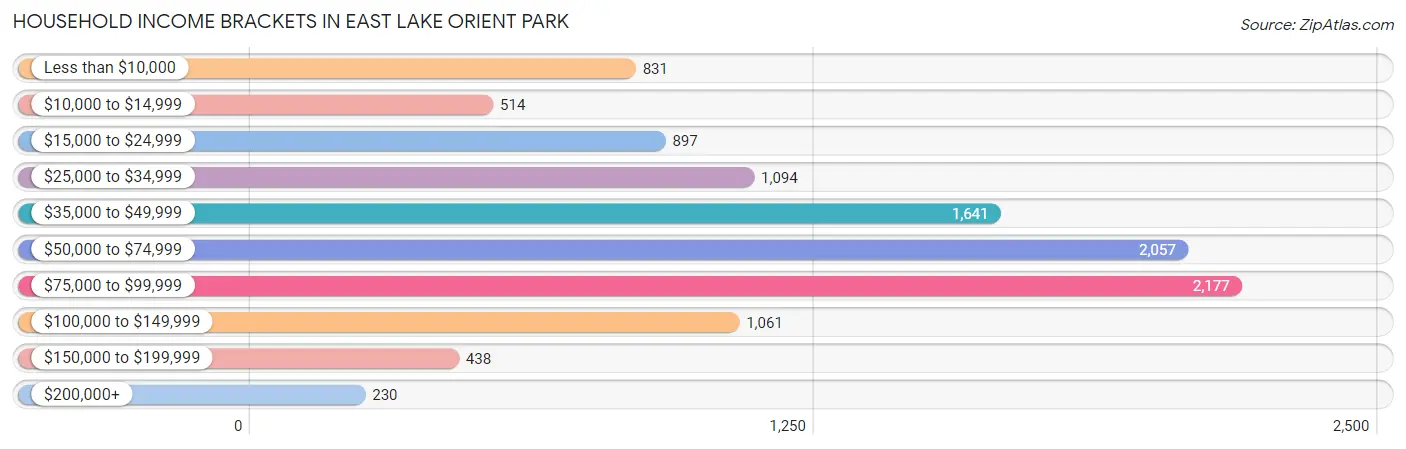
Household Income Brackets in East Lake Orient Park
With 2,177 households falling in the category, the $75,000 to $99,999 income range is the most frequent in East Lake Orient Park, accounting for 19.9% of all households. In contrast, only 230 households (2.1%) fall into the $200,000+ income bracket, making it the least populous group.
| Income Bracket | # Households | % Households |
| Less than $10,000 | 831 | 7.6% |
| $10,000 to $14,999 | 514 | 4.7% |
| $15,000 to $24,999 | 897 | 8.2% |
| $25,000 to $34,999 | 1,094 | 10.0% |
| $35,000 to $49,999 | 1,641 | 15.0% |
| $50,000 to $74,999 | 2,057 | 18.8% |
| $75,000 to $99,999 | 2,177 | 19.9% |
| $100,000 to $149,999 | 1,061 | 9.7% |
| $150,000 to $199,999 | 438 | 4.0% |
| $200,000+ | 230 | 2.1% |
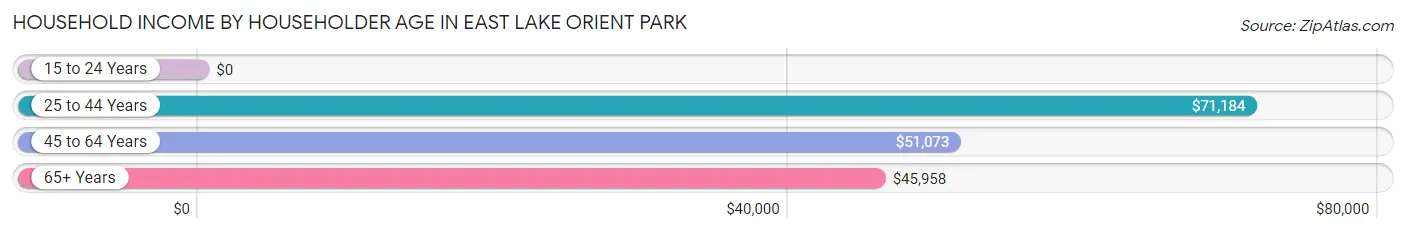
Household Income by Householder Age in East Lake Orient Park
The median household income in East Lake Orient Park is $56,401, with the highest median household income of $71,184 found in the 25 to 44 years age bracket for the primary householder. A total of 4,325 households (39.5%) fall into this category. Meanwhile, the 15 to 24 years age bracket for the primary householder has the lowest median household income of $0, with 576 households (5.3%) in this group.
| Income Bracket | # Households | Median Income |
| 15 to 24 Years | 576 (5.3%) | $0 |
| 25 to 44 Years | 4,325 (39.5%) | $71,184 |
| 45 to 64 Years | 3,933 (35.9%) | $51,073 |
| 65+ Years | 2,106 (19.3%) | $45,958 |
| Total | 10,940 (100.0%) | $56,401 |
Poverty in East Lake Orient Park
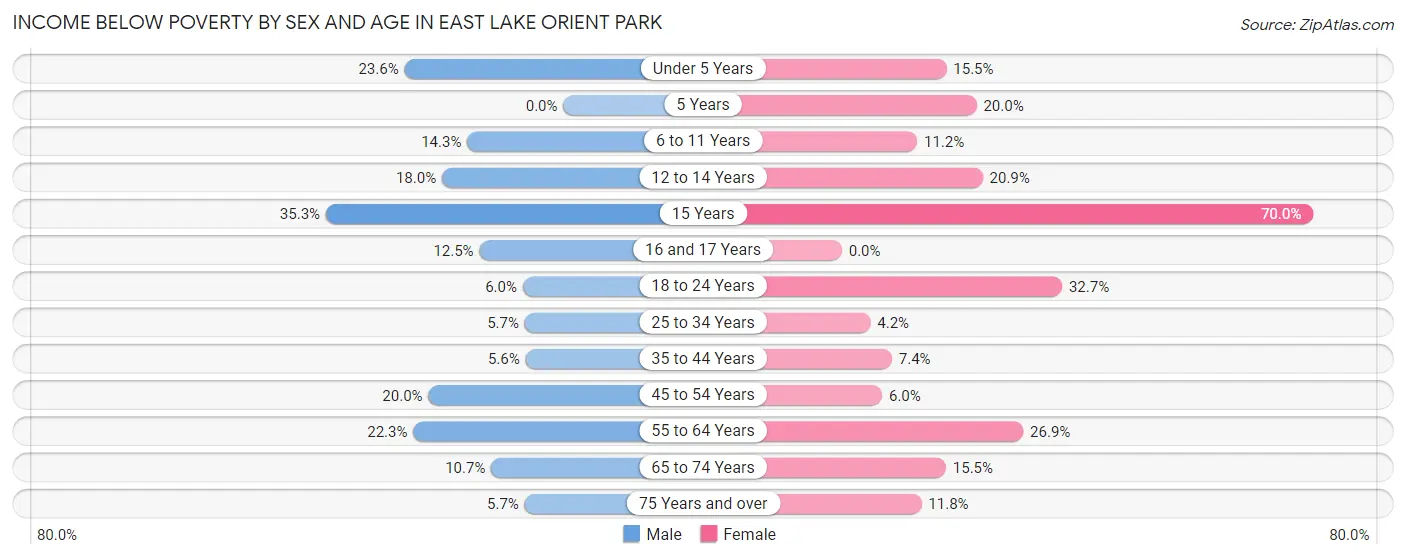
Income Below Poverty by Sex and Age in East Lake Orient Park
With 13.1% poverty level for males and 14.6% for females among the residents of East Lake Orient Park, 15 year old males and 15 year old females are the most vulnerable to poverty, with 110 males (35.3%) and 21 females (70.0%) in their respective age groups living below the poverty level.
| Age Bracket | Male | Female |
| Under 5 Years | 255 (23.6%) | 128 (15.5%) |
| 5 Years | 0 (0.0%) | 72 (20.0%) |
| 6 to 11 Years | 212 (14.3%) | 153 (11.2%) |
| 12 to 14 Years | 60 (18.0%) | 152 (20.9%) |
| 15 Years | 110 (35.3%) | 21 (70.0%) |
| 16 and 17 Years | 44 (12.5%) | 0 (0.0%) |
| 18 to 24 Years | 79 (6.0%) | 549 (32.7%) |
| 25 to 34 Years | 142 (5.7%) | 112 (4.2%) |
| 35 to 44 Years | 108 (5.6%) | 138 (7.4%) |
| 45 to 54 Years | 387 (20.0%) | 95 (6.0%) |
| 55 to 64 Years | 325 (22.3%) | 510 (26.9%) |
| 65 to 74 Years | 72 (10.7%) | 204 (15.4%) |
| 75 Years and over | 22 (5.7%) | 85 (11.8%) |
| Total | 1,816 (13.1%) | 2,219 (14.6%) |
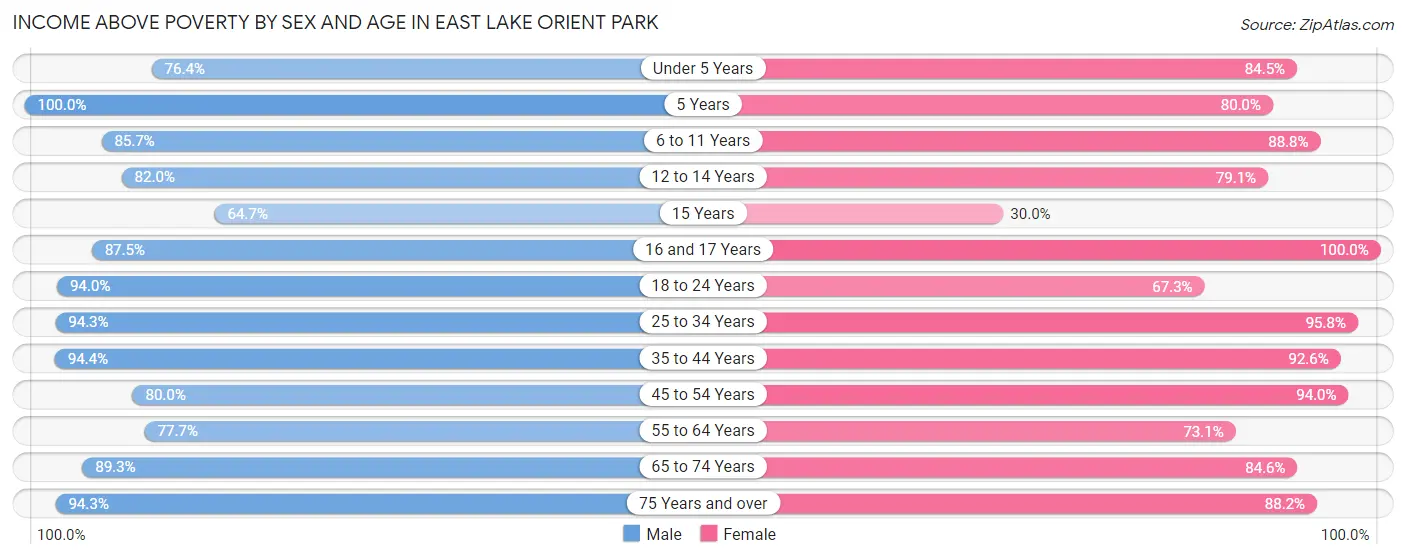
Income Above Poverty by Sex and Age in East Lake Orient Park
According to the poverty statistics in East Lake Orient Park, males aged 5 years and females aged 16 and 17 years are the age groups that are most secure financially, with 100.0% of males and 100.0% of females in these age groups living above the poverty line.
| Age Bracket | Male | Female |
| Under 5 Years | 826 (76.4%) | 696 (84.5%) |
| 5 Years | 187 (100.0%) | 288 (80.0%) |
| 6 to 11 Years | 1,274 (85.7%) | 1,216 (88.8%) |
| 12 to 14 Years | 273 (82.0%) | 575 (79.1%) |
| 15 Years | 202 (64.7%) | 9 (30.0%) |
| 16 and 17 Years | 309 (87.5%) | 174 (100.0%) |
| 18 to 24 Years | 1,234 (94.0%) | 1,130 (67.3%) |
| 25 to 34 Years | 2,342 (94.3%) | 2,527 (95.8%) |
| 35 to 44 Years | 1,818 (94.4%) | 1,720 (92.6%) |
| 45 to 54 Years | 1,544 (80.0%) | 1,494 (94.0%) |
| 55 to 64 Years | 1,134 (77.7%) | 1,384 (73.1%) |
| 65 to 74 Years | 600 (89.3%) | 1,116 (84.6%) |
| 75 Years and over | 361 (94.3%) | 634 (88.2%) |
| Total | 12,104 (87.0%) | 12,963 (85.4%) |
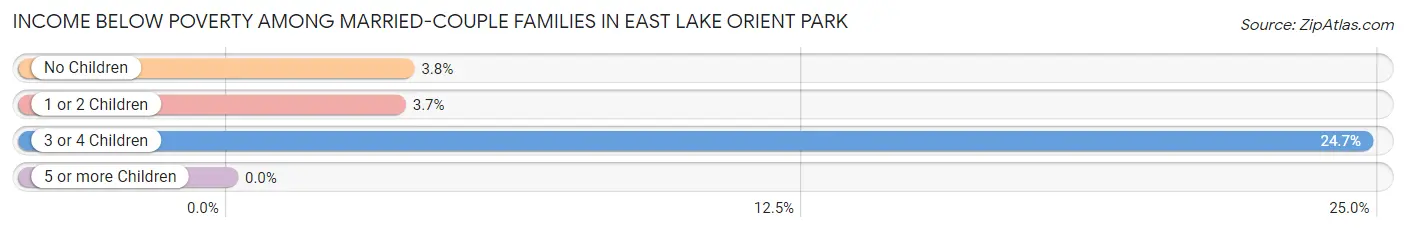
Income Below Poverty Among Married-Couple Families in East Lake Orient Park
The poverty statistics for married-couple families in East Lake Orient Park show that 5.4% or 161 of the total 3,001 families live below the poverty line. Families with 3 or 4 children have the highest poverty rate of 24.7%, comprising of 60 families. On the other hand, families with 5 or more children have the lowest poverty rate of 0.0%, which includes 0 families.
| Children | Above Poverty | Below Poverty |
| No Children | 1,428 (96.2%) | 57 (3.8%) |
| 1 or 2 Children | 1,160 (96.4%) | 44 (3.6%) |
| 3 or 4 Children | 183 (75.3%) | 60 (24.7%) |
| 5 or more Children | 69 (100.0%) | 0 (0.0%) |
| Total | 2,840 (94.6%) | 161 (5.4%) |
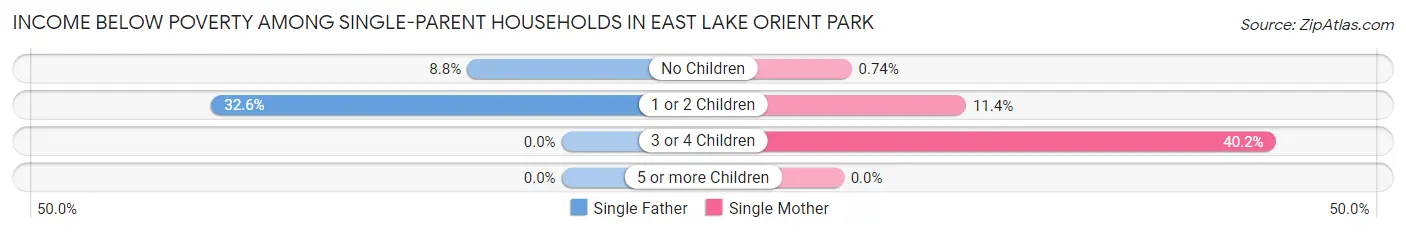
Income Below Poverty Among Single-Parent Households in East Lake Orient Park
According to the poverty data in East Lake Orient Park, 18.8% or 163 single-father households and 11.0% or 291 single-mother households are living below the poverty line. Among single-father households, those with 1 or 2 children have the highest poverty rate, with 119 households (32.6%) experiencing poverty. Likewise, among single-mother households, those with 3 or 4 children have the highest poverty rate, with 150 households (40.2%) falling below the poverty line.
| Children | Single Father | Single Mother |
| No Children | 44 (8.8%) | 7 (0.7%) |
| 1 or 2 Children | 119 (32.6%) | 134 (11.4%) |
| 3 or 4 Children | 0 (0.0%) | 150 (40.2%) |
| 5 or more Children | 0 (0.0%) | 0 (0.0%) |
| Total | 163 (18.8%) | 291 (11.0%) |
Income Below Poverty Among Married-Couple vs Single-Parent Households in East Lake Orient Park
The poverty data for East Lake Orient Park shows that 161 of the married-couple family households (5.4%) and 454 of the single-parent households (13.0%) are living below the poverty level. Within the married-couple family households, those with 3 or 4 children have the highest poverty rate, with 60 households (24.7%) falling below the poverty line. Among the single-parent households, those with 3 or 4 children have the highest poverty rate, with 150 household (40.2%) living below poverty.
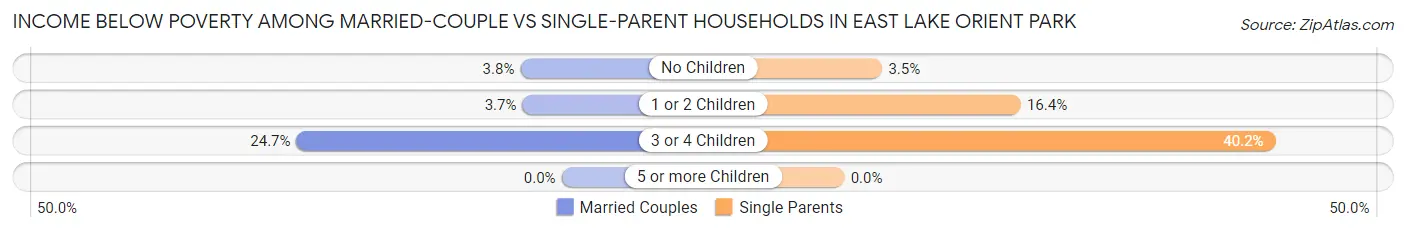
| Children | Married-Couple Families | Single-Parent Households |
| No Children | 57 (3.8%) | 51 (3.5%) |
| 1 or 2 Children | 44 (3.6%) | 253 (16.4%) |
| 3 or 4 Children | 60 (24.7%) | 150 (40.2%) |
| 5 or more Children | 0 (0.0%) | 0 (0.0%) |
| Total | 161 (5.4%) | 454 (13.0%) |
Employment Characteristics in East Lake Orient Park
Employment by Class of Employer in East Lake Orient Park
Among the 14,386 employed individuals in East Lake Orient Park, private company employees (10,666 | 74.1%), not-for-profit organizations (1,154 | 8.0%), and local government employees (877 | 6.1%) make up the most common classes of employment.
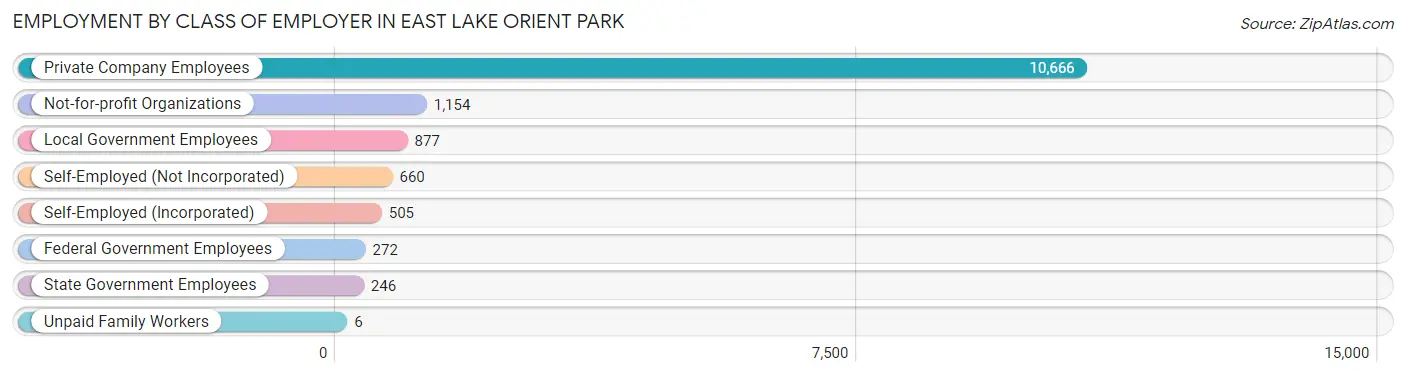
| Employer Class | # Employees | % Employees |
| Private Company Employees | 10,666 | 74.1% |
| Self-Employed (Incorporated) | 505 | 3.5% |
| Self-Employed (Not Incorporated) | 660 | 4.6% |
| Not-for-profit Organizations | 1,154 | 8.0% |
| Local Government Employees | 877 | 6.1% |
| State Government Employees | 246 | 1.7% |
| Federal Government Employees | 272 | 1.9% |
| Unpaid Family Workers | 6 | 0.0% |
| Total | 14,386 | 100.0% |
Employment Status by Age in East Lake Orient Park
According to the labor force statistics for East Lake Orient Park, out of the total population over 16 years of age (22,396), 69.9% or 15,655 individuals are in the labor force, with 7.2% or 1,127 of them unemployed. The age group with the highest labor force participation rate is 35 to 44 years, with 92.2% or 3,489 individuals in the labor force. Within the labor force, the 16 to 19 years age range has the highest percentage of unemployed individuals, with 31.6% or 176 of them being unemployed.
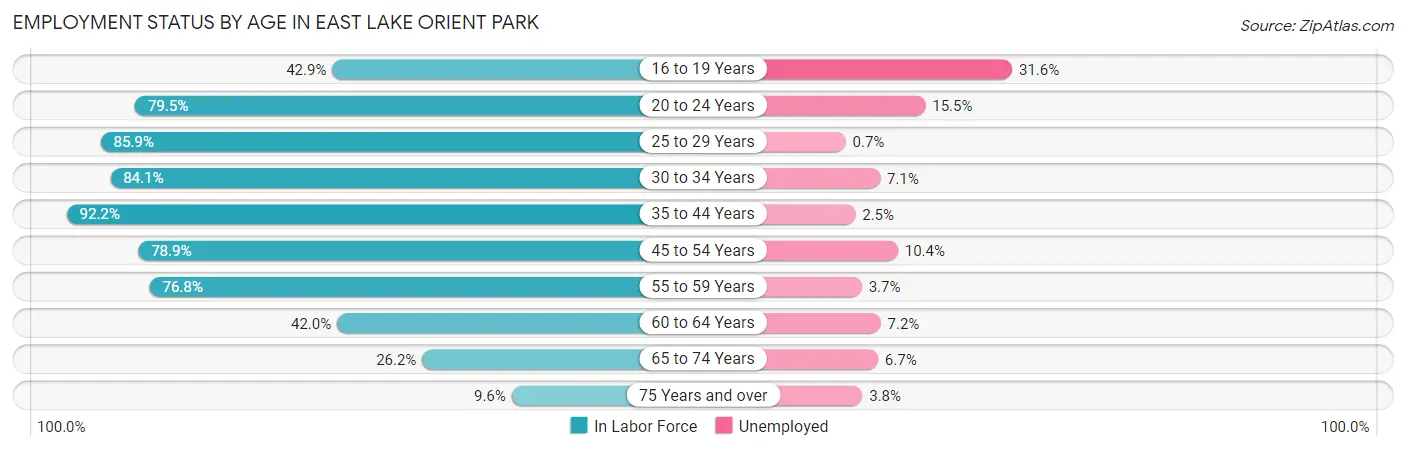
| Age Bracket | In Labor Force | Unemployed |
| 16 to 19 Years | 557 (42.9%) | 176 (31.6%) |
| 20 to 24 Years | 1,768 (79.5%) | 274 (15.5%) |
| 25 to 29 Years | 2,242 (85.9%) | 16 (0.7%) |
| 30 to 34 Years | 2,113 (84.1%) | 150 (7.1%) |
| 35 to 44 Years | 3,489 (92.2%) | 87 (2.5%) |
| 45 to 54 Years | 2,777 (78.9%) | 289 (10.4%) |
| 55 to 59 Years | 1,462 (76.8%) | 54 (3.7%) |
| 60 to 64 Years | 609 (42.0%) | 44 (7.2%) |
| 65 to 74 Years | 522 (26.2%) | 35 (6.7%) |
| 75 Years and over | 106 (9.6%) | 4 (3.8%) |
| Total | 15,655 (69.9%) | 1,127 (7.2%) |
Employment Status by Educational Attainment in East Lake Orient Park
According to labor force statistics for East Lake Orient Park, 80.4% of individuals (12,687) out of the total population between 25 and 64 years of age (15,780) are in the labor force, with 5.1% or 647 of them being unemployed. The group with the highest labor force participation rate are those with the educational attainment of bachelor's degree or higher, with 84.2% or 2,747 individuals in the labor force. Within the labor force, individuals with less than high school education have the highest percentage of unemployment, with 10.6% or 173 of them being unemployed.
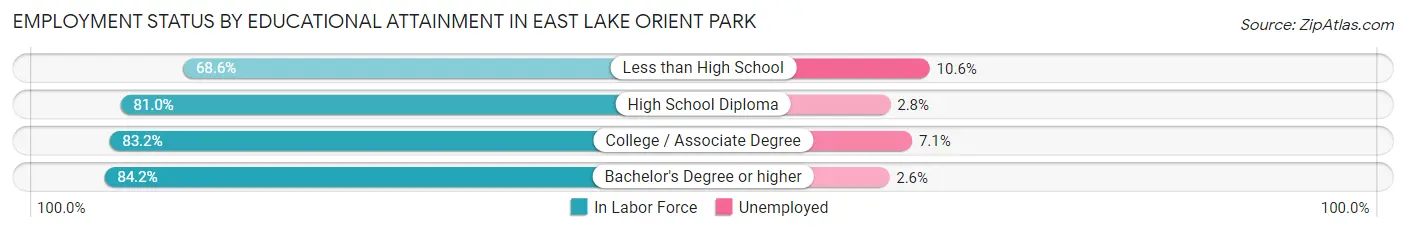
| Educational Attainment | In Labor Force | Unemployed |
| Less than High School | 1,634 (68.6%) | 252 (10.6%) |
| High School Diploma | 4,446 (81.0%) | 154 (2.8%) |
| College / Associate Degree | 3,866 (83.2%) | 330 (7.1%) |
| Bachelor's Degree or higher | 2,747 (84.2%) | 85 (2.6%) |
| Total | 12,687 (80.4%) | 805 (5.1%) |
Employment Occupations by Sex in East Lake Orient Park
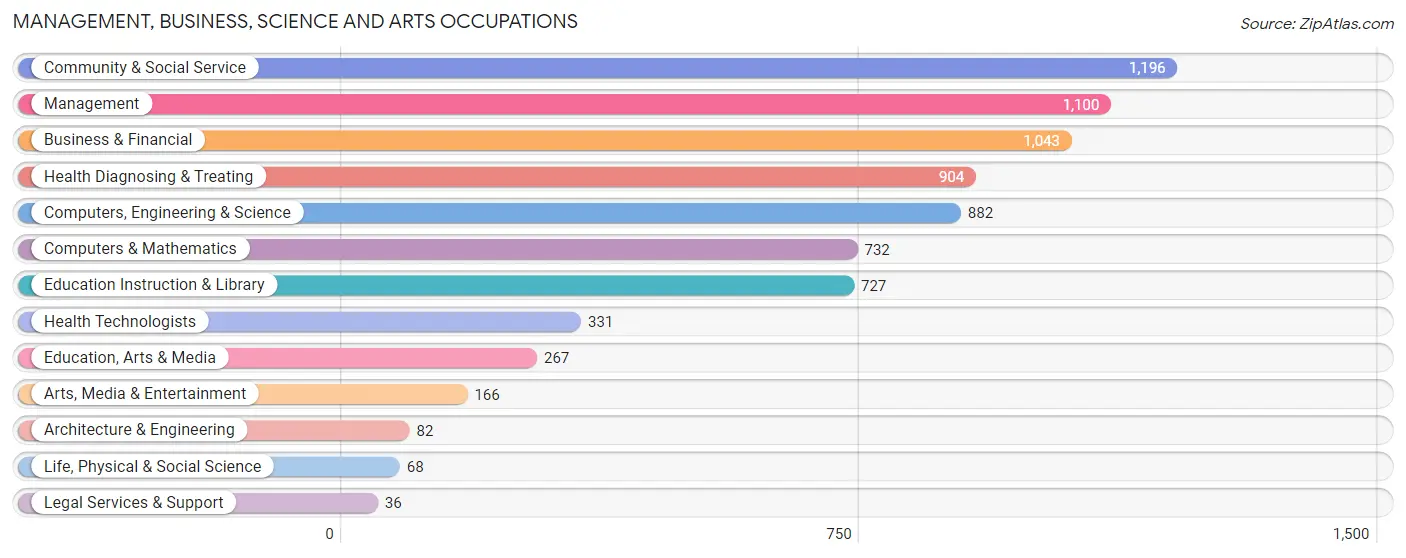
Management, Business, Science and Arts Occupations
The most common Management, Business, Science and Arts occupations in East Lake Orient Park are Community & Social Service (1,196 | 8.3%), Management (1,100 | 7.6%), Business & Financial (1,043 | 7.2%), Health Diagnosing & Treating (904 | 6.3%), and Computers, Engineering & Science (882 | 6.1%).
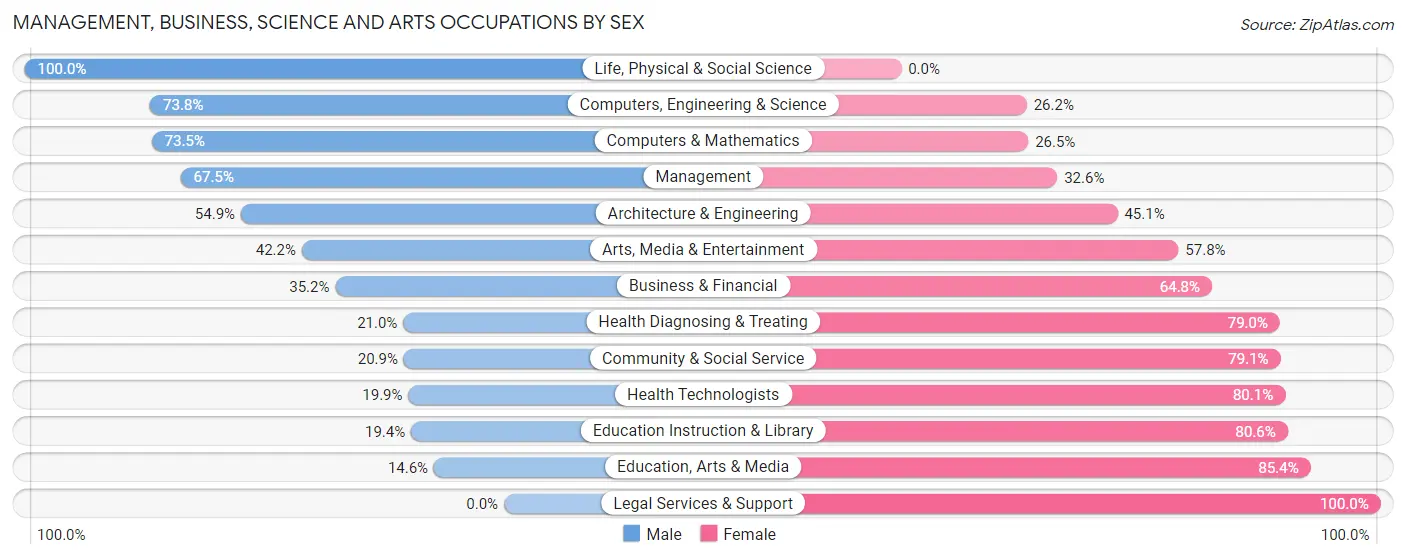
Management, Business, Science and Arts Occupations by Sex
Within the Management, Business, Science and Arts occupations in East Lake Orient Park, the most male-oriented occupations are Life, Physical & Social Science (100.0%), Computers, Engineering & Science (73.8%), and Computers & Mathematics (73.5%), while the most female-oriented occupations are Legal Services & Support (100.0%), Education, Arts & Media (85.4%), and Education Instruction & Library (80.6%).
| Occupation | Male | Female |
| Management | 742 (67.4%) | 358 (32.6%) |
| Business & Financial | 367 (35.2%) | 676 (64.8%) |
| Computers, Engineering & Science | 651 (73.8%) | 231 (26.2%) |
| Computers & Mathematics | 538 (73.5%) | 194 (26.5%) |
| Architecture & Engineering | 45 (54.9%) | 37 (45.1%) |
| Life, Physical & Social Science | 68 (100.0%) | 0 (0.0%) |
| Community & Social Service | 250 (20.9%) | 946 (79.1%) |
| Education, Arts & Media | 39 (14.6%) | 228 (85.4%) |
| Legal Services & Support | 0 (0.0%) | 36 (100.0%) |
| Education Instruction & Library | 141 (19.4%) | 586 (80.6%) |
| Arts, Media & Entertainment | 70 (42.2%) | 96 (57.8%) |
| Health Diagnosing & Treating | 190 (21.0%) | 714 (79.0%) |
| Health Technologists | 66 (19.9%) | 265 (80.1%) |
| Total (Category) | 2,200 (42.9%) | 2,925 (57.1%) |
| Total (Overall) | 6,934 (48.0%) | 7,503 (52.0%) |
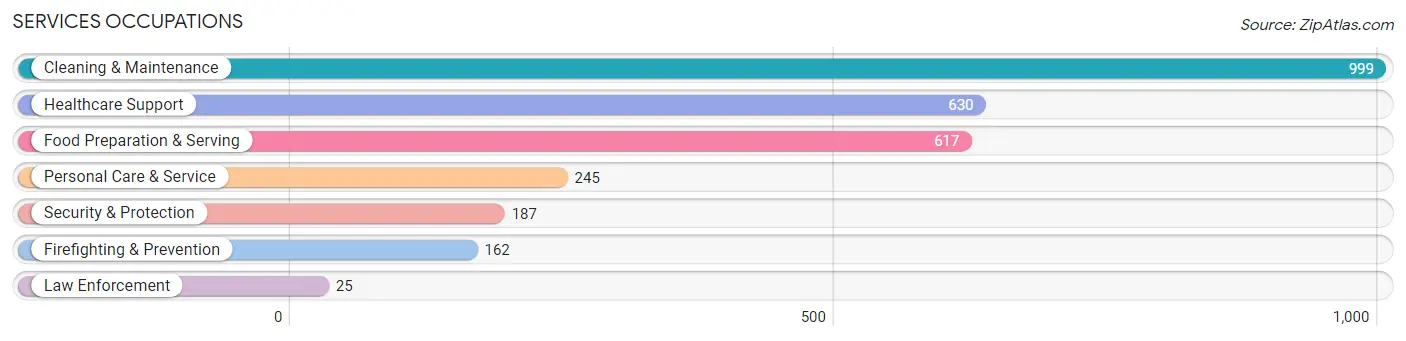
Services Occupations
The most common Services occupations in East Lake Orient Park are Cleaning & Maintenance (999 | 6.9%), Healthcare Support (630 | 4.4%), Food Preparation & Serving (617 | 4.3%), Personal Care & Service (245 | 1.7%), and Security & Protection (187 | 1.3%).
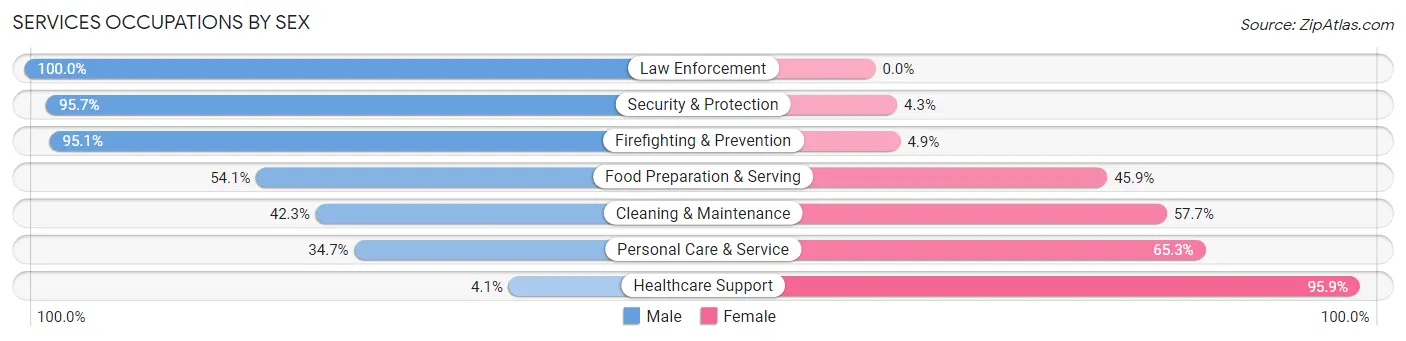
Services Occupations by Sex
Within the Services occupations in East Lake Orient Park, the most male-oriented occupations are Law Enforcement (100.0%), Security & Protection (95.7%), and Firefighting & Prevention (95.1%), while the most female-oriented occupations are Healthcare Support (95.9%), Personal Care & Service (65.3%), and Cleaning & Maintenance (57.7%).
| Occupation | Male | Female |
| Healthcare Support | 26 (4.1%) | 604 (95.9%) |
| Security & Protection | 179 (95.7%) | 8 (4.3%) |
| Firefighting & Prevention | 154 (95.1%) | 8 (4.9%) |
| Law Enforcement | 25 (100.0%) | 0 (0.0%) |
| Food Preparation & Serving | 334 (54.1%) | 283 (45.9%) |
| Cleaning & Maintenance | 423 (42.3%) | 576 (57.7%) |
| Personal Care & Service | 85 (34.7%) | 160 (65.3%) |
| Total (Category) | 1,047 (39.1%) | 1,631 (60.9%) |
| Total (Overall) | 6,934 (48.0%) | 7,503 (52.0%) |
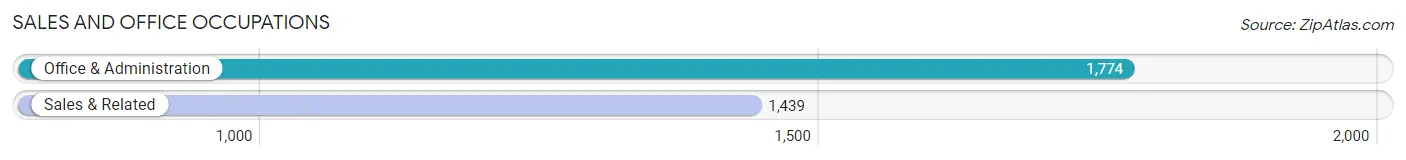
Sales and Office Occupations
The most common Sales and Office occupations in East Lake Orient Park are Office & Administration (1,774 | 12.3%), and Sales & Related (1,439 | 10.0%).
Sales and Office Occupations by Sex
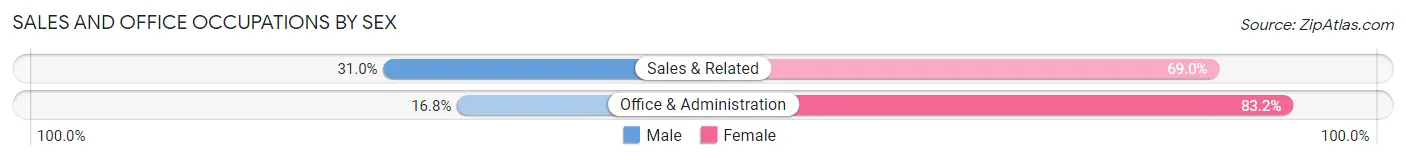
| Occupation | Male | Female |
| Sales & Related | 446 (31.0%) | 993 (69.0%) |
| Office & Administration | 298 (16.8%) | 1,476 (83.2%) |
| Total (Category) | 744 (23.2%) | 2,469 (76.8%) |
| Total (Overall) | 6,934 (48.0%) | 7,503 (52.0%) |
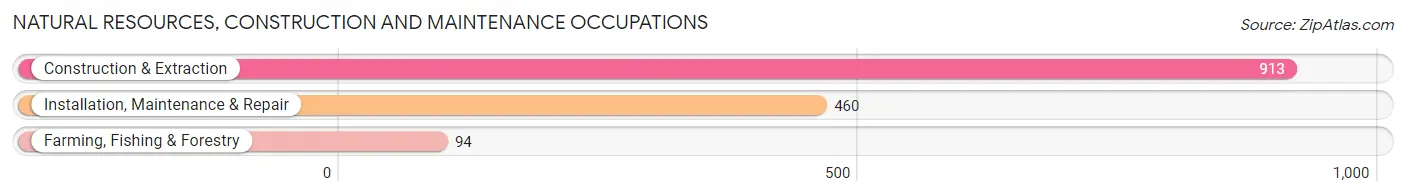
Natural Resources, Construction and Maintenance Occupations
The most common Natural Resources, Construction and Maintenance occupations in East Lake Orient Park are Construction & Extraction (913 | 6.3%), Installation, Maintenance & Repair (460 | 3.2%), and Farming, Fishing & Forestry (94 | 0.6%).
Natural Resources, Construction and Maintenance Occupations by Sex
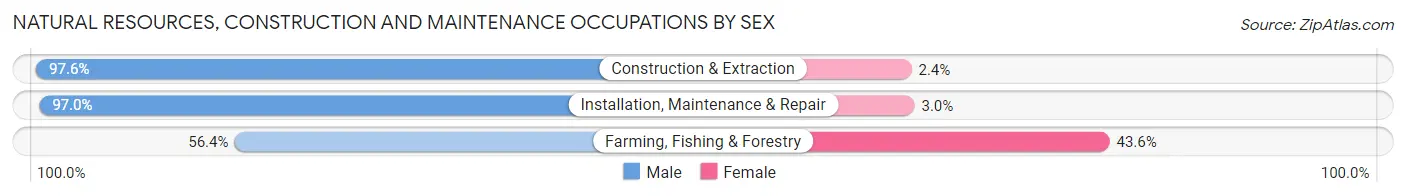
| Occupation | Male | Female |
| Farming, Fishing & Forestry | 53 (56.4%) | 41 (43.6%) |
| Construction & Extraction | 891 (97.6%) | 22 (2.4%) |
| Installation, Maintenance & Repair | 446 (97.0%) | 14 (3.0%) |
| Total (Category) | 1,390 (94.8%) | 77 (5.2%) |
| Total (Overall) | 6,934 (48.0%) | 7,503 (52.0%) |
Production, Transportation and Moving Occupations
The most common Production, Transportation and Moving occupations in East Lake Orient Park are Transportation (721 | 5.0%), Material Moving (719 | 5.0%), and Production (514 | 3.6%).
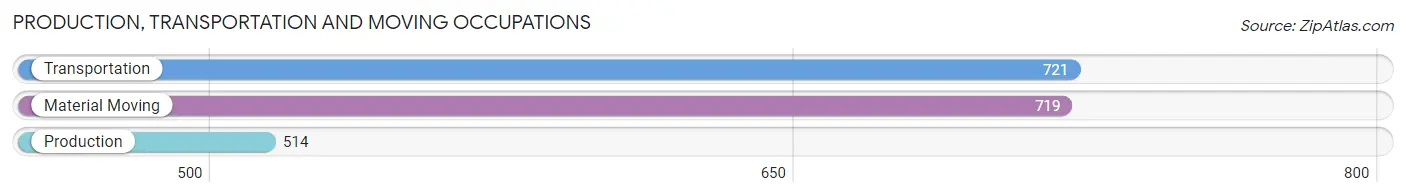
Production, Transportation and Moving Occupations by Sex
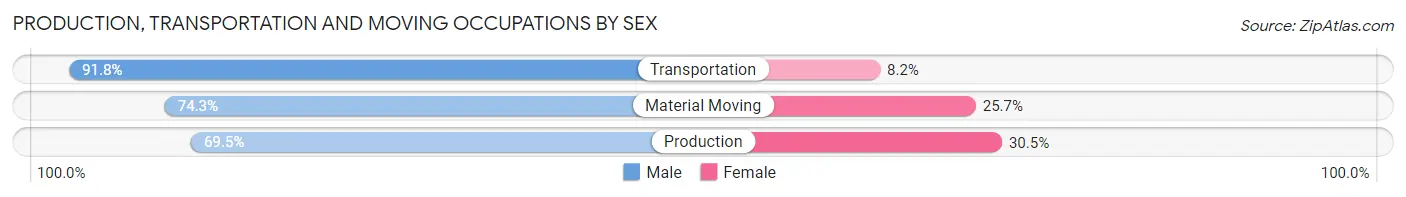
| Occupation | Male | Female |
| Production | 357 (69.5%) | 157 (30.5%) |
| Transportation | 662 (91.8%) | 59 (8.2%) |
| Material Moving | 534 (74.3%) | 185 (25.7%) |
| Total (Category) | 1,553 (79.5%) | 401 (20.5%) |
| Total (Overall) | 6,934 (48.0%) | 7,503 (52.0%) |
Employment Industries by Sex in East Lake Orient Park
Employment Industries in East Lake Orient Park
The major employment industries in East Lake Orient Park include Health Care & Social Assistance (1,882 | 13.0%), Administrative & Support (1,555 | 10.8%), Retail Trade (1,481 | 10.3%), Construction (1,384 | 9.6%), and Professional & Scientific (1,143 | 7.9%).

Employment Industries by Sex in East Lake Orient Park
The East Lake Orient Park industries that see more men than women are Enterprise Management (100.0%), Construction (90.0%), and Wholesale Trade (84.5%), whereas the industries that tend to have a higher number of women are Arts, Entertainment & Recreation (81.9%), Health Care & Social Assistance (79.0%), and Public Administration (78.8%).
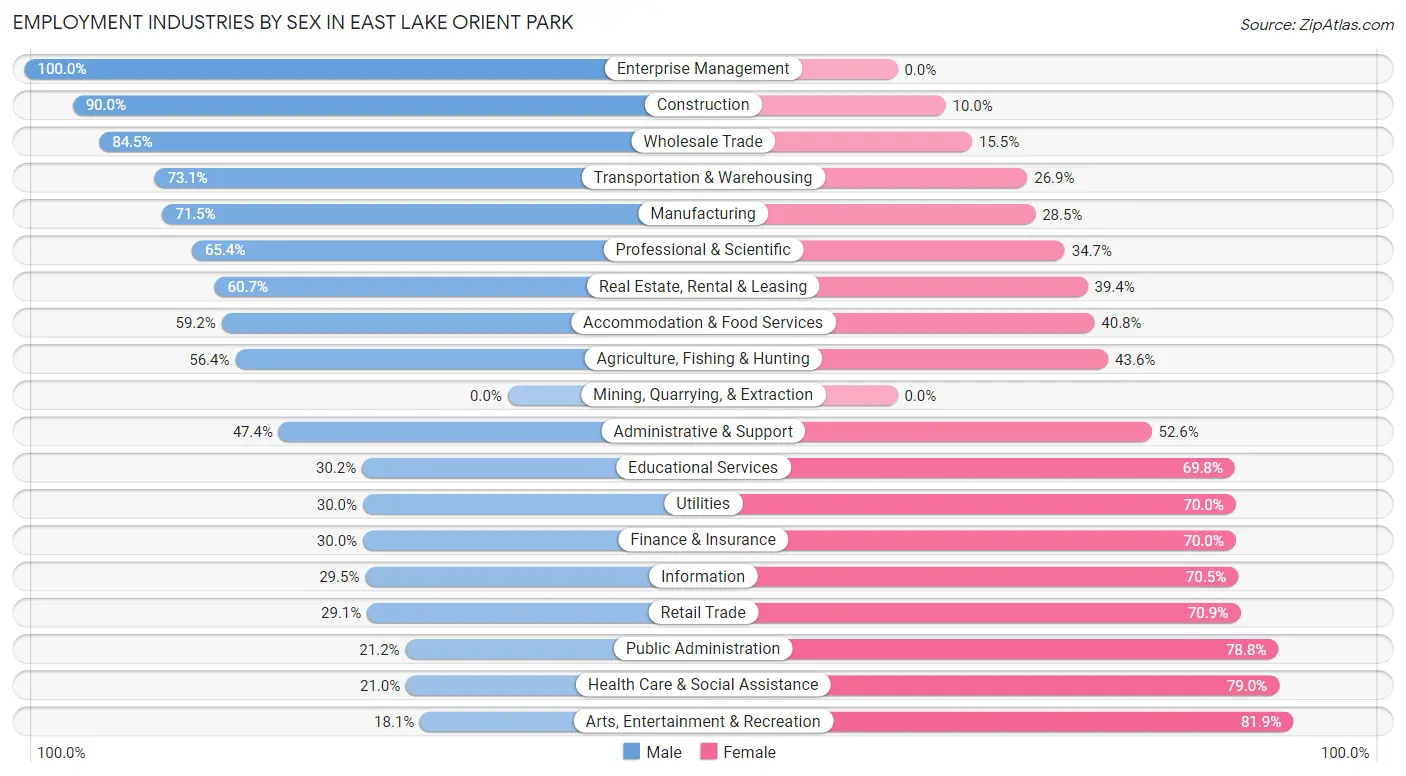
| Industry | Male | Female |
| Agriculture, Fishing & Hunting | 53 (56.4%) | 41 (43.6%) |
| Mining, Quarrying, & Extraction | 0 (0.0%) | 0 (0.0%) |
| Construction | 1,246 (90.0%) | 138 (10.0%) |
| Manufacturing | 406 (71.5%) | 162 (28.5%) |
| Wholesale Trade | 257 (84.5%) | 47 (15.5%) |
| Retail Trade | 431 (29.1%) | 1,050 (70.9%) |
| Transportation & Warehousing | 536 (73.1%) | 197 (26.9%) |
| Utilities | 15 (30.0%) | 35 (70.0%) |
| Information | 92 (29.5%) | 220 (70.5%) |
| Finance & Insurance | 331 (30.0%) | 773 (70.0%) |
| Real Estate, Rental & Leasing | 279 (60.7%) | 181 (39.4%) |
| Professional & Scientific | 747 (65.3%) | 396 (34.6%) |
| Enterprise Management | 12 (100.0%) | 0 (0.0%) |
| Administrative & Support | 737 (47.4%) | 818 (52.6%) |
| Educational Services | 288 (30.2%) | 667 (69.8%) |
| Health Care & Social Assistance | 396 (21.0%) | 1,486 (79.0%) |
| Arts, Entertainment & Recreation | 89 (18.1%) | 402 (81.9%) |
| Accommodation & Food Services | 433 (59.2%) | 298 (40.8%) |
| Public Administration | 90 (21.2%) | 335 (78.8%) |
| Total | 6,934 (48.0%) | 7,503 (52.0%) |
Education in East Lake Orient Park
School Enrollment in East Lake Orient Park
The most common levels of schooling among the 7,393 students in East Lake Orient Park are elementary school (2,206 | 29.8%), middle school (1,445 | 19.6%), and college / undergraduate (1,306 | 17.7%).
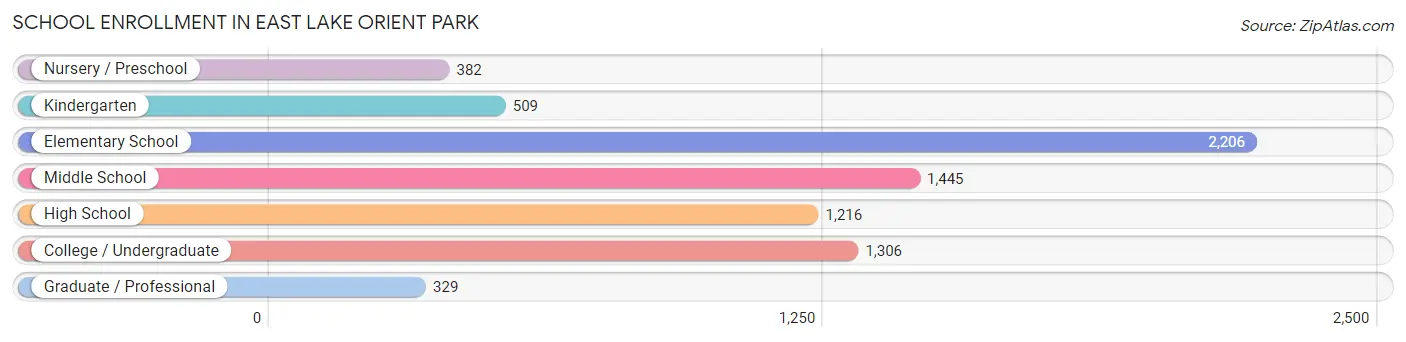
| School Level | # Students | % Students |
| Nursery / Preschool | 382 | 5.2% |
| Kindergarten | 509 | 6.9% |
| Elementary School | 2,206 | 29.8% |
| Middle School | 1,445 | 19.6% |
| High School | 1,216 | 16.5% |
| College / Undergraduate | 1,306 | 17.7% |
| Graduate / Professional | 329 | 4.4% |
| Total | 7,393 | 100.0% |
School Enrollment by Age by Funding Source in East Lake Orient Park
Out of a total of 7,393 students who are enrolled in schools in East Lake Orient Park, 1,235 (16.7%) attend a private institution, while the remaining 6,158 (83.3%) are enrolled in public schools. The age group of 10 to 14 year olds has the highest likelihood of being enrolled in private schools, with 555 (30.0% in the age bracket) enrolled. Conversely, the age group of 18 to 19 year olds has the lowest likelihood of being enrolled in a private school, with 371 (100.0% in the age bracket) attending a public institution.
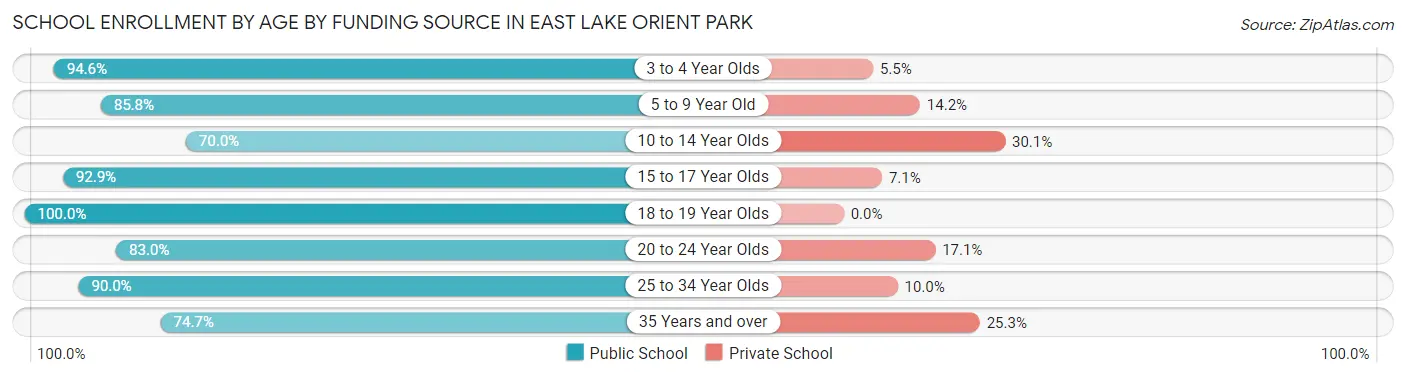
| Age Bracket | Public School | Private School |
| 3 to 4 Year Olds | 295 (94.6%) | 17 (5.4%) |
| 5 to 9 Year Old | 2,188 (85.8%) | 362 (14.2%) |
| 10 to 14 Year Olds | 1,292 (70.0%) | 555 (30.0%) |
| 15 to 17 Year Olds | 806 (92.9%) | 62 (7.1%) |
| 18 to 19 Year Olds | 371 (100.0%) | 0 (0.0%) |
| 20 to 24 Year Olds | 540 (83.0%) | 111 (17.1%) |
| 25 to 34 Year Olds | 448 (90.0%) | 50 (10.0%) |
| 35 Years and over | 221 (74.7%) | 75 (25.3%) |
| Total | 6,158 (83.3%) | 1,235 (16.7%) |
Educational Attainment by Field of Study in East Lake Orient Park
Business (764 | 18.2%), science & technology (544 | 13.0%), education (420 | 10.0%), computers & mathematics (396 | 9.4%), and communications (385 | 9.2%) are the most common fields of study among 4,199 individuals in East Lake Orient Park who have obtained a bachelor's degree or higher.
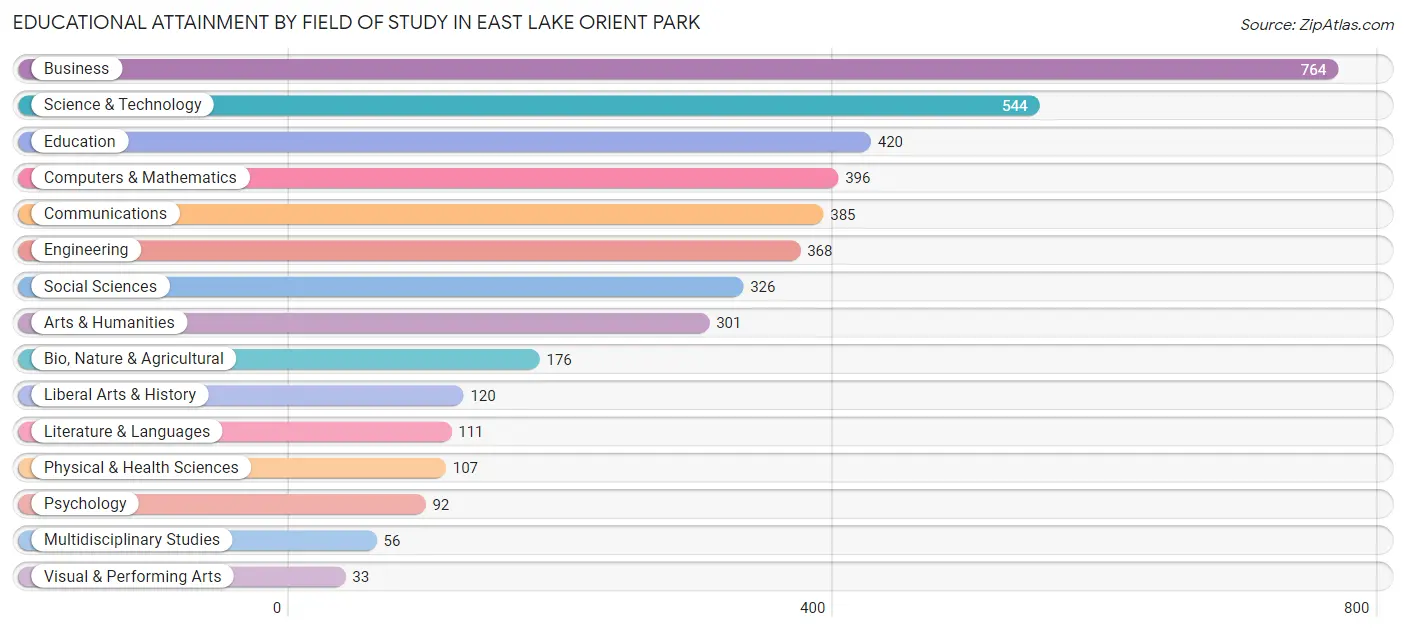
| Field of Study | # Graduates | % Graduates |
| Computers & Mathematics | 396 | 9.4% |
| Bio, Nature & Agricultural | 176 | 4.2% |
| Physical & Health Sciences | 107 | 2.5% |
| Psychology | 92 | 2.2% |
| Social Sciences | 326 | 7.8% |
| Engineering | 368 | 8.8% |
| Multidisciplinary Studies | 56 | 1.3% |
| Science & Technology | 544 | 13.0% |
| Business | 764 | 18.2% |
| Education | 420 | 10.0% |
| Literature & Languages | 111 | 2.6% |
| Liberal Arts & History | 120 | 2.9% |
| Visual & Performing Arts | 33 | 0.8% |
| Communications | 385 | 9.2% |
| Arts & Humanities | 301 | 7.2% |
| Total | 4,199 | 100.0% |
Transportation & Commute in East Lake Orient Park
Vehicle Availability by Sex in East Lake Orient Park
The most prevalent vehicle ownership categories in East Lake Orient Park are males with 2 vehicles (3,686, accounting for 53.2%) and females with 2 vehicles (3,177, making up 49.6%).
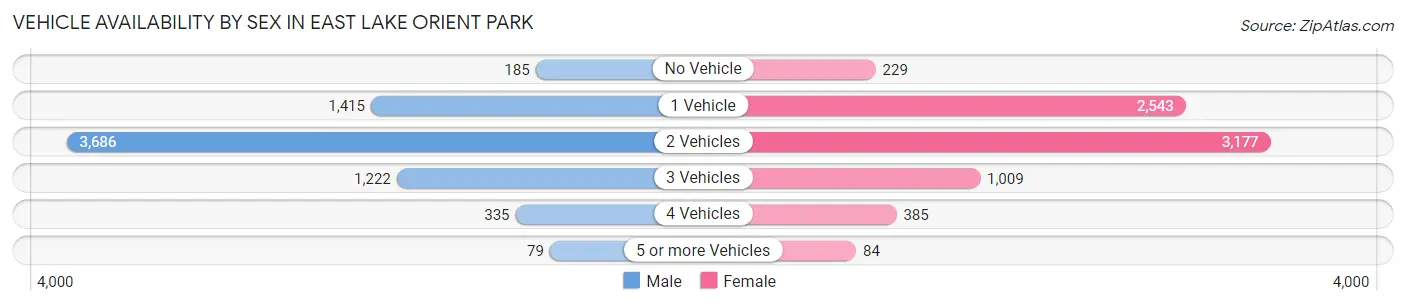
| Vehicles Available | Male | Female |
| No Vehicle | 185 (2.7%) | 229 (3.1%) |
| 1 Vehicle | 1,415 (20.4%) | 2,543 (34.2%) |
| 2 Vehicles | 3,686 (53.2%) | 3,177 (42.8%) |
| 3 Vehicles | 1,222 (17.6%) | 1,009 (13.6%) |
| 4 Vehicles | 335 (4.8%) | 385 (5.2%) |
| 5 or more Vehicles | 79 (1.1%) | 84 (1.1%) |
| Total | 6,922 (100.0%) | 7,427 (100.0%) |
Commute Time in East Lake Orient Park
The most frequently occuring commute durations in East Lake Orient Park are 15 to 19 minutes (2,286 commuters, 18.2%), 30 to 34 minutes (2,017 commuters, 16.1%), and 20 to 24 minutes (1,729 commuters, 13.8%).
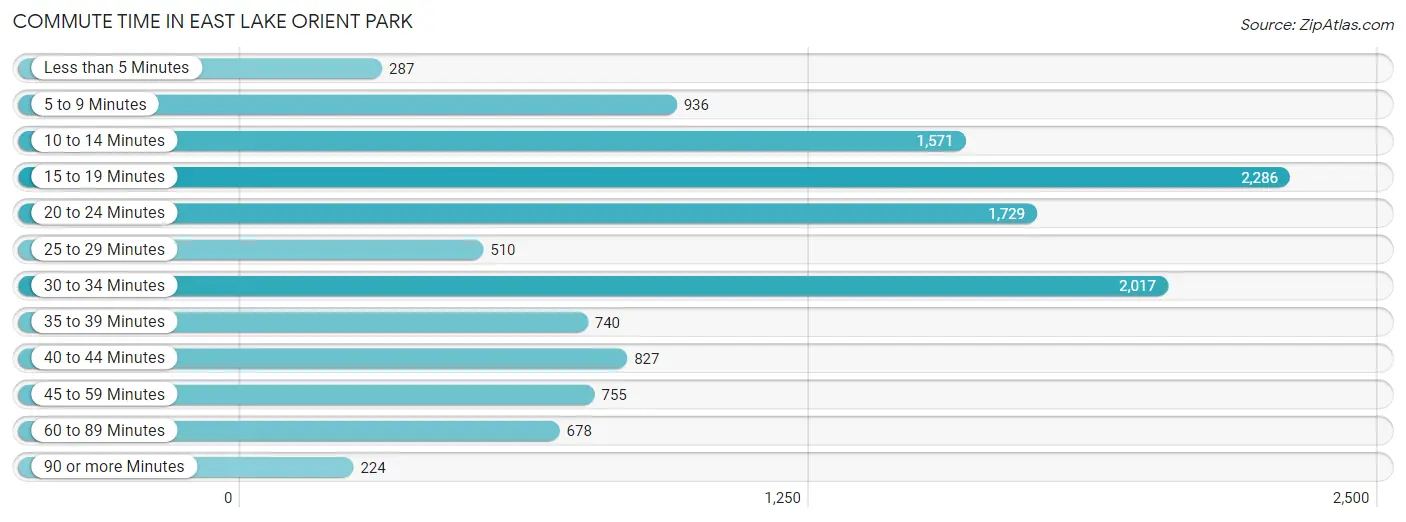
| Commute Time | # Commuters | % Commuters |
| Less than 5 Minutes | 287 | 2.3% |
| 5 to 9 Minutes | 936 | 7.4% |
| 10 to 14 Minutes | 1,571 | 12.5% |
| 15 to 19 Minutes | 2,286 | 18.2% |
| 20 to 24 Minutes | 1,729 | 13.8% |
| 25 to 29 Minutes | 510 | 4.1% |
| 30 to 34 Minutes | 2,017 | 16.1% |
| 35 to 39 Minutes | 740 | 5.9% |
| 40 to 44 Minutes | 827 | 6.6% |
| 45 to 59 Minutes | 755 | 6.0% |
| 60 to 89 Minutes | 678 | 5.4% |
| 90 or more Minutes | 224 | 1.8% |
Commute Time by Sex in East Lake Orient Park
The most common commute times in East Lake Orient Park are 15 to 19 minutes (1,134 commuters, 18.0%) for males and 15 to 19 minutes (1,152 commuters, 18.4%) for females.
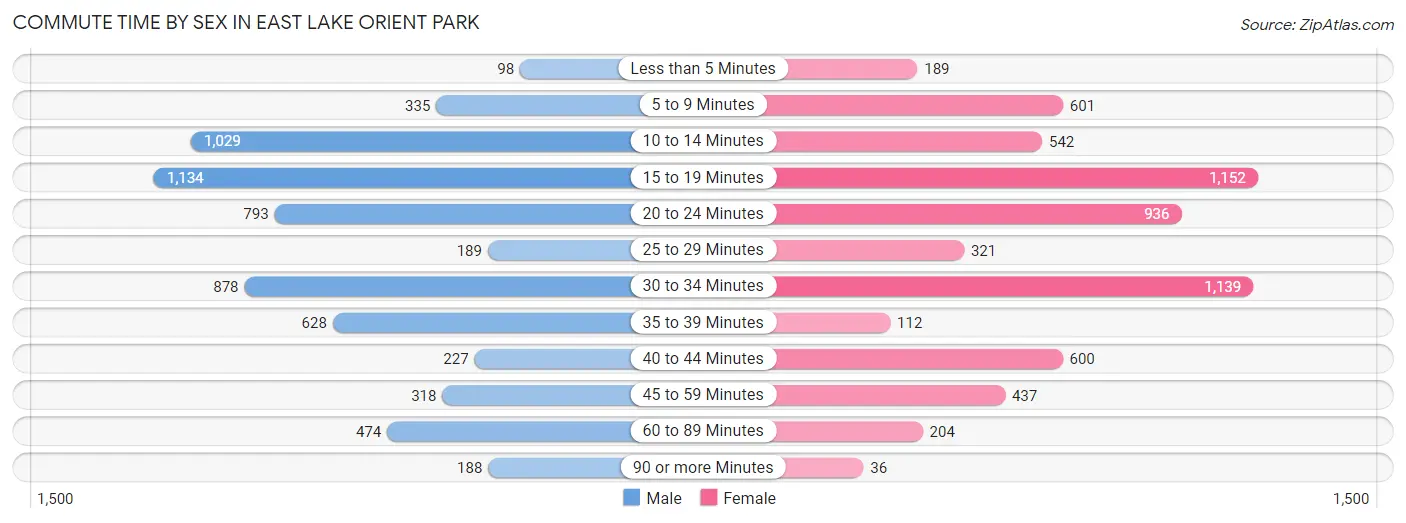
| Commute Time | Male | Female |
| Less than 5 Minutes | 98 (1.6%) | 189 (3.0%) |
| 5 to 9 Minutes | 335 (5.3%) | 601 (9.6%) |
| 10 to 14 Minutes | 1,029 (16.4%) | 542 (8.6%) |
| 15 to 19 Minutes | 1,134 (18.0%) | 1,152 (18.4%) |
| 20 to 24 Minutes | 793 (12.6%) | 936 (14.9%) |
| 25 to 29 Minutes | 189 (3.0%) | 321 (5.1%) |
| 30 to 34 Minutes | 878 (14.0%) | 1,139 (18.2%) |
| 35 to 39 Minutes | 628 (10.0%) | 112 (1.8%) |
| 40 to 44 Minutes | 227 (3.6%) | 600 (9.6%) |
| 45 to 59 Minutes | 318 (5.1%) | 437 (7.0%) |
| 60 to 89 Minutes | 474 (7.5%) | 204 (3.3%) |
| 90 or more Minutes | 188 (3.0%) | 36 (0.6%) |
Time of Departure to Work by Sex in East Lake Orient Park
The most frequent times of departure to work in East Lake Orient Park are 6:00 AM to 6:29 AM (1,003, 15.9%) for males and 5:30 AM to 5:59 AM (759, 12.1%) for females.
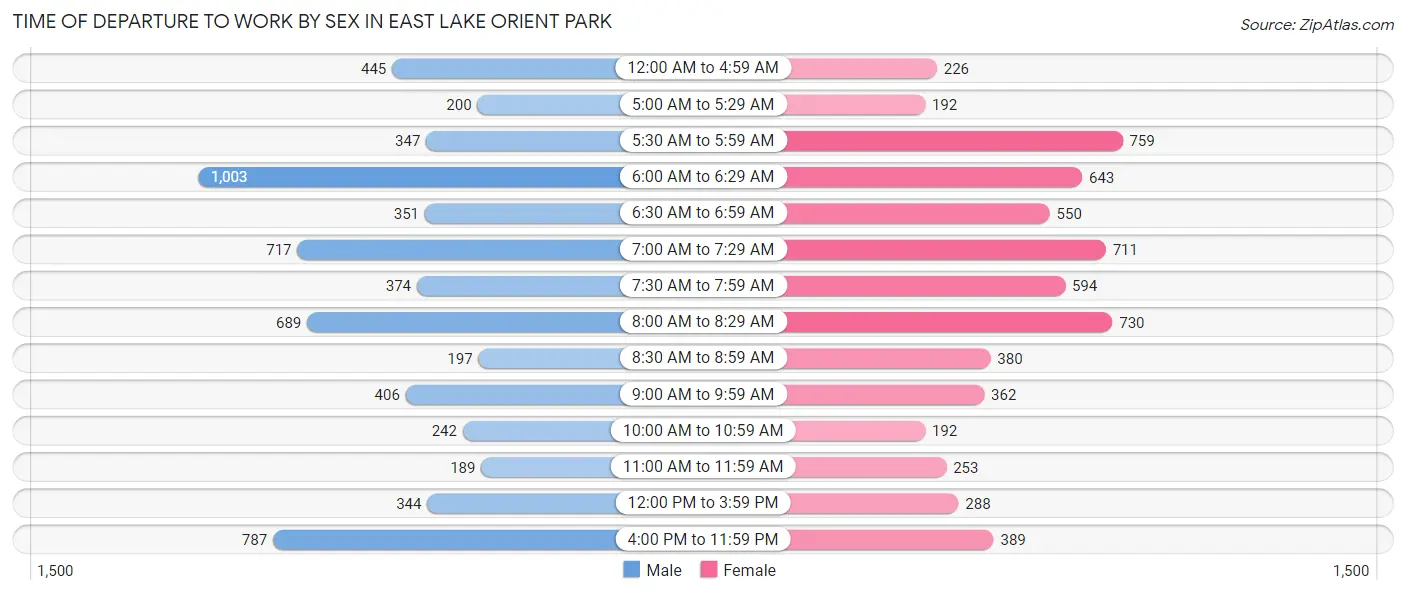
| Time of Departure | Male | Female |
| 12:00 AM to 4:59 AM | 445 (7.1%) | 226 (3.6%) |
| 5:00 AM to 5:29 AM | 200 (3.2%) | 192 (3.1%) |
| 5:30 AM to 5:59 AM | 347 (5.5%) | 759 (12.1%) |
| 6:00 AM to 6:29 AM | 1,003 (15.9%) | 643 (10.3%) |
| 6:30 AM to 6:59 AM | 351 (5.6%) | 550 (8.8%) |
| 7:00 AM to 7:29 AM | 717 (11.4%) | 711 (11.3%) |
| 7:30 AM to 7:59 AM | 374 (5.9%) | 594 (9.5%) |
| 8:00 AM to 8:29 AM | 689 (11.0%) | 730 (11.6%) |
| 8:30 AM to 8:59 AM | 197 (3.1%) | 380 (6.1%) |
| 9:00 AM to 9:59 AM | 406 (6.5%) | 362 (5.8%) |
| 10:00 AM to 10:59 AM | 242 (3.8%) | 192 (3.1%) |
| 11:00 AM to 11:59 AM | 189 (3.0%) | 253 (4.0%) |
| 12:00 PM to 3:59 PM | 344 (5.5%) | 288 (4.6%) |
| 4:00 PM to 11:59 PM | 787 (12.5%) | 389 (6.2%) |
| Total | 6,291 (100.0%) | 6,269 (100.0%) |
Housing Occupancy in East Lake Orient Park
Occupancy by Ownership in East Lake Orient Park
Of the total 10,940 dwellings in East Lake Orient Park, owner-occupied units account for 5,454 (49.8%), while renter-occupied units make up 5,486 (50.1%).
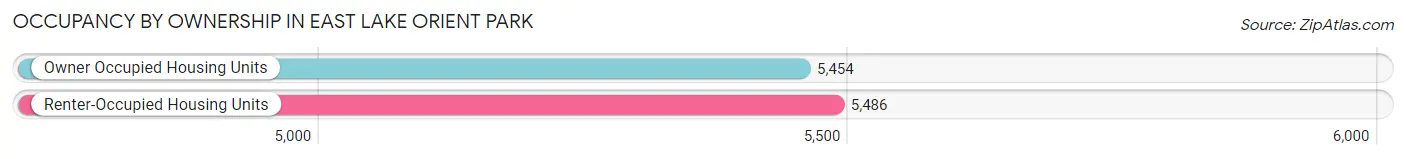
| Occupancy | # Housing Units | % Housing Units |
| Owner Occupied Housing Units | 5,454 | 49.8% |
| Renter-Occupied Housing Units | 5,486 | 50.1% |
| Total Occupied Housing Units | 10,940 | 100.0% |
Occupancy by Household Size in East Lake Orient Park
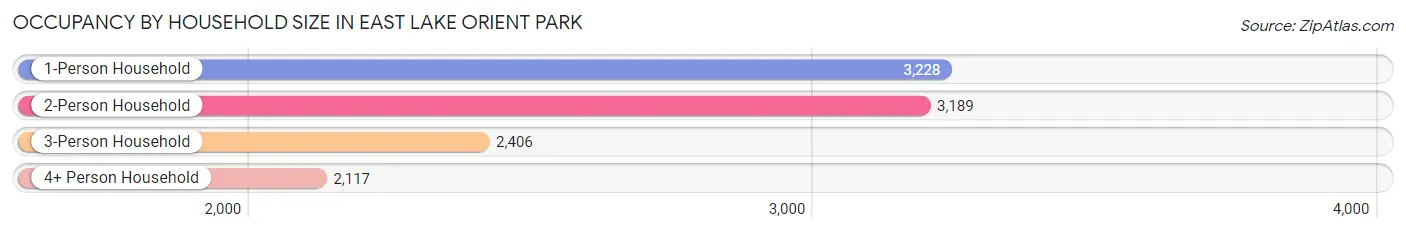
| Household Size | # Housing Units | % Housing Units |
| 1-Person Household | 3,228 | 29.5% |
| 2-Person Household | 3,189 | 29.1% |
| 3-Person Household | 2,406 | 22.0% |
| 4+ Person Household | 2,117 | 19.4% |
| Total Housing Units | 10,940 | 100.0% |
Occupancy by Ownership by Household Size in East Lake Orient Park
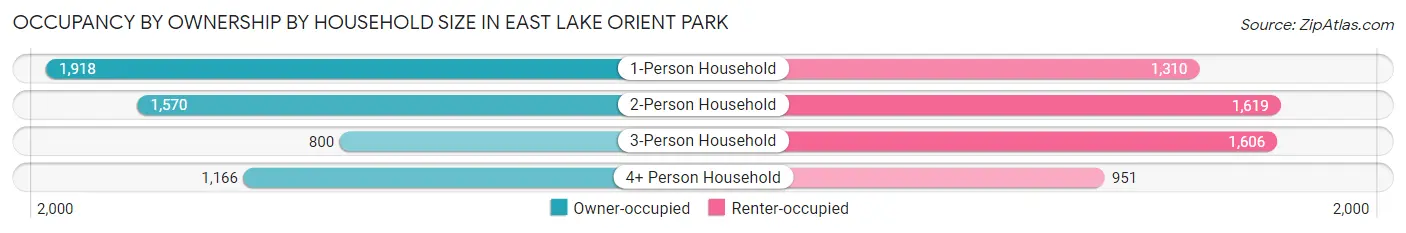
| Household Size | Owner-occupied | Renter-occupied |
| 1-Person Household | 1,918 (59.4%) | 1,310 (40.6%) |
| 2-Person Household | 1,570 (49.2%) | 1,619 (50.8%) |
| 3-Person Household | 800 (33.3%) | 1,606 (66.7%) |
| 4+ Person Household | 1,166 (55.1%) | 951 (44.9%) |
| Total Housing Units | 5,454 (49.8%) | 5,486 (50.1%) |
Occupancy by Educational Attainment in East Lake Orient Park
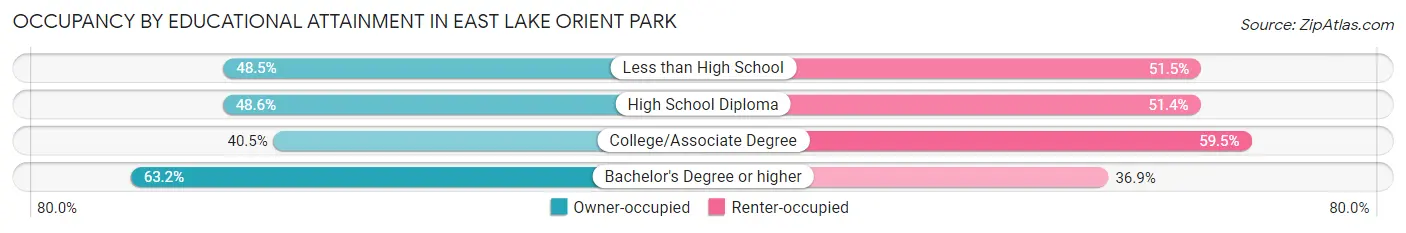
| Household Size | Owner-occupied | Renter-occupied |
| Less than High School | 775 (48.5%) | 824 (51.5%) |
| High School Diploma | 1,627 (48.6%) | 1,723 (51.4%) |
| College/Associate Degree | 1,309 (40.5%) | 1,922 (59.5%) |
| Bachelor's Degree or higher | 1,743 (63.1%) | 1,017 (36.8%) |
Occupancy by Age of Householder in East Lake Orient Park
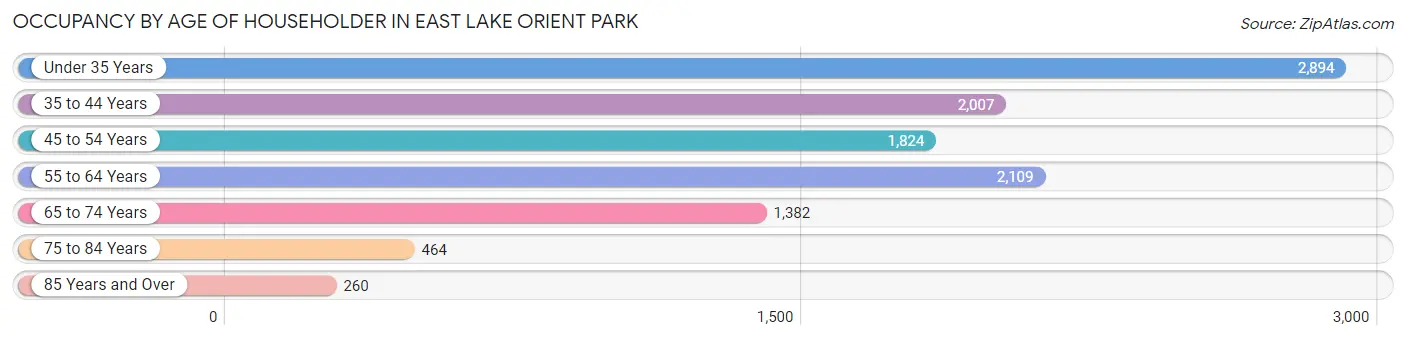
| Age Bracket | # Households | % Households |
| Under 35 Years | 2,894 | 26.5% |
| 35 to 44 Years | 2,007 | 18.3% |
| 45 to 54 Years | 1,824 | 16.7% |
| 55 to 64 Years | 2,109 | 19.3% |
| 65 to 74 Years | 1,382 | 12.6% |
| 75 to 84 Years | 464 | 4.2% |
| 85 Years and Over | 260 | 2.4% |
| Total | 10,940 | 100.0% |
Housing Finances in East Lake Orient Park
Median Income by Occupancy in East Lake Orient Park
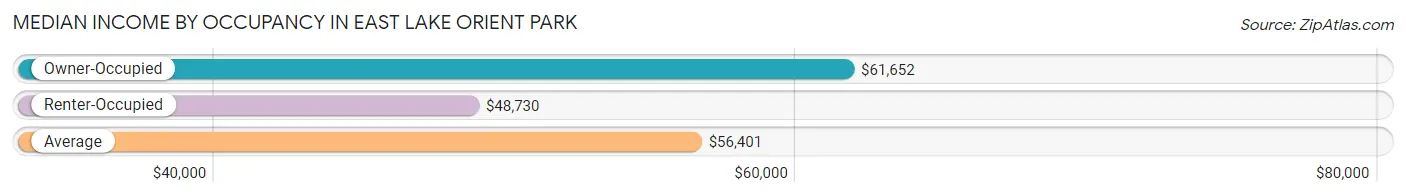
| Occupancy Type | # Households | Median Income |
| Owner-Occupied | 5,454 (49.8%) | $61,652 |
| Renter-Occupied | 5,486 (50.1%) | $48,730 |
| Average | 10,940 (100.0%) | $56,401 |
Occupancy by Householder Income Bracket in East Lake Orient Park
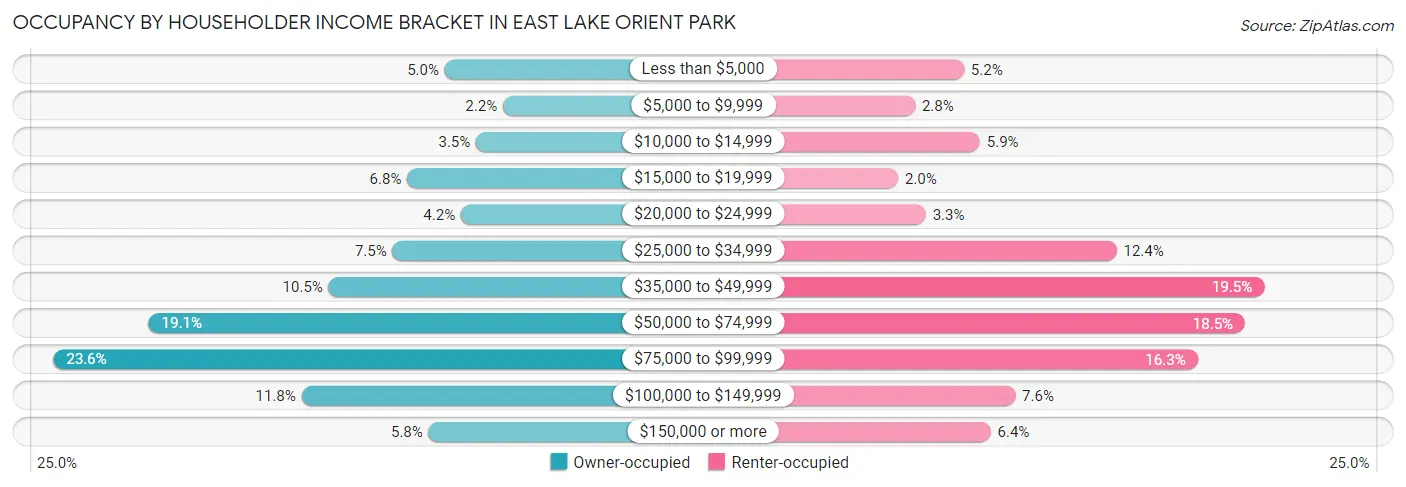
| Income Bracket | Owner-occupied | Renter-occupied |
| Less than $5,000 | 272 (5.0%) | 283 (5.2%) |
| $5,000 to $9,999 | 121 (2.2%) | 155 (2.8%) |
| $10,000 to $14,999 | 191 (3.5%) | 325 (5.9%) |
| $15,000 to $19,999 | 370 (6.8%) | 111 (2.0%) |
| $20,000 to $24,999 | 230 (4.2%) | 183 (3.3%) |
| $25,000 to $34,999 | 408 (7.5%) | 682 (12.4%) |
| $35,000 to $49,999 | 574 (10.5%) | 1,067 (19.5%) |
| $50,000 to $74,999 | 1,041 (19.1%) | 1,017 (18.5%) |
| $75,000 to $99,999 | 1,289 (23.6%) | 893 (16.3%) |
| $100,000 to $149,999 | 644 (11.8%) | 417 (7.6%) |
| $150,000 or more | 314 (5.8%) | 353 (6.4%) |
| Total | 5,454 (100.0%) | 5,486 (100.0%) |
Monthly Housing Cost Tiers in East Lake Orient Park
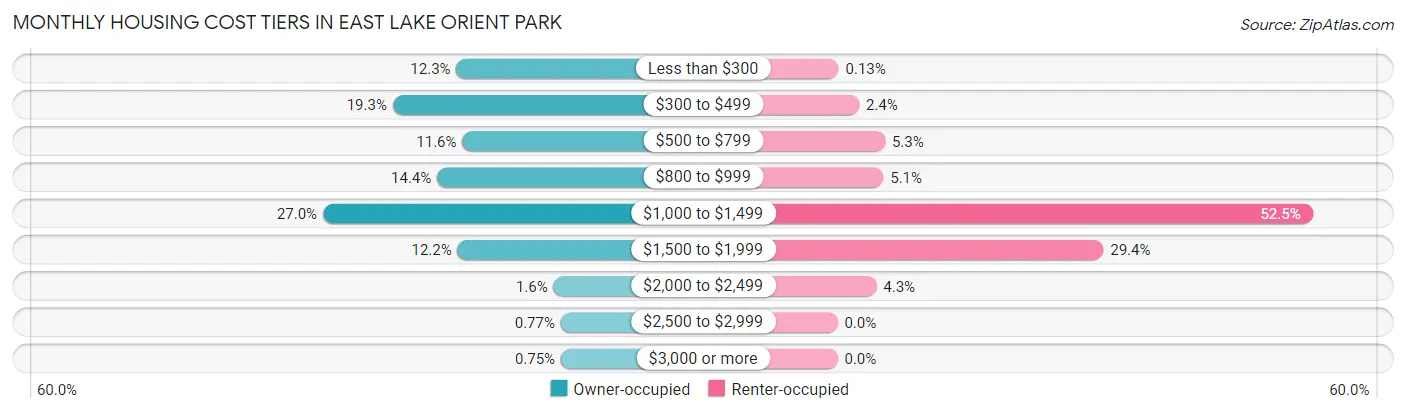
| Monthly Cost | Owner-occupied | Renter-occupied |
| Less than $300 | 671 (12.3%) | 7 (0.1%) |
| $300 to $499 | 1,054 (19.3%) | 131 (2.4%) |
| $500 to $799 | 635 (11.6%) | 288 (5.2%) |
| $800 to $999 | 787 (14.4%) | 278 (5.1%) |
| $1,000 to $1,499 | 1,475 (27.0%) | 2,879 (52.5%) |
| $1,500 to $1,999 | 664 (12.2%) | 1,611 (29.4%) |
| $2,000 to $2,499 | 85 (1.6%) | 236 (4.3%) |
| $2,500 to $2,999 | 42 (0.8%) | 0 (0.0%) |
| $3,000 or more | 41 (0.7%) | 0 (0.0%) |
| Total | 5,454 (100.0%) | 5,486 (100.0%) |
Physical Housing Characteristics in East Lake Orient Park
Housing Structures in East Lake Orient Park
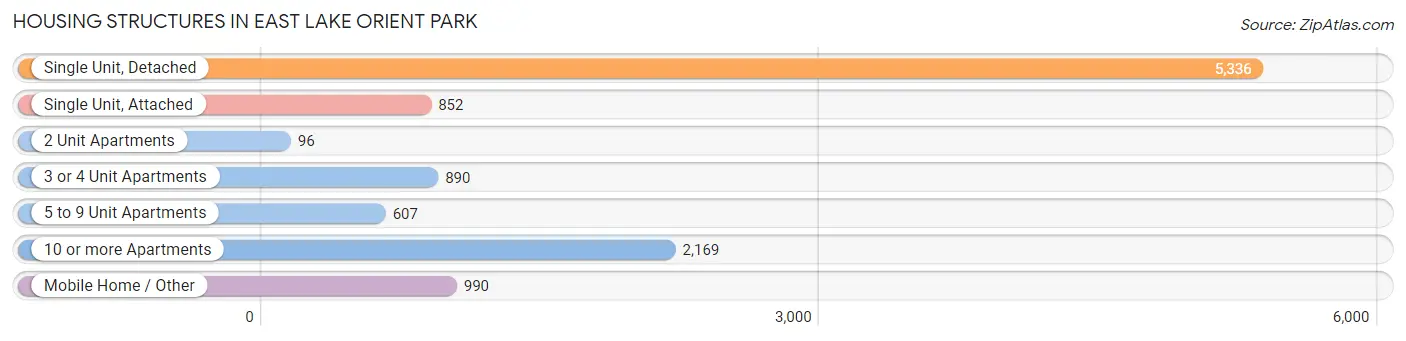
| Structure Type | # Housing Units | % Housing Units |
| Single Unit, Detached | 5,336 | 48.8% |
| Single Unit, Attached | 852 | 7.8% |
| 2 Unit Apartments | 96 | 0.9% |
| 3 or 4 Unit Apartments | 890 | 8.1% |
| 5 to 9 Unit Apartments | 607 | 5.6% |
| 10 or more Apartments | 2,169 | 19.8% |
| Mobile Home / Other | 990 | 9.0% |
| Total | 10,940 | 100.0% |
Housing Structures by Occupancy in East Lake Orient Park
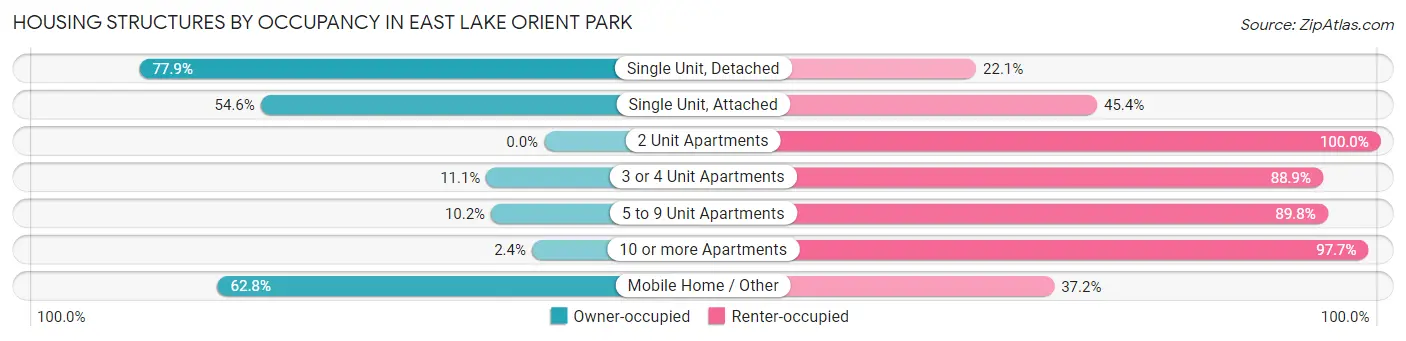
| Structure Type | Owner-occupied | Renter-occupied |
| Single Unit, Detached | 4,155 (77.9%) | 1,181 (22.1%) |
| Single Unit, Attached | 465 (54.6%) | 387 (45.4%) |
| 2 Unit Apartments | 0 (0.0%) | 96 (100.0%) |
| 3 or 4 Unit Apartments | 99 (11.1%) | 791 (88.9%) |
| 5 to 9 Unit Apartments | 62 (10.2%) | 545 (89.8%) |
| 10 or more Apartments | 51 (2.4%) | 2,118 (97.7%) |
| Mobile Home / Other | 622 (62.8%) | 368 (37.2%) |
| Total | 5,454 (49.8%) | 5,486 (50.1%) |
Housing Structures by Number of Rooms in East Lake Orient Park
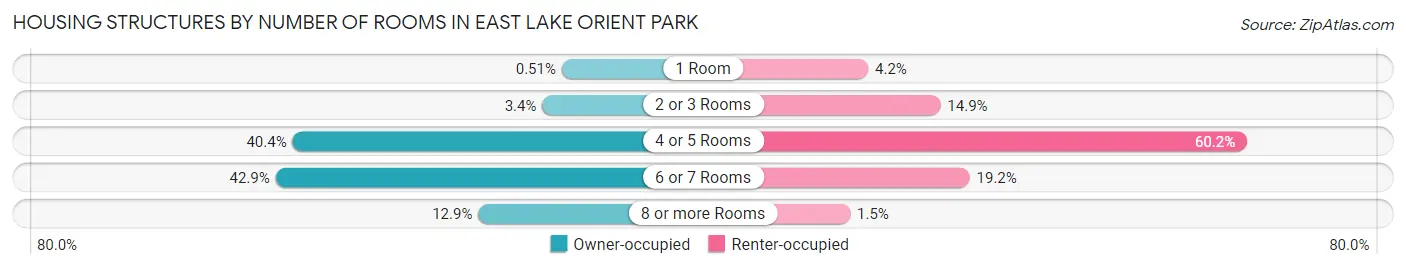
| Number of Rooms | Owner-occupied | Renter-occupied |
| 1 Room | 28 (0.5%) | 229 (4.2%) |
| 2 or 3 Rooms | 185 (3.4%) | 816 (14.9%) |
| 4 or 5 Rooms | 2,201 (40.4%) | 3,305 (60.2%) |
| 6 or 7 Rooms | 2,338 (42.9%) | 1,053 (19.2%) |
| 8 or more Rooms | 702 (12.9%) | 83 (1.5%) |
| Total | 5,454 (100.0%) | 5,486 (100.0%) |
Housing Structure by Heating Type in East Lake Orient Park
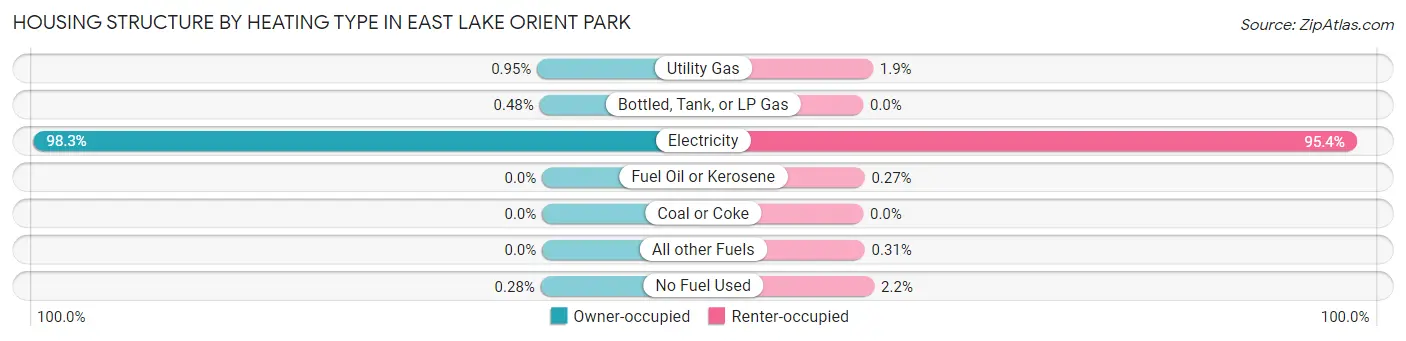
| Heating Type | Owner-occupied | Renter-occupied |
| Utility Gas | 52 (0.9%) | 104 (1.9%) |
| Bottled, Tank, or LP Gas | 26 (0.5%) | 0 (0.0%) |
| Electricity | 5,361 (98.3%) | 5,232 (95.4%) |
| Fuel Oil or Kerosene | 0 (0.0%) | 15 (0.3%) |
| Coal or Coke | 0 (0.0%) | 0 (0.0%) |
| All other Fuels | 0 (0.0%) | 17 (0.3%) |
| No Fuel Used | 15 (0.3%) | 118 (2.1%) |
| Total | 5,454 (100.0%) | 5,486 (100.0%) |
Household Vehicle Usage in East Lake Orient Park
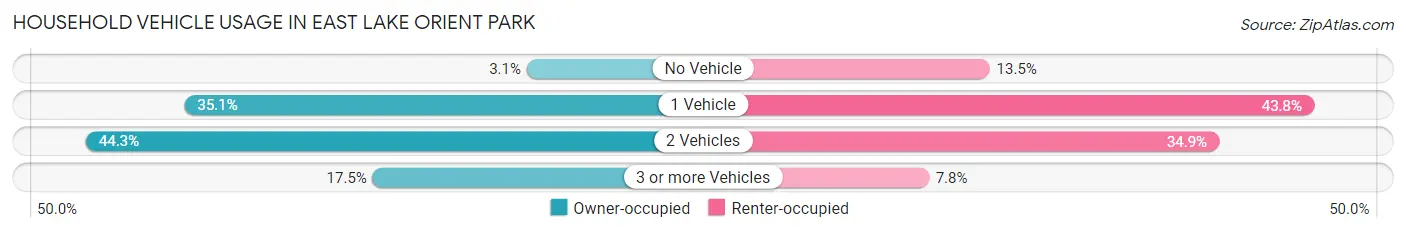
| Vehicles per Household | Owner-occupied | Renter-occupied |
| No Vehicle | 170 (3.1%) | 741 (13.5%) |
| 1 Vehicle | 1,914 (35.1%) | 2,401 (43.8%) |
| 2 Vehicles | 2,415 (44.3%) | 1,915 (34.9%) |
| 3 or more Vehicles | 955 (17.5%) | 429 (7.8%) |
| Total | 5,454 (100.0%) | 5,486 (100.0%) |
Real Estate & Mortgages in East Lake Orient Park
Real Estate and Mortgage Overview in East Lake Orient Park
| Characteristic | Without Mortgage | With Mortgage |
| Housing Units | 2,157 | 3,297 |
| Median Property Value | $175,400 | $212,300 |
| Median Household Income | $50,347 | $286 |
| Monthly Housing Costs | $345 | $41 |
| Real Estate Taxes | $988 | $357 |
Property Value by Mortgage Status in East Lake Orient Park
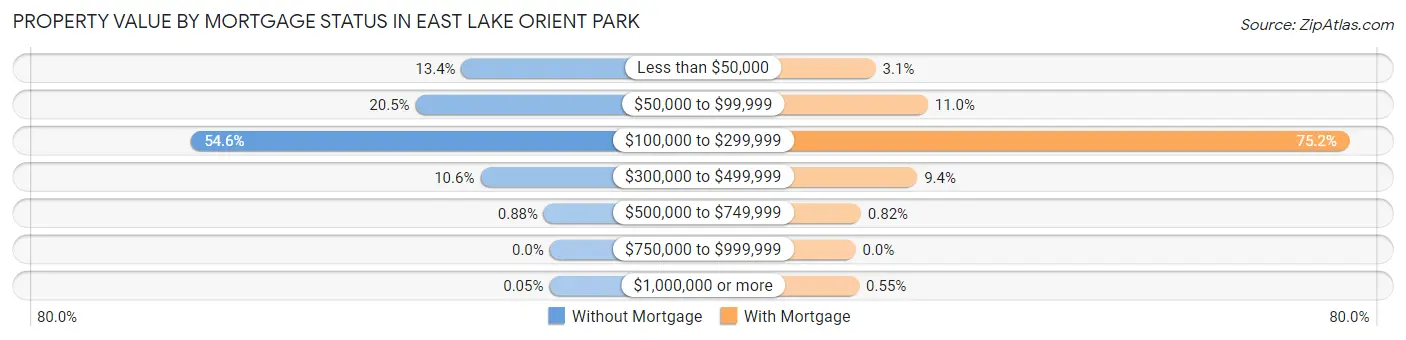
| Property Value | Without Mortgage | With Mortgage |
| Less than $50,000 | 290 (13.4%) | 101 (3.1%) |
| $50,000 to $99,999 | 441 (20.4%) | 363 (11.0%) |
| $100,000 to $299,999 | 1,178 (54.6%) | 2,478 (75.2%) |
| $300,000 to $499,999 | 228 (10.6%) | 310 (9.4%) |
| $500,000 to $749,999 | 19 (0.9%) | 27 (0.8%) |
| $750,000 to $999,999 | 0 (0.0%) | 0 (0.0%) |
| $1,000,000 or more | 1 (0.1%) | 18 (0.5%) |
| Total | 2,157 (100.0%) | 3,297 (100.0%) |
Household Income by Mortgage Status in East Lake Orient Park
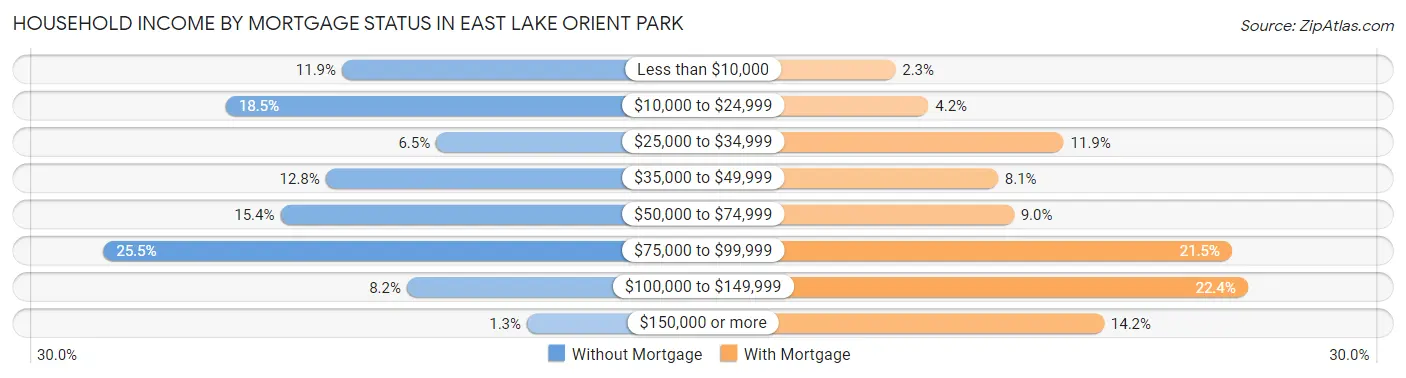
| Household Income | Without Mortgage | With Mortgage |
| Less than $10,000 | 256 (11.9%) | 75 (2.3%) |
| $10,000 to $24,999 | 399 (18.5%) | 137 (4.2%) |
| $25,000 to $34,999 | 140 (6.5%) | 392 (11.9%) |
| $35,000 to $49,999 | 276 (12.8%) | 268 (8.1%) |
| $50,000 to $74,999 | 332 (15.4%) | 298 (9.0%) |
| $75,000 to $99,999 | 550 (25.5%) | 709 (21.5%) |
| $100,000 to $149,999 | 176 (8.2%) | 739 (22.4%) |
| $150,000 or more | 28 (1.3%) | 468 (14.2%) |
| Total | 2,157 (100.0%) | 3,297 (100.0%) |
Property Value to Household Income Ratio in East Lake Orient Park
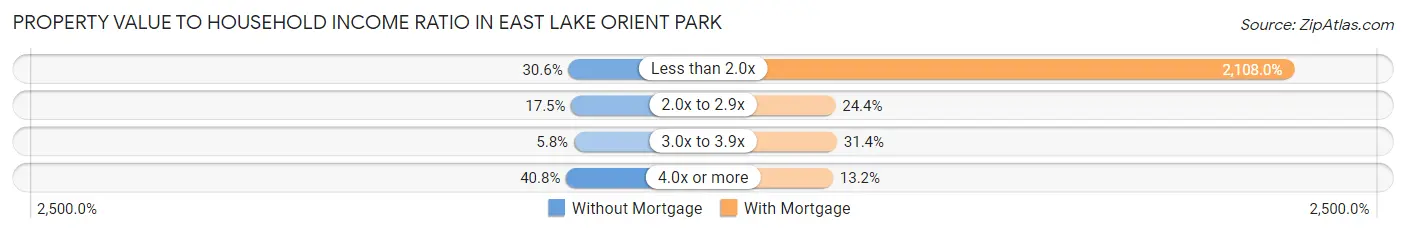
| Value-to-Income Ratio | Without Mortgage | With Mortgage |
| Less than 2.0x | 661 (30.6%) | 69,502 (2,108.0%) |
| 2.0x to 2.9x | 378 (17.5%) | 803 (24.4%) |
| 3.0x to 3.9x | 124 (5.8%) | 1,036 (31.4%) |
| 4.0x or more | 880 (40.8%) | 436 (13.2%) |
| Total | 2,157 (100.0%) | 3,297 (100.0%) |
Real Estate Taxes by Mortgage Status in East Lake Orient Park
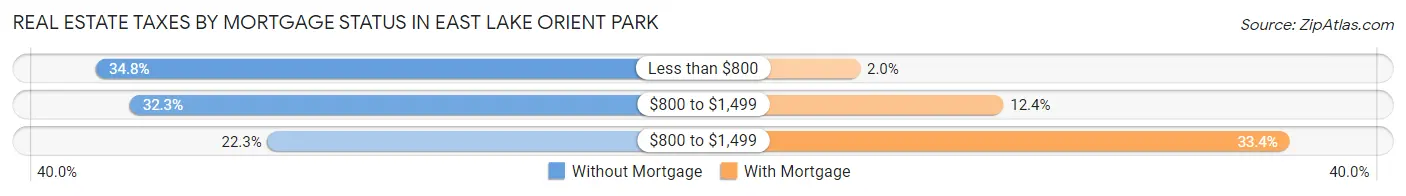
| Property Taxes | Without Mortgage | With Mortgage |
| Less than $800 | 750 (34.8%) | 65 (2.0%) |
| $800 to $1,499 | 697 (32.3%) | 410 (12.4%) |
| $800 to $1,499 | 480 (22.3%) | 1,100 (33.4%) |
| Total | 2,157 (100.0%) | 3,297 (100.0%) |
Health & Disability in East Lake Orient Park
Health Insurance Coverage by Age in East Lake Orient Park
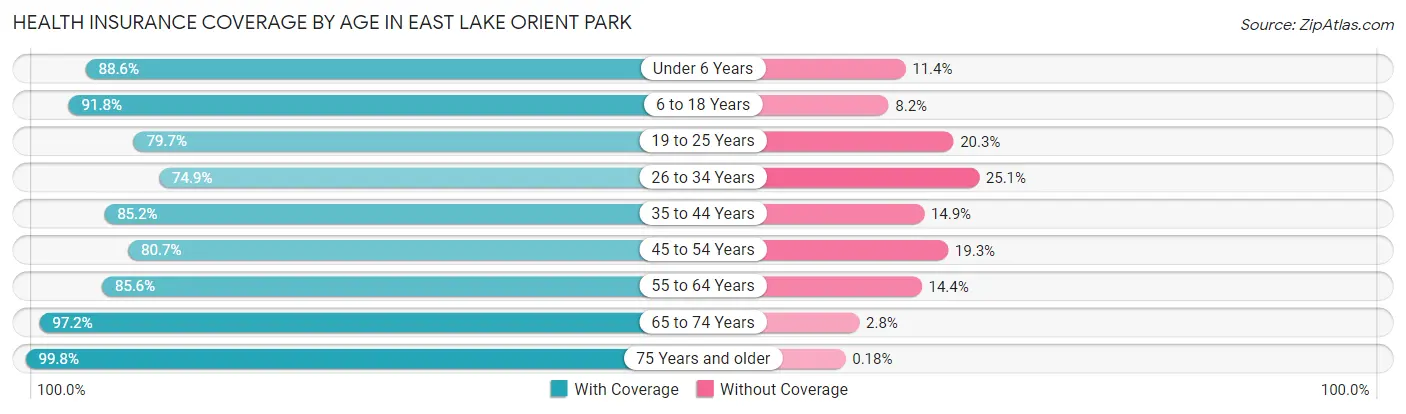
| Age Bracket | With Coverage | Without Coverage |
| Under 6 Years | 2,173 (88.6%) | 279 (11.4%) |
| 6 to 18 Years | 4,882 (91.8%) | 437 (8.2%) |
| 19 to 25 Years | 2,390 (79.7%) | 609 (20.3%) |
| 26 to 34 Years | 3,464 (74.9%) | 1,160 (25.1%) |
| 35 to 44 Years | 3,222 (85.2%) | 562 (14.8%) |
| 45 to 54 Years | 2,840 (80.7%) | 680 (19.3%) |
| 55 to 64 Years | 2,870 (85.6%) | 483 (14.4%) |
| 65 to 74 Years | 1,937 (97.2%) | 55 (2.8%) |
| 75 Years and older | 1,100 (99.8%) | 2 (0.2%) |
| Total | 24,878 (85.4%) | 4,267 (14.6%) |
Health Insurance Coverage by Citizenship Status in East Lake Orient Park
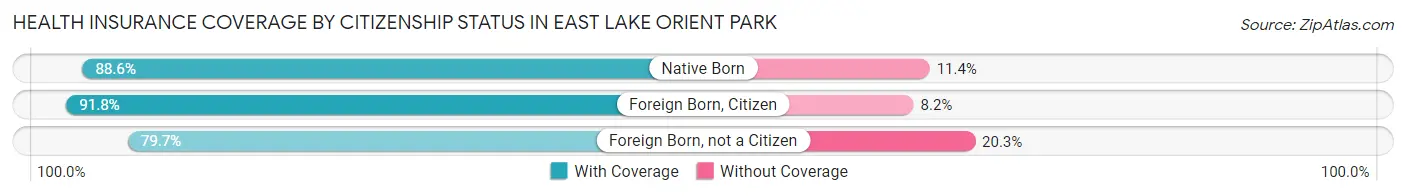
| Citizenship Status | With Coverage | Without Coverage |
| Native Born | 2,173 (88.6%) | 279 (11.4%) |
| Foreign Born, Citizen | 4,882 (91.8%) | 437 (8.2%) |
| Foreign Born, not a Citizen | 2,390 (79.7%) | 609 (20.3%) |
Health Insurance Coverage by Household Income in East Lake Orient Park
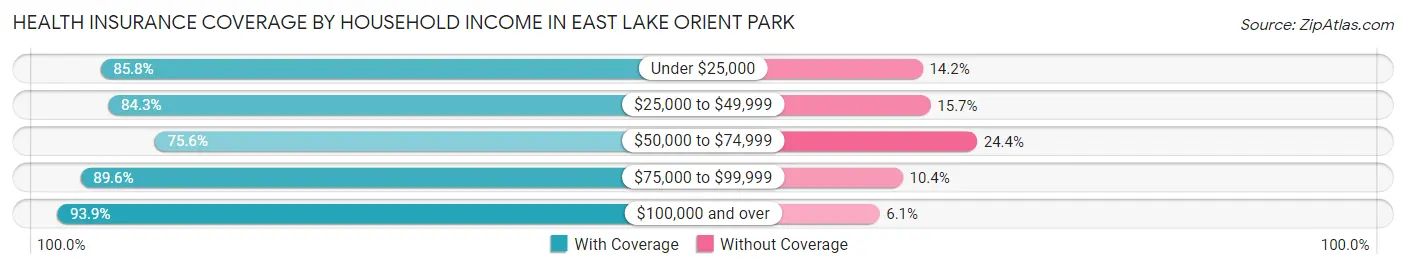
| Household Income | With Coverage | Without Coverage |
| Under $25,000 | 3,323 (85.8%) | 549 (14.2%) |
| $25,000 to $49,999 | 6,296 (84.3%) | 1,169 (15.7%) |
| $50,000 to $74,999 | 4,766 (75.6%) | 1,535 (24.4%) |
| $75,000 to $99,999 | 5,476 (89.6%) | 638 (10.4%) |
| $100,000 and over | 4,993 (93.9%) | 324 (6.1%) |
Public vs Private Health Insurance Coverage by Age in East Lake Orient Park
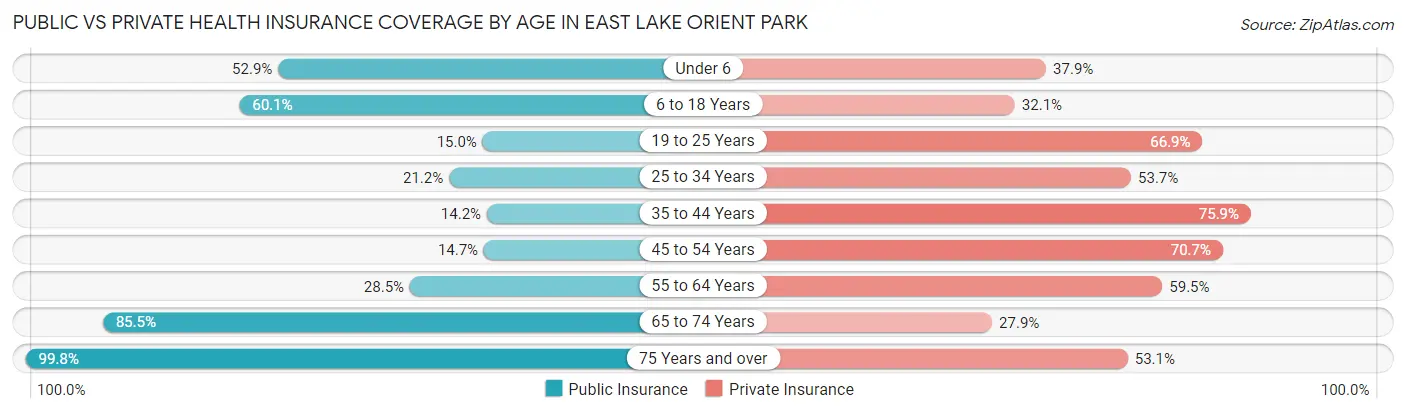
| Age Bracket | Public Insurance | Private Insurance |
| Under 6 | 1,298 (52.9%) | 930 (37.9%) |
| 6 to 18 Years | 3,199 (60.1%) | 1,709 (32.1%) |
| 19 to 25 Years | 449 (15.0%) | 2,007 (66.9%) |
| 25 to 34 Years | 981 (21.2%) | 2,483 (53.7%) |
| 35 to 44 Years | 537 (14.2%) | 2,873 (75.9%) |
| 45 to 54 Years | 519 (14.7%) | 2,489 (70.7%) |
| 55 to 64 Years | 955 (28.5%) | 1,995 (59.5%) |
| 65 to 74 Years | 1,703 (85.5%) | 556 (27.9%) |
| 75 Years and over | 1,100 (99.8%) | 585 (53.1%) |
| Total | 10,741 (36.8%) | 15,627 (53.6%) |
Disability Status by Sex by Age in East Lake Orient Park
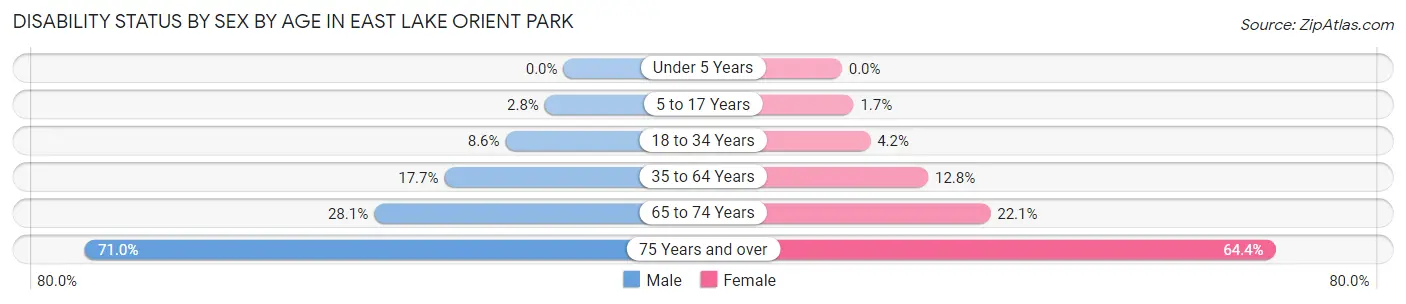
| Age Bracket | Male | Female |
| Under 5 Years | 0 (0.0%) | 0 (0.0%) |
| 5 to 17 Years | 76 (2.8%) | 47 (1.7%) |
| 18 to 34 Years | 320 (8.6%) | 182 (4.2%) |
| 35 to 64 Years | 940 (17.7%) | 684 (12.8%) |
| 65 to 74 Years | 189 (28.1%) | 291 (22.1%) |
| 75 Years and over | 272 (71.0%) | 463 (64.4%) |
Disability Class by Sex by Age in East Lake Orient Park
Disability Class: Hearing Difficulty
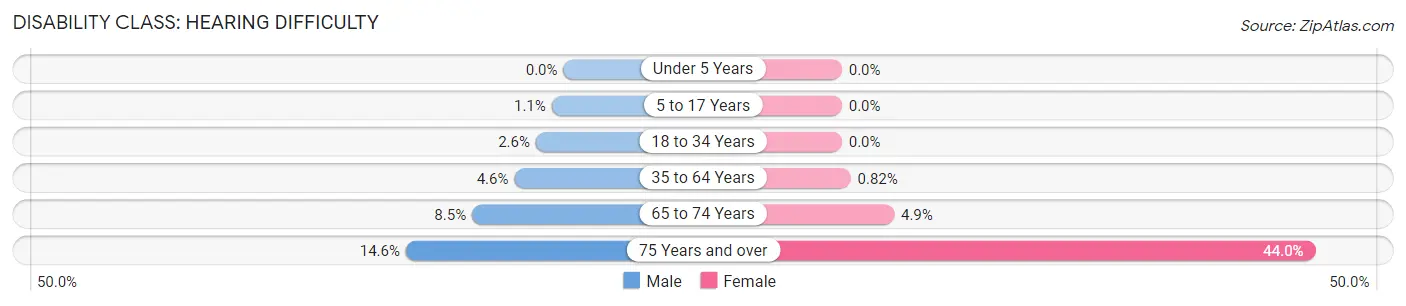
| Age Bracket | Male | Female |
| Under 5 Years | 0 (0.0%) | 0 (0.0%) |
| 5 to 17 Years | 30 (1.1%) | 0 (0.0%) |
| 18 to 34 Years | 95 (2.6%) | 0 (0.0%) |
| 35 to 64 Years | 242 (4.5%) | 44 (0.8%) |
| 65 to 74 Years | 57 (8.5%) | 64 (4.9%) |
| 75 Years and over | 56 (14.6%) | 316 (44.0%) |
Disability Class: Vision Difficulty
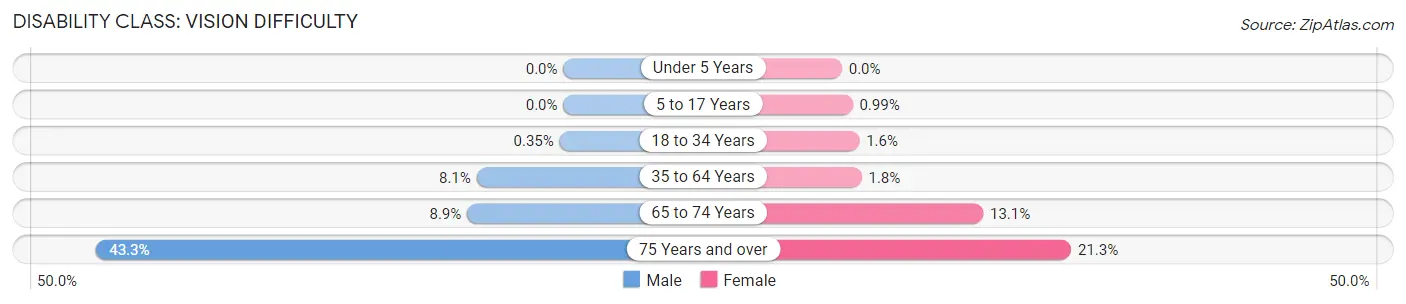
| Age Bracket | Male | Female |
| Under 5 Years | 0 (0.0%) | 0 (0.0%) |
| 5 to 17 Years | 0 (0.0%) | 27 (1.0%) |
| 18 to 34 Years | 13 (0.4%) | 70 (1.6%) |
| 35 to 64 Years | 428 (8.1%) | 98 (1.8%) |
| 65 to 74 Years | 60 (8.9%) | 173 (13.1%) |
| 75 Years and over | 166 (43.3%) | 153 (21.3%) |
Disability Class: Cognitive Difficulty
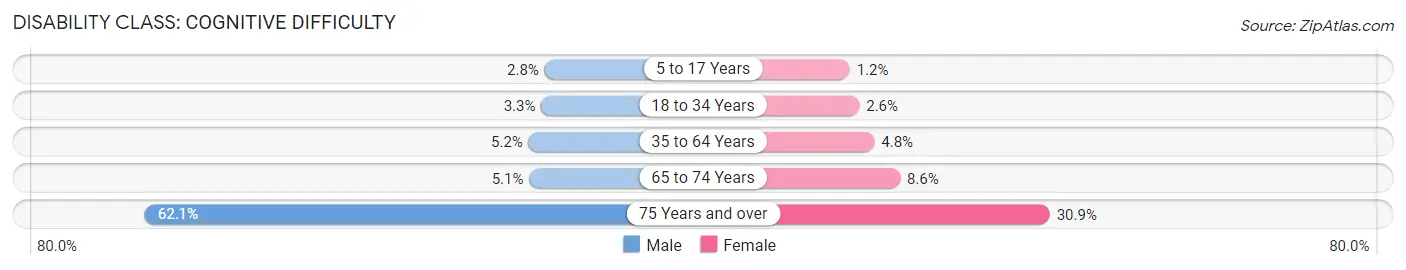
| Age Bracket | Male | Female |
| 5 to 17 Years | 76 (2.8%) | 32 (1.2%) |
| 18 to 34 Years | 122 (3.3%) | 112 (2.6%) |
| 35 to 64 Years | 274 (5.1%) | 258 (4.8%) |
| 65 to 74 Years | 34 (5.1%) | 114 (8.6%) |
| 75 Years and over | 238 (62.1%) | 222 (30.9%) |
Disability Class: Ambulatory Difficulty
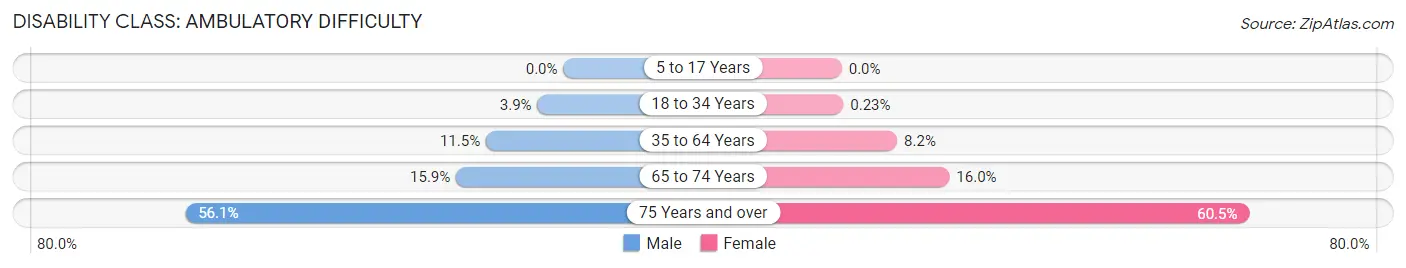
| Age Bracket | Male | Female |
| 5 to 17 Years | 0 (0.0%) | 0 (0.0%) |
| 18 to 34 Years | 143 (3.8%) | 10 (0.2%) |
| 35 to 64 Years | 611 (11.5%) | 439 (8.2%) |
| 65 to 74 Years | 107 (15.9%) | 211 (16.0%) |
| 75 Years and over | 215 (56.1%) | 435 (60.5%) |
Disability Class: Self-Care Difficulty
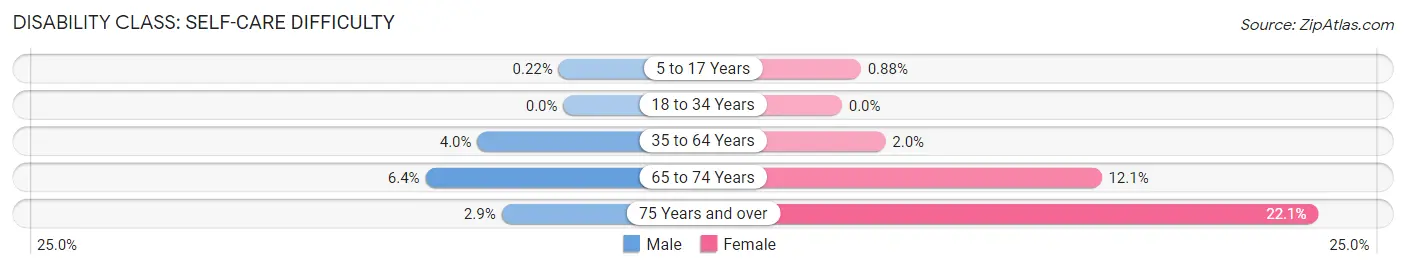
| Age Bracket | Male | Female |
| 5 to 17 Years | 6 (0.2%) | 24 (0.9%) |
| 18 to 34 Years | 0 (0.0%) | 0 (0.0%) |
| 35 to 64 Years | 212 (4.0%) | 108 (2.0%) |
| 65 to 74 Years | 43 (6.4%) | 159 (12.0%) |
| 75 Years and over | 11 (2.9%) | 159 (22.1%) |
Technology Access in East Lake Orient Park
Computing Device Access in East Lake Orient Park
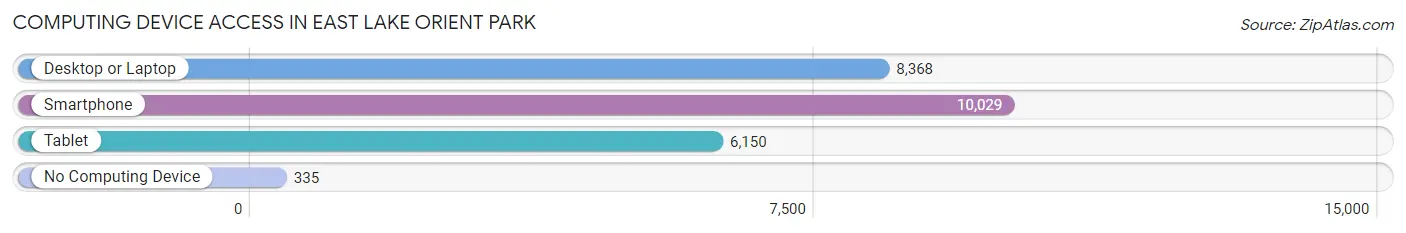
| Device Type | # Households | % Households |
| Desktop or Laptop | 8,368 | 76.5% |
| Smartphone | 10,029 | 91.7% |
| Tablet | 6,150 | 56.2% |
| No Computing Device | 335 | 3.1% |
| Total | 10,940 | 100.0% |
Internet Access in East Lake Orient Park
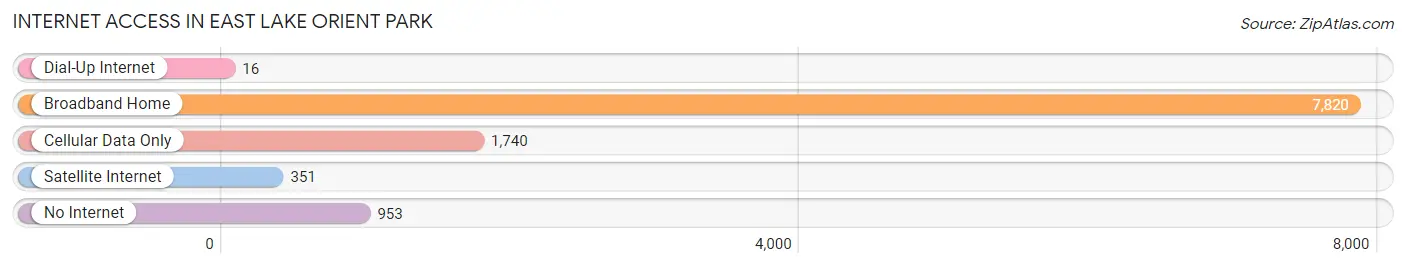
| Internet Type | # Households | % Households |
| Dial-Up Internet | 16 | 0.2% |
| Broadband Home | 7,820 | 71.5% |
| Cellular Data Only | 1,740 | 15.9% |
| Satellite Internet | 351 | 3.2% |
| No Internet | 953 | 8.7% |
| Total | 10,940 | 100.0% |
East Lake Orient Park Summary
East Lake Orient Park is a census-designated place (CDP) located in Hillsborough County, Florida, United States. The population was 8,945 at the 2010 census. It is part of the Tampa–St. Petersburg–Clearwater Metropolitan Statistical Area.
History
East Lake Orient Park was originally part of the Orient Park area, which was established in the late 1800s. The area was originally a farming community, and the land was owned by the Orient Land Company. The company was owned by the prominent Tampa family of the same name. The Orient Land Company sold the land to developers in the early 1900s, and the area was developed into a residential community.
The area was annexed by the City of Tampa in the 1950s, and the name was changed to East Lake Orient Park. The area was developed into a residential community, and the population began to grow. The area was annexed by Hillsborough County in the 1970s, and the population continued to grow.
Geography
East Lake Orient Park is located at 28°1'25" North, 82°25'17" West (28.023607, -82.421445). According to the United States Census Bureau, the CDP has a total area of 4.2 square miles (10.8 km2), of which 4.1 square miles (10.6 km2) is land and 0.1 square miles (0.2 km2) (2.37%) is water.
Economy
East Lake Orient Park is a residential community, and the economy is largely based on the service industry. There are several small businesses in the area, including restaurants, retail stores, and professional services. The area is also home to several large employers, including the University of South Florida, Tampa General Hospital, and the Tampa Bay Buccaneers.
Demographics
As of the census of 2000, there were 8,945 people, 3,717 households, and 2,541 families residing in the CDP. The population density was 2,179.3 people per square mile (841.3/km2). There were 3,945 housing units at an average density of 951.3/sq mi (367.3/km2). The racial makeup of the CDP was 79.2% White, 11.2% African American, 0.3% Native American, 2.2% Asian, 0.1% Pacific Islander, 4.7% from other races, and 2.3% from two or more races. Hispanic or Latino of any race were 13.2% of the population.
There were 3,717 households, out of which 28.2% had children under the age of 18 living with them, 51.2% were married couples living together, 12.7% had a female householder with no husband present, and 31.3% were non-families. 24.7% of all households were made up of individuals, and 8.2% had someone living alone who was 65 years of age or older. The average household size was 2.41 and the average family size was 2.86.
In the CDP, the population was spread out, with 22.2% under the age of 18, 8.2% from 18 to 24, 30.2% from 25 to 44, 24.2% from 45 to 64, and 15.2% who were 65 years of age or older. The median age was 38 years. For every 100 females, there were 94.2 males. For every 100 females age 18 and over, there were 91.2 males.
The median income for a household in the CDP was $41,945, and the median income for a family was $48,958. Males had a median income of $35,938 versus $27,917 for females. The per capita income for the CDP was $20,945. About 6.2% of families and 8.3% of the population were below the poverty line, including 10.2% of those under age 18 and 6.2% of those age 65 or over.
Common Questions
What is the Total Population of East Lake Orient Park?
Total Population of East Lake Orient Park is 29,243.
What is the Total Male Population of East Lake Orient Park?
Total Male Population of East Lake Orient Park is 14,000.
What is the Total Female Population of East Lake Orient Park?
Total Female Population of East Lake Orient Park is 15,243.
What is the Ratio of Males per 100 Females in East Lake Orient Park?
There are 91.85 Males per 100 Females in East Lake Orient Park.
What is the Ratio of Females per 100 Males in East Lake Orient Park?
There are 108.88 Females per 100 Males in East Lake Orient Park.
What is the Median Population Age in East Lake Orient Park?
Median Population Age in East Lake Orient Park is 33.2 Years.
What is the Average Family Size in East Lake Orient Park
Average Family Size in East Lake Orient Park is 3.4 People.
What is the Average Household Size in East Lake Orient Park
Average Household Size in East Lake Orient Park is 2.7 People.
What is Per Capita Income in East Lake Orient Park?
Per Capita income in East Lake Orient Park is $25,204.
What is the Median Family Income in East Lake Orient Park?
Median Family Income in East Lake Orient Park is $59,369.
What is the Median Household income in East Lake Orient Park?
Median Household Income in East Lake Orient Park is $56,401.
What is Income or Wage Gap in East Lake Orient Park?
Income or Wage Gap in East Lake Orient Park is 11.2%.
Women in East Lake Orient Park earn 88.8 cents for every dollar earned by a man.
What is Family Income Deficit in East Lake Orient Park?
Family Income Deficit in East Lake Orient Park is $14,196.
Families that are below poverty line in East Lake Orient Park earn $14,196 less on average than the poverty threshold level.
What is Inequality or Gini Index in East Lake Orient Park?
Inequality or Gini Index in East Lake Orient Park is 0.40.
How Large is the Labor Force in East Lake Orient Park?
There are 15,655 People in the Labor Forcein in East Lake Orient Park.
What is the Percentage of People in the Labor Force in East Lake Orient Park?
69.9% of People are in the Labor Force in East Lake Orient Park.
What is the Unemployment Rate in East Lake Orient Park?
Unemployment Rate in East Lake Orient Park is 7.2%.