Avalon, FL
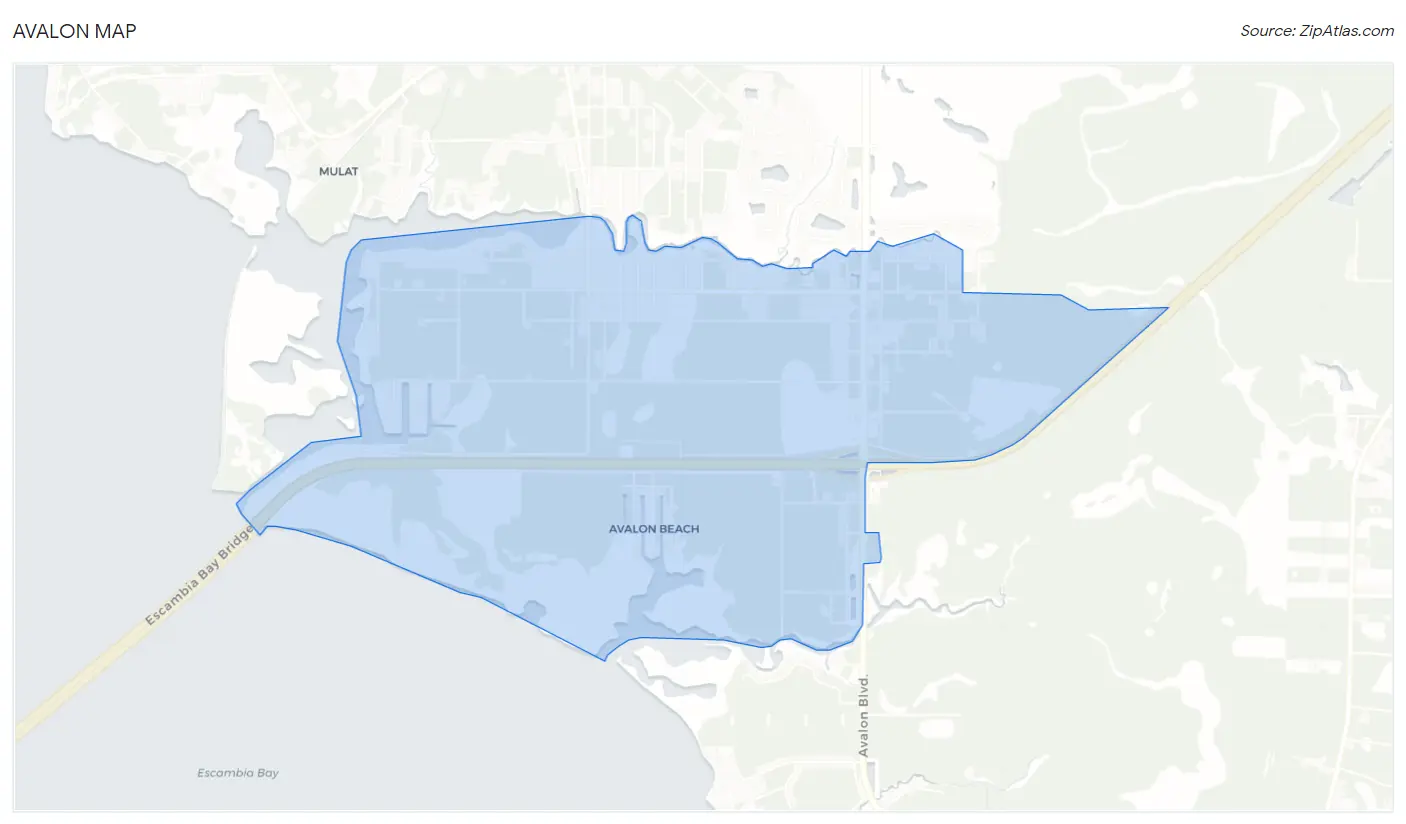
Avalon Map
Avalon Overview
777
TOTAL POPULATION
377
MALE POPULATION
400
FEMALE POPULATION
94.25
MALES / 100 FEMALES
106.10
FEMALES / 100 MALES
49.0
MEDIAN AGE
3.1
AVG FAMILY SIZE
2.6
AVG HOUSEHOLD SIZE
$36,216
PER CAPITA INCOME
$74,063
AVG FAMILY INCOME
$80,809
AVG HOUSEHOLD INCOME
45.0%
WAGE / INCOME GAP [ % ]
55.0¢/ $1
WAGE / INCOME GAP [ $ ]
0.22
INEQUALITY / GINI INDEX
461
LABOR FORCE [ PEOPLE ]
71.9%
PERCENT IN LABOR FORCE
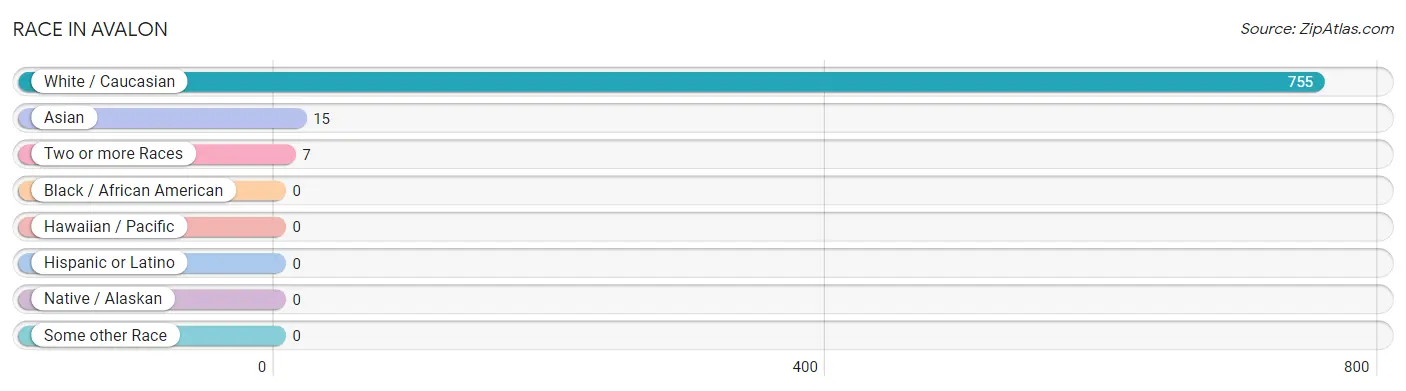
Race in Avalon
The most populous races in Avalon are White / Caucasian (755 | 97.2%), Asian (15 | 1.9%), and Two or more Races (7 | 0.9%).
| Race | # Population | % Population |
| Asian | 15 | 1.9% |
| Black / African American | 0 | 0.0% |
| Hawaiian / Pacific | 0 | 0.0% |
| Hispanic or Latino | 0 | 0.0% |
| Native / Alaskan | 0 | 0.0% |
| White / Caucasian | 755 | 97.2% |
| Two or more Races | 7 | 0.9% |
| Some other Race | 0 | 0.0% |
| Total | 777 | 100.0% |
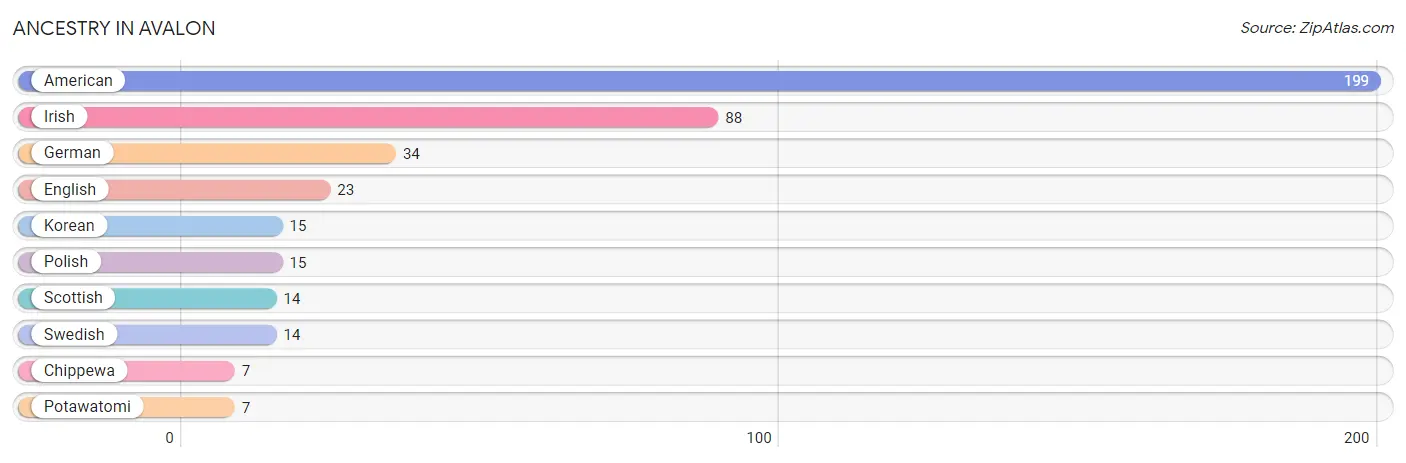
Ancestry in Avalon
The most populous ancestries reported in Avalon are American (199 | 25.6%), Irish (88 | 11.3%), German (34 | 4.4%), English (23 | 3.0%), and Korean (15 | 1.9%), together accounting for 46.2% of all Avalon residents.
| Ancestry | # Population | % Population |
| American | 199 | 25.6% |
| Chippewa | 7 | 0.9% |
| English | 23 | 3.0% |
| German | 34 | 4.4% |
| Irish | 88 | 11.3% |
| Korean | 15 | 1.9% |
| Polish | 15 | 1.9% |
| Potawatomi | 7 | 0.9% |
| Scottish | 14 | 1.8% |
| Swedish | 14 | 1.8% | View All 10 Rows |
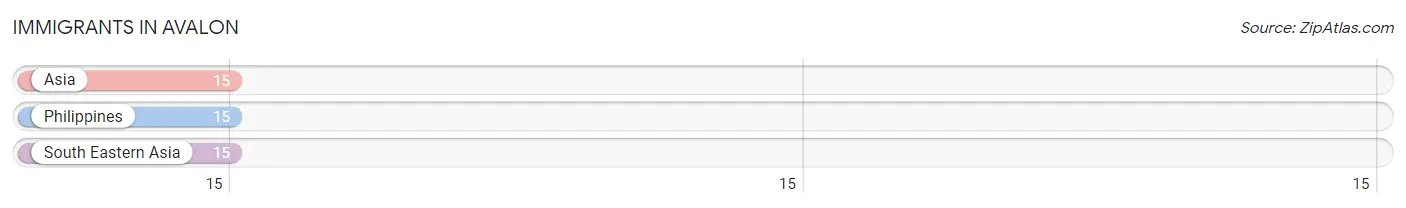
Immigrants in Avalon
The most numerous immigrant groups reported in Avalon came from Asia (15 | 1.9%), Philippines (15 | 1.9%), and South Eastern Asia (15 | 1.9%), together accounting for 5.8% of all Avalon residents.
| Immigration Origin | # Population | % Population |
| Asia | 15 | 1.9% |
| Philippines | 15 | 1.9% |
| South Eastern Asia | 15 | 1.9% | View All 3 Rows |
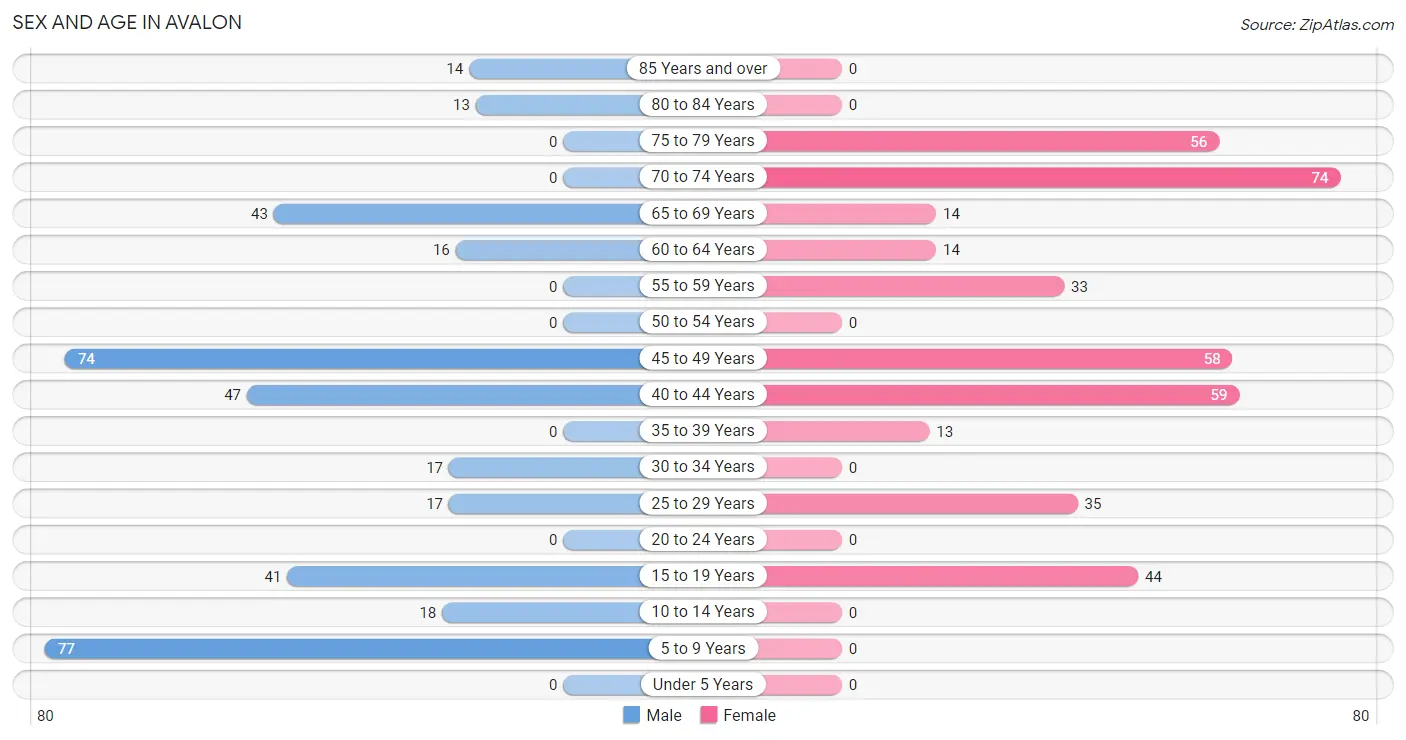
Sex and Age in Avalon
Sex and Age in Avalon
The most populous age groups in Avalon are 5 to 9 Years (77 | 20.4%) for men and 70 to 74 Years (74 | 18.5%) for women.
| Age Bracket | Male | Female |
| Under 5 Years | 0 (0.0%) | 0 (0.0%) |
| 5 to 9 Years | 77 (20.4%) | 0 (0.0%) |
| 10 to 14 Years | 18 (4.8%) | 0 (0.0%) |
| 15 to 19 Years | 41 (10.9%) | 44 (11.0%) |
| 20 to 24 Years | 0 (0.0%) | 0 (0.0%) |
| 25 to 29 Years | 17 (4.5%) | 35 (8.7%) |
| 30 to 34 Years | 17 (4.5%) | 0 (0.0%) |
| 35 to 39 Years | 0 (0.0%) | 13 (3.3%) |
| 40 to 44 Years | 47 (12.5%) | 59 (14.7%) |
| 45 to 49 Years | 74 (19.6%) | 58 (14.5%) |
| 50 to 54 Years | 0 (0.0%) | 0 (0.0%) |
| 55 to 59 Years | 0 (0.0%) | 33 (8.3%) |
| 60 to 64 Years | 16 (4.2%) | 14 (3.5%) |
| 65 to 69 Years | 43 (11.4%) | 14 (3.5%) |
| 70 to 74 Years | 0 (0.0%) | 74 (18.5%) |
| 75 to 79 Years | 0 (0.0%) | 56 (14.0%) |
| 80 to 84 Years | 13 (3.5%) | 0 (0.0%) |
| 85 Years and over | 14 (3.7%) | 0 (0.0%) |
| Total | 377 (100.0%) | 400 (100.0%) |
Families and Households in Avalon
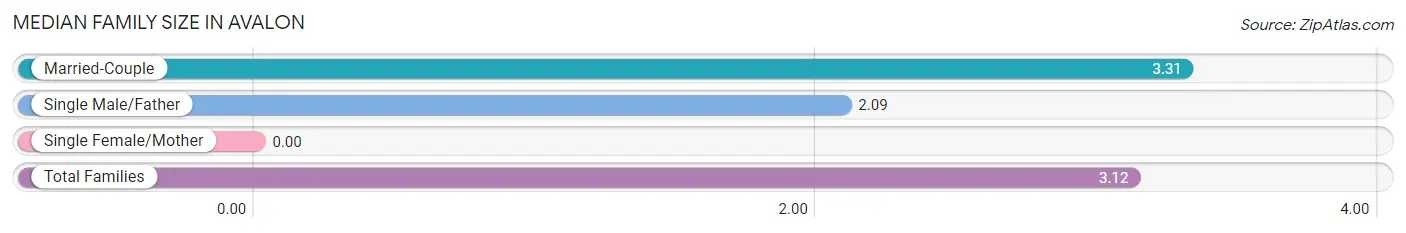
Median Family Size in Avalon
| Family Type | # Families | Family Size |
| Married-Couple | 172 (84.3%) | 3.31 |
| Single Male/Father | 32 (15.7%) | 2.09 |
| Single Female/Mother | 0 (0.0%) | - |
| Total Families | 204 (100.0%) | 3.12 |
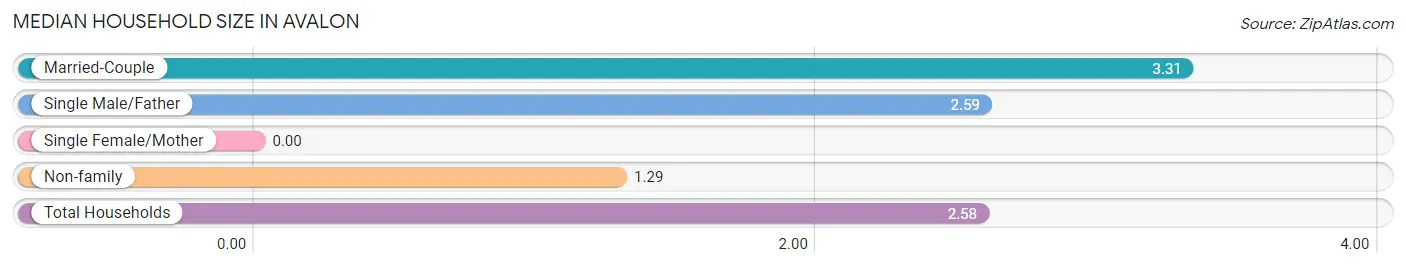
Median Household Size in Avalon
| Household Type | # Households | Household Size |
| Married-Couple | 172 (57.1%) | 3.31 |
| Single Male/Father | 32 (10.6%) | 2.59 |
| Single Female/Mother | 0 (0.0%) | - |
| Non-family | 97 (32.2%) | 1.29 |
| Total Households | 301 (100.0%) | 2.58 |
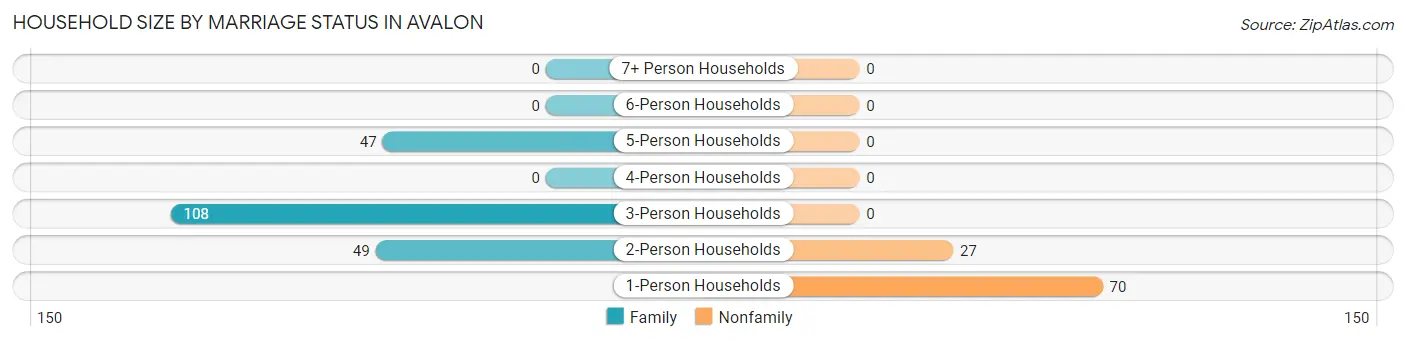
Household Size by Marriage Status in Avalon
Out of a total of 301 households in Avalon, 204 (67.8%) are family households, while 97 (32.2%) are nonfamily households. The most numerous type of family households are 3-person households, comprising 108, and the most common type of nonfamily households are 1-person households, comprising 70.
| Household Size | Family Households | Nonfamily Households |
| 1-Person Households | - | 70 (23.3%) |
| 2-Person Households | 49 (16.3%) | 27 (9.0%) |
| 3-Person Households | 108 (35.9%) | 0 (0.0%) |
| 4-Person Households | 0 (0.0%) | 0 (0.0%) |
| 5-Person Households | 47 (15.6%) | 0 (0.0%) |
| 6-Person Households | 0 (0.0%) | 0 (0.0%) |
| 7+ Person Households | 0 (0.0%) | 0 (0.0%) |
| Total | 204 (67.8%) | 97 (32.2%) |
Female Fertility in Avalon
Fertility by Age in Avalon
| Age Bracket | Women with Births | Births / 1,000 Women |
| 15 to 19 years | 0 (0.0%) | 0.0 |
| 20 to 34 years | 0 (0.0%) | 0.0 |
| 35 to 50 years | 0 (0.0%) | 0.0 |
| Total | 0 (0.0%) | 0.0 |
Fertility by Age by Marriage Status in Avalon
| Age Bracket | Married | Unmarried |
| 15 to 19 years | 0 (0.0%) | 0 (0.0%) |
| 20 to 34 years | 0 (0.0%) | 0 (0.0%) |
| 35 to 50 years | 0 (0.0%) | 0 (0.0%) |
| Total | 0 (0.0%) | 0 (0.0%) |
Fertility by Education in Avalon
| Educational Attainment | Women with Births | Births / 1,000 Women |
| Less than High School | 0 (0.0%) | 0.0 |
| High School Diploma | 0 (0.0%) | 0.0 |
| College or Associate's Degree | 0 (0.0%) | 0.0 |
| Bachelor's Degree | 0 (0.0%) | 0.0 |
| Graduate Degree | 0 (0.0%) | 0.0 |
| Total | 0 (0.0%) | 0.0 |
Fertility by Education by Marriage Status in Avalon
| Educational Attainment | Married | Unmarried |
| Less than High School | 0 (0.0%) | 0 (0.0%) |
| High School Diploma | 0 (0.0%) | 0 (0.0%) |
| College or Associate's Degree | 0 (0.0%) | 0 (0.0%) |
| Bachelor's Degree | 0 (0.0%) | 0 (0.0%) |
| Graduate Degree | 0 (0.0%) | 0 (0.0%) |
| Total | 0 (0.0%) | 0 (0.0%) |
Income in Avalon
Income Overview in Avalon
Per Capita Income in Avalon is $36,216, while median incomes of families and households are $74,063 and $80,809 respectively.
| Characteristic | Number | Measure |
| Per Capita Income | 777 | $36,216 |
| Median Family Income | 204 | $74,063 |
| Mean Family Income | 204 | $85,866 |
| Median Household Income | 301 | $80,809 |
| Mean Household Income | 301 | $91,760 |
| Income Deficit | 204 | $0 |
| Wage / Income Gap (%) | 777 | 45.04% |
| Wage / Income Gap ($) | 777 | 54.96¢ per $1 |
| Gini / Inequality Index | 777 | 0.22 |
Earnings by Sex in Avalon
Average Earnings in Avalon are $39,978, $53,511 for men and $29,408 for women, a difference of 45.0%.
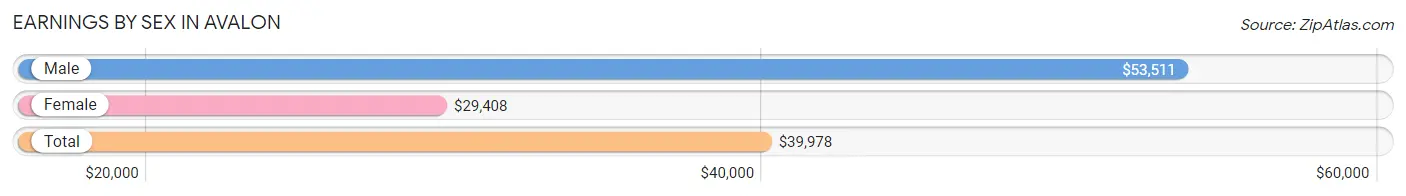
| Sex | Number | Average Earnings |
| Male | 184 (38.6%) | $53,511 |
| Female | 293 (61.4%) | $29,408 |
| Total | 477 (100.0%) | $39,978 |
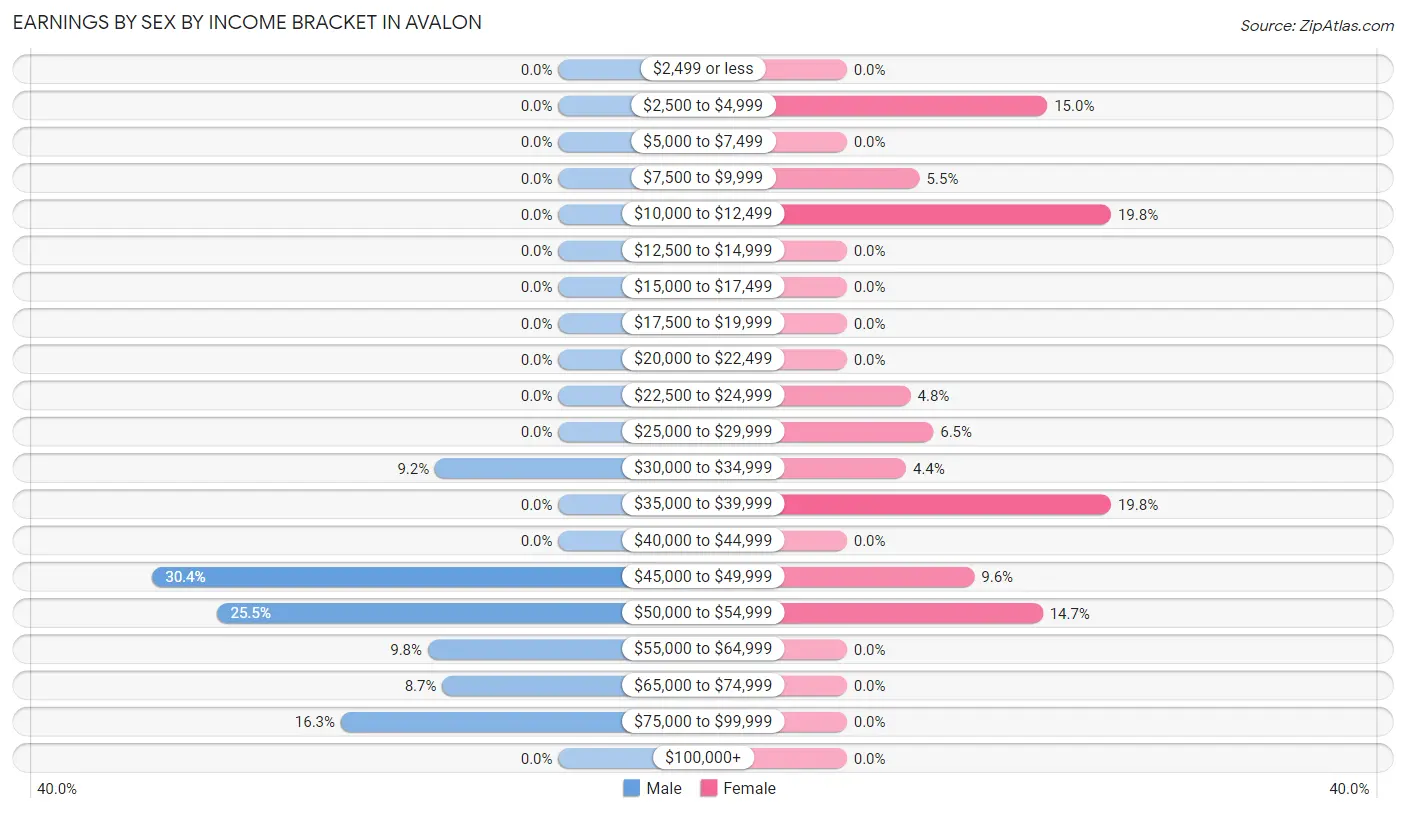
Earnings by Sex by Income Bracket in Avalon
The most common earnings brackets in Avalon are $45,000 to $49,999 for men (56 | 30.4%) and $10,000 to $12,499 for women (58 | 19.8%).
| Income | Male | Female |
| $2,499 or less | 0 (0.0%) | 0 (0.0%) |
| $2,500 to $4,999 | 0 (0.0%) | 44 (15.0%) |
| $5,000 to $7,499 | 0 (0.0%) | 0 (0.0%) |
| $7,500 to $9,999 | 0 (0.0%) | 16 (5.5%) |
| $10,000 to $12,499 | 0 (0.0%) | 58 (19.8%) |
| $12,500 to $14,999 | 0 (0.0%) | 0 (0.0%) |
| $15,000 to $17,499 | 0 (0.0%) | 0 (0.0%) |
| $17,500 to $19,999 | 0 (0.0%) | 0 (0.0%) |
| $20,000 to $22,499 | 0 (0.0%) | 0 (0.0%) |
| $22,500 to $24,999 | 0 (0.0%) | 14 (4.8%) |
| $25,000 to $29,999 | 0 (0.0%) | 19 (6.5%) |
| $30,000 to $34,999 | 17 (9.2%) | 13 (4.4%) |
| $35,000 to $39,999 | 0 (0.0%) | 58 (19.8%) |
| $40,000 to $44,999 | 0 (0.0%) | 0 (0.0%) |
| $45,000 to $49,999 | 56 (30.4%) | 28 (9.6%) |
| $50,000 to $54,999 | 47 (25.5%) | 43 (14.7%) |
| $55,000 to $64,999 | 18 (9.8%) | 0 (0.0%) |
| $65,000 to $74,999 | 16 (8.7%) | 0 (0.0%) |
| $75,000 to $99,999 | 30 (16.3%) | 0 (0.0%) |
| $100,000+ | 0 (0.0%) | 0 (0.0%) |
| Total | 184 (100.0%) | 293 (100.0%) |
Earnings by Sex by Educational Attainment in Avalon
Average earnings in Avalon are $53,511 for men and $37,694 for women, a difference of 29.6%. Men with an educational attainment of college or associate's degree enjoy the highest average annual earnings of $53,644, while those with college or associate's degree education earn the least with $53,644. Women with an educational attainment of college or associate's degree earn the most with the average annual earnings of $24,196, while those with college or associate's degree education have the smallest earnings of $24,196.
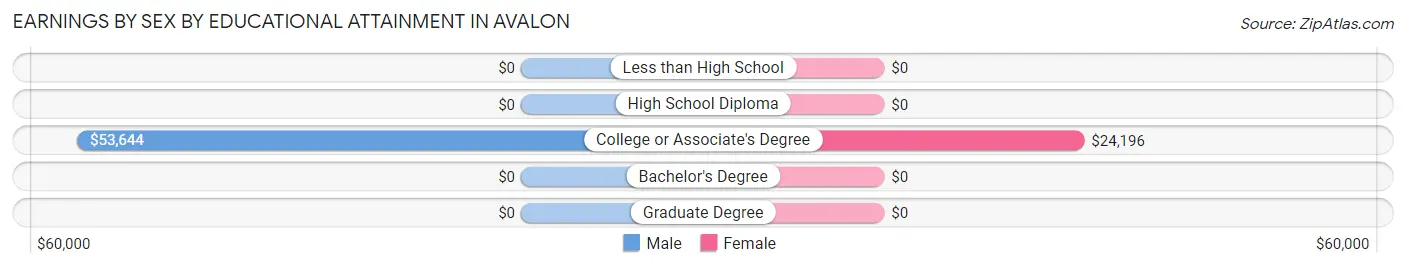
| Educational Attainment | Male Income | Female Income |
| Less than High School | - | - |
| High School Diploma | - | - |
| College or Associate's Degree | $53,644 | $24,196 |
| Bachelor's Degree | - | - |
| Graduate Degree | - | - |
| Total | $53,511 | $37,694 |
Family Income in Avalon
Family Income Brackets in Avalon
According to the Avalon family income data, there are 96 families falling into the $100,000 to $149,999 income range, which is the most common income bracket and makes up 47.1% of all families.
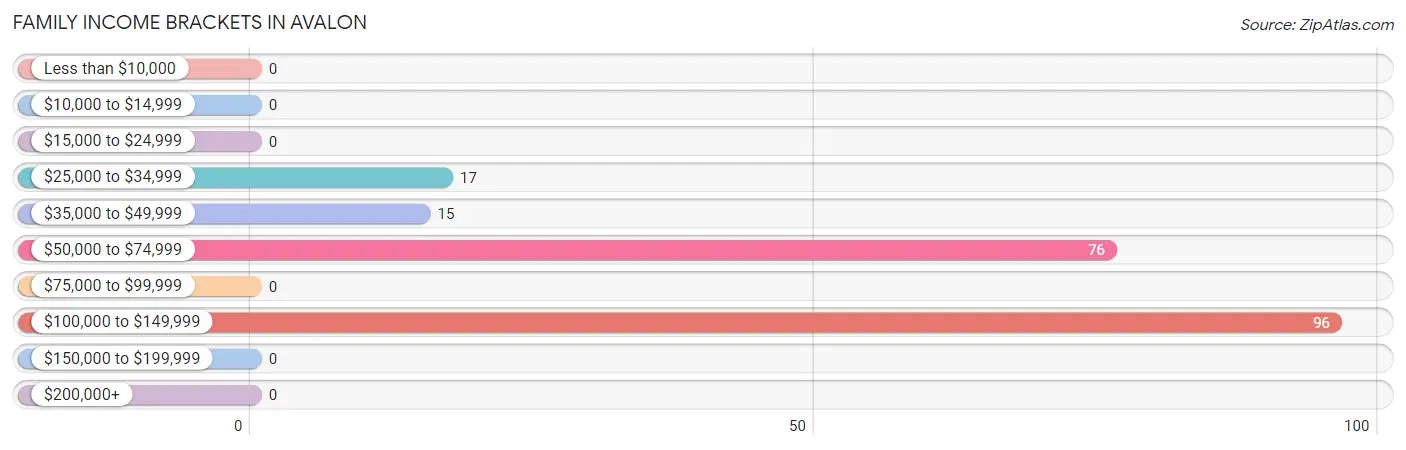
| Income Bracket | # Families | % Families |
| Less than $10,000 | 0 | 0.0% |
| $10,000 to $14,999 | 0 | 0.0% |
| $15,000 to $24,999 | 0 | 0.0% |
| $25,000 to $34,999 | 17 | 8.3% |
| $35,000 to $49,999 | 15 | 7.4% |
| $50,000 to $74,999 | 76 | 37.3% |
| $75,000 to $99,999 | 0 | 0.0% |
| $100,000 to $149,999 | 96 | 47.1% |
| $150,000 to $199,999 | 0 | 0.0% |
| $200,000+ | 0 | 0.0% |
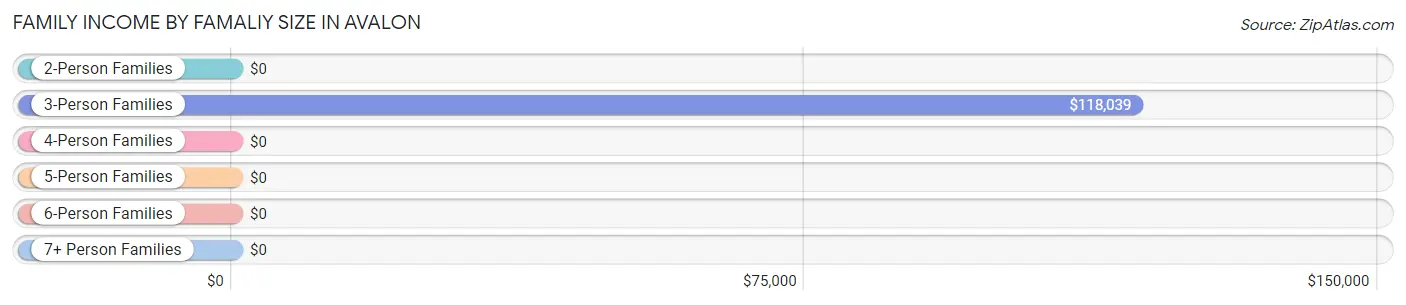
Family Income by Famaliy Size in Avalon
3-person families (91 | 44.6%) account for the highest median family income in Avalon with $118,039 per family, while 3-person families (91 | 44.6%) have the highest median income of $39,346 per family member.
| Income Bracket | # Families | Median Income |
| 2-Person Families | 66 (32.4%) | $0 |
| 3-Person Families | 91 (44.6%) | $118,039 |
| 4-Person Families | 0 (0.0%) | $0 |
| 5-Person Families | 47 (23.0%) | $0 |
| 6-Person Families | 0 (0.0%) | $0 |
| 7+ Person Families | 0 (0.0%) | $0 |
| Total | 204 (100.0%) | $74,063 |
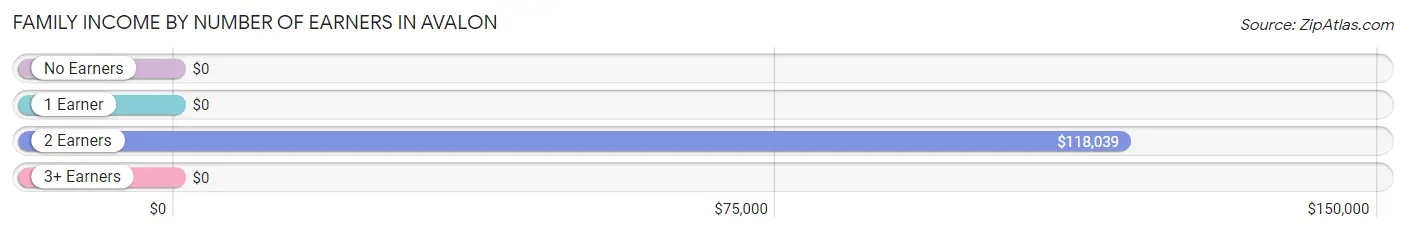
Family Income by Number of Earners in Avalon
| Number of Earners | # Families | Median Income |
| No Earners | 0 (0.0%) | $0 |
| 1 Earner | 66 (32.4%) | $0 |
| 2 Earners | 91 (44.6%) | $118,039 |
| 3+ Earners | 47 (23.0%) | $0 |
| Total | 204 (100.0%) | $74,063 |
Household Income in Avalon
Household Income Brackets in Avalon
With 139 households falling in the category, the $100,000 to $149,999 income range is the most frequent in Avalon, accounting for 46.2% of all households.
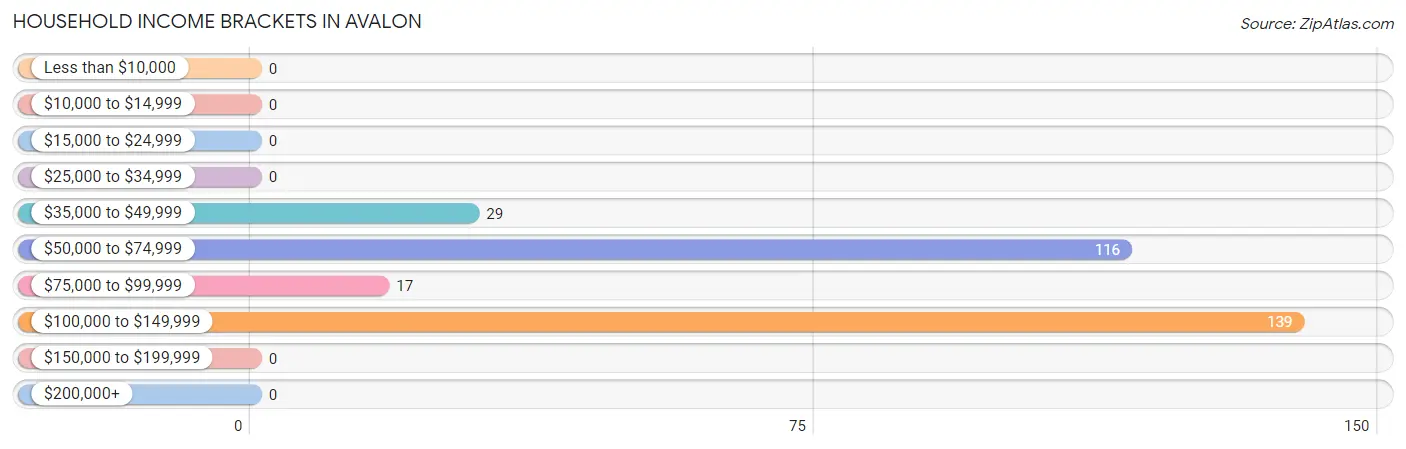
| Income Bracket | # Households | % Households |
| Less than $10,000 | 0 | 0.0% |
| $10,000 to $14,999 | 0 | 0.0% |
| $15,000 to $24,999 | 0 | 0.0% |
| $25,000 to $34,999 | 0 | 0.0% |
| $35,000 to $49,999 | 29 | 9.6% |
| $50,000 to $74,999 | 116 | 38.5% |
| $75,000 to $99,999 | 17 | 5.6% |
| $100,000 to $149,999 | 139 | 46.2% |
| $150,000 to $199,999 | 0 | 0.0% |
| $200,000+ | 0 | 0.0% |
Household Income by Householder Age in Avalon
The median household income in Avalon is $80,809, with the highest median household income of $118,642 found in the 45 to 64 years age bracket for the primary householder. A total of 91 households (30.2%) fall into this category.
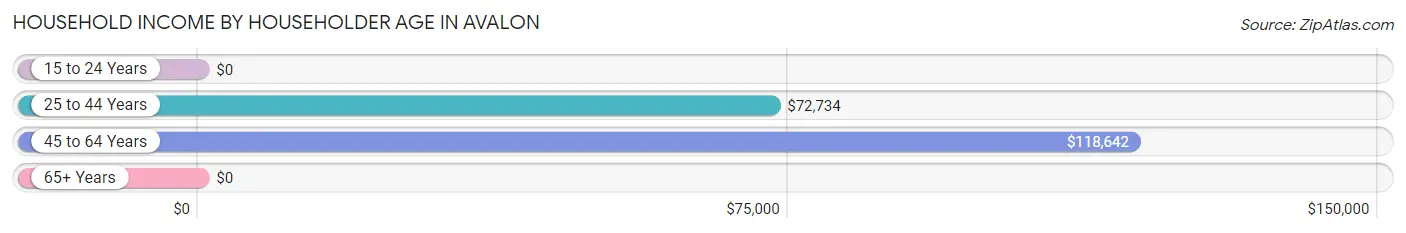
| Income Bracket | # Households | Median Income |
| 15 to 24 Years | 0 (0.0%) | $0 |
| 25 to 44 Years | 97 (32.2%) | $72,734 |
| 45 to 64 Years | 91 (30.2%) | $118,642 |
| 65+ Years | 113 (37.5%) | $0 |
| Total | 301 (100.0%) | $80,809 |
Poverty in Avalon
Income Below Poverty by Sex and Age in Avalon
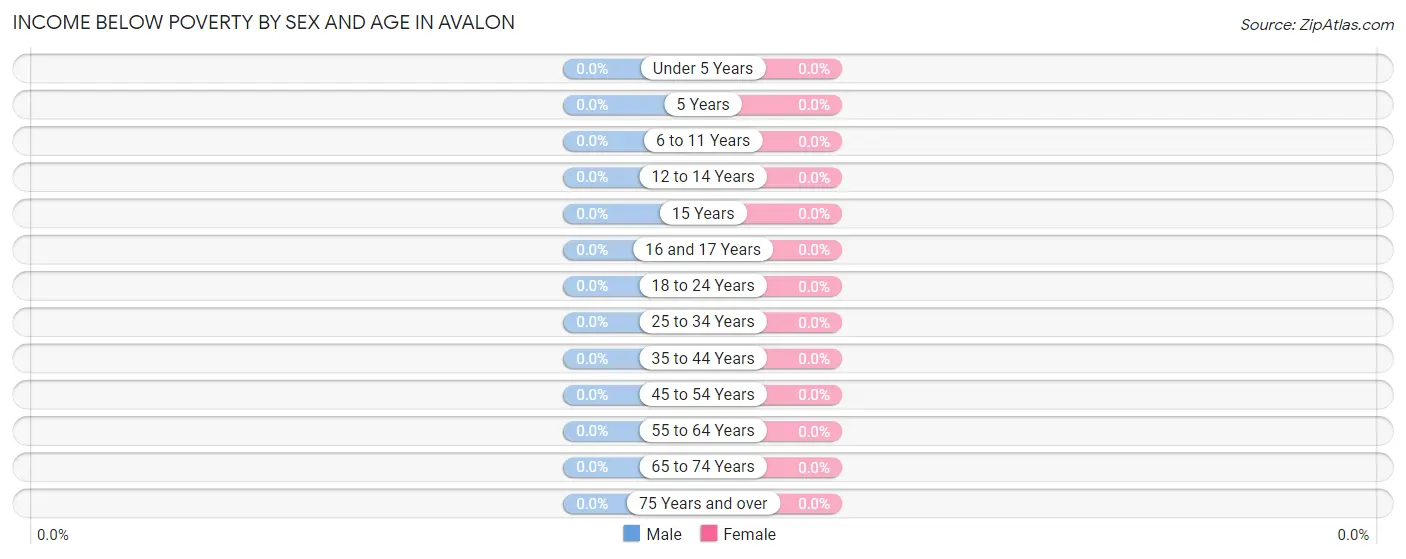
| Age Bracket | Male | Female |
| Under 5 Years | 0 (0.0%) | 0 (0.0%) |
| 5 Years | 0 (0.0%) | 0 (0.0%) |
| 6 to 11 Years | 0 (0.0%) | 0 (0.0%) |
| 12 to 14 Years | 0 (0.0%) | 0 (0.0%) |
| 15 Years | 0 (0.0%) | 0 (0.0%) |
| 16 and 17 Years | 0 (0.0%) | 0 (0.0%) |
| 18 to 24 Years | 0 (0.0%) | 0 (0.0%) |
| 25 to 34 Years | 0 (0.0%) | 0 (0.0%) |
| 35 to 44 Years | 0 (0.0%) | 0 (0.0%) |
| 45 to 54 Years | 0 (0.0%) | 0 (0.0%) |
| 55 to 64 Years | 0 (0.0%) | 0 (0.0%) |
| 65 to 74 Years | 0 (0.0%) | 0 (0.0%) |
| 75 Years and over | 0 (0.0%) | 0 (0.0%) |
| Total | 0 (0.0%) | 0 (0.0%) |
Income Above Poverty by Sex and Age in Avalon
According to the poverty statistics in Avalon, males aged 6 to 11 years and females aged 18 to 24 years are the age groups that are most secure financially, with 100.0% of males and 100.0% of females in these age groups living above the poverty line.
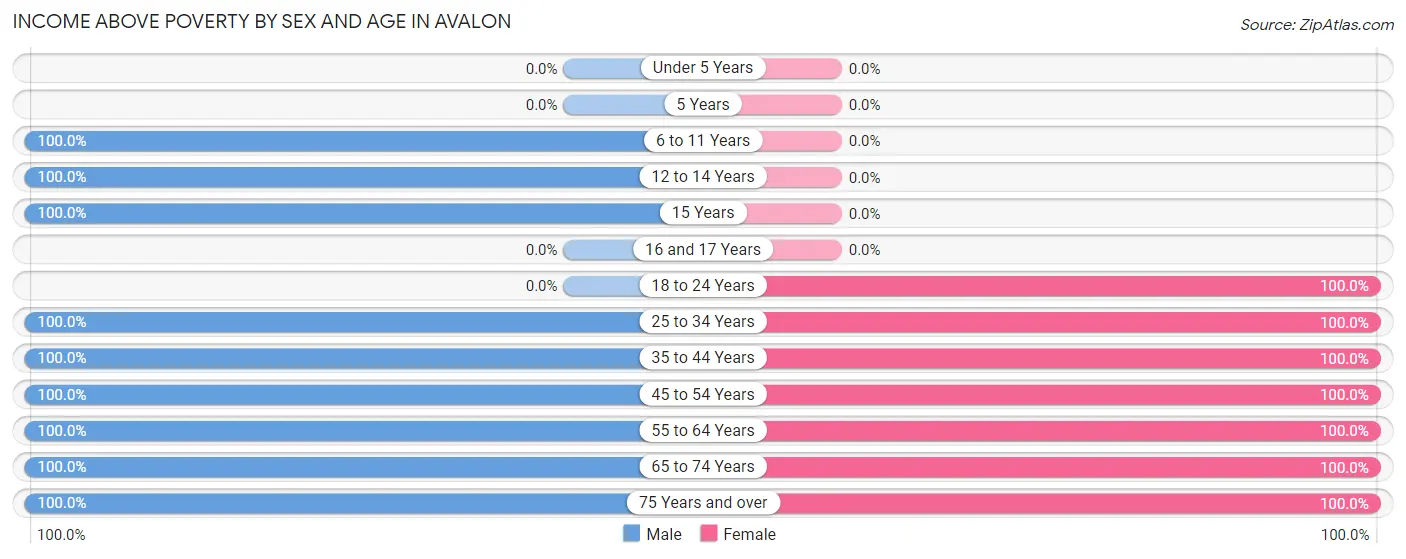
| Age Bracket | Male | Female |
| Under 5 Years | 0 (0.0%) | 0 (0.0%) |
| 5 Years | 0 (0.0%) | 0 (0.0%) |
| 6 to 11 Years | 77 (100.0%) | 0 (0.0%) |
| 12 to 14 Years | 18 (100.0%) | 0 (0.0%) |
| 15 Years | 41 (100.0%) | 0 (0.0%) |
| 16 and 17 Years | 0 (0.0%) | 0 (0.0%) |
| 18 to 24 Years | 0 (0.0%) | 44 (100.0%) |
| 25 to 34 Years | 34 (100.0%) | 35 (100.0%) |
| 35 to 44 Years | 47 (100.0%) | 72 (100.0%) |
| 45 to 54 Years | 74 (100.0%) | 58 (100.0%) |
| 55 to 64 Years | 16 (100.0%) | 47 (100.0%) |
| 65 to 74 Years | 43 (100.0%) | 88 (100.0%) |
| 75 Years and over | 27 (100.0%) | 56 (100.0%) |
| Total | 377 (100.0%) | 400 (100.0%) |
Income Below Poverty Among Married-Couple Families in Avalon
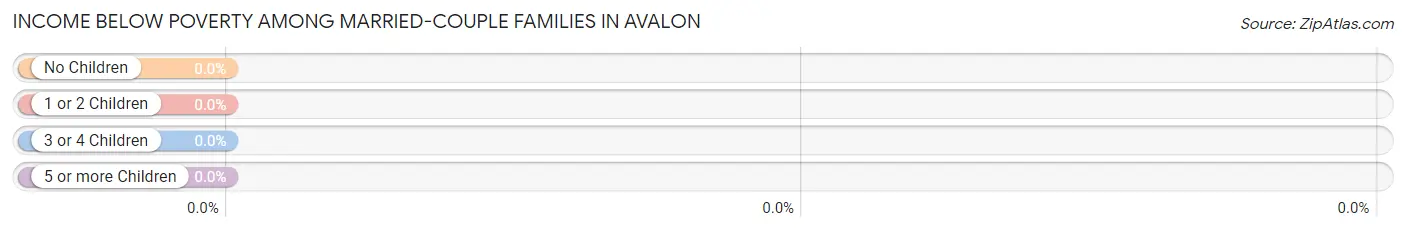
| Children | Above Poverty | Below Poverty |
| No Children | 92 (100.0%) | 0 (0.0%) |
| 1 or 2 Children | 80 (100.0%) | 0 (0.0%) |
| 3 or 4 Children | 0 (0.0%) | 0 (0.0%) |
| 5 or more Children | 0 (0.0%) | 0 (0.0%) |
| Total | 172 (100.0%) | 0 (0.0%) |
Income Below Poverty Among Single-Parent Households in Avalon
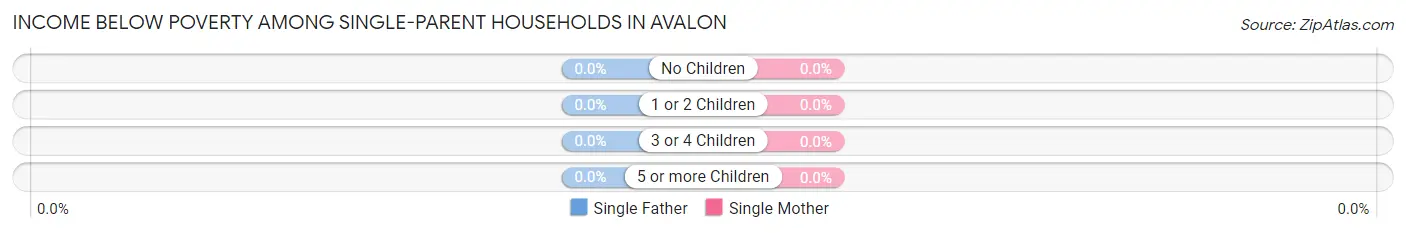
| Children | Single Father | Single Mother |
| No Children | 0 (0.0%) | 0 (0.0%) |
| 1 or 2 Children | 0 (0.0%) | 0 (0.0%) |
| 3 or 4 Children | 0 (0.0%) | 0 (0.0%) |
| 5 or more Children | 0 (0.0%) | 0 (0.0%) |
| Total | 0 (0.0%) | 0 (0.0%) |
Income Below Poverty Among Married-Couple vs Single-Parent Households in Avalon
| Children | Married-Couple Families | Single-Parent Households |
| No Children | 0 (0.0%) | 0 (0.0%) |
| 1 or 2 Children | 0 (0.0%) | 0 (0.0%) |
| 3 or 4 Children | 0 (0.0%) | 0 (0.0%) |
| 5 or more Children | 0 (0.0%) | 0 (0.0%) |
| Total | 0 (0.0%) | 0 (0.0%) |
Employment Characteristics in Avalon
Employment by Class of Employer in Avalon
Among the 461 employed individuals in Avalon, private company employees (265 | 57.5%), not-for-profit organizations (178 | 38.6%), and self-employed (not incorporated) (18 | 3.9%) make up the most common classes of employment.
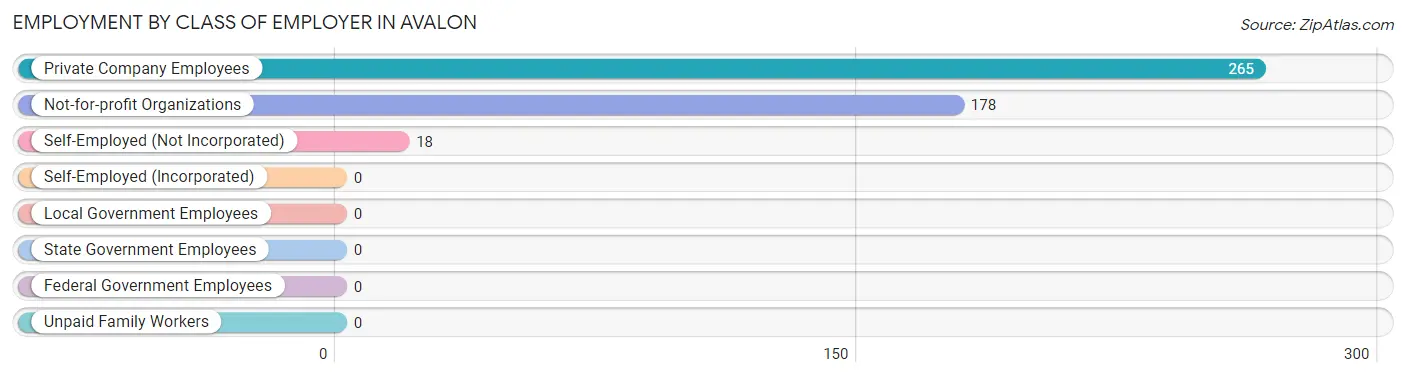
| Employer Class | # Employees | % Employees |
| Private Company Employees | 265 | 57.5% |
| Self-Employed (Incorporated) | 0 | 0.0% |
| Self-Employed (Not Incorporated) | 18 | 3.9% |
| Not-for-profit Organizations | 178 | 38.6% |
| Local Government Employees | 0 | 0.0% |
| State Government Employees | 0 | 0.0% |
| Federal Government Employees | 0 | 0.0% |
| Unpaid Family Workers | 0 | 0.0% |
| Total | 461 | 100.0% |
Employment Status by Age in Avalon
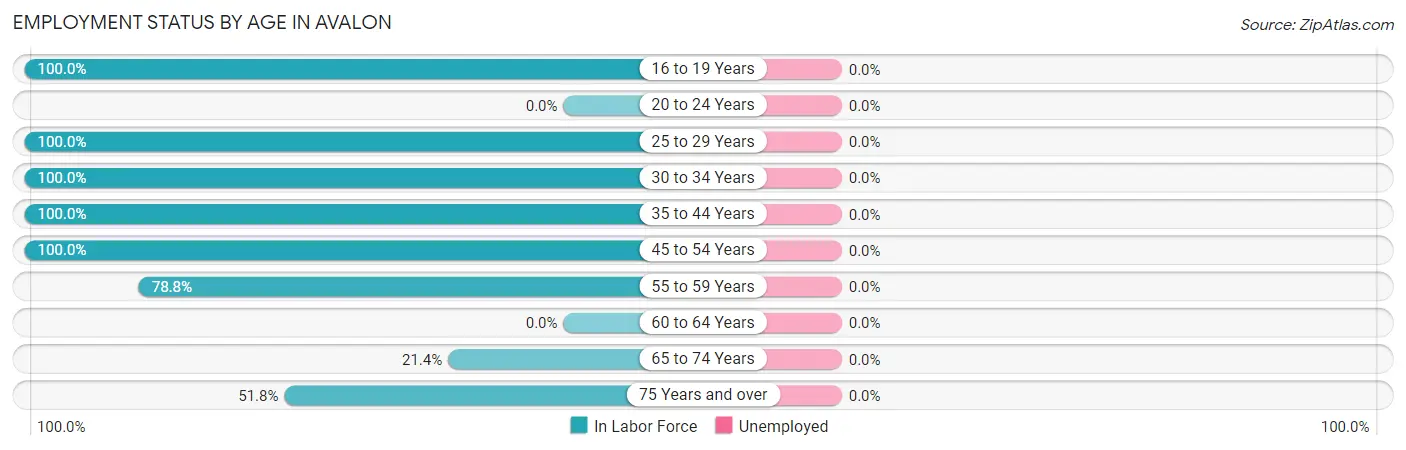
| Age Bracket | In Labor Force | Unemployed |
| 16 to 19 Years | 44 (100.0%) | 0 (0.0%) |
| 20 to 24 Years | 0 (0.0%) | 0 (0.0%) |
| 25 to 29 Years | 52 (100.0%) | 0 (0.0%) |
| 30 to 34 Years | 17 (100.0%) | 0 (0.0%) |
| 35 to 44 Years | 119 (100.0%) | 0 (0.0%) |
| 45 to 54 Years | 132 (100.0%) | 0 (0.0%) |
| 55 to 59 Years | 26 (78.8%) | 0 (0.0%) |
| 60 to 64 Years | 0 (0.0%) | 0 (0.0%) |
| 65 to 74 Years | 28 (21.4%) | 0 (0.0%) |
| 75 Years and over | 43 (51.8%) | 0 (0.0%) |
| Total | 461 (71.9%) | 0 (0.0%) |
Employment Status by Educational Attainment in Avalon
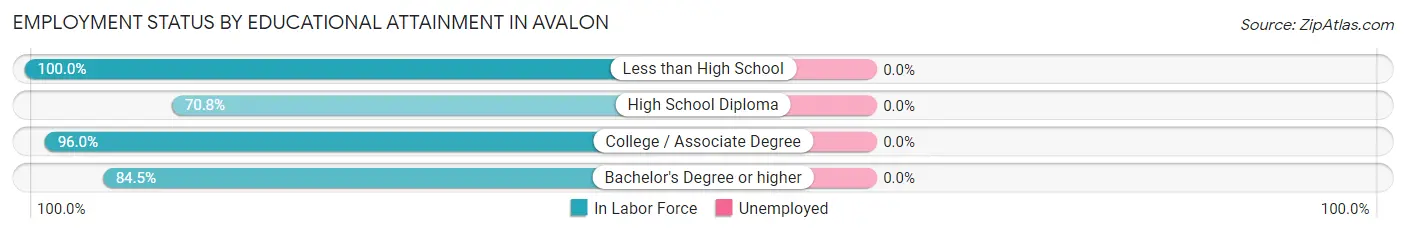
| Educational Attainment | In Labor Force | Unemployed |
| Less than High School | 56 (100.0%) | 0 (0.0%) |
| High School Diploma | 34 (70.8%) | 0 (0.0%) |
| College / Associate Degree | 169 (96.0%) | 0 (0.0%) |
| Bachelor's Degree or higher | 87 (84.5%) | 0 (0.0%) |
| Total | 346 (90.3%) | 0 (0.0%) |
Employment Occupations by Sex in Avalon
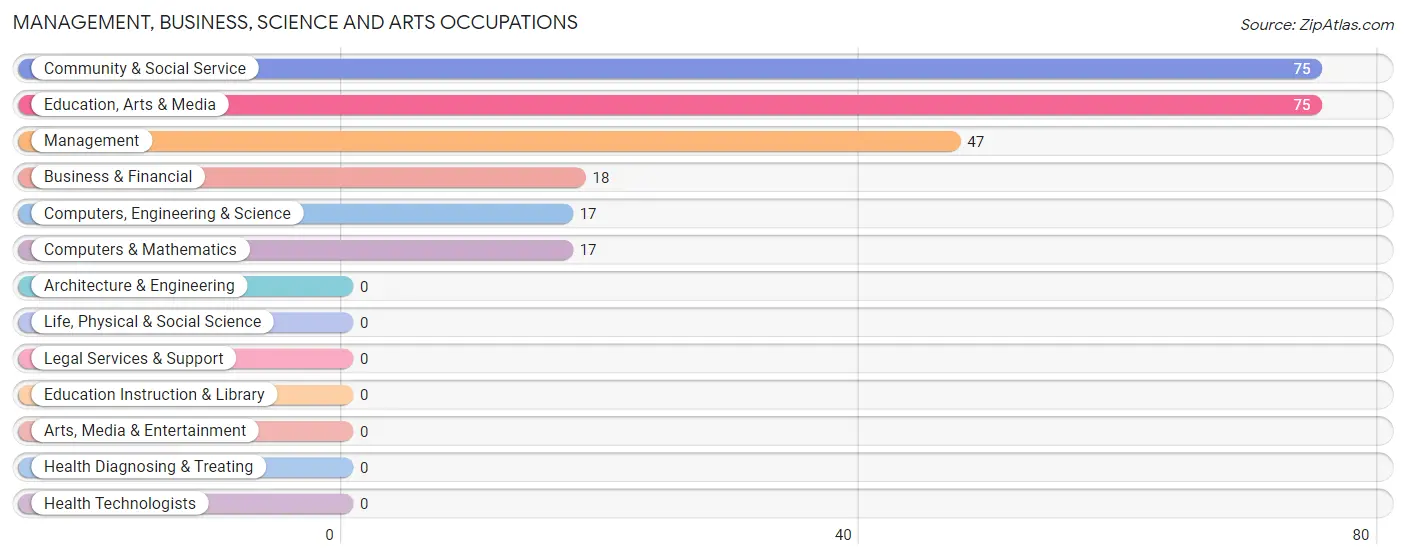
Management, Business, Science and Arts Occupations
The most common Management, Business, Science and Arts occupations in Avalon are Community & Social Service (75 | 16.3%), Education, Arts & Media (75 | 16.3%), Management (47 | 10.2%), Business & Financial (18 | 3.9%), and Computers, Engineering & Science (17 | 3.7%).
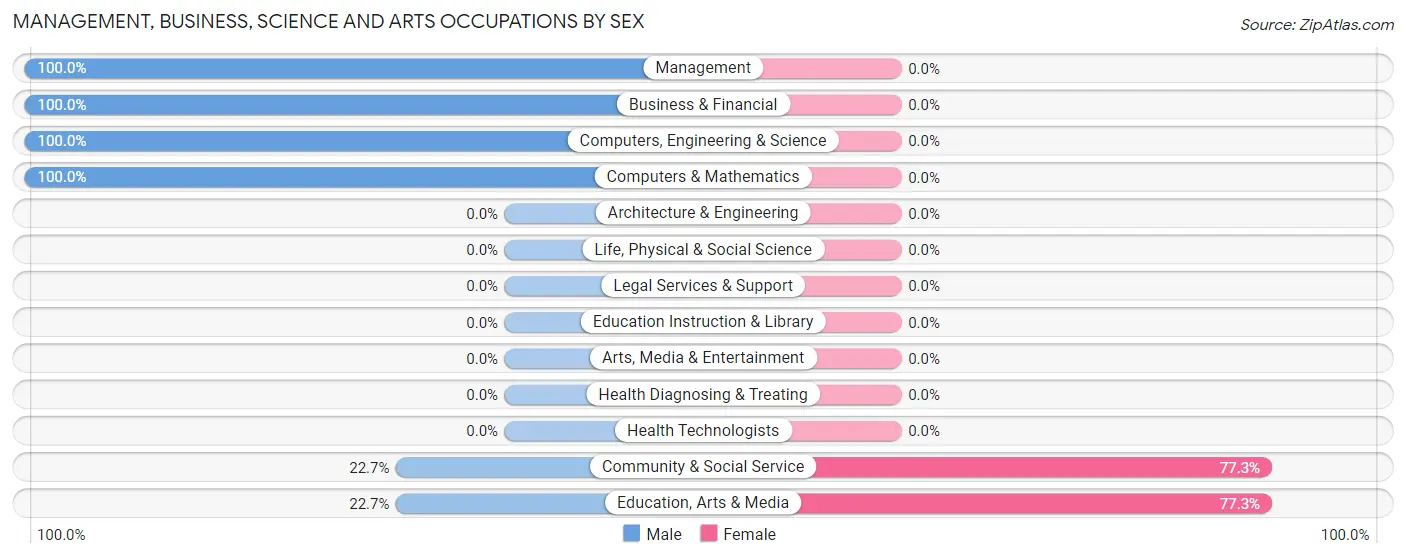
Management, Business, Science and Arts Occupations by Sex
Within the Management, Business, Science and Arts occupations in Avalon, the most male-oriented occupations are Management (100.0%), Business & Financial (100.0%), and Computers, Engineering & Science (100.0%), while the most female-oriented occupations are Community & Social Service (77.3%), and Education, Arts & Media (77.3%).
| Occupation | Male | Female |
| Management | 47 (100.0%) | 0 (0.0%) |
| Business & Financial | 18 (100.0%) | 0 (0.0%) |
| Computers, Engineering & Science | 17 (100.0%) | 0 (0.0%) |
| Computers & Mathematics | 17 (100.0%) | 0 (0.0%) |
| Architecture & Engineering | 0 (0.0%) | 0 (0.0%) |
| Life, Physical & Social Science | 0 (0.0%) | 0 (0.0%) |
| Community & Social Service | 17 (22.7%) | 58 (77.3%) |
| Education, Arts & Media | 17 (22.7%) | 58 (77.3%) |
| Legal Services & Support | 0 (0.0%) | 0 (0.0%) |
| Education Instruction & Library | 0 (0.0%) | 0 (0.0%) |
| Arts, Media & Entertainment | 0 (0.0%) | 0 (0.0%) |
| Health Diagnosing & Treating | 0 (0.0%) | 0 (0.0%) |
| Health Technologists | 0 (0.0%) | 0 (0.0%) |
| Total (Category) | 99 (63.1%) | 58 (36.9%) |
| Total (Overall) | 168 (36.4%) | 293 (63.6%) |
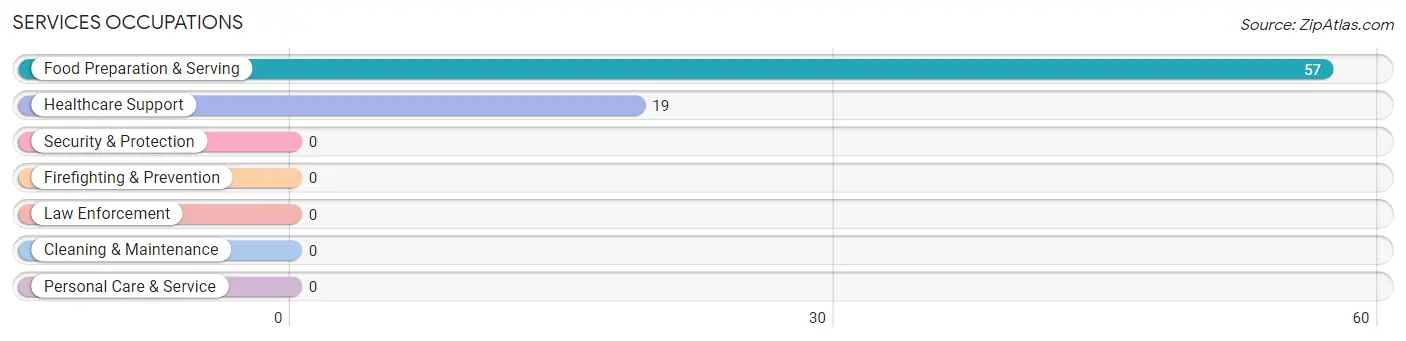
Services Occupations
The most common Services occupations in Avalon are Food Preparation & Serving (57 | 12.4%), and Healthcare Support (19 | 4.1%).
Services Occupations by Sex
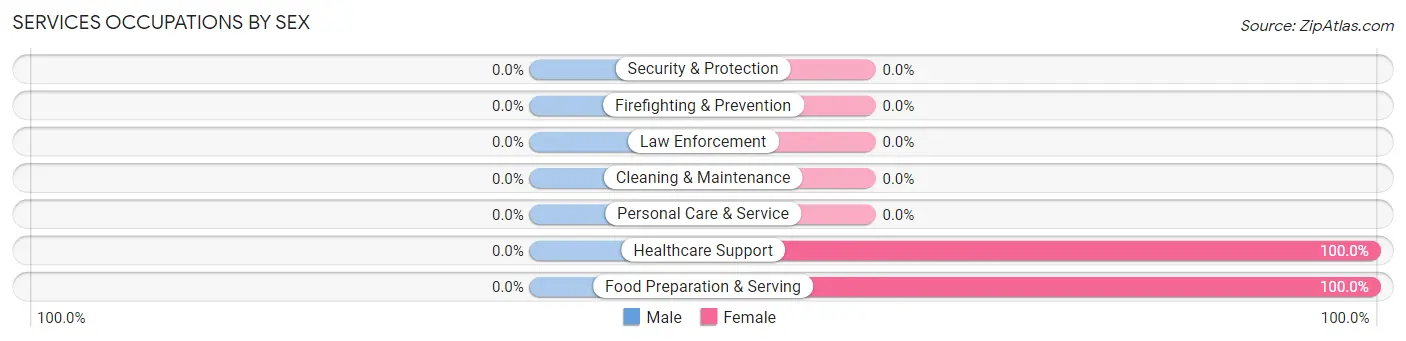
| Occupation | Male | Female |
| Healthcare Support | 0 (0.0%) | 19 (100.0%) |
| Security & Protection | 0 (0.0%) | 0 (0.0%) |
| Firefighting & Prevention | 0 (0.0%) | 0 (0.0%) |
| Law Enforcement | 0 (0.0%) | 0 (0.0%) |
| Food Preparation & Serving | 0 (0.0%) | 57 (100.0%) |
| Cleaning & Maintenance | 0 (0.0%) | 0 (0.0%) |
| Personal Care & Service | 0 (0.0%) | 0 (0.0%) |
| Total (Category) | 0 (0.0%) | 76 (100.0%) |
| Total (Overall) | 168 (36.4%) | 293 (63.6%) |
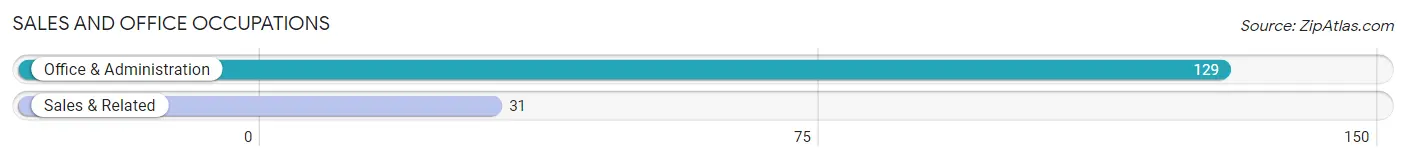
Sales and Office Occupations
The most common Sales and Office occupations in Avalon are Office & Administration (129 | 28.0%), and Sales & Related (31 | 6.7%).
Sales and Office Occupations by Sex
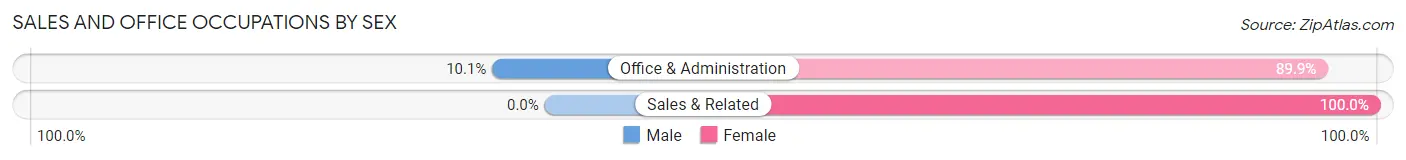
| Occupation | Male | Female |
| Sales & Related | 0 (0.0%) | 31 (100.0%) |
| Office & Administration | 13 (10.1%) | 116 (89.9%) |
| Total (Category) | 13 (8.1%) | 147 (91.9%) |
| Total (Overall) | 168 (36.4%) | 293 (63.6%) |
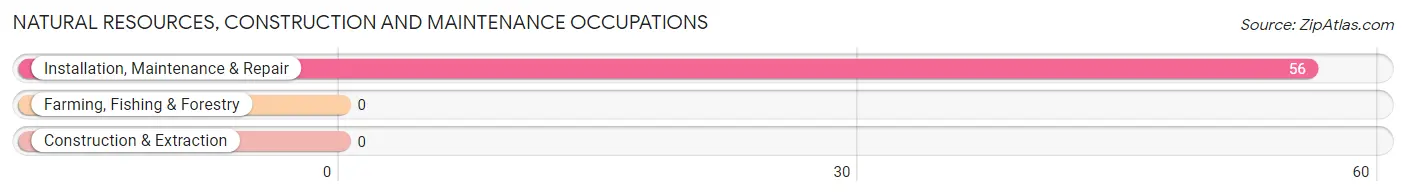
Natural Resources, Construction and Maintenance Occupations
The most common Natural Resources, Construction and Maintenance occupations in Avalon are , and Installation, Maintenance & Repair (56 | 12.1%).
Natural Resources, Construction and Maintenance Occupations by Sex
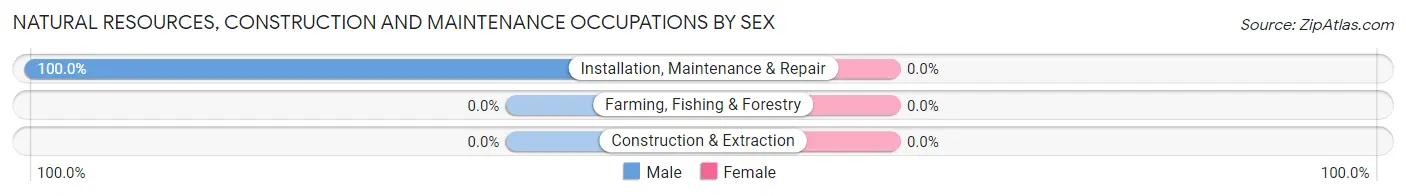
| Occupation | Male | Female |
| Farming, Fishing & Forestry | 0 (0.0%) | 0 (0.0%) |
| Construction & Extraction | 0 (0.0%) | 0 (0.0%) |
| Installation, Maintenance & Repair | 56 (100.0%) | 0 (0.0%) |
| Total (Category) | 56 (100.0%) | 0 (0.0%) |
| Total (Overall) | 168 (36.4%) | 293 (63.6%) |
Production, Transportation and Moving Occupations
The most common Production, Transportation and Moving occupations in Avalon are , and Transportation (12 | 2.6%).
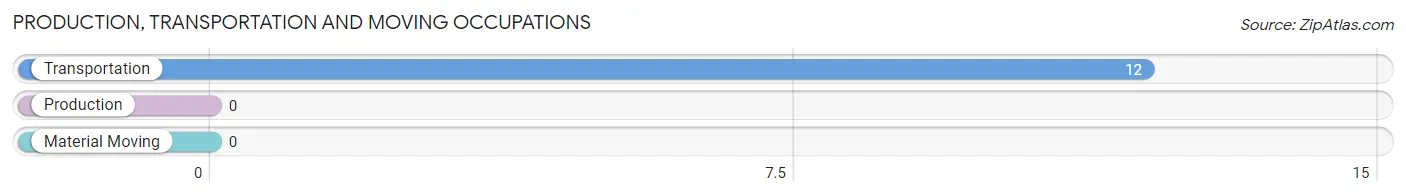
Production, Transportation and Moving Occupations by Sex
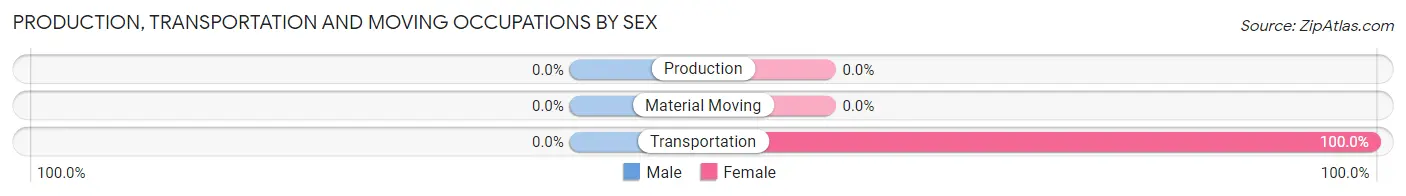
| Occupation | Male | Female |
| Production | 0 (0.0%) | 0 (0.0%) |
| Transportation | 0 (0.0%) | 12 (100.0%) |
| Material Moving | 0 (0.0%) | 0 (0.0%) |
| Total (Category) | 0 (0.0%) | 12 (100.0%) |
| Total (Overall) | 168 (36.4%) | 293 (63.6%) |
Employment Industries by Sex in Avalon
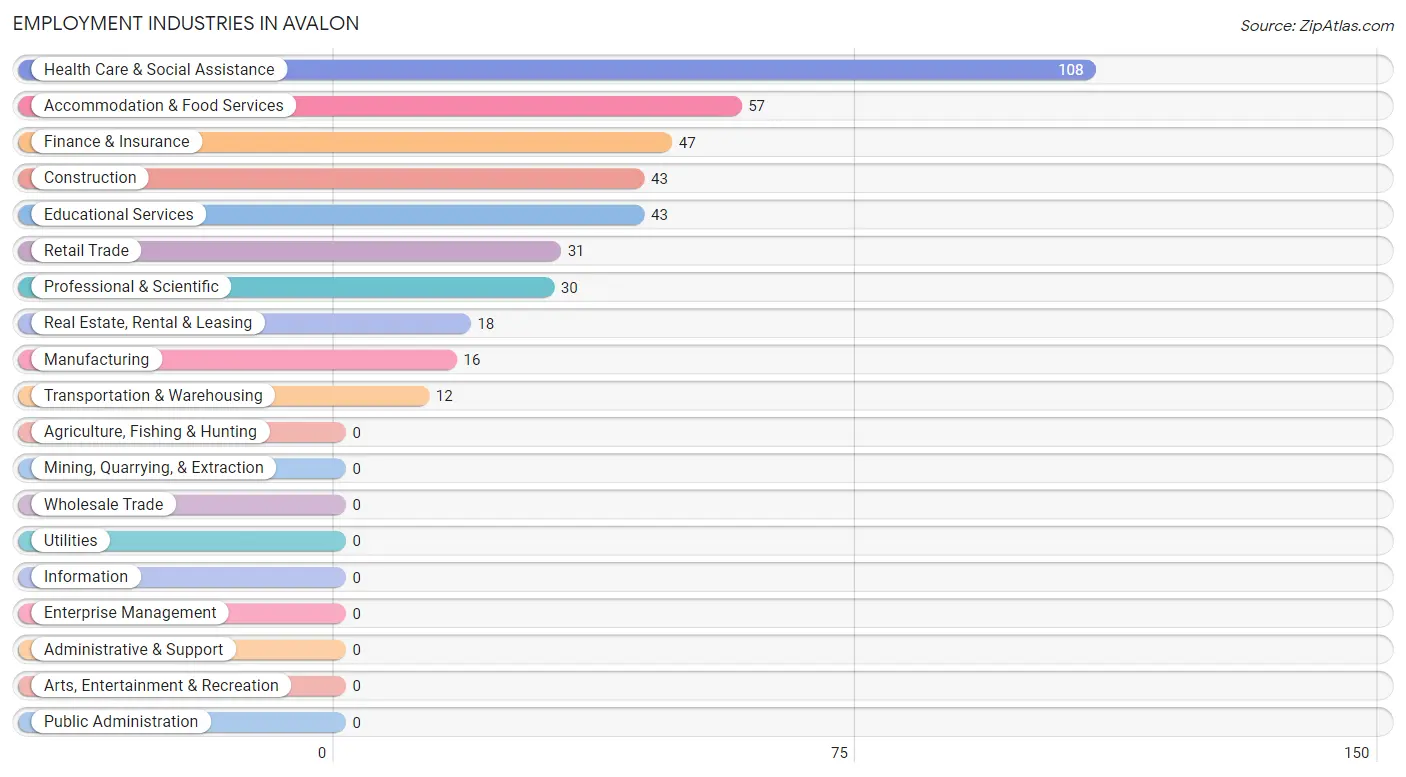
Employment Industries in Avalon
The major employment industries in Avalon include Health Care & Social Assistance (108 | 23.4%), Accommodation & Food Services (57 | 12.4%), Finance & Insurance (47 | 10.2%), Construction (43 | 9.3%), and Educational Services (43 | 9.3%).
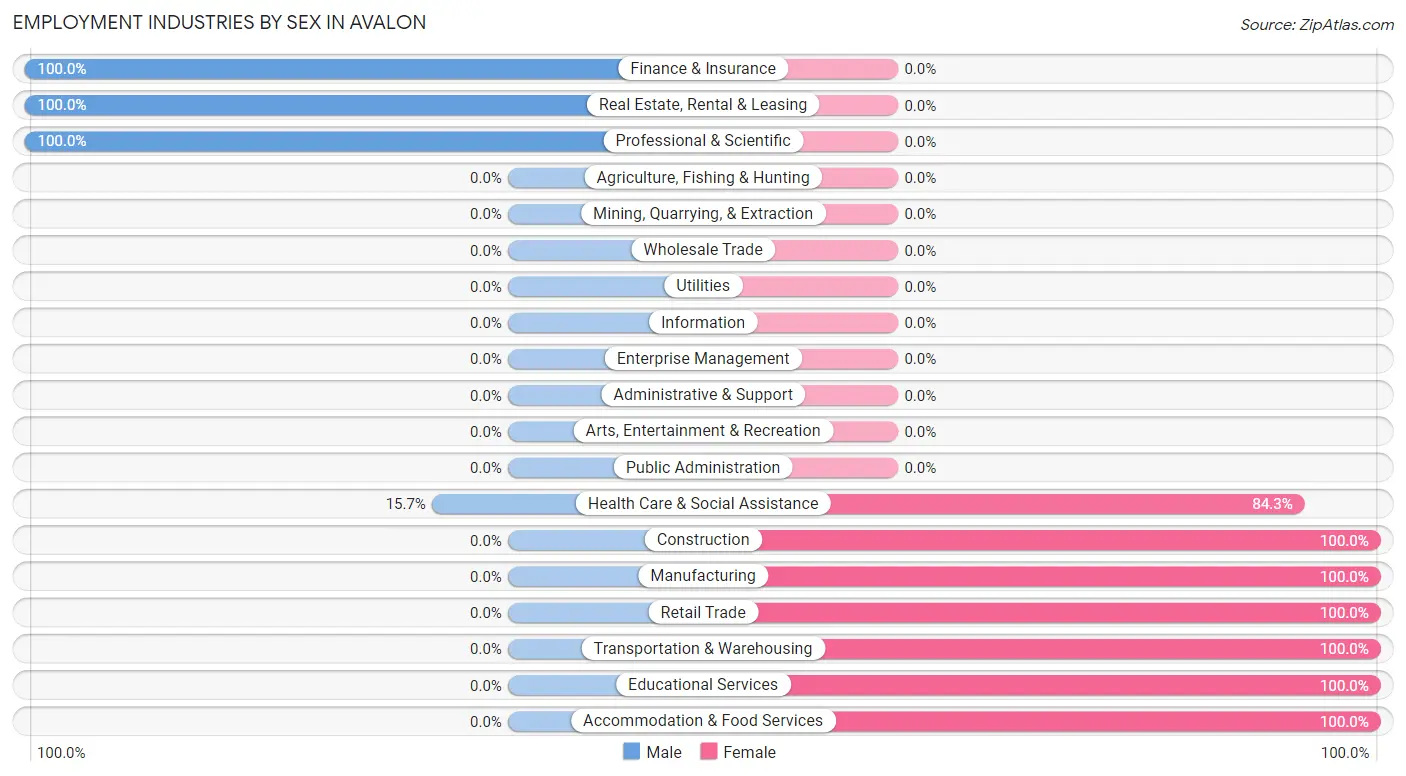
Employment Industries by Sex in Avalon
The Avalon industries that see more men than women are Finance & Insurance (100.0%), Real Estate, Rental & Leasing (100.0%), and Professional & Scientific (100.0%), whereas the industries that tend to have a higher number of women are Construction (100.0%), Manufacturing (100.0%), and Retail Trade (100.0%).
| Industry | Male | Female |
| Agriculture, Fishing & Hunting | 0 (0.0%) | 0 (0.0%) |
| Mining, Quarrying, & Extraction | 0 (0.0%) | 0 (0.0%) |
| Construction | 0 (0.0%) | 43 (100.0%) |
| Manufacturing | 0 (0.0%) | 16 (100.0%) |
| Wholesale Trade | 0 (0.0%) | 0 (0.0%) |
| Retail Trade | 0 (0.0%) | 31 (100.0%) |
| Transportation & Warehousing | 0 (0.0%) | 12 (100.0%) |
| Utilities | 0 (0.0%) | 0 (0.0%) |
| Information | 0 (0.0%) | 0 (0.0%) |
| Finance & Insurance | 47 (100.0%) | 0 (0.0%) |
| Real Estate, Rental & Leasing | 18 (100.0%) | 0 (0.0%) |
| Professional & Scientific | 30 (100.0%) | 0 (0.0%) |
| Enterprise Management | 0 (0.0%) | 0 (0.0%) |
| Administrative & Support | 0 (0.0%) | 0 (0.0%) |
| Educational Services | 0 (0.0%) | 43 (100.0%) |
| Health Care & Social Assistance | 17 (15.7%) | 91 (84.3%) |
| Arts, Entertainment & Recreation | 0 (0.0%) | 0 (0.0%) |
| Accommodation & Food Services | 0 (0.0%) | 57 (100.0%) |
| Public Administration | 0 (0.0%) | 0 (0.0%) |
| Total | 168 (36.4%) | 293 (63.6%) |
Education in Avalon
School Enrollment in Avalon
The most common levels of schooling among the 185 students in Avalon are high school (103 | 55.7%), elementary school (47 | 25.4%), and college / undergraduate (19 | 10.3%).
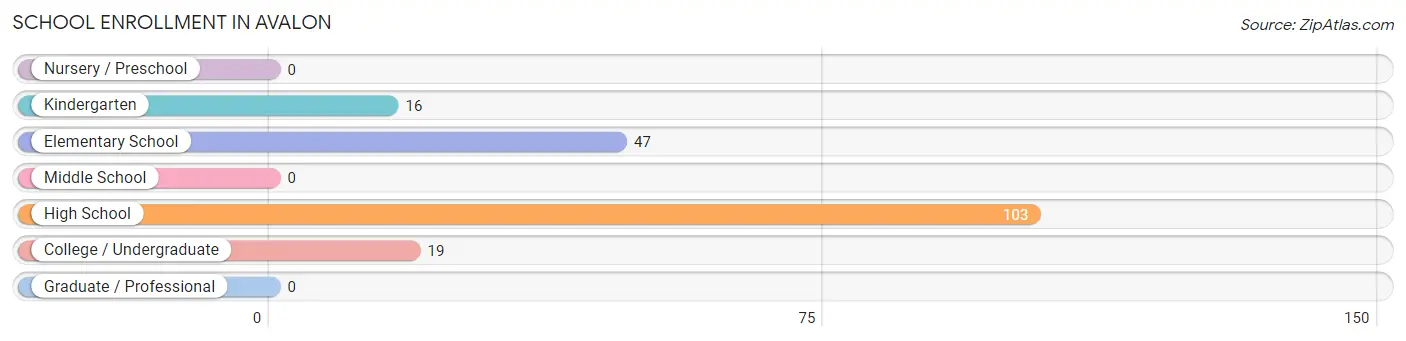
| School Level | # Students | % Students |
| Nursery / Preschool | 0 | 0.0% |
| Kindergarten | 16 | 8.6% |
| Elementary School | 47 | 25.4% |
| Middle School | 0 | 0.0% |
| High School | 103 | 55.7% |
| College / Undergraduate | 19 | 10.3% |
| Graduate / Professional | 0 | 0.0% |
| Total | 185 | 100.0% |
School Enrollment by Age by Funding Source in Avalon
Out of a total of 185 students who are enrolled in schools in Avalon, 34 (18.4%) attend a private institution, while the remaining 151 (81.6%) are enrolled in public schools. The age group of 10 to 14 year olds has the highest likelihood of being enrolled in private schools, with 18 (100.0% in the age bracket) enrolled. Conversely, the age group of 15 to 17 year olds has the lowest likelihood of being enrolled in a private school, with 41 (100.0% in the age bracket) attending a public institution.
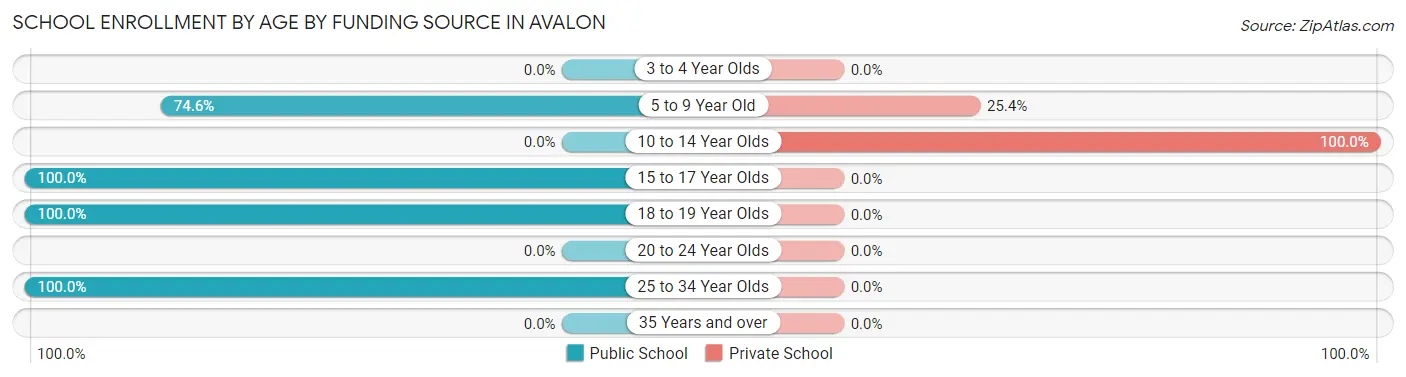
| Age Bracket | Public School | Private School |
| 3 to 4 Year Olds | 0 (0.0%) | 0 (0.0%) |
| 5 to 9 Year Old | 47 (74.6%) | 16 (25.4%) |
| 10 to 14 Year Olds | 0 (0.0%) | 18 (100.0%) |
| 15 to 17 Year Olds | 41 (100.0%) | 0 (0.0%) |
| 18 to 19 Year Olds | 44 (100.0%) | 0 (0.0%) |
| 20 to 24 Year Olds | 0 (0.0%) | 0 (0.0%) |
| 25 to 34 Year Olds | 19 (100.0%) | 0 (0.0%) |
| 35 Years and over | 0 (0.0%) | 0 (0.0%) |
| Total | 151 (81.6%) | 34 (18.4%) |
Educational Attainment by Field of Study in Avalon
Arts & humanities (58 | 49.1%), engineering (33 | 28.0%), business (15 | 12.7%), and communications (12 | 10.2%) are the most common fields of study among 118 individuals in Avalon who have obtained a bachelor's degree or higher.
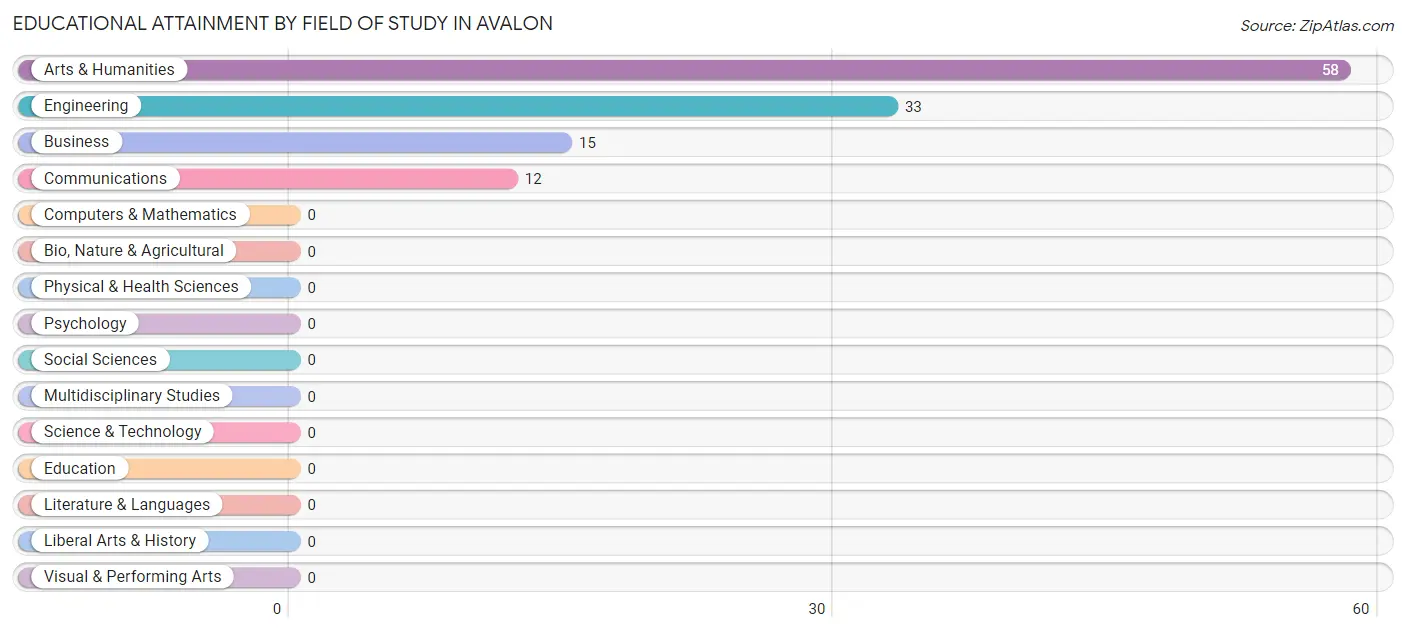
| Field of Study | # Graduates | % Graduates |
| Computers & Mathematics | 0 | 0.0% |
| Bio, Nature & Agricultural | 0 | 0.0% |
| Physical & Health Sciences | 0 | 0.0% |
| Psychology | 0 | 0.0% |
| Social Sciences | 0 | 0.0% |
| Engineering | 33 | 28.0% |
| Multidisciplinary Studies | 0 | 0.0% |
| Science & Technology | 0 | 0.0% |
| Business | 15 | 12.7% |
| Education | 0 | 0.0% |
| Literature & Languages | 0 | 0.0% |
| Liberal Arts & History | 0 | 0.0% |
| Visual & Performing Arts | 0 | 0.0% |
| Communications | 12 | 10.2% |
| Arts & Humanities | 58 | 49.1% |
| Total | 118 | 100.0% |
Transportation & Commute in Avalon
Vehicle Availability by Sex in Avalon
The most prevalent vehicle ownership categories in Avalon are males with 3 vehicles (82, accounting for 48.8%) and females with 3 vehicles (164, making up 28.0%).
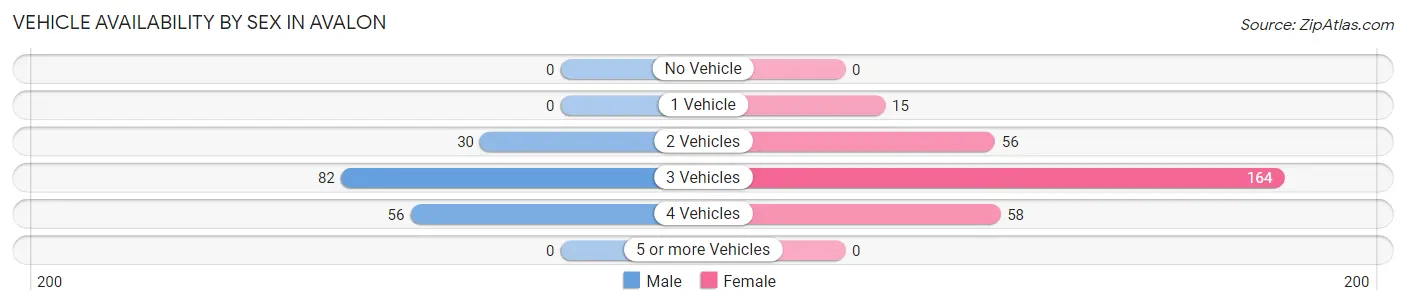
| Vehicles Available | Male | Female |
| No Vehicle | 0 (0.0%) | 0 (0.0%) |
| 1 Vehicle | 0 (0.0%) | 15 (5.1%) |
| 2 Vehicles | 30 (17.9%) | 56 (19.1%) |
| 3 Vehicles | 82 (48.8%) | 164 (56.0%) |
| 4 Vehicles | 56 (33.3%) | 58 (19.8%) |
| 5 or more Vehicles | 0 (0.0%) | 0 (0.0%) |
| Total | 168 (100.0%) | 293 (100.0%) |
Commute Time in Avalon
The most frequently occuring commute durations in Avalon are 20 to 24 minutes (130 commuters, 33.9%), 30 to 34 minutes (90 commuters, 23.4%), and 15 to 19 minutes (57 commuters, 14.8%).
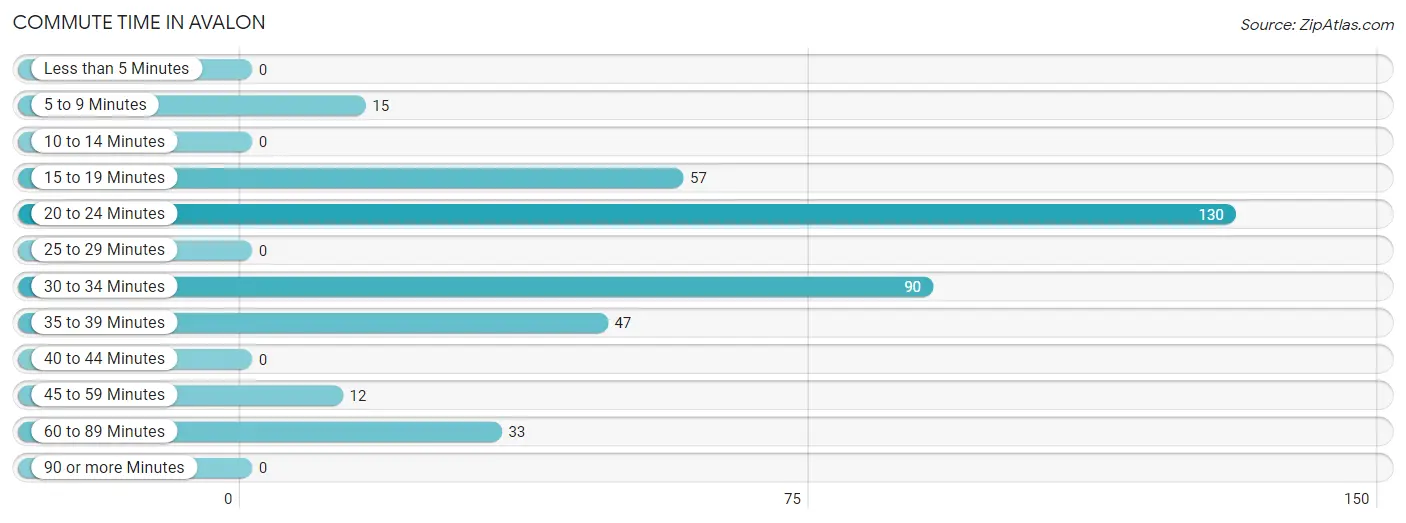
| Commute Time | # Commuters | % Commuters |
| Less than 5 Minutes | 0 | 0.0% |
| 5 to 9 Minutes | 15 | 3.9% |
| 10 to 14 Minutes | 0 | 0.0% |
| 15 to 19 Minutes | 57 | 14.8% |
| 20 to 24 Minutes | 130 | 33.9% |
| 25 to 29 Minutes | 0 | 0.0% |
| 30 to 34 Minutes | 90 | 23.4% |
| 35 to 39 Minutes | 47 | 12.2% |
| 40 to 44 Minutes | 0 | 0.0% |
| 45 to 59 Minutes | 12 | 3.1% |
| 60 to 89 Minutes | 33 | 8.6% |
| 90 or more Minutes | 0 | 0.0% |
Commute Time by Sex in Avalon
The most common commute times in Avalon are 20 to 24 minutes (73 commuters, 48.7%) for males and 30 to 34 minutes (77 commuters, 32.9%) for females.
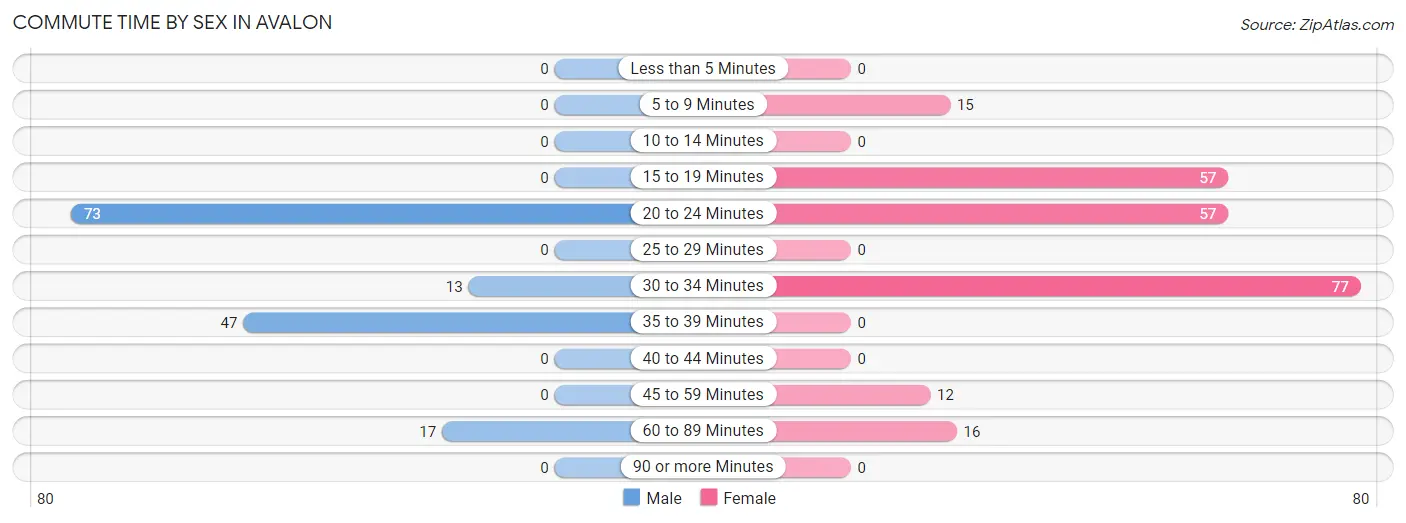
| Commute Time | Male | Female |
| Less than 5 Minutes | 0 (0.0%) | 0 (0.0%) |
| 5 to 9 Minutes | 0 (0.0%) | 15 (6.4%) |
| 10 to 14 Minutes | 0 (0.0%) | 0 (0.0%) |
| 15 to 19 Minutes | 0 (0.0%) | 57 (24.4%) |
| 20 to 24 Minutes | 73 (48.7%) | 57 (24.4%) |
| 25 to 29 Minutes | 0 (0.0%) | 0 (0.0%) |
| 30 to 34 Minutes | 13 (8.7%) | 77 (32.9%) |
| 35 to 39 Minutes | 47 (31.3%) | 0 (0.0%) |
| 40 to 44 Minutes | 0 (0.0%) | 0 (0.0%) |
| 45 to 59 Minutes | 0 (0.0%) | 12 (5.1%) |
| 60 to 89 Minutes | 17 (11.3%) | 16 (6.8%) |
| 90 or more Minutes | 0 (0.0%) | 0 (0.0%) |
Time of Departure to Work by Sex in Avalon
The most frequent times of departure to work in Avalon are 7:00 AM to 7:29 AM (73, 48.7%) for males and 7:00 AM to 7:29 AM (74, 31.6%) for females.
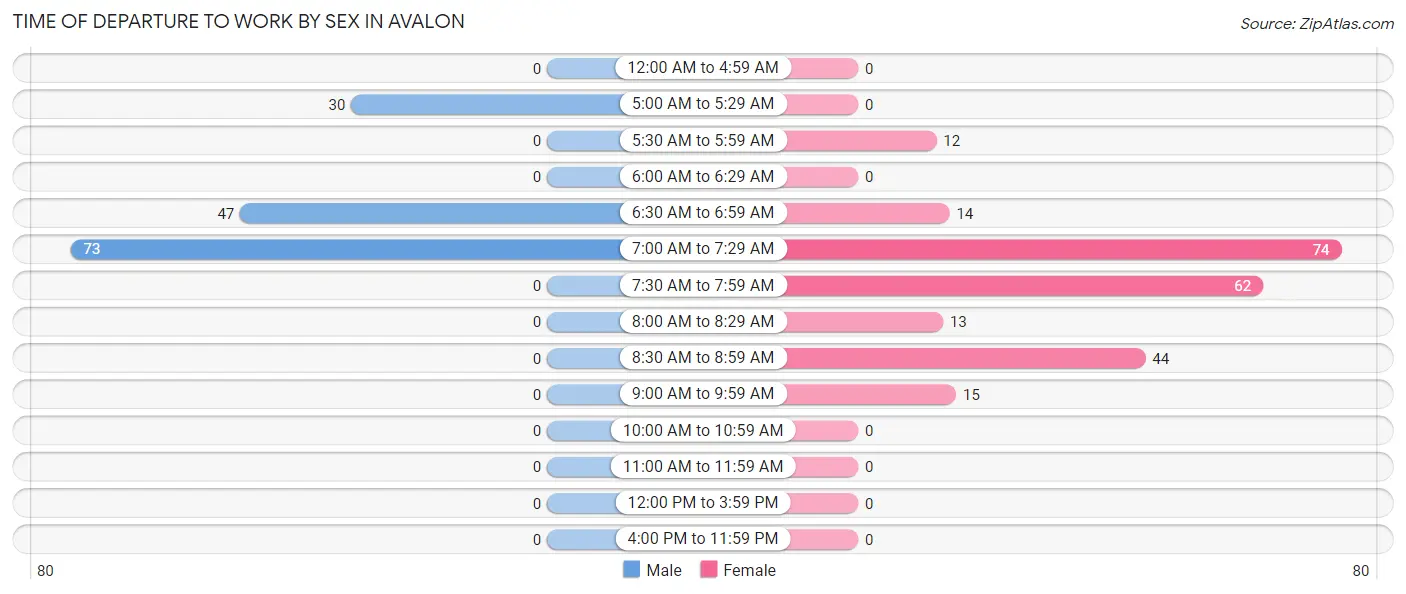
| Time of Departure | Male | Female |
| 12:00 AM to 4:59 AM | 0 (0.0%) | 0 (0.0%) |
| 5:00 AM to 5:29 AM | 30 (20.0%) | 0 (0.0%) |
| 5:30 AM to 5:59 AM | 0 (0.0%) | 12 (5.1%) |
| 6:00 AM to 6:29 AM | 0 (0.0%) | 0 (0.0%) |
| 6:30 AM to 6:59 AM | 47 (31.3%) | 14 (6.0%) |
| 7:00 AM to 7:29 AM | 73 (48.7%) | 74 (31.6%) |
| 7:30 AM to 7:59 AM | 0 (0.0%) | 62 (26.5%) |
| 8:00 AM to 8:29 AM | 0 (0.0%) | 13 (5.6%) |
| 8:30 AM to 8:59 AM | 0 (0.0%) | 44 (18.8%) |
| 9:00 AM to 9:59 AM | 0 (0.0%) | 15 (6.4%) |
| 10:00 AM to 10:59 AM | 0 (0.0%) | 0 (0.0%) |
| 11:00 AM to 11:59 AM | 0 (0.0%) | 0 (0.0%) |
| 12:00 PM to 3:59 PM | 0 (0.0%) | 0 (0.0%) |
| 4:00 PM to 11:59 PM | 0 (0.0%) | 0 (0.0%) |
| Total | 150 (100.0%) | 234 (100.0%) |
Housing Occupancy in Avalon
Occupancy by Ownership in Avalon
Of the total 301 dwellings in Avalon, owner-occupied units account for 226 (75.1%), while renter-occupied units make up 75 (24.9%).
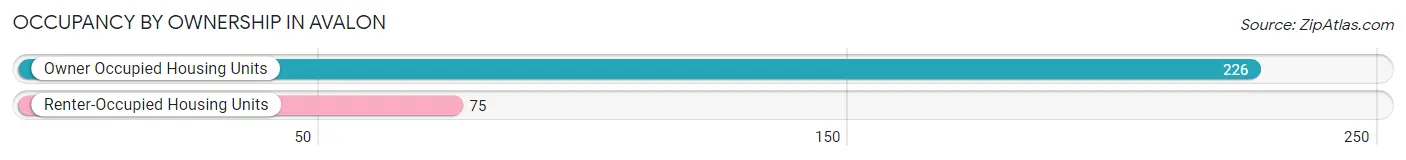
| Occupancy | # Housing Units | % Housing Units |
| Owner Occupied Housing Units | 226 | 75.1% |
| Renter-Occupied Housing Units | 75 | 24.9% |
| Total Occupied Housing Units | 301 | 100.0% |
Occupancy by Household Size in Avalon
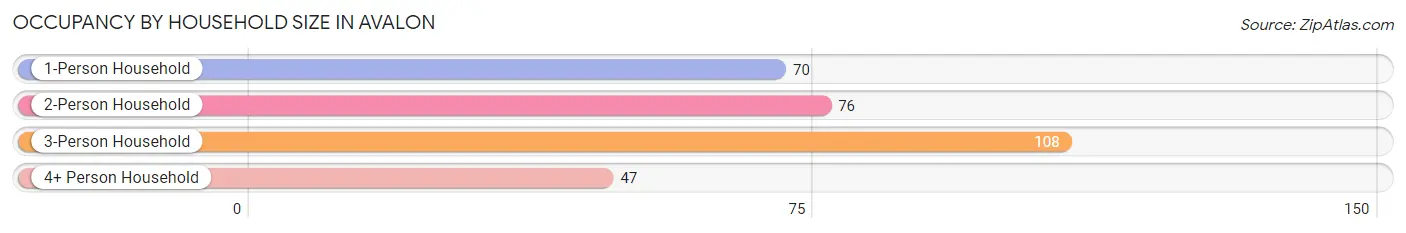
| Household Size | # Housing Units | % Housing Units |
| 1-Person Household | 70 | 23.3% |
| 2-Person Household | 76 | 25.3% |
| 3-Person Household | 108 | 35.9% |
| 4+ Person Household | 47 | 15.6% |
| Total Housing Units | 301 | 100.0% |
Occupancy by Ownership by Household Size in Avalon
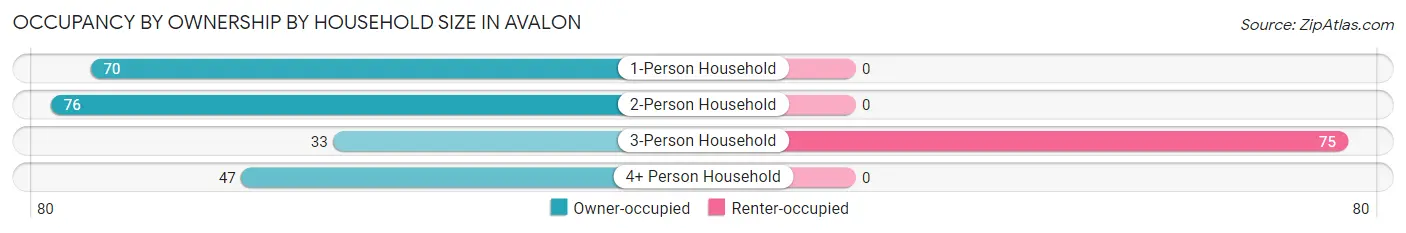
| Household Size | Owner-occupied | Renter-occupied |
| 1-Person Household | 70 (100.0%) | 0 (0.0%) |
| 2-Person Household | 76 (100.0%) | 0 (0.0%) |
| 3-Person Household | 33 (30.6%) | 75 (69.4%) |
| 4+ Person Household | 47 (100.0%) | 0 (0.0%) |
| Total Housing Units | 226 (75.1%) | 75 (24.9%) |
Occupancy by Educational Attainment in Avalon
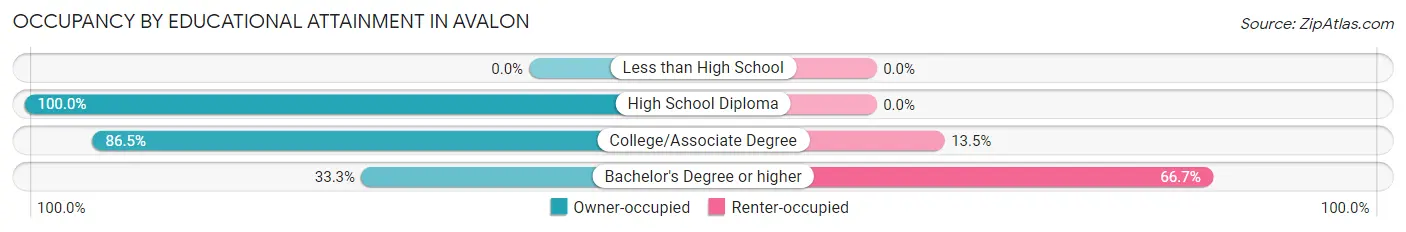
| Household Size | Owner-occupied | Renter-occupied |
| Less than High School | 0 (0.0%) | 0 (0.0%) |
| High School Diploma | 88 (100.0%) | 0 (0.0%) |
| College/Associate Degree | 109 (86.5%) | 17 (13.5%) |
| Bachelor's Degree or higher | 29 (33.3%) | 58 (66.7%) |
Occupancy by Age of Householder in Avalon
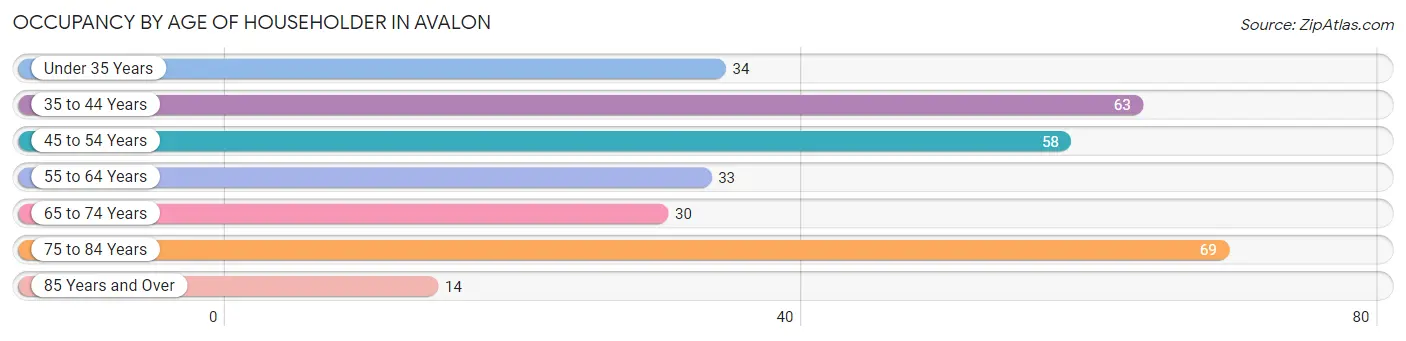
| Age Bracket | # Households | % Households |
| Under 35 Years | 34 | 11.3% |
| 35 to 44 Years | 63 | 20.9% |
| 45 to 54 Years | 58 | 19.3% |
| 55 to 64 Years | 33 | 11.0% |
| 65 to 74 Years | 30 | 10.0% |
| 75 to 84 Years | 69 | 22.9% |
| 85 Years and Over | 14 | 4.6% |
| Total | 301 | 100.0% |
Housing Finances in Avalon
Median Income by Occupancy in Avalon
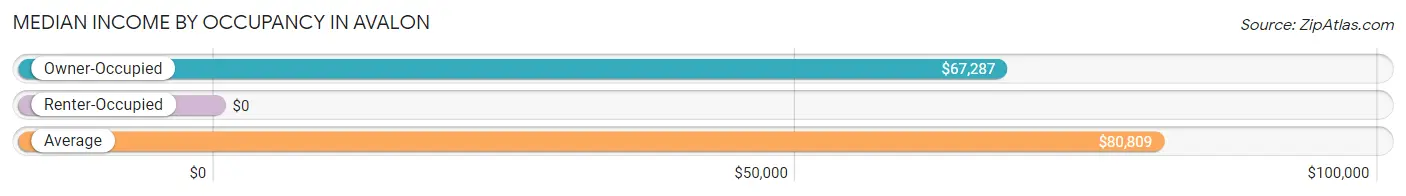
| Occupancy Type | # Households | Median Income |
| Owner-Occupied | 226 (75.1%) | $67,287 |
| Renter-Occupied | 75 (24.9%) | $0 |
| Average | 301 (100.0%) | $80,809 |
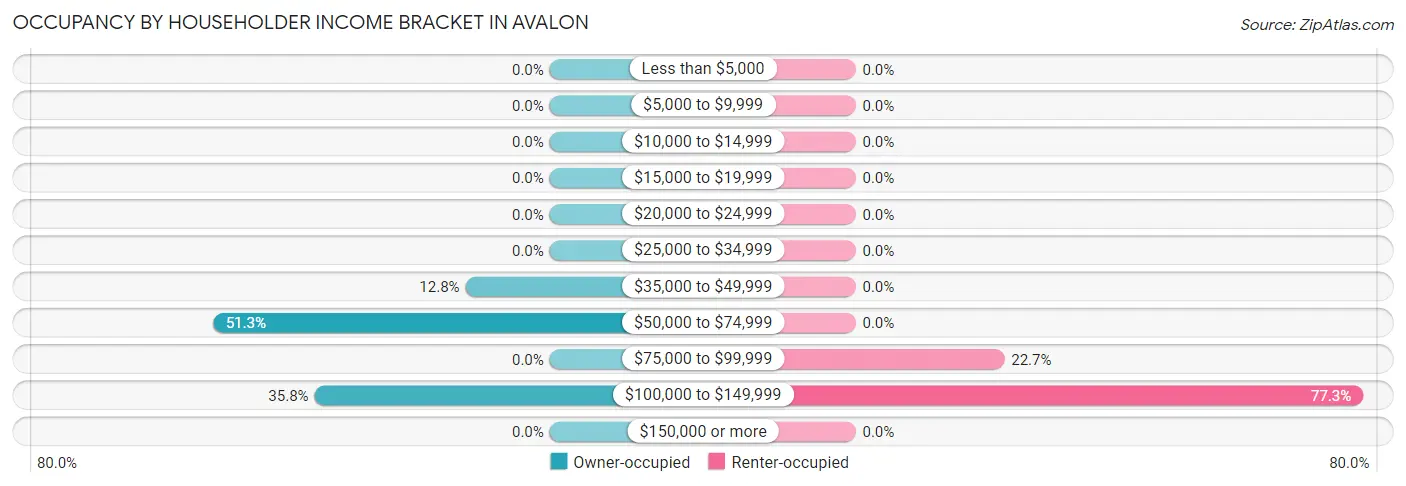
Occupancy by Householder Income Bracket in Avalon
| Income Bracket | Owner-occupied | Renter-occupied |
| Less than $5,000 | 0 (0.0%) | 0 (0.0%) |
| $5,000 to $9,999 | 0 (0.0%) | 0 (0.0%) |
| $10,000 to $14,999 | 0 (0.0%) | 0 (0.0%) |
| $15,000 to $19,999 | 0 (0.0%) | 0 (0.0%) |
| $20,000 to $24,999 | 0 (0.0%) | 0 (0.0%) |
| $25,000 to $34,999 | 0 (0.0%) | 0 (0.0%) |
| $35,000 to $49,999 | 29 (12.8%) | 0 (0.0%) |
| $50,000 to $74,999 | 116 (51.3%) | 0 (0.0%) |
| $75,000 to $99,999 | 0 (0.0%) | 17 (22.7%) |
| $100,000 to $149,999 | 81 (35.8%) | 58 (77.3%) |
| $150,000 or more | 0 (0.0%) | 0 (0.0%) |
| Total | 226 (100.0%) | 75 (100.0%) |
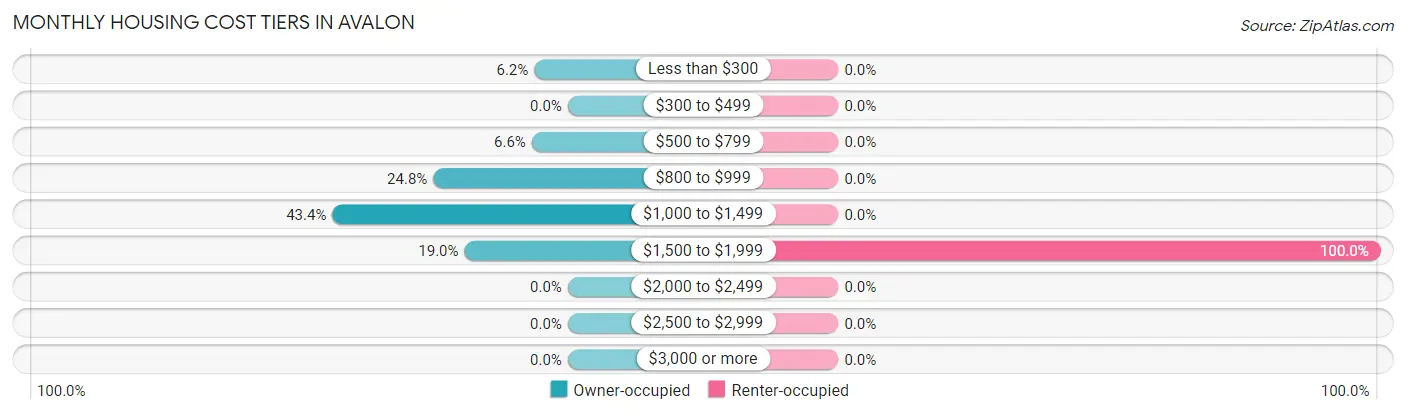
Monthly Housing Cost Tiers in Avalon
| Monthly Cost | Owner-occupied | Renter-occupied |
| Less than $300 | 14 (6.2%) | 0 (0.0%) |
| $300 to $499 | 0 (0.0%) | 0 (0.0%) |
| $500 to $799 | 15 (6.6%) | 0 (0.0%) |
| $800 to $999 | 56 (24.8%) | 0 (0.0%) |
| $1,000 to $1,499 | 98 (43.4%) | 0 (0.0%) |
| $1,500 to $1,999 | 43 (19.0%) | 75 (100.0%) |
| $2,000 to $2,499 | 0 (0.0%) | 0 (0.0%) |
| $2,500 to $2,999 | 0 (0.0%) | 0 (0.0%) |
| $3,000 or more | 0 (0.0%) | 0 (0.0%) |
| Total | 226 (100.0%) | 75 (100.0%) |
Physical Housing Characteristics in Avalon
Housing Structures in Avalon
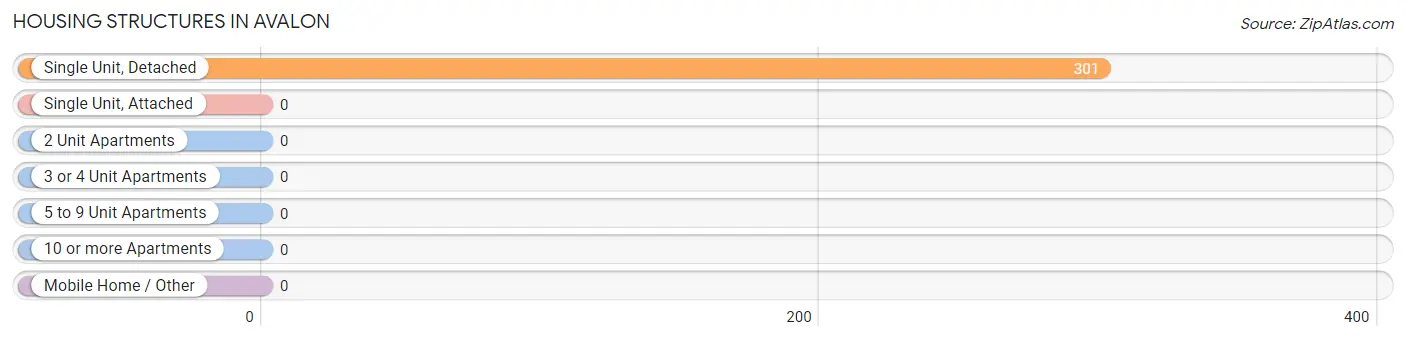
| Structure Type | # Housing Units | % Housing Units |
| Single Unit, Detached | 301 | 100.0% |
| Single Unit, Attached | 0 | 0.0% |
| 2 Unit Apartments | 0 | 0.0% |
| 3 or 4 Unit Apartments | 0 | 0.0% |
| 5 to 9 Unit Apartments | 0 | 0.0% |
| 10 or more Apartments | 0 | 0.0% |
| Mobile Home / Other | 0 | 0.0% |
| Total | 301 | 100.0% |
Housing Structures by Occupancy in Avalon
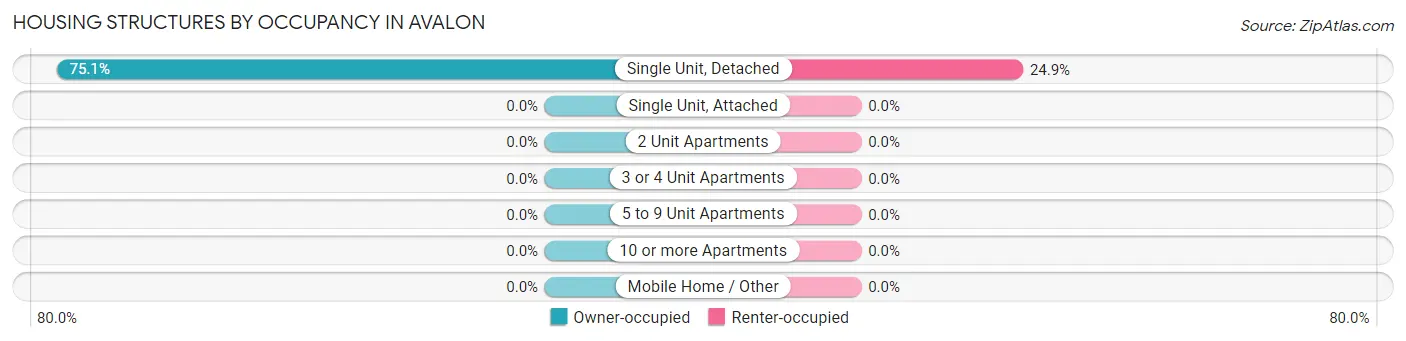
| Structure Type | Owner-occupied | Renter-occupied |
| Single Unit, Detached | 226 (75.1%) | 75 (24.9%) |
| Single Unit, Attached | 0 (0.0%) | 0 (0.0%) |
| 2 Unit Apartments | 0 (0.0%) | 0 (0.0%) |
| 3 or 4 Unit Apartments | 0 (0.0%) | 0 (0.0%) |
| 5 to 9 Unit Apartments | 0 (0.0%) | 0 (0.0%) |
| 10 or more Apartments | 0 (0.0%) | 0 (0.0%) |
| Mobile Home / Other | 0 (0.0%) | 0 (0.0%) |
| Total | 226 (75.1%) | 75 (24.9%) |
Housing Structures by Number of Rooms in Avalon
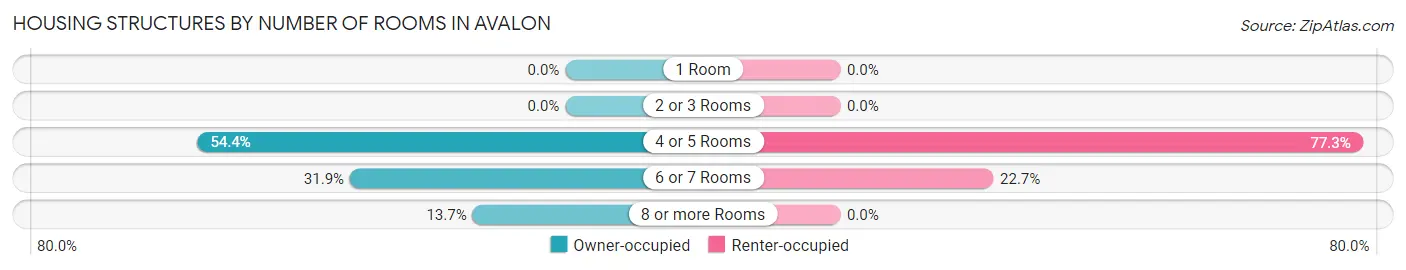
| Number of Rooms | Owner-occupied | Renter-occupied |
| 1 Room | 0 (0.0%) | 0 (0.0%) |
| 2 or 3 Rooms | 0 (0.0%) | 0 (0.0%) |
| 4 or 5 Rooms | 123 (54.4%) | 58 (77.3%) |
| 6 or 7 Rooms | 72 (31.9%) | 17 (22.7%) |
| 8 or more Rooms | 31 (13.7%) | 0 (0.0%) |
| Total | 226 (100.0%) | 75 (100.0%) |
Housing Structure by Heating Type in Avalon
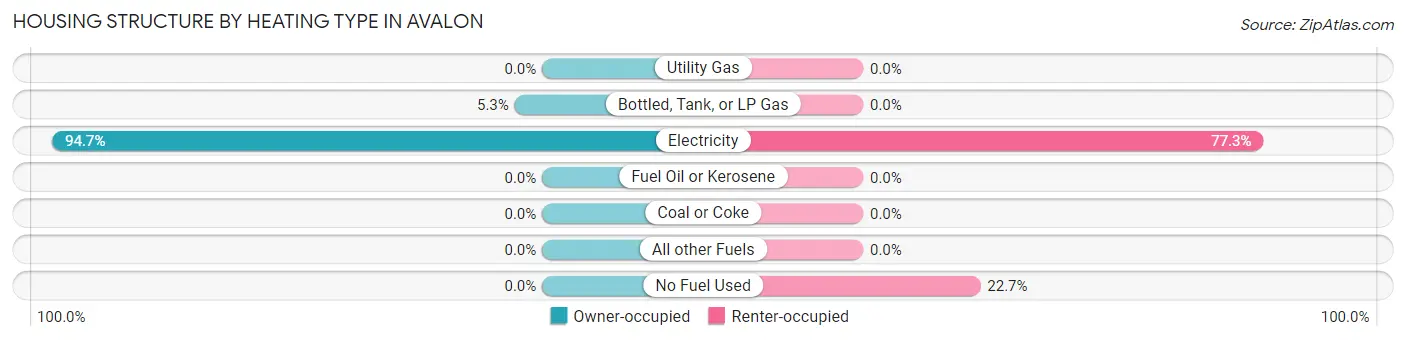
| Heating Type | Owner-occupied | Renter-occupied |
| Utility Gas | 0 (0.0%) | 0 (0.0%) |
| Bottled, Tank, or LP Gas | 12 (5.3%) | 0 (0.0%) |
| Electricity | 214 (94.7%) | 58 (77.3%) |
| Fuel Oil or Kerosene | 0 (0.0%) | 0 (0.0%) |
| Coal or Coke | 0 (0.0%) | 0 (0.0%) |
| All other Fuels | 0 (0.0%) | 0 (0.0%) |
| No Fuel Used | 0 (0.0%) | 17 (22.7%) |
| Total | 226 (100.0%) | 75 (100.0%) |
Household Vehicle Usage in Avalon
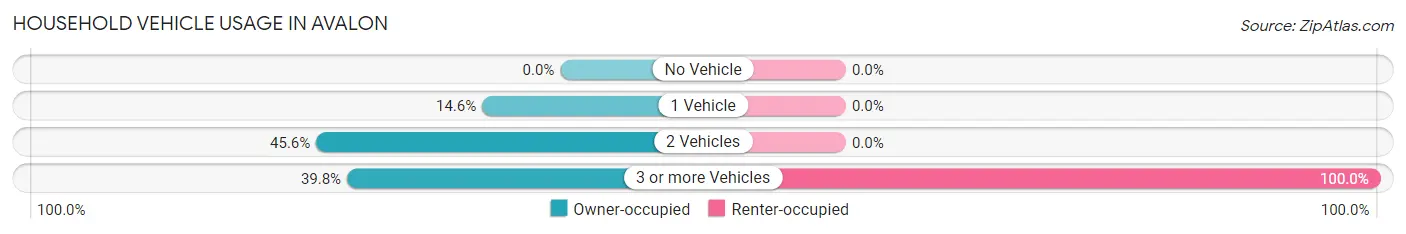
| Vehicles per Household | Owner-occupied | Renter-occupied |
| No Vehicle | 0 (0.0%) | 0 (0.0%) |
| 1 Vehicle | 33 (14.6%) | 0 (0.0%) |
| 2 Vehicles | 103 (45.6%) | 0 (0.0%) |
| 3 or more Vehicles | 90 (39.8%) | 75 (100.0%) |
| Total | 226 (100.0%) | 75 (100.0%) |
Real Estate & Mortgages in Avalon
Real Estate and Mortgage Overview in Avalon
| Characteristic | Without Mortgage | With Mortgage |
| Housing Units | 101 | 125 |
| Median Property Value | $536,000 | $264,900 |
| Median Household Income | - | - |
| Monthly Housing Costs | $920 | $0 |
| Real Estate Taxes | $2,299 | $0 |
Property Value by Mortgage Status in Avalon
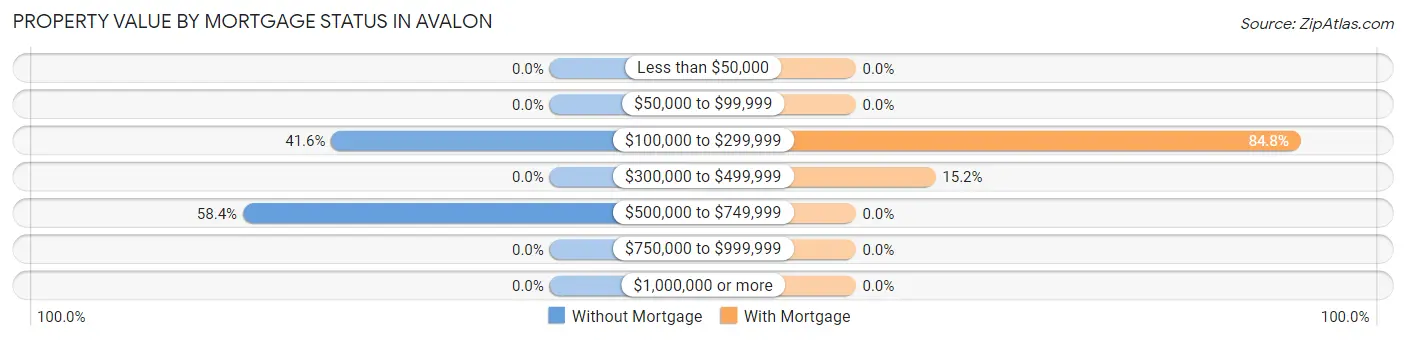
| Property Value | Without Mortgage | With Mortgage |
| Less than $50,000 | 0 (0.0%) | 0 (0.0%) |
| $50,000 to $99,999 | 0 (0.0%) | 0 (0.0%) |
| $100,000 to $299,999 | 42 (41.6%) | 106 (84.8%) |
| $300,000 to $499,999 | 0 (0.0%) | 19 (15.2%) |
| $500,000 to $749,999 | 59 (58.4%) | 0 (0.0%) |
| $750,000 to $999,999 | 0 (0.0%) | 0 (0.0%) |
| $1,000,000 or more | 0 (0.0%) | 0 (0.0%) |
| Total | 101 (100.0%) | 125 (100.0%) |
Household Income by Mortgage Status in Avalon
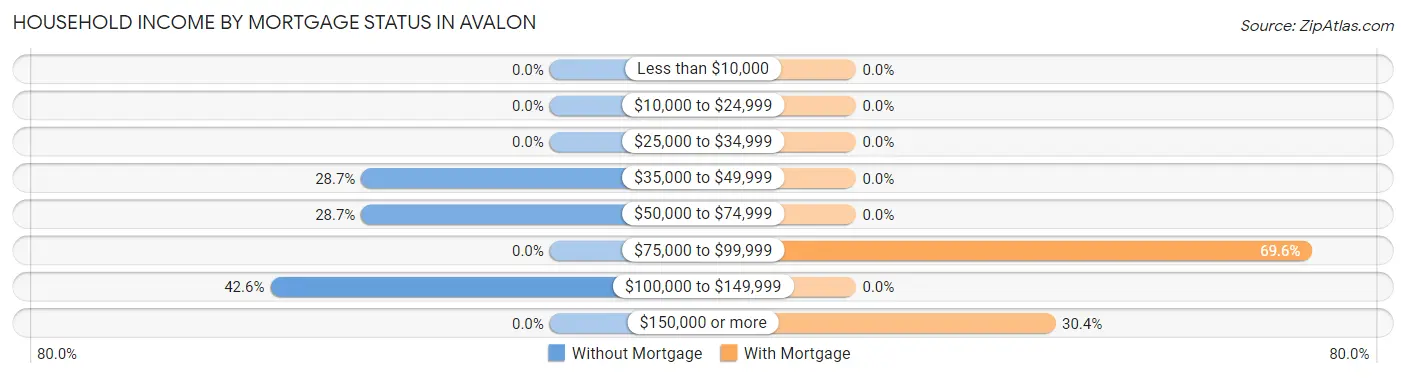
| Household Income | Without Mortgage | With Mortgage |
| Less than $10,000 | 0 (0.0%) | 0 (0.0%) |
| $10,000 to $24,999 | 0 (0.0%) | 0 (0.0%) |
| $25,000 to $34,999 | 0 (0.0%) | 0 (0.0%) |
| $35,000 to $49,999 | 29 (28.7%) | 0 (0.0%) |
| $50,000 to $74,999 | 29 (28.7%) | 0 (0.0%) |
| $75,000 to $99,999 | 0 (0.0%) | 87 (69.6%) |
| $100,000 to $149,999 | 43 (42.6%) | 0 (0.0%) |
| $150,000 or more | 0 (0.0%) | 38 (30.4%) |
| Total | 101 (100.0%) | 125 (100.0%) |
Property Value to Household Income Ratio in Avalon
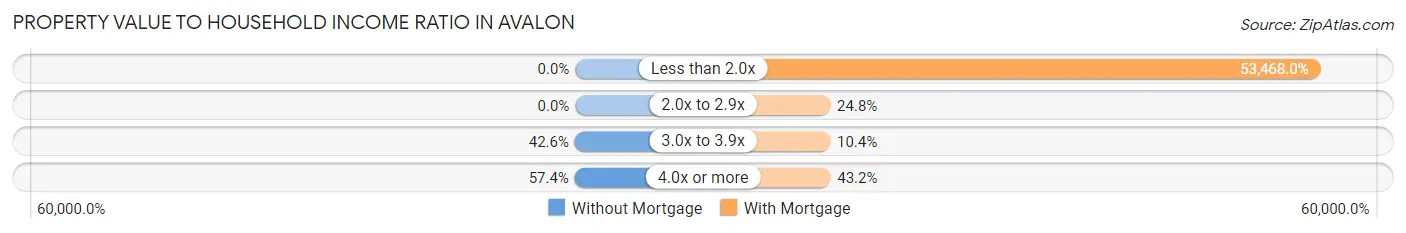
| Value-to-Income Ratio | Without Mortgage | With Mortgage |
| Less than 2.0x | 0 (0.0%) | 66,835 (53,468.0%) |
| 2.0x to 2.9x | 0 (0.0%) | 31 (24.8%) |
| 3.0x to 3.9x | 43 (42.6%) | 13 (10.4%) |
| 4.0x or more | 58 (57.4%) | 54 (43.2%) |
| Total | 101 (100.0%) | 125 (100.0%) |
Real Estate Taxes by Mortgage Status in Avalon
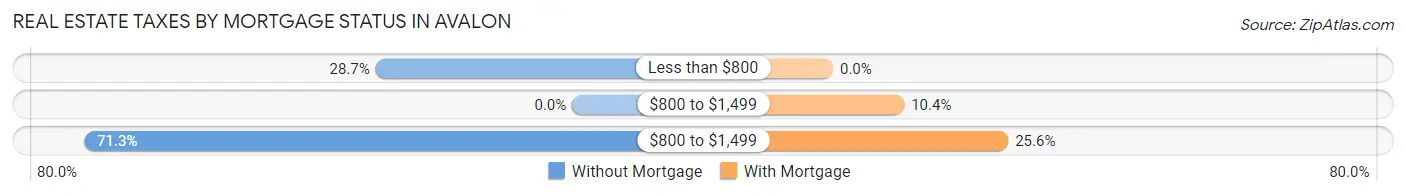
| Property Taxes | Without Mortgage | With Mortgage |
| Less than $800 | 29 (28.7%) | 0 (0.0%) |
| $800 to $1,499 | 0 (0.0%) | 13 (10.4%) |
| $800 to $1,499 | 72 (71.3%) | 32 (25.6%) |
| Total | 101 (100.0%) | 125 (100.0%) |
Health & Disability in Avalon
Health Insurance Coverage by Age in Avalon
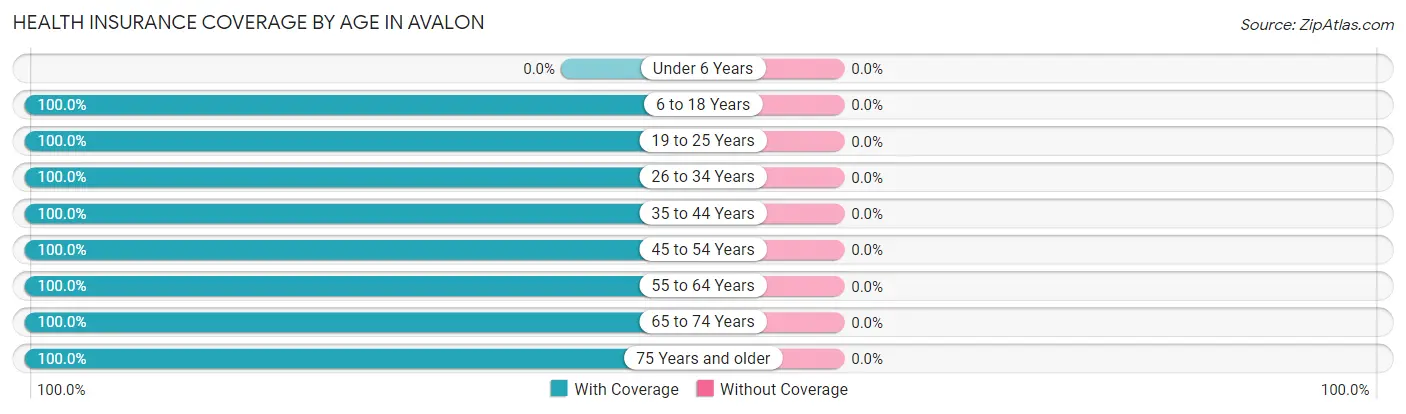
| Age Bracket | With Coverage | Without Coverage |
| Under 6 Years | 0 (0.0%) | 0 (0.0%) |
| 6 to 18 Years | 180 (100.0%) | 0 (0.0%) |
| 19 to 25 Years | 19 (100.0%) | 0 (0.0%) |
| 26 to 34 Years | 50 (100.0%) | 0 (0.0%) |
| 35 to 44 Years | 119 (100.0%) | 0 (0.0%) |
| 45 to 54 Years | 132 (100.0%) | 0 (0.0%) |
| 55 to 64 Years | 63 (100.0%) | 0 (0.0%) |
| 65 to 74 Years | 131 (100.0%) | 0 (0.0%) |
| 75 Years and older | 83 (100.0%) | 0 (0.0%) |
| Total | 777 (100.0%) | 0 (0.0%) |
Health Insurance Coverage by Citizenship Status in Avalon
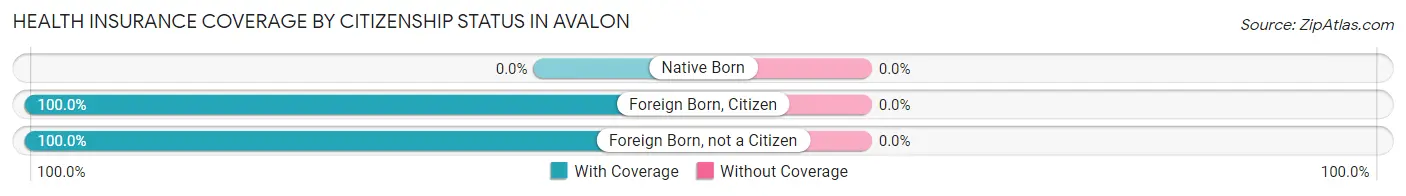
| Citizenship Status | With Coverage | Without Coverage |
| Native Born | 0 (0.0%) | 0 (0.0%) |
| Foreign Born, Citizen | 180 (100.0%) | 0 (0.0%) |
| Foreign Born, not a Citizen | 19 (100.0%) | 0 (0.0%) |
Health Insurance Coverage by Household Income in Avalon
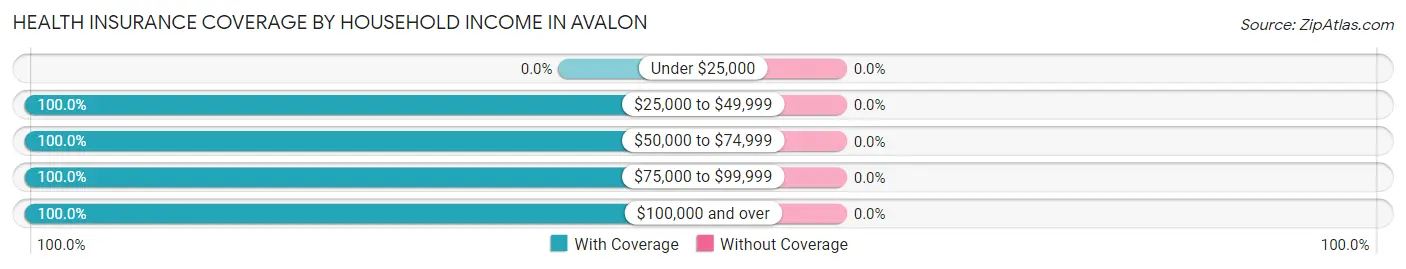
| Household Income | With Coverage | Without Coverage |
| Under $25,000 | 0 (0.0%) | 0 (0.0%) |
| $25,000 to $49,999 | 48 (100.0%) | 0 (0.0%) |
| $50,000 to $74,999 | 370 (100.0%) | 0 (0.0%) |
| $75,000 to $99,999 | 49 (100.0%) | 0 (0.0%) |
| $100,000 and over | 310 (100.0%) | 0 (0.0%) |
Public vs Private Health Insurance Coverage by Age in Avalon
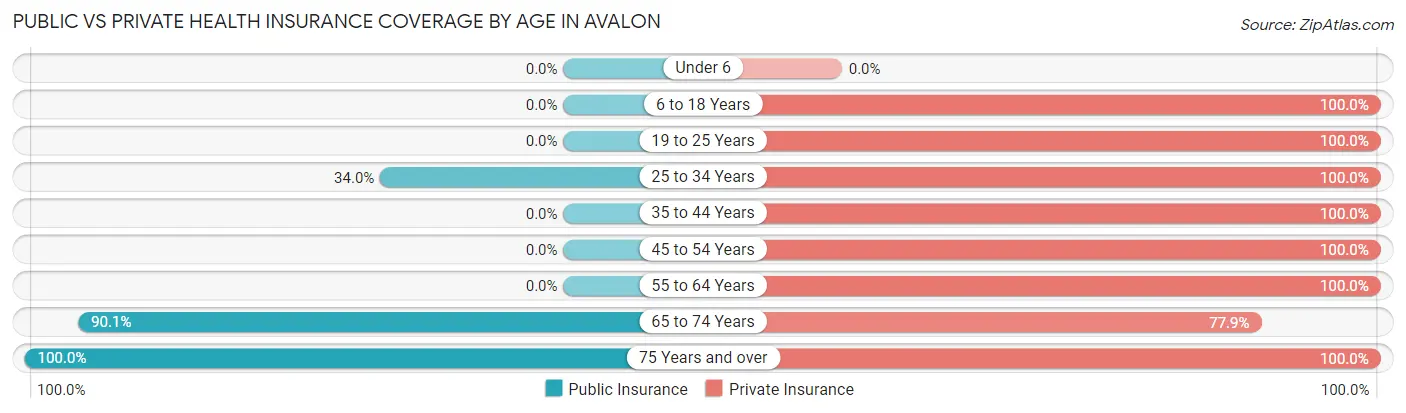
| Age Bracket | Public Insurance | Private Insurance |
| Under 6 | 0 (0.0%) | 0 (0.0%) |
| 6 to 18 Years | 0 (0.0%) | 180 (100.0%) |
| 19 to 25 Years | 0 (0.0%) | 19 (100.0%) |
| 25 to 34 Years | 17 (34.0%) | 50 (100.0%) |
| 35 to 44 Years | 0 (0.0%) | 119 (100.0%) |
| 45 to 54 Years | 0 (0.0%) | 132 (100.0%) |
| 55 to 64 Years | 0 (0.0%) | 63 (100.0%) |
| 65 to 74 Years | 118 (90.1%) | 102 (77.9%) |
| 75 Years and over | 83 (100.0%) | 83 (100.0%) |
| Total | 218 (28.1%) | 748 (96.3%) |
Disability Status by Sex by Age in Avalon
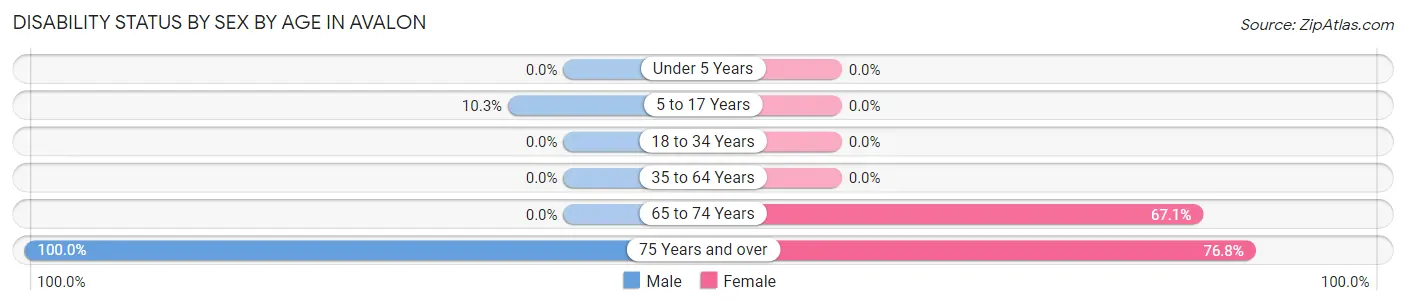
| Age Bracket | Male | Female |
| Under 5 Years | 0 (0.0%) | 0 (0.0%) |
| 5 to 17 Years | 14 (10.3%) | 0 (0.0%) |
| 18 to 34 Years | 0 (0.0%) | 0 (0.0%) |
| 35 to 64 Years | 0 (0.0%) | 0 (0.0%) |
| 65 to 74 Years | 0 (0.0%) | 59 (67.0%) |
| 75 Years and over | 27 (100.0%) | 43 (76.8%) |
Disability Class by Sex by Age in Avalon
Disability Class: Hearing Difficulty
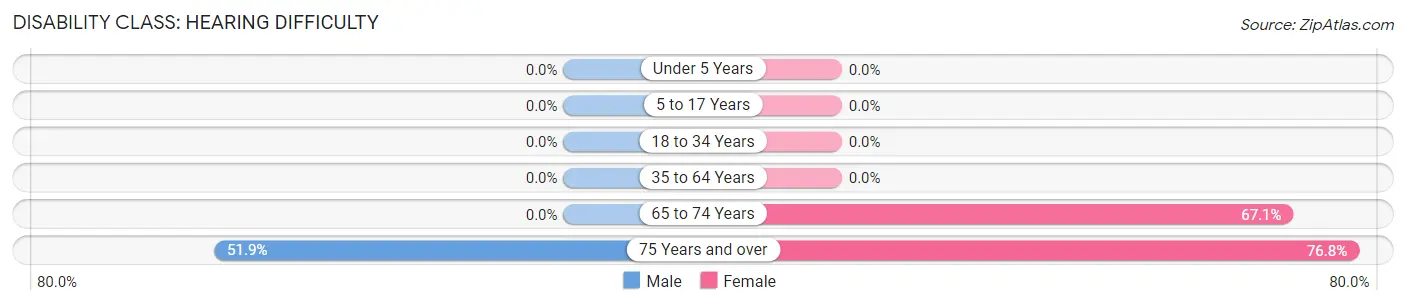
| Age Bracket | Male | Female |
| Under 5 Years | 0 (0.0%) | 0 (0.0%) |
| 5 to 17 Years | 0 (0.0%) | 0 (0.0%) |
| 18 to 34 Years | 0 (0.0%) | 0 (0.0%) |
| 35 to 64 Years | 0 (0.0%) | 0 (0.0%) |
| 65 to 74 Years | 0 (0.0%) | 59 (67.0%) |
| 75 Years and over | 14 (51.8%) | 43 (76.8%) |
Disability Class: Vision Difficulty
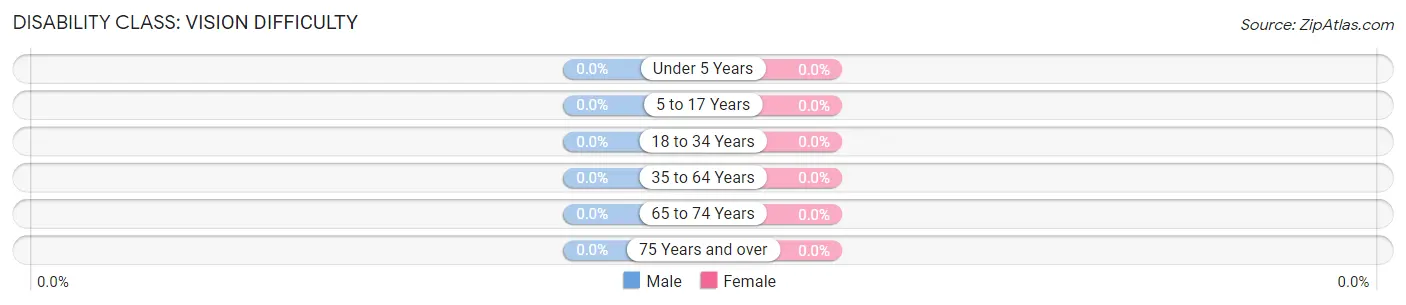
| Age Bracket | Male | Female |
| Under 5 Years | 0 (0.0%) | 0 (0.0%) |
| 5 to 17 Years | 0 (0.0%) | 0 (0.0%) |
| 18 to 34 Years | 0 (0.0%) | 0 (0.0%) |
| 35 to 64 Years | 0 (0.0%) | 0 (0.0%) |
| 65 to 74 Years | 0 (0.0%) | 0 (0.0%) |
| 75 Years and over | 0 (0.0%) | 0 (0.0%) |
Disability Class: Cognitive Difficulty
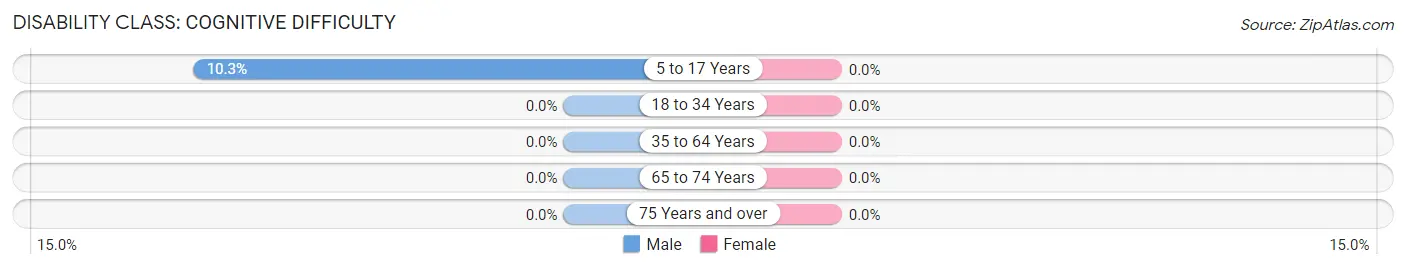
| Age Bracket | Male | Female |
| 5 to 17 Years | 14 (10.3%) | 0 (0.0%) |
| 18 to 34 Years | 0 (0.0%) | 0 (0.0%) |
| 35 to 64 Years | 0 (0.0%) | 0 (0.0%) |
| 65 to 74 Years | 0 (0.0%) | 0 (0.0%) |
| 75 Years and over | 0 (0.0%) | 0 (0.0%) |
Disability Class: Ambulatory Difficulty

| Age Bracket | Male | Female |
| 5 to 17 Years | 0 (0.0%) | 0 (0.0%) |
| 18 to 34 Years | 0 (0.0%) | 0 (0.0%) |
| 35 to 64 Years | 0 (0.0%) | 0 (0.0%) |
| 65 to 74 Years | 0 (0.0%) | 59 (67.0%) |
| 75 Years and over | 0 (0.0%) | 0 (0.0%) |
Disability Class: Self-Care Difficulty
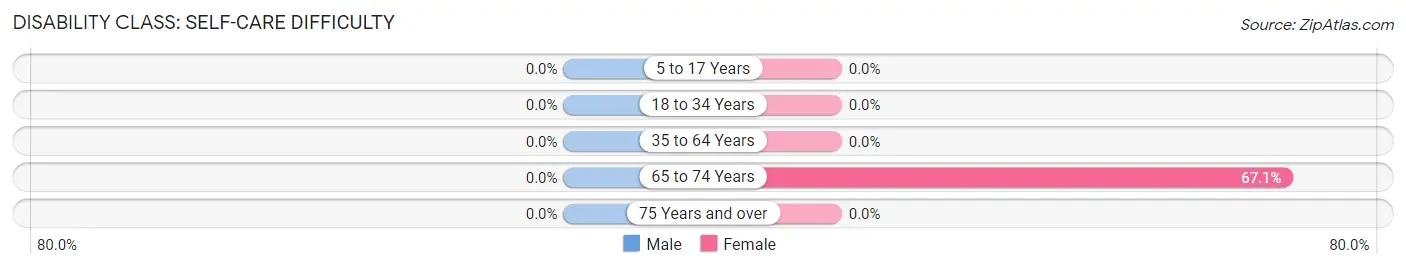
| Age Bracket | Male | Female |
| 5 to 17 Years | 0 (0.0%) | 0 (0.0%) |
| 18 to 34 Years | 0 (0.0%) | 0 (0.0%) |
| 35 to 64 Years | 0 (0.0%) | 0 (0.0%) |
| 65 to 74 Years | 0 (0.0%) | 59 (67.0%) |
| 75 Years and over | 0 (0.0%) | 0 (0.0%) |
Technology Access in Avalon
Computing Device Access in Avalon
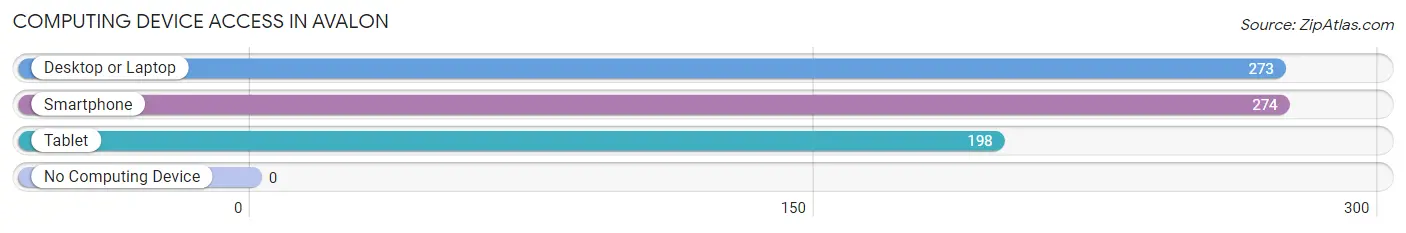
| Device Type | # Households | % Households |
| Desktop or Laptop | 273 | 90.7% |
| Smartphone | 274 | 91.0% |
| Tablet | 198 | 65.8% |
| No Computing Device | 0 | 0.0% |
| Total | 301 | 100.0% |
Internet Access in Avalon
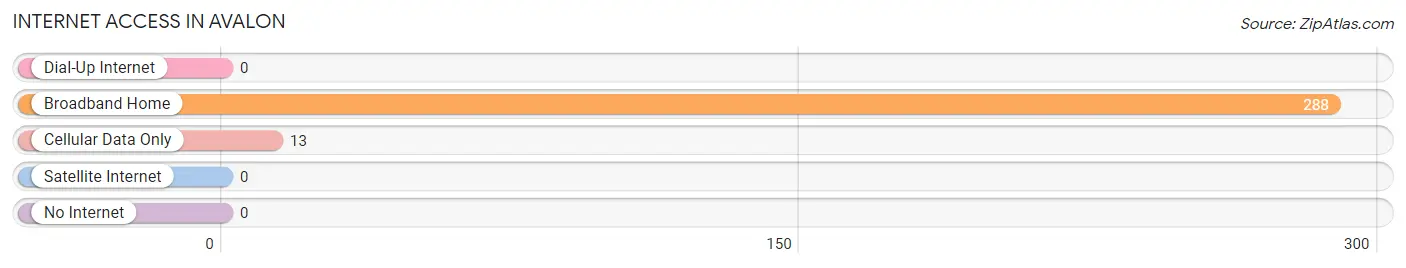
| Internet Type | # Households | % Households |
| Dial-Up Internet | 0 | 0.0% |
| Broadband Home | 288 | 95.7% |
| Cellular Data Only | 13 | 4.3% |
| Satellite Internet | 0 | 0.0% |
| No Internet | 0 | 0.0% |
| Total | 301 | 100.0% |
Avalon Summary
Avalon is a small unincorporated community located in Santa Rosa County, Florida. It is situated on the western shore of Santa Rosa Sound, just south of the city of Milton. The community is part of the Pensacola–Ferry Pass–Brent Metropolitan Statistical Area.
History
The area that is now Avalon was first settled in the early 1800s by settlers from the British Isles. The community was originally known as “Avalon Beach” and was a popular destination for beachgoers. In the late 1800s, the area was developed as a resort community and was home to several large hotels. The area was also home to a number of fishing camps and oyster beds.
In the early 1900s, the area was home to a number of wealthy families who built large homes along the shoreline. The area was also home to a number of small businesses, including a general store, a post office, and a school.
In the 1950s, the area began to decline as the wealthy families moved away and the hotels closed. The area was largely abandoned until the late 1970s when it was rediscovered by developers. The area was redeveloped as a residential community and is now home to a number of single-family homes and condominiums.
Geography
Avalon is located in Santa Rosa County, Florida. It is situated on the western shore of Santa Rosa Sound, just south of the city of Milton. The community is part of the Pensacola–Ferry Pass–Brent Metropolitan Statistical Area.
The area is characterized by flat terrain and sandy beaches. The climate is subtropical, with hot, humid summers and mild winters. The average annual temperature is around 70 degrees Fahrenheit.
Economy
Avalon is primarily a residential community, with most of the population employed in the service sector. The area is home to a number of small businesses, including restaurants, retail stores, and marinas.
The area is also home to a number of tourist attractions, including the Gulf Islands National Seashore, the Naval Live Oaks Nature Preserve, and the Pensacola Naval Air Station.
Demographics
As of the 2010 census, the population of Avalon was 1,845. The racial makeup of the community was 94.3% White, 2.2% African American, 0.7% Native American, 0.7% Asian, 0.2% Pacific Islander, and 1.1% from other races. The median household income was $45,938.
Conclusion
Avalon is a small unincorporated community located in Santa Rosa County, Florida. It is situated on the western shore of Santa Rosa Sound, just south of the city of Milton. The area was originally settled in the early 1800s and was home to a number of wealthy families in the early 1900s. In the 1950s, the area began to decline and was largely abandoned until the late 1970s when it was rediscovered by developers. Today, Avalon is primarily a residential community, with most of the population employed in the service sector. The area is also home to a number of tourist attractions. As of the 2010 census, the population of Avalon was 1,845. The racial makeup of the community was 94.3% White, 2.2% African American, 0.7% Native American, 0.7% Asian, 0.2% Pacific Islander, and 1.1% from other races. The median household income was $45,938.
Common Questions
What is the Total Population of Avalon?
Total Population of Avalon is 777.
What is the Total Male Population of Avalon?
Total Male Population of Avalon is 377.
What is the Total Female Population of Avalon?
Total Female Population of Avalon is 400.
What is the Ratio of Males per 100 Females in Avalon?
There are 94.25 Males per 100 Females in Avalon.
What is the Ratio of Females per 100 Males in Avalon?
There are 106.10 Females per 100 Males in Avalon.
What is the Median Population Age in Avalon?
Median Population Age in Avalon is 49.0 Years.
What is the Average Family Size in Avalon
Average Family Size in Avalon is 3.1 People.
What is the Average Household Size in Avalon
Average Household Size in Avalon is 2.6 People.
What is Per Capita Income in Avalon?
Per Capita income in Avalon is $36,216.
What is the Median Family Income in Avalon?
Median Family Income in Avalon is $74,063.
What is the Median Household income in Avalon?
Median Household Income in Avalon is $80,809.
What is Income or Wage Gap in Avalon?
Income or Wage Gap in Avalon is 45.0%.
Women in Avalon earn 55.0 cents for every dollar earned by a man.
What is Inequality or Gini Index in Avalon?
Inequality or Gini Index in Avalon is 0.22.
How Large is the Labor Force in Avalon?
There are 461 People in the Labor Forcein in Avalon.
What is the Percentage of People in the Labor Force in Avalon?
71.9% of People are in the Labor Force in Avalon.