Callaway, FL
Callaway Map
Callaway Overview
13,455
TOTAL POPULATION
7,097
MALE POPULATION
6,358
FEMALE POPULATION
111.62
MALES / 100 FEMALES
89.59
FEMALES / 100 MALES
38.8
MEDIAN AGE
3.0
AVG FAMILY SIZE
2.4
AVG HOUSEHOLD SIZE
$31,984
PER CAPITA INCOME
$75,799
AVG FAMILY INCOME
$61,743
AVG HOUSEHOLD INCOME
19.3%
WAGE / INCOME GAP [ % ]
80.7¢/ $1
WAGE / INCOME GAP [ $ ]
0.39
INEQUALITY / GINI INDEX
7,206
LABOR FORCE [ PEOPLE ]
66.1%
PERCENT IN LABOR FORCE
4.7%
UNEMPLOYMENT RATE
Callaway Area Codes
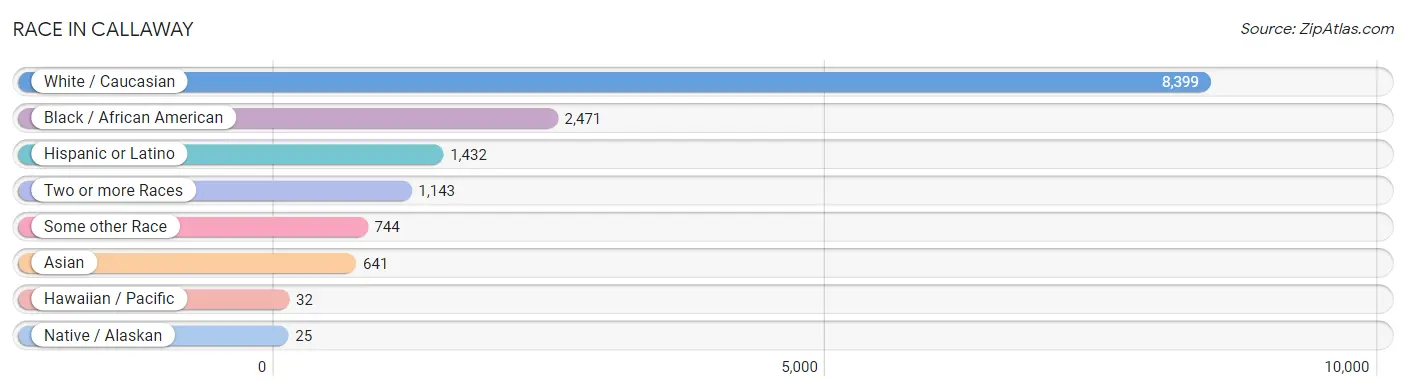
Race in Callaway
The most populous races in Callaway are White / Caucasian (8,399 | 62.4%), Black / African American (2,471 | 18.4%), and Hispanic or Latino (1,432 | 10.6%).
| Race | # Population | % Population |
| Asian | 641 | 4.8% |
| Black / African American | 2,471 | 18.4% |
| Hawaiian / Pacific | 32 | 0.2% |
| Hispanic or Latino | 1,432 | 10.6% |
| Native / Alaskan | 25 | 0.2% |
| White / Caucasian | 8,399 | 62.4% |
| Two or more Races | 1,143 | 8.5% |
| Some other Race | 744 | 5.5% |
| Total | 13,455 | 100.0% |
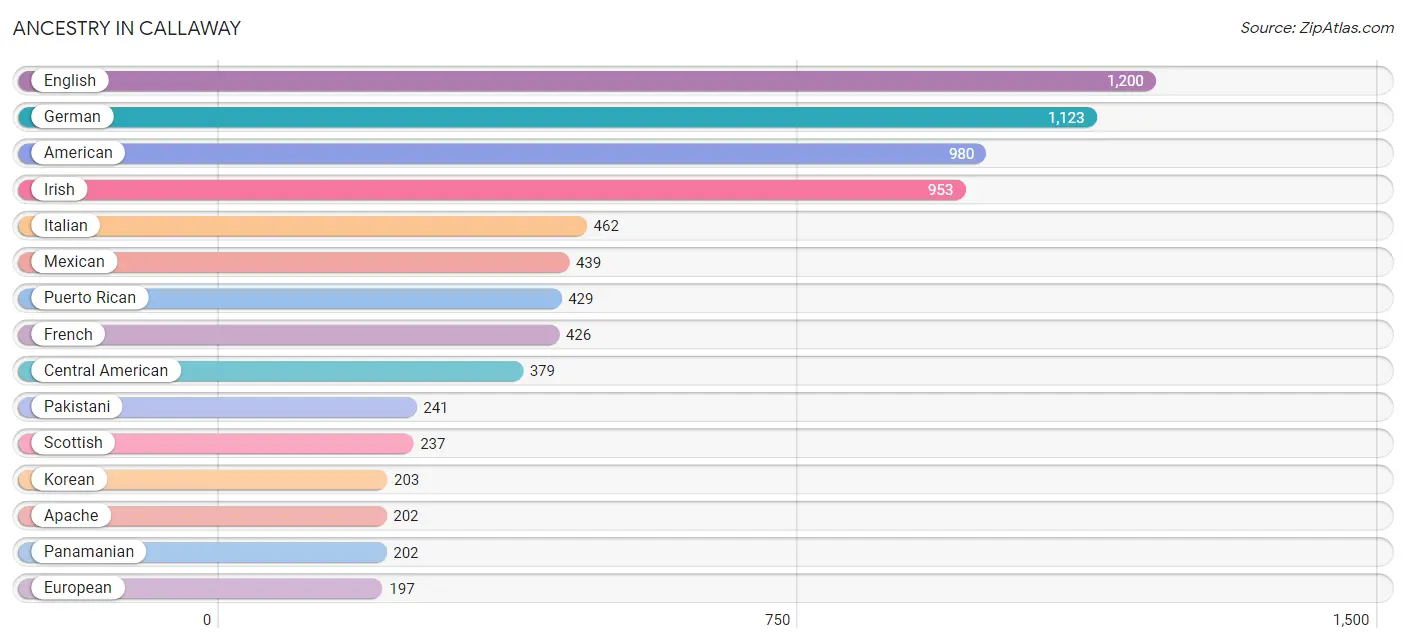
Ancestry in Callaway
The most populous ancestries reported in Callaway are English (1,200 | 8.9%), German (1,123 | 8.4%), American (980 | 7.3%), Irish (953 | 7.1%), and Italian (462 | 3.4%), together accounting for 35.1% of all Callaway residents.
| Ancestry | # Population | % Population |
| African | 11 | 0.1% |
| American | 980 | 7.3% |
| Apache | 202 | 1.5% |
| Arab | 66 | 0.5% |
| Barbadian | 11 | 0.1% |
| Bhutanese | 3 | 0.0% |
| British | 28 | 0.2% |
| British West Indian | 122 | 0.9% |
| Burmese | 194 | 1.4% |
| Canadian | 6 | 0.0% |
| Central American | 379 | 2.8% |
| Creek | 16 | 0.1% |
| Cuban | 42 | 0.3% |
| Czech | 23 | 0.2% |
| Dominican | 73 | 0.5% |
| Dutch | 90 | 0.7% |
| Eastern European | 54 | 0.4% |
| Egyptian | 6 | 0.0% |
| English | 1,200 | 8.9% |
| European | 197 | 1.5% |
| Filipino | 24 | 0.2% |
| Finnish | 4 | 0.0% |
| French | 426 | 3.2% |
| French Canadian | 79 | 0.6% |
| German | 1,123 | 8.4% |
| Guatemalan | 100 | 0.7% |
| Honduran | 77 | 0.6% |
| Hungarian | 20 | 0.2% |
| Indian (Asian) | 18 | 0.1% |
| Irish | 953 | 7.1% |
| Italian | 462 | 3.4% |
| Jamaican | 39 | 0.3% |
| Korean | 203 | 1.5% |
| Latvian | 8 | 0.1% |
| Lithuanian | 4 | 0.0% |
| Luxembourger | 52 | 0.4% |
| Mexican | 439 | 3.3% |
| Moroccan | 51 | 0.4% |
| Norwegian | 90 | 0.7% |
| Pakistani | 241 | 1.8% |
| Panamanian | 202 | 1.5% |
| Pennsylvania German | 16 | 0.1% |
| Polish | 87 | 0.6% |
| Portuguese | 104 | 0.8% |
| Puerto Rican | 429 | 3.2% |
| Russian | 30 | 0.2% |
| Scandinavian | 50 | 0.4% |
| Scotch-Irish | 170 | 1.3% |
| Scottish | 237 | 1.8% |
| Slavic | 10 | 0.1% |
| Spaniard | 27 | 0.2% |
| Spanish | 23 | 0.2% |
| Sri Lankan | 155 | 1.1% |
| Subsaharan African | 11 | 0.1% |
| Swedish | 59 | 0.4% |
| Swiss | 95 | 0.7% |
| Syrian | 9 | 0.1% |
| Thai | 56 | 0.4% |
| Trinidadian and Tobagonian | 65 | 0.5% |
| Welsh | 18 | 0.1% | View All 60 Rows |
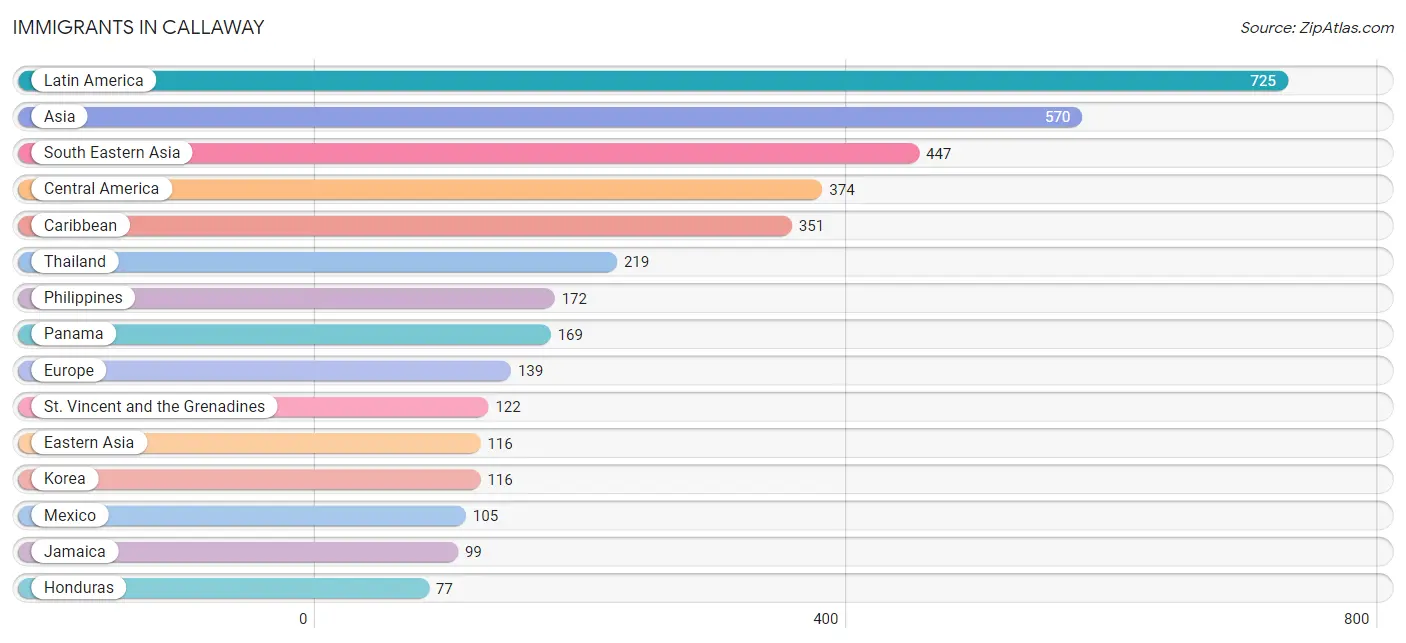
Immigrants in Callaway
The most numerous immigrant groups reported in Callaway came from Latin America (725 | 5.4%), Asia (570 | 4.2%), South Eastern Asia (447 | 3.3%), Central America (374 | 2.8%), and Caribbean (351 | 2.6%), together accounting for 18.3% of all Callaway residents.
| Immigration Origin | # Population | % Population |
| Africa | 7 | 0.1% |
| Asia | 570 | 4.2% |
| Barbados | 11 | 0.1% |
| Canada | 9 | 0.1% |
| Caribbean | 351 | 2.6% |
| Central America | 374 | 2.8% |
| Cuba | 32 | 0.2% |
| Dominican Republic | 73 | 0.5% |
| Eastern Africa | 1 | 0.0% |
| Eastern Asia | 116 | 0.9% |
| Eastern Europe | 5 | 0.0% |
| Egypt | 6 | 0.0% |
| England | 37 | 0.3% |
| Europe | 139 | 1.0% |
| France | 26 | 0.2% |
| Germany | 51 | 0.4% |
| Guatemala | 23 | 0.2% |
| Honduras | 77 | 0.6% |
| India | 7 | 0.1% |
| Ireland | 16 | 0.1% |
| Jamaica | 99 | 0.7% |
| Kenya | 1 | 0.0% |
| Korea | 116 | 0.9% |
| Latin America | 725 | 5.4% |
| Mexico | 105 | 0.8% |
| Northern Africa | 6 | 0.0% |
| Northern Europe | 57 | 0.4% |
| Panama | 169 | 1.3% |
| Philippines | 172 | 1.3% |
| Poland | 5 | 0.0% |
| South Central Asia | 7 | 0.1% |
| South Eastern Asia | 447 | 3.3% |
| St. Vincent and the Grenadines | 122 | 0.9% |
| Thailand | 219 | 1.6% |
| Trinidad and Tobago | 14 | 0.1% |
| Vietnam | 56 | 0.4% |
| Western Europe | 77 | 0.6% | View All 37 Rows |
Sex and Age in Callaway
Sex and Age in Callaway
The most populous age groups in Callaway are 25 to 29 Years (750 | 10.6%) for men and 60 to 64 Years (588 | 9.2%) for women.
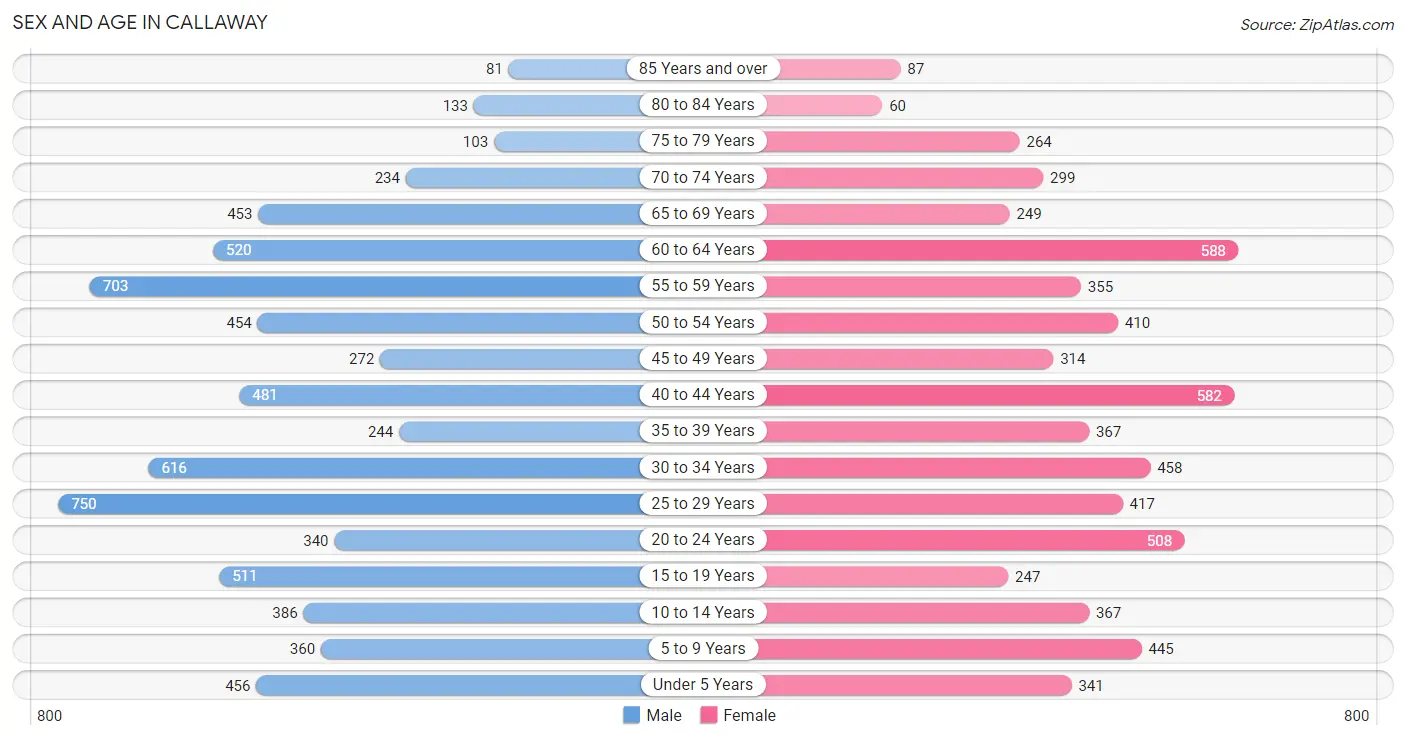
| Age Bracket | Male | Female |
| Under 5 Years | 456 (6.4%) | 341 (5.4%) |
| 5 to 9 Years | 360 (5.1%) | 445 (7.0%) |
| 10 to 14 Years | 386 (5.4%) | 367 (5.8%) |
| 15 to 19 Years | 511 (7.2%) | 247 (3.9%) |
| 20 to 24 Years | 340 (4.8%) | 508 (8.0%) |
| 25 to 29 Years | 750 (10.6%) | 417 (6.6%) |
| 30 to 34 Years | 616 (8.7%) | 458 (7.2%) |
| 35 to 39 Years | 244 (3.4%) | 367 (5.8%) |
| 40 to 44 Years | 481 (6.8%) | 582 (9.1%) |
| 45 to 49 Years | 272 (3.8%) | 314 (4.9%) |
| 50 to 54 Years | 454 (6.4%) | 410 (6.5%) |
| 55 to 59 Years | 703 (9.9%) | 355 (5.6%) |
| 60 to 64 Years | 520 (7.3%) | 588 (9.2%) |
| 65 to 69 Years | 453 (6.4%) | 249 (3.9%) |
| 70 to 74 Years | 234 (3.3%) | 299 (4.7%) |
| 75 to 79 Years | 103 (1.5%) | 264 (4.2%) |
| 80 to 84 Years | 133 (1.9%) | 60 (0.9%) |
| 85 Years and over | 81 (1.1%) | 87 (1.4%) |
| Total | 7,097 (100.0%) | 6,358 (100.0%) |
Families and Households in Callaway
Median Family Size in Callaway
The median family size in Callaway is 3.00 persons per family, with married-couple families (2,356 | 67.3%) accounting for the largest median family size of 3.21 persons per family. On the other hand, single female/mother families (710 | 20.3%) represent the smallest median family size with 2.48 persons per family.
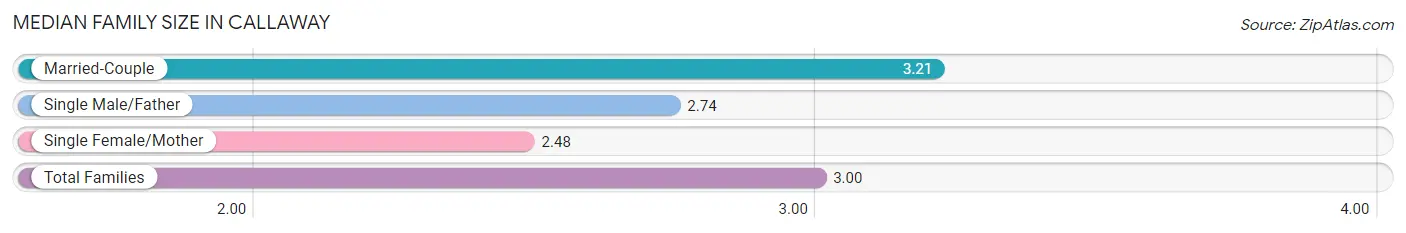
| Family Type | # Families | Family Size |
| Married-Couple | 2,356 (67.3%) | 3.21 |
| Single Male/Father | 432 (12.3%) | 2.74 |
| Single Female/Mother | 710 (20.3%) | 2.48 |
| Total Families | 3,498 (100.0%) | 3.00 |
Median Household Size in Callaway
The median household size in Callaway is 2.44 persons per household, with single male/father households (432 | 7.9%) accounting for the largest median household size of 3.26 persons per household. non-family households (1,984 | 36.2%) represent the smallest median household size with 1.24 persons per household.
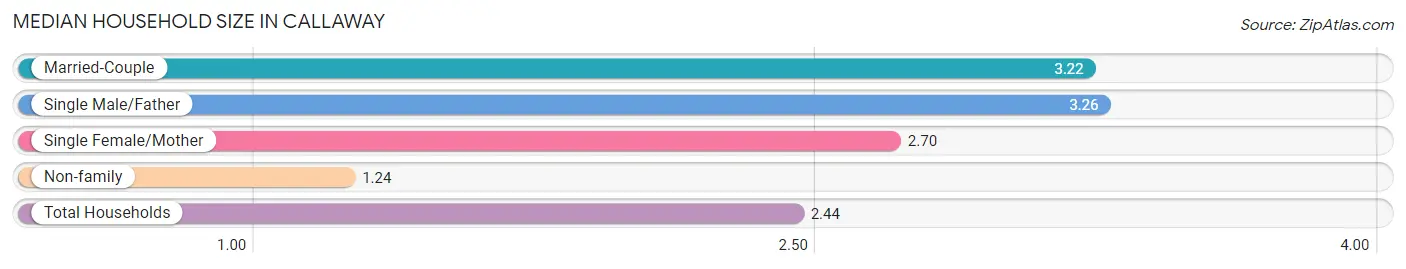
| Household Type | # Households | Household Size |
| Married-Couple | 2,356 (43.0%) | 3.22 |
| Single Male/Father | 432 (7.9%) | 3.26 |
| Single Female/Mother | 710 (13.0%) | 2.70 |
| Non-family | 1,984 (36.2%) | 1.24 |
| Total Households | 5,482 (100.0%) | 2.44 |
Household Size by Marriage Status in Callaway
Out of a total of 5,482 households in Callaway, 3,498 (63.8%) are family households, while 1,984 (36.2%) are nonfamily households. The most numerous type of family households are 2-person households, comprising 1,596, and the most common type of nonfamily households are 1-person households, comprising 1,559.
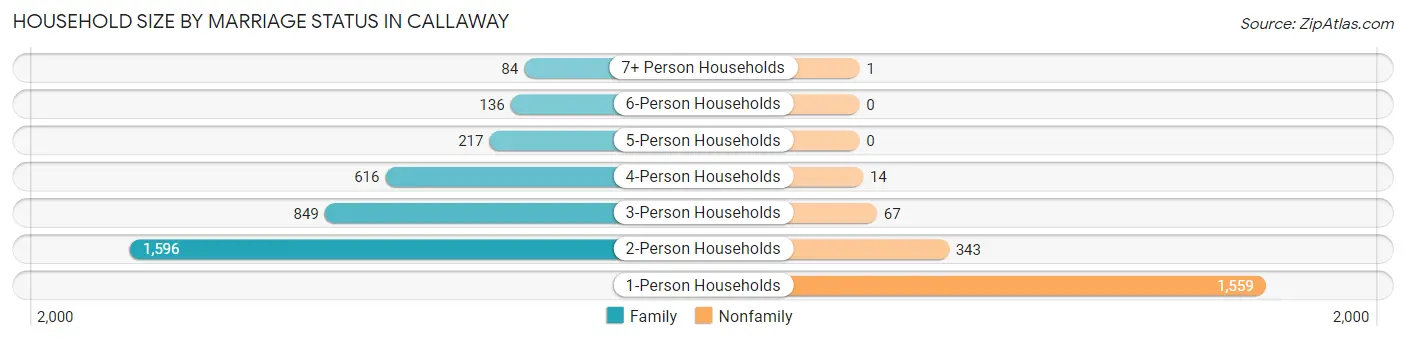
| Household Size | Family Households | Nonfamily Households |
| 1-Person Households | - | 1,559 (28.4%) |
| 2-Person Households | 1,596 (29.1%) | 343 (6.3%) |
| 3-Person Households | 849 (15.5%) | 67 (1.2%) |
| 4-Person Households | 616 (11.2%) | 14 (0.3%) |
| 5-Person Households | 217 (4.0%) | 0 (0.0%) |
| 6-Person Households | 136 (2.5%) | 0 (0.0%) |
| 7+ Person Households | 84 (1.5%) | 1 (0.0%) |
| Total | 3,498 (63.8%) | 1,984 (36.2%) |
Female Fertility in Callaway
Fertility by Age in Callaway
Average fertility rate in Callaway is 94.0 births per 1,000 women. Women in the age bracket of 35 to 50 years have the highest fertility rate with 138.0 births per 1,000 women. Women in the age bracket of 35 to 50 years acount for 66.8% of all women with births.
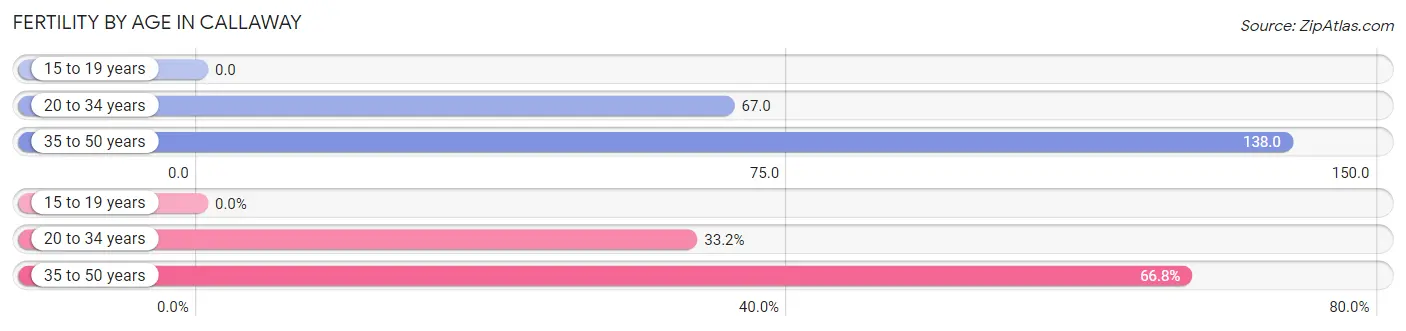
| Age Bracket | Women with Births | Births / 1,000 Women |
| 15 to 19 years | 0 (0.0%) | 0.0 |
| 20 to 34 years | 93 (33.2%) | 67.0 |
| 35 to 50 years | 187 (66.8%) | 138.0 |
| Total | 280 (100.0%) | 94.0 |
Fertility by Age by Marriage Status in Callaway
51.8% of women with births (280) in Callaway are married. The highest percentage of unmarried women with births falls into 35 to 50 years age bracket with 52.9% of them unmarried at the time of birth, while the lowest percentage of unmarried women with births belong to 20 to 34 years age bracket with 38.7% of them unmarried.
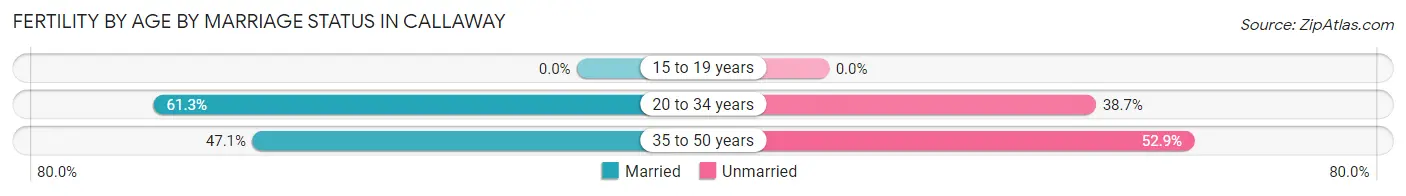
| Age Bracket | Married | Unmarried |
| 15 to 19 years | 0 (0.0%) | 0 (0.0%) |
| 20 to 34 years | 57 (61.3%) | 36 (38.7%) |
| 35 to 50 years | 88 (47.1%) | 99 (52.9%) |
| Total | 145 (51.8%) | 135 (48.2%) |
Fertility by Education in Callaway
Average fertility rate in Callaway is 94.0 births per 1,000 women. Women with the education attainment of graduate degree have the highest fertility rate of 344.0 births per 1,000 women, while women with the education attainment of less than high school have the lowest fertility at 34.0 births per 1,000 women. Women with the education attainment of bachelor's degree represent 36.8% of all women with births.
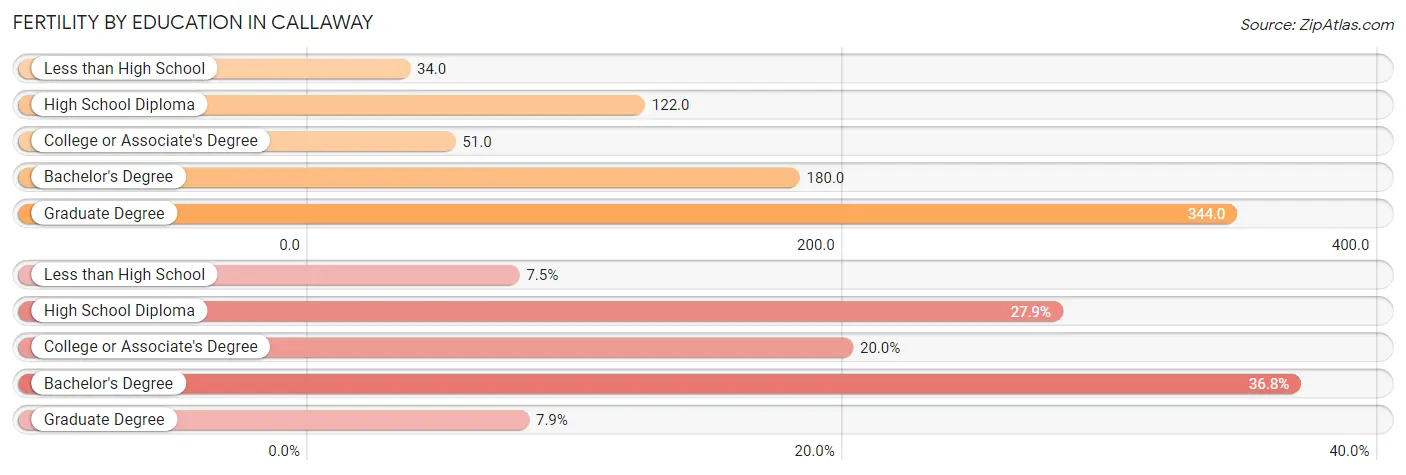
| Educational Attainment | Women with Births | Births / 1,000 Women |
| Less than High School | 21 (7.5%) | 34.0 |
| High School Diploma | 78 (27.9%) | 122.0 |
| College or Associate's Degree | 56 (20.0%) | 51.0 |
| Bachelor's Degree | 103 (36.8%) | 180.0 |
| Graduate Degree | 22 (7.9%) | 344.0 |
| Total | 280 (100.0%) | 94.0 |
Fertility by Education by Marriage Status in Callaway
48.2% of women with births in Callaway are unmarried. Women with the educational attainment of less than high school are most likely to be married with 100.0% of them married at childbirth, while women with the educational attainment of high school diploma are least likely to be married with 87.2% of them unmarried at childbirth.
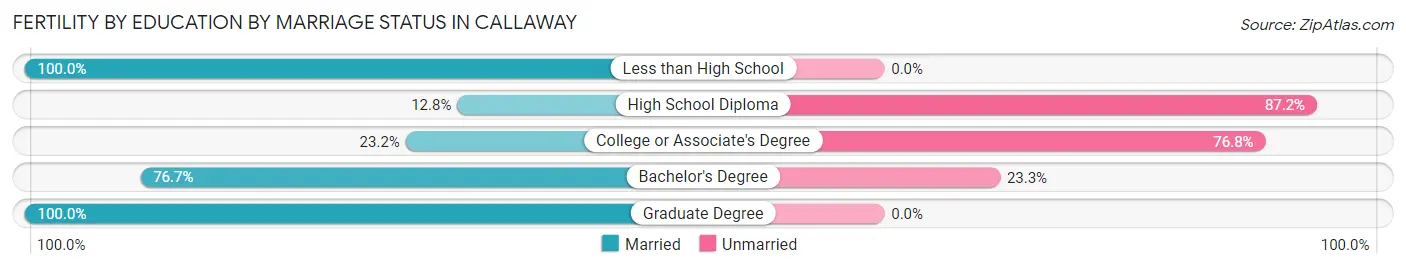
| Educational Attainment | Married | Unmarried |
| Less than High School | 21 (100.0%) | 0 (0.0%) |
| High School Diploma | 10 (12.8%) | 68 (87.2%) |
| College or Associate's Degree | 13 (23.2%) | 43 (76.8%) |
| Bachelor's Degree | 79 (76.7%) | 24 (23.3%) |
| Graduate Degree | 22 (100.0%) | 0 (0.0%) |
| Total | 145 (51.8%) | 135 (48.2%) |
Income in Callaway
Income Overview in Callaway
Per Capita Income in Callaway is $31,984, while median incomes of families and households are $75,799 and $61,743 respectively.
| Characteristic | Number | Measure |
| Per Capita Income | 13,455 | $31,984 |
| Median Family Income | 3,498 | $75,799 |
| Mean Family Income | 3,498 | $92,488 |
| Median Household Income | 5,482 | $61,743 |
| Mean Household Income | 5,482 | $77,639 |
| Income Deficit | 3,498 | $0 |
| Wage / Income Gap (%) | 13,455 | 19.33% |
| Wage / Income Gap ($) | 13,455 | 80.67¢ per $1 |
| Gini / Inequality Index | 13,455 | 0.39 |
Earnings by Sex in Callaway
Average Earnings in Callaway are $32,394, $35,665 for men and $28,772 for women, a difference of 19.3%.
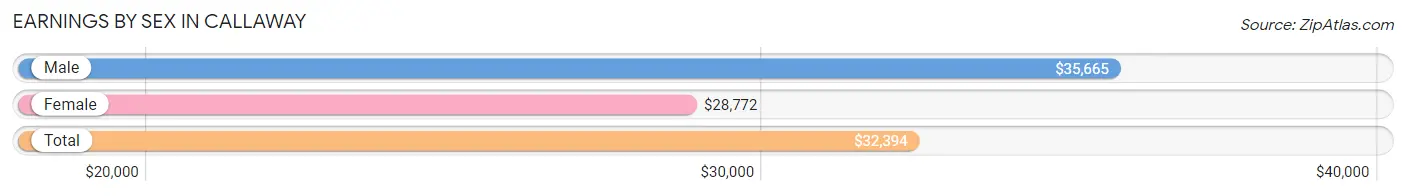
| Sex | Number | Average Earnings |
| Male | 4,143 (56.1%) | $35,665 |
| Female | 3,237 (43.9%) | $28,772 |
| Total | 7,380 (100.0%) | $32,394 |
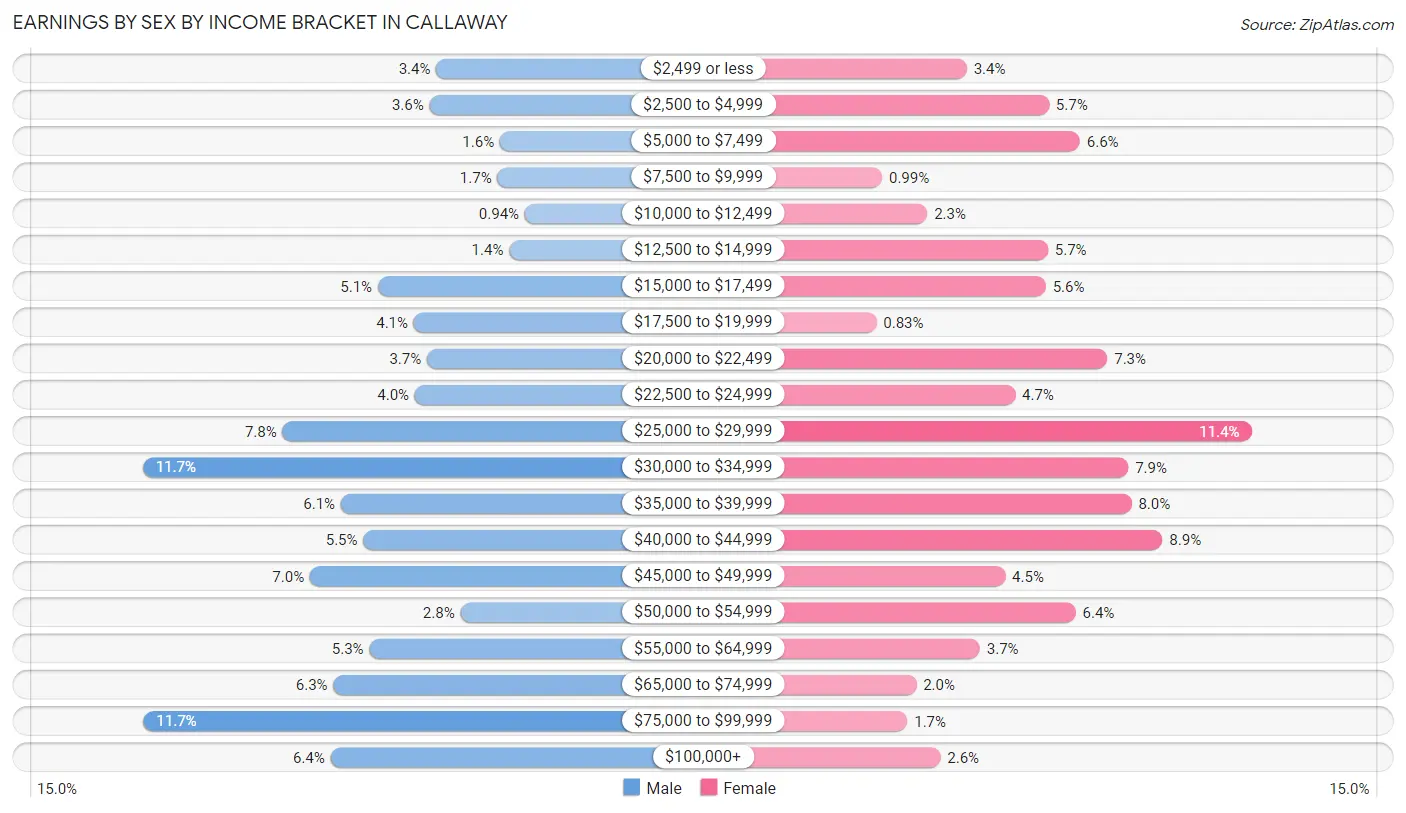
Earnings by Sex by Income Bracket in Callaway
The most common earnings brackets in Callaway are $30,000 to $34,999 for men (484 | 11.7%) and $25,000 to $29,999 for women (368 | 11.4%).
| Income | Male | Female |
| $2,499 or less | 142 (3.4%) | 109 (3.4%) |
| $2,500 to $4,999 | 150 (3.6%) | 184 (5.7%) |
| $5,000 to $7,499 | 68 (1.6%) | 212 (6.6%) |
| $7,500 to $9,999 | 71 (1.7%) | 32 (1.0%) |
| $10,000 to $12,499 | 39 (0.9%) | 73 (2.3%) |
| $12,500 to $14,999 | 57 (1.4%) | 183 (5.7%) |
| $15,000 to $17,499 | 210 (5.1%) | 181 (5.6%) |
| $17,500 to $19,999 | 168 (4.1%) | 27 (0.8%) |
| $20,000 to $22,499 | 153 (3.7%) | 237 (7.3%) |
| $22,500 to $24,999 | 167 (4.0%) | 153 (4.7%) |
| $25,000 to $29,999 | 321 (7.7%) | 368 (11.4%) |
| $30,000 to $34,999 | 484 (11.7%) | 256 (7.9%) |
| $35,000 to $39,999 | 253 (6.1%) | 259 (8.0%) |
| $40,000 to $44,999 | 227 (5.5%) | 287 (8.9%) |
| $45,000 to $49,999 | 289 (7.0%) | 144 (4.4%) |
| $50,000 to $54,999 | 114 (2.8%) | 208 (6.4%) |
| $55,000 to $64,999 | 220 (5.3%) | 121 (3.7%) |
| $65,000 to $74,999 | 262 (6.3%) | 63 (1.9%) |
| $75,000 to $99,999 | 483 (11.7%) | 55 (1.7%) |
| $100,000+ | 265 (6.4%) | 85 (2.6%) |
| Total | 4,143 (100.0%) | 3,237 (100.0%) |
Earnings by Sex by Educational Attainment in Callaway
Average earnings in Callaway are $39,523 for men and $31,802 for women, a difference of 19.5%. Men with an educational attainment of graduate degree enjoy the highest average annual earnings of $115,588, while those with high school diploma education earn the least with $32,530. Women with an educational attainment of graduate degree earn the most with the average annual earnings of $66,103, while those with high school diploma education have the smallest earnings of $18,935.
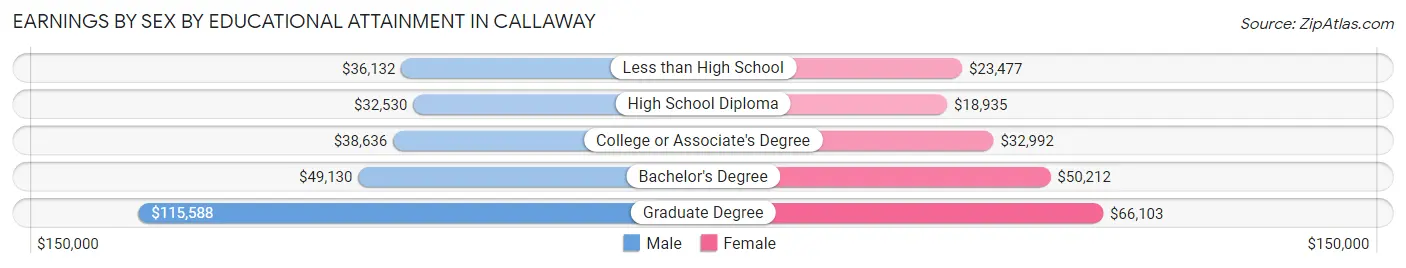
| Educational Attainment | Male Income | Female Income |
| Less than High School | $36,132 | $23,477 |
| High School Diploma | $32,530 | $18,935 |
| College or Associate's Degree | $38,636 | $32,992 |
| Bachelor's Degree | $49,130 | $50,212 |
| Graduate Degree | $115,588 | $66,103 |
| Total | $39,523 | $31,802 |
Family Income in Callaway
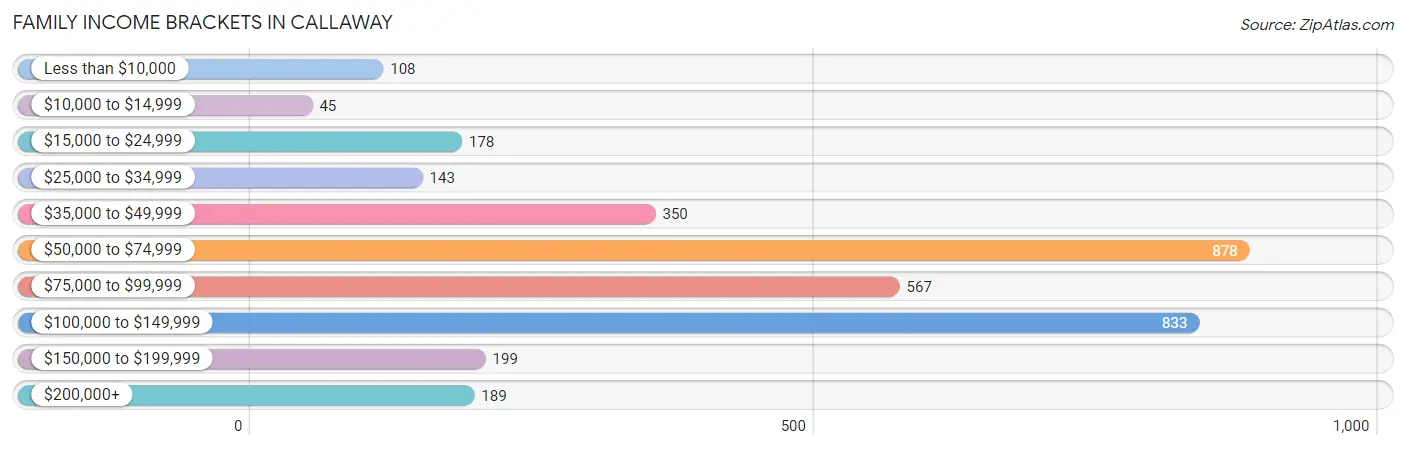
Family Income Brackets in Callaway
According to the Callaway family income data, there are 878 families falling into the $50,000 to $74,999 income range, which is the most common income bracket and makes up 25.1% of all families. Conversely, the $10,000 to $14,999 income bracket is the least frequent group with only 45 families (1.3%) belonging to this category.
| Income Bracket | # Families | % Families |
| Less than $10,000 | 108 | 3.1% |
| $10,000 to $14,999 | 45 | 1.3% |
| $15,000 to $24,999 | 178 | 5.1% |
| $25,000 to $34,999 | 143 | 4.1% |
| $35,000 to $49,999 | 350 | 10.0% |
| $50,000 to $74,999 | 878 | 25.1% |
| $75,000 to $99,999 | 567 | 16.2% |
| $100,000 to $149,999 | 833 | 23.8% |
| $150,000 to $199,999 | 199 | 5.7% |
| $200,000+ | 189 | 5.4% |
Family Income by Famaliy Size in Callaway
4-person families (520 | 14.9%) account for the highest median family income in Callaway with $98,048 per family, while 2-person families (1,747 | 49.9%) have the highest median income of $30,782 per family member.
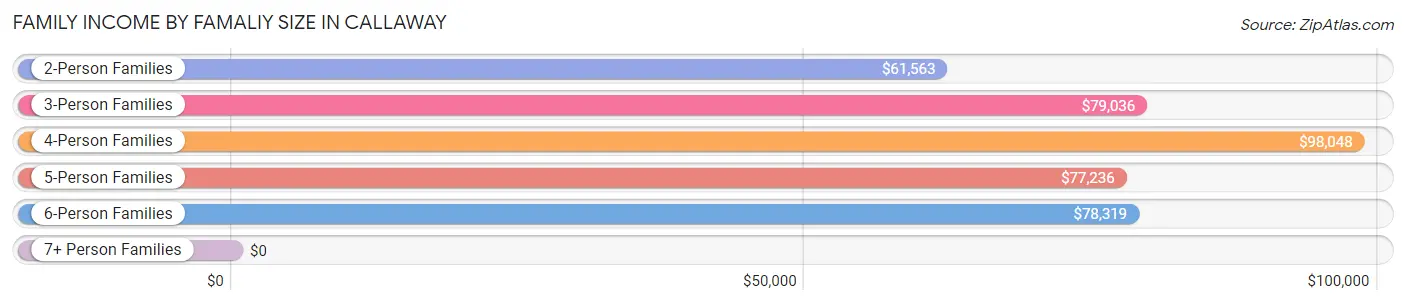
| Income Bracket | # Families | Median Income |
| 2-Person Families | 1,747 (49.9%) | $61,563 |
| 3-Person Families | 831 (23.8%) | $79,036 |
| 4-Person Families | 520 (14.9%) | $98,048 |
| 5-Person Families | 199 (5.7%) | $77,236 |
| 6-Person Families | 117 (3.3%) | $78,319 |
| 7+ Person Families | 84 (2.4%) | $0 |
| Total | 3,498 (100.0%) | $75,799 |
Family Income by Number of Earners in Callaway
The median family income in Callaway is $75,799, with families comprising 3+ earners (482) having the highest median family income of $112,241, while families with no earners (590) have the lowest median family income of $44,130, accounting for 13.8% and 16.9% of families, respectively.
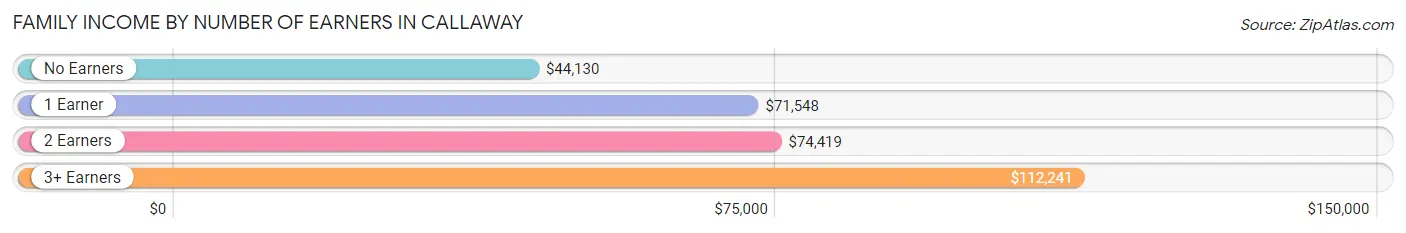
| Number of Earners | # Families | Median Income |
| No Earners | 590 (16.9%) | $44,130 |
| 1 Earner | 1,318 (37.7%) | $71,548 |
| 2 Earners | 1,108 (31.7%) | $74,419 |
| 3+ Earners | 482 (13.8%) | $112,241 |
| Total | 3,498 (100.0%) | $75,799 |
Household Income in Callaway
Household Income Brackets in Callaway
With 1,283 households falling in the category, the $50,000 to $74,999 income range is the most frequent in Callaway, accounting for 23.4% of all households. In contrast, only 175 households (3.2%) fall into the less than $10,000 income bracket, making it the least populous group.
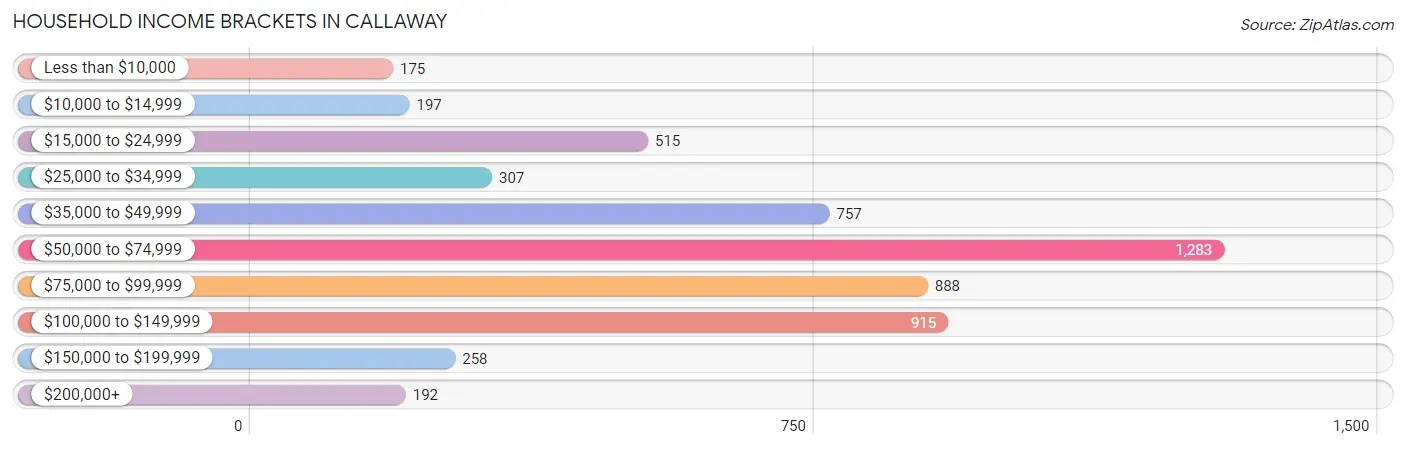
| Income Bracket | # Households | % Households |
| Less than $10,000 | 175 | 3.2% |
| $10,000 to $14,999 | 197 | 3.6% |
| $15,000 to $24,999 | 515 | 9.4% |
| $25,000 to $34,999 | 307 | 5.6% |
| $35,000 to $49,999 | 757 | 13.8% |
| $50,000 to $74,999 | 1,283 | 23.4% |
| $75,000 to $99,999 | 888 | 16.2% |
| $100,000 to $149,999 | 915 | 16.7% |
| $150,000 to $199,999 | 258 | 4.7% |
| $200,000+ | 192 | 3.5% |
Household Income by Householder Age in Callaway
The median household income in Callaway is $61,743, with the highest median household income of $85,253 found in the 45 to 64 years age bracket for the primary householder. A total of 2,189 households (39.9%) fall into this category. Meanwhile, the 15 to 24 years age bracket for the primary householder has the lowest median household income of $53,069, with 267 households (4.9%) in this group.
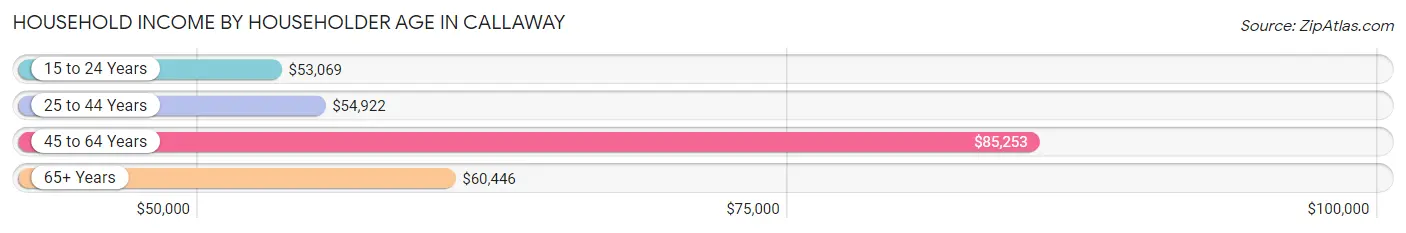
| Income Bracket | # Households | Median Income |
| 15 to 24 Years | 267 (4.9%) | $53,069 |
| 25 to 44 Years | 1,823 (33.3%) | $54,922 |
| 45 to 64 Years | 2,189 (39.9%) | $85,253 |
| 65+ Years | 1,203 (21.9%) | $60,446 |
| Total | 5,482 (100.0%) | $61,743 |
Poverty in Callaway
Income Below Poverty by Sex and Age in Callaway
With 7.9% poverty level for males and 10.4% for females among the residents of Callaway, 16 and 17 year old males and 12 to 14 year old females are the most vulnerable to poverty, with 74 males (46.3%) and 89 females (43.2%) in their respective age groups living below the poverty level.
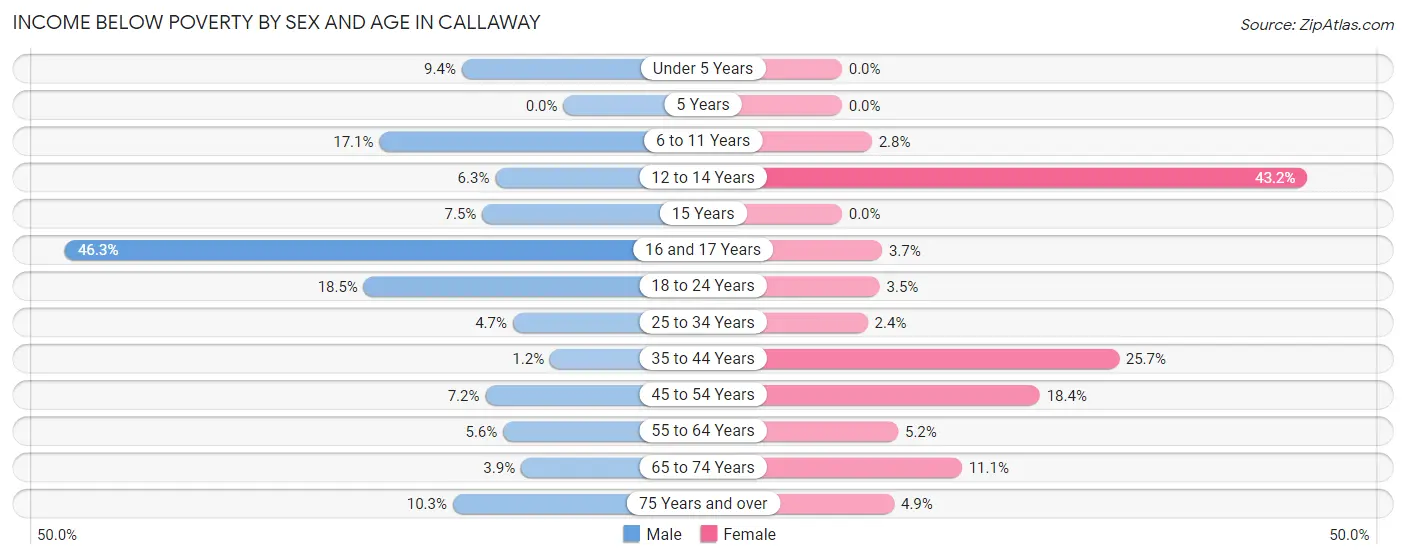
| Age Bracket | Male | Female |
| Under 5 Years | 43 (9.4%) | 0 (0.0%) |
| 5 Years | 0 (0.0%) | 0 (0.0%) |
| 6 to 11 Years | 62 (17.1%) | 14 (2.8%) |
| 12 to 14 Years | 18 (6.3%) | 89 (43.2%) |
| 15 Years | 11 (7.5%) | 0 (0.0%) |
| 16 and 17 Years | 74 (46.3%) | 6 (3.7%) |
| 18 to 24 Years | 101 (18.5%) | 19 (3.5%) |
| 25 to 34 Years | 64 (4.7%) | 21 (2.4%) |
| 35 to 44 Years | 9 (1.2%) | 244 (25.7%) |
| 45 to 54 Years | 52 (7.2%) | 133 (18.4%) |
| 55 to 64 Years | 68 (5.6%) | 49 (5.2%) |
| 65 to 74 Years | 27 (3.9%) | 60 (11.1%) |
| 75 Years and over | 31 (10.3%) | 18 (4.9%) |
| Total | 560 (7.9%) | 653 (10.4%) |
Income Above Poverty by Sex and Age in Callaway
According to the poverty statistics in Callaway, males aged 5 years and females aged under 5 years are the age groups that are most secure financially, with 100.0% of males and 100.0% of females in these age groups living above the poverty line.
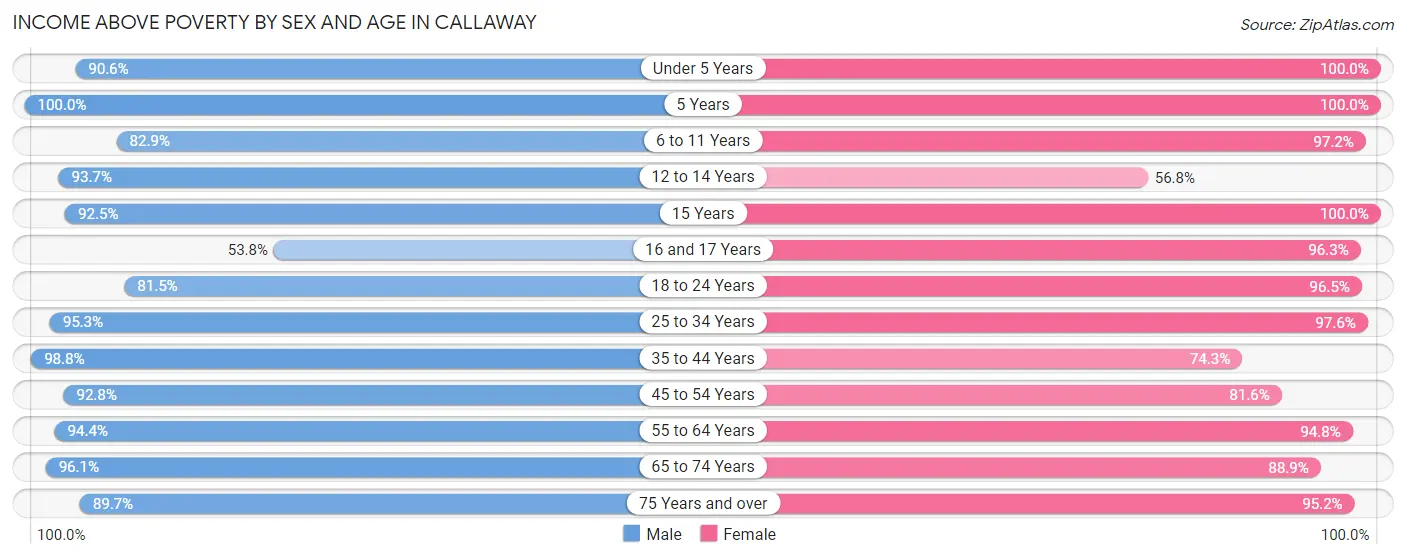
| Age Bracket | Male | Female |
| Under 5 Years | 413 (90.6%) | 341 (100.0%) |
| 5 Years | 83 (100.0%) | 89 (100.0%) |
| 6 to 11 Years | 301 (82.9%) | 489 (97.2%) |
| 12 to 14 Years | 267 (93.7%) | 117 (56.8%) |
| 15 Years | 135 (92.5%) | 52 (100.0%) |
| 16 and 17 Years | 86 (53.7%) | 155 (96.3%) |
| 18 to 24 Years | 444 (81.5%) | 523 (96.5%) |
| 25 to 34 Years | 1,302 (95.3%) | 854 (97.6%) |
| 35 to 44 Years | 716 (98.8%) | 705 (74.3%) |
| 45 to 54 Years | 666 (92.8%) | 591 (81.6%) |
| 55 to 64 Years | 1,149 (94.4%) | 890 (94.8%) |
| 65 to 74 Years | 660 (96.1%) | 479 (88.9%) |
| 75 Years and over | 271 (89.7%) | 353 (95.2%) |
| Total | 6,493 (92.1%) | 5,638 (89.6%) |
Income Below Poverty Among Married-Couple Families in Callaway
The poverty statistics for married-couple families in Callaway show that 4.8% or 113 of the total 2,356 families live below the poverty line. Families with 5 or more children have the highest poverty rate of 100.0%, comprising of 37 families. On the other hand, families with 3 or 4 children have the lowest poverty rate of 0.0%, which includes 0 families.
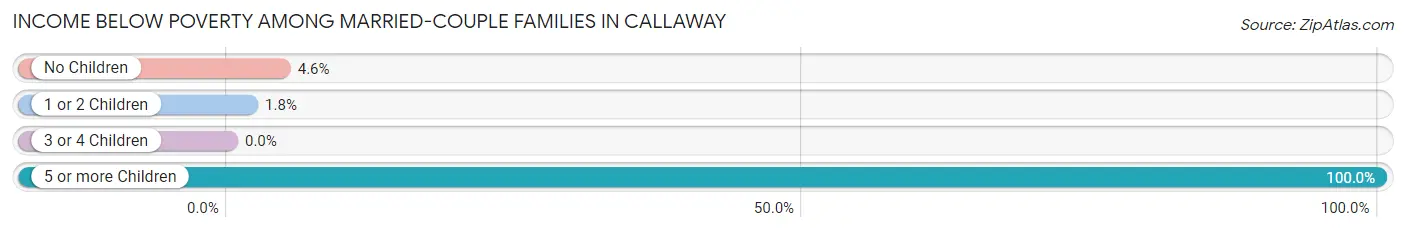
| Children | Above Poverty | Below Poverty |
| No Children | 1,267 (95.4%) | 61 (4.6%) |
| 1 or 2 Children | 843 (98.3%) | 15 (1.8%) |
| 3 or 4 Children | 133 (100.0%) | 0 (0.0%) |
| 5 or more Children | 0 (0.0%) | 37 (100.0%) |
| Total | 2,243 (95.2%) | 113 (4.8%) |
Income Below Poverty Among Single-Parent Households in Callaway
According to the poverty data in Callaway, 3.5% or 15 single-father households and 10.6% or 75 single-mother households are living below the poverty line. Among single-father households, those with 1 or 2 children have the highest poverty rate, with 15 households (5.8%) experiencing poverty. Likewise, among single-mother households, those with 3 or 4 children have the highest poverty rate, with 9 households (100.0%) falling below the poverty line.
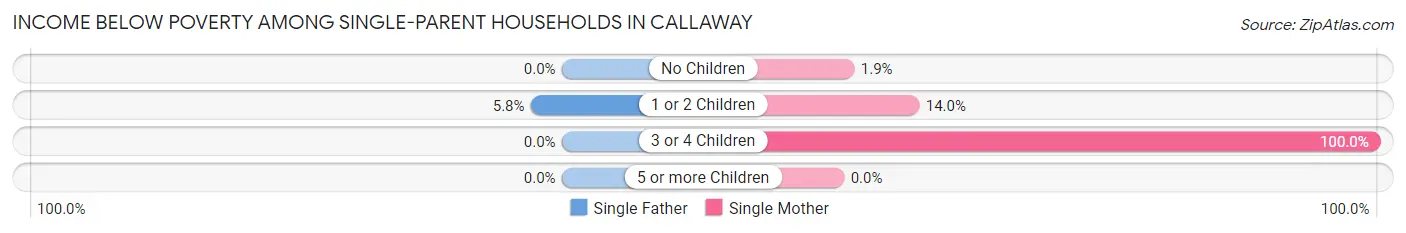
| Children | Single Father | Single Mother |
| No Children | 0 (0.0%) | 5 (1.9%) |
| 1 or 2 Children | 15 (5.8%) | 61 (14.0%) |
| 3 or 4 Children | 0 (0.0%) | 9 (100.0%) |
| 5 or more Children | 0 (0.0%) | 0 (0.0%) |
| Total | 15 (3.5%) | 75 (10.6%) |
Income Below Poverty Among Married-Couple vs Single-Parent Households in Callaway
The poverty data for Callaway shows that 113 of the married-couple family households (4.8%) and 90 of the single-parent households (7.9%) are living below the poverty level. Within the married-couple family households, those with 5 or more children have the highest poverty rate, with 37 households (100.0%) falling below the poverty line. Among the single-parent households, those with 3 or 4 children have the highest poverty rate, with 9 household (32.1%) living below poverty.
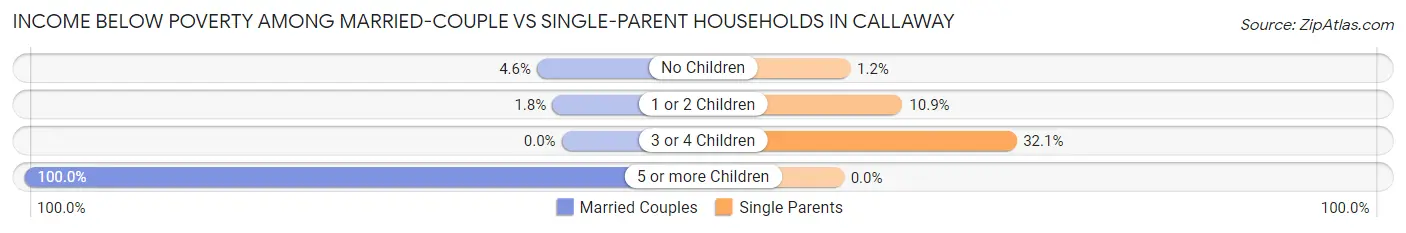
| Children | Married-Couple Families | Single-Parent Households |
| No Children | 61 (4.6%) | 5 (1.2%) |
| 1 or 2 Children | 15 (1.8%) | 76 (10.9%) |
| 3 or 4 Children | 0 (0.0%) | 9 (32.1%) |
| 5 or more Children | 37 (100.0%) | 0 (0.0%) |
| Total | 113 (4.8%) | 90 (7.9%) |
Employment Characteristics in Callaway
Employment by Class of Employer in Callaway
Among the 6,795 employed individuals in Callaway, private company employees (4,670 | 68.7%), federal government employees (809 | 11.9%), and local government employees (467 | 6.9%) make up the most common classes of employment.
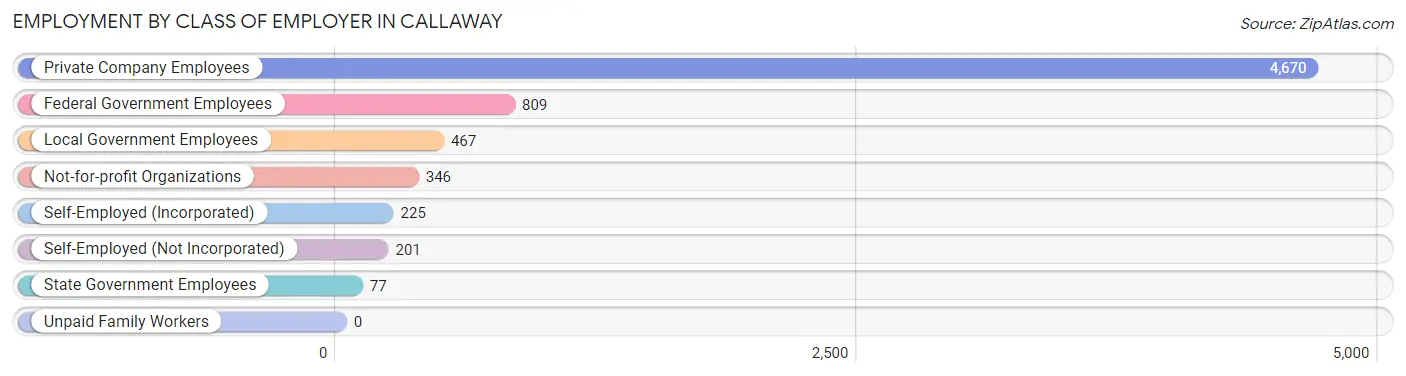
| Employer Class | # Employees | % Employees |
| Private Company Employees | 4,670 | 68.7% |
| Self-Employed (Incorporated) | 225 | 3.3% |
| Self-Employed (Not Incorporated) | 201 | 3.0% |
| Not-for-profit Organizations | 346 | 5.1% |
| Local Government Employees | 467 | 6.9% |
| State Government Employees | 77 | 1.1% |
| Federal Government Employees | 809 | 11.9% |
| Unpaid Family Workers | 0 | 0.0% |
| Total | 6,795 | 100.0% |
Employment Status by Age in Callaway
According to the labor force statistics for Callaway, out of the total population over 16 years of age (10,902), 66.1% or 7,206 individuals are in the labor force, with 4.7% or 339 of them unemployed. The age group with the highest labor force participation rate is 20 to 24 years, with 92.8% or 787 individuals in the labor force. Within the labor force, the 55 to 59 years age range has the highest percentage of unemployed individuals, with 8.4% or 72 of them being unemployed.
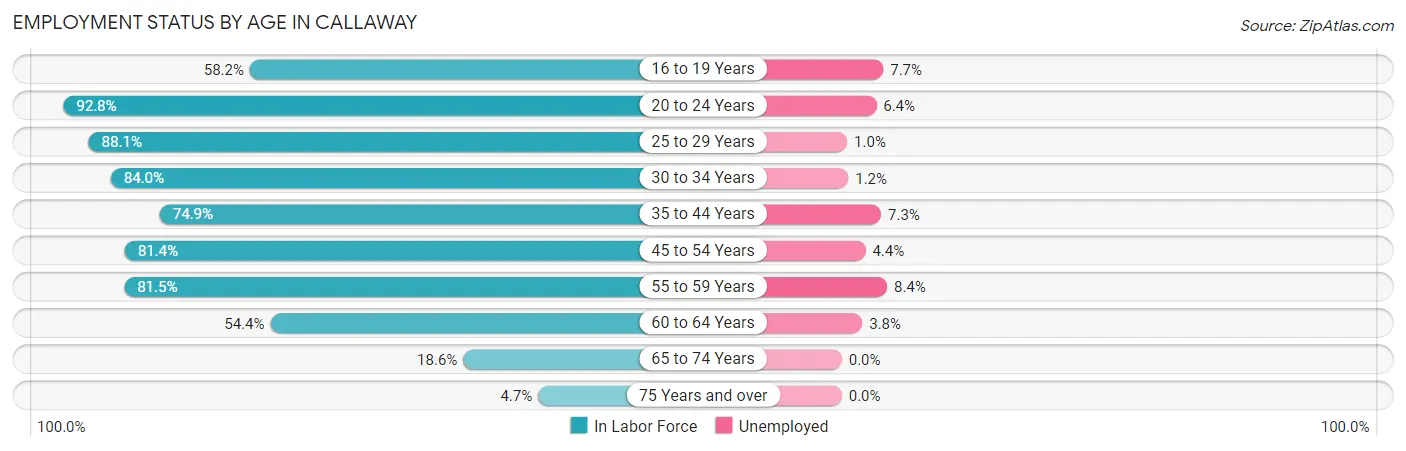
| Age Bracket | In Labor Force | Unemployed |
| 16 to 19 Years | 326 (58.2%) | 25 (7.7%) |
| 20 to 24 Years | 787 (92.8%) | 50 (6.4%) |
| 25 to 29 Years | 1,028 (88.1%) | 10 (1.0%) |
| 30 to 34 Years | 902 (84.0%) | 11 (1.2%) |
| 35 to 44 Years | 1,254 (74.9%) | 92 (7.3%) |
| 45 to 54 Years | 1,180 (81.4%) | 52 (4.4%) |
| 55 to 59 Years | 862 (81.5%) | 72 (8.4%) |
| 60 to 64 Years | 603 (54.4%) | 23 (3.8%) |
| 65 to 74 Years | 230 (18.6%) | 0 (0.0%) |
| 75 Years and over | 34 (4.7%) | 0 (0.0%) |
| Total | 7,206 (66.1%) | 339 (4.7%) |
Employment Status by Educational Attainment in Callaway
According to labor force statistics for Callaway, 77.4% of individuals (5,829) out of the total population between 25 and 64 years of age (7,531) are in the labor force, with 4.6% or 268 of them being unemployed. The group with the highest labor force participation rate are those with the educational attainment of bachelor's degree or higher, with 85.3% or 1,402 individuals in the labor force. Within the labor force, individuals with high school diploma education have the highest percentage of unemployment, with 10.5% or 163 of them being unemployed.
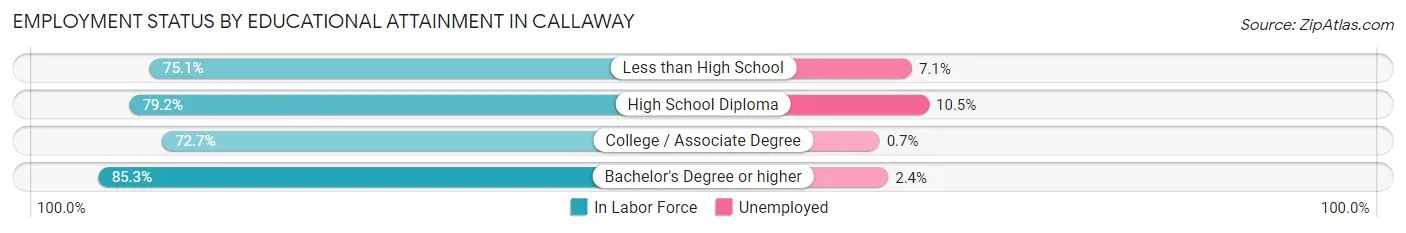
| Educational Attainment | In Labor Force | Unemployed |
| Less than High School | 644 (75.1%) | 61 (7.1%) |
| High School Diploma | 1,554 (79.2%) | 206 (10.5%) |
| College / Associate Degree | 2,230 (72.7%) | 21 (0.7%) |
| Bachelor's Degree or higher | 1,402 (85.3%) | 39 (2.4%) |
| Total | 5,829 (77.4%) | 346 (4.6%) |
Employment Occupations by Sex in Callaway
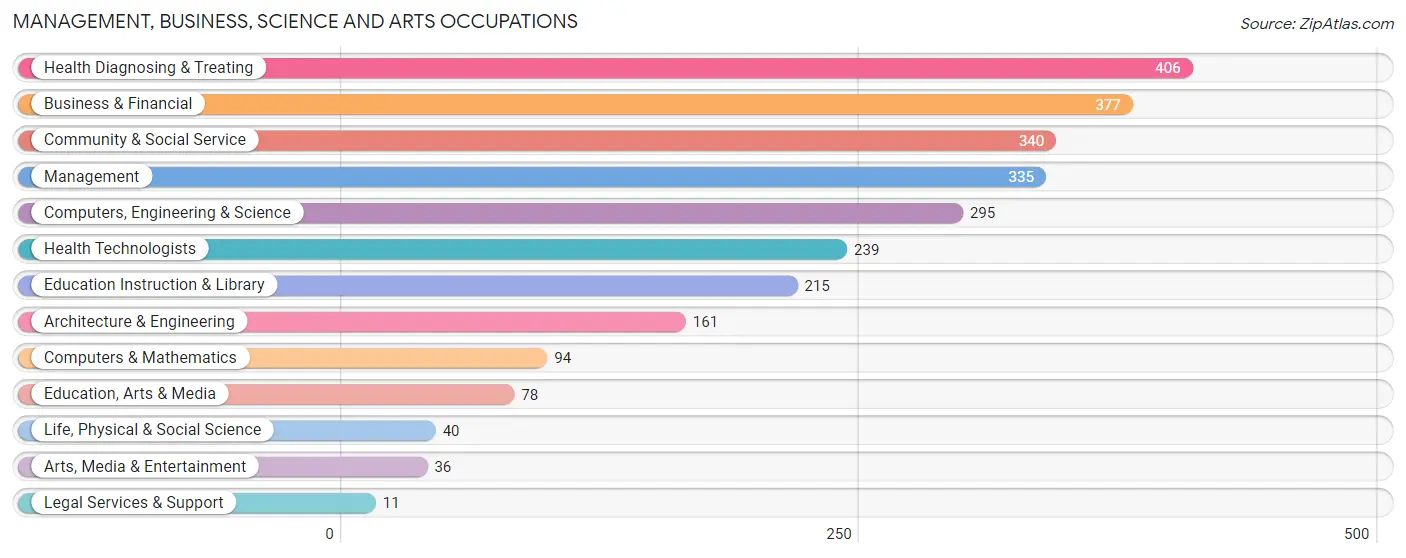
Management, Business, Science and Arts Occupations
The most common Management, Business, Science and Arts occupations in Callaway are Health Diagnosing & Treating (406 | 6.3%), Business & Financial (377 | 5.8%), Community & Social Service (340 | 5.3%), Management (335 | 5.2%), and Computers, Engineering & Science (295 | 4.6%).
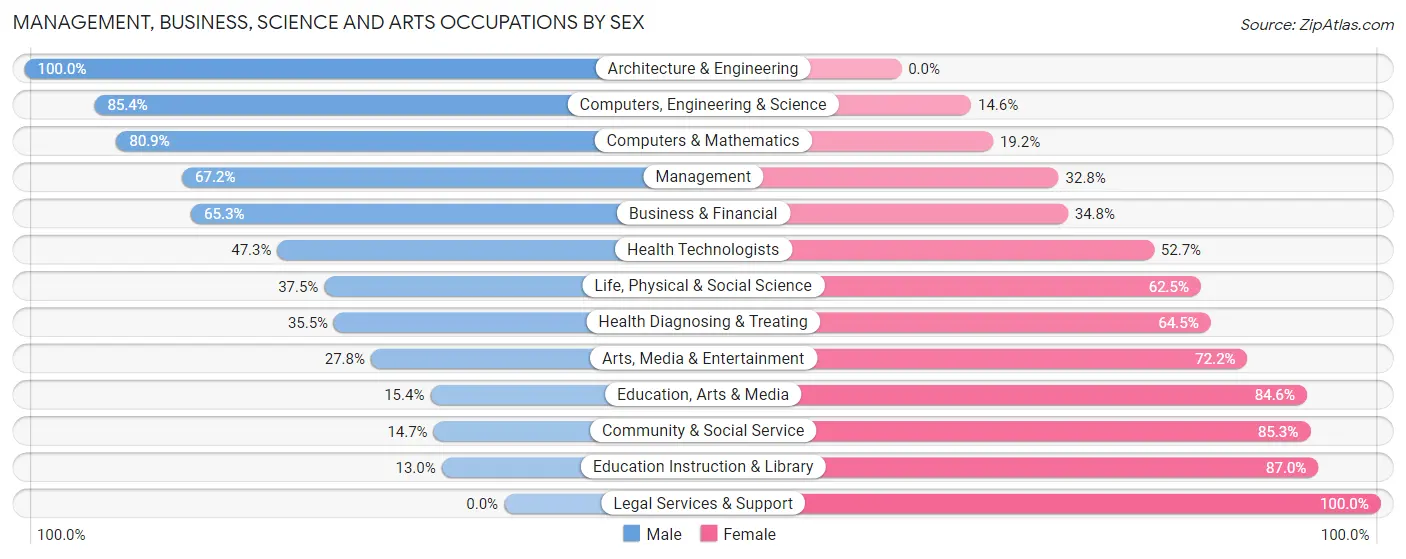
Management, Business, Science and Arts Occupations by Sex
Within the Management, Business, Science and Arts occupations in Callaway, the most male-oriented occupations are Architecture & Engineering (100.0%), Computers, Engineering & Science (85.4%), and Computers & Mathematics (80.8%), while the most female-oriented occupations are Legal Services & Support (100.0%), Education Instruction & Library (87.0%), and Community & Social Service (85.3%).
| Occupation | Male | Female |
| Management | 225 (67.2%) | 110 (32.8%) |
| Business & Financial | 246 (65.2%) | 131 (34.7%) |
| Computers, Engineering & Science | 252 (85.4%) | 43 (14.6%) |
| Computers & Mathematics | 76 (80.8%) | 18 (19.2%) |
| Architecture & Engineering | 161 (100.0%) | 0 (0.0%) |
| Life, Physical & Social Science | 15 (37.5%) | 25 (62.5%) |
| Community & Social Service | 50 (14.7%) | 290 (85.3%) |
| Education, Arts & Media | 12 (15.4%) | 66 (84.6%) |
| Legal Services & Support | 0 (0.0%) | 11 (100.0%) |
| Education Instruction & Library | 28 (13.0%) | 187 (87.0%) |
| Arts, Media & Entertainment | 10 (27.8%) | 26 (72.2%) |
| Health Diagnosing & Treating | 144 (35.5%) | 262 (64.5%) |
| Health Technologists | 113 (47.3%) | 126 (52.7%) |
| Total (Category) | 917 (52.3%) | 836 (47.7%) |
| Total (Overall) | 3,630 (56.1%) | 2,835 (43.9%) |
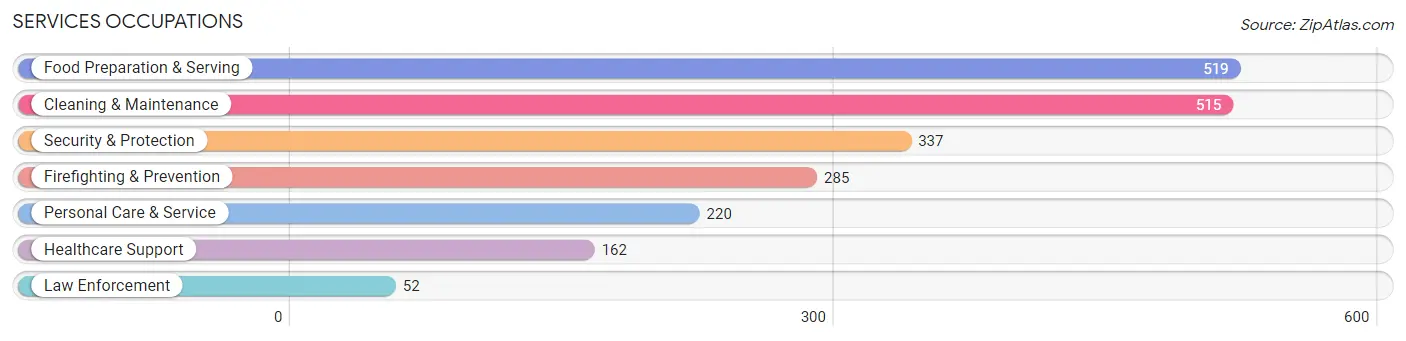
Services Occupations
The most common Services occupations in Callaway are Food Preparation & Serving (519 | 8.0%), Cleaning & Maintenance (515 | 8.0%), Security & Protection (337 | 5.2%), Firefighting & Prevention (285 | 4.4%), and Personal Care & Service (220 | 3.4%).
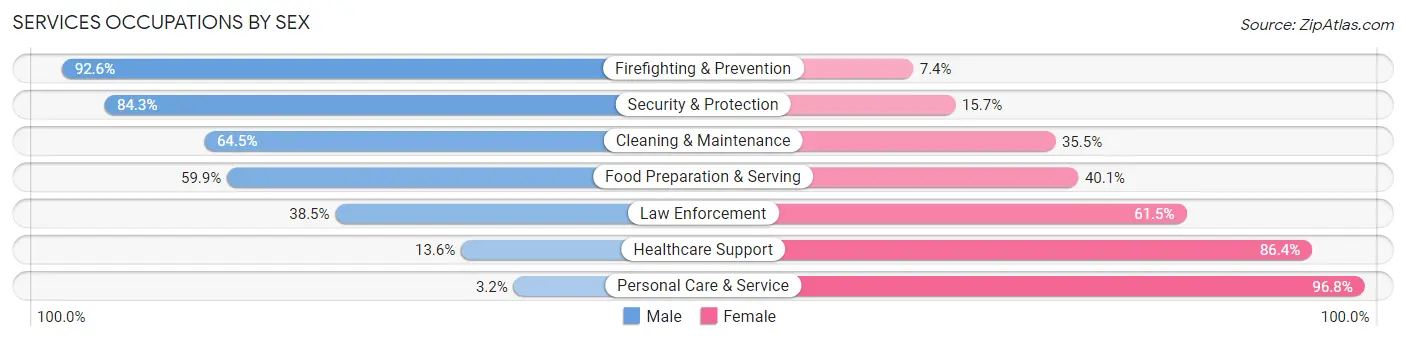
Services Occupations by Sex
Within the Services occupations in Callaway, the most male-oriented occupations are Firefighting & Prevention (92.6%), Security & Protection (84.3%), and Cleaning & Maintenance (64.5%), while the most female-oriented occupations are Personal Care & Service (96.8%), Healthcare Support (86.4%), and Law Enforcement (61.5%).
| Occupation | Male | Female |
| Healthcare Support | 22 (13.6%) | 140 (86.4%) |
| Security & Protection | 284 (84.3%) | 53 (15.7%) |
| Firefighting & Prevention | 264 (92.6%) | 21 (7.4%) |
| Law Enforcement | 20 (38.5%) | 32 (61.5%) |
| Food Preparation & Serving | 311 (59.9%) | 208 (40.1%) |
| Cleaning & Maintenance | 332 (64.5%) | 183 (35.5%) |
| Personal Care & Service | 7 (3.2%) | 213 (96.8%) |
| Total (Category) | 956 (54.5%) | 797 (45.5%) |
| Total (Overall) | 3,630 (56.1%) | 2,835 (43.9%) |
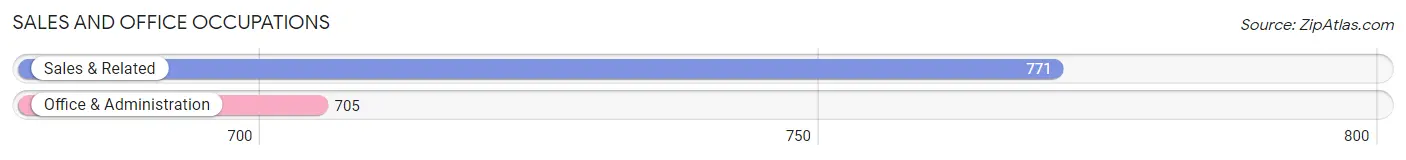
Sales and Office Occupations
The most common Sales and Office occupations in Callaway are Sales & Related (771 | 11.9%), and Office & Administration (705 | 10.9%).
Sales and Office Occupations by Sex
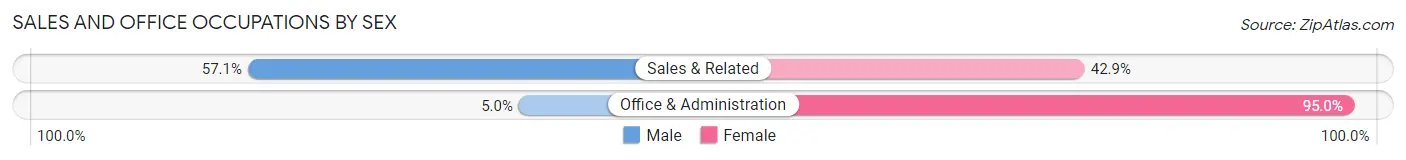
| Occupation | Male | Female |
| Sales & Related | 440 (57.1%) | 331 (42.9%) |
| Office & Administration | 35 (5.0%) | 670 (95.0%) |
| Total (Category) | 475 (32.2%) | 1,001 (67.8%) |
| Total (Overall) | 3,630 (56.1%) | 2,835 (43.9%) |
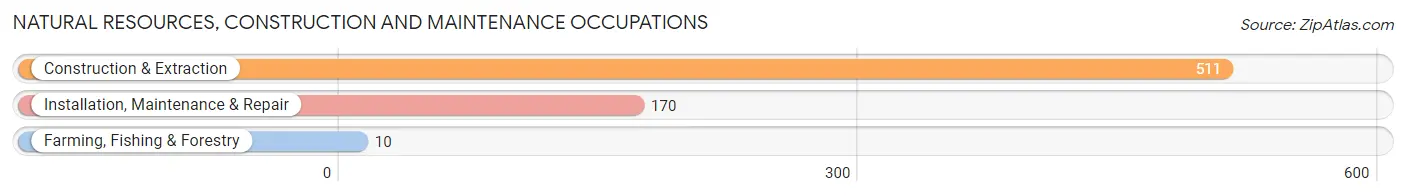
Natural Resources, Construction and Maintenance Occupations
The most common Natural Resources, Construction and Maintenance occupations in Callaway are Construction & Extraction (511 | 7.9%), Installation, Maintenance & Repair (170 | 2.6%), and Farming, Fishing & Forestry (10 | 0.2%).
Natural Resources, Construction and Maintenance Occupations by Sex
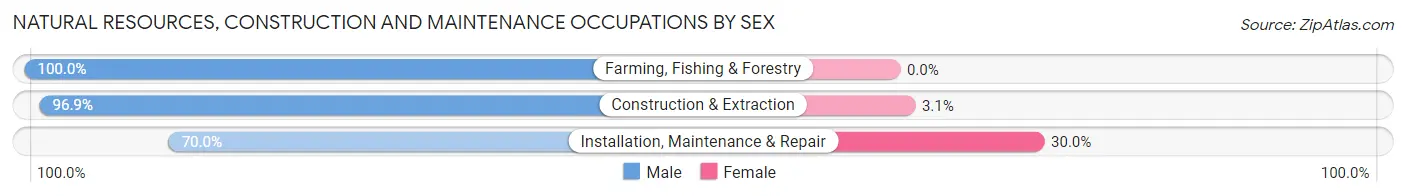
| Occupation | Male | Female |
| Farming, Fishing & Forestry | 10 (100.0%) | 0 (0.0%) |
| Construction & Extraction | 495 (96.9%) | 16 (3.1%) |
| Installation, Maintenance & Repair | 119 (70.0%) | 51 (30.0%) |
| Total (Category) | 624 (90.3%) | 67 (9.7%) |
| Total (Overall) | 3,630 (56.1%) | 2,835 (43.9%) |
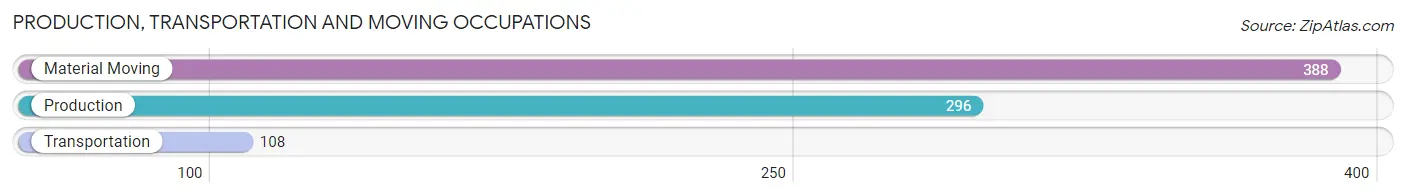
Production, Transportation and Moving Occupations
The most common Production, Transportation and Moving occupations in Callaway are Material Moving (388 | 6.0%), Production (296 | 4.6%), and Transportation (108 | 1.7%).
Production, Transportation and Moving Occupations by Sex
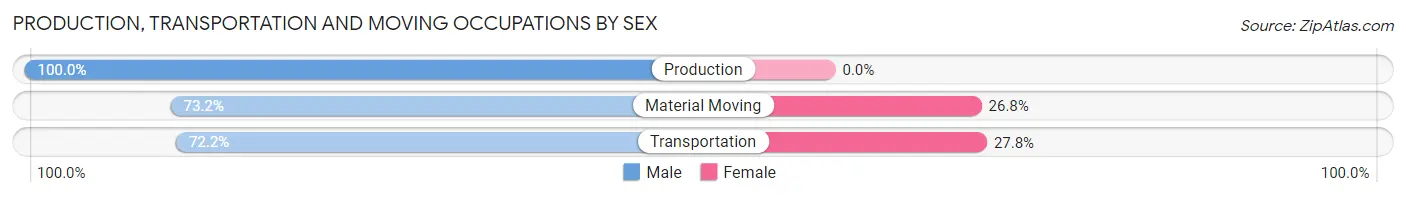
| Occupation | Male | Female |
| Production | 296 (100.0%) | 0 (0.0%) |
| Transportation | 78 (72.2%) | 30 (27.8%) |
| Material Moving | 284 (73.2%) | 104 (26.8%) |
| Total (Category) | 658 (83.1%) | 134 (16.9%) |
| Total (Overall) | 3,630 (56.1%) | 2,835 (43.9%) |
Employment Industries by Sex in Callaway
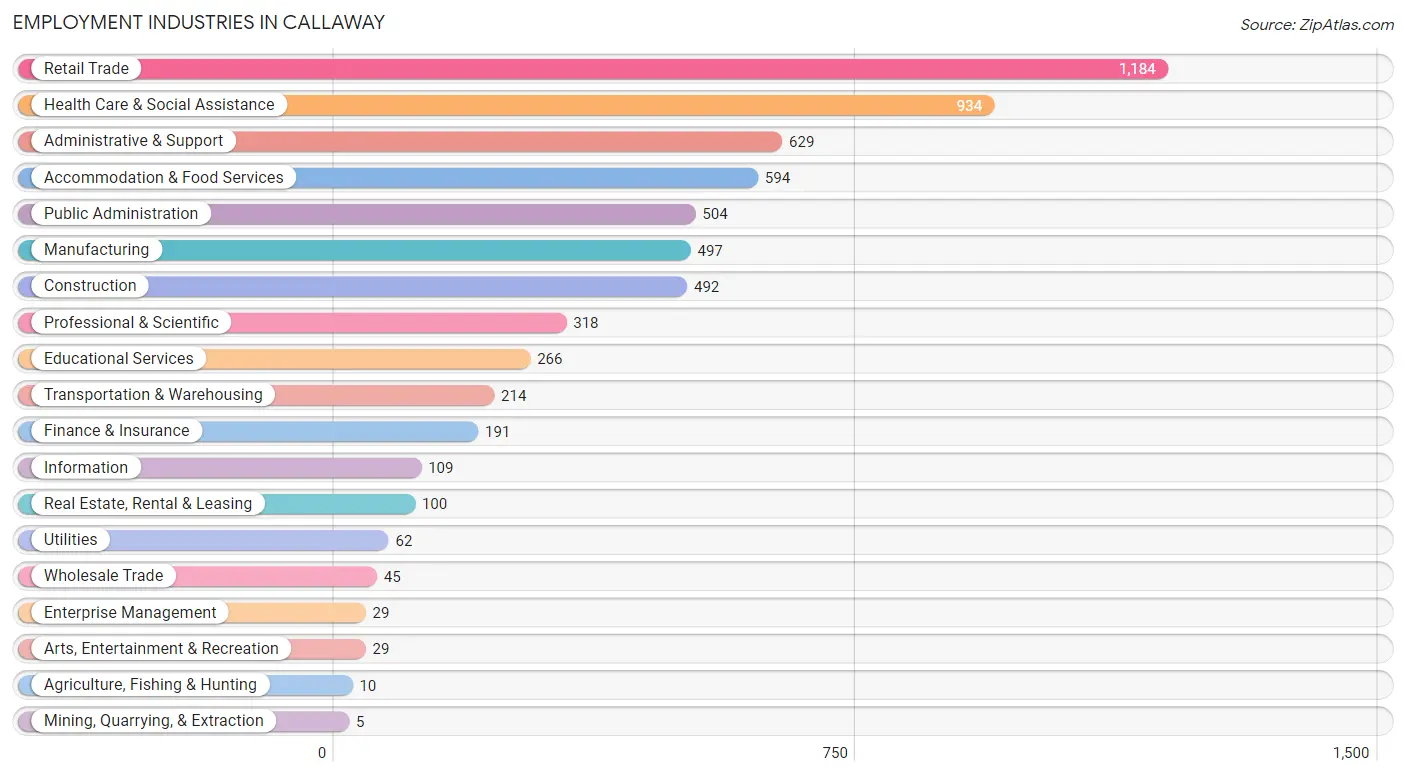
Employment Industries in Callaway
The major employment industries in Callaway include Retail Trade (1,184 | 18.3%), Health Care & Social Assistance (934 | 14.4%), Administrative & Support (629 | 9.7%), Accommodation & Food Services (594 | 9.2%), and Public Administration (504 | 7.8%).
Employment Industries by Sex in Callaway
The Callaway industries that see more men than women are Agriculture, Fishing & Hunting (100.0%), Utilities (100.0%), and Manufacturing (95.0%), whereas the industries that tend to have a higher number of women are Mining, Quarrying, & Extraction (100.0%), Enterprise Management (100.0%), and Health Care & Social Assistance (78.6%).
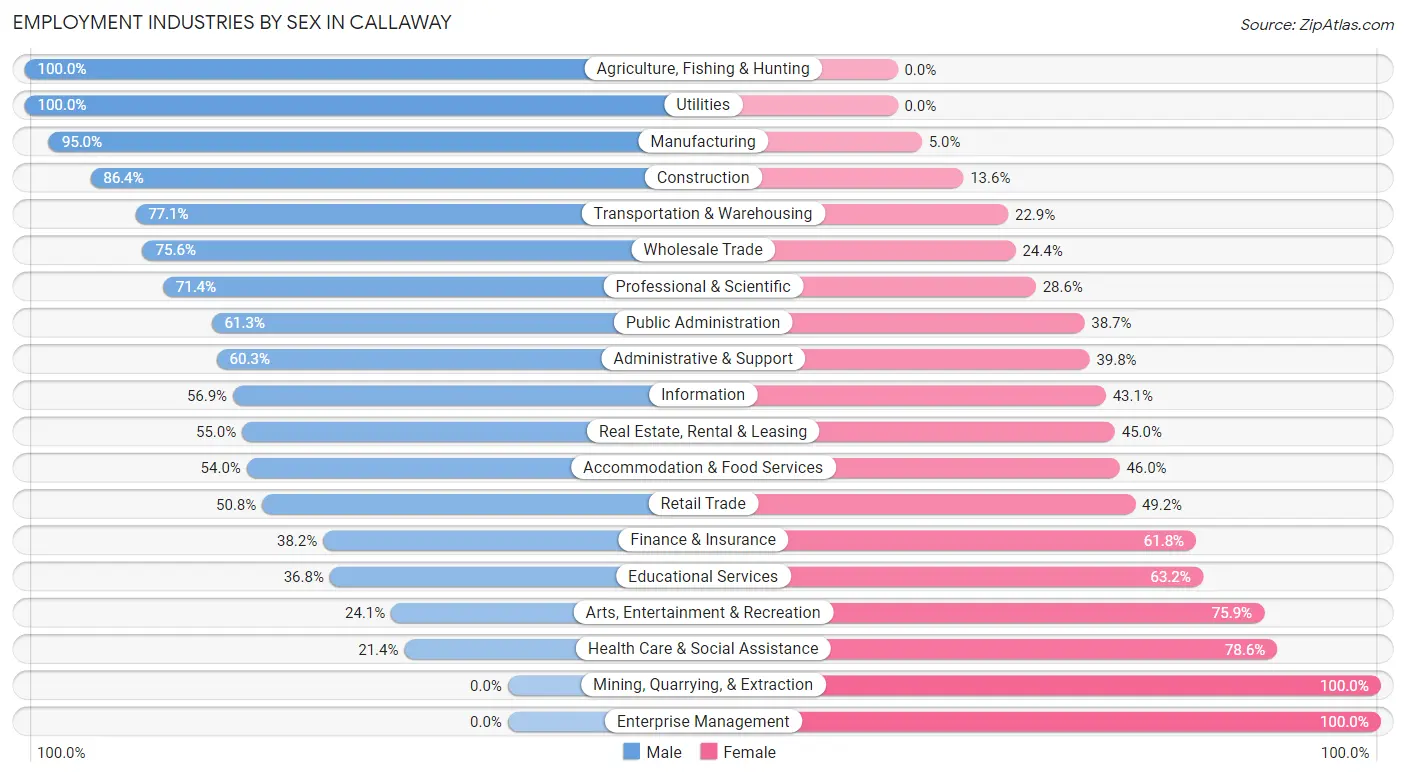
| Industry | Male | Female |
| Agriculture, Fishing & Hunting | 10 (100.0%) | 0 (0.0%) |
| Mining, Quarrying, & Extraction | 0 (0.0%) | 5 (100.0%) |
| Construction | 425 (86.4%) | 67 (13.6%) |
| Manufacturing | 472 (95.0%) | 25 (5.0%) |
| Wholesale Trade | 34 (75.6%) | 11 (24.4%) |
| Retail Trade | 602 (50.8%) | 582 (49.2%) |
| Transportation & Warehousing | 165 (77.1%) | 49 (22.9%) |
| Utilities | 62 (100.0%) | 0 (0.0%) |
| Information | 62 (56.9%) | 47 (43.1%) |
| Finance & Insurance | 73 (38.2%) | 118 (61.8%) |
| Real Estate, Rental & Leasing | 55 (55.0%) | 45 (45.0%) |
| Professional & Scientific | 227 (71.4%) | 91 (28.6%) |
| Enterprise Management | 0 (0.0%) | 29 (100.0%) |
| Administrative & Support | 379 (60.3%) | 250 (39.8%) |
| Educational Services | 98 (36.8%) | 168 (63.2%) |
| Health Care & Social Assistance | 200 (21.4%) | 734 (78.6%) |
| Arts, Entertainment & Recreation | 7 (24.1%) | 22 (75.9%) |
| Accommodation & Food Services | 321 (54.0%) | 273 (46.0%) |
| Public Administration | 309 (61.3%) | 195 (38.7%) |
| Total | 3,630 (56.1%) | 2,835 (43.9%) |
Education in Callaway
School Enrollment in Callaway
The most common levels of schooling among the 2,870 students in Callaway are college / undergraduate (649 | 22.6%), middle school (614 | 21.4%), and high school (592 | 20.6%).
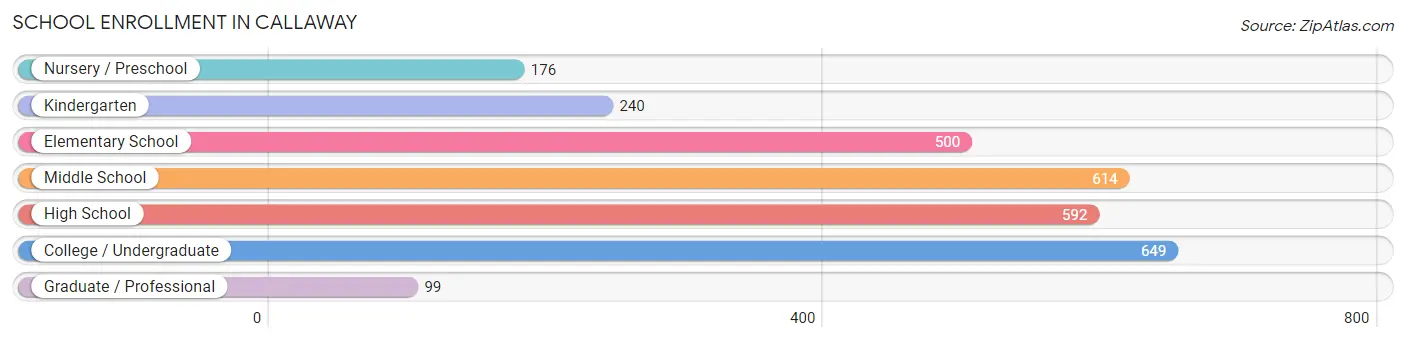
| School Level | # Students | % Students |
| Nursery / Preschool | 176 | 6.1% |
| Kindergarten | 240 | 8.4% |
| Elementary School | 500 | 17.4% |
| Middle School | 614 | 21.4% |
| High School | 592 | 20.6% |
| College / Undergraduate | 649 | 22.6% |
| Graduate / Professional | 99 | 3.5% |
| Total | 2,870 | 100.0% |
School Enrollment by Age by Funding Source in Callaway
Out of a total of 2,870 students who are enrolled in schools in Callaway, 568 (19.8%) attend a private institution, while the remaining 2,302 (80.2%) are enrolled in public schools. The age group of 3 to 4 year olds has the highest likelihood of being enrolled in private schools, with 102 (69.9% in the age bracket) enrolled. Conversely, the age group of 25 to 34 year olds has the lowest likelihood of being enrolled in a private school, with 170 (100.0% in the age bracket) attending a public institution.
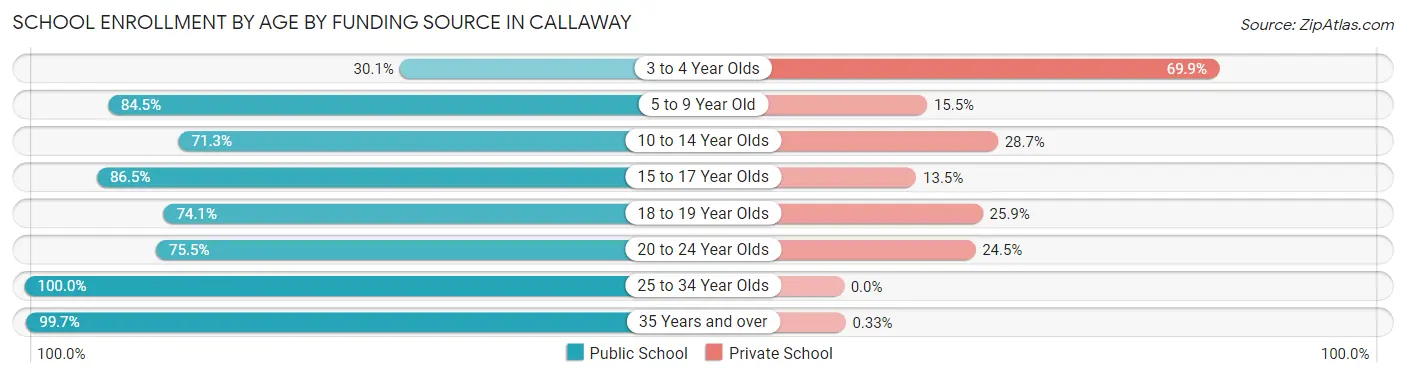
| Age Bracket | Public School | Private School |
| 3 to 4 Year Olds | 44 (30.1%) | 102 (69.9%) |
| 5 to 9 Year Old | 583 (84.5%) | 107 (15.5%) |
| 10 to 14 Year Olds | 537 (71.3%) | 216 (28.7%) |
| 15 to 17 Year Olds | 449 (86.5%) | 70 (13.5%) |
| 18 to 19 Year Olds | 63 (74.1%) | 22 (25.9%) |
| 20 to 24 Year Olds | 151 (75.5%) | 49 (24.5%) |
| 25 to 34 Year Olds | 170 (100.0%) | 0 (0.0%) |
| 35 Years and over | 306 (99.7%) | 1 (0.3%) |
| Total | 2,302 (80.2%) | 568 (19.8%) |
Educational Attainment by Field of Study in Callaway
Business (461 | 24.1%), science & technology (396 | 20.7%), education (272 | 14.2%), arts & humanities (196 | 10.2%), and engineering (129 | 6.7%) are the most common fields of study among 1,915 individuals in Callaway who have obtained a bachelor's degree or higher.
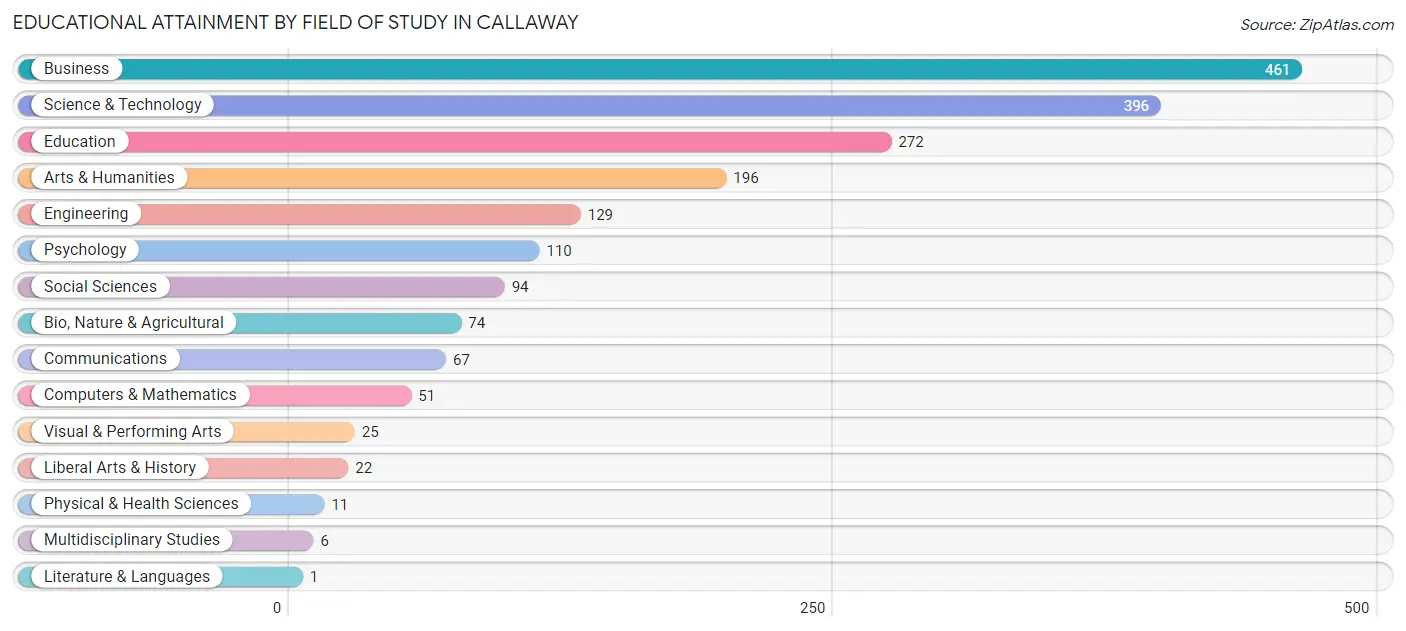
| Field of Study | # Graduates | % Graduates |
| Computers & Mathematics | 51 | 2.7% |
| Bio, Nature & Agricultural | 74 | 3.9% |
| Physical & Health Sciences | 11 | 0.6% |
| Psychology | 110 | 5.7% |
| Social Sciences | 94 | 4.9% |
| Engineering | 129 | 6.7% |
| Multidisciplinary Studies | 6 | 0.3% |
| Science & Technology | 396 | 20.7% |
| Business | 461 | 24.1% |
| Education | 272 | 14.2% |
| Literature & Languages | 1 | 0.1% |
| Liberal Arts & History | 22 | 1.1% |
| Visual & Performing Arts | 25 | 1.3% |
| Communications | 67 | 3.5% |
| Arts & Humanities | 196 | 10.2% |
| Total | 1,915 | 100.0% |
Transportation & Commute in Callaway
Vehicle Availability by Sex in Callaway
The most prevalent vehicle ownership categories in Callaway are males with 2 vehicles (1,516, accounting for 39.7%) and females with 2 vehicles (1,084, making up 51.0%).
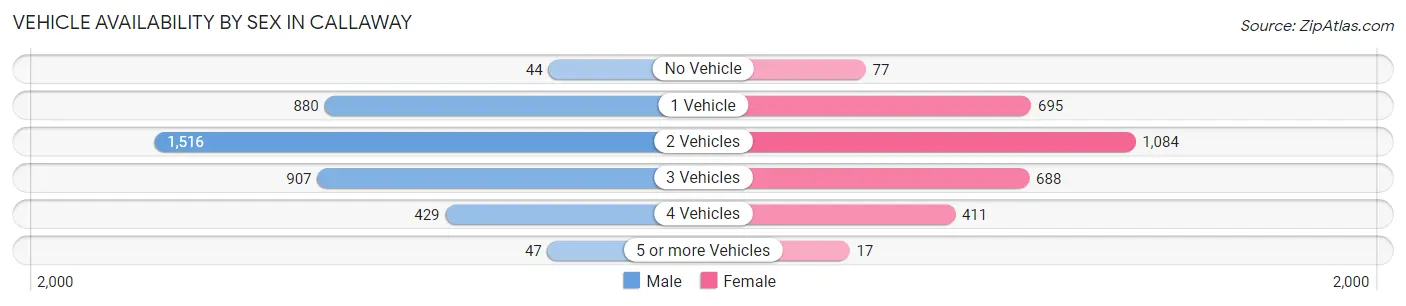
| Vehicles Available | Male | Female |
| No Vehicle | 44 (1.1%) | 77 (2.6%) |
| 1 Vehicle | 880 (23.0%) | 695 (23.4%) |
| 2 Vehicles | 1,516 (39.7%) | 1,084 (36.5%) |
| 3 Vehicles | 907 (23.7%) | 688 (23.2%) |
| 4 Vehicles | 429 (11.2%) | 411 (13.8%) |
| 5 or more Vehicles | 47 (1.2%) | 17 (0.6%) |
| Total | 3,823 (100.0%) | 2,972 (100.0%) |
Commute Time in Callaway
The most frequently occuring commute durations in Callaway are 15 to 19 minutes (1,259 commuters, 19.9%), 30 to 34 minutes (1,190 commuters, 18.8%), and 20 to 24 minutes (1,087 commuters, 17.2%).
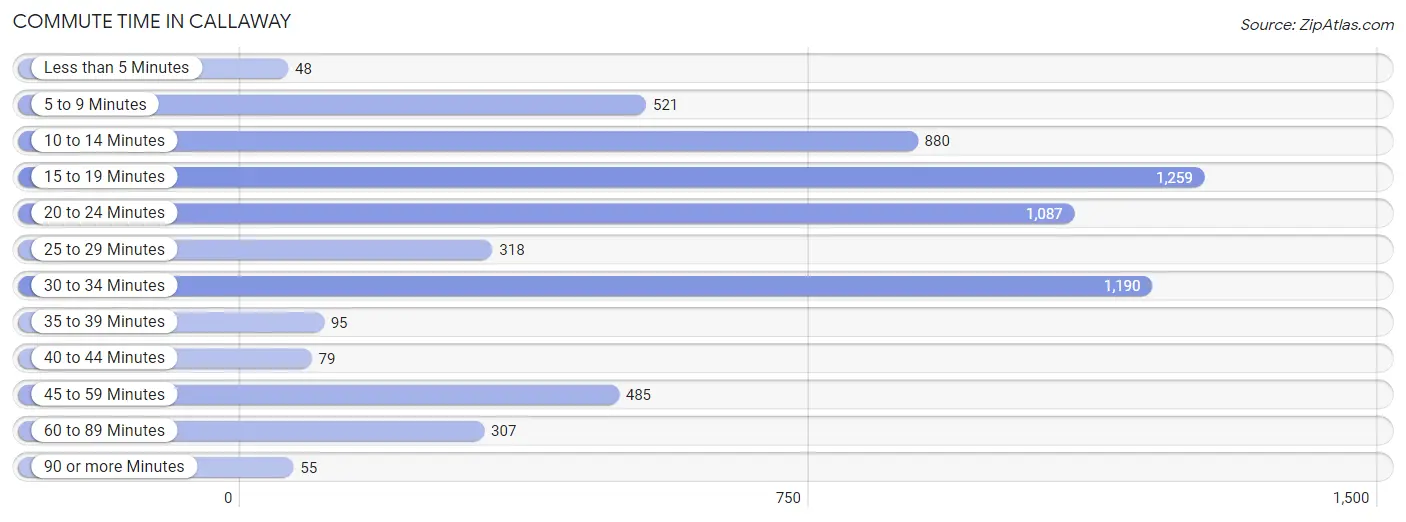
| Commute Time | # Commuters | % Commuters |
| Less than 5 Minutes | 48 | 0.8% |
| 5 to 9 Minutes | 521 | 8.2% |
| 10 to 14 Minutes | 880 | 13.9% |
| 15 to 19 Minutes | 1,259 | 19.9% |
| 20 to 24 Minutes | 1,087 | 17.2% |
| 25 to 29 Minutes | 318 | 5.0% |
| 30 to 34 Minutes | 1,190 | 18.8% |
| 35 to 39 Minutes | 95 | 1.5% |
| 40 to 44 Minutes | 79 | 1.3% |
| 45 to 59 Minutes | 485 | 7.7% |
| 60 to 89 Minutes | 307 | 4.9% |
| 90 or more Minutes | 55 | 0.9% |
Commute Time by Sex in Callaway
The most common commute times in Callaway are 15 to 19 minutes (734 commuters, 20.4%) for males and 20 to 24 minutes (591 commuters, 21.7%) for females.
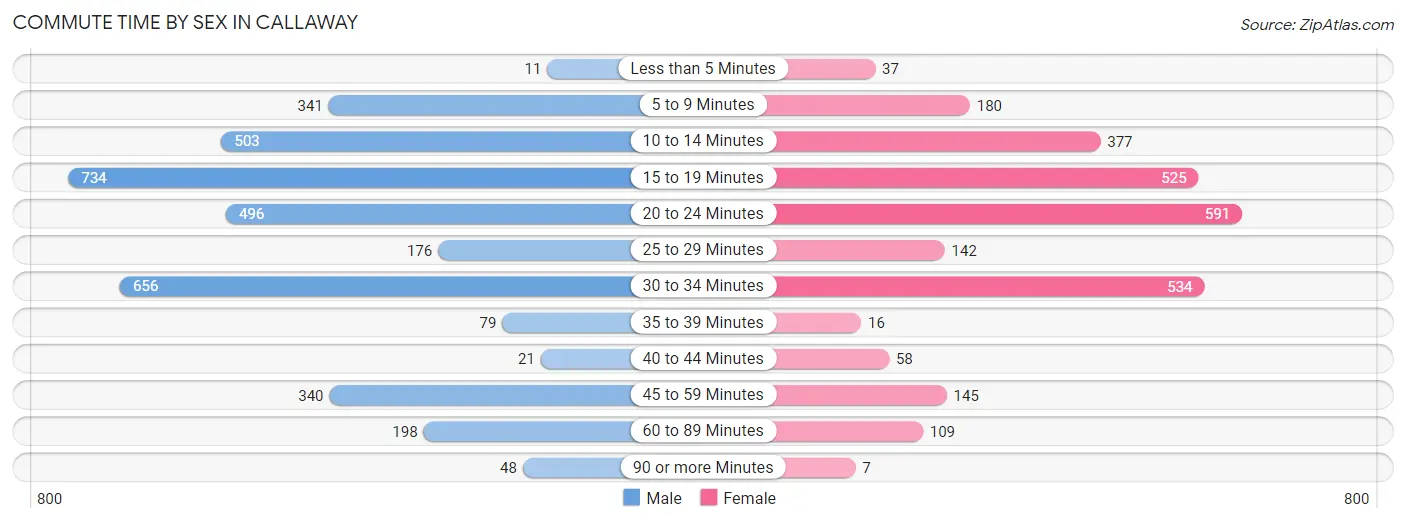
| Commute Time | Male | Female |
| Less than 5 Minutes | 11 (0.3%) | 37 (1.4%) |
| 5 to 9 Minutes | 341 (9.5%) | 180 (6.6%) |
| 10 to 14 Minutes | 503 (14.0%) | 377 (13.9%) |
| 15 to 19 Minutes | 734 (20.4%) | 525 (19.3%) |
| 20 to 24 Minutes | 496 (13.8%) | 591 (21.7%) |
| 25 to 29 Minutes | 176 (4.9%) | 142 (5.2%) |
| 30 to 34 Minutes | 656 (18.2%) | 534 (19.6%) |
| 35 to 39 Minutes | 79 (2.2%) | 16 (0.6%) |
| 40 to 44 Minutes | 21 (0.6%) | 58 (2.1%) |
| 45 to 59 Minutes | 340 (9.4%) | 145 (5.3%) |
| 60 to 89 Minutes | 198 (5.5%) | 109 (4.0%) |
| 90 or more Minutes | 48 (1.3%) | 7 (0.3%) |
Time of Departure to Work by Sex in Callaway
The most frequent times of departure to work in Callaway are 6:00 AM to 6:29 AM (606, 16.8%) for males and 7:00 AM to 7:29 AM (540, 19.9%) for females.
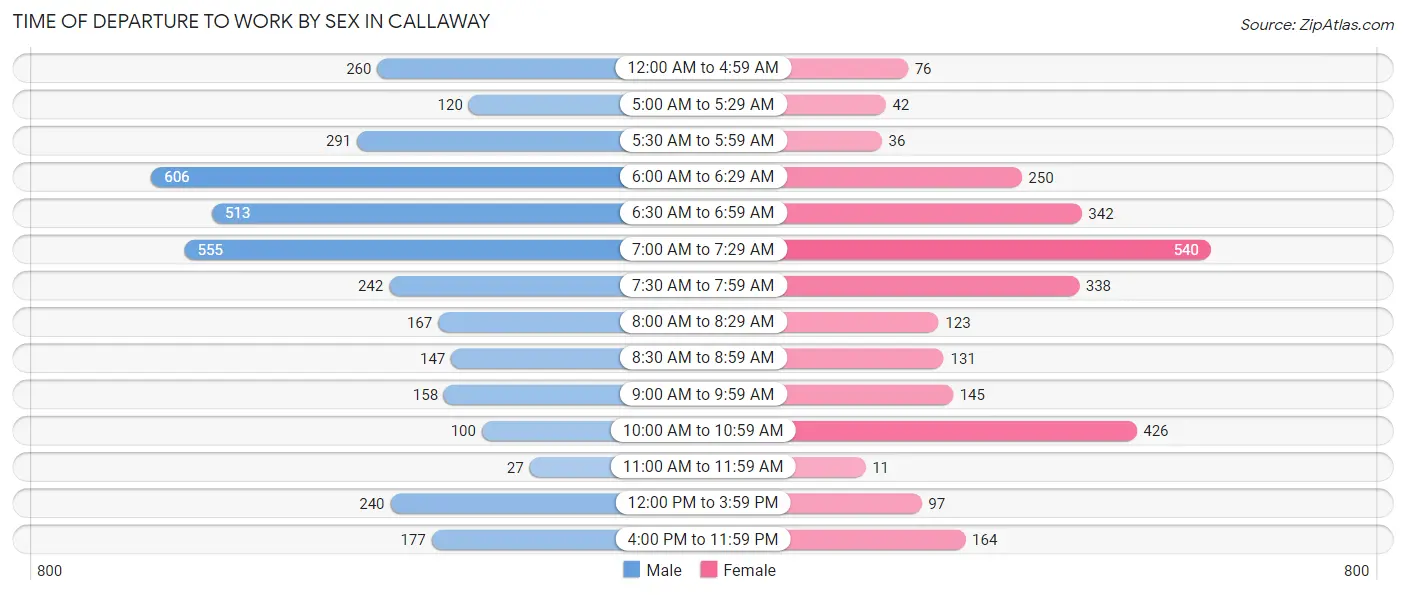
| Time of Departure | Male | Female |
| 12:00 AM to 4:59 AM | 260 (7.2%) | 76 (2.8%) |
| 5:00 AM to 5:29 AM | 120 (3.3%) | 42 (1.5%) |
| 5:30 AM to 5:59 AM | 291 (8.1%) | 36 (1.3%) |
| 6:00 AM to 6:29 AM | 606 (16.8%) | 250 (9.2%) |
| 6:30 AM to 6:59 AM | 513 (14.2%) | 342 (12.6%) |
| 7:00 AM to 7:29 AM | 555 (15.4%) | 540 (19.9%) |
| 7:30 AM to 7:59 AM | 242 (6.7%) | 338 (12.4%) |
| 8:00 AM to 8:29 AM | 167 (4.6%) | 123 (4.5%) |
| 8:30 AM to 8:59 AM | 147 (4.1%) | 131 (4.8%) |
| 9:00 AM to 9:59 AM | 158 (4.4%) | 145 (5.3%) |
| 10:00 AM to 10:59 AM | 100 (2.8%) | 426 (15.7%) |
| 11:00 AM to 11:59 AM | 27 (0.7%) | 11 (0.4%) |
| 12:00 PM to 3:59 PM | 240 (6.7%) | 97 (3.6%) |
| 4:00 PM to 11:59 PM | 177 (4.9%) | 164 (6.0%) |
| Total | 3,603 (100.0%) | 2,721 (100.0%) |
Housing Occupancy in Callaway
Occupancy by Ownership in Callaway
Of the total 5,482 dwellings in Callaway, owner-occupied units account for 3,352 (61.2%), while renter-occupied units make up 2,130 (38.9%).
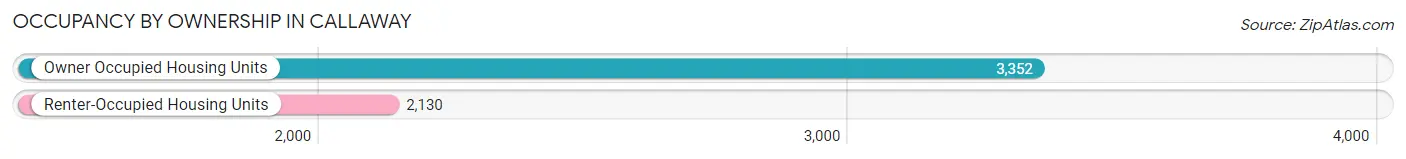
| Occupancy | # Housing Units | % Housing Units |
| Owner Occupied Housing Units | 3,352 | 61.2% |
| Renter-Occupied Housing Units | 2,130 | 38.9% |
| Total Occupied Housing Units | 5,482 | 100.0% |
Occupancy by Household Size in Callaway
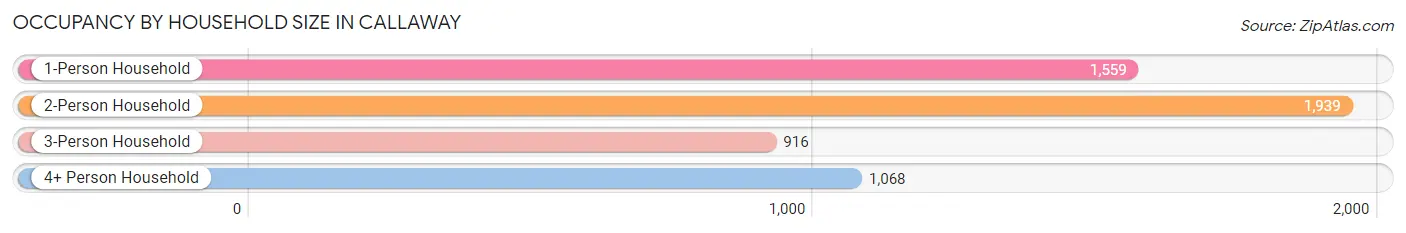
| Household Size | # Housing Units | % Housing Units |
| 1-Person Household | 1,559 | 28.4% |
| 2-Person Household | 1,939 | 35.4% |
| 3-Person Household | 916 | 16.7% |
| 4+ Person Household | 1,068 | 19.5% |
| Total Housing Units | 5,482 | 100.0% |
Occupancy by Ownership by Household Size in Callaway
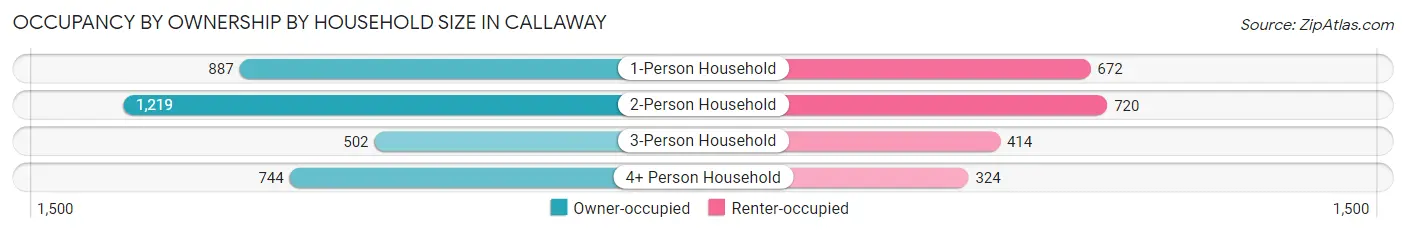
| Household Size | Owner-occupied | Renter-occupied |
| 1-Person Household | 887 (56.9%) | 672 (43.1%) |
| 2-Person Household | 1,219 (62.9%) | 720 (37.1%) |
| 3-Person Household | 502 (54.8%) | 414 (45.2%) |
| 4+ Person Household | 744 (69.7%) | 324 (30.3%) |
| Total Housing Units | 3,352 (61.2%) | 2,130 (38.9%) |
Occupancy by Educational Attainment in Callaway
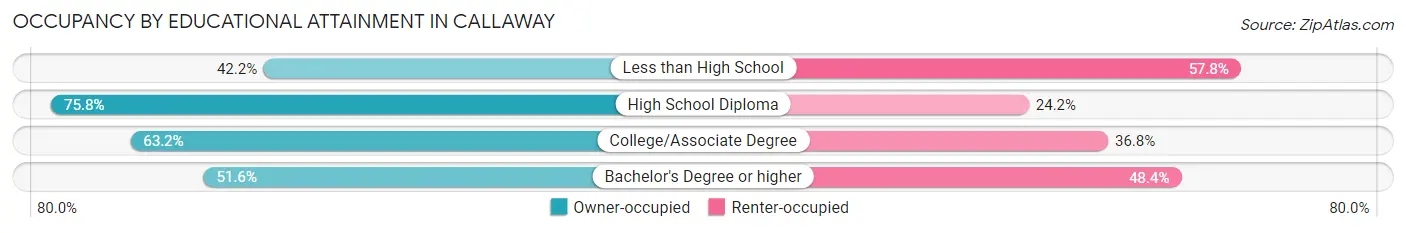
| Household Size | Owner-occupied | Renter-occupied |
| Less than High School | 254 (42.2%) | 348 (57.8%) |
| High School Diploma | 920 (75.8%) | 294 (24.2%) |
| College/Associate Degree | 1,557 (63.2%) | 906 (36.8%) |
| Bachelor's Degree or higher | 621 (51.6%) | 582 (48.4%) |
Occupancy by Age of Householder in Callaway
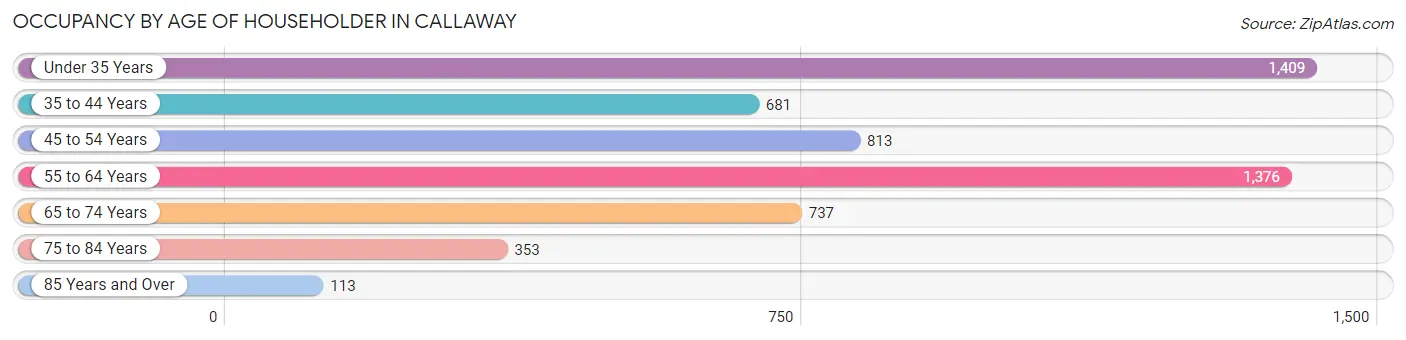
| Age Bracket | # Households | % Households |
| Under 35 Years | 1,409 | 25.7% |
| 35 to 44 Years | 681 | 12.4% |
| 45 to 54 Years | 813 | 14.8% |
| 55 to 64 Years | 1,376 | 25.1% |
| 65 to 74 Years | 737 | 13.4% |
| 75 to 84 Years | 353 | 6.4% |
| 85 Years and Over | 113 | 2.1% |
| Total | 5,482 | 100.0% |
Housing Finances in Callaway
Median Income by Occupancy in Callaway
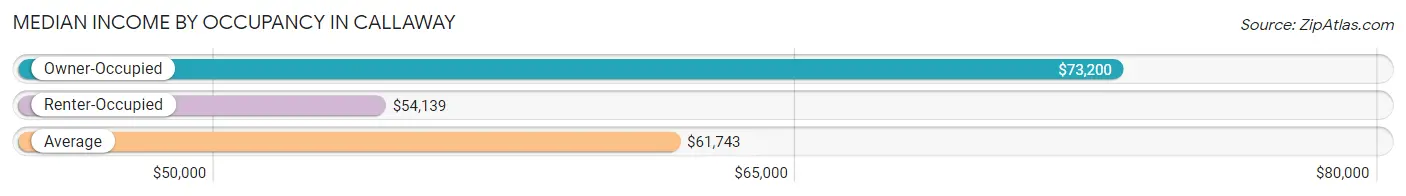
| Occupancy Type | # Households | Median Income |
| Owner-Occupied | 3,352 (61.2%) | $73,200 |
| Renter-Occupied | 2,130 (38.9%) | $54,139 |
| Average | 5,482 (100.0%) | $61,743 |
Occupancy by Householder Income Bracket in Callaway
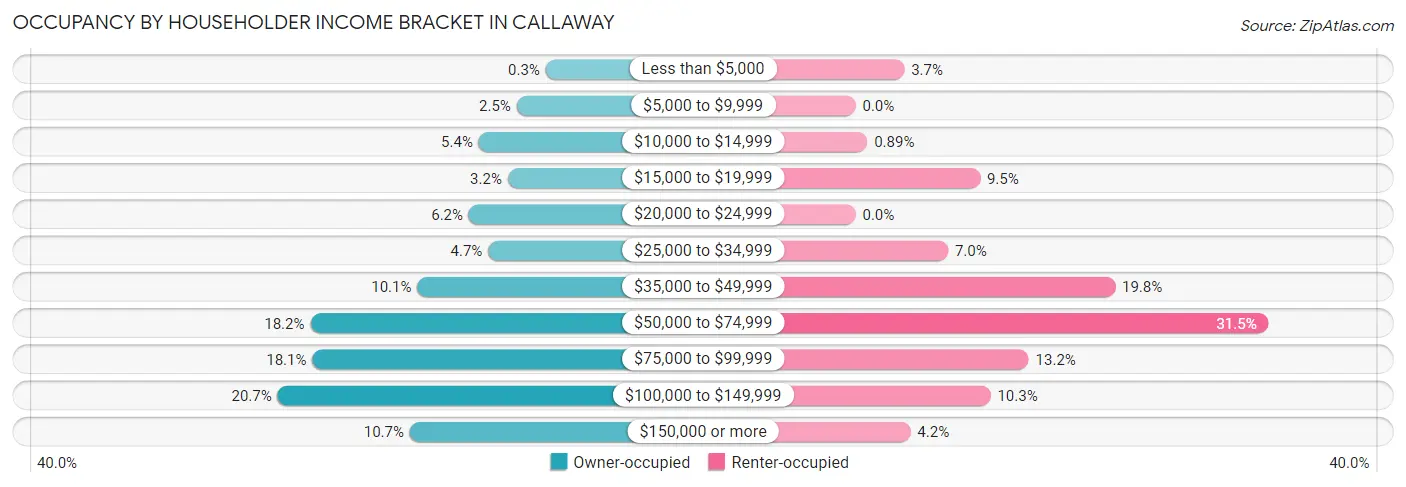
| Income Bracket | Owner-occupied | Renter-occupied |
| Less than $5,000 | 10 (0.3%) | 79 (3.7%) |
| $5,000 to $9,999 | 84 (2.5%) | 0 (0.0%) |
| $10,000 to $14,999 | 181 (5.4%) | 19 (0.9%) |
| $15,000 to $19,999 | 107 (3.2%) | 202 (9.5%) |
| $20,000 to $24,999 | 206 (6.1%) | 0 (0.0%) |
| $25,000 to $34,999 | 157 (4.7%) | 150 (7.0%) |
| $35,000 to $49,999 | 338 (10.1%) | 421 (19.8%) |
| $50,000 to $74,999 | 611 (18.2%) | 670 (31.5%) |
| $75,000 to $99,999 | 606 (18.1%) | 281 (13.2%) |
| $100,000 to $149,999 | 695 (20.7%) | 219 (10.3%) |
| $150,000 or more | 357 (10.6%) | 89 (4.2%) |
| Total | 3,352 (100.0%) | 2,130 (100.0%) |
Monthly Housing Cost Tiers in Callaway
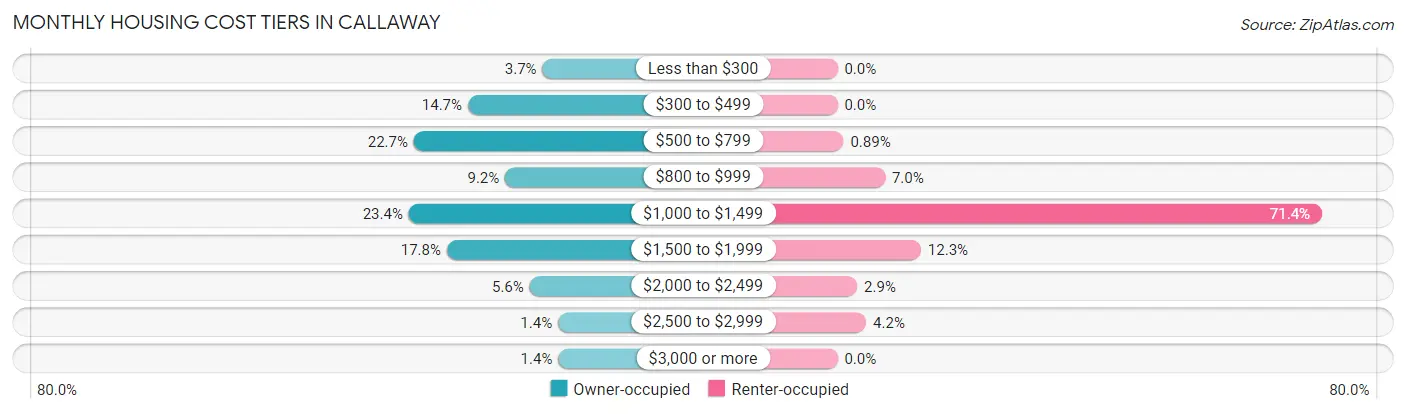
| Monthly Cost | Owner-occupied | Renter-occupied |
| Less than $300 | 125 (3.7%) | 0 (0.0%) |
| $300 to $499 | 493 (14.7%) | 0 (0.0%) |
| $500 to $799 | 760 (22.7%) | 19 (0.9%) |
| $800 to $999 | 309 (9.2%) | 149 (7.0%) |
| $1,000 to $1,499 | 785 (23.4%) | 1,520 (71.4%) |
| $1,500 to $1,999 | 597 (17.8%) | 262 (12.3%) |
| $2,000 to $2,499 | 188 (5.6%) | 62 (2.9%) |
| $2,500 to $2,999 | 48 (1.4%) | 90 (4.2%) |
| $3,000 or more | 47 (1.4%) | 0 (0.0%) |
| Total | 3,352 (100.0%) | 2,130 (100.0%) |
Physical Housing Characteristics in Callaway
Housing Structures in Callaway
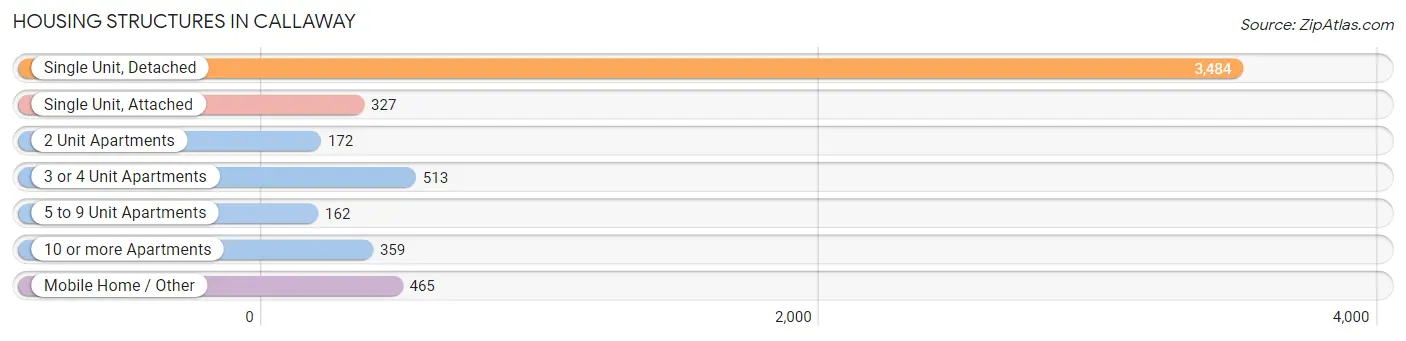
| Structure Type | # Housing Units | % Housing Units |
| Single Unit, Detached | 3,484 | 63.5% |
| Single Unit, Attached | 327 | 6.0% |
| 2 Unit Apartments | 172 | 3.1% |
| 3 or 4 Unit Apartments | 513 | 9.4% |
| 5 to 9 Unit Apartments | 162 | 3.0% |
| 10 or more Apartments | 359 | 6.6% |
| Mobile Home / Other | 465 | 8.5% |
| Total | 5,482 | 100.0% |
Housing Structures by Occupancy in Callaway
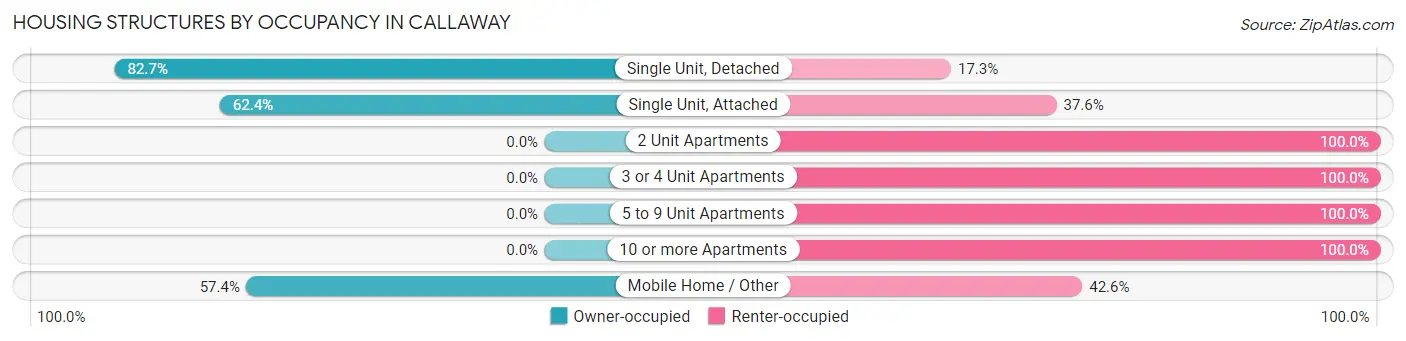
| Structure Type | Owner-occupied | Renter-occupied |
| Single Unit, Detached | 2,881 (82.7%) | 603 (17.3%) |
| Single Unit, Attached | 204 (62.4%) | 123 (37.6%) |
| 2 Unit Apartments | 0 (0.0%) | 172 (100.0%) |
| 3 or 4 Unit Apartments | 0 (0.0%) | 513 (100.0%) |
| 5 to 9 Unit Apartments | 0 (0.0%) | 162 (100.0%) |
| 10 or more Apartments | 0 (0.0%) | 359 (100.0%) |
| Mobile Home / Other | 267 (57.4%) | 198 (42.6%) |
| Total | 3,352 (61.2%) | 2,130 (38.9%) |
Housing Structures by Number of Rooms in Callaway
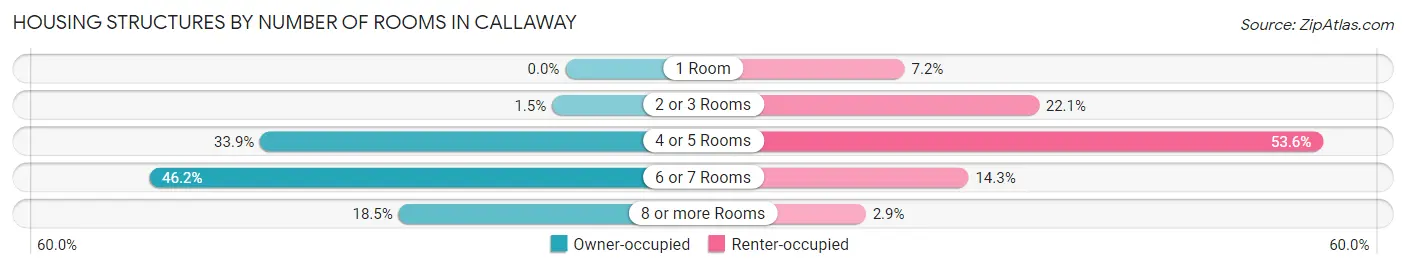
| Number of Rooms | Owner-occupied | Renter-occupied |
| 1 Room | 0 (0.0%) | 153 (7.2%) |
| 2 or 3 Rooms | 49 (1.5%) | 470 (22.1%) |
| 4 or 5 Rooms | 1,135 (33.9%) | 1,142 (53.6%) |
| 6 or 7 Rooms | 1,548 (46.2%) | 304 (14.3%) |
| 8 or more Rooms | 620 (18.5%) | 61 (2.9%) |
| Total | 3,352 (100.0%) | 2,130 (100.0%) |
Housing Structure by Heating Type in Callaway
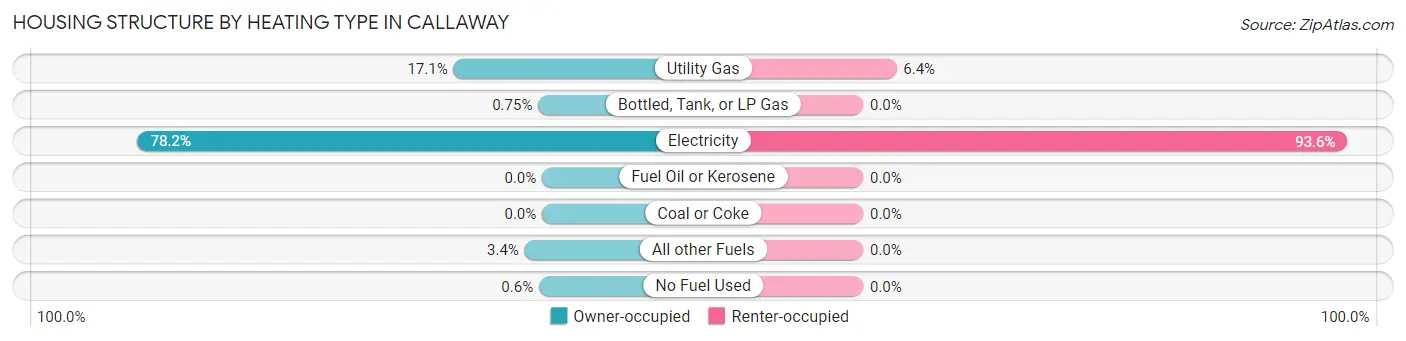
| Heating Type | Owner-occupied | Renter-occupied |
| Utility Gas | 574 (17.1%) | 137 (6.4%) |
| Bottled, Tank, or LP Gas | 25 (0.7%) | 0 (0.0%) |
| Electricity | 2,620 (78.2%) | 1,993 (93.6%) |
| Fuel Oil or Kerosene | 0 (0.0%) | 0 (0.0%) |
| Coal or Coke | 0 (0.0%) | 0 (0.0%) |
| All other Fuels | 113 (3.4%) | 0 (0.0%) |
| No Fuel Used | 20 (0.6%) | 0 (0.0%) |
| Total | 3,352 (100.0%) | 2,130 (100.0%) |
Household Vehicle Usage in Callaway
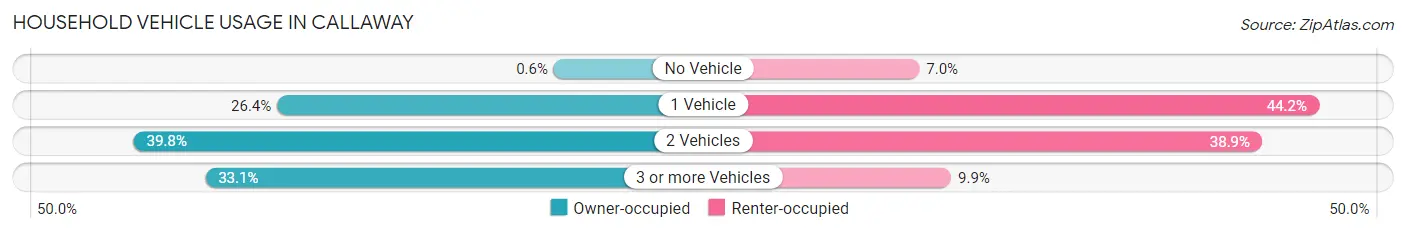
| Vehicles per Household | Owner-occupied | Renter-occupied |
| No Vehicle | 20 (0.6%) | 148 (7.0%) |
| 1 Vehicle | 886 (26.4%) | 942 (44.2%) |
| 2 Vehicles | 1,335 (39.8%) | 829 (38.9%) |
| 3 or more Vehicles | 1,111 (33.1%) | 211 (9.9%) |
| Total | 3,352 (100.0%) | 2,130 (100.0%) |
Real Estate & Mortgages in Callaway
Real Estate and Mortgage Overview in Callaway
| Characteristic | Without Mortgage | With Mortgage |
| Housing Units | 1,468 | 1,884 |
| Median Property Value | $170,200 | $205,500 |
| Median Household Income | $56,719 | $286 |
| Monthly Housing Costs | $521 | $47 |
| Real Estate Taxes | $887 | $126 |
Property Value by Mortgage Status in Callaway
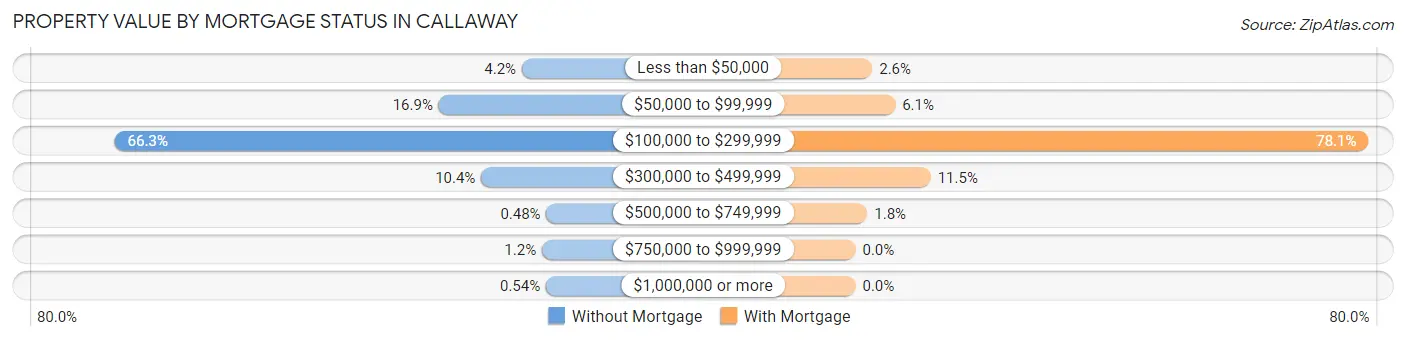
| Property Value | Without Mortgage | With Mortgage |
| Less than $50,000 | 62 (4.2%) | 48 (2.5%) |
| $50,000 to $99,999 | 248 (16.9%) | 114 (6.0%) |
| $100,000 to $299,999 | 973 (66.3%) | 1,472 (78.1%) |
| $300,000 to $499,999 | 153 (10.4%) | 216 (11.5%) |
| $500,000 to $749,999 | 7 (0.5%) | 34 (1.8%) |
| $750,000 to $999,999 | 17 (1.2%) | 0 (0.0%) |
| $1,000,000 or more | 8 (0.5%) | 0 (0.0%) |
| Total | 1,468 (100.0%) | 1,884 (100.0%) |
Household Income by Mortgage Status in Callaway
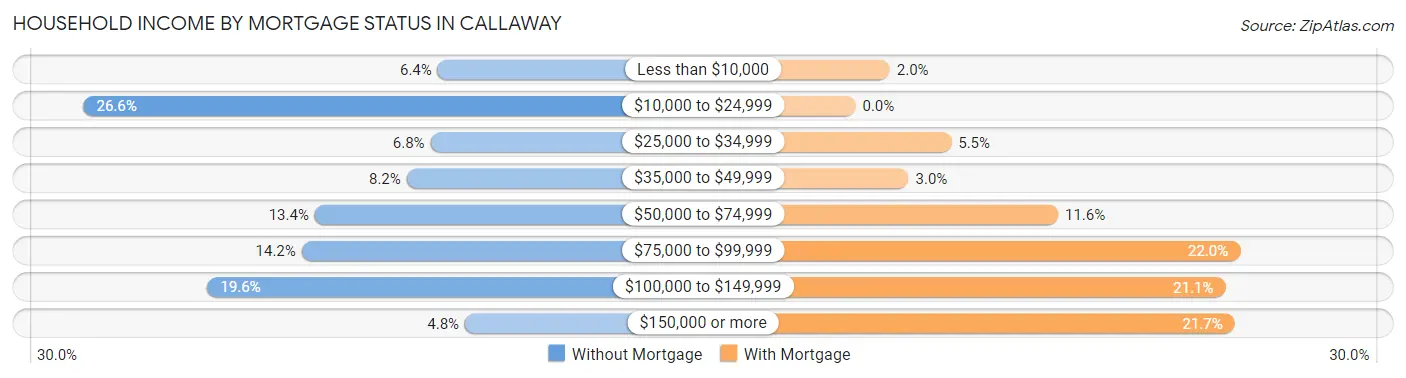
| Household Income | Without Mortgage | With Mortgage |
| Less than $10,000 | 94 (6.4%) | 37 (2.0%) |
| $10,000 to $24,999 | 391 (26.6%) | 0 (0.0%) |
| $25,000 to $34,999 | 100 (6.8%) | 103 (5.5%) |
| $35,000 to $49,999 | 120 (8.2%) | 57 (3.0%) |
| $50,000 to $74,999 | 197 (13.4%) | 218 (11.6%) |
| $75,000 to $99,999 | 208 (14.2%) | 414 (22.0%) |
| $100,000 to $149,999 | 287 (19.6%) | 398 (21.1%) |
| $150,000 or more | 71 (4.8%) | 408 (21.7%) |
| Total | 1,468 (100.0%) | 1,884 (100.0%) |
Property Value to Household Income Ratio in Callaway
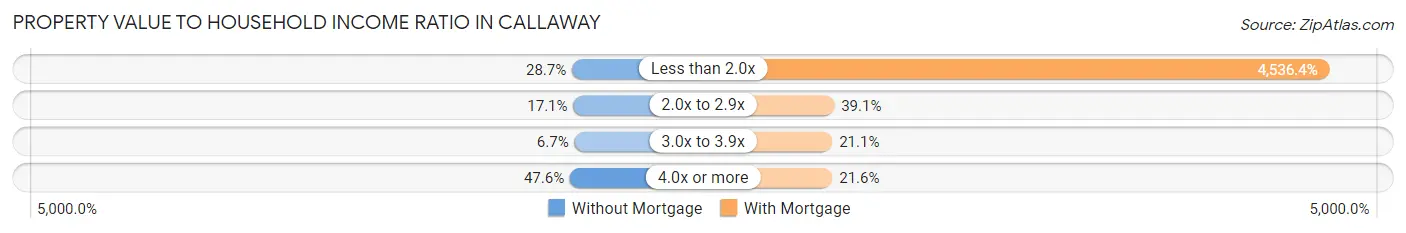
| Value-to-Income Ratio | Without Mortgage | With Mortgage |
| Less than 2.0x | 421 (28.7%) | 85,466 (4,536.4%) |
| 2.0x to 2.9x | 251 (17.1%) | 736 (39.1%) |
| 3.0x to 3.9x | 98 (6.7%) | 398 (21.1%) |
| 4.0x or more | 698 (47.5%) | 407 (21.6%) |
| Total | 1,468 (100.0%) | 1,884 (100.0%) |
Real Estate Taxes by Mortgage Status in Callaway
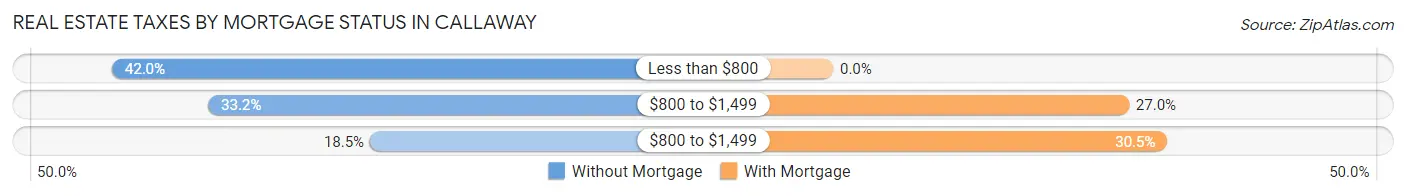
| Property Taxes | Without Mortgage | With Mortgage |
| Less than $800 | 617 (42.0%) | 0 (0.0%) |
| $800 to $1,499 | 488 (33.2%) | 509 (27.0%) |
| $800 to $1,499 | 271 (18.5%) | 575 (30.5%) |
| Total | 1,468 (100.0%) | 1,884 (100.0%) |
Health & Disability in Callaway
Health Insurance Coverage by Age in Callaway
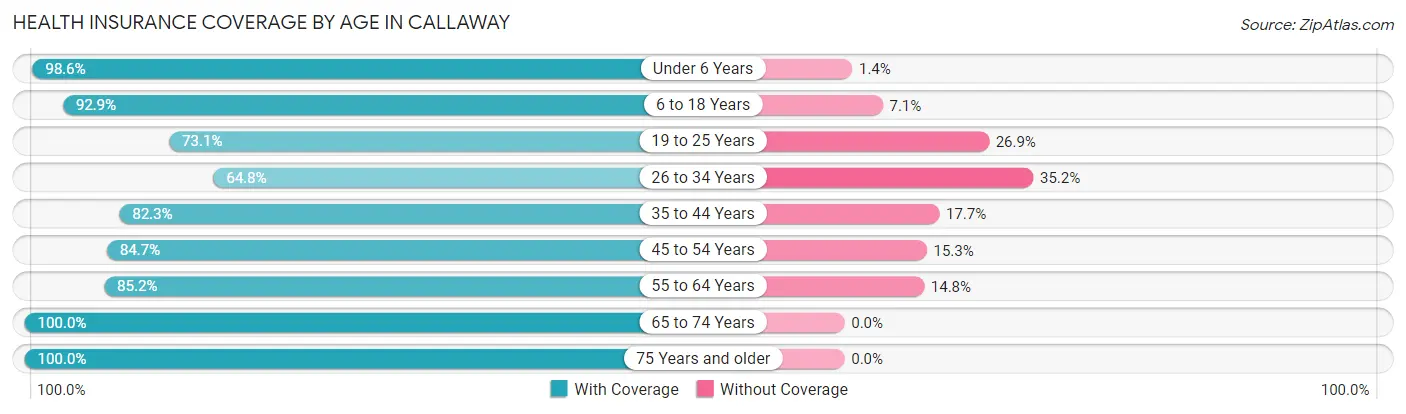
| Age Bracket | With Coverage | Without Coverage |
| Under 6 Years | 955 (98.6%) | 14 (1.4%) |
| 6 to 18 Years | 1,863 (92.9%) | 143 (7.1%) |
| 19 to 25 Years | 822 (73.1%) | 303 (26.9%) |
| 26 to 34 Years | 1,136 (64.8%) | 617 (35.2%) |
| 35 to 44 Years | 1,319 (82.3%) | 283 (17.7%) |
| 45 to 54 Years | 1,221 (84.7%) | 221 (15.3%) |
| 55 to 64 Years | 1,836 (85.2%) | 320 (14.8%) |
| 65 to 74 Years | 1,226 (100.0%) | 0 (0.0%) |
| 75 Years and older | 673 (100.0%) | 0 (0.0%) |
| Total | 11,051 (85.3%) | 1,901 (14.7%) |
Health Insurance Coverage by Citizenship Status in Callaway
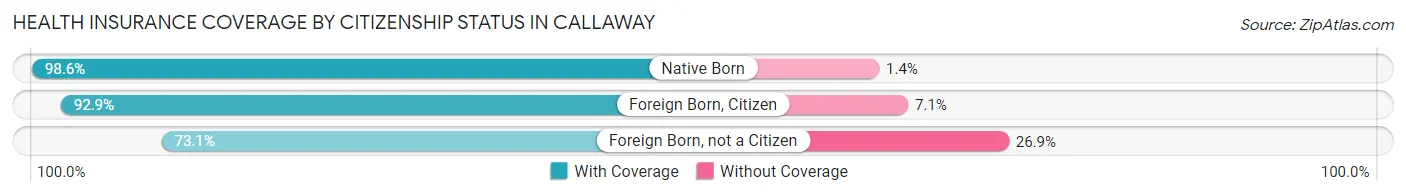
| Citizenship Status | With Coverage | Without Coverage |
| Native Born | 955 (98.6%) | 14 (1.4%) |
| Foreign Born, Citizen | 1,863 (92.9%) | 143 (7.1%) |
| Foreign Born, not a Citizen | 822 (73.1%) | 303 (26.9%) |
Health Insurance Coverage by Household Income in Callaway
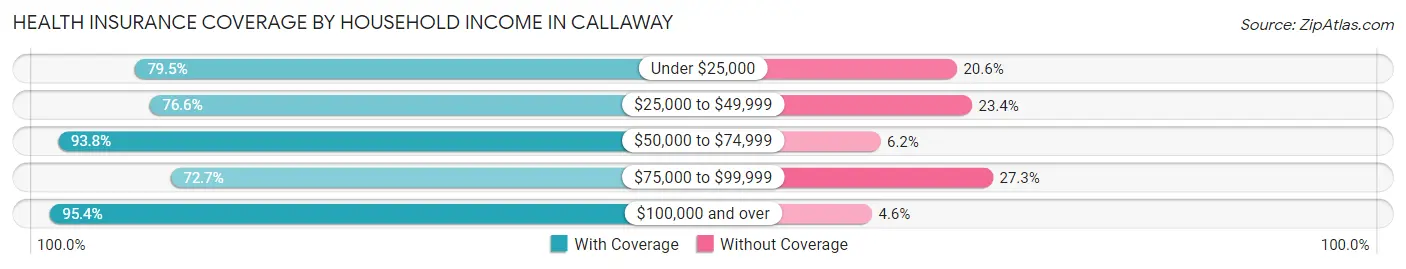
| Household Income | With Coverage | Without Coverage |
| Under $25,000 | 1,017 (79.4%) | 263 (20.5%) |
| $25,000 to $49,999 | 1,823 (76.6%) | 556 (23.4%) |
| $50,000 to $74,999 | 2,529 (93.8%) | 168 (6.2%) |
| $75,000 to $99,999 | 1,952 (72.7%) | 733 (27.3%) |
| $100,000 and over | 3,725 (95.4%) | 181 (4.6%) |
Public vs Private Health Insurance Coverage by Age in Callaway
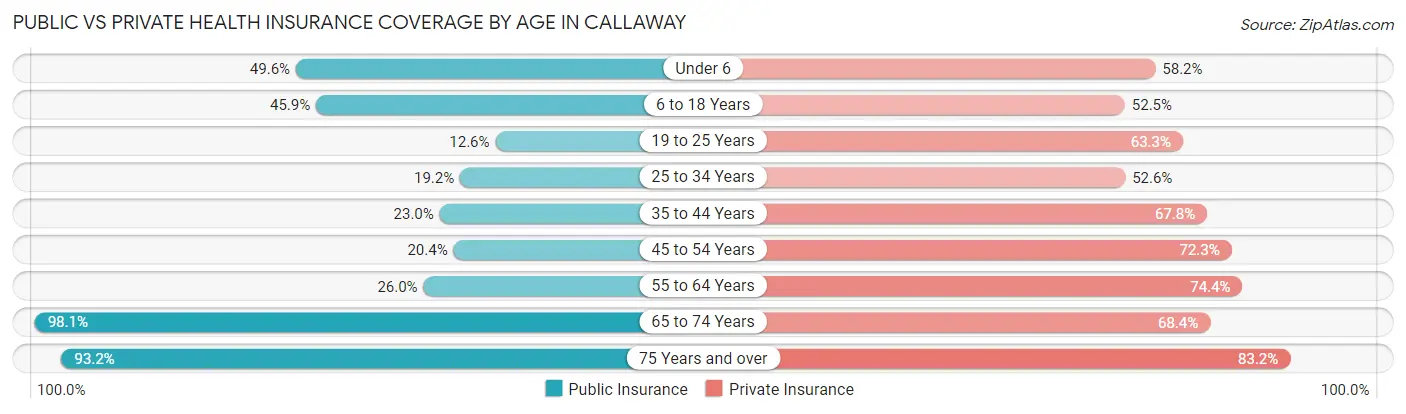
| Age Bracket | Public Insurance | Private Insurance |
| Under 6 | 481 (49.6%) | 564 (58.2%) |
| 6 to 18 Years | 921 (45.9%) | 1,054 (52.5%) |
| 19 to 25 Years | 142 (12.6%) | 712 (63.3%) |
| 25 to 34 Years | 336 (19.2%) | 922 (52.6%) |
| 35 to 44 Years | 368 (23.0%) | 1,086 (67.8%) |
| 45 to 54 Years | 294 (20.4%) | 1,043 (72.3%) |
| 55 to 64 Years | 560 (26.0%) | 1,603 (74.4%) |
| 65 to 74 Years | 1,203 (98.1%) | 838 (68.3%) |
| 75 Years and over | 627 (93.2%) | 560 (83.2%) |
| Total | 4,932 (38.1%) | 8,382 (64.7%) |
Disability Status by Sex by Age in Callaway
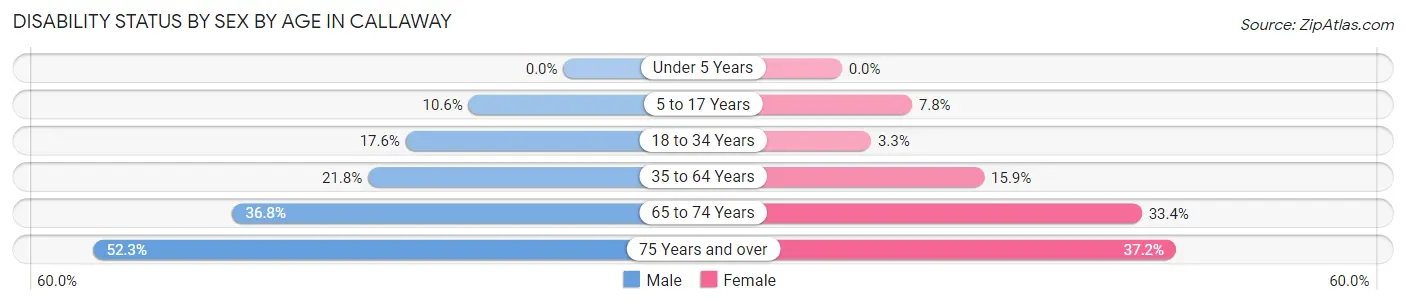
| Age Bracket | Male | Female |
| Under 5 Years | 0 (0.0%) | 0 (0.0%) |
| 5 to 17 Years | 111 (10.5%) | 80 (7.8%) |
| 18 to 34 Years | 307 (17.6%) | 40 (3.3%) |
| 35 to 64 Years | 563 (21.7%) | 414 (15.9%) |
| 65 to 74 Years | 253 (36.8%) | 180 (33.4%) |
| 75 Years and over | 158 (52.3%) | 138 (37.2%) |
Disability Class by Sex by Age in Callaway
Disability Class: Hearing Difficulty
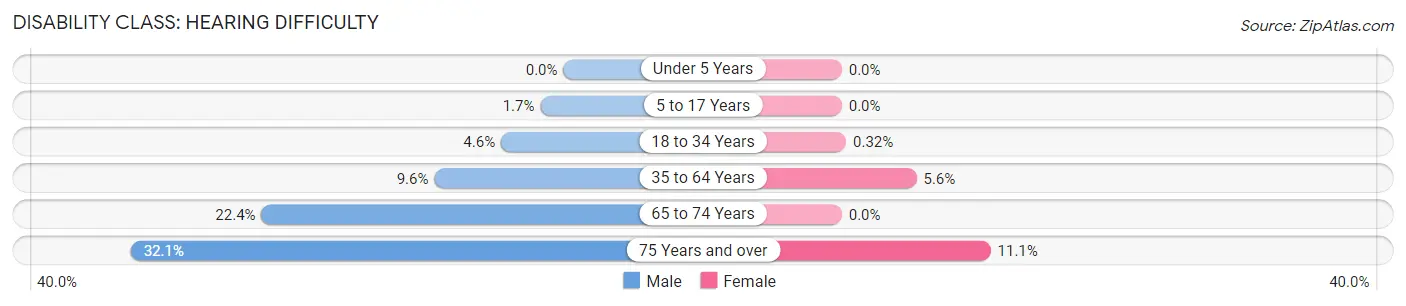
| Age Bracket | Male | Female |
| Under 5 Years | 0 (0.0%) | 0 (0.0%) |
| 5 to 17 Years | 18 (1.7%) | 0 (0.0%) |
| 18 to 34 Years | 81 (4.6%) | 4 (0.3%) |
| 35 to 64 Years | 248 (9.6%) | 145 (5.6%) |
| 65 to 74 Years | 154 (22.4%) | 0 (0.0%) |
| 75 Years and over | 97 (32.1%) | 41 (11.1%) |
Disability Class: Vision Difficulty
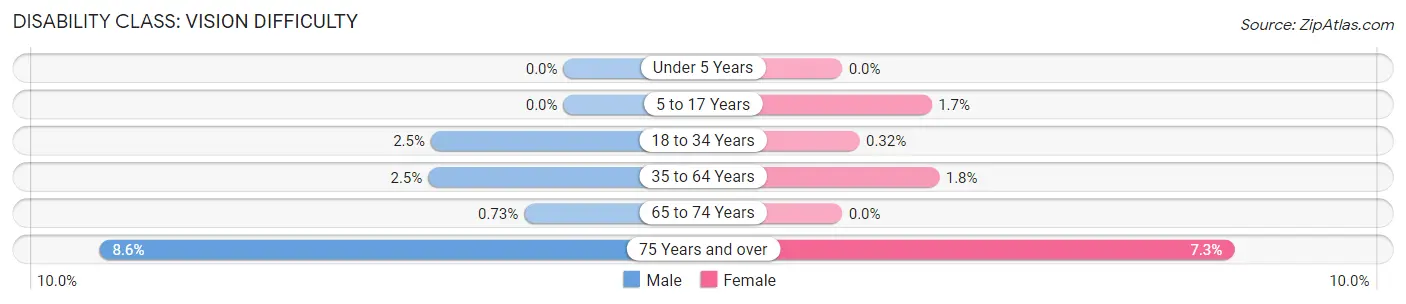
| Age Bracket | Male | Female |
| Under 5 Years | 0 (0.0%) | 0 (0.0%) |
| 5 to 17 Years | 0 (0.0%) | 17 (1.7%) |
| 18 to 34 Years | 43 (2.5%) | 4 (0.3%) |
| 35 to 64 Years | 65 (2.5%) | 47 (1.8%) |
| 65 to 74 Years | 5 (0.7%) | 0 (0.0%) |
| 75 Years and over | 26 (8.6%) | 27 (7.3%) |
Disability Class: Cognitive Difficulty
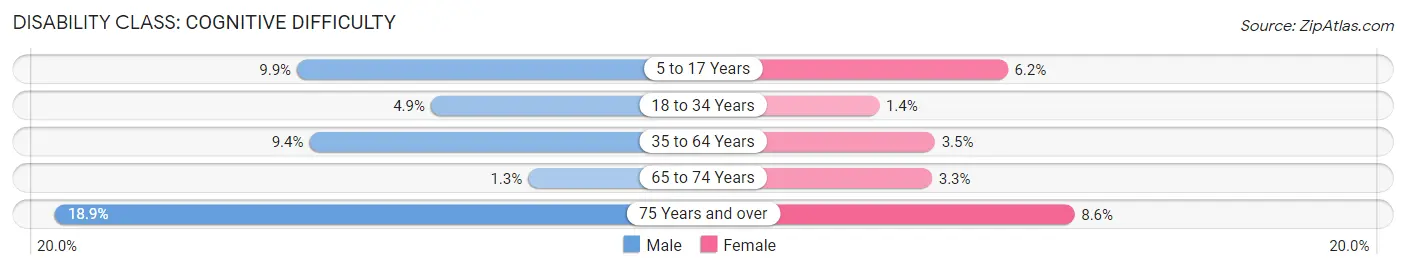
| Age Bracket | Male | Female |
| 5 to 17 Years | 104 (9.9%) | 63 (6.1%) |
| 18 to 34 Years | 86 (4.9%) | 17 (1.4%) |
| 35 to 64 Years | 244 (9.4%) | 90 (3.5%) |
| 65 to 74 Years | 9 (1.3%) | 18 (3.3%) |
| 75 Years and over | 57 (18.9%) | 32 (8.6%) |
Disability Class: Ambulatory Difficulty
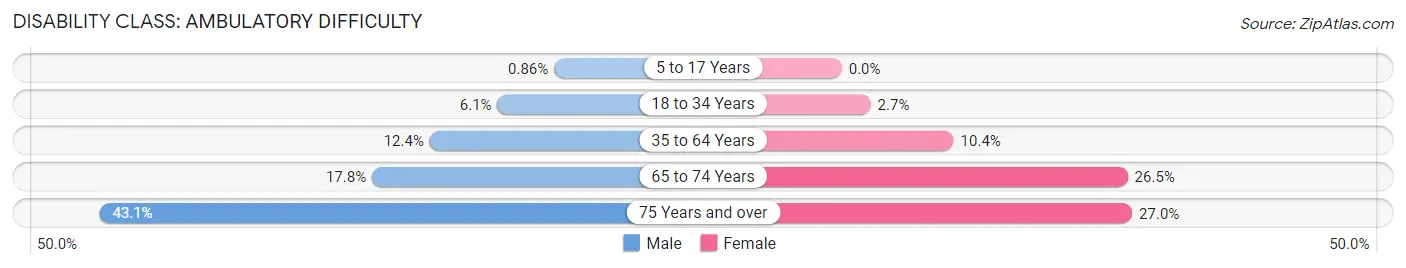
| Age Bracket | Male | Female |
| 5 to 17 Years | 9 (0.9%) | 0 (0.0%) |
| 18 to 34 Years | 107 (6.1%) | 33 (2.7%) |
| 35 to 64 Years | 321 (12.4%) | 271 (10.4%) |
| 65 to 74 Years | 122 (17.8%) | 143 (26.5%) |
| 75 Years and over | 130 (43.0%) | 100 (27.0%) |
Disability Class: Self-Care Difficulty
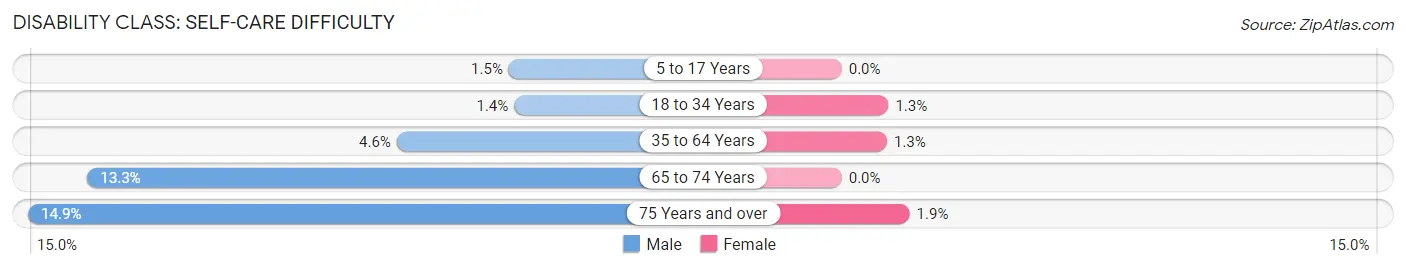
| Age Bracket | Male | Female |
| 5 to 17 Years | 16 (1.5%) | 0 (0.0%) |
| 18 to 34 Years | 24 (1.4%) | 16 (1.3%) |
| 35 to 64 Years | 120 (4.6%) | 33 (1.3%) |
| 65 to 74 Years | 91 (13.3%) | 0 (0.0%) |
| 75 Years and over | 45 (14.9%) | 7 (1.9%) |
Technology Access in Callaway
Computing Device Access in Callaway
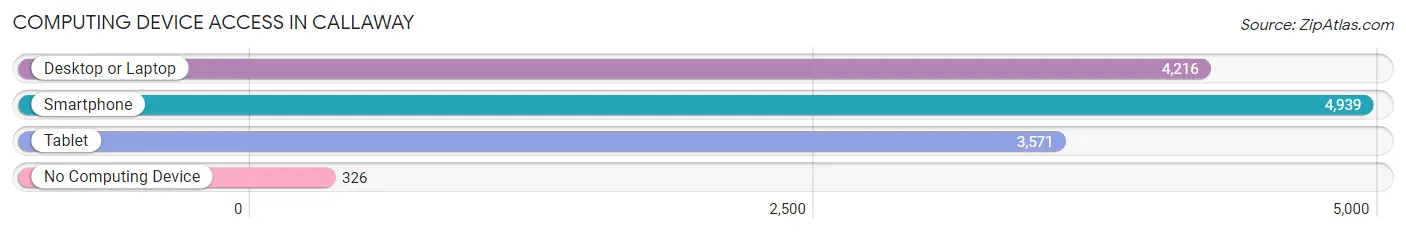
| Device Type | # Households | % Households |
| Desktop or Laptop | 4,216 | 76.9% |
| Smartphone | 4,939 | 90.1% |
| Tablet | 3,571 | 65.1% |
| No Computing Device | 326 | 5.9% |
| Total | 5,482 | 100.0% |
Internet Access in Callaway
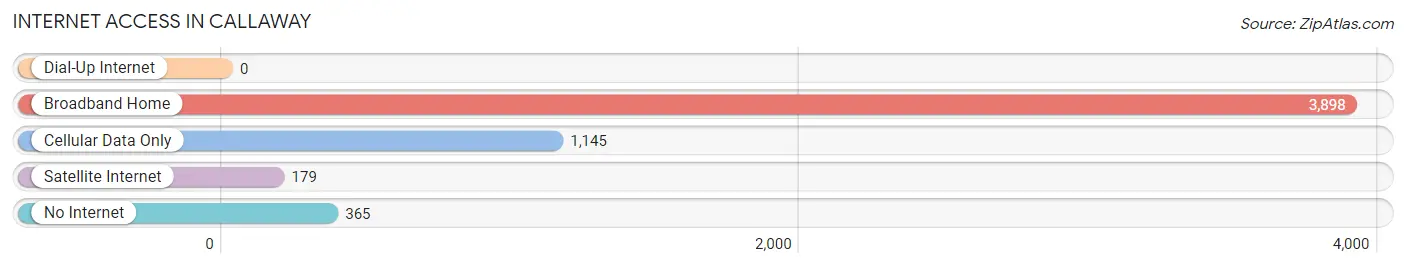
| Internet Type | # Households | % Households |
| Dial-Up Internet | 0 | 0.0% |
| Broadband Home | 3,898 | 71.1% |
| Cellular Data Only | 1,145 | 20.9% |
| Satellite Internet | 179 | 3.3% |
| No Internet | 365 | 6.7% |
| Total | 5,482 | 100.0% |
Callaway Summary
Callaway is a city located in Bay County, Florida, United States. It is part of the Panama City–Lynn Haven–Panama City Beach Metropolitan Statistical Area. The population was 13,945 at the 2010 census.
History
The area that is now Callaway was first settled in the early 1800s by the Callaway family, who were among the first settlers in the area. The family established a homestead and a small trading post, which eventually grew into a small village. The village was named after the family, and the area was officially incorporated as a city in 1959.
Geography
Callaway is located at 30°09'45" North, 85°41'45" West (30.1625, -85.6958). According to the United States Census Bureau, the city has a total area of 11.2 square miles (29.0 km2), of which 10.9 square miles (28.2 km2) is land and 0.3 square miles (0.8 km2) is water.
Economy
The economy of Callaway is largely based on tourism and the military. The city is home to Tyndall Air Force Base, which is a major employer in the area. The base is home to the 325th Fighter Wing, which is part of the Air Combat Command. The base also houses the Air Force Research Laboratory, which is responsible for developing and testing new technologies for the Air Force.
In addition to the military, Callaway is home to several tourist attractions, including the Gulf World Marine Park, which is a popular destination for families. The city also has several restaurants, shopping centers, and other businesses that cater to tourists.
Demographics
As of the census of 2010, there were 13,945 people, 5,845 households, and 3,845 families residing in the city. The population density was 1,279.2 people per square mile (493.2/km2). There were 6,541 housing units at an average density of 597.2 per square mile (230.7/km2). The racial makeup of the city was 79.2% White, 11.3% African American, 0.7% Native American, 2.2% Asian, 0.1% Pacific Islander, 4.2% from other races, and 2.4% from two or more races. Hispanic or Latino of any race were 8.7% of the population.
There were 5,845 households, out of which 28.2% had children under the age of 18 living with them, 44.2% were married couples living together, 15.2% had a female householder with no husband present, and 35.3% were non-families. 28.2% of all households were made up of individuals, and 9.2% had someone living alone who was 65 years of age or older. The average household size was 2.38 and the average family size was 2.90.
In the city, the population was spread out, with 23.2% under the age of 18, 8.7% from 18 to 24, 28.2% from 25 to 44, 25.2% from 45 to 64, and 14.7% who were 65 years of age or older. The median age was 38 years. For every 100 females, there were 97.2 males. For every 100 females age 18 and over, there were 94.2 males.
The median income for a household in the city was $37,845, and the median income for a family was $45,945. Males had a median income of $31,945 versus $25,945 for females. The per capita income for the city was $20,945. About 10.2% of families and 13.2% of the population were below the poverty line, including 18.2% of those under age 18 and 8.2% of those age 65 or over.
Common Questions
What is the Total Population of Callaway?
Total Population of Callaway is 13,455.
What is the Total Male Population of Callaway?
Total Male Population of Callaway is 7,097.
What is the Total Female Population of Callaway?
Total Female Population of Callaway is 6,358.
What is the Ratio of Males per 100 Females in Callaway?
There are 111.62 Males per 100 Females in Callaway.
What is the Ratio of Females per 100 Males in Callaway?
There are 89.59 Females per 100 Males in Callaway.
What is the Median Population Age in Callaway?
Median Population Age in Callaway is 38.8 Years.
What is the Average Family Size in Callaway
Average Family Size in Callaway is 3.0 People.
What is the Average Household Size in Callaway
Average Household Size in Callaway is 2.4 People.
What is Per Capita Income in Callaway?
Per Capita income in Callaway is $31,984.
What is the Median Family Income in Callaway?
Median Family Income in Callaway is $75,799.
What is the Median Household income in Callaway?
Median Household Income in Callaway is $61,743.
What is Income or Wage Gap in Callaway?
Income or Wage Gap in Callaway is 19.3%.
Women in Callaway earn 80.7 cents for every dollar earned by a man.
What is Inequality or Gini Index in Callaway?
Inequality or Gini Index in Callaway is 0.39.
How Large is the Labor Force in Callaway?
There are 7,206 People in the Labor Forcein in Callaway.
What is the Percentage of People in the Labor Force in Callaway?
66.1% of People are in the Labor Force in Callaway.
What is the Unemployment Rate in Callaway?
Unemployment Rate in Callaway is 4.7%.