Palm Coast, FL
Palm Coast Map
Palm Coast Overview
91,082
TOTAL POPULATION
43,931
MALE POPULATION
47,151
FEMALE POPULATION
93.17
MALES / 100 FEMALES
107.33
FEMALES / 100 MALES
50.3
MEDIAN AGE
2.9
AVG FAMILY SIZE
2.5
AVG HOUSEHOLD SIZE
$37,904
PER CAPITA INCOME
$77,353
AVG FAMILY INCOME
$68,824
AVG HOUSEHOLD INCOME
20.0%
WAGE / INCOME GAP [ % ]
80.0¢/ $1
WAGE / INCOME GAP [ $ ]
$9,725
FAMILY INCOME DEFICIT
0.44
INEQUALITY / GINI INDEX
40,146
LABOR FORCE [ PEOPLE ]
52.2%
PERCENT IN LABOR FORCE
4.1%
UNEMPLOYMENT RATE
Palm Coast Area Codes
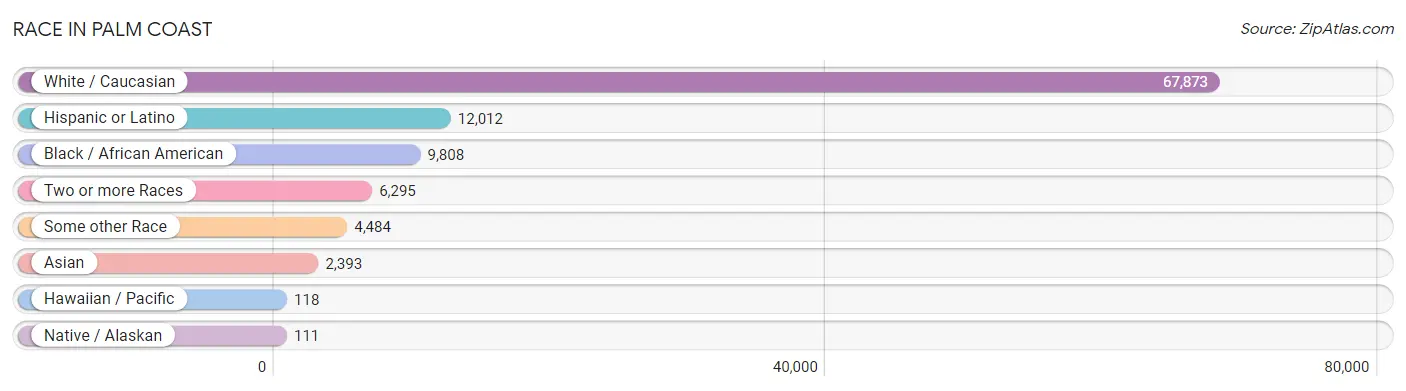
Race in Palm Coast
The most populous races in Palm Coast are White / Caucasian (67,873 | 74.5%), Hispanic or Latino (12,012 | 13.2%), and Black / African American (9,808 | 10.8%).
| Race | # Population | % Population |
| Asian | 2,393 | 2.6% |
| Black / African American | 9,808 | 10.8% |
| Hawaiian / Pacific | 118 | 0.1% |
| Hispanic or Latino | 12,012 | 13.2% |
| Native / Alaskan | 111 | 0.1% |
| White / Caucasian | 67,873 | 74.5% |
| Two or more Races | 6,295 | 6.9% |
| Some other Race | 4,484 | 4.9% |
| Total | 91,082 | 100.0% |
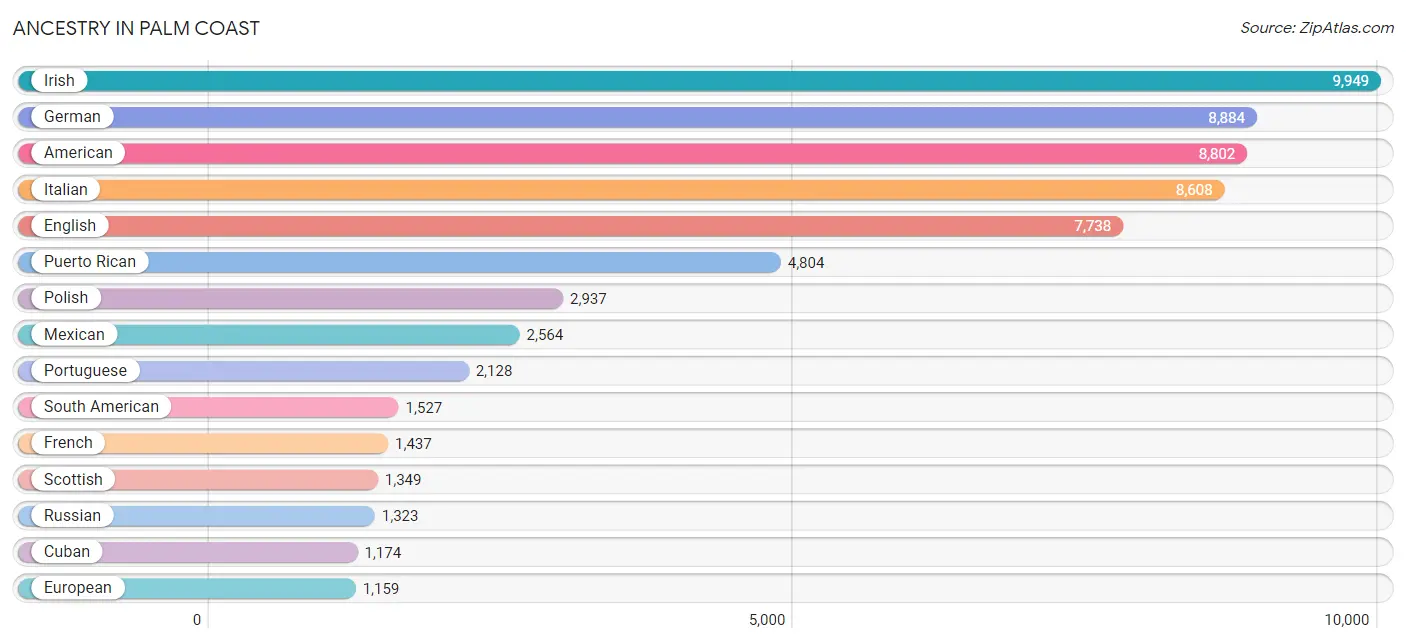
Ancestry in Palm Coast
The most populous ancestries reported in Palm Coast are Irish (9,949 | 10.9%), German (8,884 | 9.8%), American (8,802 | 9.7%), Italian (8,608 | 9.5%), and English (7,738 | 8.5%), together accounting for 48.3% of all Palm Coast residents.
| Ancestry | # Population | % Population |
| African | 206 | 0.2% |
| Albanian | 49 | 0.1% |
| American | 8,802 | 9.7% |
| Arab | 253 | 0.3% |
| Argentinean | 61 | 0.1% |
| Armenian | 25 | 0.0% |
| Australian | 17 | 0.0% |
| Austrian | 94 | 0.1% |
| Belgian | 76 | 0.1% |
| Belizean | 22 | 0.0% |
| Bhutanese | 195 | 0.2% |
| Blackfeet | 69 | 0.1% |
| Bolivian | 37 | 0.0% |
| Brazilian | 367 | 0.4% |
| British | 685 | 0.7% |
| Burmese | 116 | 0.1% |
| Cajun | 22 | 0.0% |
| Cambodian | 97 | 0.1% |
| Canadian | 189 | 0.2% |
| Cape Verdean | 12 | 0.0% |
| Celtic | 26 | 0.0% |
| Central American | 797 | 0.9% |
| Cherokee | 167 | 0.2% |
| Chilean | 17 | 0.0% |
| Choctaw | 15 | 0.0% |
| Colombian | 843 | 0.9% |
| Costa Rican | 22 | 0.0% |
| Croatian | 31 | 0.0% |
| Cuban | 1,174 | 1.3% |
| Czech | 233 | 0.3% |
| Czechoslovakian | 172 | 0.2% |
| Danish | 167 | 0.2% |
| Dominican | 449 | 0.5% |
| Dutch | 787 | 0.9% |
| Eastern European | 122 | 0.1% |
| Ecuadorian | 149 | 0.2% |
| Egyptian | 17 | 0.0% |
| English | 7,738 | 8.5% |
| European | 1,159 | 1.3% |
| Finnish | 19 | 0.0% |
| French | 1,437 | 1.6% |
| French Canadian | 588 | 0.6% |
| German | 8,884 | 9.8% |
| Greek | 368 | 0.4% |
| Guatemalan | 164 | 0.2% |
| Guyanese | 387 | 0.4% |
| Haitian | 535 | 0.6% |
| Honduran | 160 | 0.2% |
| Hopi | 16 | 0.0% |
| Hungarian | 370 | 0.4% |
| Indian (Asian) | 600 | 0.7% |
| Iranian | 27 | 0.0% |
| Irish | 9,949 | 10.9% |
| Italian | 8,608 | 9.5% |
| Jamaican | 437 | 0.5% |
| Japanese | 40 | 0.0% |
| Jordanian | 12 | 0.0% |
| Korean | 882 | 1.0% |
| Laotian | 63 | 0.1% |
| Latvian | 36 | 0.0% |
| Lebanese | 36 | 0.0% |
| Lithuanian | 417 | 0.5% |
| Luxembourger | 23 | 0.0% |
| Maltese | 14 | 0.0% |
| Mexican | 2,564 | 2.8% |
| New Zealander | 10 | 0.0% |
| Nicaraguan | 33 | 0.0% |
| Nigerian | 26 | 0.0% |
| Northern European | 184 | 0.2% |
| Norwegian | 597 | 0.7% |
| Pakistani | 228 | 0.3% |
| Panamanian | 86 | 0.1% |
| Pennsylvania German | 46 | 0.1% |
| Peruvian | 291 | 0.3% |
| Polish | 2,937 | 3.2% |
| Portuguese | 2,128 | 2.3% |
| Puerto Rican | 4,804 | 5.3% |
| Romanian | 41 | 0.1% |
| Russian | 1,323 | 1.5% |
| Salvadoran | 332 | 0.4% |
| Samoan | 73 | 0.1% |
| Scandinavian | 192 | 0.2% |
| Scotch-Irish | 651 | 0.7% |
| Scottish | 1,349 | 1.5% |
| Slavic | 22 | 0.0% |
| Slovak | 221 | 0.2% |
| Slovene | 4 | 0.0% |
| South American | 1,527 | 1.7% |
| South American Indian | 13 | 0.0% |
| Soviet Union | 39 | 0.0% |
| Spaniard | 157 | 0.2% |
| Spanish | 96 | 0.1% |
| Sri Lankan | 388 | 0.4% |
| Subsaharan African | 265 | 0.3% |
| Swedish | 624 | 0.7% |
| Swiss | 128 | 0.1% |
| Syrian | 81 | 0.1% |
| Thai | 396 | 0.4% |
| Trinidadian and Tobagonian | 165 | 0.2% |
| Turkish | 12 | 0.0% |
| Ukrainian | 615 | 0.7% |
| Uruguayan | 43 | 0.1% |
| Venezuelan | 58 | 0.1% |
| Welsh | 595 | 0.6% |
| West Indian | 138 | 0.2% |
| Yugoslavian | 113 | 0.1% | View All 106 Rows |
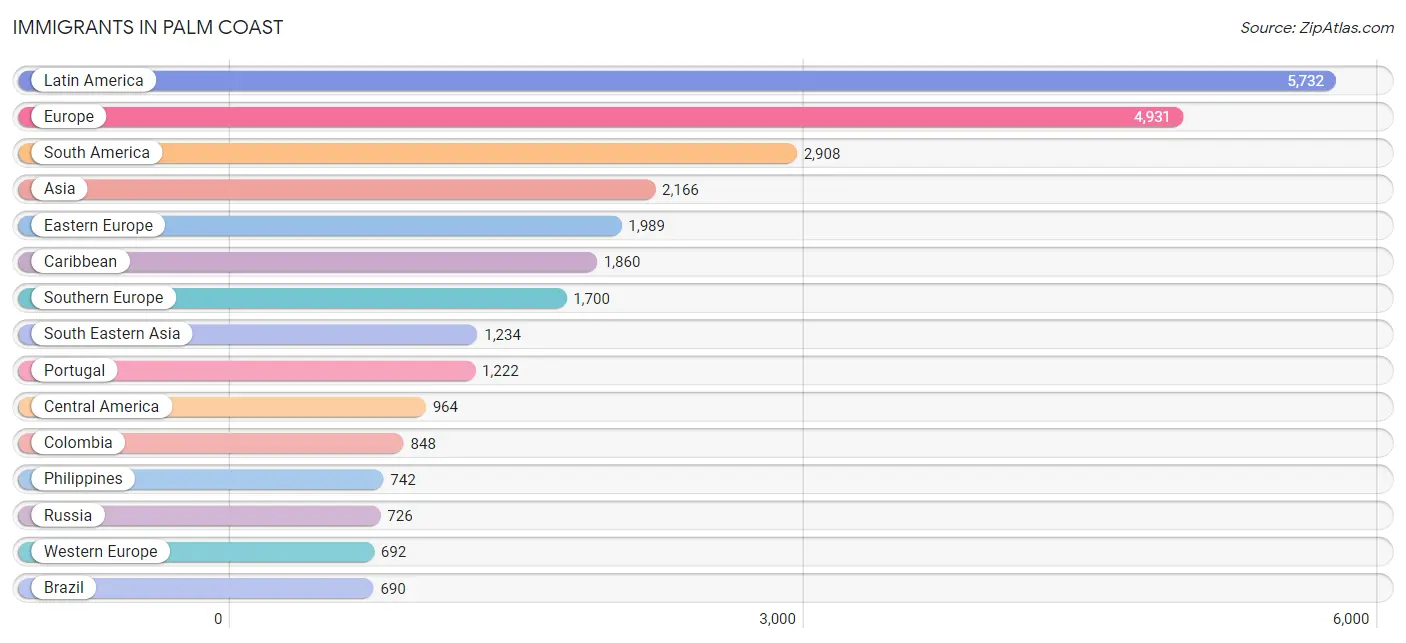
Immigrants in Palm Coast
The most numerous immigrant groups reported in Palm Coast came from Latin America (5,732 | 6.3%), Europe (4,931 | 5.4%), South America (2,908 | 3.2%), Asia (2,166 | 2.4%), and Eastern Europe (1,989 | 2.2%), together accounting for 19.4% of all Palm Coast residents.
| Immigration Origin | # Population | % Population |
| Africa | 111 | 0.1% |
| Argentina | 61 | 0.1% |
| Asia | 2,166 | 2.4% |
| Australia | 59 | 0.1% |
| Austria | 45 | 0.1% |
| Azores | 38 | 0.0% |
| Barbados | 53 | 0.1% |
| Belarus | 71 | 0.1% |
| Belize | 12 | 0.0% |
| Brazil | 690 | 0.8% |
| Cambodia | 4 | 0.0% |
| Canada | 348 | 0.4% |
| Caribbean | 1,860 | 2.0% |
| Central America | 964 | 1.1% |
| China | 101 | 0.1% |
| Colombia | 848 | 0.9% |
| Costa Rica | 60 | 0.1% |
| Croatia | 16 | 0.0% |
| Cuba | 508 | 0.6% |
| Czechoslovakia | 28 | 0.0% |
| Denmark | 8 | 0.0% |
| Dominican Republic | 178 | 0.2% |
| Eastern Africa | 35 | 0.0% |
| Eastern Asia | 266 | 0.3% |
| Eastern Europe | 1,989 | 2.2% |
| Ecuador | 130 | 0.1% |
| Egypt | 17 | 0.0% |
| El Salvador | 330 | 0.4% |
| England | 127 | 0.1% |
| Europe | 4,931 | 5.4% |
| France | 33 | 0.0% |
| Germany | 614 | 0.7% |
| Greece | 45 | 0.1% |
| Guatemala | 166 | 0.2% |
| Guyana | 502 | 0.5% |
| Haiti | 450 | 0.5% |
| Hungary | 20 | 0.0% |
| India | 107 | 0.1% |
| Indonesia | 63 | 0.1% |
| Iran | 27 | 0.0% |
| Ireland | 20 | 0.0% |
| Italy | 287 | 0.3% |
| Jamaica | 370 | 0.4% |
| Japan | 19 | 0.0% |
| Jordan | 15 | 0.0% |
| Kazakhstan | 247 | 0.3% |
| Korea | 49 | 0.1% |
| Latin America | 5,732 | 6.3% |
| Lithuania | 33 | 0.0% |
| Mexico | 298 | 0.3% |
| Middle Africa | 15 | 0.0% |
| Moldova | 24 | 0.0% |
| Nicaragua | 21 | 0.0% |
| Nigeria | 14 | 0.0% |
| Northern Africa | 28 | 0.0% |
| Northern Europe | 403 | 0.4% |
| Oceania | 59 | 0.1% |
| Pakistan | 149 | 0.2% |
| Panama | 77 | 0.1% |
| Peru | 534 | 0.6% |
| Philippines | 742 | 0.8% |
| Poland | 469 | 0.5% |
| Portugal | 1,222 | 1.3% |
| Romania | 27 | 0.0% |
| Russia | 726 | 0.8% |
| Saudi Arabia | 16 | 0.0% |
| Scotland | 48 | 0.1% |
| Sierra Leone | 19 | 0.0% |
| South America | 2,908 | 3.2% |
| South Central Asia | 560 | 0.6% |
| South Eastern Asia | 1,234 | 1.3% |
| Southern Europe | 1,700 | 1.9% |
| Spain | 146 | 0.2% |
| Syria | 49 | 0.1% |
| Thailand | 217 | 0.2% |
| Trinidad and Tobago | 268 | 0.3% |
| Turkey | 12 | 0.0% |
| Ukraine | 440 | 0.5% |
| Uruguay | 43 | 0.1% |
| Uzbekistan | 30 | 0.0% |
| Venezuela | 43 | 0.1% |
| Vietnam | 208 | 0.2% |
| Western Africa | 33 | 0.0% |
| Western Asia | 106 | 0.1% |
| Western Europe | 692 | 0.8% | View All 85 Rows |
Sex and Age in Palm Coast
Sex and Age in Palm Coast
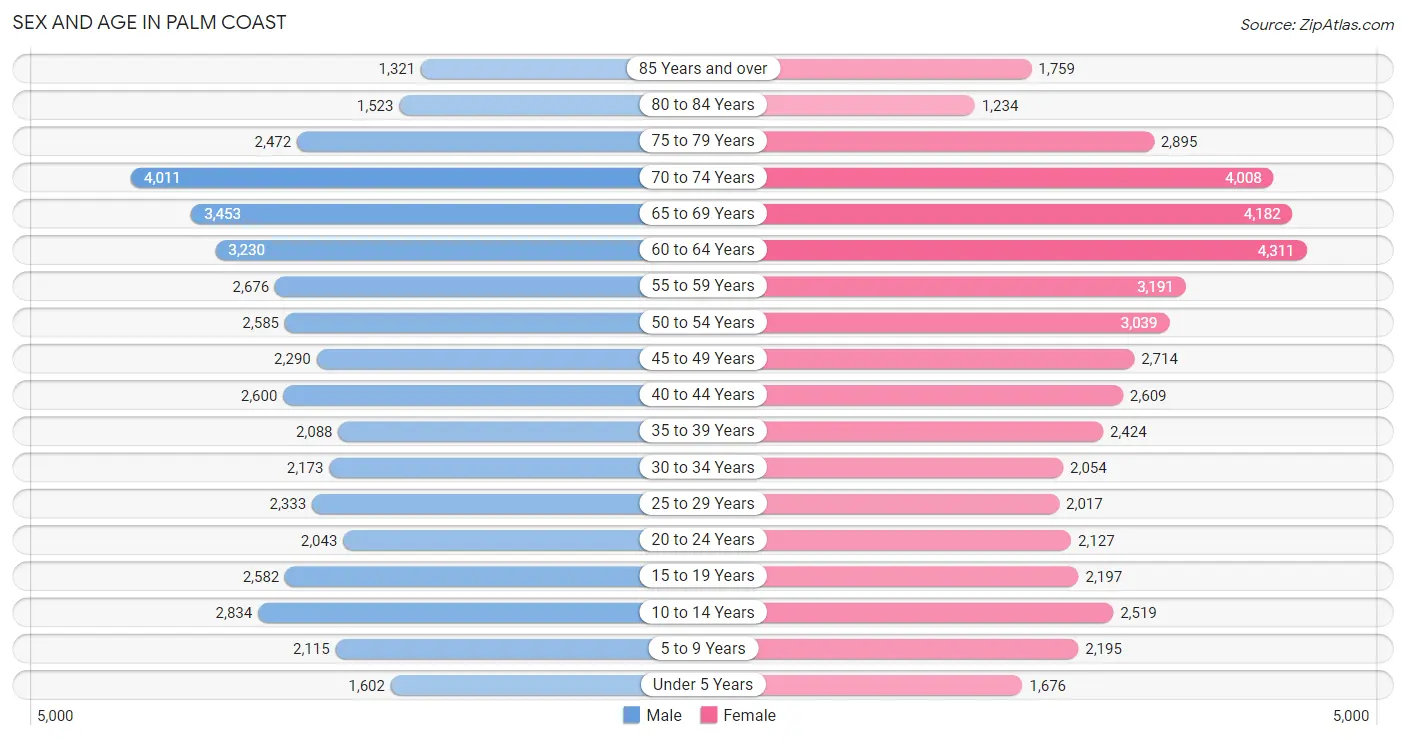
The most populous age groups in Palm Coast are 70 to 74 Years (4,011 | 9.1%) for men and 60 to 64 Years (4,311 | 9.1%) for women.
| Age Bracket | Male | Female |
| Under 5 Years | 1,602 (3.6%) | 1,676 (3.5%) |
| 5 to 9 Years | 2,115 (4.8%) | 2,195 (4.7%) |
| 10 to 14 Years | 2,834 (6.5%) | 2,519 (5.3%) |
| 15 to 19 Years | 2,582 (5.9%) | 2,197 (4.7%) |
| 20 to 24 Years | 2,043 (4.6%) | 2,127 (4.5%) |
| 25 to 29 Years | 2,333 (5.3%) | 2,017 (4.3%) |
| 30 to 34 Years | 2,173 (5.0%) | 2,054 (4.4%) |
| 35 to 39 Years | 2,088 (4.8%) | 2,424 (5.1%) |
| 40 to 44 Years | 2,600 (5.9%) | 2,609 (5.5%) |
| 45 to 49 Years | 2,290 (5.2%) | 2,714 (5.8%) |
| 50 to 54 Years | 2,585 (5.9%) | 3,039 (6.5%) |
| 55 to 59 Years | 2,676 (6.1%) | 3,191 (6.8%) |
| 60 to 64 Years | 3,230 (7.3%) | 4,311 (9.1%) |
| 65 to 69 Years | 3,453 (7.9%) | 4,182 (8.9%) |
| 70 to 74 Years | 4,011 (9.1%) | 4,008 (8.5%) |
| 75 to 79 Years | 2,472 (5.6%) | 2,895 (6.1%) |
| 80 to 84 Years | 1,523 (3.5%) | 1,234 (2.6%) |
| 85 Years and over | 1,321 (3.0%) | 1,759 (3.7%) |
| Total | 43,931 (100.0%) | 47,151 (100.0%) |
Families and Households in Palm Coast
Median Family Size in Palm Coast
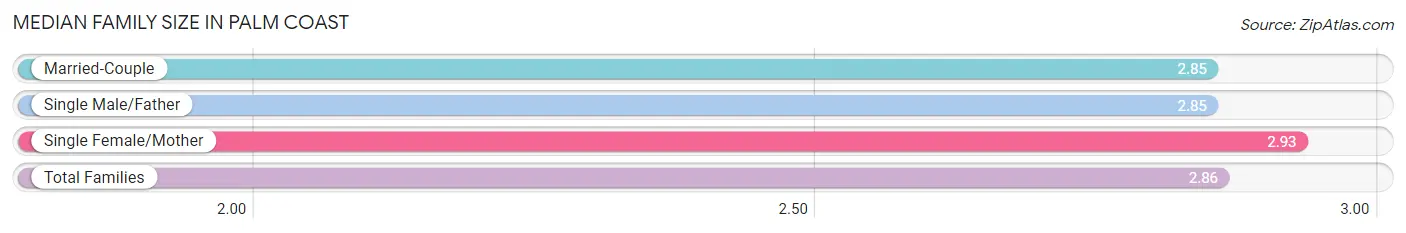
The median family size in Palm Coast is 2.86 persons per family, with single female/mother families (4,100 | 15.4%) accounting for the largest median family size of 2.93 persons per family. On the other hand, married-couple families (20,884 | 78.5%) represent the smallest median family size with 2.85 persons per family.
| Family Type | # Families | Family Size |
| Married-Couple | 20,884 (78.5%) | 2.85 |
| Single Male/Father | 1,618 (6.1%) | 2.85 |
| Single Female/Mother | 4,100 (15.4%) | 2.93 |
| Total Families | 26,602 (100.0%) | 2.86 |
Median Household Size in Palm Coast
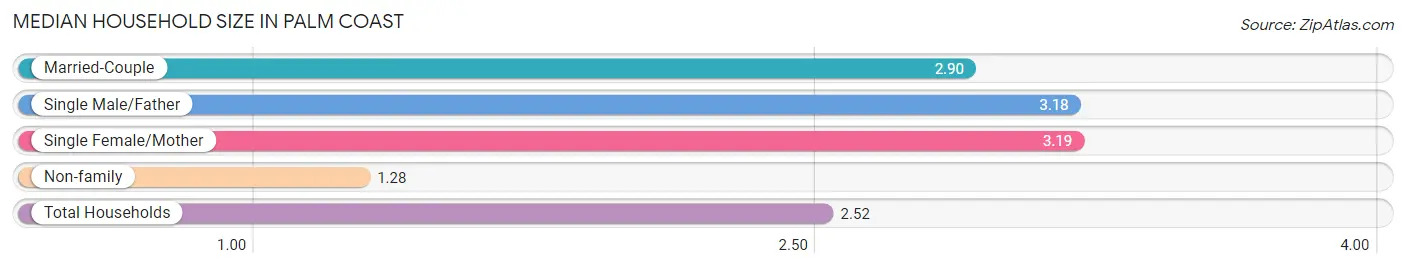
The median household size in Palm Coast is 2.52 persons per household, with single female/mother households (4,100 | 11.4%) accounting for the largest median household size of 3.19 persons per household. non-family households (9,359 | 26.0%) represent the smallest median household size with 1.28 persons per household.
| Household Type | # Households | Household Size |
| Married-Couple | 20,884 (58.1%) | 2.90 |
| Single Male/Father | 1,618 (4.5%) | 3.18 |
| Single Female/Mother | 4,100 (11.4%) | 3.19 |
| Non-family | 9,359 (26.0%) | 1.28 |
| Total Households | 35,961 (100.0%) | 2.52 |
Household Size by Marriage Status in Palm Coast
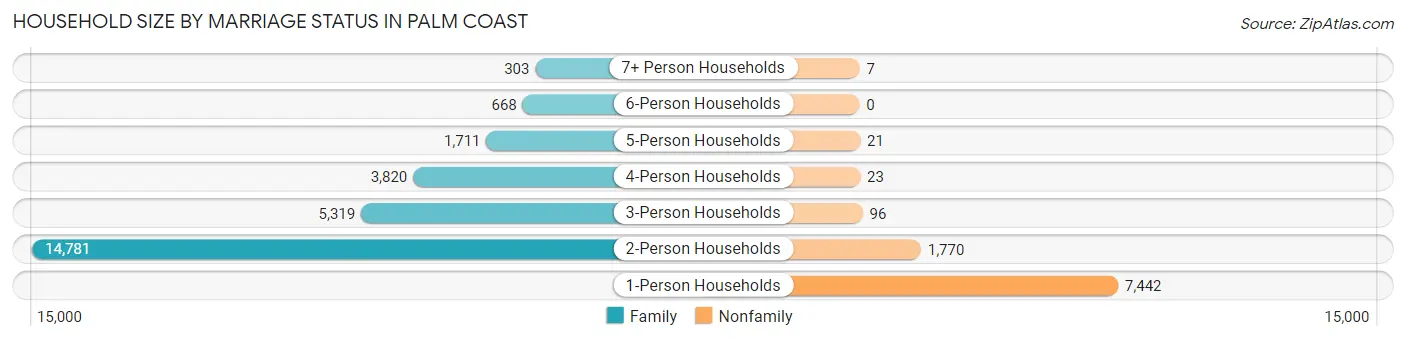
Out of a total of 35,961 households in Palm Coast, 26,602 (74.0%) are family households, while 9,359 (26.0%) are nonfamily households. The most numerous type of family households are 2-person households, comprising 14,781, and the most common type of nonfamily households are 1-person households, comprising 7,442.
| Household Size | Family Households | Nonfamily Households |
| 1-Person Households | - | 7,442 (20.7%) |
| 2-Person Households | 14,781 (41.1%) | 1,770 (4.9%) |
| 3-Person Households | 5,319 (14.8%) | 96 (0.3%) |
| 4-Person Households | 3,820 (10.6%) | 23 (0.1%) |
| 5-Person Households | 1,711 (4.8%) | 21 (0.1%) |
| 6-Person Households | 668 (1.9%) | 0 (0.0%) |
| 7+ Person Households | 303 (0.8%) | 7 (0.0%) |
| Total | 26,602 (74.0%) | 9,359 (26.0%) |
Female Fertility in Palm Coast
Fertility by Age in Palm Coast
Average fertility rate in Palm Coast is 26.0 births per 1,000 women. Women in the age bracket of 20 to 34 years have the highest fertility rate with 47.0 births per 1,000 women. Women in the age bracket of 20 to 34 years acount for 67.0% of all women with births.
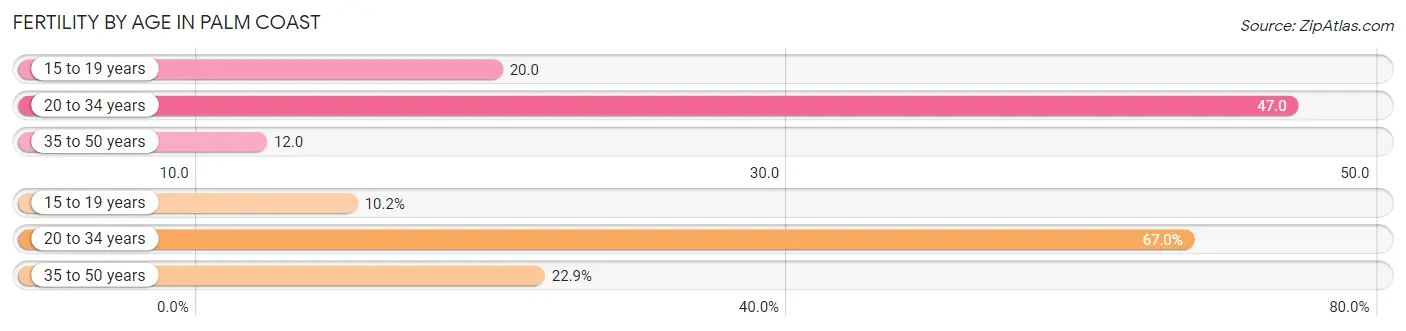
| Age Bracket | Women with Births | Births / 1,000 Women |
| 15 to 19 years | 44 (10.2%) | 20.0 |
| 20 to 34 years | 290 (67.0%) | 47.0 |
| 35 to 50 years | 99 (22.9%) | 12.0 |
| Total | 433 (100.0%) | 26.0 |
Fertility by Age by Marriage Status in Palm Coast
58.2% of women with births (433) in Palm Coast are married. The highest percentage of unmarried women with births falls into 15 to 19 years age bracket with 100.0% of them unmarried at the time of birth, while the lowest percentage of unmarried women with births belong to 35 to 50 years age bracket with 0.0% of them unmarried.
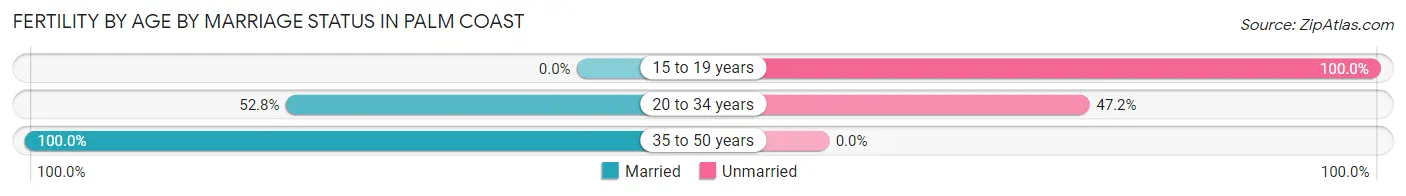
| Age Bracket | Married | Unmarried |
| 15 to 19 years | 0 (0.0%) | 44 (100.0%) |
| 20 to 34 years | 153 (52.8%) | 137 (47.2%) |
| 35 to 50 years | 99 (100.0%) | 0 (0.0%) |
| Total | 252 (58.2%) | 181 (41.8%) |
Fertility by Education in Palm Coast
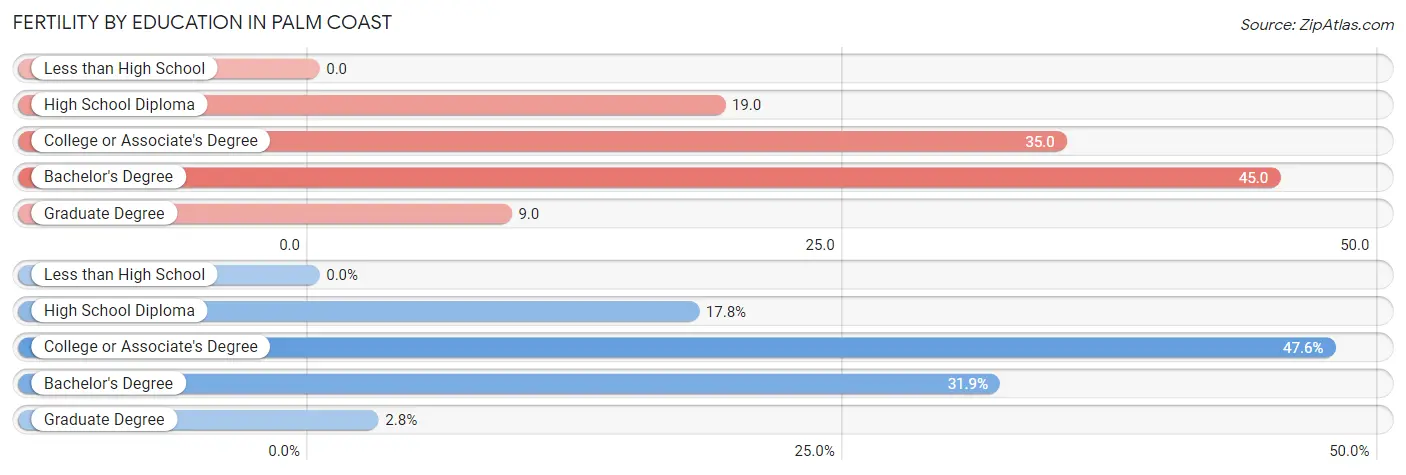
| Educational Attainment | Women with Births | Births / 1,000 Women |
| Less than High School | 0 (0.0%) | 0.0 |
| High School Diploma | 77 (17.8%) | 19.0 |
| College or Associate's Degree | 206 (47.6%) | 35.0 |
| Bachelor's Degree | 138 (31.9%) | 45.0 |
| Graduate Degree | 12 (2.8%) | 9.0 |
| Total | 433 (100.0%) | 26.0 |
Fertility by Education by Marriage Status in Palm Coast
41.8% of women with births in Palm Coast are unmarried. Women with the educational attainment of graduate degree are most likely to be married with 100.0% of them married at childbirth, while women with the educational attainment of high school diploma are least likely to be married with 100.0% of them unmarried at childbirth.
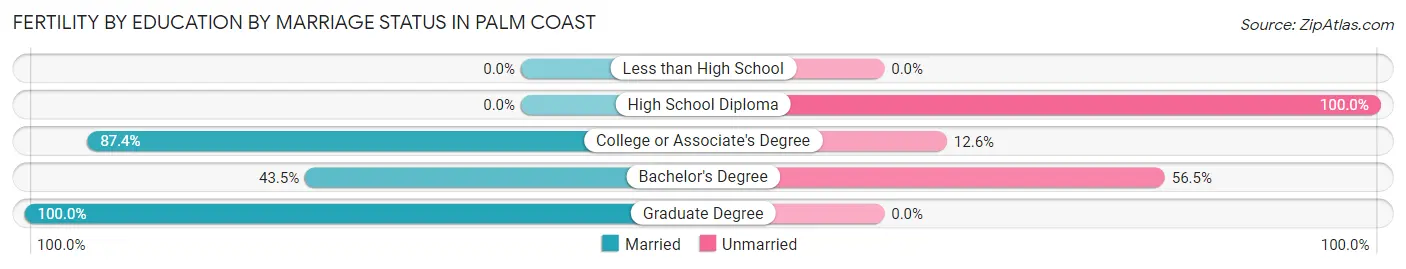
| Educational Attainment | Married | Unmarried |
| Less than High School | 0 (0.0%) | 0 (0.0%) |
| High School Diploma | 0 (0.0%) | 77 (100.0%) |
| College or Associate's Degree | 180 (87.4%) | 26 (12.6%) |
| Bachelor's Degree | 60 (43.5%) | 78 (56.5%) |
| Graduate Degree | 12 (100.0%) | 0 (0.0%) |
| Total | 252 (58.2%) | 181 (41.8%) |
Income in Palm Coast
Income Overview in Palm Coast
Per Capita Income in Palm Coast is $37,904, while median incomes of families and households are $77,353 and $68,824 respectively.
| Characteristic | Number | Measure |
| Per Capita Income | 91,082 | $37,904 |
| Median Family Income | 26,602 | $77,353 |
| Mean Family Income | 26,602 | $103,243 |
| Median Household Income | 35,961 | $68,824 |
| Mean Household Income | 35,961 | $93,072 |
| Income Deficit | 26,602 | $9,725 |
| Wage / Income Gap (%) | 91,082 | 20.01% |
| Wage / Income Gap ($) | 91,082 | 79.99¢ per $1 |
| Gini / Inequality Index | 91,082 | 0.44 |
Earnings by Sex in Palm Coast
Average Earnings in Palm Coast are $37,184, $41,673 for men and $33,336 for women, a difference of 20.0%.
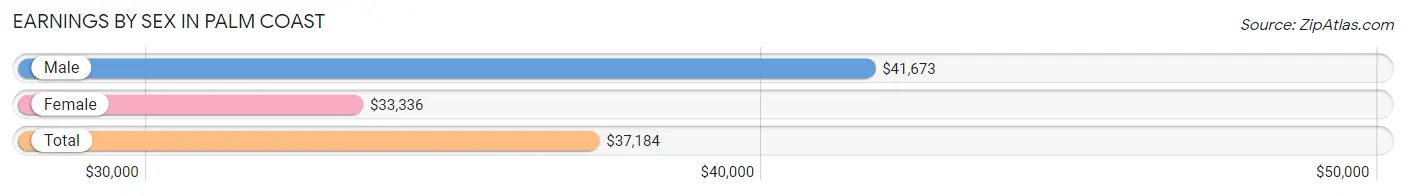
| Sex | Number | Average Earnings |
| Male | 20,770 (50.3%) | $41,673 |
| Female | 20,537 (49.7%) | $33,336 |
| Total | 41,307 (100.0%) | $37,184 |
Earnings by Sex by Income Bracket in Palm Coast
The most common earnings brackets in Palm Coast are $100,000+ for men (2,783 | 13.4%) and $100,000+ for women (1,499 | 7.3%).
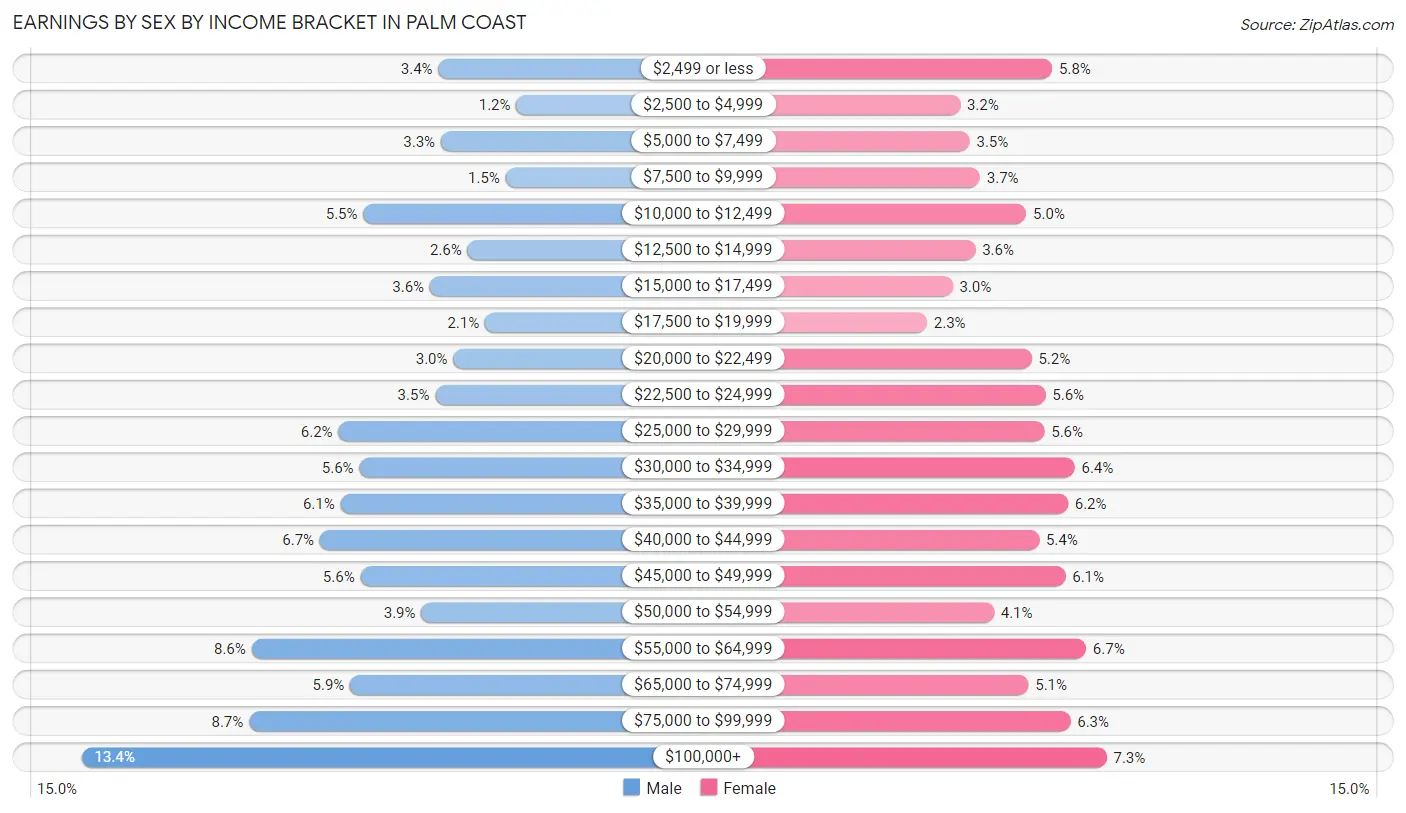
| Income | Male | Female |
| $2,499 or less | 700 (3.4%) | 1,184 (5.8%) |
| $2,500 to $4,999 | 245 (1.2%) | 653 (3.2%) |
| $5,000 to $7,499 | 685 (3.3%) | 708 (3.5%) |
| $7,500 to $9,999 | 307 (1.5%) | 768 (3.7%) |
| $10,000 to $12,499 | 1,138 (5.5%) | 1,035 (5.0%) |
| $12,500 to $14,999 | 530 (2.5%) | 742 (3.6%) |
| $15,000 to $17,499 | 749 (3.6%) | 609 (3.0%) |
| $17,500 to $19,999 | 428 (2.1%) | 463 (2.2%) |
| $20,000 to $22,499 | 613 (2.9%) | 1,066 (5.2%) |
| $22,500 to $24,999 | 719 (3.5%) | 1,146 (5.6%) |
| $25,000 to $29,999 | 1,284 (6.2%) | 1,139 (5.6%) |
| $30,000 to $34,999 | 1,162 (5.6%) | 1,314 (6.4%) |
| $35,000 to $39,999 | 1,271 (6.1%) | 1,276 (6.2%) |
| $40,000 to $44,999 | 1,391 (6.7%) | 1,109 (5.4%) |
| $45,000 to $49,999 | 1,154 (5.6%) | 1,260 (6.1%) |
| $50,000 to $54,999 | 799 (3.8%) | 849 (4.1%) |
| $55,000 to $64,999 | 1,791 (8.6%) | 1,381 (6.7%) |
| $65,000 to $74,999 | 1,216 (5.9%) | 1,047 (5.1%) |
| $75,000 to $99,999 | 1,805 (8.7%) | 1,289 (6.3%) |
| $100,000+ | 2,783 (13.4%) | 1,499 (7.3%) |
| Total | 20,770 (100.0%) | 20,537 (100.0%) |
Earnings by Sex by Educational Attainment in Palm Coast
Average earnings in Palm Coast are $45,935 for men and $36,454 for women, a difference of 20.6%. Men with an educational attainment of graduate degree enjoy the highest average annual earnings of $58,438, while those with less than high school education earn the least with $35,254. Women with an educational attainment of graduate degree earn the most with the average annual earnings of $60,245, while those with less than high school education have the smallest earnings of $22,246.
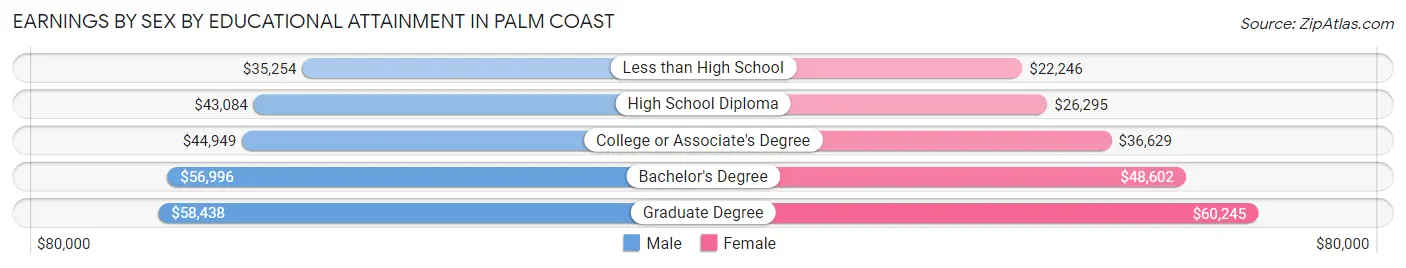
| Educational Attainment | Male Income | Female Income |
| Less than High School | $35,254 | $22,246 |
| High School Diploma | $43,084 | $26,295 |
| College or Associate's Degree | $44,949 | $36,629 |
| Bachelor's Degree | $56,996 | $48,602 |
| Graduate Degree | $58,438 | $60,245 |
| Total | $45,935 | $36,454 |
Family Income in Palm Coast
Family Income Brackets in Palm Coast
According to the Palm Coast family income data, there are 5,480 families falling into the $100,000 to $149,999 income range, which is the most common income bracket and makes up 20.6% of all families. Conversely, the $10,000 to $14,999 income bracket is the least frequent group with only 346 families (1.3%) belonging to this category.
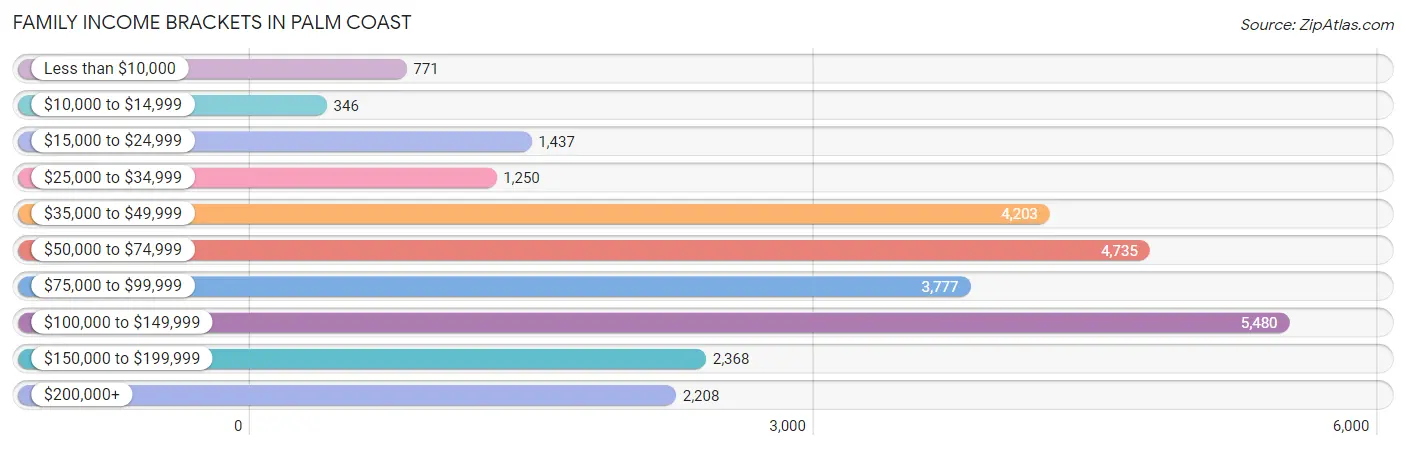
| Income Bracket | # Families | % Families |
| Less than $10,000 | 771 | 2.9% |
| $10,000 to $14,999 | 346 | 1.3% |
| $15,000 to $24,999 | 1,437 | 5.4% |
| $25,000 to $34,999 | 1,250 | 4.7% |
| $35,000 to $49,999 | 4,203 | 15.8% |
| $50,000 to $74,999 | 4,735 | 17.8% |
| $75,000 to $99,999 | 3,777 | 14.2% |
| $100,000 to $149,999 | 5,480 | 20.6% |
| $150,000 to $199,999 | 2,368 | 8.9% |
| $200,000+ | 2,208 | 8.3% |
Family Income by Famaliy Size in Palm Coast
6-person families (551 | 2.1%) account for the highest median family income in Palm Coast with $110,412 per family, while 2-person families (15,603 | 58.7%) have the highest median income of $32,445 per family member.
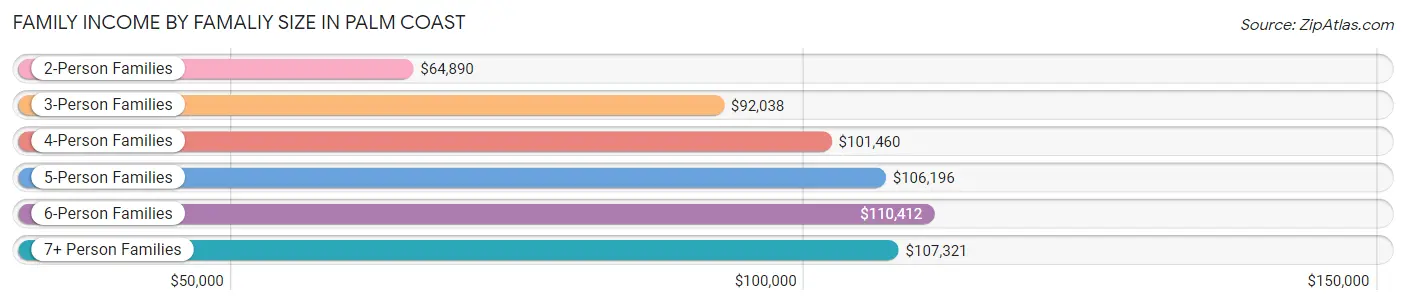
| Income Bracket | # Families | Median Income |
| 2-Person Families | 15,603 (58.7%) | $64,890 |
| 3-Person Families | 5,254 (19.8%) | $92,038 |
| 4-Person Families | 3,463 (13.0%) | $101,460 |
| 5-Person Families | 1,447 (5.4%) | $106,196 |
| 6-Person Families | 551 (2.1%) | $110,412 |
| 7+ Person Families | 284 (1.1%) | $107,321 |
| Total | 26,602 (100.0%) | $77,353 |
Family Income by Number of Earners in Palm Coast
The median family income in Palm Coast is $77,353, with families comprising 3+ earners (2,460) having the highest median family income of $125,328, while families with no earners (8,264) have the lowest median family income of $53,732, accounting for 9.2% and 31.1% of families, respectively.
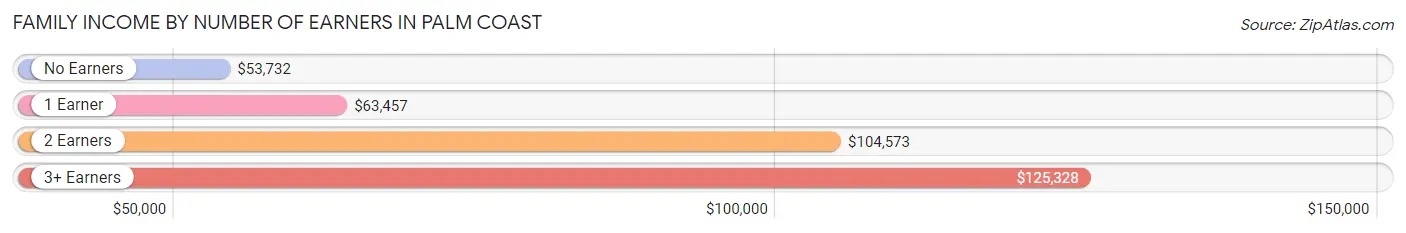
| Number of Earners | # Families | Median Income |
| No Earners | 8,264 (31.1%) | $53,732 |
| 1 Earner | 6,978 (26.2%) | $63,457 |
| 2 Earners | 8,900 (33.5%) | $104,573 |
| 3+ Earners | 2,460 (9.2%) | $125,328 |
| Total | 26,602 (100.0%) | $77,353 |
Household Income in Palm Coast
Household Income Brackets in Palm Coast
With 6,545 households falling in the category, the $50,000 to $74,999 income range is the most frequent in Palm Coast, accounting for 18.2% of all households. In contrast, only 791 households (2.2%) fall into the $10,000 to $14,999 income bracket, making it the least populous group.
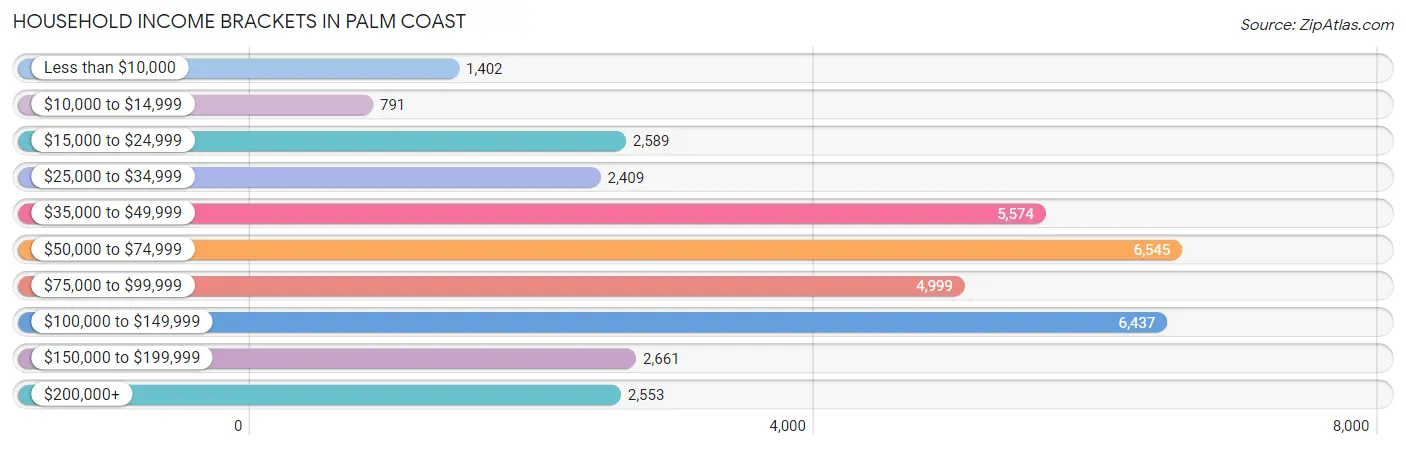
| Income Bracket | # Households | % Households |
| Less than $10,000 | 1,402 | 3.9% |
| $10,000 to $14,999 | 791 | 2.2% |
| $15,000 to $24,999 | 2,589 | 7.2% |
| $25,000 to $34,999 | 2,409 | 6.7% |
| $35,000 to $49,999 | 5,574 | 15.5% |
| $50,000 to $74,999 | 6,545 | 18.2% |
| $75,000 to $99,999 | 4,999 | 13.9% |
| $100,000 to $149,999 | 6,437 | 17.9% |
| $150,000 to $199,999 | 2,661 | 7.4% |
| $200,000+ | 2,553 | 7.1% |
Household Income by Householder Age in Palm Coast
The median household income in Palm Coast is $68,824, with the highest median household income of $81,801 found in the 25 to 44 years age bracket for the primary householder. A total of 7,660 households (21.3%) fall into this category. Meanwhile, the 15 to 24 years age bracket for the primary householder has the lowest median household income of $44,960, with 565 households (1.6%) in this group.
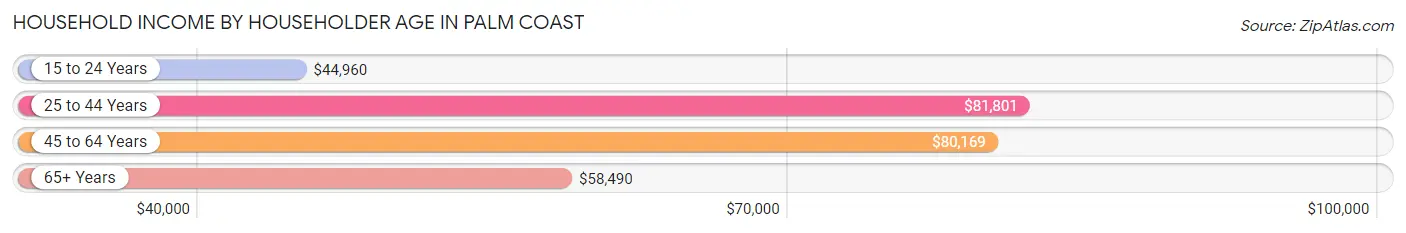
| Income Bracket | # Households | Median Income |
| 15 to 24 Years | 565 (1.6%) | $44,960 |
| 25 to 44 Years | 7,660 (21.3%) | $81,801 |
| 45 to 64 Years | 12,600 (35.0%) | $80,169 |
| 65+ Years | 15,136 (42.1%) | $58,490 |
| Total | 35,961 (100.0%) | $68,824 |
Poverty in Palm Coast
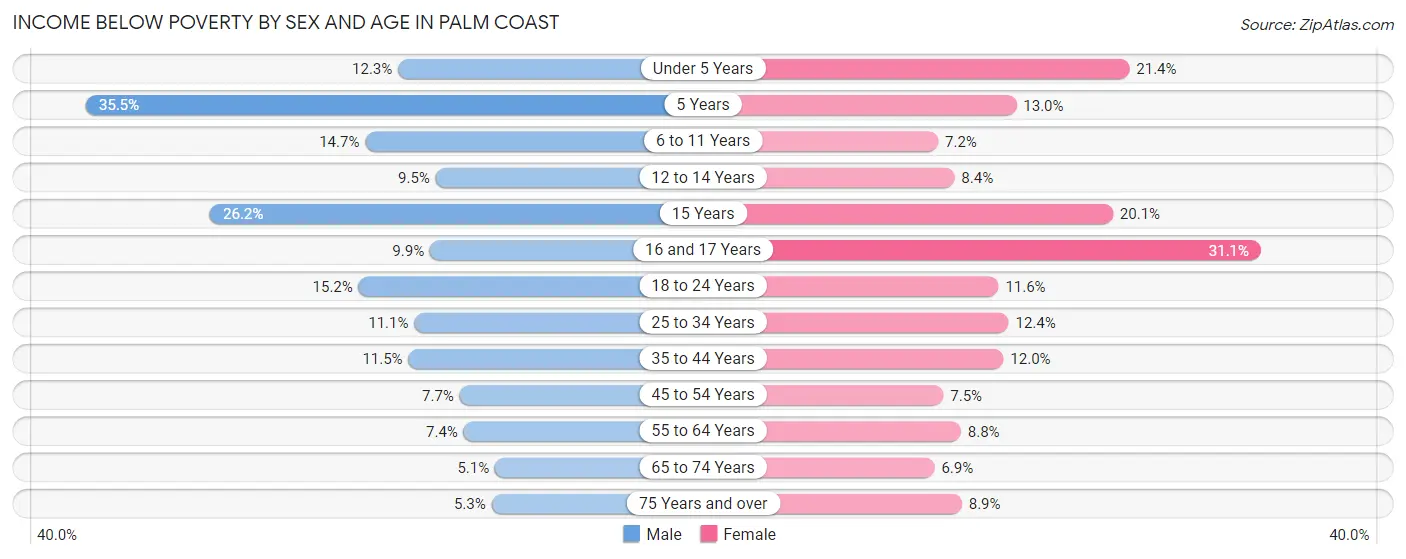
Income Below Poverty by Sex and Age in Palm Coast
With 9.4% poverty level for males and 10.1% for females among the residents of Palm Coast, 5 year old males and 16 and 17 year old females are the most vulnerable to poverty, with 67 males (35.4%) and 299 females (31.1%) in their respective age groups living below the poverty level.
| Age Bracket | Male | Female |
| Under 5 Years | 181 (12.3%) | 344 (21.3%) |
| 5 Years | 67 (35.4%) | 63 (13.0%) |
| 6 to 11 Years | 435 (14.7%) | 197 (7.1%) |
| 12 to 14 Years | 161 (9.5%) | 112 (8.4%) |
| 15 Years | 203 (26.2%) | 92 (20.1%) |
| 16 and 17 Years | 87 (9.9%) | 299 (31.1%) |
| 18 to 24 Years | 451 (15.2%) | 338 (11.6%) |
| 25 to 34 Years | 499 (11.1%) | 504 (12.4%) |
| 35 to 44 Years | 539 (11.5%) | 604 (12.0%) |
| 45 to 54 Years | 375 (7.7%) | 434 (7.5%) |
| 55 to 64 Years | 437 (7.4%) | 663 (8.8%) |
| 65 to 74 Years | 377 (5.1%) | 559 (6.9%) |
| 75 Years and over | 282 (5.3%) | 514 (8.9%) |
| Total | 4,094 (9.4%) | 4,723 (10.1%) |
Income Above Poverty by Sex and Age in Palm Coast
According to the poverty statistics in Palm Coast, males aged 65 to 74 years and females aged 65 to 74 years are the age groups that are most secure financially, with 94.9% of males and 93.1% of females in these age groups living above the poverty line.
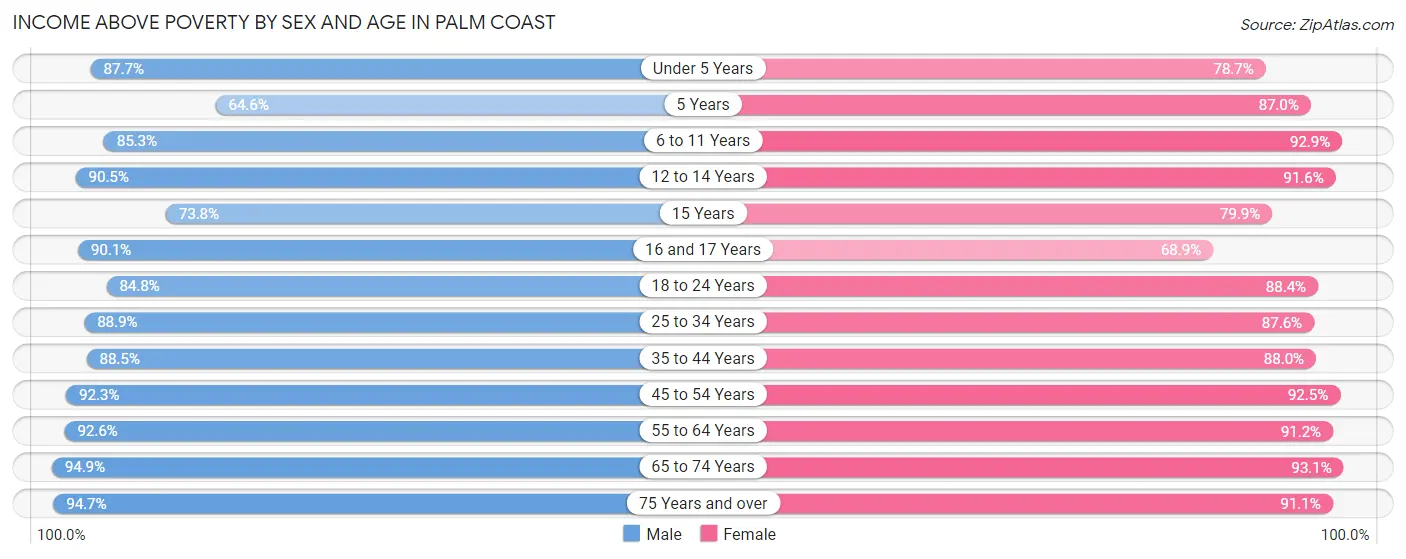
| Age Bracket | Male | Female |
| Under 5 Years | 1,294 (87.7%) | 1,267 (78.6%) |
| 5 Years | 122 (64.5%) | 423 (87.0%) |
| 6 to 11 Years | 2,523 (85.3%) | 2,560 (92.8%) |
| 12 to 14 Years | 1,538 (90.5%) | 1,228 (91.6%) |
| 15 Years | 571 (73.8%) | 365 (79.9%) |
| 16 and 17 Years | 792 (90.1%) | 662 (68.9%) |
| 18 to 24 Years | 2,516 (84.8%) | 2,568 (88.4%) |
| 25 to 34 Years | 4,007 (88.9%) | 3,567 (87.6%) |
| 35 to 44 Years | 4,149 (88.5%) | 4,429 (88.0%) |
| 45 to 54 Years | 4,493 (92.3%) | 5,319 (92.5%) |
| 55 to 64 Years | 5,467 (92.6%) | 6,839 (91.2%) |
| 65 to 74 Years | 7,064 (94.9%) | 7,571 (93.1%) |
| 75 Years and over | 5,008 (94.7%) | 5,255 (91.1%) |
| Total | 39,544 (90.6%) | 42,053 (89.9%) |
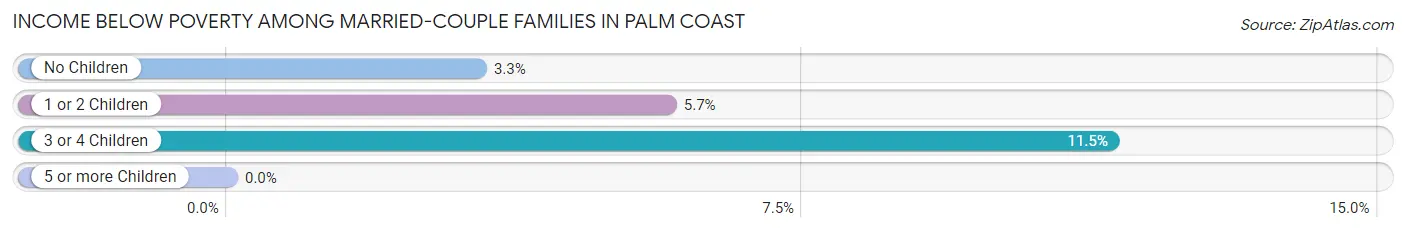
Income Below Poverty Among Married-Couple Families in Palm Coast
The poverty statistics for married-couple families in Palm Coast show that 4.2% or 884 of the total 20,884 families live below the poverty line. Families with 3 or 4 children have the highest poverty rate of 11.5%, comprising of 136 families. On the other hand, families with 5 or more children have the lowest poverty rate of 0.0%, which includes 0 families.
| Children | Above Poverty | Below Poverty |
| No Children | 14,742 (96.8%) | 495 (3.3%) |
| 1 or 2 Children | 4,159 (94.3%) | 253 (5.7%) |
| 3 or 4 Children | 1,046 (88.5%) | 136 (11.5%) |
| 5 or more Children | 53 (100.0%) | 0 (0.0%) |
| Total | 20,000 (95.8%) | 884 (4.2%) |
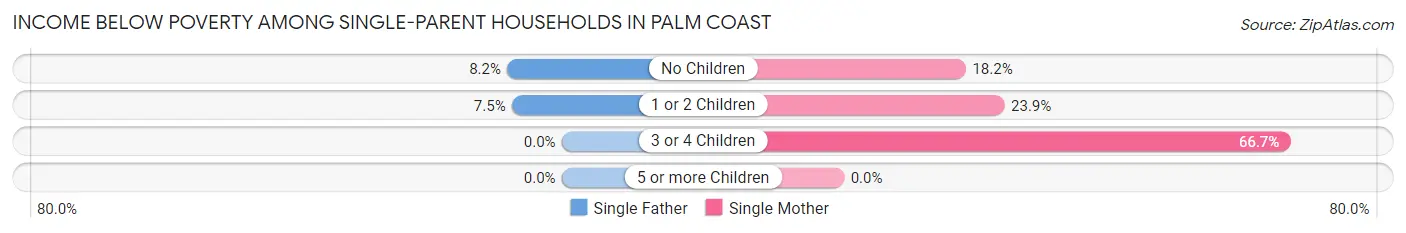
Income Below Poverty Among Single-Parent Households in Palm Coast
According to the poverty data in Palm Coast, 7.6% or 123 single-father households and 22.6% or 927 single-mother households are living below the poverty line. Among single-father households, those with no children have the highest poverty rate, with 68 households (8.2%) experiencing poverty. Likewise, among single-mother households, those with 3 or 4 children have the highest poverty rate, with 104 households (66.7%) falling below the poverty line.
| Children | Single Father | Single Mother |
| No Children | 68 (8.2%) | 378 (18.1%) |
| 1 or 2 Children | 55 (7.4%) | 445 (23.9%) |
| 3 or 4 Children | 0 (0.0%) | 104 (66.7%) |
| 5 or more Children | 0 (0.0%) | 0 (0.0%) |
| Total | 123 (7.6%) | 927 (22.6%) |
Income Below Poverty Among Married-Couple vs Single-Parent Households in Palm Coast
The poverty data for Palm Coast shows that 884 of the married-couple family households (4.2%) and 1,050 of the single-parent households (18.4%) are living below the poverty level. Within the married-couple family households, those with 3 or 4 children have the highest poverty rate, with 136 households (11.5%) falling below the poverty line. Among the single-parent households, those with 3 or 4 children have the highest poverty rate, with 104 household (51.5%) living below poverty.
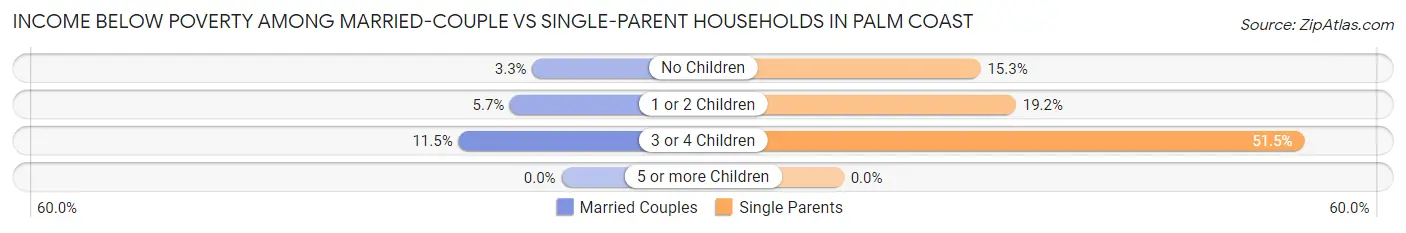
| Children | Married-Couple Families | Single-Parent Households |
| No Children | 495 (3.3%) | 446 (15.3%) |
| 1 or 2 Children | 253 (5.7%) | 500 (19.2%) |
| 3 or 4 Children | 136 (11.5%) | 104 (51.5%) |
| 5 or more Children | 0 (0.0%) | 0 (0.0%) |
| Total | 884 (4.2%) | 1,050 (18.4%) |
Employment Characteristics in Palm Coast
Employment by Class of Employer in Palm Coast
Among the 37,393 employed individuals in Palm Coast, private company employees (25,326 | 67.7%), local government employees (3,110 | 8.3%), and not-for-profit organizations (2,729 | 7.3%) make up the most common classes of employment.
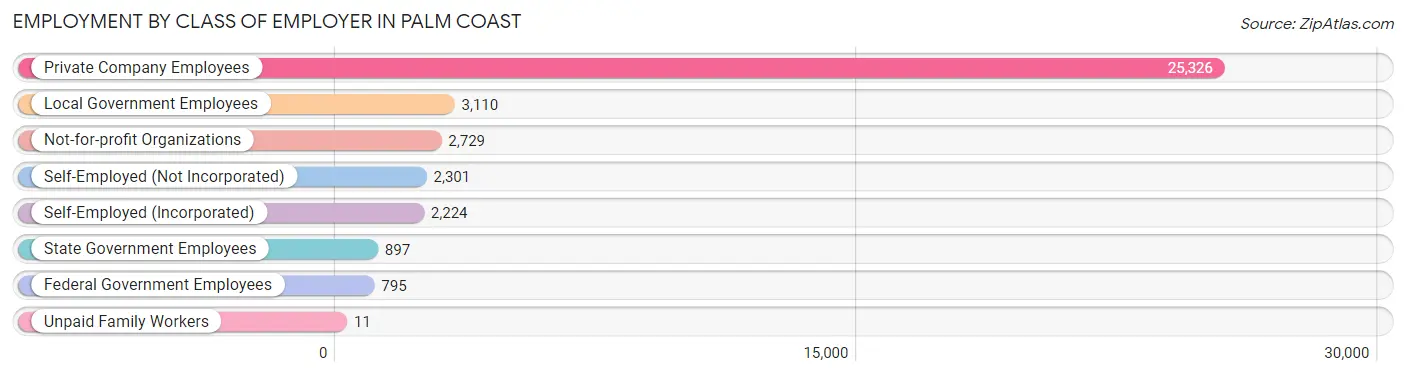
| Employer Class | # Employees | % Employees |
| Private Company Employees | 25,326 | 67.7% |
| Self-Employed (Incorporated) | 2,224 | 5.9% |
| Self-Employed (Not Incorporated) | 2,301 | 6.1% |
| Not-for-profit Organizations | 2,729 | 7.3% |
| Local Government Employees | 3,110 | 8.3% |
| State Government Employees | 897 | 2.4% |
| Federal Government Employees | 795 | 2.1% |
| Unpaid Family Workers | 11 | 0.0% |
| Total | 37,393 | 100.0% |
Employment Status by Age in Palm Coast
According to the labor force statistics for Palm Coast, out of the total population over 16 years of age (76,909), 52.2% or 40,146 individuals are in the labor force, with 4.1% or 1,646 of them unemployed. The age group with the highest labor force participation rate is 30 to 34 years, with 91.1% or 3,851 individuals in the labor force. Within the labor force, the 75 years and over age range has the highest percentage of unemployed individuals, with 12.0% or 63 of them being unemployed.
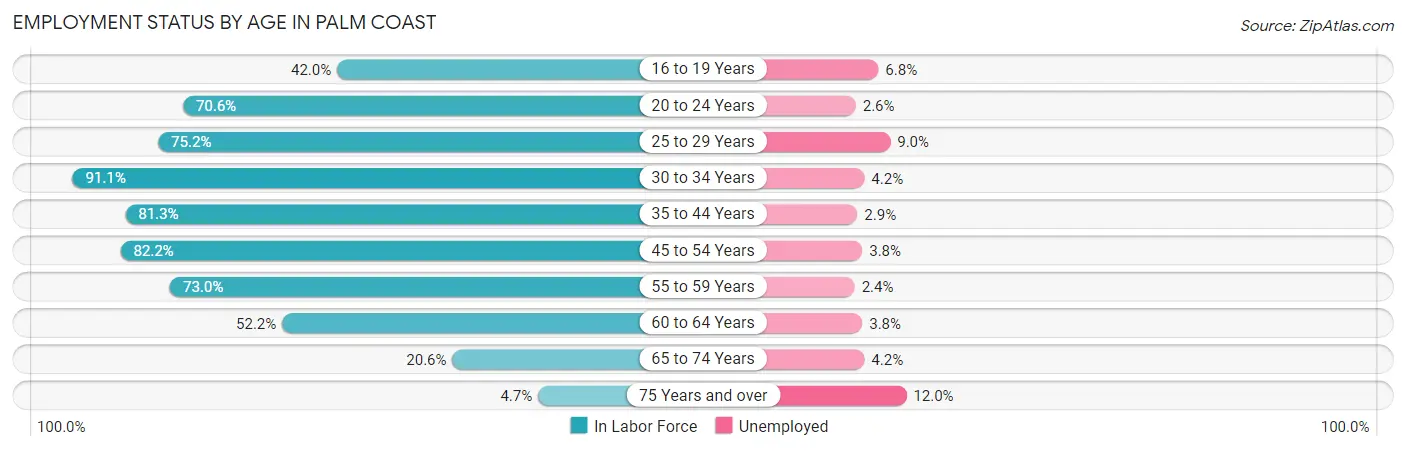
| Age Bracket | In Labor Force | Unemployed |
| 16 to 19 Years | 1,490 (42.0%) | 101 (6.8%) |
| 20 to 24 Years | 2,944 (70.6%) | 77 (2.6%) |
| 25 to 29 Years | 3,271 (75.2%) | 294 (9.0%) |
| 30 to 34 Years | 3,851 (91.1%) | 162 (4.2%) |
| 35 to 44 Years | 7,903 (81.3%) | 229 (2.9%) |
| 45 to 54 Years | 8,736 (82.2%) | 332 (3.8%) |
| 55 to 59 Years | 4,283 (73.0%) | 103 (2.4%) |
| 60 to 64 Years | 3,936 (52.2%) | 150 (3.8%) |
| 65 to 74 Years | 3,225 (20.6%) | 135 (4.2%) |
| 75 Years and over | 527 (4.7%) | 63 (12.0%) |
| Total | 40,146 (52.2%) | 1,646 (4.1%) |
Employment Status by Educational Attainment in Palm Coast
According to labor force statistics for Palm Coast, 75.5% of individuals (31,962) out of the total population between 25 and 64 years of age (42,334) are in the labor force, with 4.0% or 1,278 of them being unemployed. The group with the highest labor force participation rate are those with the educational attainment of bachelor's degree or higher, with 78.2% or 9,120 individuals in the labor force. Within the labor force, individuals with college / associate degree education have the highest percentage of unemployment, with 5.0% or 590 of them being unemployed.
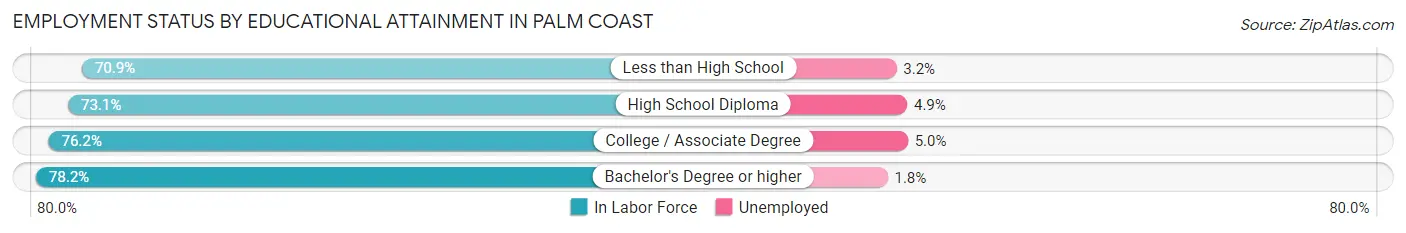
| Educational Attainment | In Labor Force | Unemployed |
| Less than High School | 1,759 (70.9%) | 79 (3.2%) |
| High School Diploma | 9,286 (73.1%) | 622 (4.9%) |
| College / Associate Degree | 11,801 (76.2%) | 774 (5.0%) |
| Bachelor's Degree or higher | 9,120 (78.2%) | 210 (1.8%) |
| Total | 31,962 (75.5%) | 1,693 (4.0%) |
Employment Occupations by Sex in Palm Coast
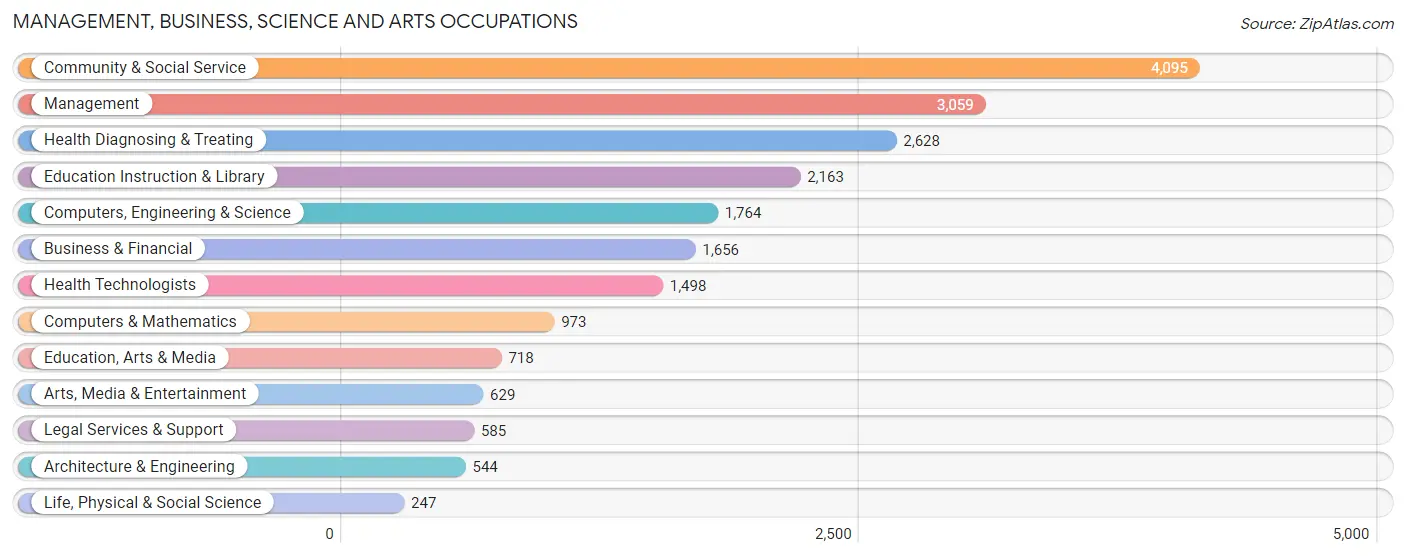
Management, Business, Science and Arts Occupations
The most common Management, Business, Science and Arts occupations in Palm Coast are Community & Social Service (4,095 | 10.7%), Management (3,059 | 8.0%), Health Diagnosing & Treating (2,628 | 6.8%), Education Instruction & Library (2,163 | 5.6%), and Computers, Engineering & Science (1,764 | 4.6%).
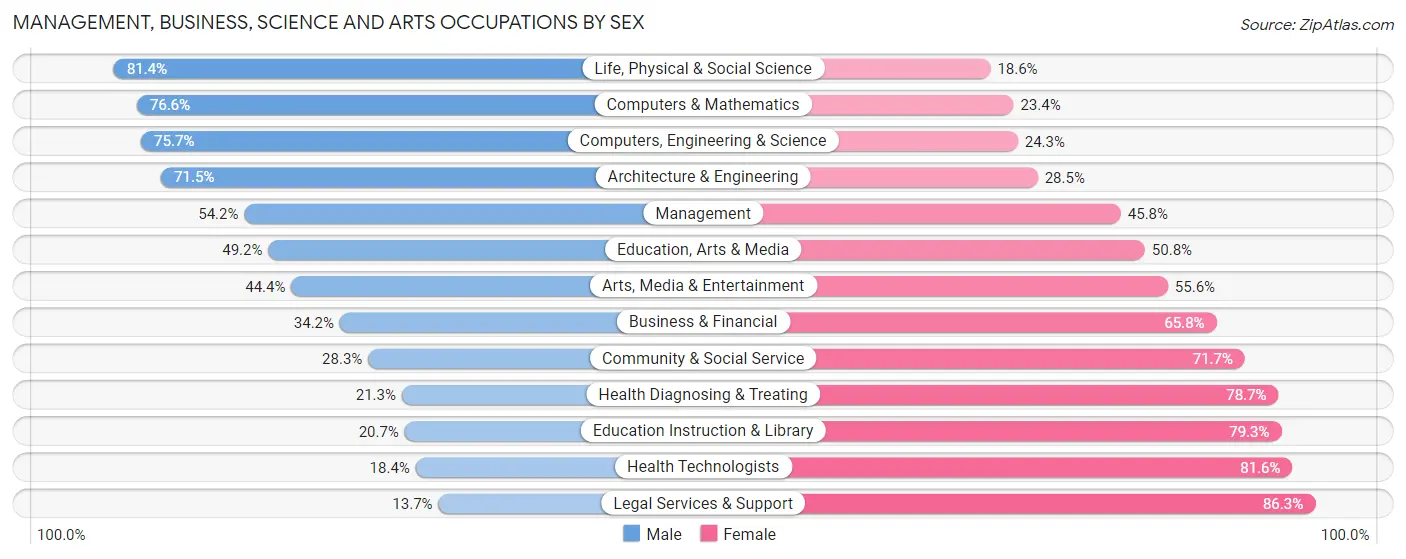
Management, Business, Science and Arts Occupations by Sex
Within the Management, Business, Science and Arts occupations in Palm Coast, the most male-oriented occupations are Life, Physical & Social Science (81.4%), Computers & Mathematics (76.6%), and Computers, Engineering & Science (75.7%), while the most female-oriented occupations are Legal Services & Support (86.3%), Health Technologists (81.6%), and Education Instruction & Library (79.3%).
| Occupation | Male | Female |
| Management | 1,657 (54.2%) | 1,402 (45.8%) |
| Business & Financial | 567 (34.2%) | 1,089 (65.8%) |
| Computers, Engineering & Science | 1,335 (75.7%) | 429 (24.3%) |
| Computers & Mathematics | 745 (76.6%) | 228 (23.4%) |
| Architecture & Engineering | 389 (71.5%) | 155 (28.5%) |
| Life, Physical & Social Science | 201 (81.4%) | 46 (18.6%) |
| Community & Social Service | 1,160 (28.3%) | 2,935 (71.7%) |
| Education, Arts & Media | 353 (49.2%) | 365 (50.8%) |
| Legal Services & Support | 80 (13.7%) | 505 (86.3%) |
| Education Instruction & Library | 448 (20.7%) | 1,715 (79.3%) |
| Arts, Media & Entertainment | 279 (44.4%) | 350 (55.6%) |
| Health Diagnosing & Treating | 560 (21.3%) | 2,068 (78.7%) |
| Health Technologists | 276 (18.4%) | 1,222 (81.6%) |
| Total (Category) | 5,279 (40.0%) | 7,923 (60.0%) |
| Total (Overall) | 19,447 (50.6%) | 18,971 (49.4%) |
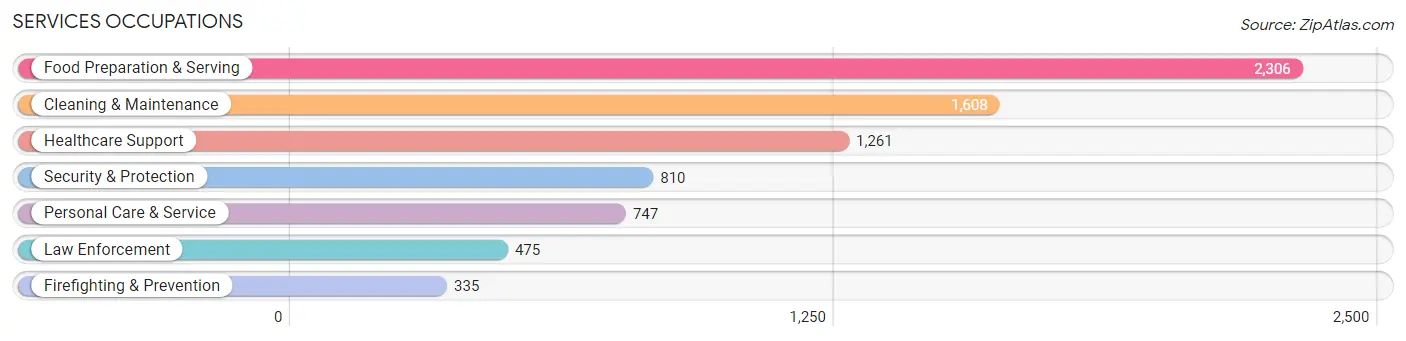
Services Occupations
The most common Services occupations in Palm Coast are Food Preparation & Serving (2,306 | 6.0%), Cleaning & Maintenance (1,608 | 4.2%), Healthcare Support (1,261 | 3.3%), Security & Protection (810 | 2.1%), and Personal Care & Service (747 | 1.9%).
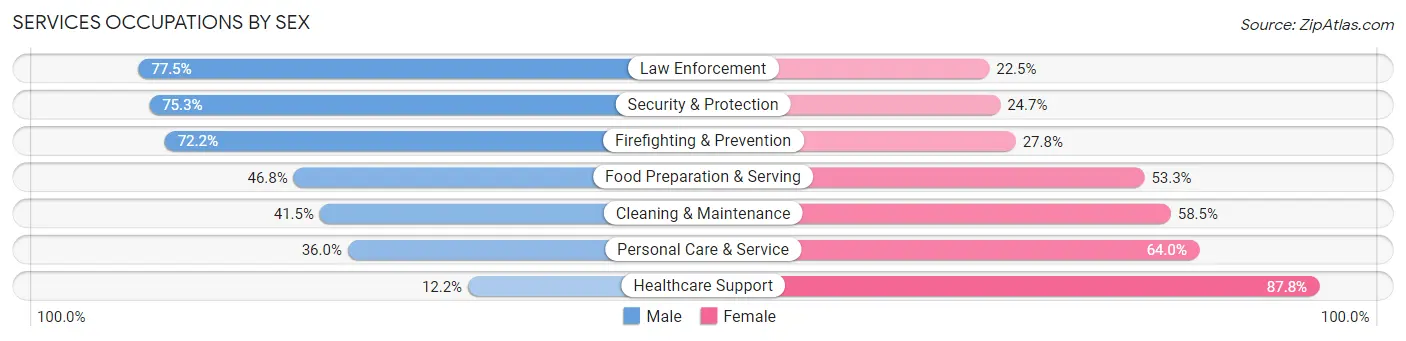
Services Occupations by Sex
Within the Services occupations in Palm Coast, the most male-oriented occupations are Law Enforcement (77.5%), Security & Protection (75.3%), and Firefighting & Prevention (72.2%), while the most female-oriented occupations are Healthcare Support (87.8%), Personal Care & Service (64.0%), and Cleaning & Maintenance (58.5%).
| Occupation | Male | Female |
| Healthcare Support | 154 (12.2%) | 1,107 (87.8%) |
| Security & Protection | 610 (75.3%) | 200 (24.7%) |
| Firefighting & Prevention | 242 (72.2%) | 93 (27.8%) |
| Law Enforcement | 368 (77.5%) | 107 (22.5%) |
| Food Preparation & Serving | 1,078 (46.8%) | 1,228 (53.2%) |
| Cleaning & Maintenance | 668 (41.5%) | 940 (58.5%) |
| Personal Care & Service | 269 (36.0%) | 478 (64.0%) |
| Total (Category) | 2,779 (41.3%) | 3,953 (58.7%) |
| Total (Overall) | 19,447 (50.6%) | 18,971 (49.4%) |
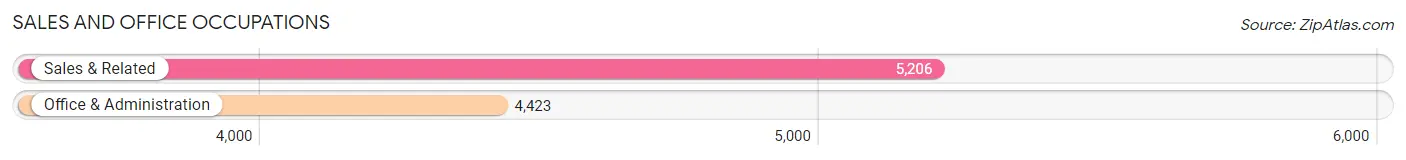
Sales and Office Occupations
The most common Sales and Office occupations in Palm Coast are Sales & Related (5,206 | 13.6%), and Office & Administration (4,423 | 11.5%).
Sales and Office Occupations by Sex
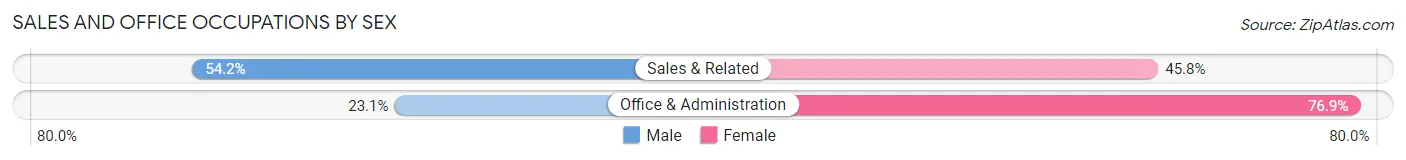
| Occupation | Male | Female |
| Sales & Related | 2,821 (54.2%) | 2,385 (45.8%) |
| Office & Administration | 1,023 (23.1%) | 3,400 (76.9%) |
| Total (Category) | 3,844 (39.9%) | 5,785 (60.1%) |
| Total (Overall) | 19,447 (50.6%) | 18,971 (49.4%) |
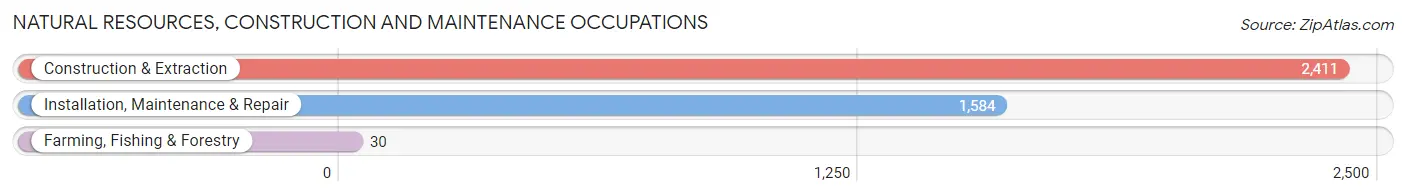
Natural Resources, Construction and Maintenance Occupations
The most common Natural Resources, Construction and Maintenance occupations in Palm Coast are Construction & Extraction (2,411 | 6.3%), Installation, Maintenance & Repair (1,584 | 4.1%), and Farming, Fishing & Forestry (30 | 0.1%).
Natural Resources, Construction and Maintenance Occupations by Sex
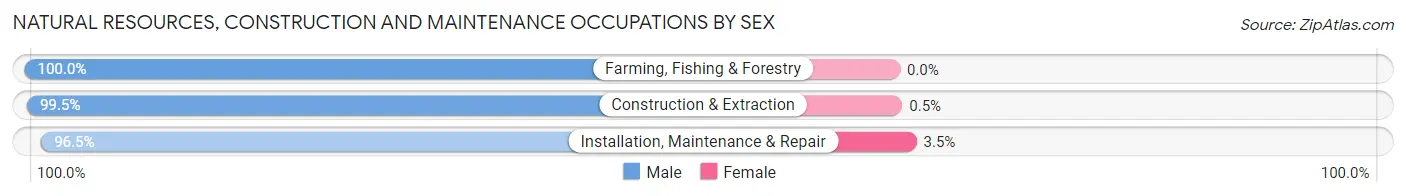
| Occupation | Male | Female |
| Farming, Fishing & Forestry | 30 (100.0%) | 0 (0.0%) |
| Construction & Extraction | 2,399 (99.5%) | 12 (0.5%) |
| Installation, Maintenance & Repair | 1,529 (96.5%) | 55 (3.5%) |
| Total (Category) | 3,958 (98.3%) | 67 (1.7%) |
| Total (Overall) | 19,447 (50.6%) | 18,971 (49.4%) |
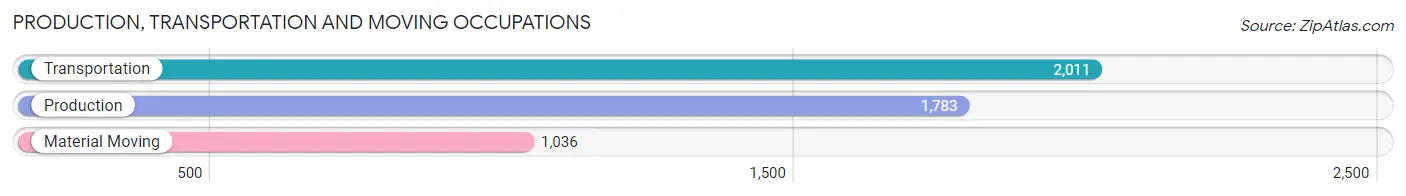
Production, Transportation and Moving Occupations
The most common Production, Transportation and Moving occupations in Palm Coast are Transportation (2,011 | 5.2%), Production (1,783 | 4.6%), and Material Moving (1,036 | 2.7%).
Production, Transportation and Moving Occupations by Sex
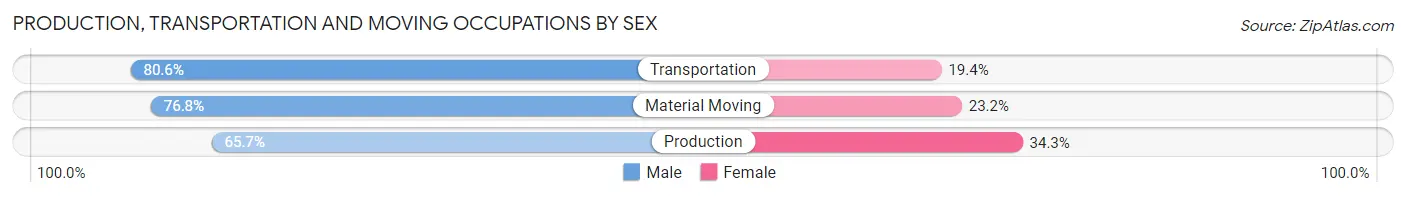
| Occupation | Male | Female |
| Production | 1,171 (65.7%) | 612 (34.3%) |
| Transportation | 1,620 (80.6%) | 391 (19.4%) |
| Material Moving | 796 (76.8%) | 240 (23.2%) |
| Total (Category) | 3,587 (74.3%) | 1,243 (25.7%) |
| Total (Overall) | 19,447 (50.6%) | 18,971 (49.4%) |
Employment Industries by Sex in Palm Coast
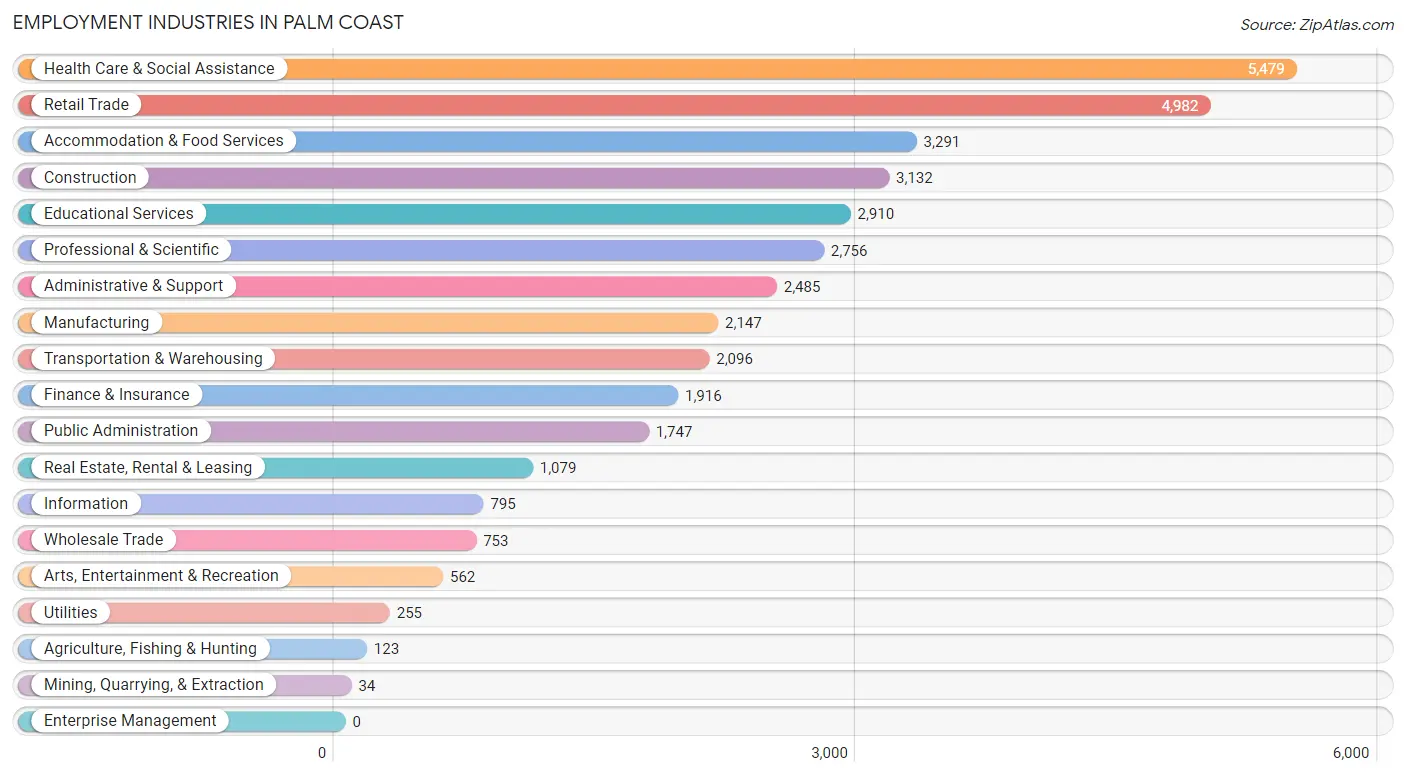
Employment Industries in Palm Coast
The major employment industries in Palm Coast include Health Care & Social Assistance (5,479 | 14.3%), Retail Trade (4,982 | 13.0%), Accommodation & Food Services (3,291 | 8.6%), Construction (3,132 | 8.2%), and Educational Services (2,910 | 7.6%).
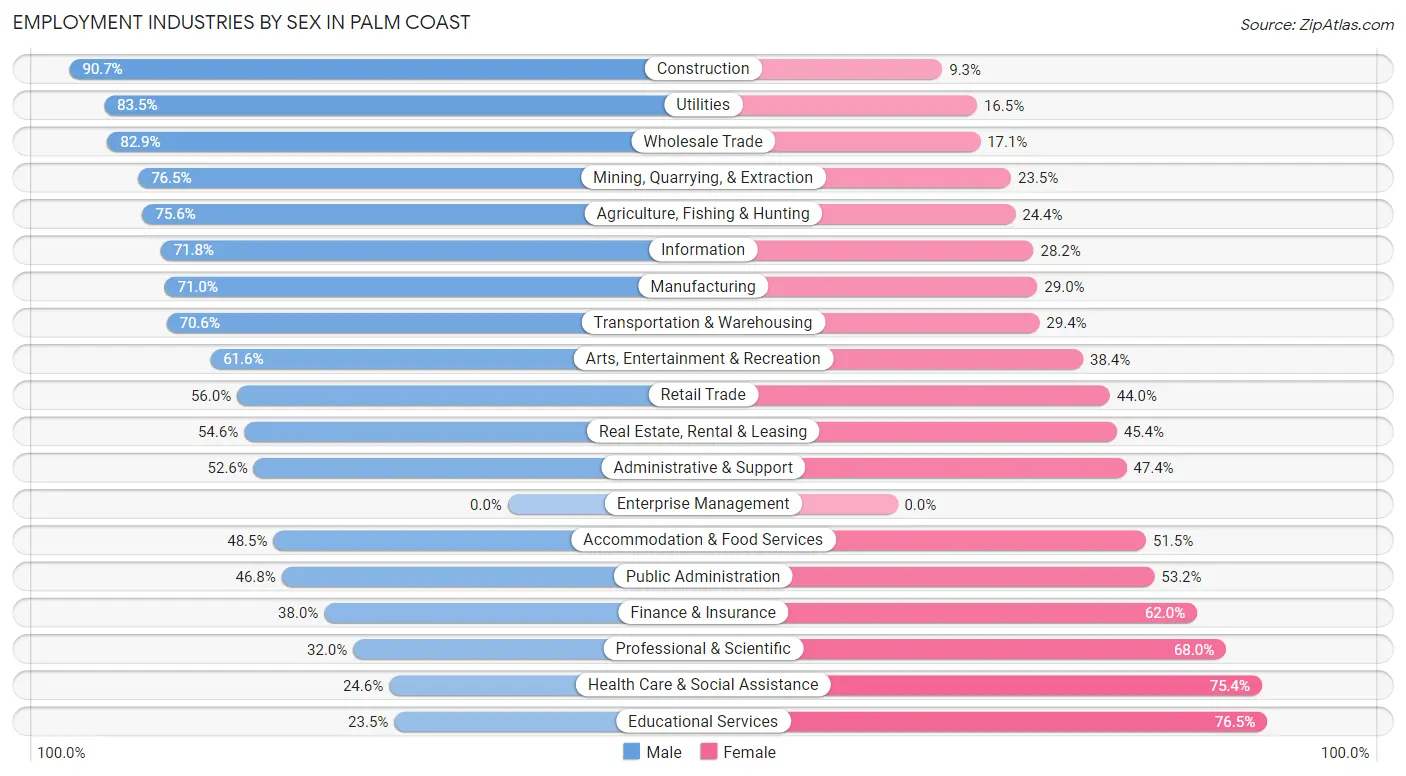
Employment Industries by Sex in Palm Coast
The Palm Coast industries that see more men than women are Construction (90.7%), Utilities (83.5%), and Wholesale Trade (82.9%), whereas the industries that tend to have a higher number of women are Educational Services (76.5%), Health Care & Social Assistance (75.4%), and Professional & Scientific (68.0%).
| Industry | Male | Female |
| Agriculture, Fishing & Hunting | 93 (75.6%) | 30 (24.4%) |
| Mining, Quarrying, & Extraction | 26 (76.5%) | 8 (23.5%) |
| Construction | 2,841 (90.7%) | 291 (9.3%) |
| Manufacturing | 1,525 (71.0%) | 622 (29.0%) |
| Wholesale Trade | 624 (82.9%) | 129 (17.1%) |
| Retail Trade | 2,792 (56.0%) | 2,190 (44.0%) |
| Transportation & Warehousing | 1,480 (70.6%) | 616 (29.4%) |
| Utilities | 213 (83.5%) | 42 (16.5%) |
| Information | 571 (71.8%) | 224 (28.2%) |
| Finance & Insurance | 728 (38.0%) | 1,188 (62.0%) |
| Real Estate, Rental & Leasing | 589 (54.6%) | 490 (45.4%) |
| Professional & Scientific | 882 (32.0%) | 1,874 (68.0%) |
| Enterprise Management | 0 (0.0%) | 0 (0.0%) |
| Administrative & Support | 1,307 (52.6%) | 1,178 (47.4%) |
| Educational Services | 684 (23.5%) | 2,226 (76.5%) |
| Health Care & Social Assistance | 1,347 (24.6%) | 4,132 (75.4%) |
| Arts, Entertainment & Recreation | 346 (61.6%) | 216 (38.4%) |
| Accommodation & Food Services | 1,597 (48.5%) | 1,694 (51.5%) |
| Public Administration | 818 (46.8%) | 929 (53.2%) |
| Total | 19,447 (50.6%) | 18,971 (49.4%) |
Education in Palm Coast
School Enrollment in Palm Coast
The most common levels of schooling among the 18,392 students in Palm Coast are middle school (4,518 | 24.6%), high school (4,004 | 21.8%), and elementary school (3,818 | 20.8%).
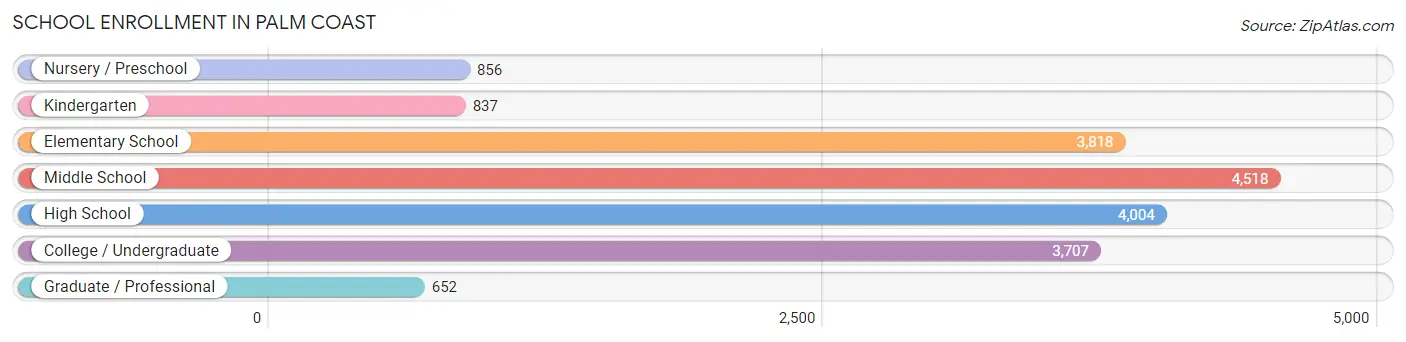
| School Level | # Students | % Students |
| Nursery / Preschool | 856 | 4.6% |
| Kindergarten | 837 | 4.5% |
| Elementary School | 3,818 | 20.8% |
| Middle School | 4,518 | 24.6% |
| High School | 4,004 | 21.8% |
| College / Undergraduate | 3,707 | 20.2% |
| Graduate / Professional | 652 | 3.5% |
| Total | 18,392 | 100.0% |
School Enrollment by Age by Funding Source in Palm Coast
Out of a total of 18,392 students who are enrolled in schools in Palm Coast, 2,759 (15.0%) attend a private institution, while the remaining 15,633 (85.0%) are enrolled in public schools. The age group of 35 years and over has the highest likelihood of being enrolled in private schools, with 475 (31.5% in the age bracket) enrolled. Conversely, the age group of 15 to 17 year olds has the lowest likelihood of being enrolled in a private school, with 2,866 (93.9% in the age bracket) attending a public institution.
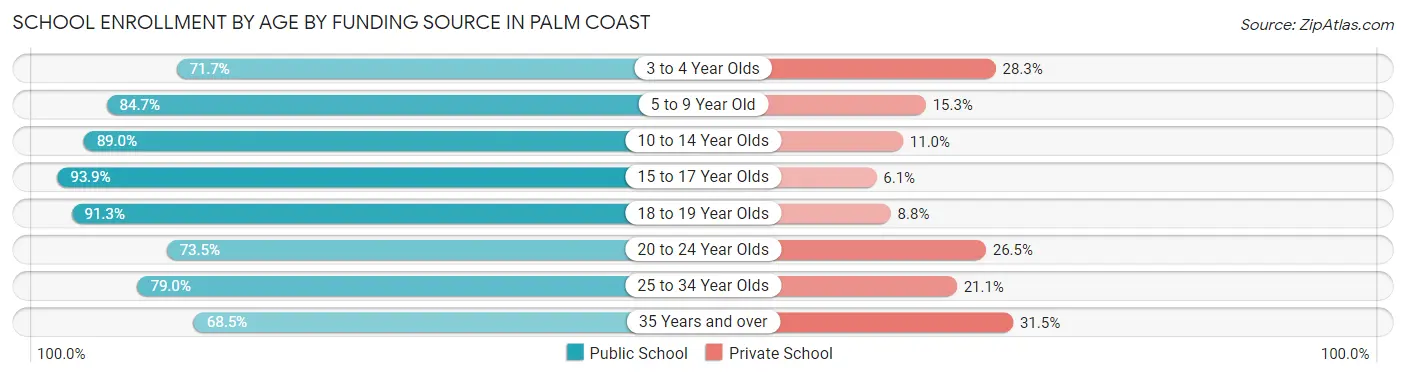
| Age Bracket | Public School | Private School |
| 3 to 4 Year Olds | 474 (71.7%) | 187 (28.3%) |
| 5 to 9 Year Old | 3,572 (84.7%) | 644 (15.3%) |
| 10 to 14 Year Olds | 4,750 (89.0%) | 588 (11.0%) |
| 15 to 17 Year Olds | 2,866 (93.9%) | 186 (6.1%) |
| 18 to 19 Year Olds | 1,157 (91.2%) | 111 (8.7%) |
| 20 to 24 Year Olds | 1,072 (73.5%) | 386 (26.5%) |
| 25 to 34 Year Olds | 705 (78.9%) | 188 (21.0%) |
| 35 Years and over | 1,031 (68.5%) | 475 (31.5%) |
| Total | 15,633 (85.0%) | 2,759 (15.0%) |
Educational Attainment by Field of Study in Palm Coast
Business (4,119 | 20.5%), education (2,700 | 13.5%), science & technology (2,164 | 10.8%), engineering (1,962 | 9.8%), and arts & humanities (1,576 | 7.9%) are the most common fields of study among 20,051 individuals in Palm Coast who have obtained a bachelor's degree or higher.
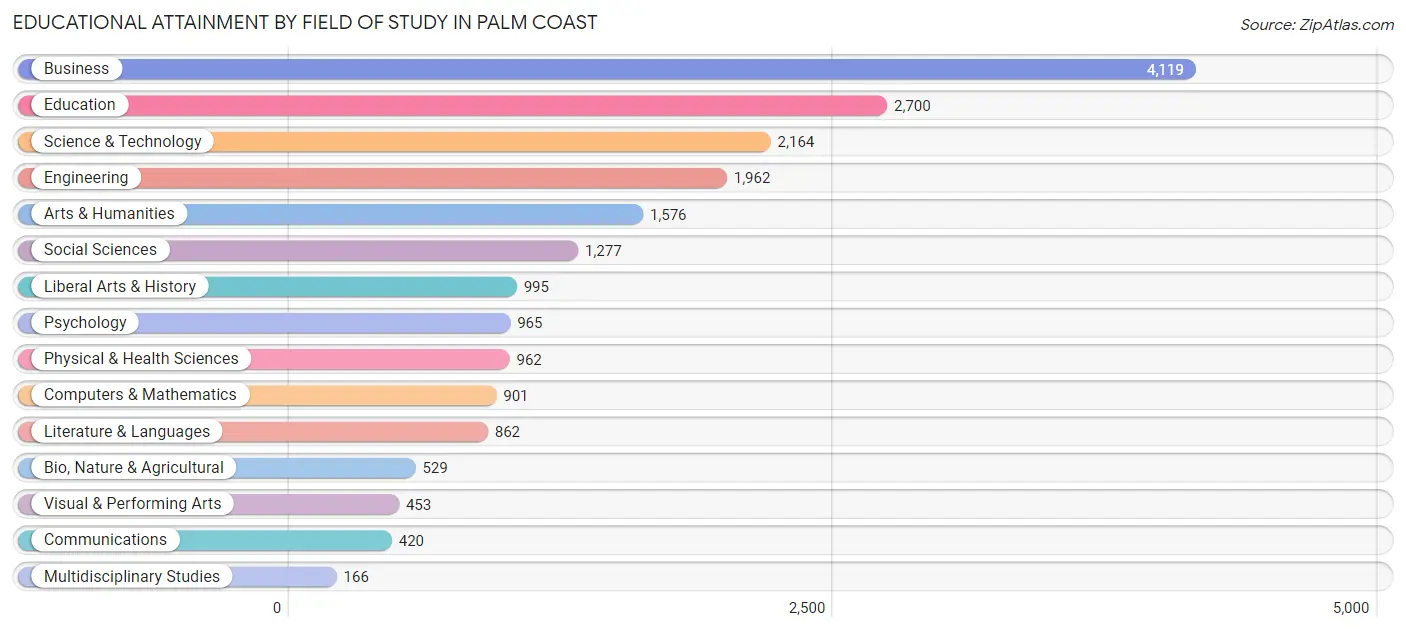
| Field of Study | # Graduates | % Graduates |
| Computers & Mathematics | 901 | 4.5% |
| Bio, Nature & Agricultural | 529 | 2.6% |
| Physical & Health Sciences | 962 | 4.8% |
| Psychology | 965 | 4.8% |
| Social Sciences | 1,277 | 6.4% |
| Engineering | 1,962 | 9.8% |
| Multidisciplinary Studies | 166 | 0.8% |
| Science & Technology | 2,164 | 10.8% |
| Business | 4,119 | 20.5% |
| Education | 2,700 | 13.5% |
| Literature & Languages | 862 | 4.3% |
| Liberal Arts & History | 995 | 5.0% |
| Visual & Performing Arts | 453 | 2.3% |
| Communications | 420 | 2.1% |
| Arts & Humanities | 1,576 | 7.9% |
| Total | 20,051 | 100.0% |
Transportation & Commute in Palm Coast
Vehicle Availability by Sex in Palm Coast
The most prevalent vehicle ownership categories in Palm Coast are males with 2 vehicles (9,010, accounting for 47.6%) and females with 2 vehicles (9,192, making up 48.8%).
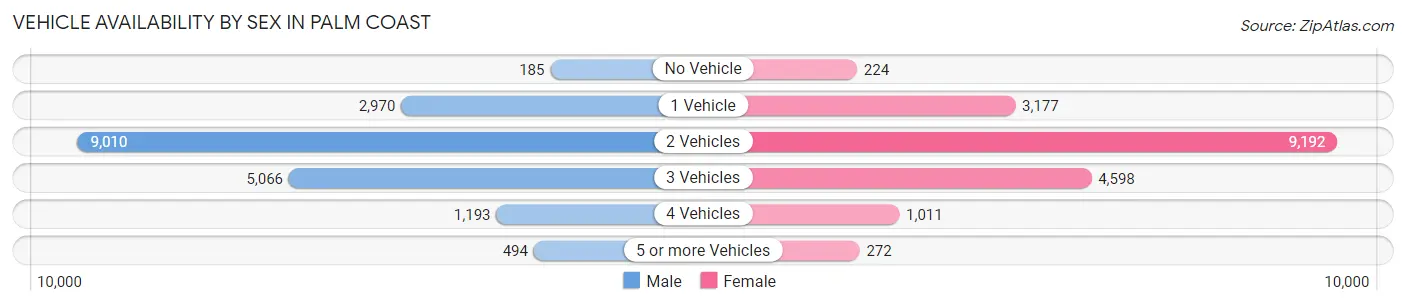
| Vehicles Available | Male | Female |
| No Vehicle | 185 (1.0%) | 224 (1.2%) |
| 1 Vehicle | 2,970 (15.7%) | 3,177 (17.2%) |
| 2 Vehicles | 9,010 (47.6%) | 9,192 (49.8%) |
| 3 Vehicles | 5,066 (26.8%) | 4,598 (24.9%) |
| 4 Vehicles | 1,193 (6.3%) | 1,011 (5.5%) |
| 5 or more Vehicles | 494 (2.6%) | 272 (1.5%) |
| Total | 18,918 (100.0%) | 18,474 (100.0%) |
Commute Time in Palm Coast
The most frequently occuring commute durations in Palm Coast are 10 to 14 minutes (6,006 commuters, 18.5%), 15 to 19 minutes (5,570 commuters, 17.1%), and 30 to 34 minutes (4,822 commuters, 14.8%).
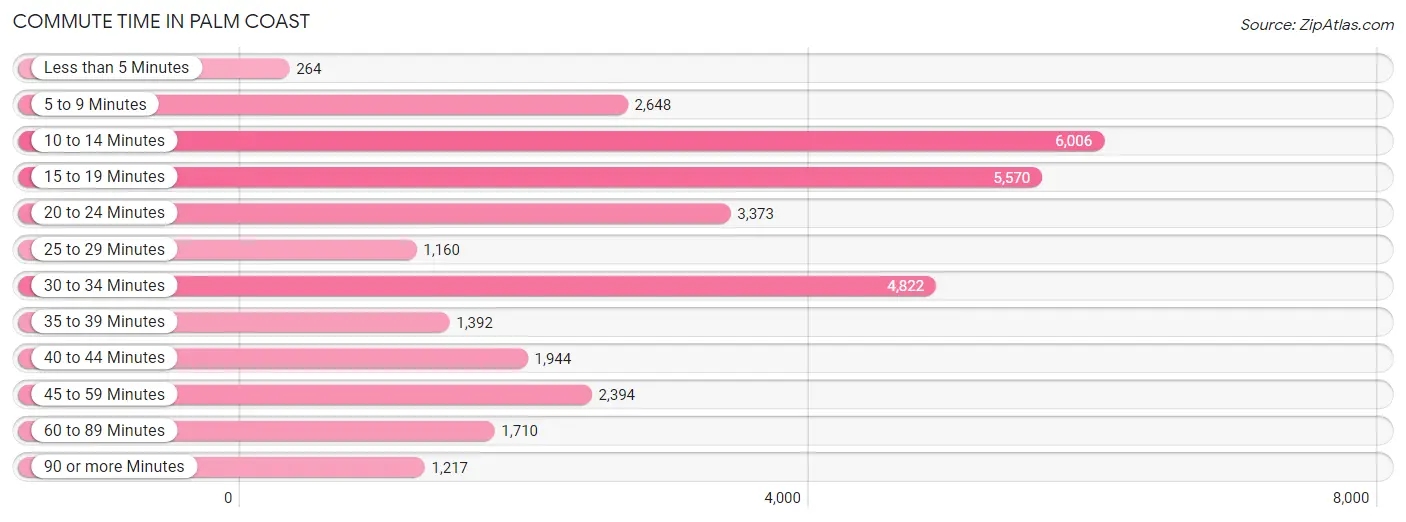
| Commute Time | # Commuters | % Commuters |
| Less than 5 Minutes | 264 | 0.8% |
| 5 to 9 Minutes | 2,648 | 8.2% |
| 10 to 14 Minutes | 6,006 | 18.5% |
| 15 to 19 Minutes | 5,570 | 17.1% |
| 20 to 24 Minutes | 3,373 | 10.4% |
| 25 to 29 Minutes | 1,160 | 3.6% |
| 30 to 34 Minutes | 4,822 | 14.8% |
| 35 to 39 Minutes | 1,392 | 4.3% |
| 40 to 44 Minutes | 1,944 | 6.0% |
| 45 to 59 Minutes | 2,394 | 7.4% |
| 60 to 89 Minutes | 1,710 | 5.3% |
| 90 or more Minutes | 1,217 | 3.7% |
Commute Time by Sex in Palm Coast
The most common commute times in Palm Coast are 10 to 14 minutes (2,711 commuters, 16.2%) for males and 10 to 14 minutes (3,295 commuters, 20.9%) for females.
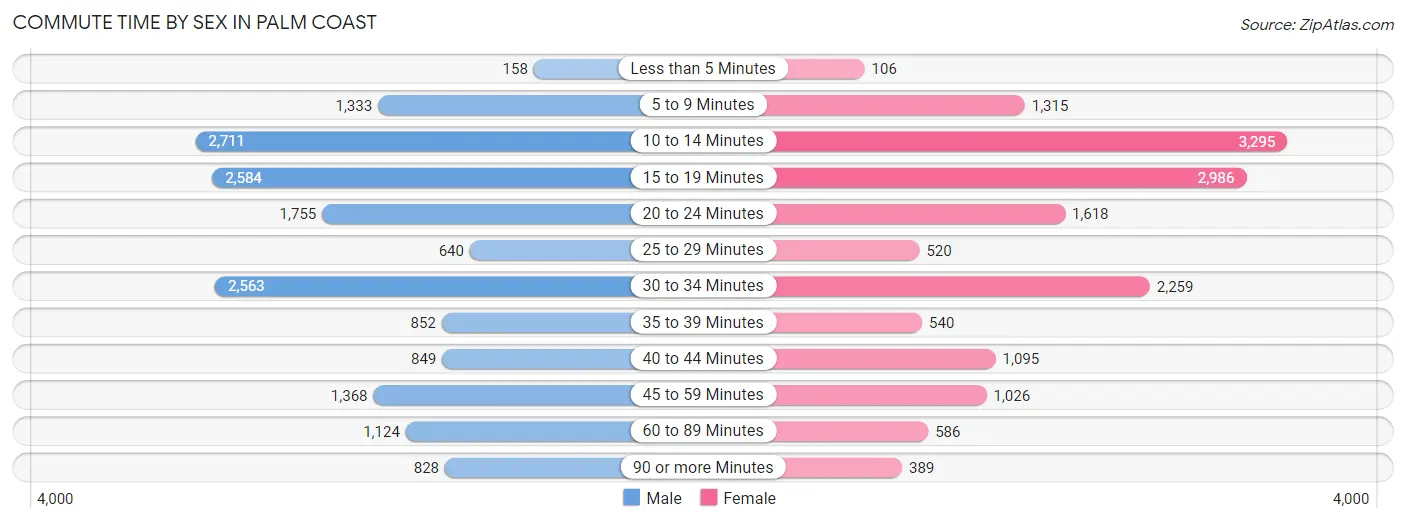
| Commute Time | Male | Female |
| Less than 5 Minutes | 158 (0.9%) | 106 (0.7%) |
| 5 to 9 Minutes | 1,333 (8.0%) | 1,315 (8.4%) |
| 10 to 14 Minutes | 2,711 (16.2%) | 3,295 (20.9%) |
| 15 to 19 Minutes | 2,584 (15.4%) | 2,986 (19.0%) |
| 20 to 24 Minutes | 1,755 (10.5%) | 1,618 (10.3%) |
| 25 to 29 Minutes | 640 (3.8%) | 520 (3.3%) |
| 30 to 34 Minutes | 2,563 (15.3%) | 2,259 (14.4%) |
| 35 to 39 Minutes | 852 (5.1%) | 540 (3.4%) |
| 40 to 44 Minutes | 849 (5.1%) | 1,095 (7.0%) |
| 45 to 59 Minutes | 1,368 (8.2%) | 1,026 (6.5%) |
| 60 to 89 Minutes | 1,124 (6.7%) | 586 (3.7%) |
| 90 or more Minutes | 828 (4.9%) | 389 (2.5%) |
Time of Departure to Work by Sex in Palm Coast
The most frequent times of departure to work in Palm Coast are 8:00 AM to 8:29 AM (4,191, 25.0%) for males and 8:00 AM to 8:29 AM (3,255, 20.7%) for females.
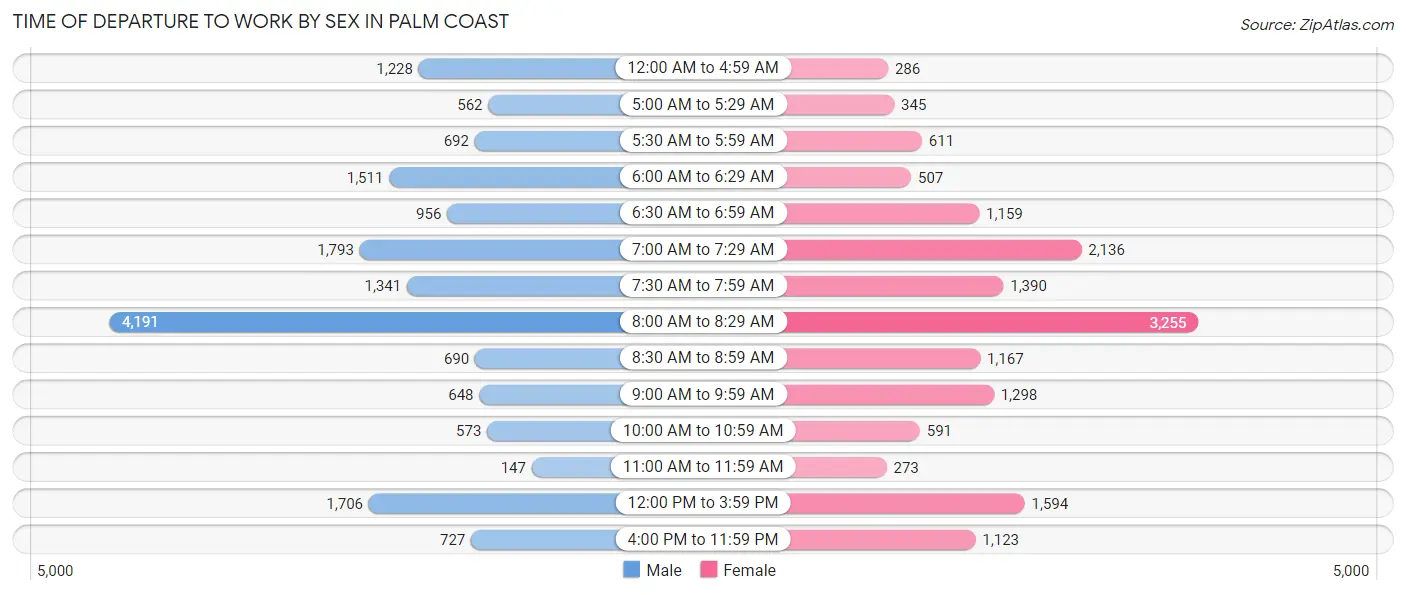
| Time of Departure | Male | Female |
| 12:00 AM to 4:59 AM | 1,228 (7.3%) | 286 (1.8%) |
| 5:00 AM to 5:29 AM | 562 (3.4%) | 345 (2.2%) |
| 5:30 AM to 5:59 AM | 692 (4.1%) | 611 (3.9%) |
| 6:00 AM to 6:29 AM | 1,511 (9.0%) | 507 (3.2%) |
| 6:30 AM to 6:59 AM | 956 (5.7%) | 1,159 (7.4%) |
| 7:00 AM to 7:29 AM | 1,793 (10.7%) | 2,136 (13.6%) |
| 7:30 AM to 7:59 AM | 1,341 (8.0%) | 1,390 (8.8%) |
| 8:00 AM to 8:29 AM | 4,191 (25.0%) | 3,255 (20.7%) |
| 8:30 AM to 8:59 AM | 690 (4.1%) | 1,167 (7.4%) |
| 9:00 AM to 9:59 AM | 648 (3.9%) | 1,298 (8.3%) |
| 10:00 AM to 10:59 AM | 573 (3.4%) | 591 (3.8%) |
| 11:00 AM to 11:59 AM | 147 (0.9%) | 273 (1.7%) |
| 12:00 PM to 3:59 PM | 1,706 (10.2%) | 1,594 (10.1%) |
| 4:00 PM to 11:59 PM | 727 (4.3%) | 1,123 (7.1%) |
| Total | 16,765 (100.0%) | 15,735 (100.0%) |
Housing Occupancy in Palm Coast
Occupancy by Ownership in Palm Coast
Of the total 35,961 dwellings in Palm Coast, owner-occupied units account for 28,001 (77.9%), while renter-occupied units make up 7,960 (22.1%).
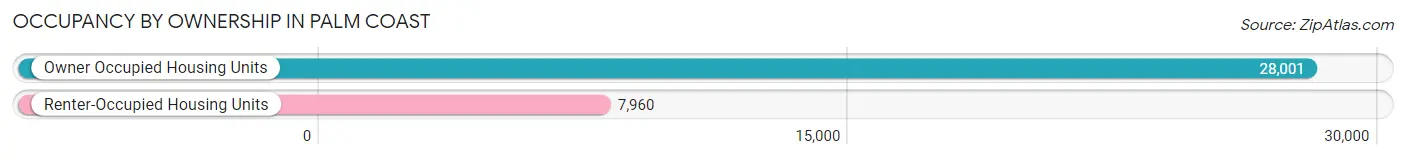
| Occupancy | # Housing Units | % Housing Units |
| Owner Occupied Housing Units | 28,001 | 77.9% |
| Renter-Occupied Housing Units | 7,960 | 22.1% |
| Total Occupied Housing Units | 35,961 | 100.0% |
Occupancy by Household Size in Palm Coast
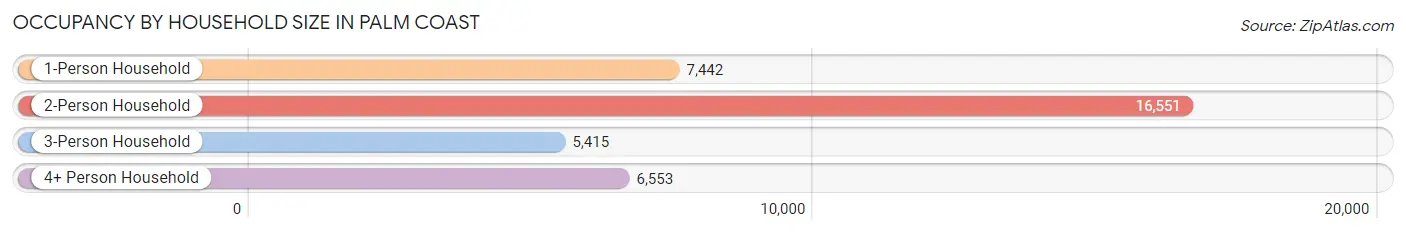
| Household Size | # Housing Units | % Housing Units |
| 1-Person Household | 7,442 | 20.7% |
| 2-Person Household | 16,551 | 46.0% |
| 3-Person Household | 5,415 | 15.1% |
| 4+ Person Household | 6,553 | 18.2% |
| Total Housing Units | 35,961 | 100.0% |
Occupancy by Ownership by Household Size in Palm Coast
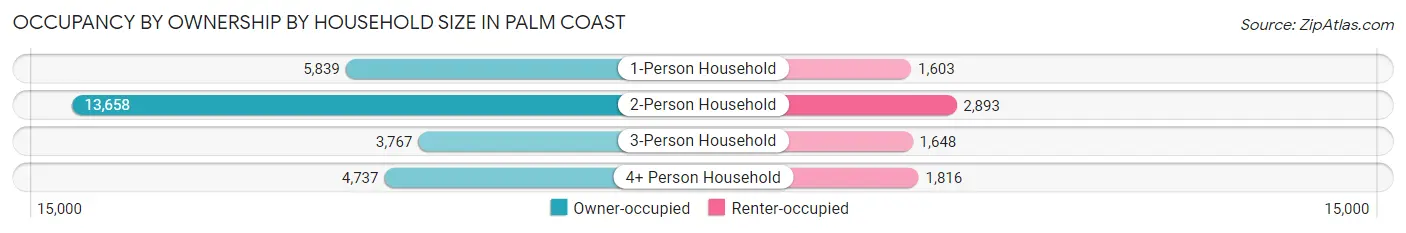
| Household Size | Owner-occupied | Renter-occupied |
| 1-Person Household | 5,839 (78.5%) | 1,603 (21.5%) |
| 2-Person Household | 13,658 (82.5%) | 2,893 (17.5%) |
| 3-Person Household | 3,767 (69.6%) | 1,648 (30.4%) |
| 4+ Person Household | 4,737 (72.3%) | 1,816 (27.7%) |
| Total Housing Units | 28,001 (77.9%) | 7,960 (22.1%) |
Occupancy by Educational Attainment in Palm Coast
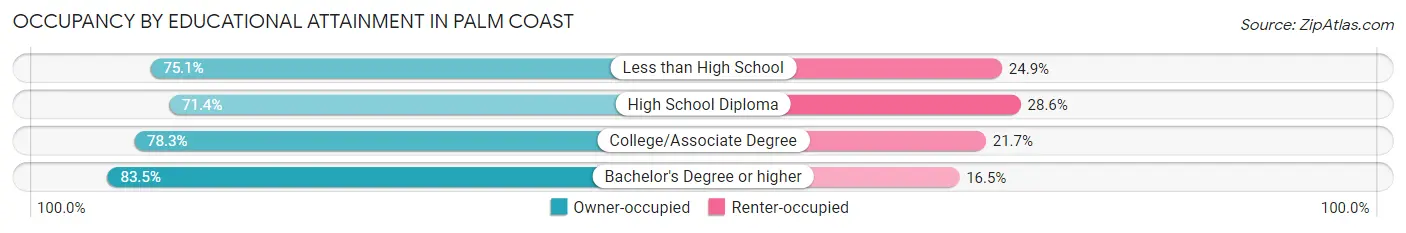
| Household Size | Owner-occupied | Renter-occupied |
| Less than High School | 1,858 (75.1%) | 617 (24.9%) |
| High School Diploma | 6,706 (71.4%) | 2,691 (28.6%) |
| College/Associate Degree | 10,214 (78.3%) | 2,835 (21.7%) |
| Bachelor's Degree or higher | 9,223 (83.5%) | 1,817 (16.5%) |
Occupancy by Age of Householder in Palm Coast
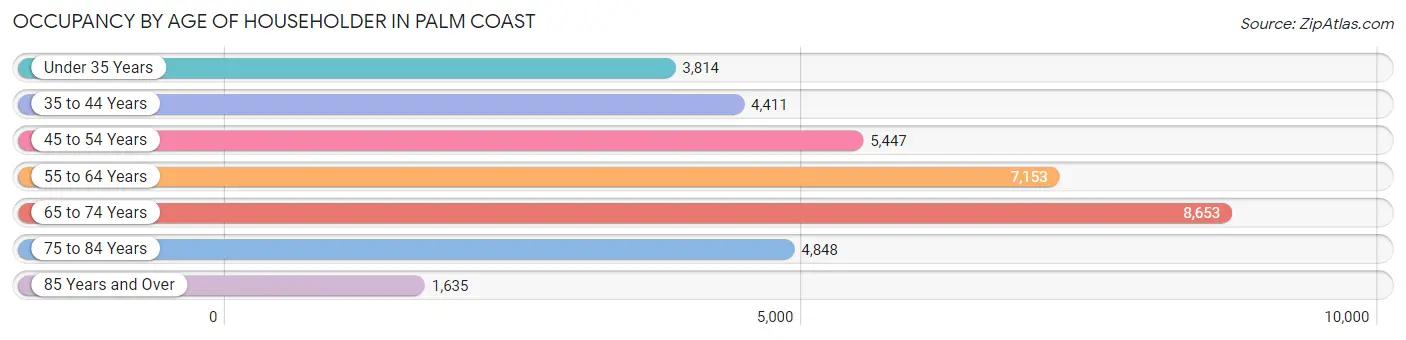
| Age Bracket | # Households | % Households |
| Under 35 Years | 3,814 | 10.6% |
| 35 to 44 Years | 4,411 | 12.3% |
| 45 to 54 Years | 5,447 | 15.1% |
| 55 to 64 Years | 7,153 | 19.9% |
| 65 to 74 Years | 8,653 | 24.1% |
| 75 to 84 Years | 4,848 | 13.5% |
| 85 Years and Over | 1,635 | 4.5% |
| Total | 35,961 | 100.0% |
Housing Finances in Palm Coast
Median Income by Occupancy in Palm Coast
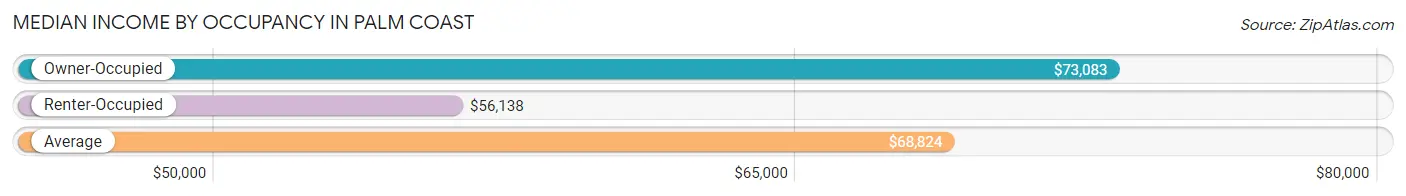
| Occupancy Type | # Households | Median Income |
| Owner-Occupied | 28,001 (77.9%) | $73,083 |
| Renter-Occupied | 7,960 (22.1%) | $56,138 |
| Average | 35,961 (100.0%) | $68,824 |
Occupancy by Householder Income Bracket in Palm Coast
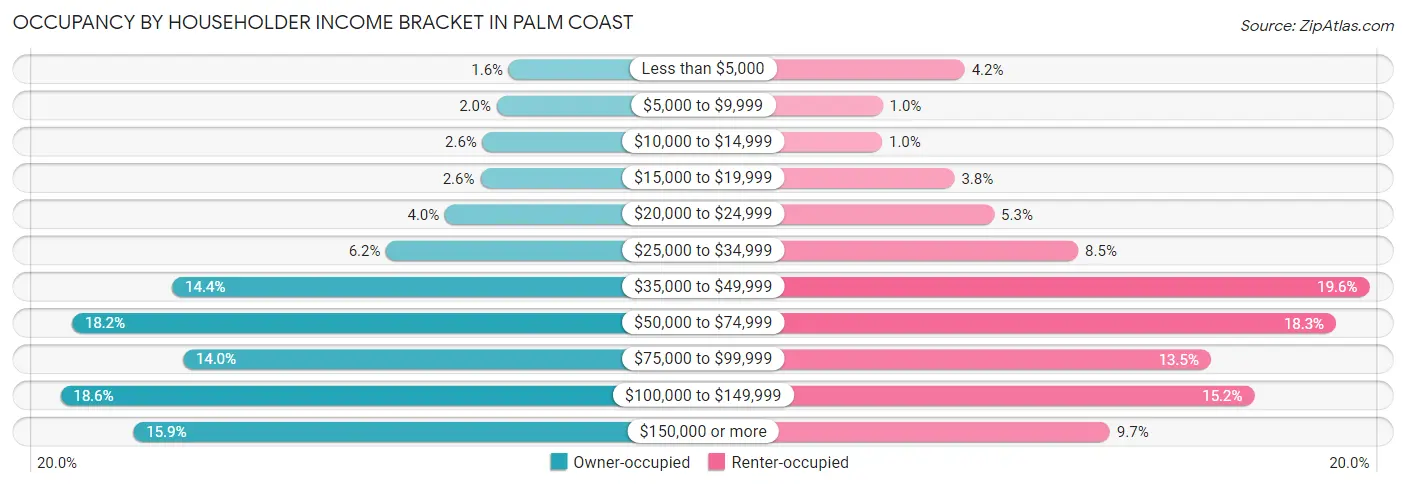
| Income Bracket | Owner-occupied | Renter-occupied |
| Less than $5,000 | 435 (1.5%) | 331 (4.2%) |
| $5,000 to $9,999 | 562 (2.0%) | 82 (1.0%) |
| $10,000 to $14,999 | 713 (2.5%) | 80 (1.0%) |
| $15,000 to $19,999 | 740 (2.6%) | 300 (3.8%) |
| $20,000 to $24,999 | 1,115 (4.0%) | 420 (5.3%) |
| $25,000 to $34,999 | 1,742 (6.2%) | 675 (8.5%) |
| $35,000 to $49,999 | 4,026 (14.4%) | 1,558 (19.6%) |
| $50,000 to $74,999 | 5,097 (18.2%) | 1,457 (18.3%) |
| $75,000 to $99,999 | 3,913 (14.0%) | 1,077 (13.5%) |
| $100,000 to $149,999 | 5,218 (18.6%) | 1,209 (15.2%) |
| $150,000 or more | 4,440 (15.9%) | 771 (9.7%) |
| Total | 28,001 (100.0%) | 7,960 (100.0%) |
Monthly Housing Cost Tiers in Palm Coast
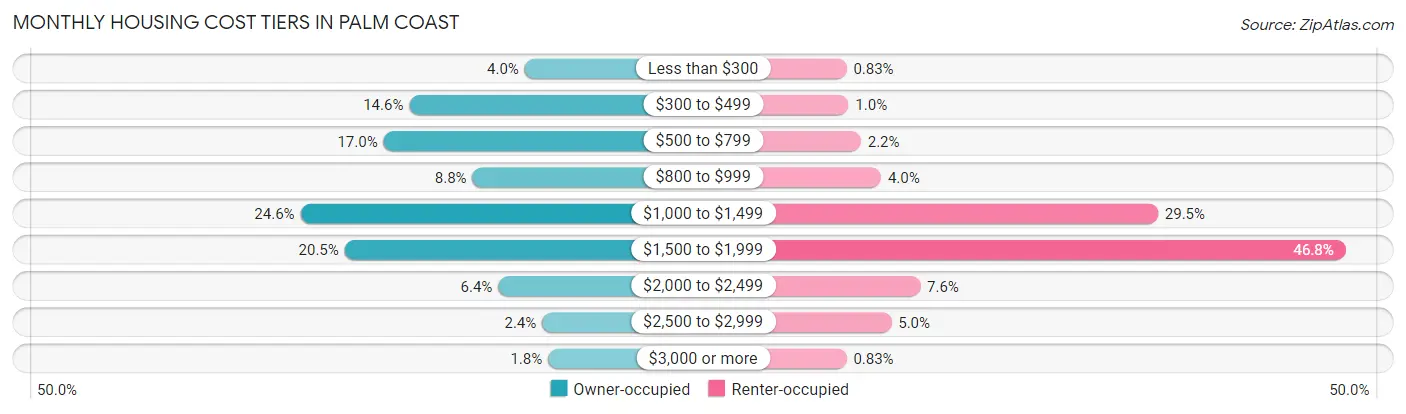
| Monthly Cost | Owner-occupied | Renter-occupied |
| Less than $300 | 1,110 (4.0%) | 66 (0.8%) |
| $300 to $499 | 4,084 (14.6%) | 80 (1.0%) |
| $500 to $799 | 4,748 (17.0%) | 171 (2.1%) |
| $800 to $999 | 2,457 (8.8%) | 319 (4.0%) |
| $1,000 to $1,499 | 6,891 (24.6%) | 2,348 (29.5%) |
| $1,500 to $1,999 | 5,752 (20.5%) | 3,724 (46.8%) |
| $2,000 to $2,499 | 1,791 (6.4%) | 606 (7.6%) |
| $2,500 to $2,999 | 661 (2.4%) | 395 (5.0%) |
| $3,000 or more | 507 (1.8%) | 66 (0.8%) |
| Total | 28,001 (100.0%) | 7,960 (100.0%) |
Physical Housing Characteristics in Palm Coast
Housing Structures in Palm Coast
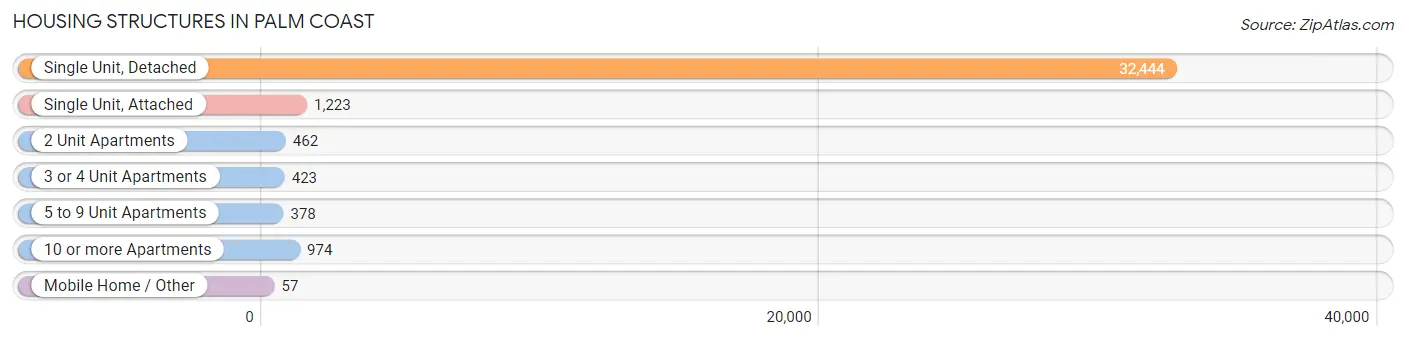
| Structure Type | # Housing Units | % Housing Units |
| Single Unit, Detached | 32,444 | 90.2% |
| Single Unit, Attached | 1,223 | 3.4% |
| 2 Unit Apartments | 462 | 1.3% |
| 3 or 4 Unit Apartments | 423 | 1.2% |
| 5 to 9 Unit Apartments | 378 | 1.1% |
| 10 or more Apartments | 974 | 2.7% |
| Mobile Home / Other | 57 | 0.2% |
| Total | 35,961 | 100.0% |
Housing Structures by Occupancy in Palm Coast
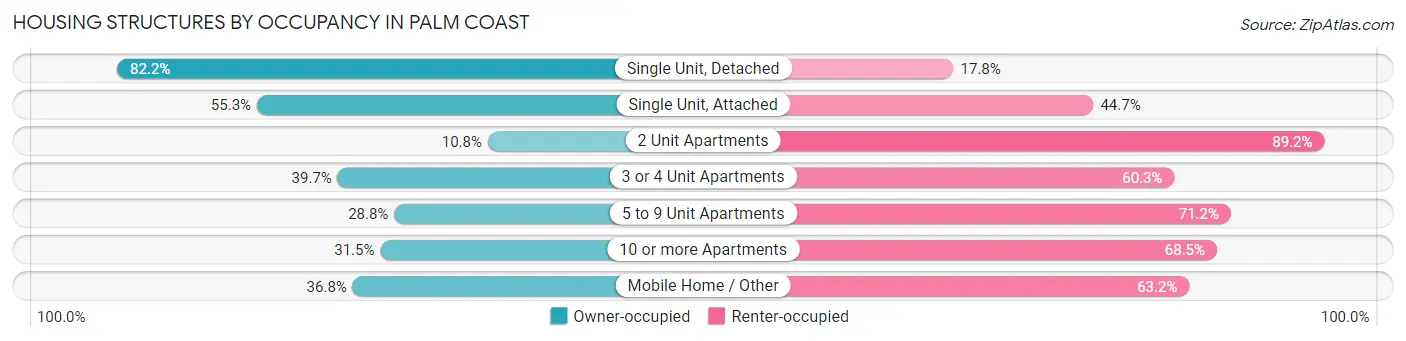
| Structure Type | Owner-occupied | Renter-occupied |
| Single Unit, Detached | 26,670 (82.2%) | 5,774 (17.8%) |
| Single Unit, Attached | 676 (55.3%) | 547 (44.7%) |
| 2 Unit Apartments | 50 (10.8%) | 412 (89.2%) |
| 3 or 4 Unit Apartments | 168 (39.7%) | 255 (60.3%) |
| 5 to 9 Unit Apartments | 109 (28.8%) | 269 (71.2%) |
| 10 or more Apartments | 307 (31.5%) | 667 (68.5%) |
| Mobile Home / Other | 21 (36.8%) | 36 (63.2%) |
| Total | 28,001 (77.9%) | 7,960 (22.1%) |
Housing Structures by Number of Rooms in Palm Coast
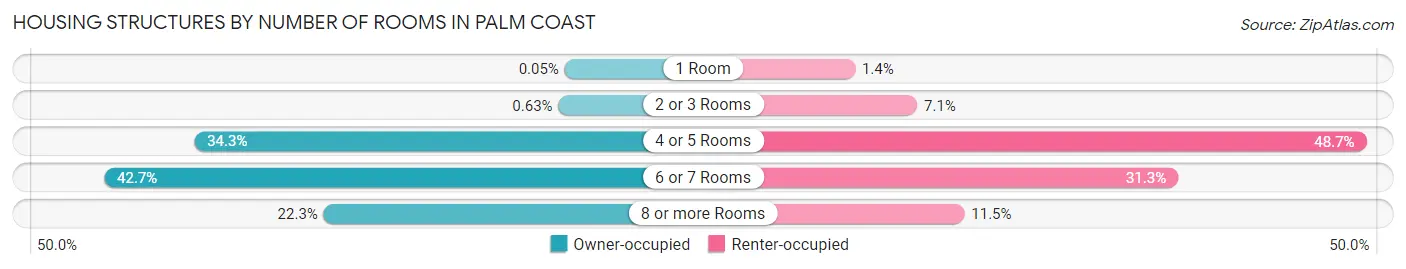
| Number of Rooms | Owner-occupied | Renter-occupied |
| 1 Room | 13 (0.1%) | 111 (1.4%) |
| 2 or 3 Rooms | 176 (0.6%) | 568 (7.1%) |
| 4 or 5 Rooms | 9,612 (34.3%) | 3,876 (48.7%) |
| 6 or 7 Rooms | 11,944 (42.7%) | 2,489 (31.3%) |
| 8 or more Rooms | 6,256 (22.3%) | 916 (11.5%) |
| Total | 28,001 (100.0%) | 7,960 (100.0%) |
Housing Structure by Heating Type in Palm Coast
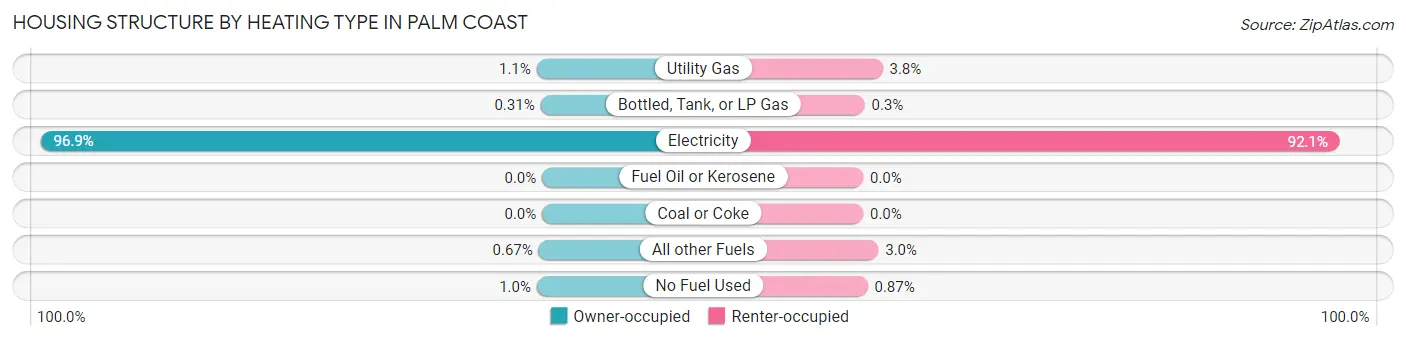
| Heating Type | Owner-occupied | Renter-occupied |
| Utility Gas | 298 (1.1%) | 299 (3.8%) |
| Bottled, Tank, or LP Gas | 87 (0.3%) | 24 (0.3%) |
| Electricity | 27,141 (96.9%) | 7,333 (92.1%) |
| Fuel Oil or Kerosene | 0 (0.0%) | 0 (0.0%) |
| Coal or Coke | 0 (0.0%) | 0 (0.0%) |
| All other Fuels | 189 (0.7%) | 235 (2.9%) |
| No Fuel Used | 286 (1.0%) | 69 (0.9%) |
| Total | 28,001 (100.0%) | 7,960 (100.0%) |
Household Vehicle Usage in Palm Coast
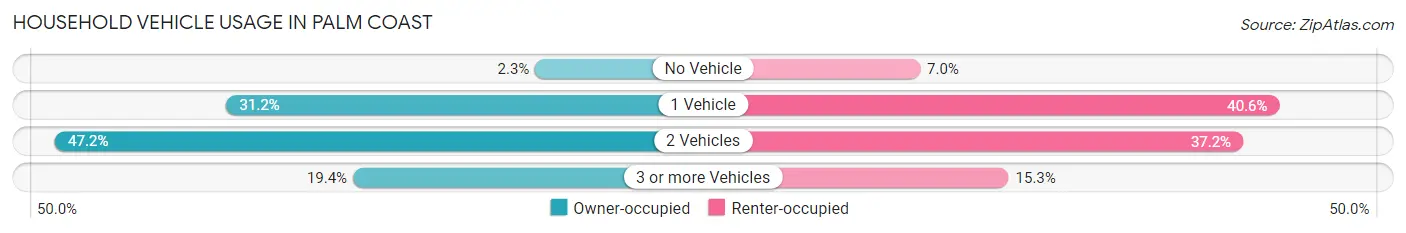
| Vehicles per Household | Owner-occupied | Renter-occupied |
| No Vehicle | 654 (2.3%) | 559 (7.0%) |
| 1 Vehicle | 8,726 (31.2%) | 3,228 (40.6%) |
| 2 Vehicles | 13,203 (47.1%) | 2,957 (37.1%) |
| 3 or more Vehicles | 5,418 (19.4%) | 1,216 (15.3%) |
| Total | 28,001 (100.0%) | 7,960 (100.0%) |
Real Estate & Mortgages in Palm Coast
Real Estate and Mortgage Overview in Palm Coast
| Characteristic | Without Mortgage | With Mortgage |
| Housing Units | 11,262 | 16,739 |
| Median Property Value | $289,000 | $279,900 |
| Median Household Income | $56,469 | $3,198 |
| Monthly Housing Costs | $527 | $489 |
| Real Estate Taxes | $2,321 | $515 |
Property Value by Mortgage Status in Palm Coast
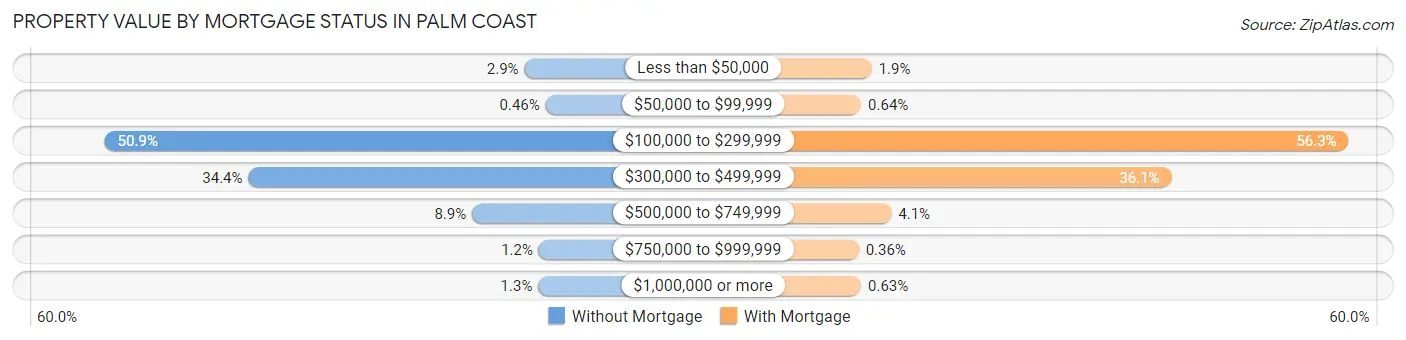
| Property Value | Without Mortgage | With Mortgage |
| Less than $50,000 | 324 (2.9%) | 310 (1.8%) |
| $50,000 to $99,999 | 52 (0.5%) | 107 (0.6%) |
| $100,000 to $299,999 | 5,727 (50.8%) | 9,429 (56.3%) |
| $300,000 to $499,999 | 3,877 (34.4%) | 6,042 (36.1%) |
| $500,000 to $749,999 | 998 (8.9%) | 685 (4.1%) |
| $750,000 to $999,999 | 138 (1.2%) | 60 (0.4%) |
| $1,000,000 or more | 146 (1.3%) | 106 (0.6%) |
| Total | 11,262 (100.0%) | 16,739 (100.0%) |
Household Income by Mortgage Status in Palm Coast
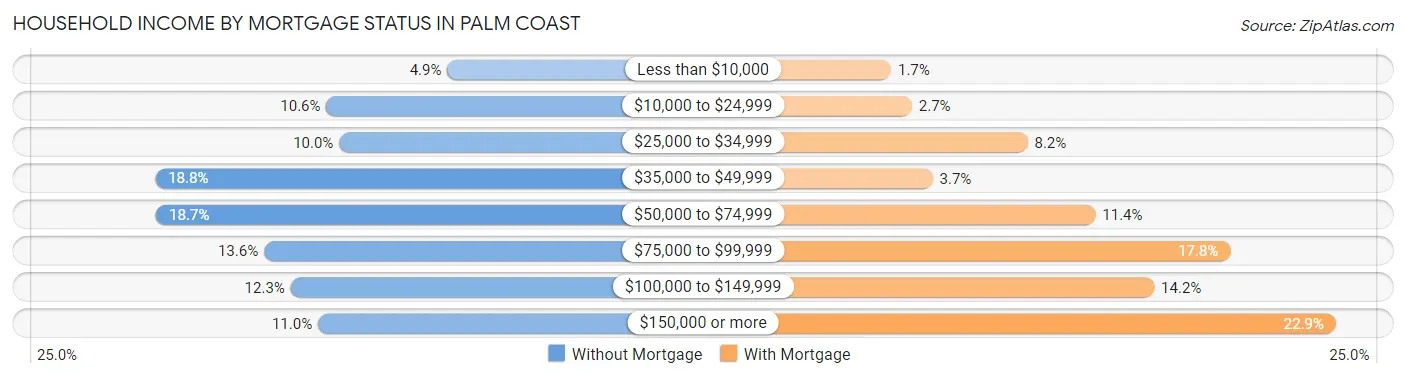
| Household Income | Without Mortgage | With Mortgage |
| Less than $10,000 | 548 (4.9%) | 283 (1.7%) |
| $10,000 to $24,999 | 1,197 (10.6%) | 449 (2.7%) |
| $25,000 to $34,999 | 1,128 (10.0%) | 1,371 (8.2%) |
| $35,000 to $49,999 | 2,115 (18.8%) | 614 (3.7%) |
| $50,000 to $74,999 | 2,111 (18.7%) | 1,911 (11.4%) |
| $75,000 to $99,999 | 1,532 (13.6%) | 2,986 (17.8%) |
| $100,000 to $149,999 | 1,389 (12.3%) | 2,381 (14.2%) |
| $150,000 or more | 1,242 (11.0%) | 3,829 (22.9%) |
| Total | 11,262 (100.0%) | 16,739 (100.0%) |
Property Value to Household Income Ratio in Palm Coast
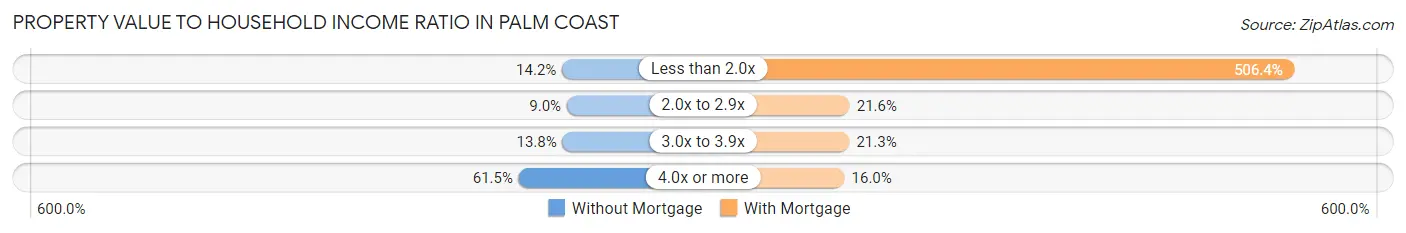
| Value-to-Income Ratio | Without Mortgage | With Mortgage |
| Less than 2.0x | 1,601 (14.2%) | 84,762 (506.4%) |
| 2.0x to 2.9x | 1,018 (9.0%) | 3,621 (21.6%) |
| 3.0x to 3.9x | 1,552 (13.8%) | 3,572 (21.3%) |
| 4.0x or more | 6,921 (61.5%) | 2,678 (16.0%) |
| Total | 11,262 (100.0%) | 16,739 (100.0%) |
Real Estate Taxes by Mortgage Status in Palm Coast
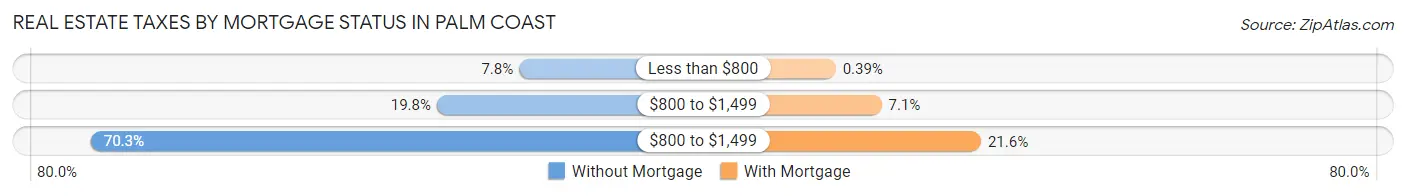
| Property Taxes | Without Mortgage | With Mortgage |
| Less than $800 | 873 (7.7%) | 65 (0.4%) |
| $800 to $1,499 | 2,226 (19.8%) | 1,188 (7.1%) |
| $800 to $1,499 | 7,919 (70.3%) | 3,619 (21.6%) |
| Total | 11,262 (100.0%) | 16,739 (100.0%) |
Health & Disability in Palm Coast
Health Insurance Coverage by Age in Palm Coast
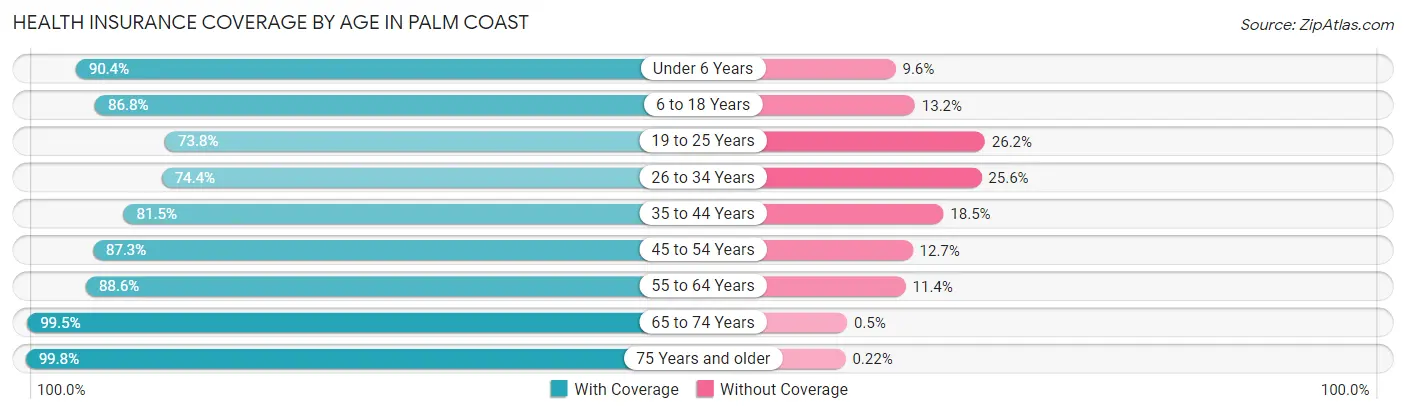
| Age Bracket | With Coverage | Without Coverage |
| Under 6 Years | 3,575 (90.4%) | 378 (9.6%) |
| 6 to 18 Years | 11,326 (86.8%) | 1,716 (13.2%) |
| 19 to 25 Years | 4,144 (73.8%) | 1,472 (26.2%) |
| 26 to 34 Years | 5,830 (74.4%) | 2,003 (25.6%) |
| 35 to 44 Years | 7,863 (81.5%) | 1,782 (18.5%) |
| 45 to 54 Years | 9,264 (87.3%) | 1,353 (12.7%) |
| 55 to 64 Years | 11,873 (88.6%) | 1,533 (11.4%) |
| 65 to 74 Years | 15,493 (99.5%) | 78 (0.5%) |
| 75 Years and older | 11,035 (99.8%) | 24 (0.2%) |
| Total | 80,403 (88.6%) | 10,339 (11.4%) |
Health Insurance Coverage by Citizenship Status in Palm Coast
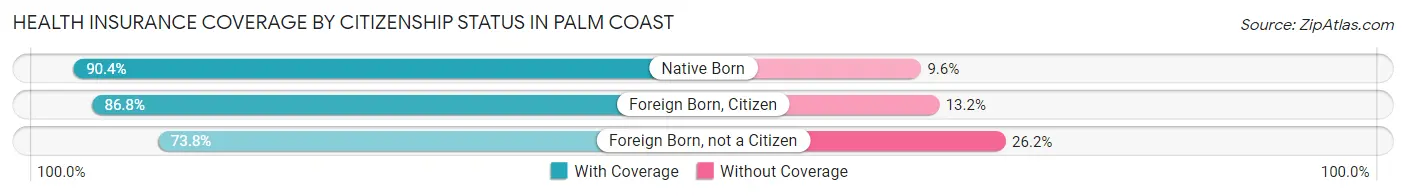
| Citizenship Status | With Coverage | Without Coverage |
| Native Born | 3,575 (90.4%) | 378 (9.6%) |
| Foreign Born, Citizen | 11,326 (86.8%) | 1,716 (13.2%) |
| Foreign Born, not a Citizen | 4,144 (73.8%) | 1,472 (26.2%) |
Health Insurance Coverage by Household Income in Palm Coast
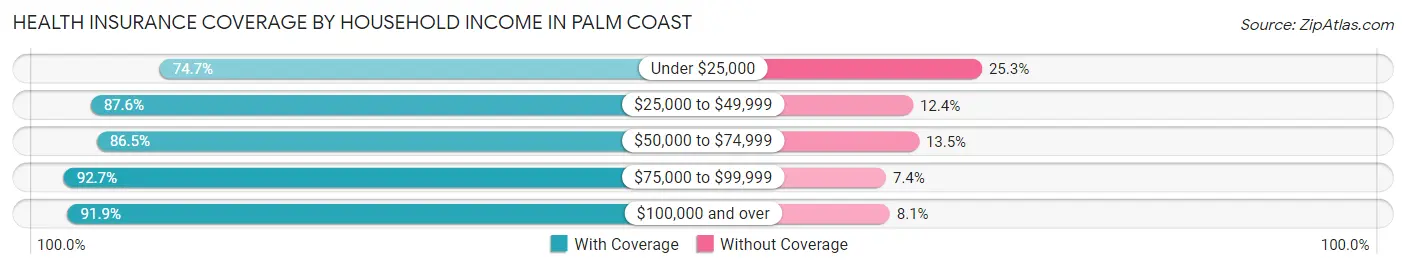
| Household Income | With Coverage | Without Coverage |
| Under $25,000 | 6,586 (74.7%) | 2,234 (25.3%) |
| $25,000 to $49,999 | 14,703 (87.6%) | 2,082 (12.4%) |
| $50,000 to $74,999 | 13,643 (86.5%) | 2,132 (13.5%) |
| $75,000 to $99,999 | 12,119 (92.6%) | 962 (7.3%) |
| $100,000 and over | 33,283 (91.9%) | 2,923 (8.1%) |
Public vs Private Health Insurance Coverage by Age in Palm Coast
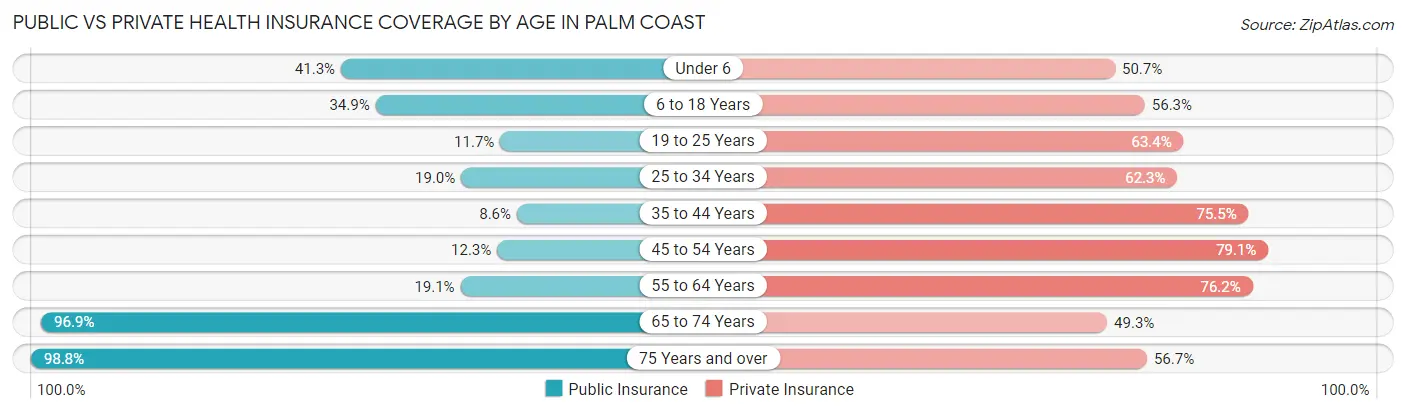
| Age Bracket | Public Insurance | Private Insurance |
| Under 6 | 1,632 (41.3%) | 2,005 (50.7%) |
| 6 to 18 Years | 4,548 (34.9%) | 7,336 (56.2%) |
| 19 to 25 Years | 659 (11.7%) | 3,562 (63.4%) |
| 25 to 34 Years | 1,487 (19.0%) | 4,878 (62.3%) |
| 35 to 44 Years | 832 (8.6%) | 7,281 (75.5%) |
| 45 to 54 Years | 1,305 (12.3%) | 8,402 (79.1%) |
| 55 to 64 Years | 2,561 (19.1%) | 10,219 (76.2%) |
| 65 to 74 Years | 15,093 (96.9%) | 7,670 (49.3%) |
| 75 Years and over | 10,930 (98.8%) | 6,265 (56.7%) |
| Total | 39,047 (43.0%) | 57,618 (63.5%) |
Disability Status by Sex by Age in Palm Coast
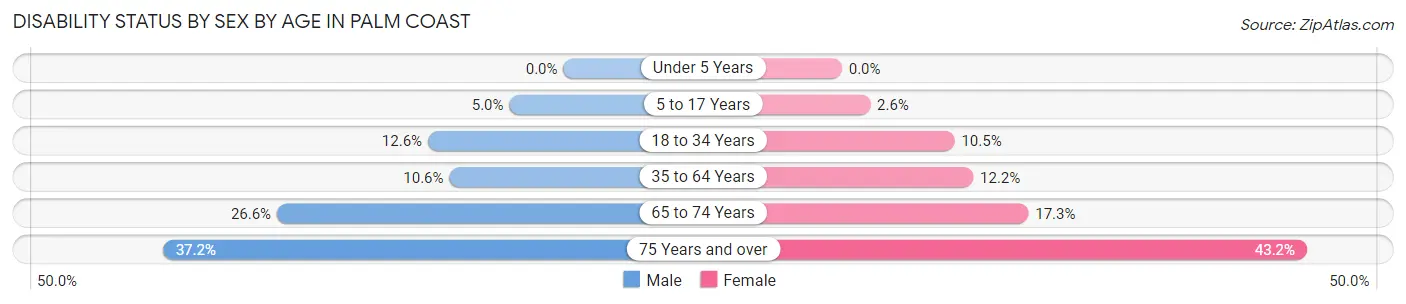
| Age Bracket | Male | Female |
| Under 5 Years | 0 (0.0%) | 0 (0.0%) |
| 5 to 17 Years | 331 (5.0%) | 161 (2.6%) |
| 18 to 34 Years | 937 (12.6%) | 730 (10.5%) |
| 35 to 64 Years | 1,628 (10.6%) | 2,229 (12.2%) |
| 65 to 74 Years | 1,978 (26.6%) | 1,407 (17.3%) |
| 75 Years and over | 1,967 (37.2%) | 2,490 (43.2%) |
Disability Class by Sex by Age in Palm Coast
Disability Class: Hearing Difficulty
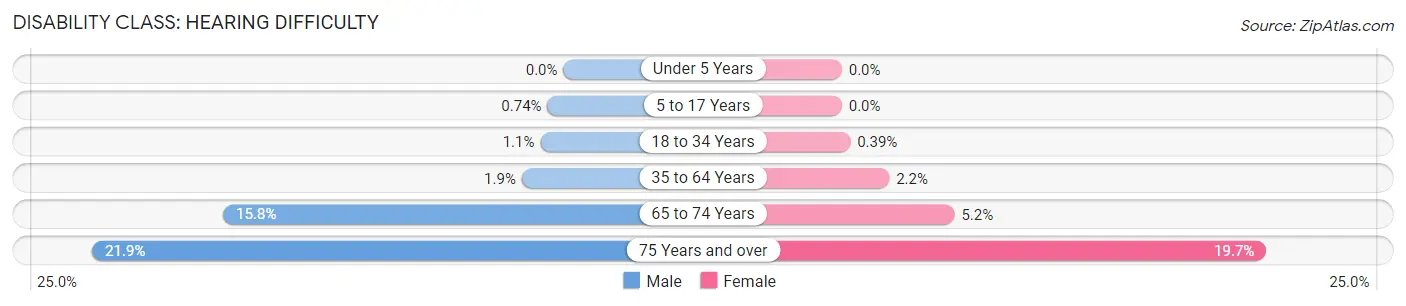
| Age Bracket | Male | Female |
| Under 5 Years | 0 (0.0%) | 0 (0.0%) |
| 5 to 17 Years | 49 (0.7%) | 0 (0.0%) |
| 18 to 34 Years | 80 (1.1%) | 27 (0.4%) |
| 35 to 64 Years | 297 (1.9%) | 402 (2.2%) |
| 65 to 74 Years | 1,175 (15.8%) | 425 (5.2%) |
| 75 Years and over | 1,157 (21.9%) | 1,136 (19.7%) |
Disability Class: Vision Difficulty
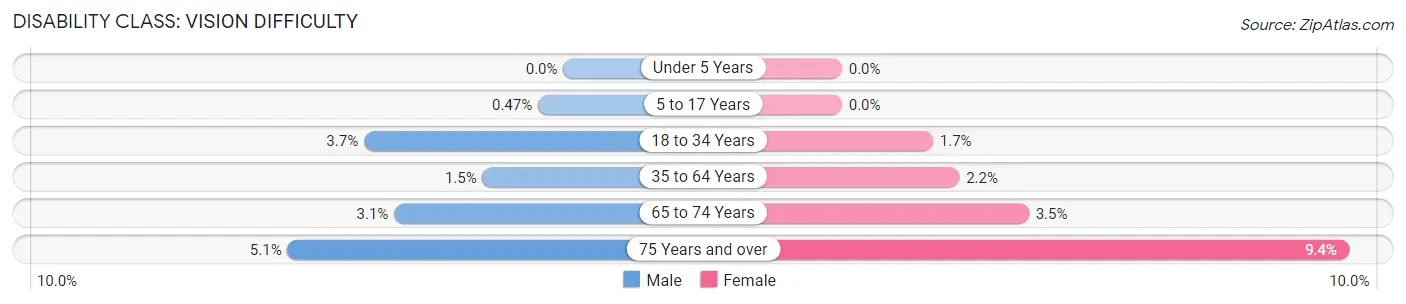
| Age Bracket | Male | Female |
| Under 5 Years | 0 (0.0%) | 0 (0.0%) |
| 5 to 17 Years | 31 (0.5%) | 0 (0.0%) |
| 18 to 34 Years | 276 (3.7%) | 118 (1.7%) |
| 35 to 64 Years | 231 (1.5%) | 398 (2.2%) |
| 65 to 74 Years | 234 (3.1%) | 282 (3.5%) |
| 75 Years and over | 271 (5.1%) | 543 (9.4%) |
Disability Class: Cognitive Difficulty
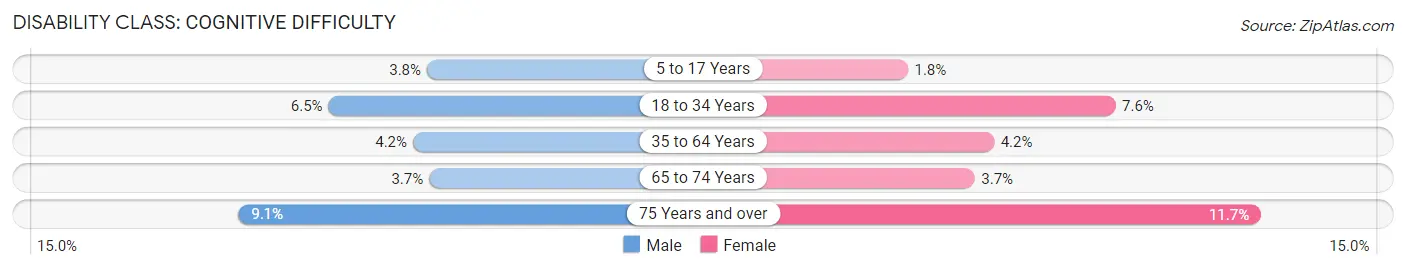
| Age Bracket | Male | Female |
| 5 to 17 Years | 251 (3.8%) | 112 (1.8%) |
| 18 to 34 Years | 488 (6.5%) | 531 (7.6%) |
| 35 to 64 Years | 644 (4.2%) | 773 (4.2%) |
| 65 to 74 Years | 278 (3.7%) | 300 (3.7%) |
| 75 Years and over | 479 (9.0%) | 673 (11.7%) |
Disability Class: Ambulatory Difficulty
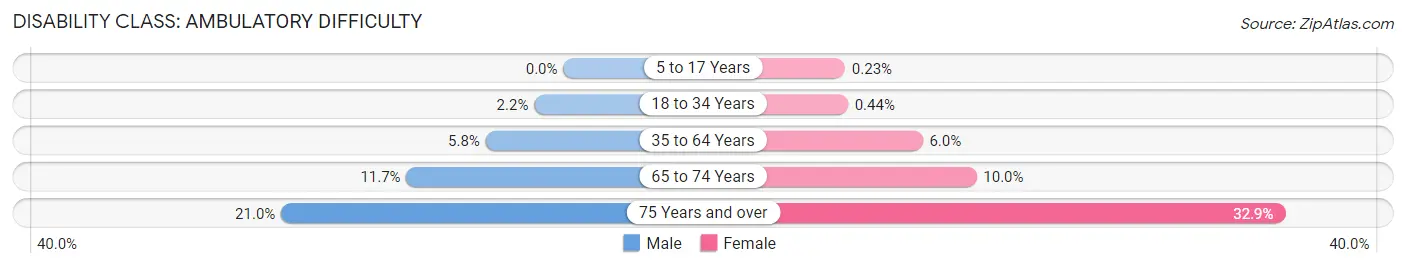
| Age Bracket | Male | Female |
| 5 to 17 Years | 0 (0.0%) | 14 (0.2%) |
| 18 to 34 Years | 161 (2.2%) | 31 (0.4%) |
| 35 to 64 Years | 888 (5.8%) | 1,095 (6.0%) |
| 65 to 74 Years | 867 (11.7%) | 812 (10.0%) |
| 75 Years and over | 1,108 (20.9%) | 1,900 (32.9%) |
Disability Class: Self-Care Difficulty
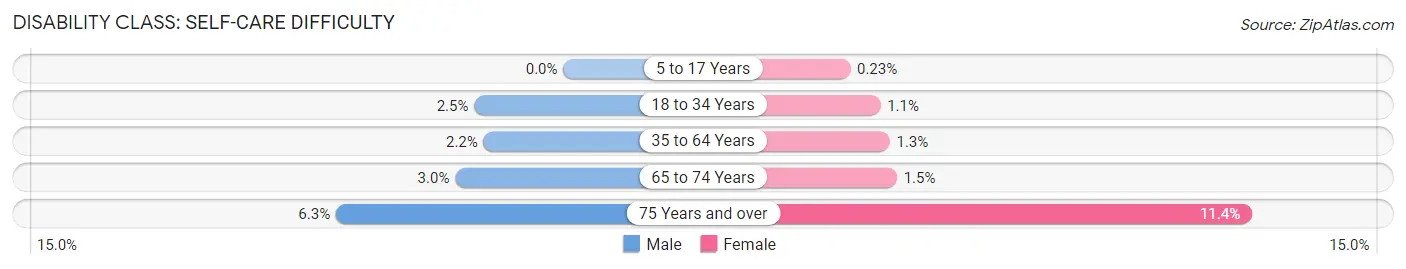
| Age Bracket | Male | Female |
| 5 to 17 Years | 0 (0.0%) | 14 (0.2%) |
| 18 to 34 Years | 185 (2.5%) | 75 (1.1%) |
| 35 to 64 Years | 341 (2.2%) | 243 (1.3%) |
| 65 to 74 Years | 224 (3.0%) | 124 (1.5%) |
| 75 Years and over | 335 (6.3%) | 659 (11.4%) |
Technology Access in Palm Coast
Computing Device Access in Palm Coast
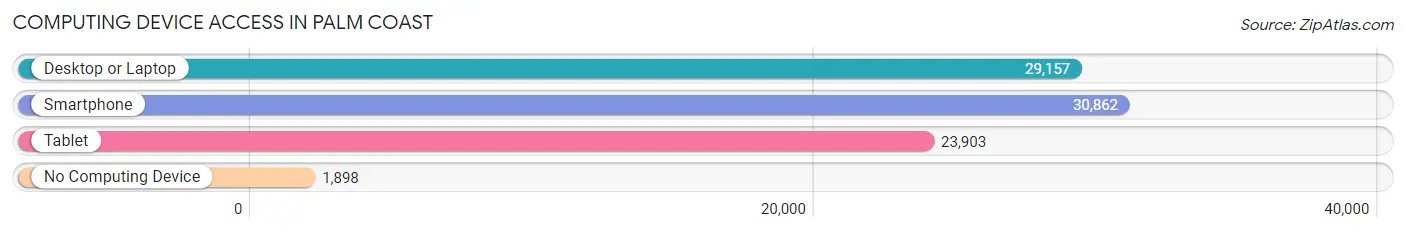
| Device Type | # Households | % Households |
| Desktop or Laptop | 29,157 | 81.1% |
| Smartphone | 30,862 | 85.8% |
| Tablet | 23,903 | 66.5% |
| No Computing Device | 1,898 | 5.3% |
| Total | 35,961 | 100.0% |
Internet Access in Palm Coast
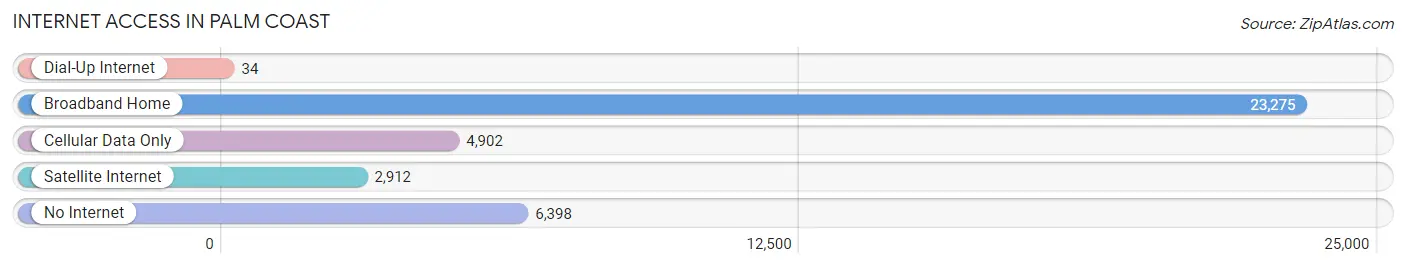
| Internet Type | # Households | % Households |
| Dial-Up Internet | 34 | 0.1% |
| Broadband Home | 23,275 | 64.7% |
| Cellular Data Only | 4,902 | 13.6% |
| Satellite Internet | 2,912 | 8.1% |
| No Internet | 6,398 | 17.8% |
| Total | 35,961 | 100.0% |
Palm Coast Summary
Palm Coast is a city located in Flagler County, Florida, United States. It is situated along the Atlantic Ocean, about 70 miles northeast of Orlando and about 60 miles south of Jacksonville. The city was incorporated in 1999 and has a population of about 75,000 people.
Geography
Palm Coast is located in the northeast corner of Flagler County, Florida, and is bordered by the Atlantic Ocean to the east, the Intracoastal Waterway to the west, and the Matanzas River to the south. The city covers an area of about 40 square miles and is located about 70 miles northeast of Orlando and about 60 miles south of Jacksonville. The city is divided into several neighborhoods, including Palm Harbor, Grand Haven, and Flagler Beach.
The city has a humid subtropical climate, with hot, humid summers and mild winters. The average temperature in the summer is around 90°F, while in the winter it is around 60°F. The average annual precipitation is around 50 inches.
Economy
The economy of Palm Coast is largely based on tourism and services. The city is home to several resorts and hotels, as well as a variety of restaurants and shops. The city also has a large number of retirees, who contribute to the local economy through their spending.
The city is also home to several large employers, including Florida Hospital Flagler, Flagler County Public Schools, and Flagler County Government. The city also has a large number of small businesses, including retail stores, restaurants, and professional services.
Demographics
As of the 2010 census, the population of Palm Coast was 75,180. The racial makeup of the city was 79.2% White, 11.3% African American, 0.5% Native American, 2.2% Asian, 0.1% Pacific Islander, 4.2% from other races, and 2.5% from two or more races. Hispanic or Latino of any race were 11.3% of the population.
The median income for a household in the city was $45,837, and the median income for a family was $51,919. The per capita income for the city was $25,845. About 11.3% of families and 14.2% of the population were below the poverty line, including 19.2% of those under age 18 and 8.2% of those age 65 or over.
Palm Coast is a growing city with a diverse population and a strong economy. The city is home to a variety of businesses, from resorts and hotels to small businesses and professional services. The city also has a large number of retirees, who contribute to the local economy through their spending. With its beautiful beaches, warm climate, and strong economy, Palm Coast is an attractive destination for both tourists and residents alike.
Common Questions
What is the Total Population of Palm Coast?
Total Population of Palm Coast is 91,082.
What is the Total Male Population of Palm Coast?
Total Male Population of Palm Coast is 43,931.
What is the Total Female Population of Palm Coast?
Total Female Population of Palm Coast is 47,151.
What is the Ratio of Males per 100 Females in Palm Coast?
There are 93.17 Males per 100 Females in Palm Coast.
What is the Ratio of Females per 100 Males in Palm Coast?
There are 107.33 Females per 100 Males in Palm Coast.
What is the Median Population Age in Palm Coast?
Median Population Age in Palm Coast is 50.3 Years.
What is the Average Family Size in Palm Coast
Average Family Size in Palm Coast is 2.9 People.
What is the Average Household Size in Palm Coast
Average Household Size in Palm Coast is 2.5 People.
What is Per Capita Income in Palm Coast?
Per Capita income in Palm Coast is $37,904.
What is the Median Family Income in Palm Coast?
Median Family Income in Palm Coast is $77,353.
What is the Median Household income in Palm Coast?
Median Household Income in Palm Coast is $68,824.
What is Income or Wage Gap in Palm Coast?
Income or Wage Gap in Palm Coast is 20.0%.
Women in Palm Coast earn 80.0 cents for every dollar earned by a man.
What is Family Income Deficit in Palm Coast?
Family Income Deficit in Palm Coast is $9,725.
Families that are below poverty line in Palm Coast earn $9,725 less on average than the poverty threshold level.
What is Inequality or Gini Index in Palm Coast?
Inequality or Gini Index in Palm Coast is 0.44.
How Large is the Labor Force in Palm Coast?
There are 40,146 People in the Labor Forcein in Palm Coast.
What is the Percentage of People in the Labor Force in Palm Coast?
52.2% of People are in the Labor Force in Palm Coast.
What is the Unemployment Rate in Palm Coast?
Unemployment Rate in Palm Coast is 4.1%.