Bagdad, FL
Bagdad Map
Bagdad Overview
4,359
TOTAL POPULATION
2,237
MALE POPULATION
2,122
FEMALE POPULATION
105.42
MALES / 100 FEMALES
94.86
FEMALES / 100 MALES
38.3
MEDIAN AGE
2.9
AVG FAMILY SIZE
2.6
AVG HOUSEHOLD SIZE
$35,716
PER CAPITA INCOME
$82,284
AVG FAMILY INCOME
$78,182
AVG HOUSEHOLD INCOME
17.5%
WAGE / INCOME GAP [ % ]
82.5¢/ $1
WAGE / INCOME GAP [ $ ]
0.34
INEQUALITY / GINI INDEX
2,325
LABOR FORCE [ PEOPLE ]
64.9%
PERCENT IN LABOR FORCE
1.1%
UNEMPLOYMENT RATE
Bagdad Zip Codes
Bagdad Area Codes
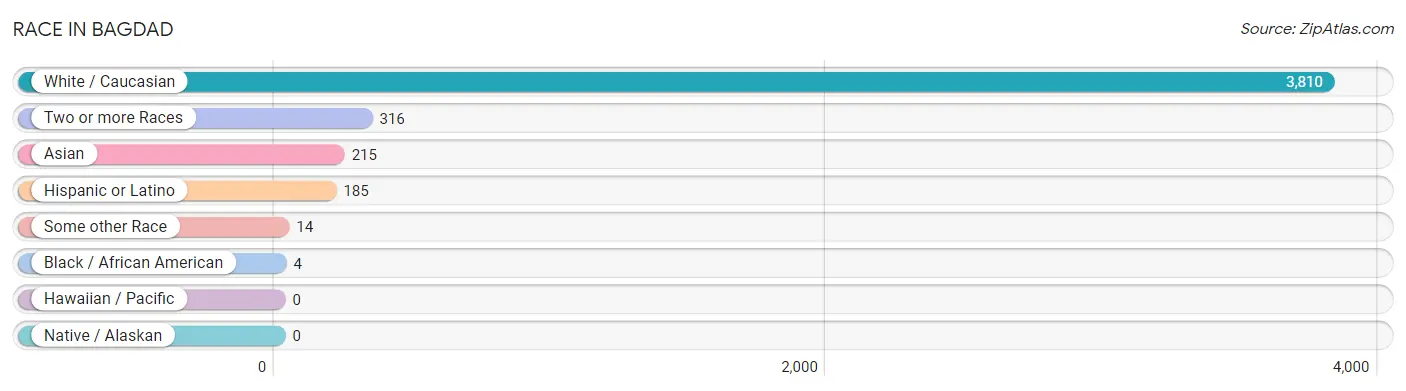
Race in Bagdad
The most populous races in Bagdad are White / Caucasian (3,810 | 87.4%), Two or more Races (316 | 7.2%), and Asian (215 | 4.9%).
| Race | # Population | % Population |
| Asian | 215 | 4.9% |
| Black / African American | 4 | 0.1% |
| Hawaiian / Pacific | 0 | 0.0% |
| Hispanic or Latino | 185 | 4.2% |
| Native / Alaskan | 0 | 0.0% |
| White / Caucasian | 3,810 | 87.4% |
| Two or more Races | 316 | 7.2% |
| Some other Race | 14 | 0.3% |
| Total | 4,359 | 100.0% |
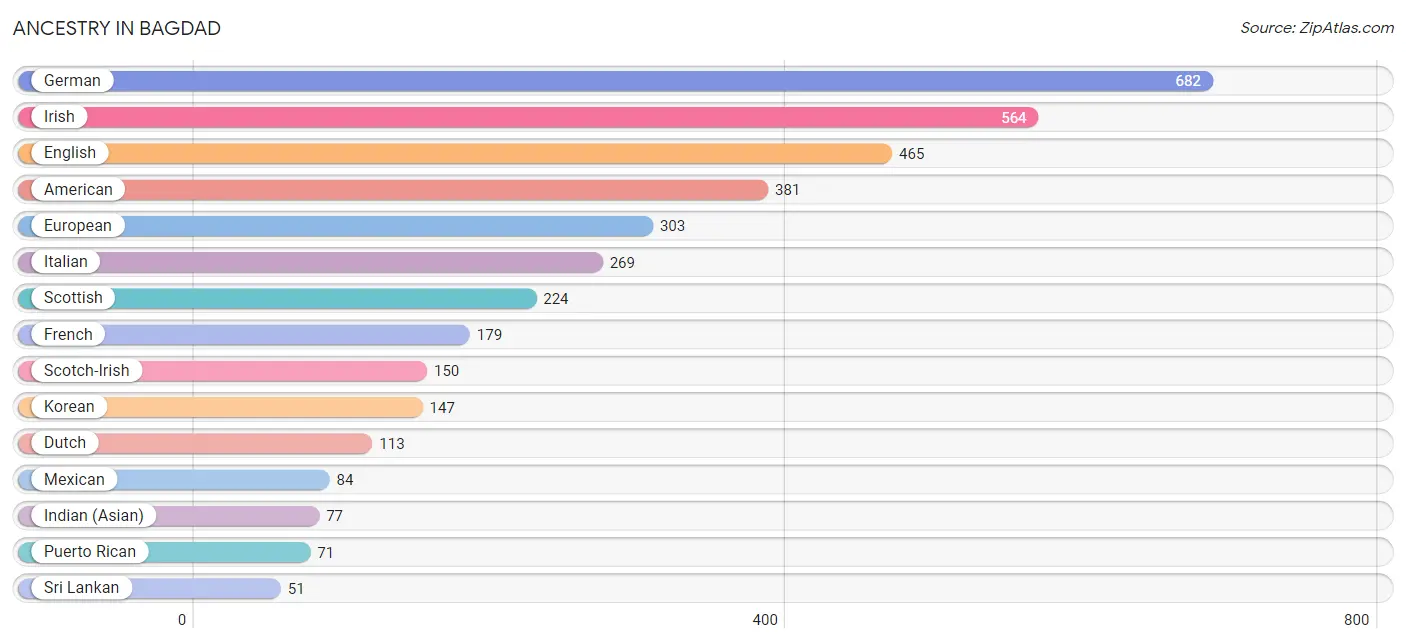
Ancestry in Bagdad
The most populous ancestries reported in Bagdad are German (682 | 15.7%), Irish (564 | 12.9%), English (465 | 10.7%), American (381 | 8.7%), and European (303 | 7.0%), together accounting for 54.9% of all Bagdad residents.
| Ancestry | # Population | % Population |
| American | 381 | 8.7% |
| Blackfeet | 12 | 0.3% |
| British | 20 | 0.5% |
| Central American | 28 | 0.6% |
| Cherokee | 42 | 1.0% |
| Cuban | 2 | 0.1% |
| Danish | 6 | 0.1% |
| Dutch | 113 | 2.6% |
| English | 465 | 10.7% |
| European | 303 | 7.0% |
| French | 179 | 4.1% |
| German | 682 | 15.7% |
| Greek | 26 | 0.6% |
| Guatemalan | 28 | 0.6% |
| Indian (Asian) | 77 | 1.8% |
| Irish | 564 | 12.9% |
| Italian | 269 | 6.2% |
| Korean | 147 | 3.4% |
| Mexican | 84 | 1.9% |
| Native Hawaiian | 25 | 0.6% |
| Northern European | 14 | 0.3% |
| Norwegian | 18 | 0.4% |
| Polish | 13 | 0.3% |
| Puerto Rican | 71 | 1.6% |
| Scotch-Irish | 150 | 3.4% |
| Scottish | 224 | 5.1% |
| Sri Lankan | 51 | 1.2% |
| Ukrainian | 16 | 0.4% | View All 28 Rows |
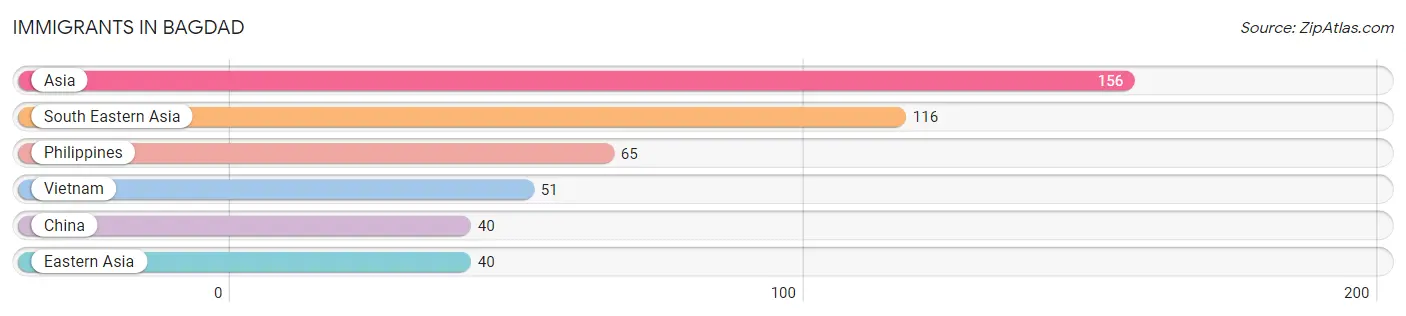
Immigrants in Bagdad
The most numerous immigrant groups reported in Bagdad came from Asia (156 | 3.6%), South Eastern Asia (116 | 2.7%), Philippines (65 | 1.5%), Vietnam (51 | 1.2%), and China (40 | 0.9%), together accounting for 9.8% of all Bagdad residents.
| Immigration Origin | # Population | % Population |
| Asia | 156 | 3.6% |
| China | 40 | 0.9% |
| Eastern Asia | 40 | 0.9% |
| Philippines | 65 | 1.5% |
| South Eastern Asia | 116 | 2.7% |
| Vietnam | 51 | 1.2% | View All 6 Rows |
Sex and Age in Bagdad
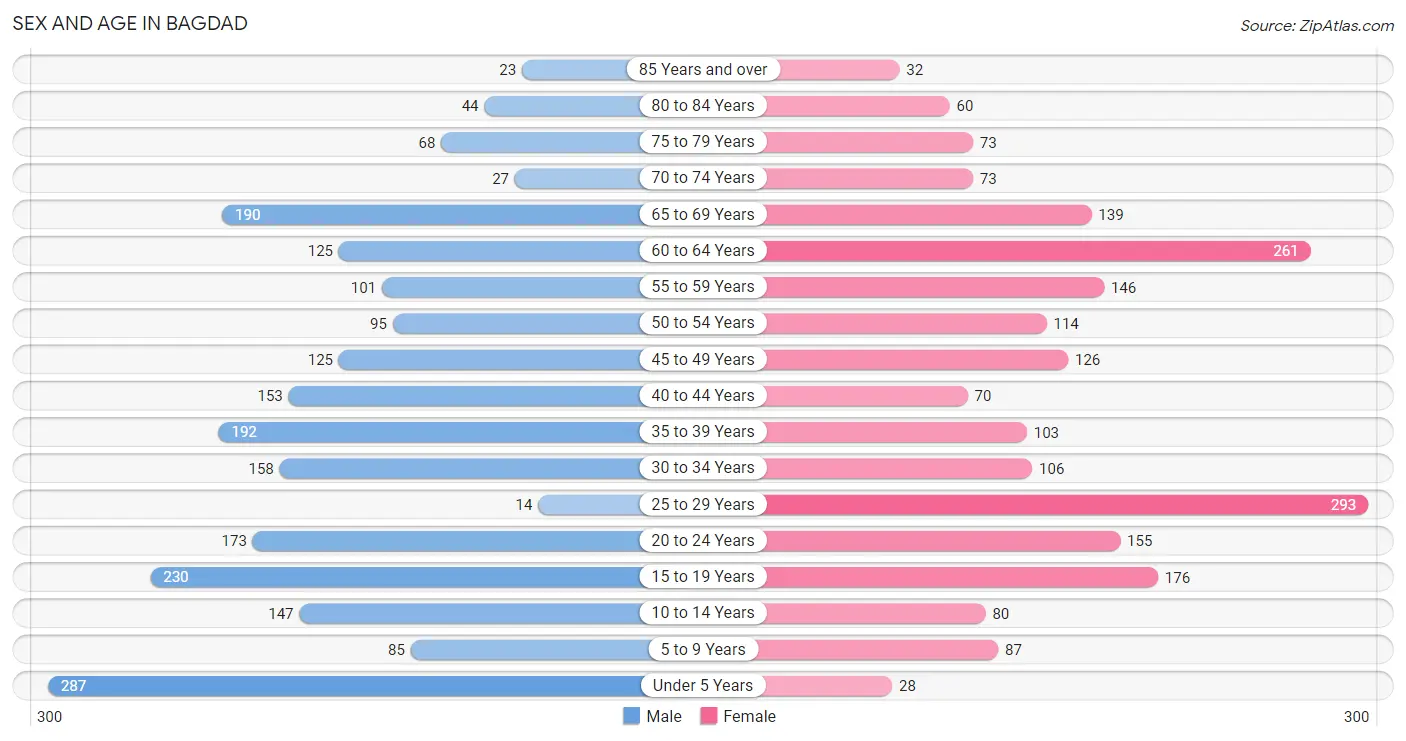
Sex and Age in Bagdad
The most populous age groups in Bagdad are Under 5 Years (287 | 12.8%) for men and 25 to 29 Years (293 | 13.8%) for women.
| Age Bracket | Male | Female |
| Under 5 Years | 287 (12.8%) | 28 (1.3%) |
| 5 to 9 Years | 85 (3.8%) | 87 (4.1%) |
| 10 to 14 Years | 147 (6.6%) | 80 (3.8%) |
| 15 to 19 Years | 230 (10.3%) | 176 (8.3%) |
| 20 to 24 Years | 173 (7.7%) | 155 (7.3%) |
| 25 to 29 Years | 14 (0.6%) | 293 (13.8%) |
| 30 to 34 Years | 158 (7.1%) | 106 (5.0%) |
| 35 to 39 Years | 192 (8.6%) | 103 (4.9%) |
| 40 to 44 Years | 153 (6.8%) | 70 (3.3%) |
| 45 to 49 Years | 125 (5.6%) | 126 (5.9%) |
| 50 to 54 Years | 95 (4.3%) | 114 (5.4%) |
| 55 to 59 Years | 101 (4.5%) | 146 (6.9%) |
| 60 to 64 Years | 125 (5.6%) | 261 (12.3%) |
| 65 to 69 Years | 190 (8.5%) | 139 (6.6%) |
| 70 to 74 Years | 27 (1.2%) | 73 (3.4%) |
| 75 to 79 Years | 68 (3.0%) | 73 (3.4%) |
| 80 to 84 Years | 44 (2.0%) | 60 (2.8%) |
| 85 Years and over | 23 (1.0%) | 32 (1.5%) |
| Total | 2,237 (100.0%) | 2,122 (100.0%) |
Families and Households in Bagdad
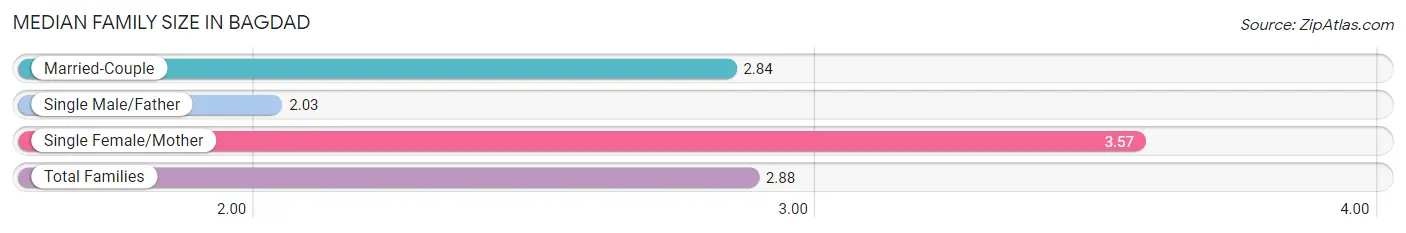
Median Family Size in Bagdad
The median family size in Bagdad is 2.88 persons per family, with single female/mother families (237 | 17.8%) accounting for the largest median family size of 3.57 persons per family. On the other hand, single male/father families (150 | 11.3%) represent the smallest median family size with 2.03 persons per family.
| Family Type | # Families | Family Size |
| Married-Couple | 945 (71.0%) | 2.84 |
| Single Male/Father | 150 (11.3%) | 2.03 |
| Single Female/Mother | 237 (17.8%) | 3.57 |
| Total Families | 1,332 (100.0%) | 2.88 |
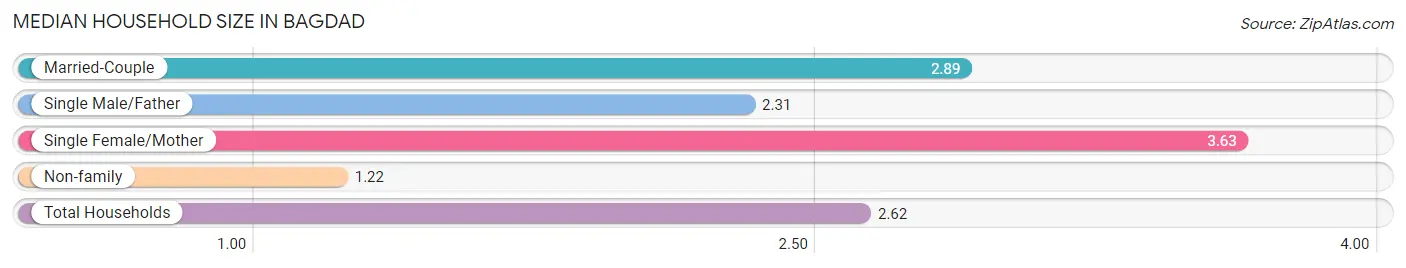
Median Household Size in Bagdad
The median household size in Bagdad is 2.62 persons per household, with single female/mother households (237 | 14.3%) accounting for the largest median household size of 3.63 persons per household. non-family households (326 | 19.7%) represent the smallest median household size with 1.22 persons per household.
| Household Type | # Households | Household Size |
| Married-Couple | 945 (57.0%) | 2.89 |
| Single Male/Father | 150 (9.0%) | 2.31 |
| Single Female/Mother | 237 (14.3%) | 3.63 |
| Non-family | 326 (19.7%) | 1.22 |
| Total Households | 1,658 (100.0%) | 2.62 |
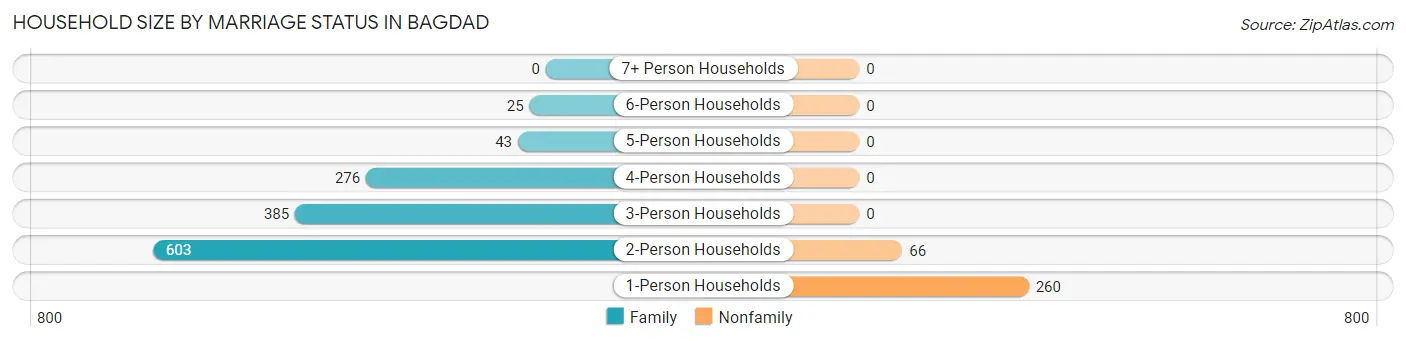
Household Size by Marriage Status in Bagdad
Out of a total of 1,658 households in Bagdad, 1,332 (80.3%) are family households, while 326 (19.7%) are nonfamily households. The most numerous type of family households are 2-person households, comprising 603, and the most common type of nonfamily households are 1-person households, comprising 260.
| Household Size | Family Households | Nonfamily Households |
| 1-Person Households | - | 260 (15.7%) |
| 2-Person Households | 603 (36.4%) | 66 (4.0%) |
| 3-Person Households | 385 (23.2%) | 0 (0.0%) |
| 4-Person Households | 276 (16.7%) | 0 (0.0%) |
| 5-Person Households | 43 (2.6%) | 0 (0.0%) |
| 6-Person Households | 25 (1.5%) | 0 (0.0%) |
| 7+ Person Households | 0 (0.0%) | 0 (0.0%) |
| Total | 1,332 (80.3%) | 326 (19.7%) |
Female Fertility in Bagdad
Fertility by Age in Bagdad
Average fertility rate in Bagdad is 108.0 births per 1,000 women. Women in the age bracket of 35 to 50 years have the highest fertility rate with 144.0 births per 1,000 women. Women in the age bracket of 20 to 34 years acount for 61.3% of all women with births.
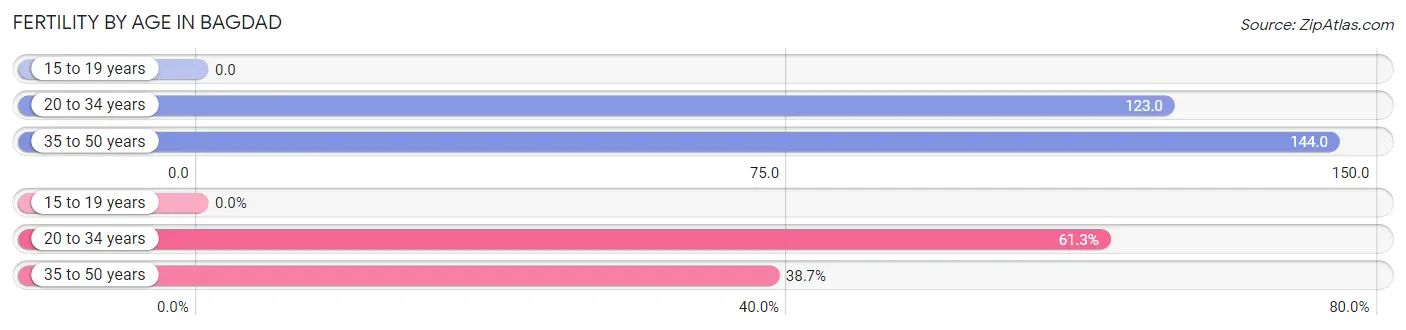
| Age Bracket | Women with Births | Births / 1,000 Women |
| 15 to 19 years | 0 (0.0%) | 0.0 |
| 20 to 34 years | 68 (61.3%) | 123.0 |
| 35 to 50 years | 43 (38.7%) | 144.0 |
| Total | 111 (100.0%) | 108.0 |
Fertility by Age by Marriage Status in Bagdad
61.3% of women with births (111) in Bagdad are married. The highest percentage of unmarried women with births falls into 35 to 50 years age bracket with 100.0% of them unmarried at the time of birth, while the lowest percentage of unmarried women with births belong to 20 to 34 years age bracket with 0.0% of them unmarried.
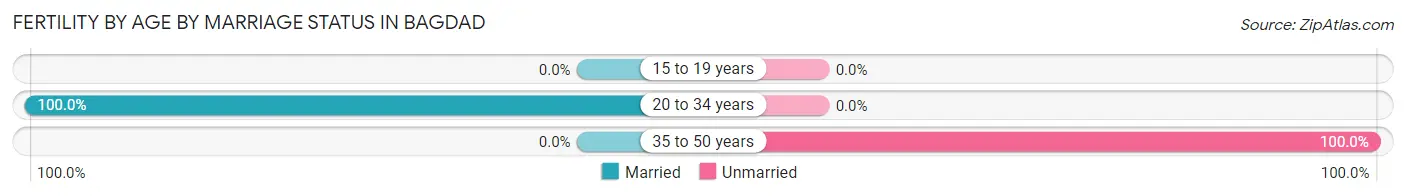
| Age Bracket | Married | Unmarried |
| 15 to 19 years | 0 (0.0%) | 0 (0.0%) |
| 20 to 34 years | 68 (100.0%) | 0 (0.0%) |
| 35 to 50 years | 0 (0.0%) | 43 (100.0%) |
| Total | 68 (61.3%) | 43 (38.7%) |
Fertility by Education in Bagdad
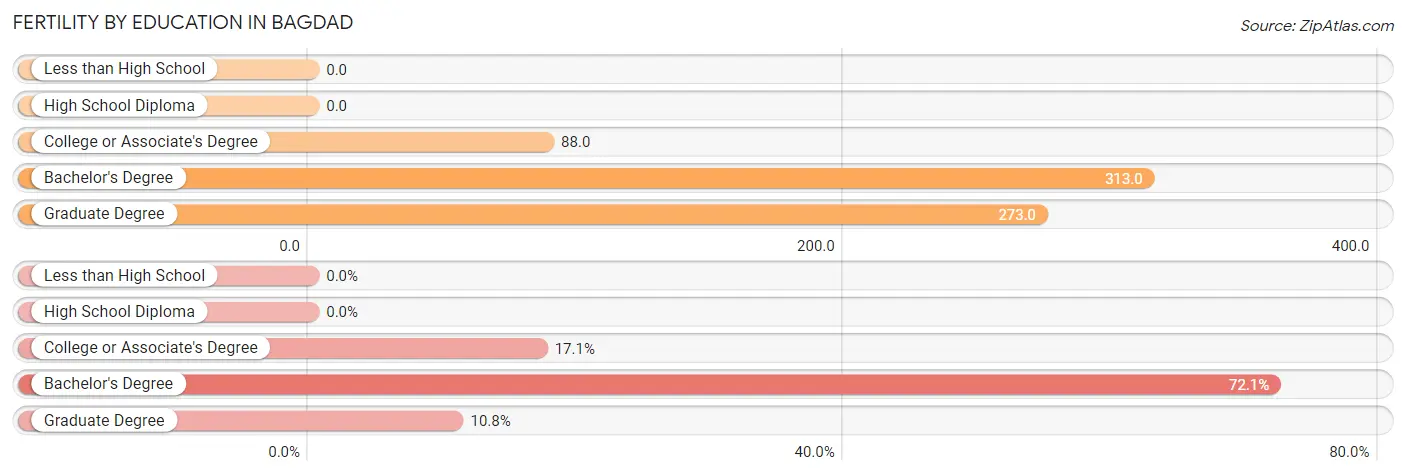
| Educational Attainment | Women with Births | Births / 1,000 Women |
| Less than High School | 0 (0.0%) | 0.0 |
| High School Diploma | 0 (0.0%) | 0.0 |
| College or Associate's Degree | 19 (17.1%) | 88.0 |
| Bachelor's Degree | 80 (72.1%) | 313.0 |
| Graduate Degree | 12 (10.8%) | 273.0 |
| Total | 111 (100.0%) | 108.0 |
Fertility by Education by Marriage Status in Bagdad
38.7% of women with births in Bagdad are unmarried. Women with the educational attainment of college or associate's degree are most likely to be married with 100.0% of them married at childbirth, while women with the educational attainment of bachelor's degree are least likely to be married with 53.7% of them unmarried at childbirth.
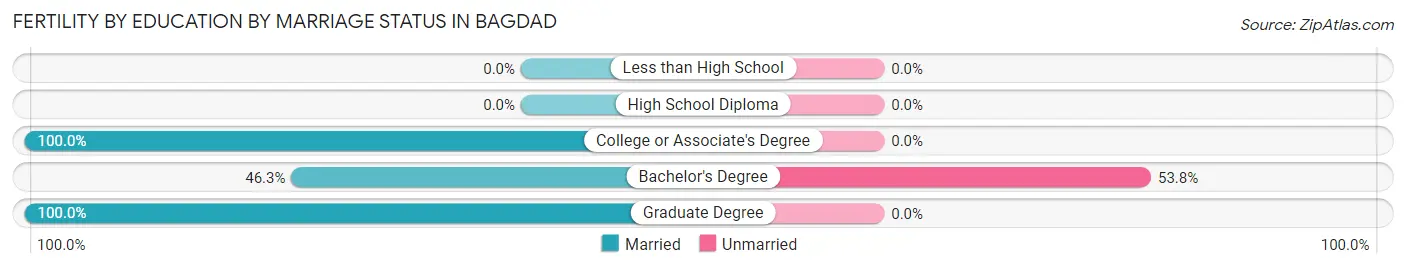
| Educational Attainment | Married | Unmarried |
| Less than High School | 0 (0.0%) | 0 (0.0%) |
| High School Diploma | 0 (0.0%) | 0 (0.0%) |
| College or Associate's Degree | 19 (100.0%) | 0 (0.0%) |
| Bachelor's Degree | 37 (46.3%) | 43 (53.7%) |
| Graduate Degree | 12 (100.0%) | 0 (0.0%) |
| Total | 68 (61.3%) | 43 (38.7%) |
Income in Bagdad
Income Overview in Bagdad
Per Capita Income in Bagdad is $35,716, while median incomes of families and households are $82,284 and $78,182 respectively.
| Characteristic | Number | Measure |
| Per Capita Income | 4,359 | $35,716 |
| Median Family Income | 1,332 | $82,284 |
| Mean Family Income | 1,332 | $98,706 |
| Median Household Income | 1,658 | $78,182 |
| Mean Household Income | 1,658 | $88,699 |
| Income Deficit | 1,332 | $0 |
| Wage / Income Gap (%) | 4,359 | 17.46% |
| Wage / Income Gap ($) | 4,359 | 82.54¢ per $1 |
| Gini / Inequality Index | 4,359 | 0.34 |
Earnings by Sex in Bagdad
Average Earnings in Bagdad are $40,748, $43,419 for men and $35,837 for women, a difference of 17.5%.
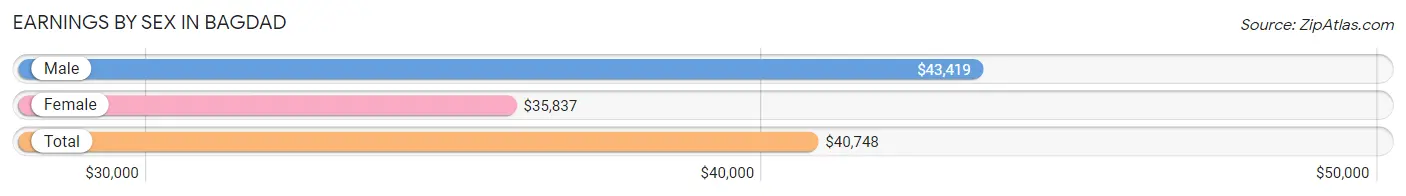
| Sex | Number | Average Earnings |
| Male | 1,307 (51.7%) | $43,419 |
| Female | 1,221 (48.3%) | $35,837 |
| Total | 2,528 (100.0%) | $40,748 |
Earnings by Sex by Income Bracket in Bagdad
The most common earnings brackets in Bagdad are $40,000 to $44,999 for men (207 | 15.8%) and $65,000 to $74,999 for women (172 | 14.1%).
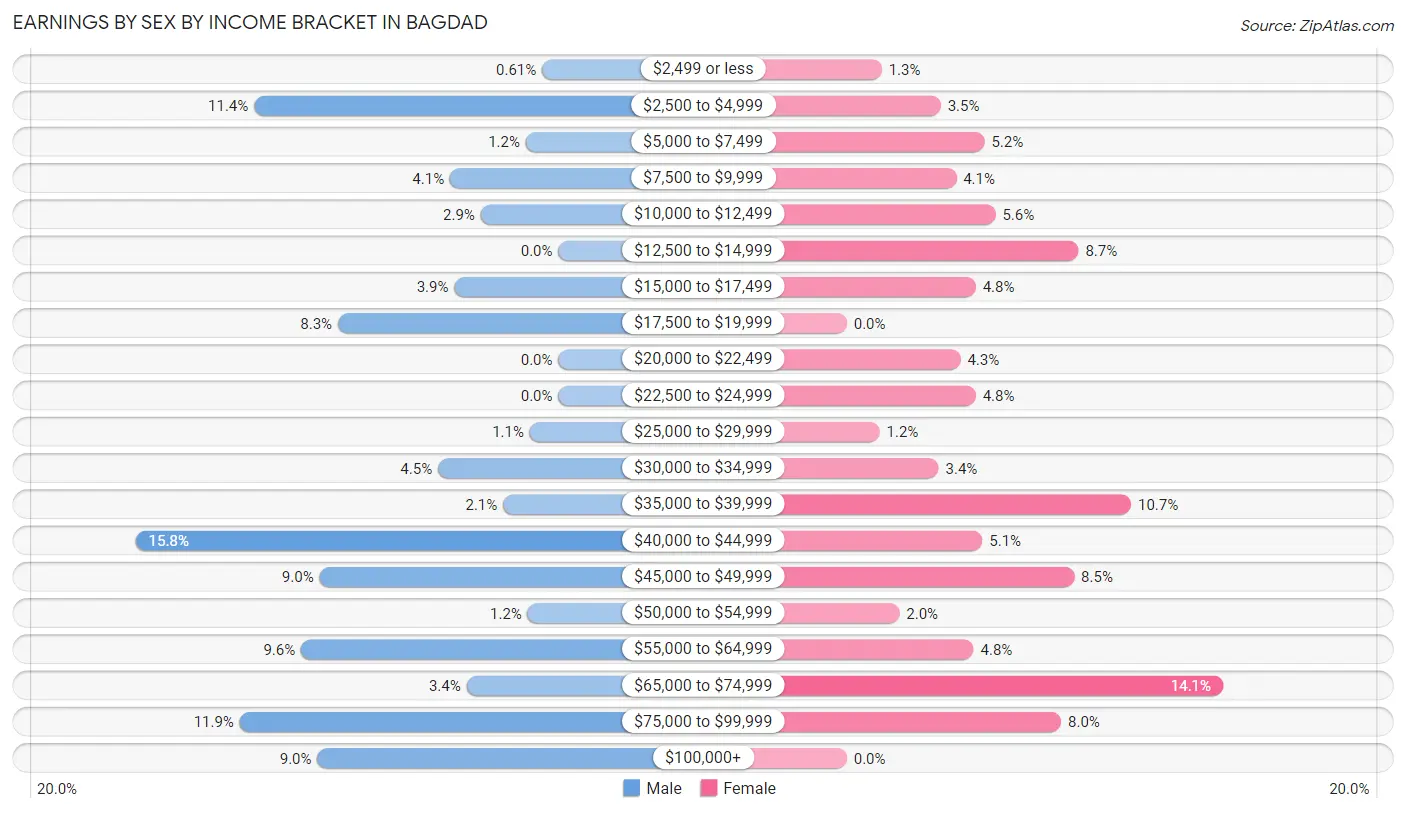
| Income | Male | Female |
| $2,499 or less | 8 (0.6%) | 16 (1.3%) |
| $2,500 to $4,999 | 149 (11.4%) | 43 (3.5%) |
| $5,000 to $7,499 | 16 (1.2%) | 63 (5.2%) |
| $7,500 to $9,999 | 53 (4.1%) | 50 (4.1%) |
| $10,000 to $12,499 | 38 (2.9%) | 68 (5.6%) |
| $12,500 to $14,999 | 0 (0.0%) | 106 (8.7%) |
| $15,000 to $17,499 | 51 (3.9%) | 59 (4.8%) |
| $17,500 to $19,999 | 108 (8.3%) | 0 (0.0%) |
| $20,000 to $22,499 | 0 (0.0%) | 52 (4.3%) |
| $22,500 to $24,999 | 0 (0.0%) | 59 (4.8%) |
| $25,000 to $29,999 | 14 (1.1%) | 15 (1.2%) |
| $30,000 to $34,999 | 59 (4.5%) | 42 (3.4%) |
| $35,000 to $39,999 | 27 (2.1%) | 130 (10.6%) |
| $40,000 to $44,999 | 207 (15.8%) | 62 (5.1%) |
| $45,000 to $49,999 | 117 (8.9%) | 104 (8.5%) |
| $50,000 to $54,999 | 15 (1.1%) | 24 (2.0%) |
| $55,000 to $64,999 | 126 (9.6%) | 58 (4.8%) |
| $65,000 to $74,999 | 45 (3.4%) | 172 (14.1%) |
| $75,000 to $99,999 | 156 (11.9%) | 98 (8.0%) |
| $100,000+ | 118 (9.0%) | 0 (0.0%) |
| Total | 1,307 (100.0%) | 1,221 (100.0%) |
Earnings by Sex by Educational Attainment in Bagdad
Average earnings in Bagdad are $45,187 for men and $39,028 for women, a difference of 13.6%. Men with an educational attainment of college or associate's degree enjoy the highest average annual earnings of $46,523, while those with high school diploma education earn the least with $34,331. Women with an educational attainment of bachelor's degree earn the most with the average annual earnings of $36,637, while those with college or associate's degree education have the smallest earnings of $35,884.
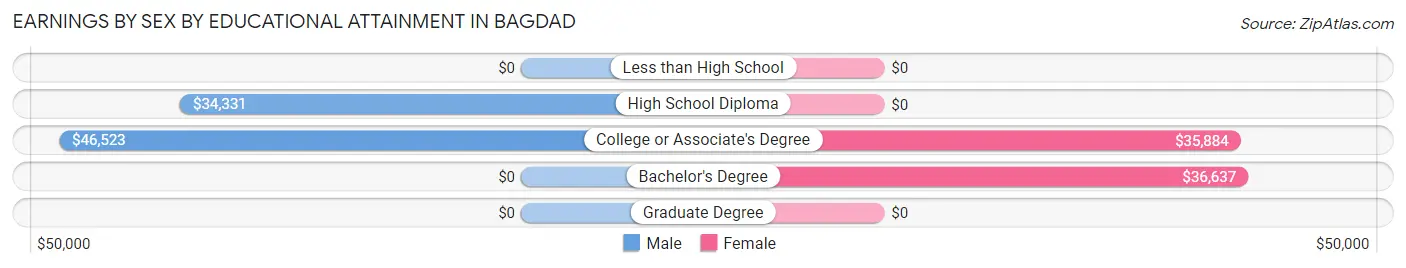
| Educational Attainment | Male Income | Female Income |
| Less than High School | - | - |
| High School Diploma | $34,331 | $0 |
| College or Associate's Degree | $46,523 | $35,884 |
| Bachelor's Degree | - | - |
| Graduate Degree | - | - |
| Total | $45,187 | $39,028 |
Family Income in Bagdad
Family Income Brackets in Bagdad
According to the Bagdad family income data, there are 348 families falling into the $100,000 to $149,999 income range, which is the most common income bracket and makes up 26.1% of all families.
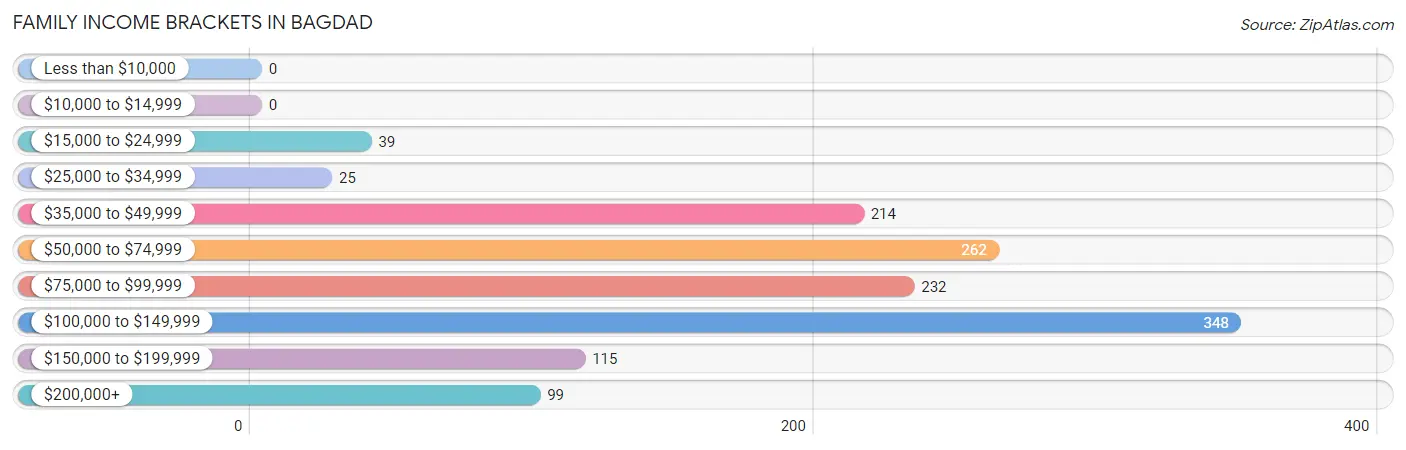
| Income Bracket | # Families | % Families |
| Less than $10,000 | 0 | 0.0% |
| $10,000 to $14,999 | 0 | 0.0% |
| $15,000 to $24,999 | 39 | 2.9% |
| $25,000 to $34,999 | 25 | 1.9% |
| $35,000 to $49,999 | 214 | 16.1% |
| $50,000 to $74,999 | 262 | 19.7% |
| $75,000 to $99,999 | 232 | 17.4% |
| $100,000 to $149,999 | 348 | 26.1% |
| $150,000 to $199,999 | 115 | 8.6% |
| $200,000+ | 99 | 7.4% |
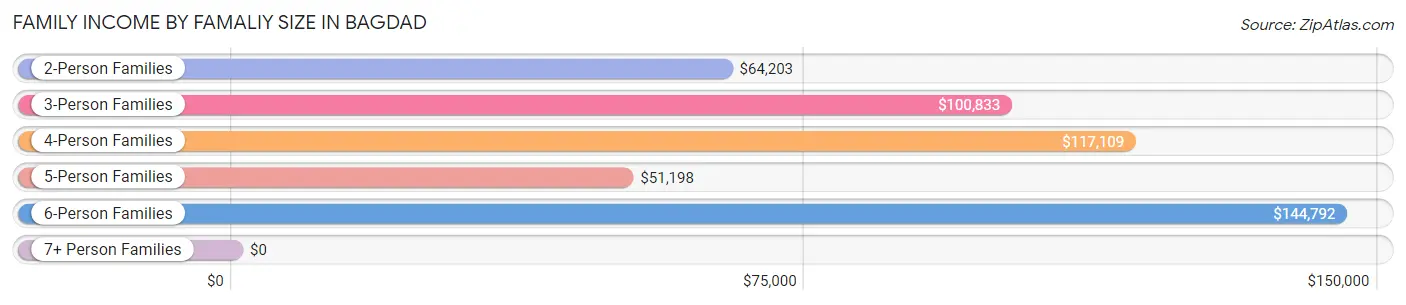
Family Income by Famaliy Size in Bagdad
6-person families (25 | 1.9%) account for the highest median family income in Bagdad with $144,792 per family, while 3-person families (370 | 27.8%) have the highest median income of $33,611 per family member.
| Income Bracket | # Families | Median Income |
| 2-Person Families | 660 (49.5%) | $64,203 |
| 3-Person Families | 370 (27.8%) | $100,833 |
| 4-Person Families | 234 (17.6%) | $117,109 |
| 5-Person Families | 43 (3.2%) | $51,198 |
| 6-Person Families | 25 (1.9%) | $144,792 |
| 7+ Person Families | 0 (0.0%) | $0 |
| Total | 1,332 (100.0%) | $82,284 |
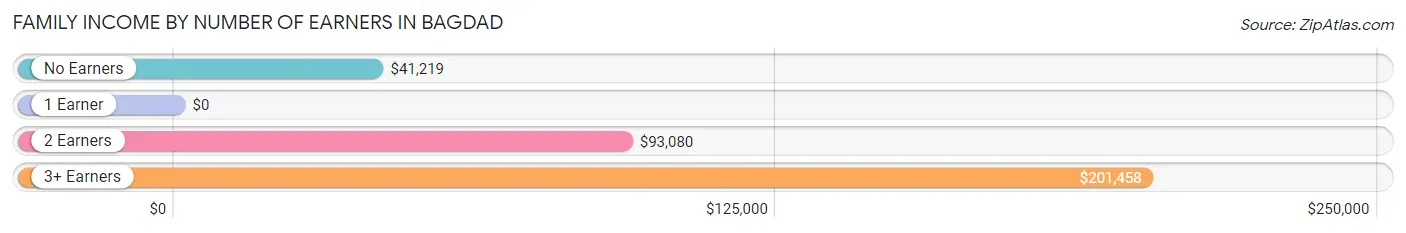
Family Income by Number of Earners in Bagdad
| Number of Earners | # Families | Median Income |
| No Earners | 147 (11.0%) | $41,219 |
| 1 Earner | 417 (31.3%) | $0 |
| 2 Earners | 621 (46.6%) | $93,080 |
| 3+ Earners | 147 (11.0%) | $201,458 |
| Total | 1,332 (100.0%) | $82,284 |
Household Income in Bagdad
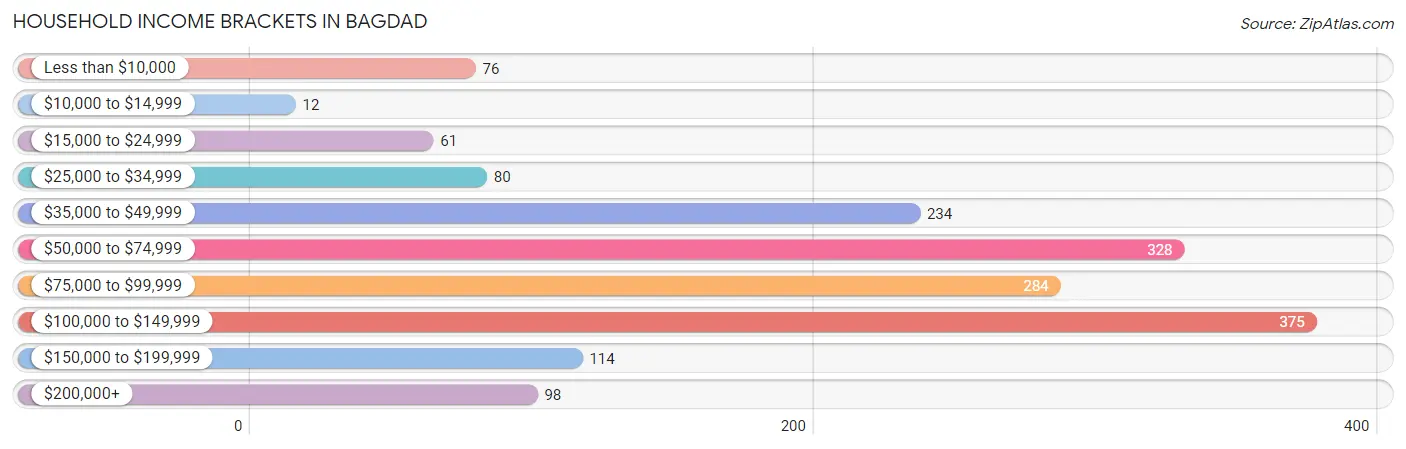
Household Income Brackets in Bagdad
With 375 households falling in the category, the $100,000 to $149,999 income range is the most frequent in Bagdad, accounting for 22.6% of all households. In contrast, only 12 households (0.7%) fall into the $10,000 to $14,999 income bracket, making it the least populous group.
| Income Bracket | # Households | % Households |
| Less than $10,000 | 76 | 4.6% |
| $10,000 to $14,999 | 12 | 0.7% |
| $15,000 to $24,999 | 61 | 3.7% |
| $25,000 to $34,999 | 80 | 4.8% |
| $35,000 to $49,999 | 234 | 14.1% |
| $50,000 to $74,999 | 328 | 19.8% |
| $75,000 to $99,999 | 284 | 17.1% |
| $100,000 to $149,999 | 375 | 22.6% |
| $150,000 to $199,999 | 114 | 6.9% |
| $200,000+ | 98 | 5.9% |
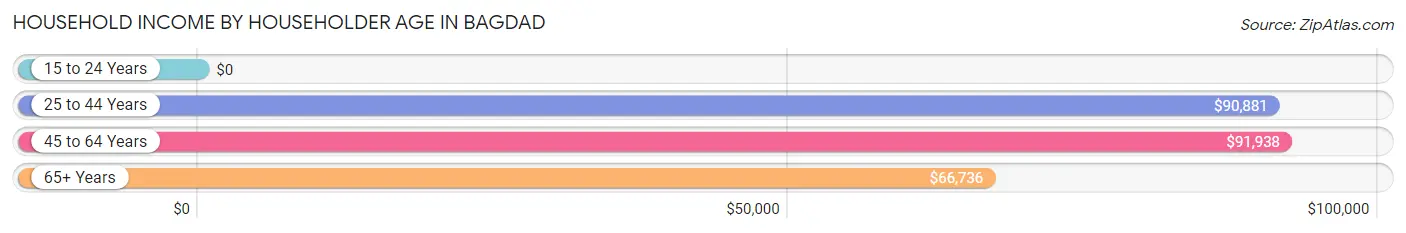
Household Income by Householder Age in Bagdad
The median household income in Bagdad is $78,182, with the highest median household income of $91,938 found in the 45 to 64 years age bracket for the primary householder. A total of 573 households (34.6%) fall into this category. Meanwhile, the 15 to 24 years age bracket for the primary householder has the lowest median household income of $0, with 92 households (5.6%) in this group.
| Income Bracket | # Households | Median Income |
| 15 to 24 Years | 92 (5.6%) | $0 |
| 25 to 44 Years | 451 (27.2%) | $90,881 |
| 45 to 64 Years | 573 (34.6%) | $91,938 |
| 65+ Years | 542 (32.7%) | $66,736 |
| Total | 1,658 (100.0%) | $78,182 |
Poverty in Bagdad
Income Below Poverty by Sex and Age in Bagdad
With 2.5% poverty level for males and 3.5% for females among the residents of Bagdad, 55 to 64 year old males and 65 to 74 year old females are the most vulnerable to poverty, with 26 males (11.5%) and 51 females (24.1%) in their respective age groups living below the poverty level.
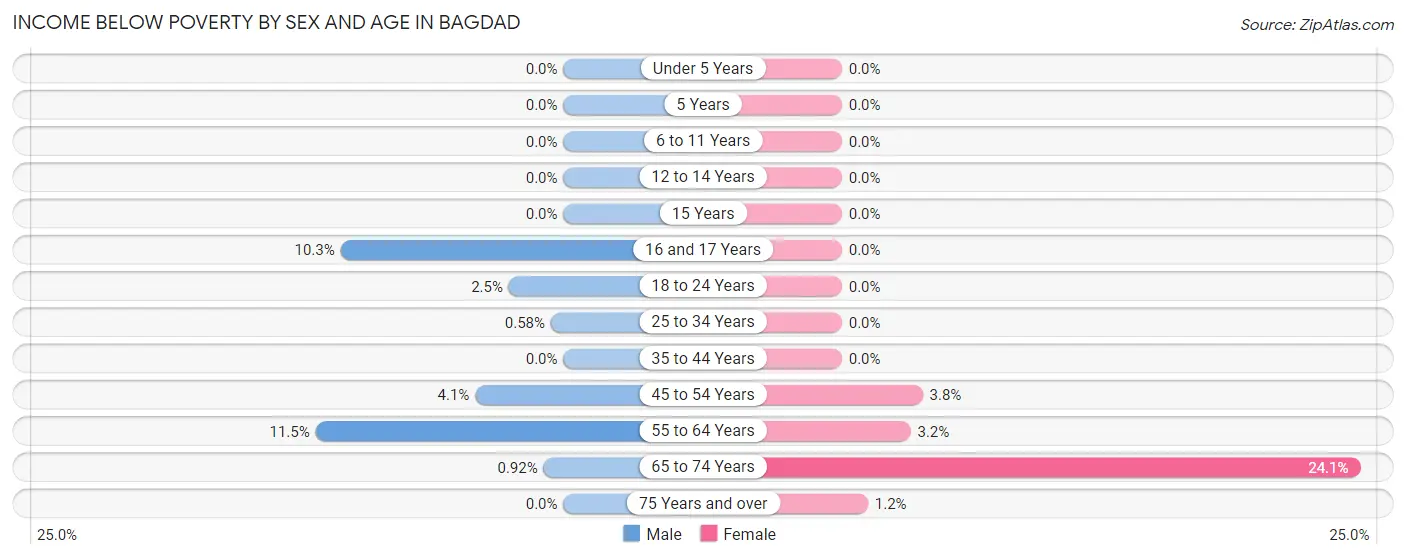
| Age Bracket | Male | Female |
| Under 5 Years | 0 (0.0%) | 0 (0.0%) |
| 5 Years | 0 (0.0%) | 0 (0.0%) |
| 6 to 11 Years | 0 (0.0%) | 0 (0.0%) |
| 12 to 14 Years | 0 (0.0%) | 0 (0.0%) |
| 15 Years | 0 (0.0%) | 0 (0.0%) |
| 16 and 17 Years | 9 (10.3%) | 0 (0.0%) |
| 18 to 24 Years | 8 (2.5%) | 0 (0.0%) |
| 25 to 34 Years | 1 (0.6%) | 0 (0.0%) |
| 35 to 44 Years | 0 (0.0%) | 0 (0.0%) |
| 45 to 54 Years | 9 (4.1%) | 9 (3.7%) |
| 55 to 64 Years | 26 (11.5%) | 13 (3.2%) |
| 65 to 74 Years | 2 (0.9%) | 51 (24.1%) |
| 75 Years and over | 0 (0.0%) | 2 (1.2%) |
| Total | 55 (2.5%) | 75 (3.5%) |
Income Above Poverty by Sex and Age in Bagdad
According to the poverty statistics in Bagdad, males aged under 5 years and females aged under 5 years are the age groups that are most secure financially, with 100.0% of males and 100.0% of females in these age groups living above the poverty line.
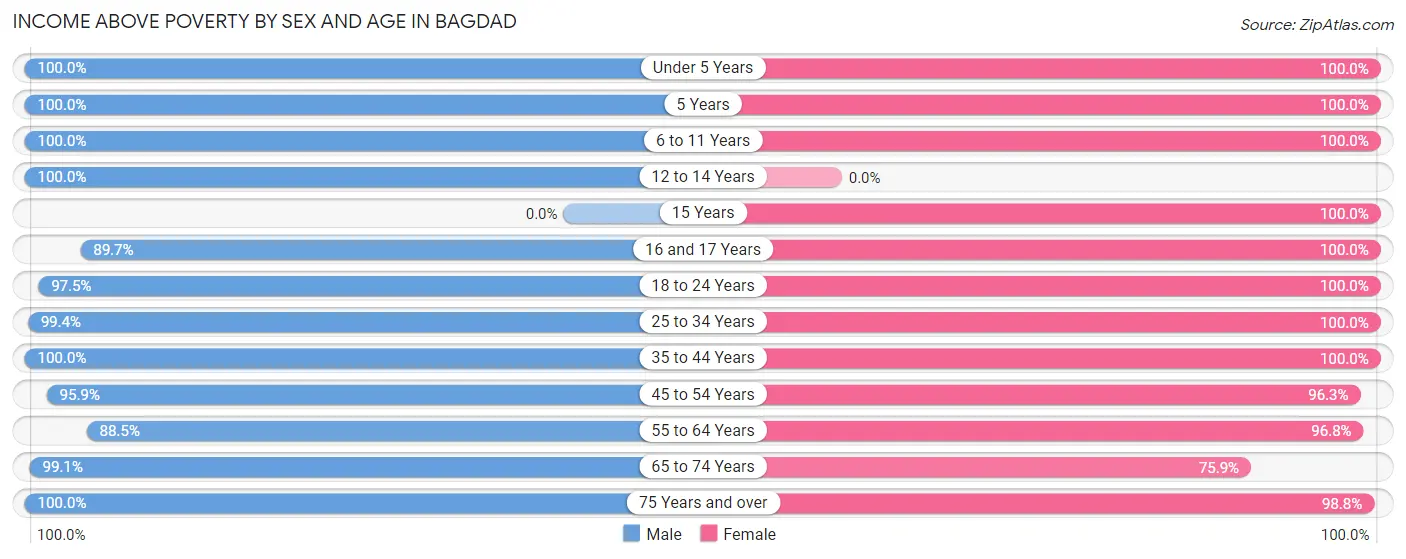
| Age Bracket | Male | Female |
| Under 5 Years | 287 (100.0%) | 28 (100.0%) |
| 5 Years | 10 (100.0%) | 11 (100.0%) |
| 6 to 11 Years | 97 (100.0%) | 156 (100.0%) |
| 12 to 14 Years | 125 (100.0%) | 0 (0.0%) |
| 15 Years | 0 (0.0%) | 63 (100.0%) |
| 16 and 17 Years | 78 (89.7%) | 50 (100.0%) |
| 18 to 24 Years | 308 (97.5%) | 218 (100.0%) |
| 25 to 34 Years | 171 (99.4%) | 399 (100.0%) |
| 35 to 44 Years | 345 (100.0%) | 173 (100.0%) |
| 45 to 54 Years | 211 (95.9%) | 231 (96.3%) |
| 55 to 64 Years | 200 (88.5%) | 394 (96.8%) |
| 65 to 74 Years | 215 (99.1%) | 161 (75.9%) |
| 75 Years and over | 135 (100.0%) | 163 (98.8%) |
| Total | 2,182 (97.5%) | 2,047 (96.5%) |
Income Below Poverty Among Married-Couple Families in Bagdad
The poverty statistics for married-couple families in Bagdad show that 0.9% or 9 of the total 945 families live below the poverty line. Families with 1 or 2 children have the highest poverty rate of 2.3%, comprising of 9 families. On the other hand, families with no children have the lowest poverty rate of 0.0%, which includes 0 families.
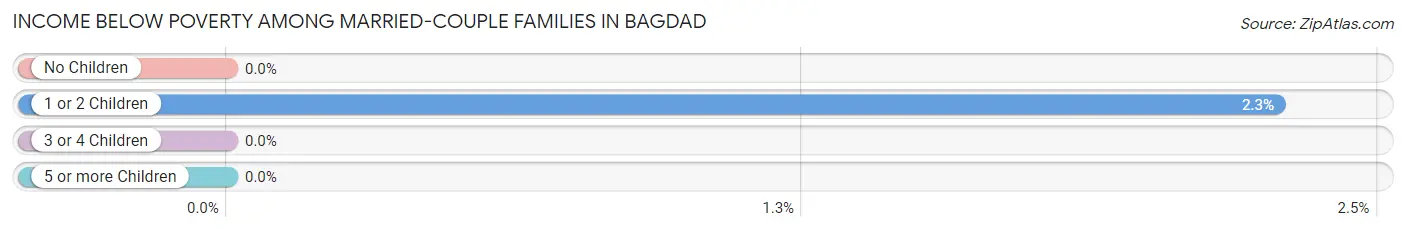
| Children | Above Poverty | Below Poverty |
| No Children | 512 (100.0%) | 0 (0.0%) |
| 1 or 2 Children | 386 (97.7%) | 9 (2.3%) |
| 3 or 4 Children | 38 (100.0%) | 0 (0.0%) |
| 5 or more Children | 0 (0.0%) | 0 (0.0%) |
| Total | 936 (99.1%) | 9 (0.9%) |
Income Below Poverty Among Single-Parent Households in Bagdad
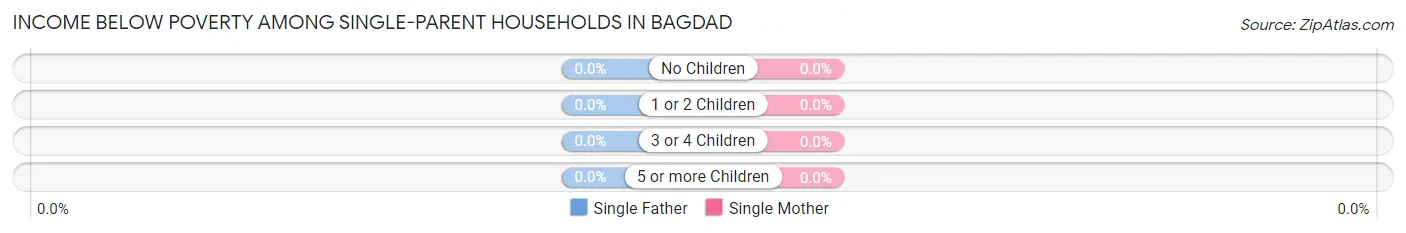
| Children | Single Father | Single Mother |
| No Children | 0 (0.0%) | 0 (0.0%) |
| 1 or 2 Children | 0 (0.0%) | 0 (0.0%) |
| 3 or 4 Children | 0 (0.0%) | 0 (0.0%) |
| 5 or more Children | 0 (0.0%) | 0 (0.0%) |
| Total | 0 (0.0%) | 0 (0.0%) |
Income Below Poverty Among Married-Couple vs Single-Parent Households in Bagdad
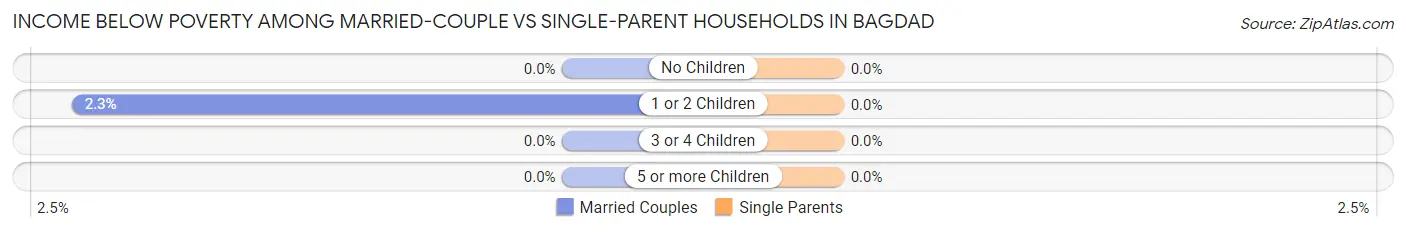
| Children | Married-Couple Families | Single-Parent Households |
| No Children | 0 (0.0%) | 0 (0.0%) |
| 1 or 2 Children | 9 (2.3%) | 0 (0.0%) |
| 3 or 4 Children | 0 (0.0%) | 0 (0.0%) |
| 5 or more Children | 0 (0.0%) | 0 (0.0%) |
| Total | 9 (0.9%) | 0 (0.0%) |
Employment Characteristics in Bagdad
Employment by Class of Employer in Bagdad
Among the 2,092 employed individuals in Bagdad, private company employees (1,251 | 59.8%), not-for-profit organizations (298 | 14.2%), and federal government employees (212 | 10.1%) make up the most common classes of employment.
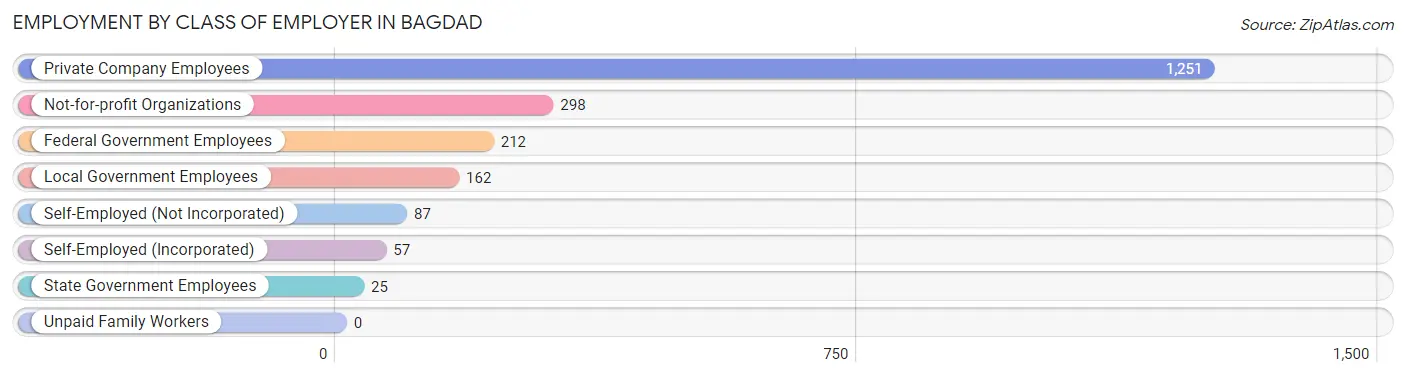
| Employer Class | # Employees | % Employees |
| Private Company Employees | 1,251 | 59.8% |
| Self-Employed (Incorporated) | 57 | 2.7% |
| Self-Employed (Not Incorporated) | 87 | 4.2% |
| Not-for-profit Organizations | 298 | 14.2% |
| Local Government Employees | 162 | 7.7% |
| State Government Employees | 25 | 1.2% |
| Federal Government Employees | 212 | 10.1% |
| Unpaid Family Workers | 0 | 0.0% |
| Total | 2,092 | 100.0% |
Employment Status by Age in Bagdad
According to the labor force statistics for Bagdad, out of the total population over 16 years of age (3,582), 64.9% or 2,325 individuals are in the labor force, with 1.1% or 26 of them unemployed. The age group with the highest labor force participation rate is 25 to 29 years, with 99.3% or 305 individuals in the labor force. Within the labor force, the 35 to 44 years age range has the highest percentage of unemployed individuals, with 5.2% or 25 of them being unemployed.
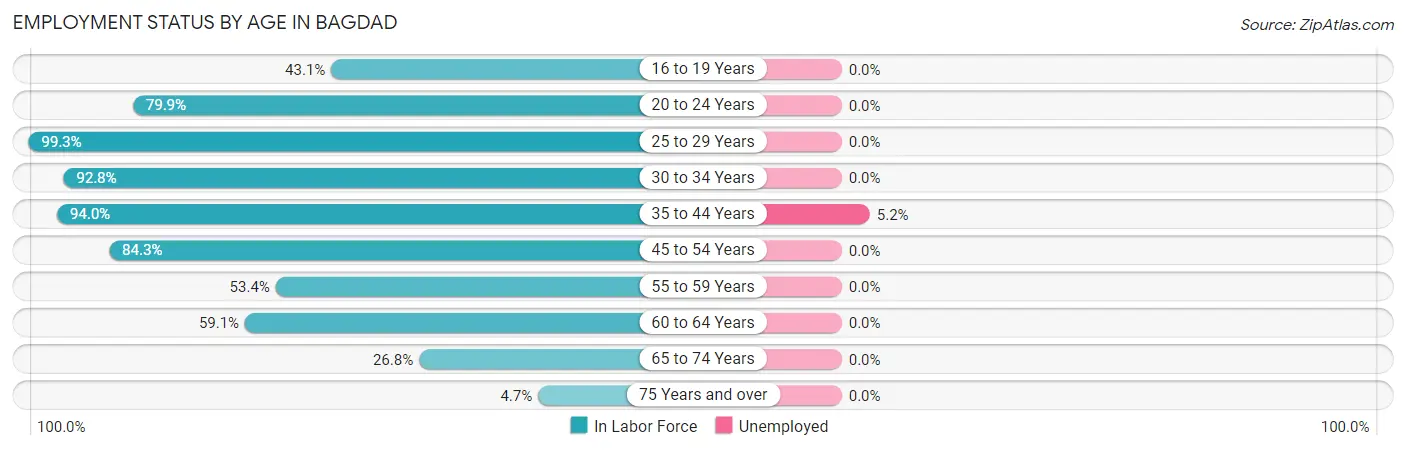
| Age Bracket | In Labor Force | Unemployed |
| 16 to 19 Years | 148 (43.1%) | 0 (0.0%) |
| 20 to 24 Years | 262 (79.9%) | 0 (0.0%) |
| 25 to 29 Years | 305 (99.3%) | 0 (0.0%) |
| 30 to 34 Years | 245 (92.8%) | 0 (0.0%) |
| 35 to 44 Years | 487 (94.0%) | 25 (5.2%) |
| 45 to 54 Years | 388 (84.3%) | 0 (0.0%) |
| 55 to 59 Years | 132 (53.4%) | 0 (0.0%) |
| 60 to 64 Years | 228 (59.1%) | 0 (0.0%) |
| 65 to 74 Years | 115 (26.8%) | 0 (0.0%) |
| 75 Years and over | 14 (4.7%) | 0 (0.0%) |
| Total | 2,325 (64.9%) | 26 (1.1%) |
Employment Status by Educational Attainment in Bagdad
According to labor force statistics for Bagdad, 81.8% of individuals (1,785) out of the total population between 25 and 64 years of age (2,182) are in the labor force, with 1.4% or 25 of them being unemployed. The group with the highest labor force participation rate are those with the educational attainment of college / associate degree, with 88.3% or 786 individuals in the labor force. Within the labor force, individuals with high school diploma education have the highest percentage of unemployment, with 2.6% or 11 of them being unemployed.
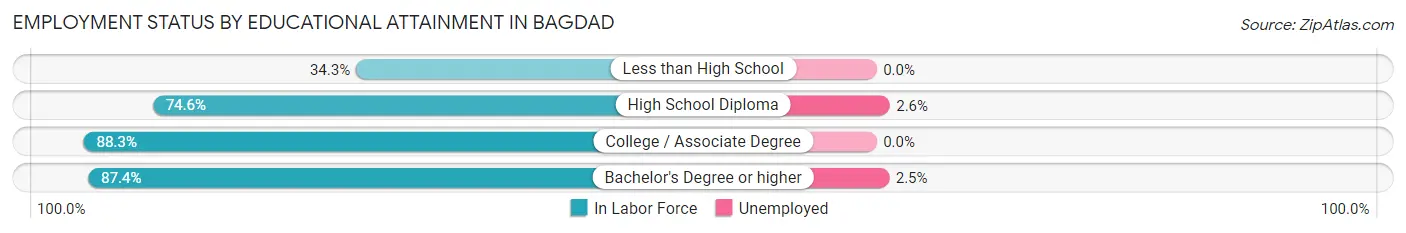
| Educational Attainment | In Labor Force | Unemployed |
| Less than High School | 36 (34.3%) | 0 (0.0%) |
| High School Diploma | 435 (74.6%) | 15 (2.6%) |
| College / Associate Degree | 786 (88.3%) | 0 (0.0%) |
| Bachelor's Degree or higher | 528 (87.4%) | 15 (2.5%) |
| Total | 1,785 (81.8%) | 31 (1.4%) |
Employment Occupations by Sex in Bagdad
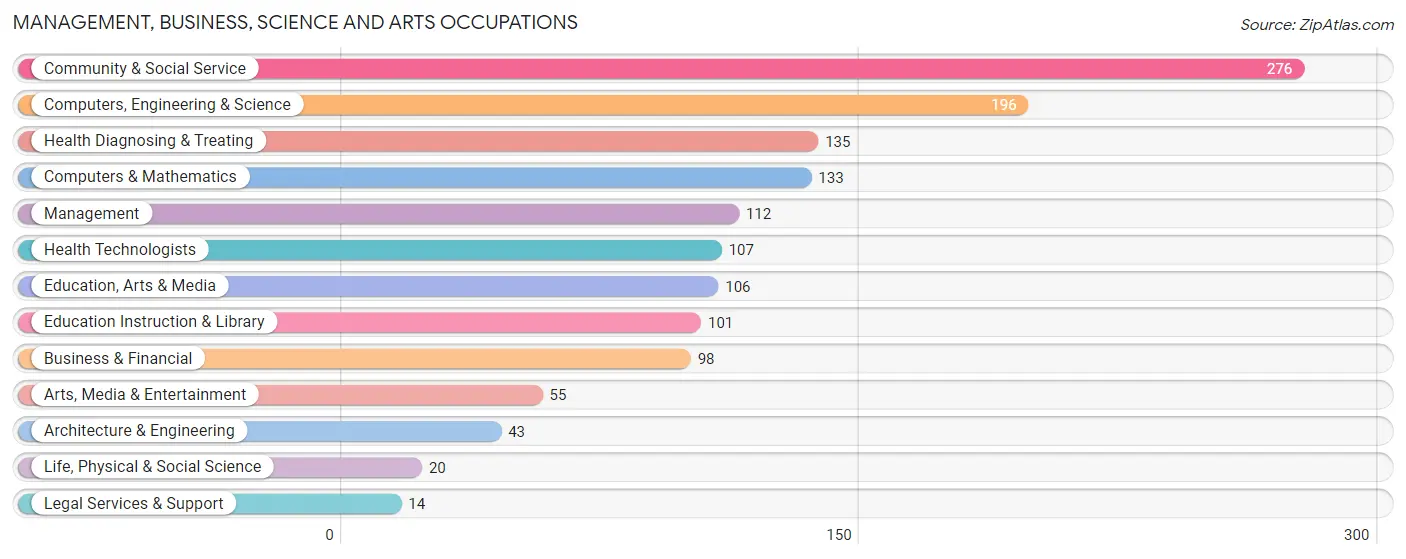
Management, Business, Science and Arts Occupations
The most common Management, Business, Science and Arts occupations in Bagdad are Community & Social Service (276 | 12.5%), Computers, Engineering & Science (196 | 8.8%), Health Diagnosing & Treating (135 | 6.1%), Computers & Mathematics (133 | 6.0%), and Management (112 | 5.1%).
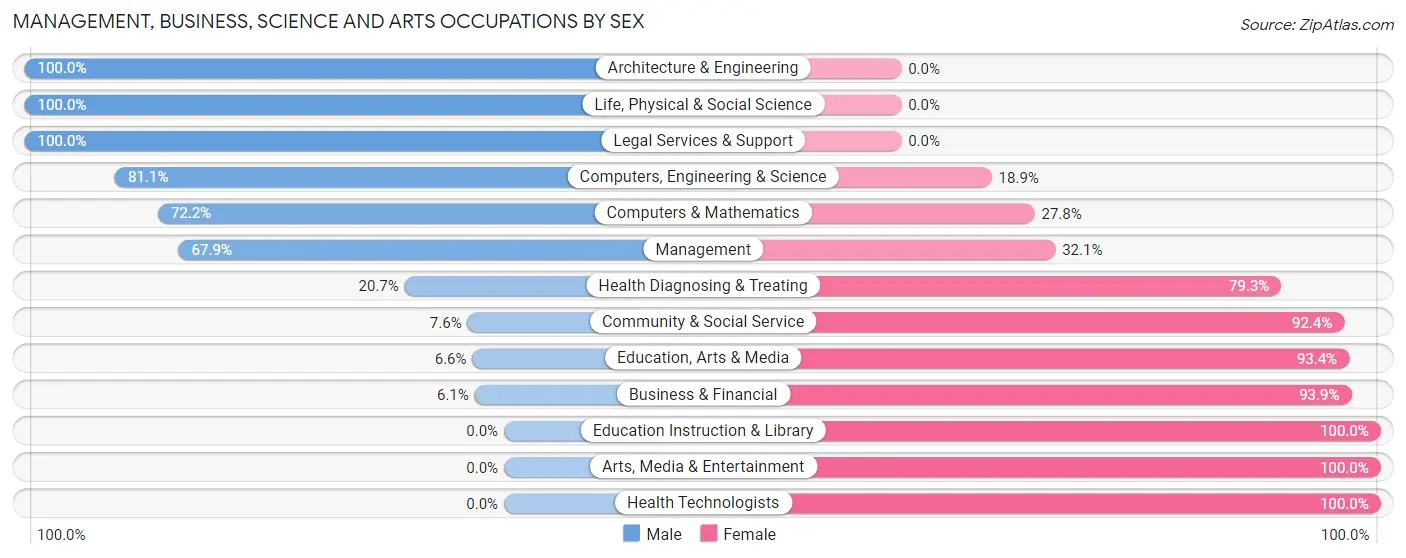
Management, Business, Science and Arts Occupations by Sex
Within the Management, Business, Science and Arts occupations in Bagdad, the most male-oriented occupations are Architecture & Engineering (100.0%), Life, Physical & Social Science (100.0%), and Legal Services & Support (100.0%), while the most female-oriented occupations are Education Instruction & Library (100.0%), Arts, Media & Entertainment (100.0%), and Health Technologists (100.0%).
| Occupation | Male | Female |
| Management | 76 (67.9%) | 36 (32.1%) |
| Business & Financial | 6 (6.1%) | 92 (93.9%) |
| Computers, Engineering & Science | 159 (81.1%) | 37 (18.9%) |
| Computers & Mathematics | 96 (72.2%) | 37 (27.8%) |
| Architecture & Engineering | 43 (100.0%) | 0 (0.0%) |
| Life, Physical & Social Science | 20 (100.0%) | 0 (0.0%) |
| Community & Social Service | 21 (7.6%) | 255 (92.4%) |
| Education, Arts & Media | 7 (6.6%) | 99 (93.4%) |
| Legal Services & Support | 14 (100.0%) | 0 (0.0%) |
| Education Instruction & Library | 0 (0.0%) | 101 (100.0%) |
| Arts, Media & Entertainment | 0 (0.0%) | 55 (100.0%) |
| Health Diagnosing & Treating | 28 (20.7%) | 107 (79.3%) |
| Health Technologists | 0 (0.0%) | 107 (100.0%) |
| Total (Category) | 290 (35.5%) | 527 (64.5%) |
| Total (Overall) | 1,062 (47.9%) | 1,153 (52.0%) |
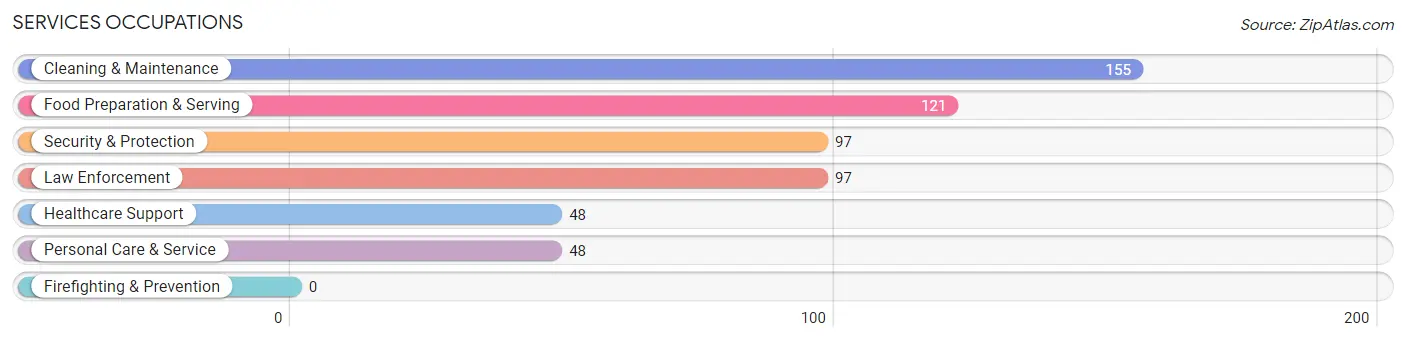
Services Occupations
The most common Services occupations in Bagdad are Cleaning & Maintenance (155 | 7.0%), Food Preparation & Serving (121 | 5.5%), Security & Protection (97 | 4.4%), Law Enforcement (97 | 4.4%), and Healthcare Support (48 | 2.2%).
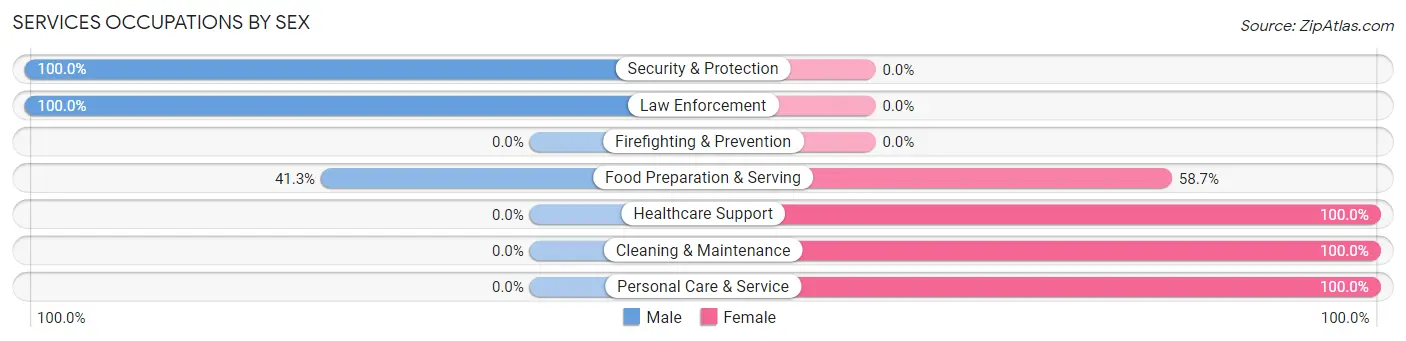
Services Occupations by Sex
Within the Services occupations in Bagdad, the most male-oriented occupations are Security & Protection (100.0%), Law Enforcement (100.0%), and Food Preparation & Serving (41.3%), while the most female-oriented occupations are Healthcare Support (100.0%), Cleaning & Maintenance (100.0%), and Personal Care & Service (100.0%).
| Occupation | Male | Female |
| Healthcare Support | 0 (0.0%) | 48 (100.0%) |
| Security & Protection | 97 (100.0%) | 0 (0.0%) |
| Firefighting & Prevention | 0 (0.0%) | 0 (0.0%) |
| Law Enforcement | 97 (100.0%) | 0 (0.0%) |
| Food Preparation & Serving | 50 (41.3%) | 71 (58.7%) |
| Cleaning & Maintenance | 0 (0.0%) | 155 (100.0%) |
| Personal Care & Service | 0 (0.0%) | 48 (100.0%) |
| Total (Category) | 147 (31.3%) | 322 (68.7%) |
| Total (Overall) | 1,062 (47.9%) | 1,153 (52.0%) |
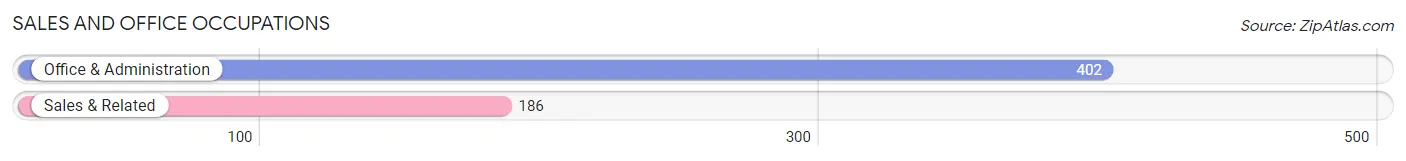
Sales and Office Occupations
The most common Sales and Office occupations in Bagdad are Office & Administration (402 | 18.1%), and Sales & Related (186 | 8.4%).
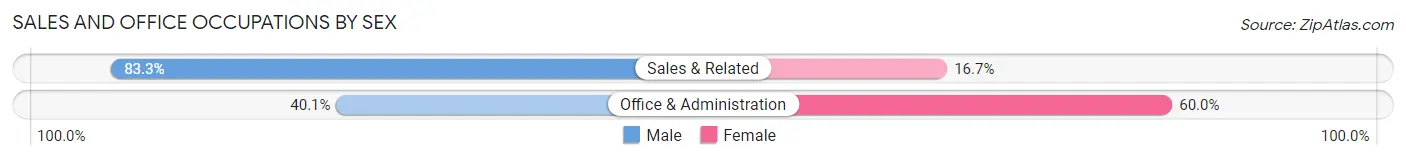
Sales and Office Occupations by Sex
| Occupation | Male | Female |
| Sales & Related | 155 (83.3%) | 31 (16.7%) |
| Office & Administration | 161 (40.1%) | 241 (60.0%) |
| Total (Category) | 316 (53.7%) | 272 (46.3%) |
| Total (Overall) | 1,062 (47.9%) | 1,153 (52.0%) |
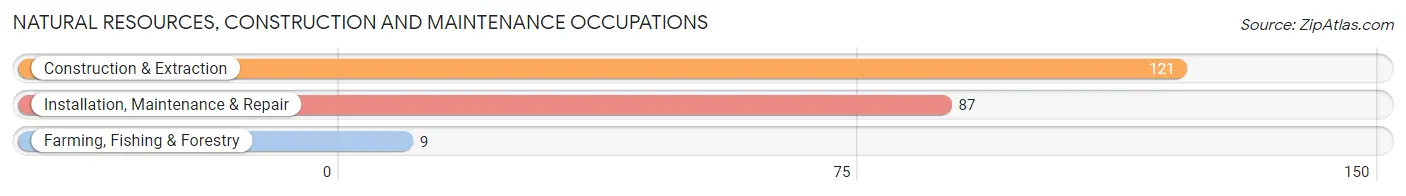
Natural Resources, Construction and Maintenance Occupations
The most common Natural Resources, Construction and Maintenance occupations in Bagdad are Construction & Extraction (121 | 5.5%), Installation, Maintenance & Repair (87 | 3.9%), and Farming, Fishing & Forestry (9 | 0.4%).
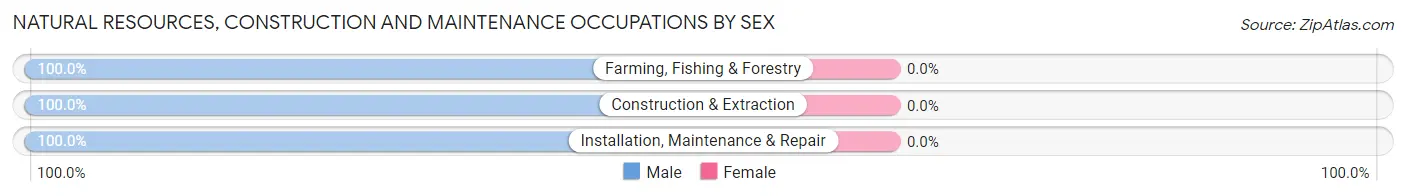
Natural Resources, Construction and Maintenance Occupations by Sex
| Occupation | Male | Female |
| Farming, Fishing & Forestry | 9 (100.0%) | 0 (0.0%) |
| Construction & Extraction | 121 (100.0%) | 0 (0.0%) |
| Installation, Maintenance & Repair | 87 (100.0%) | 0 (0.0%) |
| Total (Category) | 217 (100.0%) | 0 (0.0%) |
| Total (Overall) | 1,062 (47.9%) | 1,153 (52.0%) |
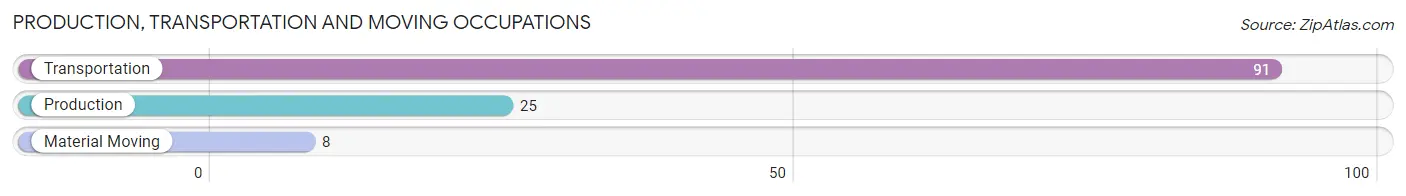
Production, Transportation and Moving Occupations
The most common Production, Transportation and Moving occupations in Bagdad are Transportation (91 | 4.1%), Production (25 | 1.1%), and Material Moving (8 | 0.4%).
Production, Transportation and Moving Occupations by Sex
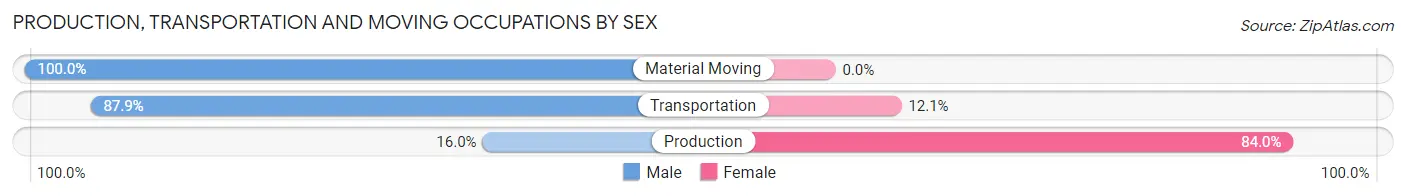
| Occupation | Male | Female |
| Production | 4 (16.0%) | 21 (84.0%) |
| Transportation | 80 (87.9%) | 11 (12.1%) |
| Material Moving | 8 (100.0%) | 0 (0.0%) |
| Total (Category) | 92 (74.2%) | 32 (25.8%) |
| Total (Overall) | 1,062 (47.9%) | 1,153 (52.0%) |
Employment Industries by Sex in Bagdad
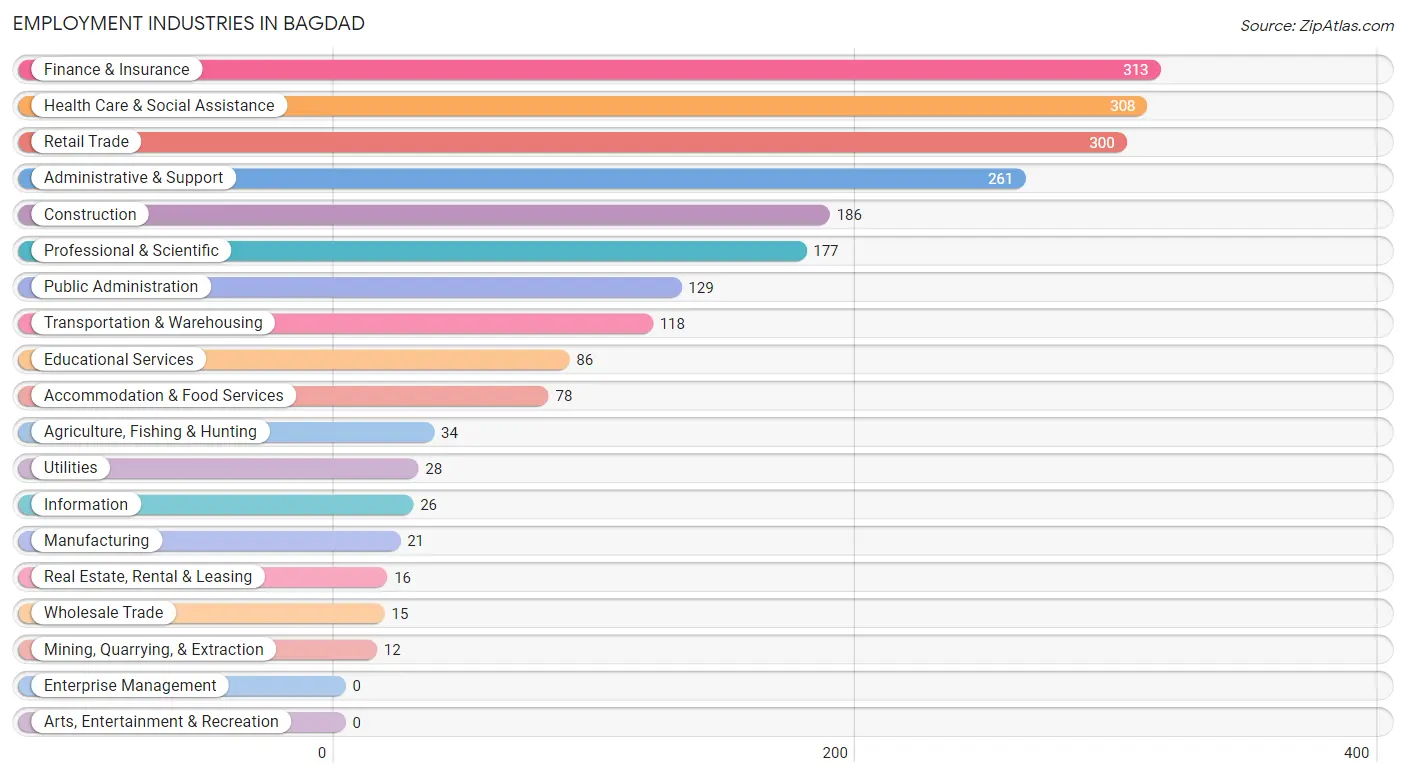
Employment Industries in Bagdad
The major employment industries in Bagdad include Finance & Insurance (313 | 14.1%), Health Care & Social Assistance (308 | 13.9%), Retail Trade (300 | 13.5%), Administrative & Support (261 | 11.8%), and Construction (186 | 8.4%).
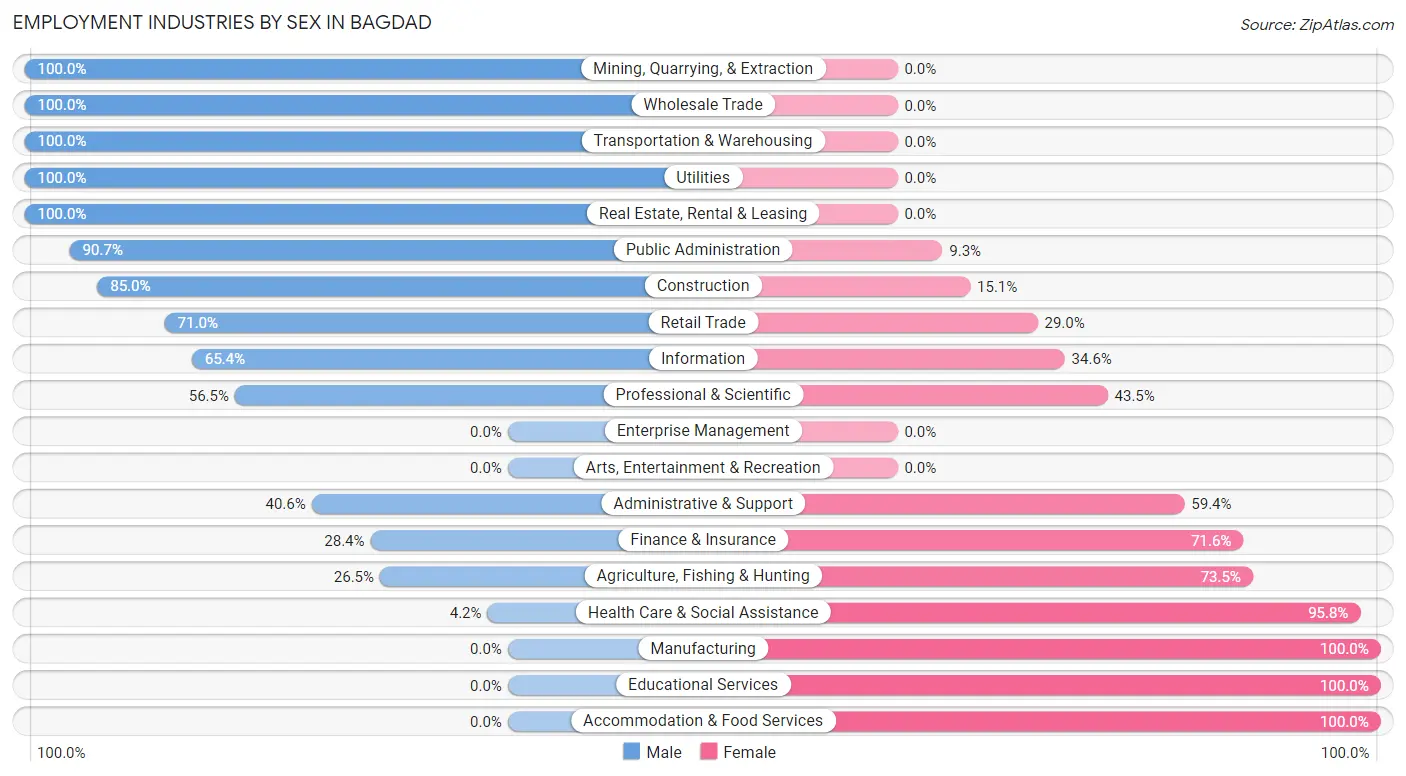
Employment Industries by Sex in Bagdad
The Bagdad industries that see more men than women are Mining, Quarrying, & Extraction (100.0%), Wholesale Trade (100.0%), and Transportation & Warehousing (100.0%), whereas the industries that tend to have a higher number of women are Manufacturing (100.0%), Educational Services (100.0%), and Accommodation & Food Services (100.0%).
| Industry | Male | Female |
| Agriculture, Fishing & Hunting | 9 (26.5%) | 25 (73.5%) |
| Mining, Quarrying, & Extraction | 12 (100.0%) | 0 (0.0%) |
| Construction | 158 (85.0%) | 28 (15.0%) |
| Manufacturing | 0 (0.0%) | 21 (100.0%) |
| Wholesale Trade | 15 (100.0%) | 0 (0.0%) |
| Retail Trade | 213 (71.0%) | 87 (29.0%) |
| Transportation & Warehousing | 118 (100.0%) | 0 (0.0%) |
| Utilities | 28 (100.0%) | 0 (0.0%) |
| Information | 17 (65.4%) | 9 (34.6%) |
| Finance & Insurance | 89 (28.4%) | 224 (71.6%) |
| Real Estate, Rental & Leasing | 16 (100.0%) | 0 (0.0%) |
| Professional & Scientific | 100 (56.5%) | 77 (43.5%) |
| Enterprise Management | 0 (0.0%) | 0 (0.0%) |
| Administrative & Support | 106 (40.6%) | 155 (59.4%) |
| Educational Services | 0 (0.0%) | 86 (100.0%) |
| Health Care & Social Assistance | 13 (4.2%) | 295 (95.8%) |
| Arts, Entertainment & Recreation | 0 (0.0%) | 0 (0.0%) |
| Accommodation & Food Services | 0 (0.0%) | 78 (100.0%) |
| Public Administration | 117 (90.7%) | 12 (9.3%) |
| Total | 1,062 (47.9%) | 1,153 (52.0%) |
Education in Bagdad
School Enrollment in Bagdad
The most common levels of schooling among the 790 students in Bagdad are high school (256 | 32.4%), elementary school (200 | 25.3%), and middle school (178 | 22.5%).
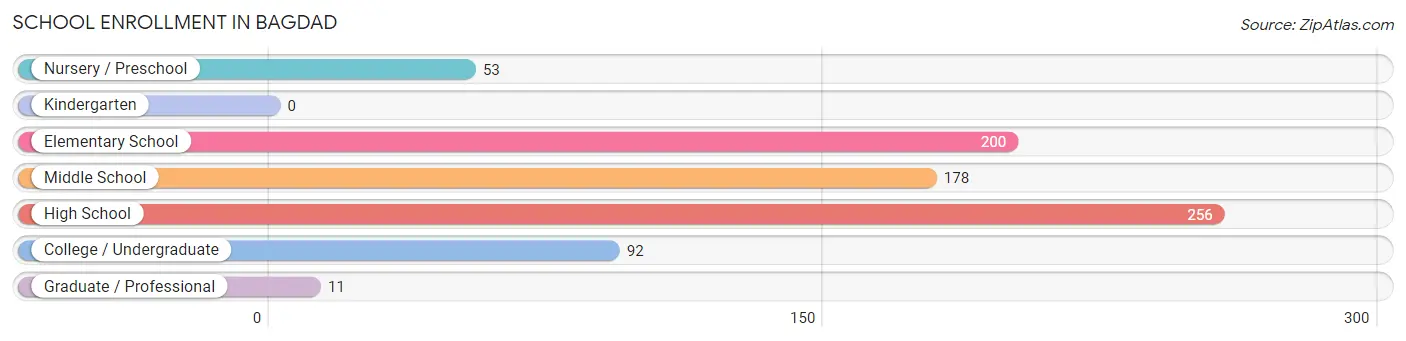
| School Level | # Students | % Students |
| Nursery / Preschool | 53 | 6.7% |
| Kindergarten | 0 | 0.0% |
| Elementary School | 200 | 25.3% |
| Middle School | 178 | 22.5% |
| High School | 256 | 32.4% |
| College / Undergraduate | 92 | 11.7% |
| Graduate / Professional | 11 | 1.4% |
| Total | 790 | 100.0% |
School Enrollment by Age by Funding Source in Bagdad
Out of a total of 790 students who are enrolled in schools in Bagdad, 128 (16.2%) attend a private institution, while the remaining 662 (83.8%) are enrolled in public schools. The age group of 3 to 4 year olds has the highest likelihood of being enrolled in private schools, with 22 (68.8% in the age bracket) enrolled. Conversely, the age group of 18 to 19 year olds has the lowest likelihood of being enrolled in a private school, with 56 (100.0% in the age bracket) attending a public institution.
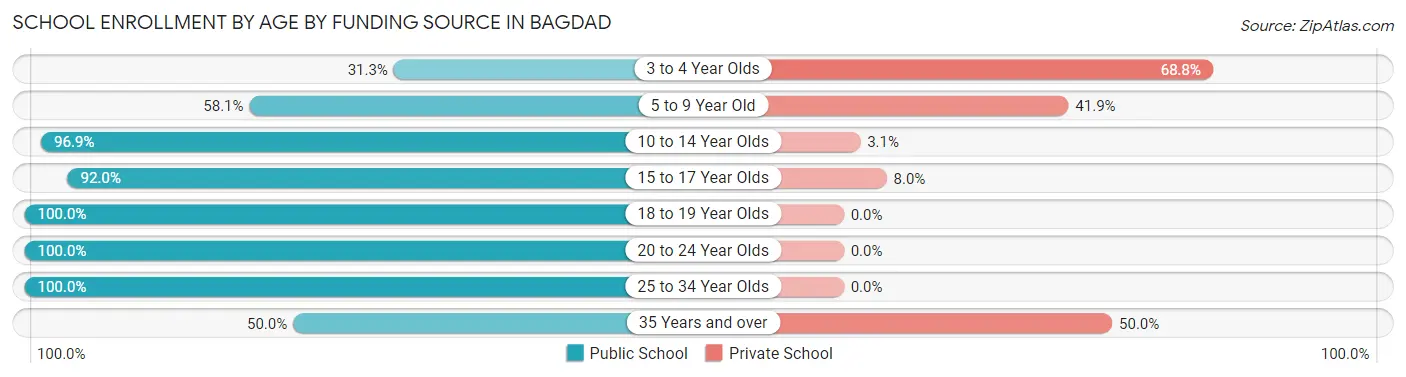
| Age Bracket | Public School | Private School |
| 3 to 4 Year Olds | 10 (31.2%) | 22 (68.8%) |
| 5 to 9 Year Old | 100 (58.1%) | 72 (41.9%) |
| 10 to 14 Year Olds | 220 (96.9%) | 7 (3.1%) |
| 15 to 17 Year Olds | 184 (92.0%) | 16 (8.0%) |
| 18 to 19 Year Olds | 56 (100.0%) | 0 (0.0%) |
| 20 to 24 Year Olds | 19 (100.0%) | 0 (0.0%) |
| 25 to 34 Year Olds | 62 (100.0%) | 0 (0.0%) |
| 35 Years and over | 11 (50.0%) | 11 (50.0%) |
| Total | 662 (83.8%) | 128 (16.2%) |
Educational Attainment by Field of Study in Bagdad
Science & technology (162 | 18.9%), business (152 | 17.7%), education (140 | 16.3%), psychology (116 | 13.5%), and visual & performing arts (71 | 8.3%) are the most common fields of study among 859 individuals in Bagdad who have obtained a bachelor's degree or higher.
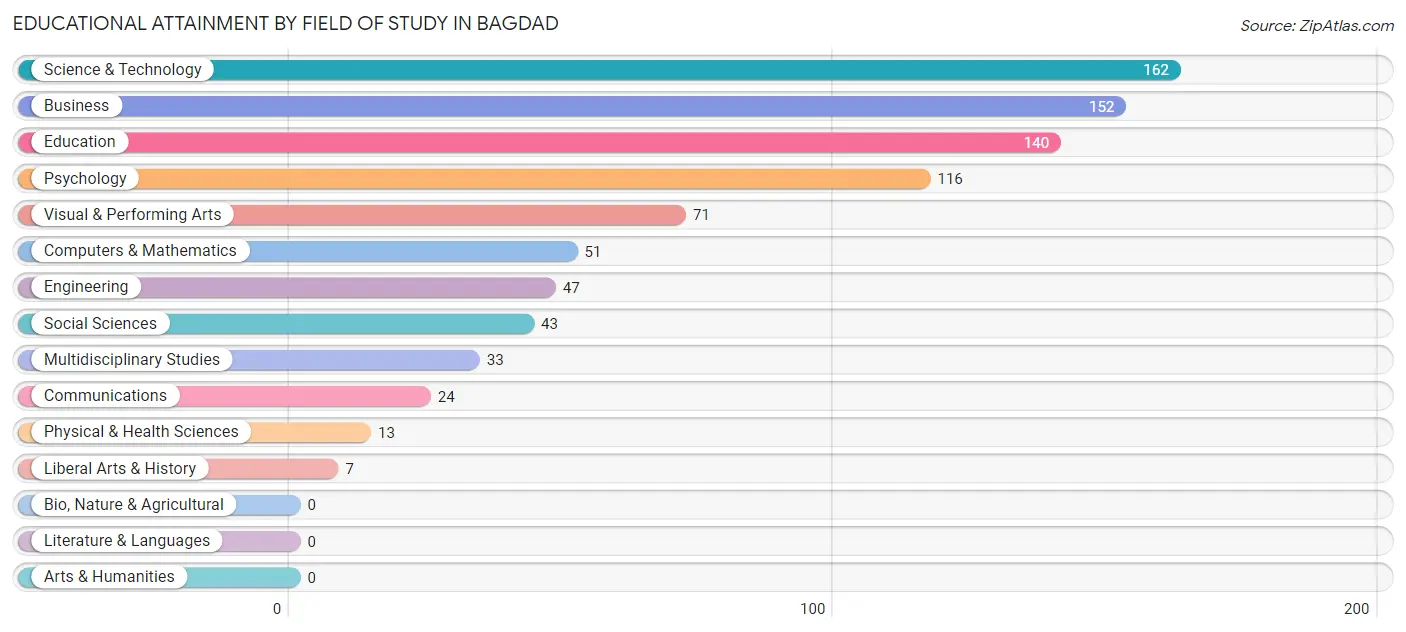
| Field of Study | # Graduates | % Graduates |
| Computers & Mathematics | 51 | 5.9% |
| Bio, Nature & Agricultural | 0 | 0.0% |
| Physical & Health Sciences | 13 | 1.5% |
| Psychology | 116 | 13.5% |
| Social Sciences | 43 | 5.0% |
| Engineering | 47 | 5.5% |
| Multidisciplinary Studies | 33 | 3.8% |
| Science & Technology | 162 | 18.9% |
| Business | 152 | 17.7% |
| Education | 140 | 16.3% |
| Literature & Languages | 0 | 0.0% |
| Liberal Arts & History | 7 | 0.8% |
| Visual & Performing Arts | 71 | 8.3% |
| Communications | 24 | 2.8% |
| Arts & Humanities | 0 | 0.0% |
| Total | 859 | 100.0% |
Transportation & Commute in Bagdad
Vehicle Availability by Sex in Bagdad
The most prevalent vehicle ownership categories in Bagdad are males with 2 vehicles (657, accounting for 60.3%) and females with 2 vehicles (491, making up 65.8%).
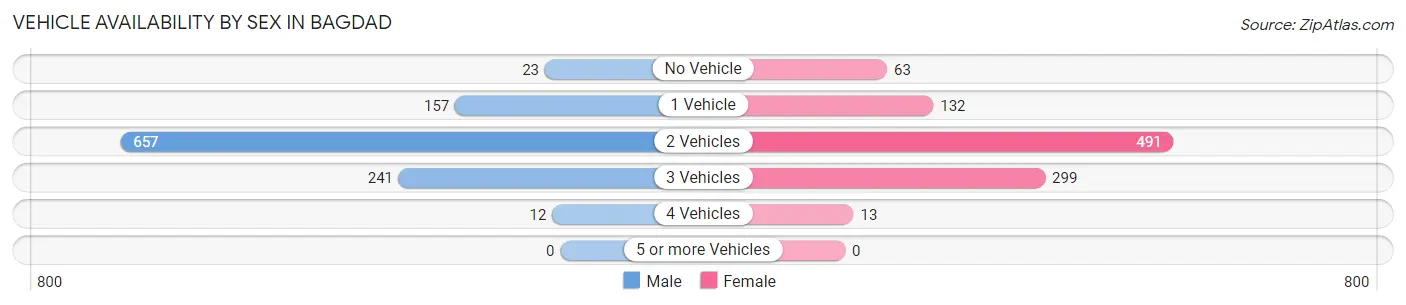
| Vehicles Available | Male | Female |
| No Vehicle | 23 (2.1%) | 63 (6.3%) |
| 1 Vehicle | 157 (14.4%) | 132 (13.2%) |
| 2 Vehicles | 657 (60.3%) | 491 (49.2%) |
| 3 Vehicles | 241 (22.1%) | 299 (30.0%) |
| 4 Vehicles | 12 (1.1%) | 13 (1.3%) |
| 5 or more Vehicles | 0 (0.0%) | 0 (0.0%) |
| Total | 1,090 (100.0%) | 998 (100.0%) |
Commute Time in Bagdad
The most frequently occuring commute durations in Bagdad are 15 to 19 minutes (300 commuters, 17.8%), 20 to 24 minutes (226 commuters, 13.4%), and 25 to 29 minutes (182 commuters, 10.8%).
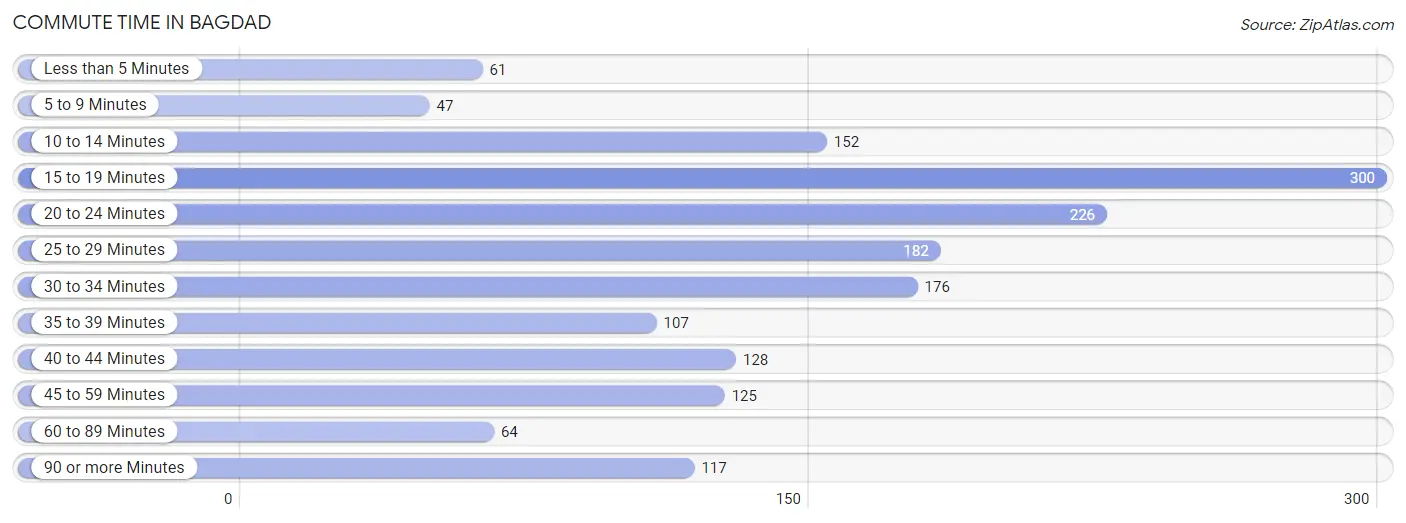
| Commute Time | # Commuters | % Commuters |
| Less than 5 Minutes | 61 | 3.6% |
| 5 to 9 Minutes | 47 | 2.8% |
| 10 to 14 Minutes | 152 | 9.0% |
| 15 to 19 Minutes | 300 | 17.8% |
| 20 to 24 Minutes | 226 | 13.4% |
| 25 to 29 Minutes | 182 | 10.8% |
| 30 to 34 Minutes | 176 | 10.4% |
| 35 to 39 Minutes | 107 | 6.4% |
| 40 to 44 Minutes | 128 | 7.6% |
| 45 to 59 Minutes | 125 | 7.4% |
| 60 to 89 Minutes | 64 | 3.8% |
| 90 or more Minutes | 117 | 6.9% |
Commute Time by Sex in Bagdad
The most common commute times in Bagdad are 20 to 24 minutes (174 commuters, 20.8%) for males and 15 to 19 minutes (150 commuters, 17.6%) for females.
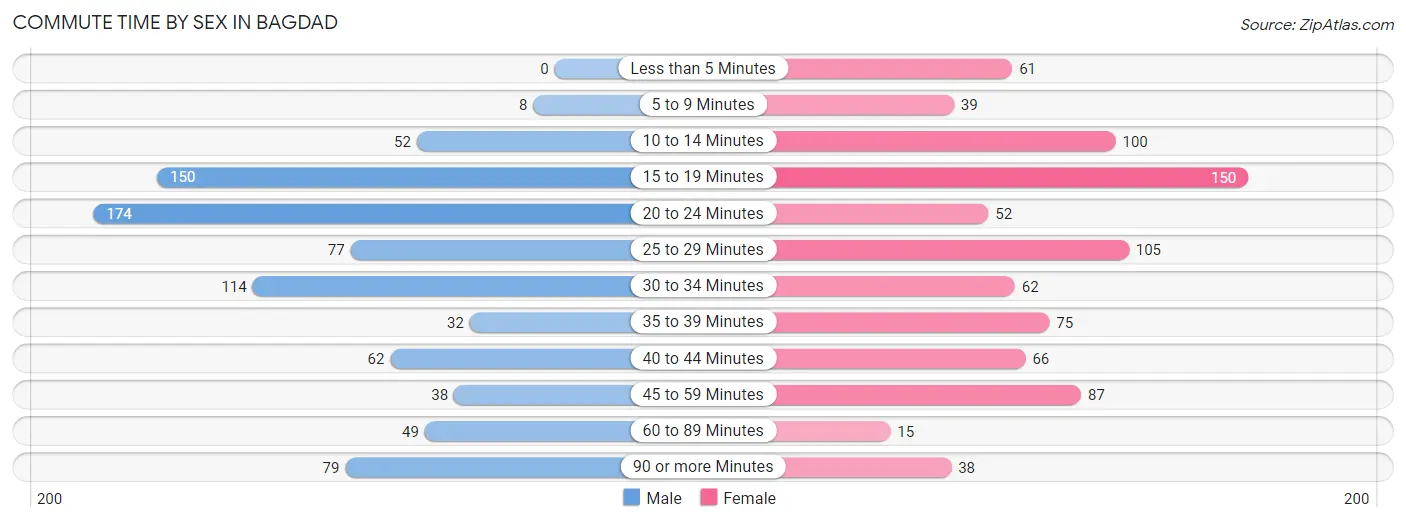
| Commute Time | Male | Female |
| Less than 5 Minutes | 0 (0.0%) | 61 (7.2%) |
| 5 to 9 Minutes | 8 (1.0%) | 39 (4.6%) |
| 10 to 14 Minutes | 52 (6.2%) | 100 (11.8%) |
| 15 to 19 Minutes | 150 (18.0%) | 150 (17.6%) |
| 20 to 24 Minutes | 174 (20.8%) | 52 (6.1%) |
| 25 to 29 Minutes | 77 (9.2%) | 105 (12.3%) |
| 30 to 34 Minutes | 114 (13.7%) | 62 (7.3%) |
| 35 to 39 Minutes | 32 (3.8%) | 75 (8.8%) |
| 40 to 44 Minutes | 62 (7.4%) | 66 (7.8%) |
| 45 to 59 Minutes | 38 (4.5%) | 87 (10.2%) |
| 60 to 89 Minutes | 49 (5.9%) | 15 (1.8%) |
| 90 or more Minutes | 79 (9.5%) | 38 (4.5%) |
Time of Departure to Work by Sex in Bagdad
The most frequent times of departure to work in Bagdad are 5:00 AM to 5:29 AM (170, 20.4%) for males and 6:30 AM to 6:59 AM (181, 21.3%) for females.
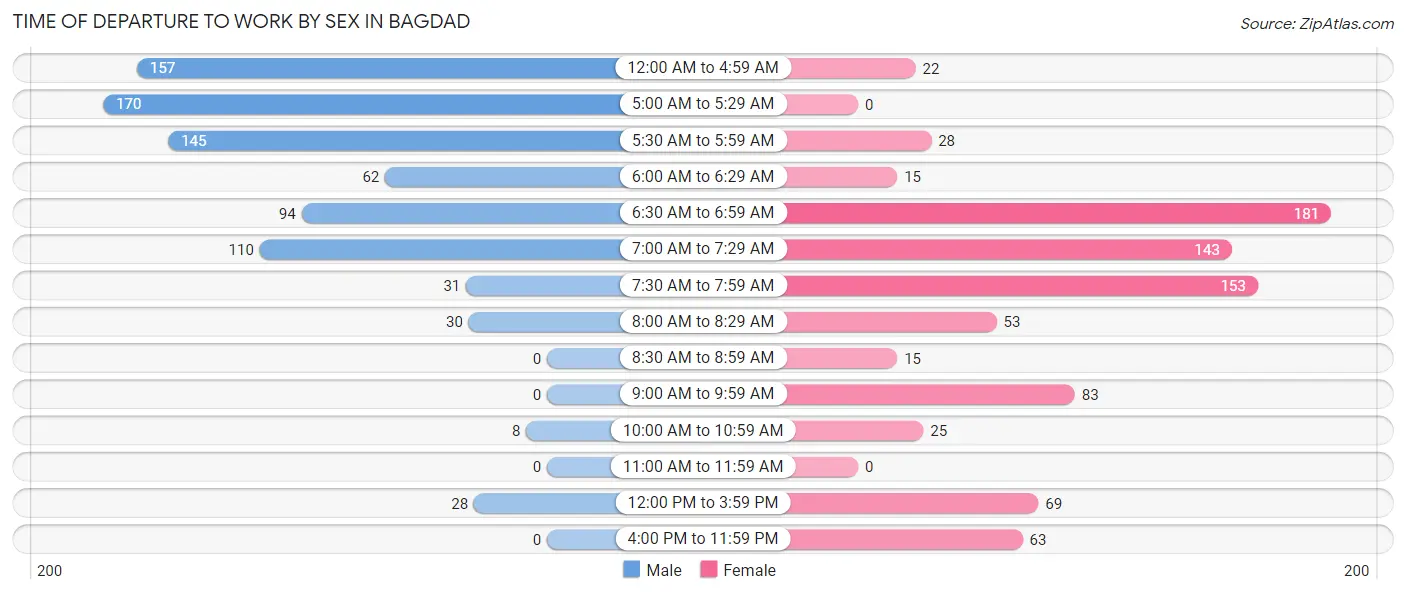
| Time of Departure | Male | Female |
| 12:00 AM to 4:59 AM | 157 (18.8%) | 22 (2.6%) |
| 5:00 AM to 5:29 AM | 170 (20.4%) | 0 (0.0%) |
| 5:30 AM to 5:59 AM | 145 (17.4%) | 28 (3.3%) |
| 6:00 AM to 6:29 AM | 62 (7.4%) | 15 (1.8%) |
| 6:30 AM to 6:59 AM | 94 (11.3%) | 181 (21.3%) |
| 7:00 AM to 7:29 AM | 110 (13.2%) | 143 (16.8%) |
| 7:30 AM to 7:59 AM | 31 (3.7%) | 153 (18.0%) |
| 8:00 AM to 8:29 AM | 30 (3.6%) | 53 (6.2%) |
| 8:30 AM to 8:59 AM | 0 (0.0%) | 15 (1.8%) |
| 9:00 AM to 9:59 AM | 0 (0.0%) | 83 (9.8%) |
| 10:00 AM to 10:59 AM | 8 (1.0%) | 25 (2.9%) |
| 11:00 AM to 11:59 AM | 0 (0.0%) | 0 (0.0%) |
| 12:00 PM to 3:59 PM | 28 (3.4%) | 69 (8.1%) |
| 4:00 PM to 11:59 PM | 0 (0.0%) | 63 (7.4%) |
| Total | 835 (100.0%) | 850 (100.0%) |
Housing Occupancy in Bagdad
Occupancy by Ownership in Bagdad
Of the total 1,658 dwellings in Bagdad, owner-occupied units account for 1,420 (85.7%), while renter-occupied units make up 238 (14.3%).
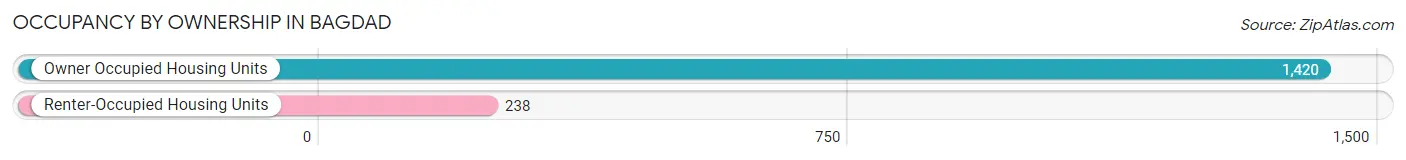
| Occupancy | # Housing Units | % Housing Units |
| Owner Occupied Housing Units | 1,420 | 85.7% |
| Renter-Occupied Housing Units | 238 | 14.3% |
| Total Occupied Housing Units | 1,658 | 100.0% |
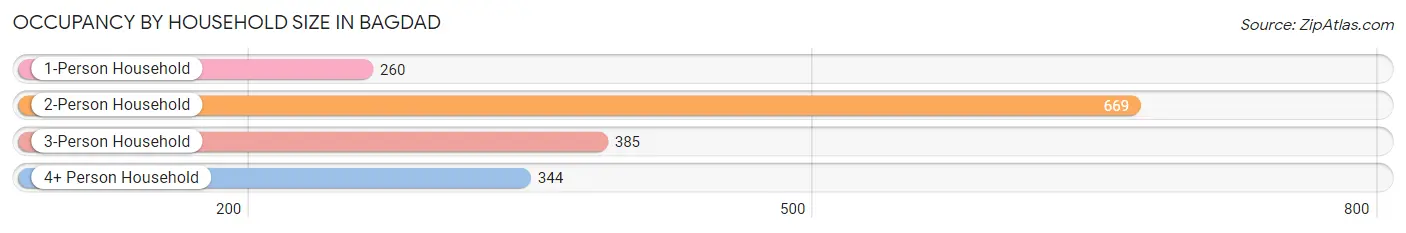
Occupancy by Household Size in Bagdad
| Household Size | # Housing Units | % Housing Units |
| 1-Person Household | 260 | 15.7% |
| 2-Person Household | 669 | 40.4% |
| 3-Person Household | 385 | 23.2% |
| 4+ Person Household | 344 | 20.7% |
| Total Housing Units | 1,658 | 100.0% |
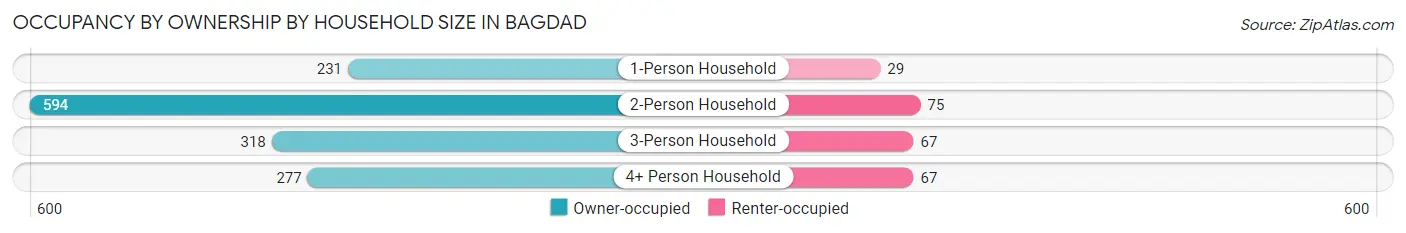
Occupancy by Ownership by Household Size in Bagdad
| Household Size | Owner-occupied | Renter-occupied |
| 1-Person Household | 231 (88.8%) | 29 (11.2%) |
| 2-Person Household | 594 (88.8%) | 75 (11.2%) |
| 3-Person Household | 318 (82.6%) | 67 (17.4%) |
| 4+ Person Household | 277 (80.5%) | 67 (19.5%) |
| Total Housing Units | 1,420 (85.7%) | 238 (14.3%) |
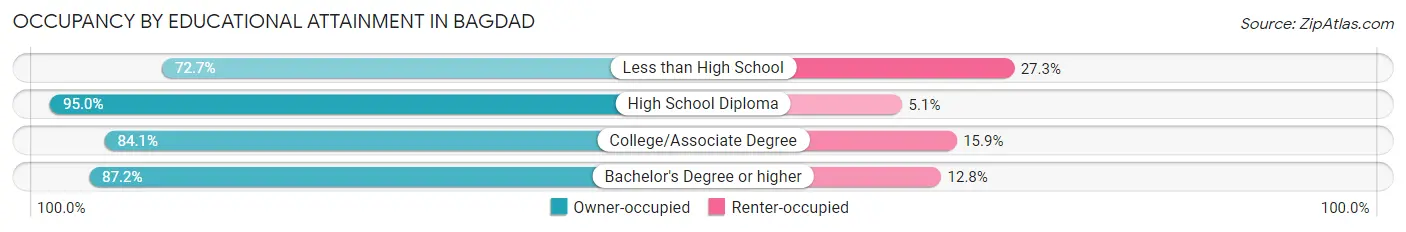
Occupancy by Educational Attainment in Bagdad
| Household Size | Owner-occupied | Renter-occupied |
| Less than High School | 112 (72.7%) | 42 (27.3%) |
| High School Diploma | 207 (95.0%) | 11 (5.1%) |
| College/Associate Degree | 562 (84.1%) | 106 (15.9%) |
| Bachelor's Degree or higher | 539 (87.2%) | 79 (12.8%) |
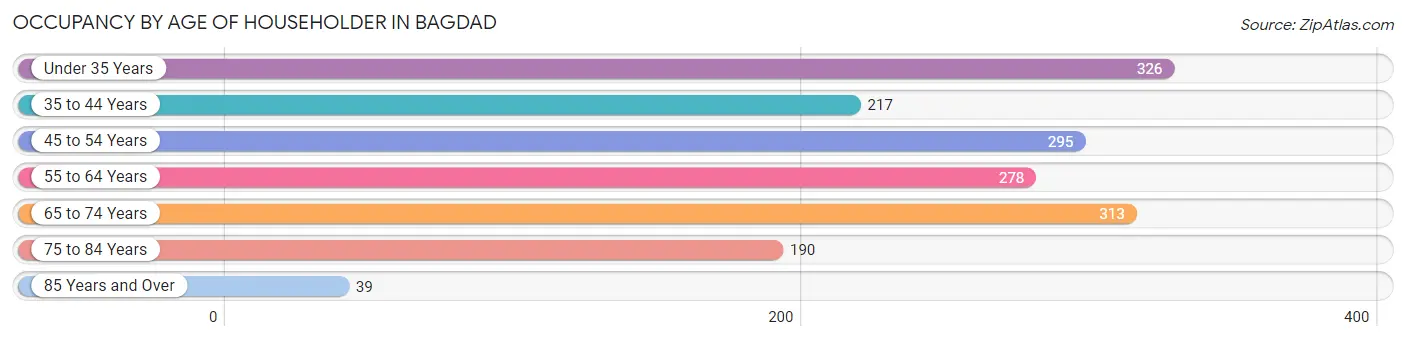
Occupancy by Age of Householder in Bagdad
| Age Bracket | # Households | % Households |
| Under 35 Years | 326 | 19.7% |
| 35 to 44 Years | 217 | 13.1% |
| 45 to 54 Years | 295 | 17.8% |
| 55 to 64 Years | 278 | 16.8% |
| 65 to 74 Years | 313 | 18.9% |
| 75 to 84 Years | 190 | 11.5% |
| 85 Years and Over | 39 | 2.4% |
| Total | 1,658 | 100.0% |
Housing Finances in Bagdad
Median Income by Occupancy in Bagdad
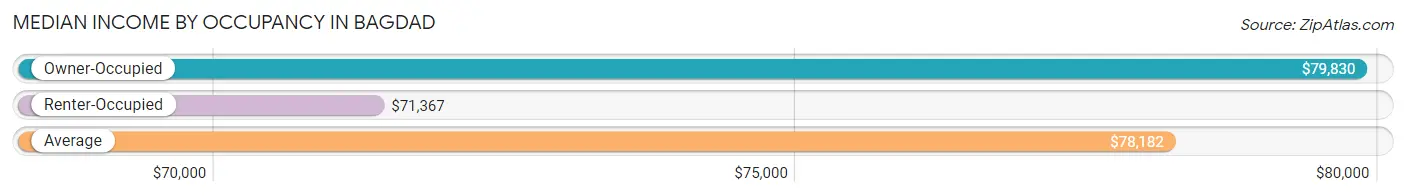
| Occupancy Type | # Households | Median Income |
| Owner-Occupied | 1,420 (85.7%) | $79,830 |
| Renter-Occupied | 238 (14.3%) | $71,367 |
| Average | 1,658 (100.0%) | $78,182 |
Occupancy by Householder Income Bracket in Bagdad
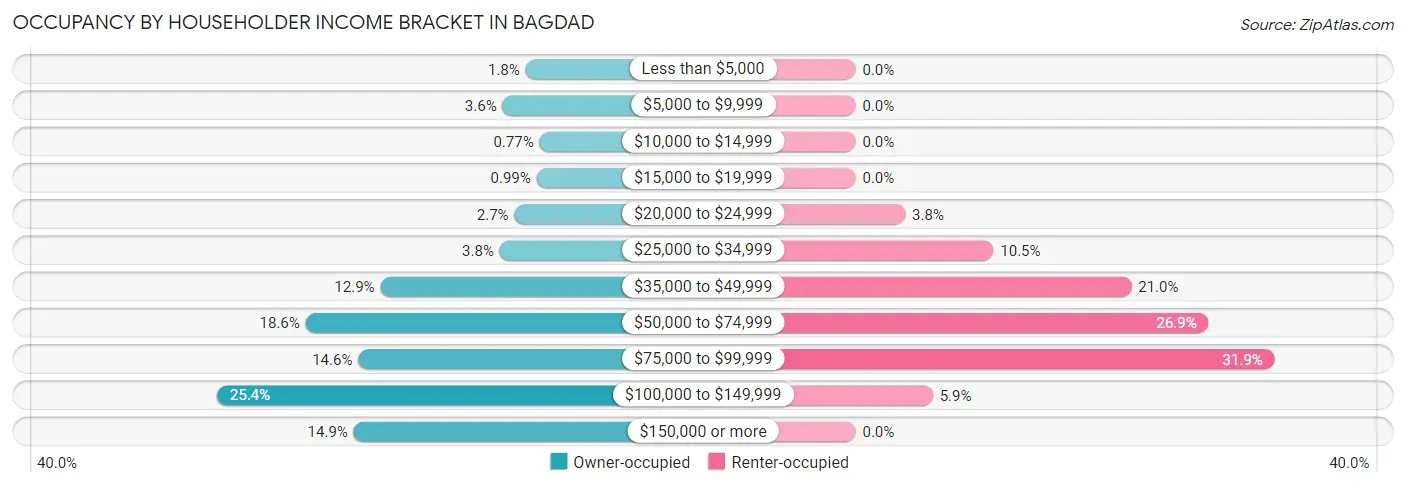
| Income Bracket | Owner-occupied | Renter-occupied |
| Less than $5,000 | 26 (1.8%) | 0 (0.0%) |
| $5,000 to $9,999 | 51 (3.6%) | 0 (0.0%) |
| $10,000 to $14,999 | 11 (0.8%) | 0 (0.0%) |
| $15,000 to $19,999 | 14 (1.0%) | 0 (0.0%) |
| $20,000 to $24,999 | 38 (2.7%) | 9 (3.8%) |
| $25,000 to $34,999 | 54 (3.8%) | 25 (10.5%) |
| $35,000 to $49,999 | 183 (12.9%) | 50 (21.0%) |
| $50,000 to $74,999 | 264 (18.6%) | 64 (26.9%) |
| $75,000 to $99,999 | 207 (14.6%) | 76 (31.9%) |
| $100,000 to $149,999 | 360 (25.4%) | 14 (5.9%) |
| $150,000 or more | 212 (14.9%) | 0 (0.0%) |
| Total | 1,420 (100.0%) | 238 (100.0%) |
Monthly Housing Cost Tiers in Bagdad
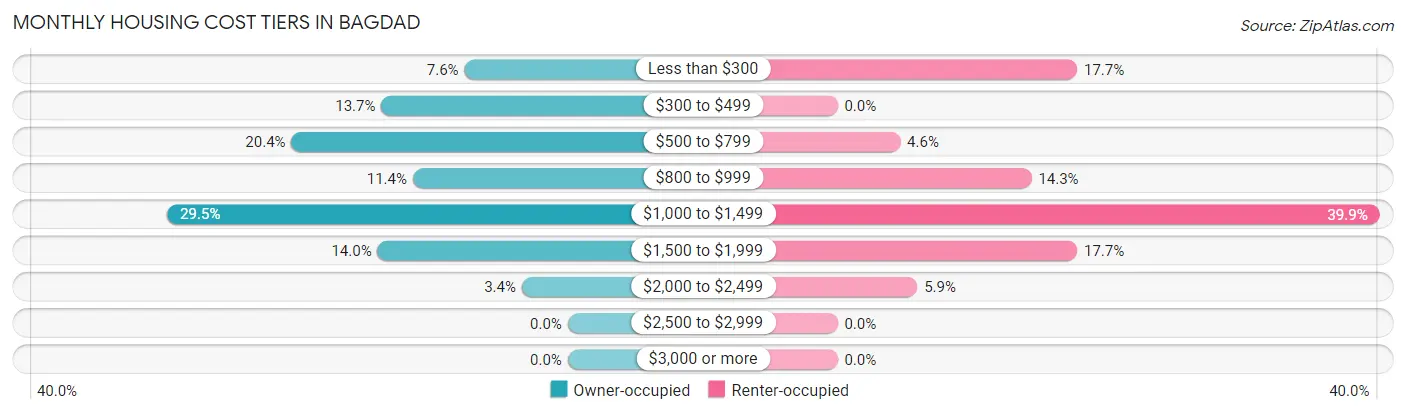
| Monthly Cost | Owner-occupied | Renter-occupied |
| Less than $300 | 108 (7.6%) | 42 (17.6%) |
| $300 to $499 | 195 (13.7%) | 0 (0.0%) |
| $500 to $799 | 289 (20.3%) | 11 (4.6%) |
| $800 to $999 | 162 (11.4%) | 34 (14.3%) |
| $1,000 to $1,499 | 419 (29.5%) | 95 (39.9%) |
| $1,500 to $1,999 | 199 (14.0%) | 42 (17.6%) |
| $2,000 to $2,499 | 48 (3.4%) | 14 (5.9%) |
| $2,500 to $2,999 | 0 (0.0%) | 0 (0.0%) |
| $3,000 or more | 0 (0.0%) | 0 (0.0%) |
| Total | 1,420 (100.0%) | 238 (100.0%) |
Physical Housing Characteristics in Bagdad
Housing Structures in Bagdad
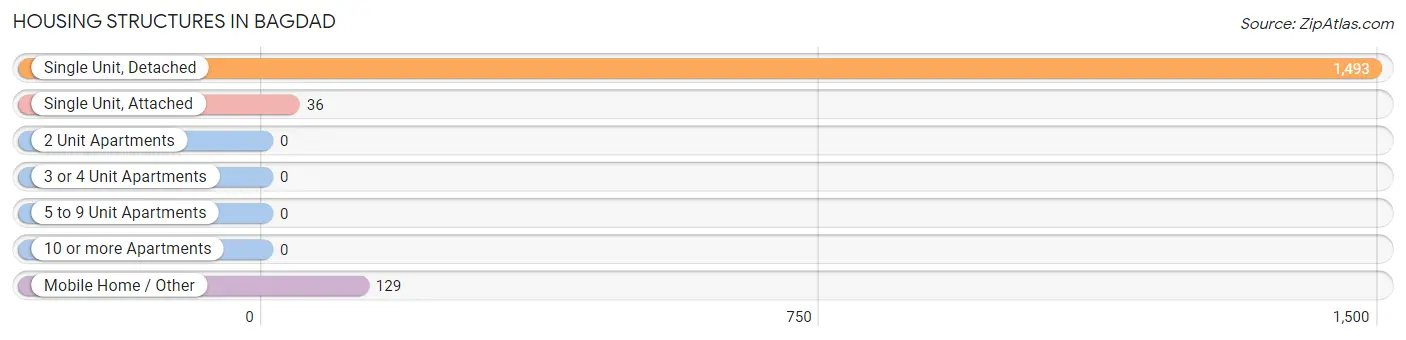
| Structure Type | # Housing Units | % Housing Units |
| Single Unit, Detached | 1,493 | 90.0% |
| Single Unit, Attached | 36 | 2.2% |
| 2 Unit Apartments | 0 | 0.0% |
| 3 or 4 Unit Apartments | 0 | 0.0% |
| 5 to 9 Unit Apartments | 0 | 0.0% |
| 10 or more Apartments | 0 | 0.0% |
| Mobile Home / Other | 129 | 7.8% |
| Total | 1,658 | 100.0% |
Housing Structures by Occupancy in Bagdad
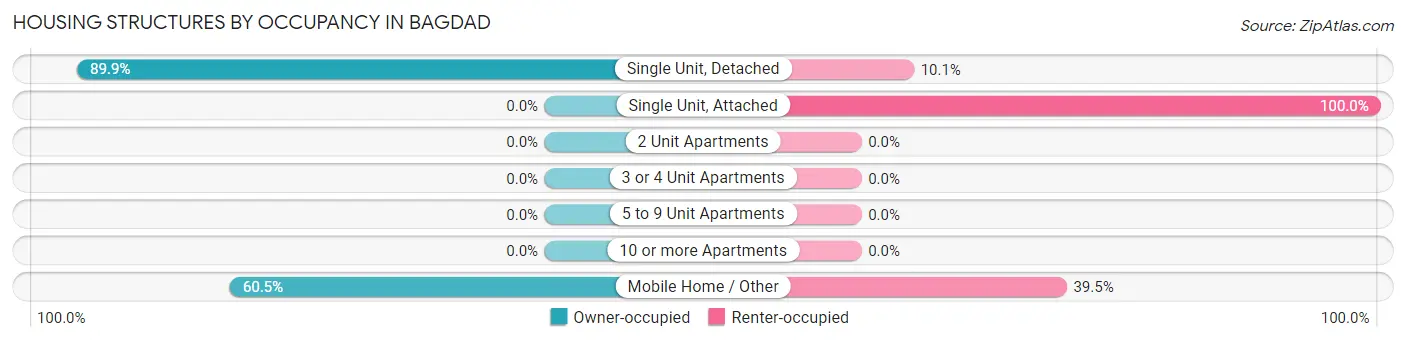
| Structure Type | Owner-occupied | Renter-occupied |
| Single Unit, Detached | 1,342 (89.9%) | 151 (10.1%) |
| Single Unit, Attached | 0 (0.0%) | 36 (100.0%) |
| 2 Unit Apartments | 0 (0.0%) | 0 (0.0%) |
| 3 or 4 Unit Apartments | 0 (0.0%) | 0 (0.0%) |
| 5 to 9 Unit Apartments | 0 (0.0%) | 0 (0.0%) |
| 10 or more Apartments | 0 (0.0%) | 0 (0.0%) |
| Mobile Home / Other | 78 (60.5%) | 51 (39.5%) |
| Total | 1,420 (85.7%) | 238 (14.3%) |
Housing Structures by Number of Rooms in Bagdad
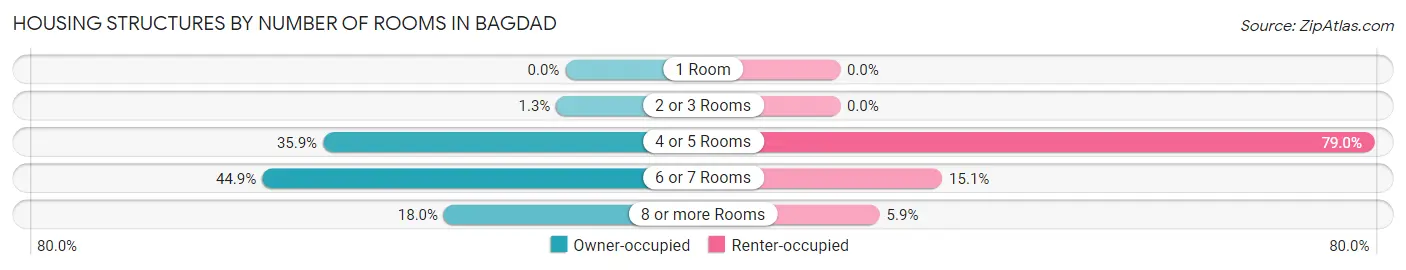
| Number of Rooms | Owner-occupied | Renter-occupied |
| 1 Room | 0 (0.0%) | 0 (0.0%) |
| 2 or 3 Rooms | 19 (1.3%) | 0 (0.0%) |
| 4 or 5 Rooms | 509 (35.8%) | 188 (79.0%) |
| 6 or 7 Rooms | 637 (44.9%) | 36 (15.1%) |
| 8 or more Rooms | 255 (18.0%) | 14 (5.9%) |
| Total | 1,420 (100.0%) | 238 (100.0%) |
Housing Structure by Heating Type in Bagdad
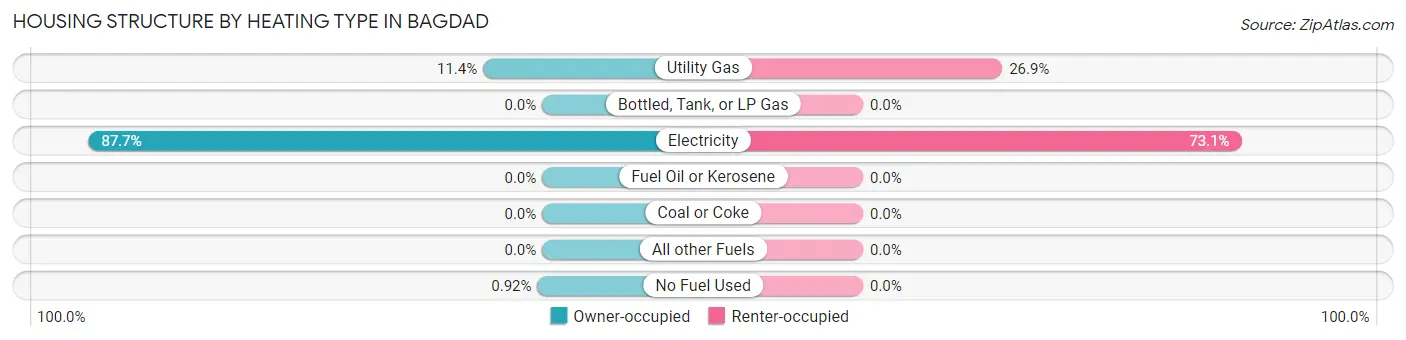
| Heating Type | Owner-occupied | Renter-occupied |
| Utility Gas | 162 (11.4%) | 64 (26.9%) |
| Bottled, Tank, or LP Gas | 0 (0.0%) | 0 (0.0%) |
| Electricity | 1,245 (87.7%) | 174 (73.1%) |
| Fuel Oil or Kerosene | 0 (0.0%) | 0 (0.0%) |
| Coal or Coke | 0 (0.0%) | 0 (0.0%) |
| All other Fuels | 0 (0.0%) | 0 (0.0%) |
| No Fuel Used | 13 (0.9%) | 0 (0.0%) |
| Total | 1,420 (100.0%) | 238 (100.0%) |
Household Vehicle Usage in Bagdad
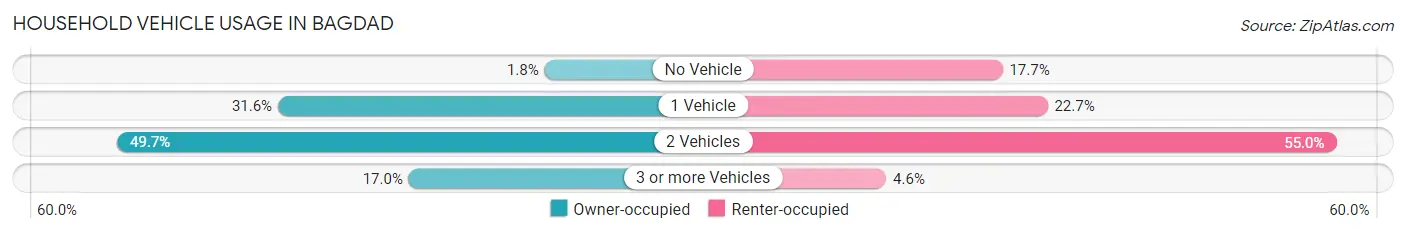
| Vehicles per Household | Owner-occupied | Renter-occupied |
| No Vehicle | 25 (1.8%) | 42 (17.6%) |
| 1 Vehicle | 449 (31.6%) | 54 (22.7%) |
| 2 Vehicles | 705 (49.6%) | 131 (55.0%) |
| 3 or more Vehicles | 241 (17.0%) | 11 (4.6%) |
| Total | 1,420 (100.0%) | 238 (100.0%) |
Real Estate & Mortgages in Bagdad
Real Estate and Mortgage Overview in Bagdad
| Characteristic | Without Mortgage | With Mortgage |
| Housing Units | 592 | 828 |
| Median Property Value | $211,700 | $222,800 |
| Median Household Income | $67,273 | $171 |
| Monthly Housing Costs | $490 | $0 |
| Real Estate Taxes | $1,355 | $84 |
Property Value by Mortgage Status in Bagdad
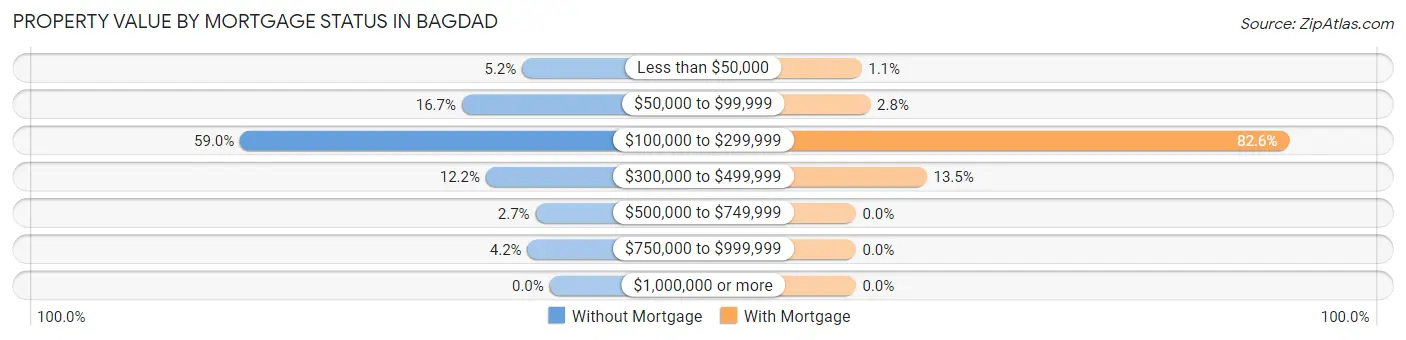
| Property Value | Without Mortgage | With Mortgage |
| Less than $50,000 | 31 (5.2%) | 9 (1.1%) |
| $50,000 to $99,999 | 99 (16.7%) | 23 (2.8%) |
| $100,000 to $299,999 | 349 (59.0%) | 684 (82.6%) |
| $300,000 to $499,999 | 72 (12.2%) | 112 (13.5%) |
| $500,000 to $749,999 | 16 (2.7%) | 0 (0.0%) |
| $750,000 to $999,999 | 25 (4.2%) | 0 (0.0%) |
| $1,000,000 or more | 0 (0.0%) | 0 (0.0%) |
| Total | 592 (100.0%) | 828 (100.0%) |
Household Income by Mortgage Status in Bagdad
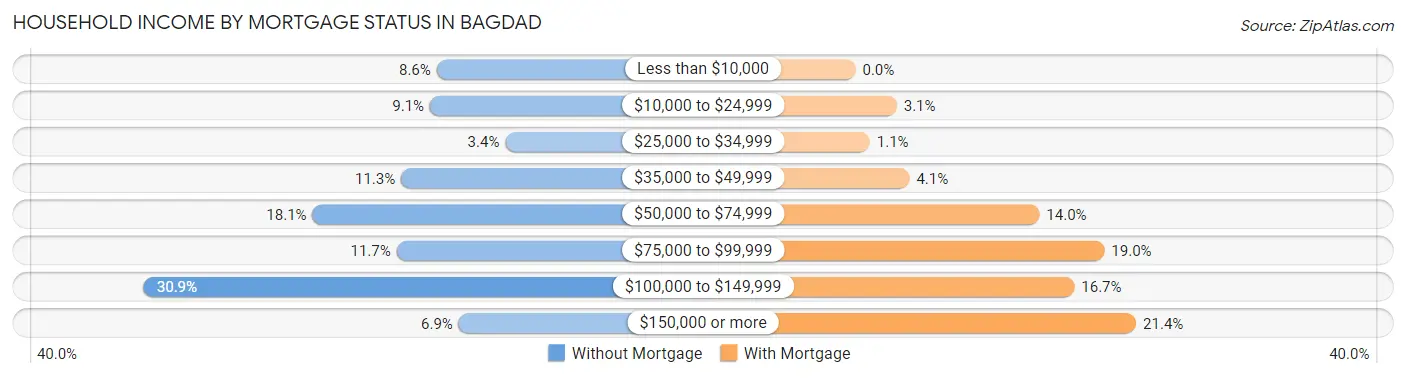
| Household Income | Without Mortgage | With Mortgage |
| Less than $10,000 | 51 (8.6%) | 0 (0.0%) |
| $10,000 to $24,999 | 54 (9.1%) | 26 (3.1%) |
| $25,000 to $34,999 | 20 (3.4%) | 9 (1.1%) |
| $35,000 to $49,999 | 67 (11.3%) | 34 (4.1%) |
| $50,000 to $74,999 | 107 (18.1%) | 116 (14.0%) |
| $75,000 to $99,999 | 69 (11.7%) | 157 (19.0%) |
| $100,000 to $149,999 | 183 (30.9%) | 138 (16.7%) |
| $150,000 or more | 41 (6.9%) | 177 (21.4%) |
| Total | 592 (100.0%) | 828 (100.0%) |
Property Value to Household Income Ratio in Bagdad
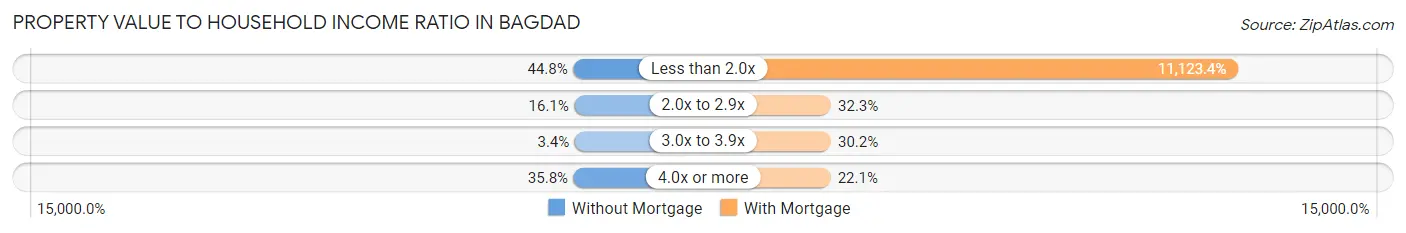
| Value-to-Income Ratio | Without Mortgage | With Mortgage |
| Less than 2.0x | 265 (44.8%) | 92,102 (11,123.4%) |
| 2.0x to 2.9x | 95 (16.1%) | 267 (32.3%) |
| 3.0x to 3.9x | 20 (3.4%) | 250 (30.2%) |
| 4.0x or more | 212 (35.8%) | 183 (22.1%) |
| Total | 592 (100.0%) | 828 (100.0%) |
Real Estate Taxes by Mortgage Status in Bagdad
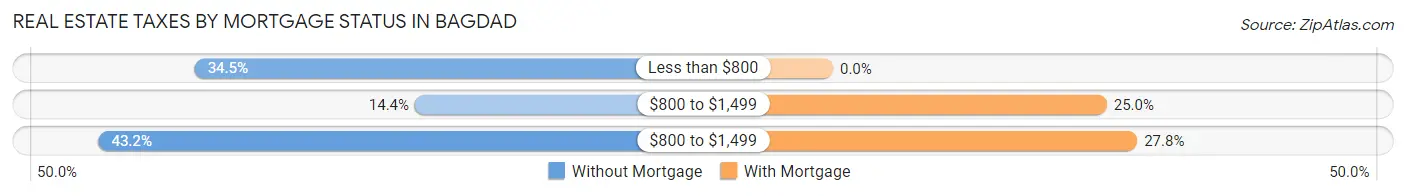
| Property Taxes | Without Mortgage | With Mortgage |
| Less than $800 | 204 (34.5%) | 0 (0.0%) |
| $800 to $1,499 | 85 (14.4%) | 207 (25.0%) |
| $800 to $1,499 | 256 (43.2%) | 230 (27.8%) |
| Total | 592 (100.0%) | 828 (100.0%) |
Health & Disability in Bagdad
Health Insurance Coverage by Age in Bagdad
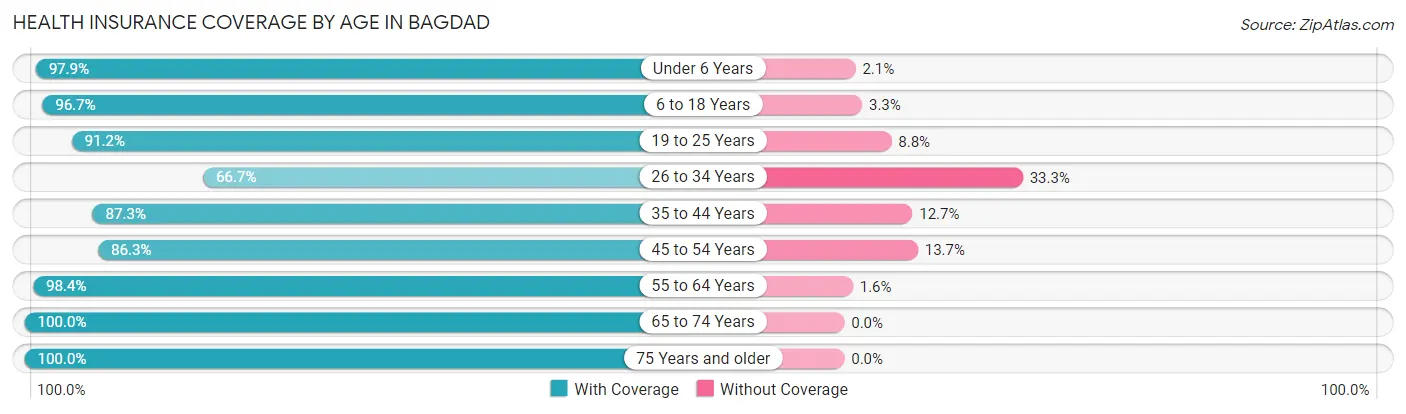
| Age Bracket | With Coverage | Without Coverage |
| Under 6 Years | 329 (97.9%) | 7 (2.1%) |
| 6 to 18 Years | 613 (96.7%) | 21 (3.3%) |
| 19 to 25 Years | 437 (91.2%) | 42 (8.8%) |
| 26 to 34 Years | 343 (66.7%) | 171 (33.3%) |
| 35 to 44 Years | 427 (87.3%) | 62 (12.7%) |
| 45 to 54 Years | 397 (86.3%) | 63 (13.7%) |
| 55 to 64 Years | 623 (98.4%) | 10 (1.6%) |
| 65 to 74 Years | 429 (100.0%) | 0 (0.0%) |
| 75 Years and older | 300 (100.0%) | 0 (0.0%) |
| Total | 3,898 (91.2%) | 376 (8.8%) |
Health Insurance Coverage by Citizenship Status in Bagdad
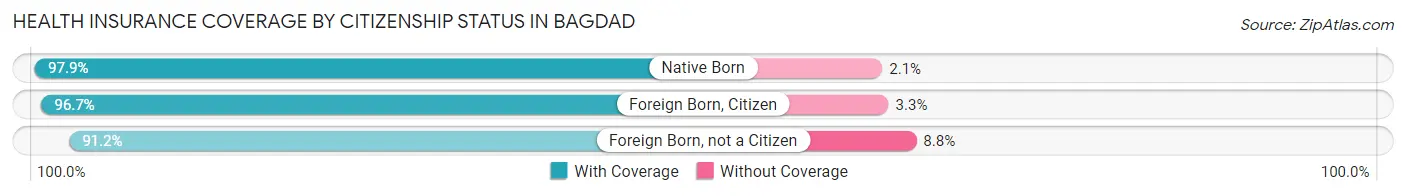
| Citizenship Status | With Coverage | Without Coverage |
| Native Born | 329 (97.9%) | 7 (2.1%) |
| Foreign Born, Citizen | 613 (96.7%) | 21 (3.3%) |
| Foreign Born, not a Citizen | 437 (91.2%) | 42 (8.8%) |
Health Insurance Coverage by Household Income in Bagdad
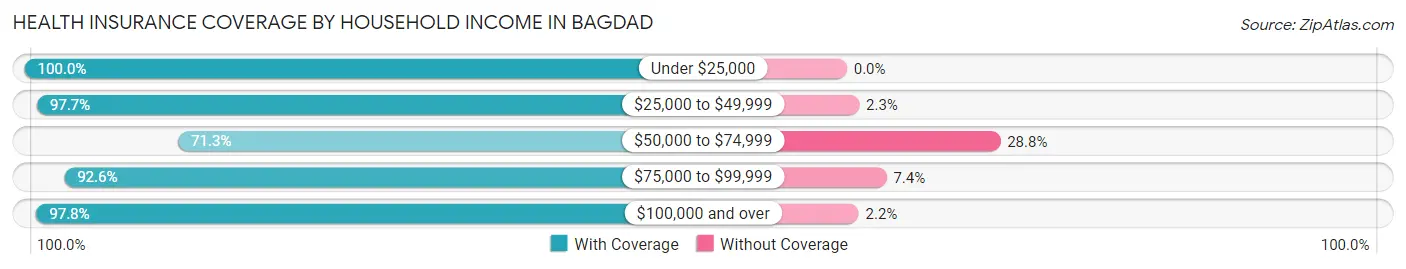
| Household Income | With Coverage | Without Coverage |
| Under $25,000 | 203 (100.0%) | 0 (0.0%) |
| $25,000 to $49,999 | 594 (97.7%) | 14 (2.3%) |
| $50,000 to $74,999 | 642 (71.3%) | 259 (28.7%) |
| $75,000 to $99,999 | 760 (92.6%) | 61 (7.4%) |
| $100,000 and over | 1,685 (97.8%) | 38 (2.2%) |
Public vs Private Health Insurance Coverage by Age in Bagdad
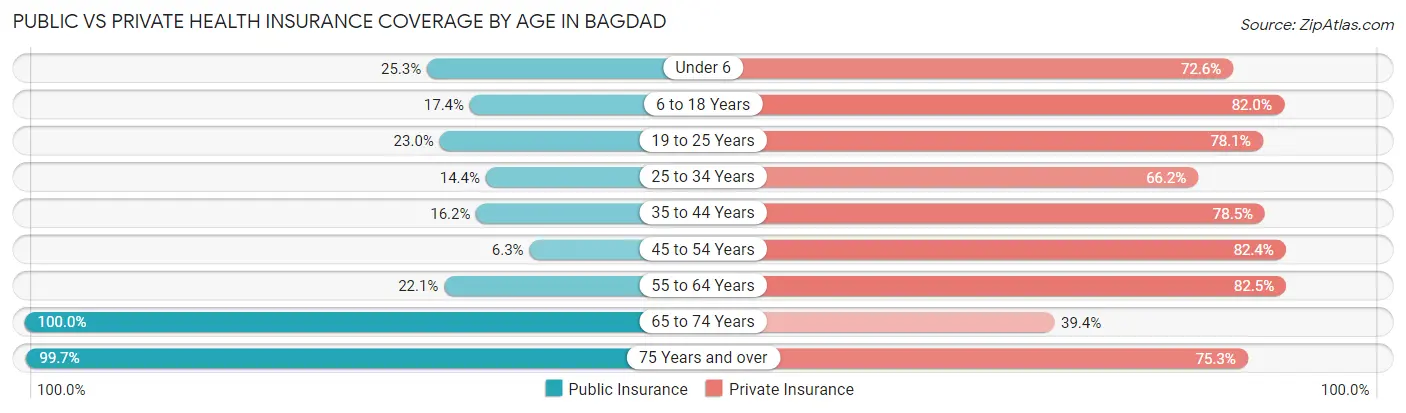
| Age Bracket | Public Insurance | Private Insurance |
| Under 6 | 85 (25.3%) | 244 (72.6%) |
| 6 to 18 Years | 110 (17.3%) | 520 (82.0%) |
| 19 to 25 Years | 110 (23.0%) | 374 (78.1%) |
| 25 to 34 Years | 74 (14.4%) | 340 (66.1%) |
| 35 to 44 Years | 79 (16.2%) | 384 (78.5%) |
| 45 to 54 Years | 29 (6.3%) | 379 (82.4%) |
| 55 to 64 Years | 140 (22.1%) | 522 (82.5%) |
| 65 to 74 Years | 429 (100.0%) | 169 (39.4%) |
| 75 Years and over | 299 (99.7%) | 226 (75.3%) |
| Total | 1,355 (31.7%) | 3,158 (73.9%) |
Disability Status by Sex by Age in Bagdad
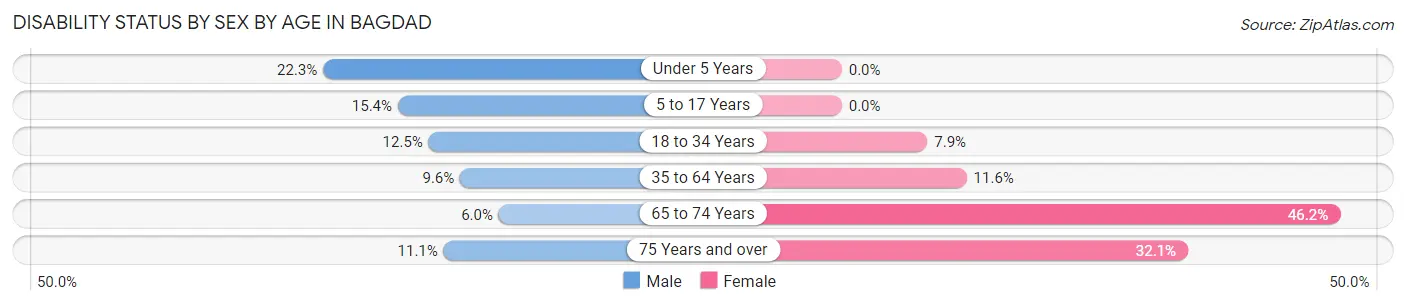
| Age Bracket | Male | Female |
| Under 5 Years | 64 (22.3%) | 0 (0.0%) |
| 5 to 17 Years | 49 (15.4%) | 0 (0.0%) |
| 18 to 34 Years | 54 (12.5%) | 49 (7.9%) |
| 35 to 64 Years | 73 (9.6%) | 95 (11.6%) |
| 65 to 74 Years | 13 (6.0%) | 98 (46.2%) |
| 75 Years and over | 15 (11.1%) | 53 (32.1%) |
Disability Class by Sex by Age in Bagdad
Disability Class: Hearing Difficulty
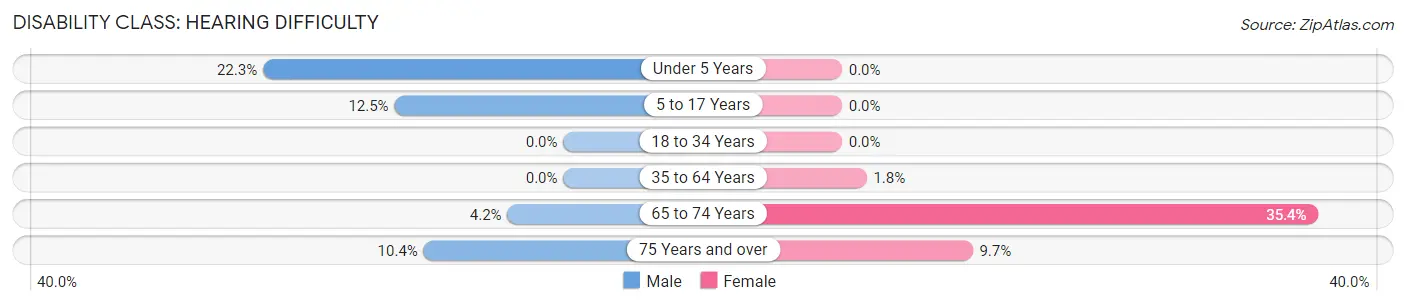
| Age Bracket | Male | Female |
| Under 5 Years | 64 (22.3%) | 0 (0.0%) |
| 5 to 17 Years | 40 (12.5%) | 0 (0.0%) |
| 18 to 34 Years | 0 (0.0%) | 0 (0.0%) |
| 35 to 64 Years | 0 (0.0%) | 15 (1.8%) |
| 65 to 74 Years | 9 (4.2%) | 75 (35.4%) |
| 75 Years and over | 14 (10.4%) | 16 (9.7%) |
Disability Class: Vision Difficulty
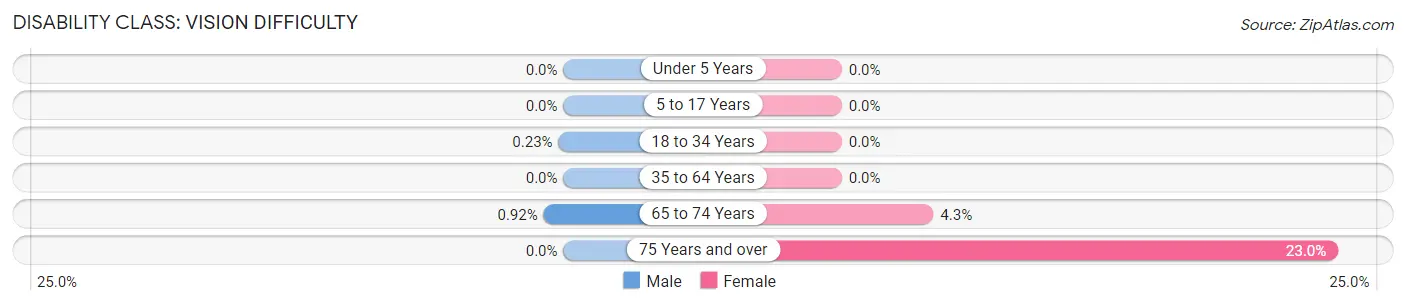
| Age Bracket | Male | Female |
| Under 5 Years | 0 (0.0%) | 0 (0.0%) |
| 5 to 17 Years | 0 (0.0%) | 0 (0.0%) |
| 18 to 34 Years | 1 (0.2%) | 0 (0.0%) |
| 35 to 64 Years | 0 (0.0%) | 0 (0.0%) |
| 65 to 74 Years | 2 (0.9%) | 9 (4.3%) |
| 75 Years and over | 0 (0.0%) | 38 (23.0%) |
Disability Class: Cognitive Difficulty
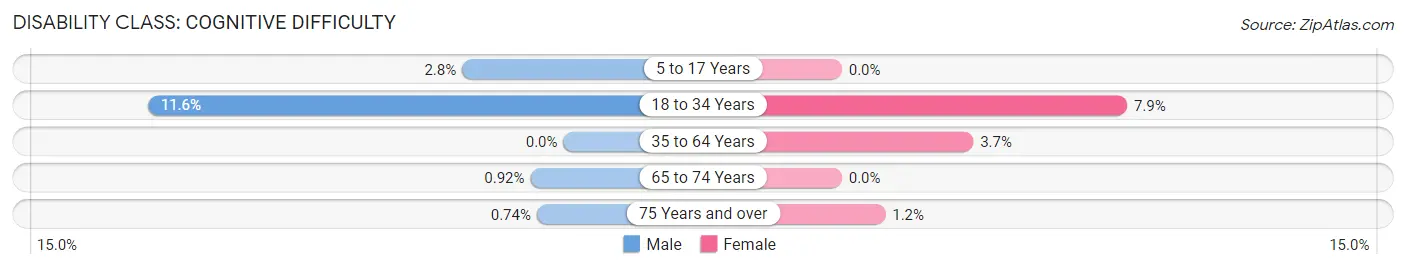
| Age Bracket | Male | Female |
| 5 to 17 Years | 9 (2.8%) | 0 (0.0%) |
| 18 to 34 Years | 50 (11.6%) | 49 (7.9%) |
| 35 to 64 Years | 0 (0.0%) | 30 (3.7%) |
| 65 to 74 Years | 2 (0.9%) | 0 (0.0%) |
| 75 Years and over | 1 (0.7%) | 2 (1.2%) |
Disability Class: Ambulatory Difficulty
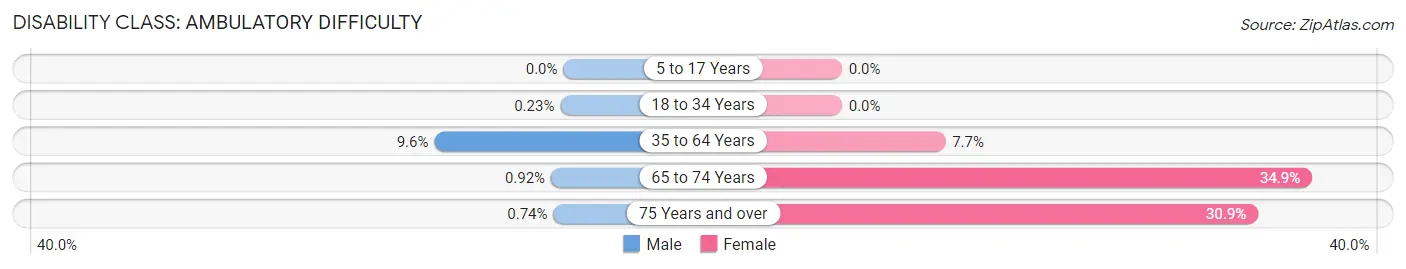
| Age Bracket | Male | Female |
| 5 to 17 Years | 0 (0.0%) | 0 (0.0%) |
| 18 to 34 Years | 1 (0.2%) | 0 (0.0%) |
| 35 to 64 Years | 73 (9.6%) | 63 (7.7%) |
| 65 to 74 Years | 2 (0.9%) | 74 (34.9%) |
| 75 Years and over | 1 (0.7%) | 51 (30.9%) |
Disability Class: Self-Care Difficulty
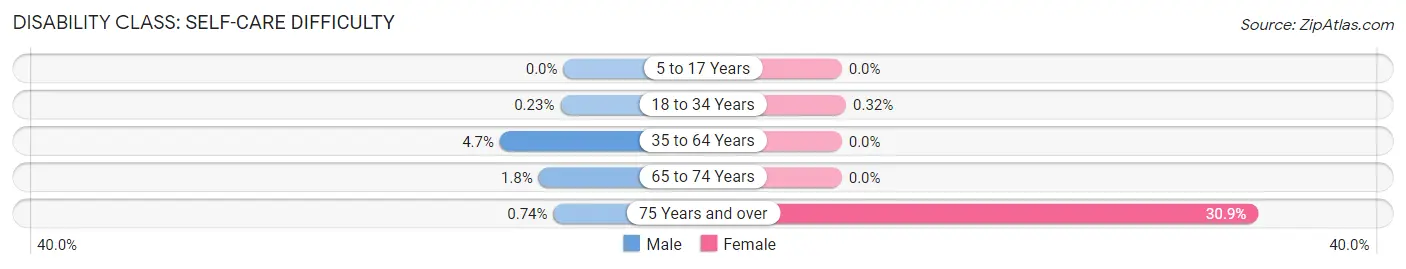
| Age Bracket | Male | Female |
| 5 to 17 Years | 0 (0.0%) | 0 (0.0%) |
| 18 to 34 Years | 1 (0.2%) | 2 (0.3%) |
| 35 to 64 Years | 36 (4.7%) | 0 (0.0%) |
| 65 to 74 Years | 4 (1.8%) | 0 (0.0%) |
| 75 Years and over | 1 (0.7%) | 51 (30.9%) |
Technology Access in Bagdad
Computing Device Access in Bagdad
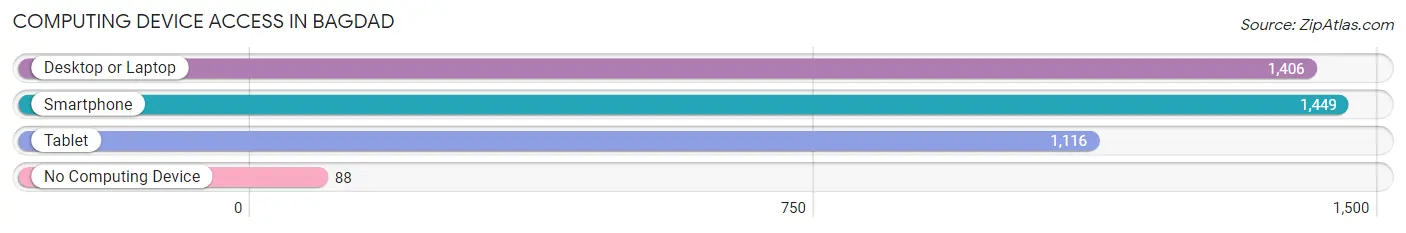
| Device Type | # Households | % Households |
| Desktop or Laptop | 1,406 | 84.8% |
| Smartphone | 1,449 | 87.4% |
| Tablet | 1,116 | 67.3% |
| No Computing Device | 88 | 5.3% |
| Total | 1,658 | 100.0% |
Internet Access in Bagdad
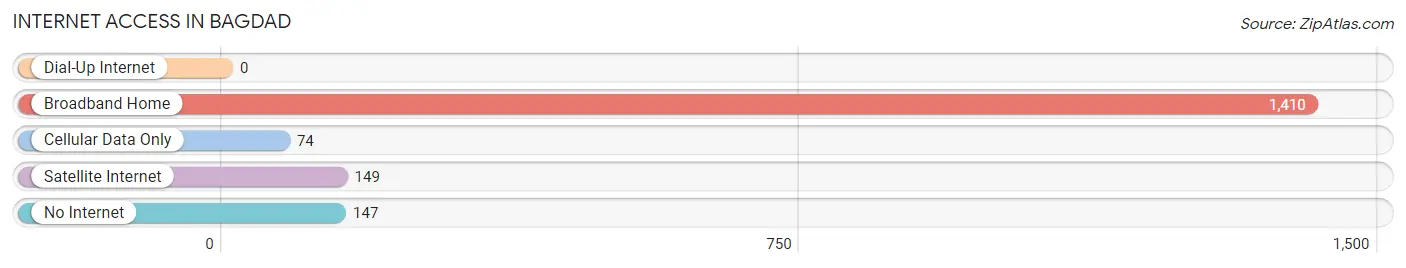
| Internet Type | # Households | % Households |
| Dial-Up Internet | 0 | 0.0% |
| Broadband Home | 1,410 | 85.0% |
| Cellular Data Only | 74 | 4.5% |
| Satellite Internet | 149 | 9.0% |
| No Internet | 147 | 8.9% |
| Total | 1,658 | 100.0% |
Bagdad Summary
Bagdad, Florida is a small town located in Santa Rosa County, Florida. It is situated on the Blackwater River, approximately 25 miles northeast of Pensacola. The town was founded in 1821 and is one of the oldest towns in the state. The population of Bagdad was 1,764 in the 2010 census.
History
Bagdad was founded in 1821 by settlers from the British Isles. The town was named after the city of Baghdad, Iraq, which was then part of the Ottoman Empire. The town was originally a trading post for the local Native American tribes. In 1822, the town was incorporated and the first post office was established.
In the late 19th century, Bagdad became a major lumber town. The town was home to several sawmills and lumber companies. The lumber industry was the main source of income for the town until the early 20th century.
In the early 20th century, Bagdad began to decline as the lumber industry moved away. The town was hit hard by the Great Depression and many of the businesses closed. In the 1950s, the town began to revive as a tourist destination. The town was home to several resorts and fishing camps.
Geography
Bagdad is located in Santa Rosa County, Florida. It is situated on the Blackwater River, approximately 25 miles northeast of Pensacola. The town is located in the Florida Panhandle, near the Alabama border. The town is surrounded by forests and wetlands.
The climate in Bagdad is humid subtropical. The average temperature in the summer is around 90 degrees Fahrenheit and the average temperature in the winter is around 50 degrees Fahrenheit. The town receives an average of 54 inches of rain per year.
Economy
The economy of Bagdad is largely based on tourism. The town is home to several resorts and fishing camps. The town is also home to several small businesses, including restaurants, shops, and art galleries.
The town is also home to several manufacturing companies. The largest employer in the town is the Bagdad Mill Site, which produces paper products. The town is also home to several small farms, which produce vegetables, fruits, and livestock.
Demographics
As of the 2010 census, the population of Bagdad was 1,764. The racial makeup of the town was 94.3% White, 2.2% African American, 0.7% Native American, 0.3% Asian, 0.1% Pacific Islander, 0.9% from other races, and 1.6% from two or more races. Hispanic or Latino of any race were 3.2% of the population.
The median income for a household in Bagdad was $37,917, and the median income for a family was $45,625. The per capita income for the town was $19,945. About 11.2% of families and 14.2% of the population were below the poverty line, including 19.2% of those under age 18 and 8.3% of those age 65 or over.
Common Questions
What is the Total Population of Bagdad?
Total Population of Bagdad is 4,359.
What is the Total Male Population of Bagdad?
Total Male Population of Bagdad is 2,237.
What is the Total Female Population of Bagdad?
Total Female Population of Bagdad is 2,122.
What is the Ratio of Males per 100 Females in Bagdad?
There are 105.42 Males per 100 Females in Bagdad.
What is the Ratio of Females per 100 Males in Bagdad?
There are 94.86 Females per 100 Males in Bagdad.
What is the Median Population Age in Bagdad?
Median Population Age in Bagdad is 38.3 Years.
What is the Average Family Size in Bagdad
Average Family Size in Bagdad is 2.9 People.
What is the Average Household Size in Bagdad
Average Household Size in Bagdad is 2.6 People.
What is Per Capita Income in Bagdad?
Per Capita income in Bagdad is $35,716.
What is the Median Family Income in Bagdad?
Median Family Income in Bagdad is $82,284.
What is the Median Household income in Bagdad?
Median Household Income in Bagdad is $78,182.
What is Income or Wage Gap in Bagdad?
Income or Wage Gap in Bagdad is 17.5%.
Women in Bagdad earn 82.5 cents for every dollar earned by a man.
What is Inequality or Gini Index in Bagdad?
Inequality or Gini Index in Bagdad is 0.34.
How Large is the Labor Force in Bagdad?
There are 2,325 People in the Labor Forcein in Bagdad.
What is the Percentage of People in the Labor Force in Bagdad?
64.9% of People are in the Labor Force in Bagdad.
What is the Unemployment Rate in Bagdad?
Unemployment Rate in Bagdad is 1.1%.