Citrus Hills, FL
Citrus Hills Map
Citrus Hills Overview
8,599
TOTAL POPULATION
3,795
MALE POPULATION
4,804
FEMALE POPULATION
79.00
MALES / 100 FEMALES
126.59
FEMALES / 100 MALES
67.9
MEDIAN AGE
2.4
AVG FAMILY SIZE
2.1
AVG HOUSEHOLD SIZE
$49,418
PER CAPITA INCOME
$89,836
AVG FAMILY INCOME
$79,206
AVG HOUSEHOLD INCOME
61.6%
WAGE / INCOME GAP [ % ]
38.4¢/ $1
WAGE / INCOME GAP [ $ ]
0.46
INEQUALITY / GINI INDEX
2,079
LABOR FORCE [ PEOPLE ]
25.7%
PERCENT IN LABOR FORCE
14.3%
UNEMPLOYMENT RATE
Citrus Hills Area Codes
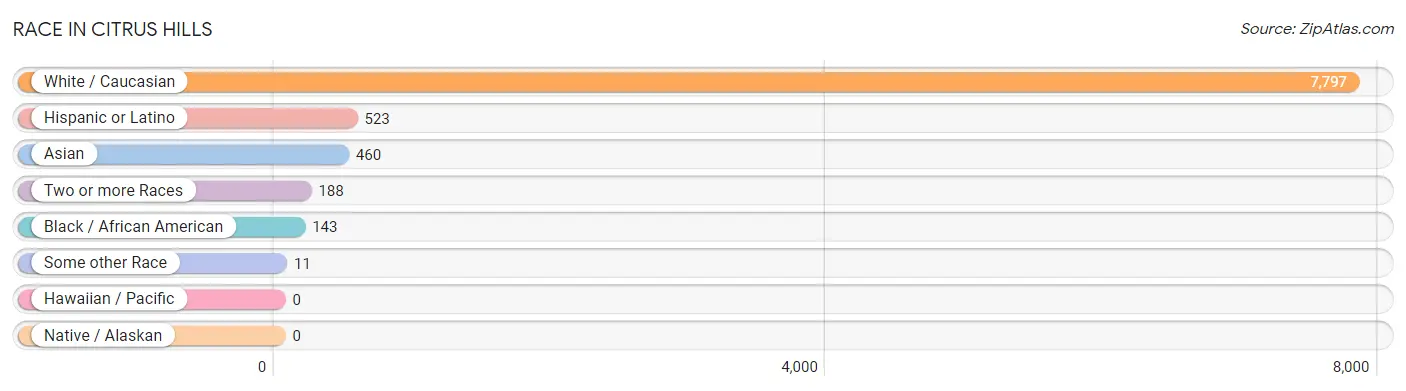
Race in Citrus Hills
The most populous races in Citrus Hills are White / Caucasian (7,797 | 90.7%), Hispanic or Latino (523 | 6.1%), and Asian (460 | 5.3%).
| Race | # Population | % Population |
| Asian | 460 | 5.3% |
| Black / African American | 143 | 1.7% |
| Hawaiian / Pacific | 0 | 0.0% |
| Hispanic or Latino | 523 | 6.1% |
| Native / Alaskan | 0 | 0.0% |
| White / Caucasian | 7,797 | 90.7% |
| Two or more Races | 188 | 2.2% |
| Some other Race | 11 | 0.1% |
| Total | 8,599 | 100.0% |
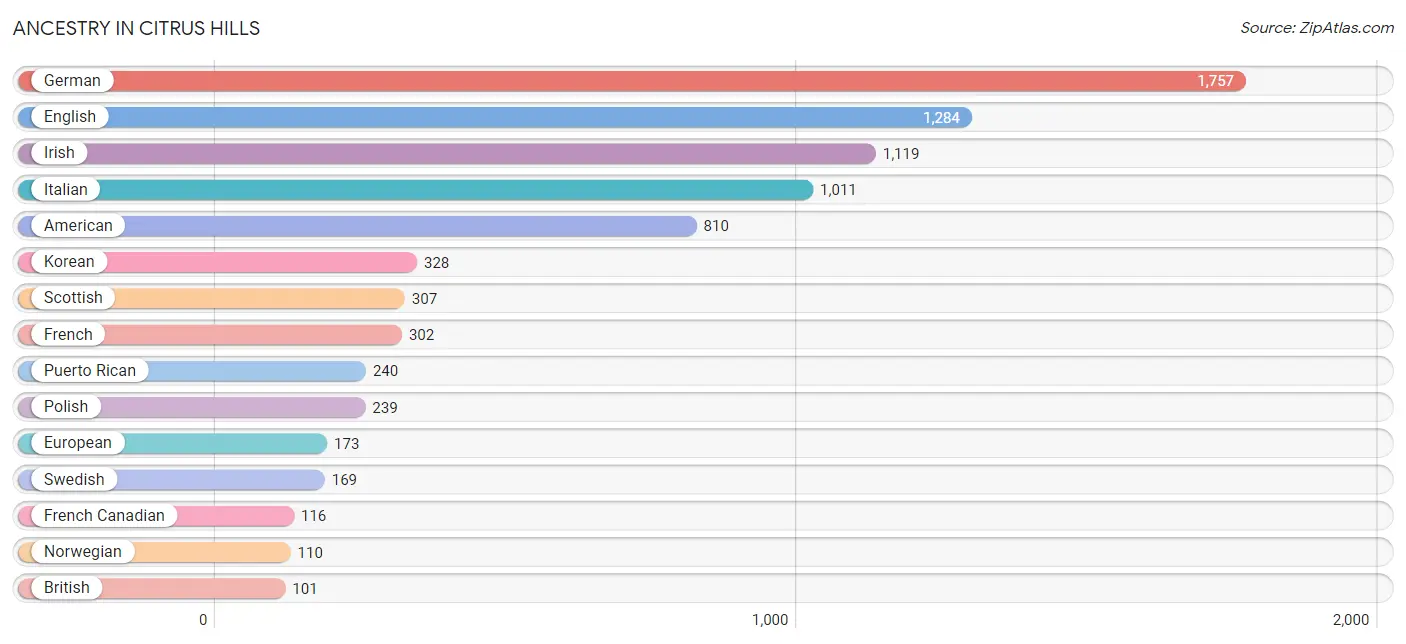
Ancestry in Citrus Hills
The most populous ancestries reported in Citrus Hills are German (1,757 | 20.4%), English (1,284 | 14.9%), Irish (1,119 | 13.0%), Italian (1,011 | 11.8%), and American (810 | 9.4%), together accounting for 69.6% of all Citrus Hills residents.
| Ancestry | # Population | % Population |
| African | 21 | 0.2% |
| American | 810 | 9.4% |
| Arab | 14 | 0.2% |
| British | 101 | 1.2% |
| Burmese | 65 | 0.8% |
| Central American | 58 | 0.7% |
| Croatian | 25 | 0.3% |
| Cuban | 31 | 0.4% |
| Czech | 82 | 0.9% |
| Czechoslovakian | 13 | 0.2% |
| Danish | 42 | 0.5% |
| Dominican | 21 | 0.2% |
| Dutch | 93 | 1.1% |
| Eastern European | 48 | 0.6% |
| Ecuadorian | 17 | 0.2% |
| English | 1,284 | 14.9% |
| European | 173 | 2.0% |
| French | 302 | 3.5% |
| French Canadian | 116 | 1.3% |
| German | 1,757 | 20.4% |
| Greek | 27 | 0.3% |
| Haitian | 33 | 0.4% |
| Honduran | 58 | 0.7% |
| Hungarian | 43 | 0.5% |
| Indian (Asian) | 33 | 0.4% |
| Irish | 1,119 | 13.0% |
| Italian | 1,011 | 11.8% |
| Jamaican | 9 | 0.1% |
| Korean | 328 | 3.8% |
| Lebanese | 14 | 0.2% |
| Lithuanian | 14 | 0.2% |
| Luxembourger | 36 | 0.4% |
| Mexican | 90 | 1.1% |
| Northern European | 20 | 0.2% |
| Norwegian | 110 | 1.3% |
| Polish | 239 | 2.8% |
| Portuguese | 21 | 0.2% |
| Puerto Rican | 240 | 2.8% |
| Russian | 40 | 0.5% |
| Scotch-Irish | 64 | 0.7% |
| Scottish | 307 | 3.6% |
| Slovak | 13 | 0.2% |
| Slovene | 17 | 0.2% |
| South American | 17 | 0.2% |
| Spaniard | 37 | 0.4% |
| Sri Lankan | 18 | 0.2% |
| Subsaharan African | 21 | 0.2% |
| Swedish | 169 | 2.0% |
| Swiss | 55 | 0.6% |
| Thai | 30 | 0.4% |
| Ukrainian | 45 | 0.5% |
| Welsh | 32 | 0.4% | View All 52 Rows |
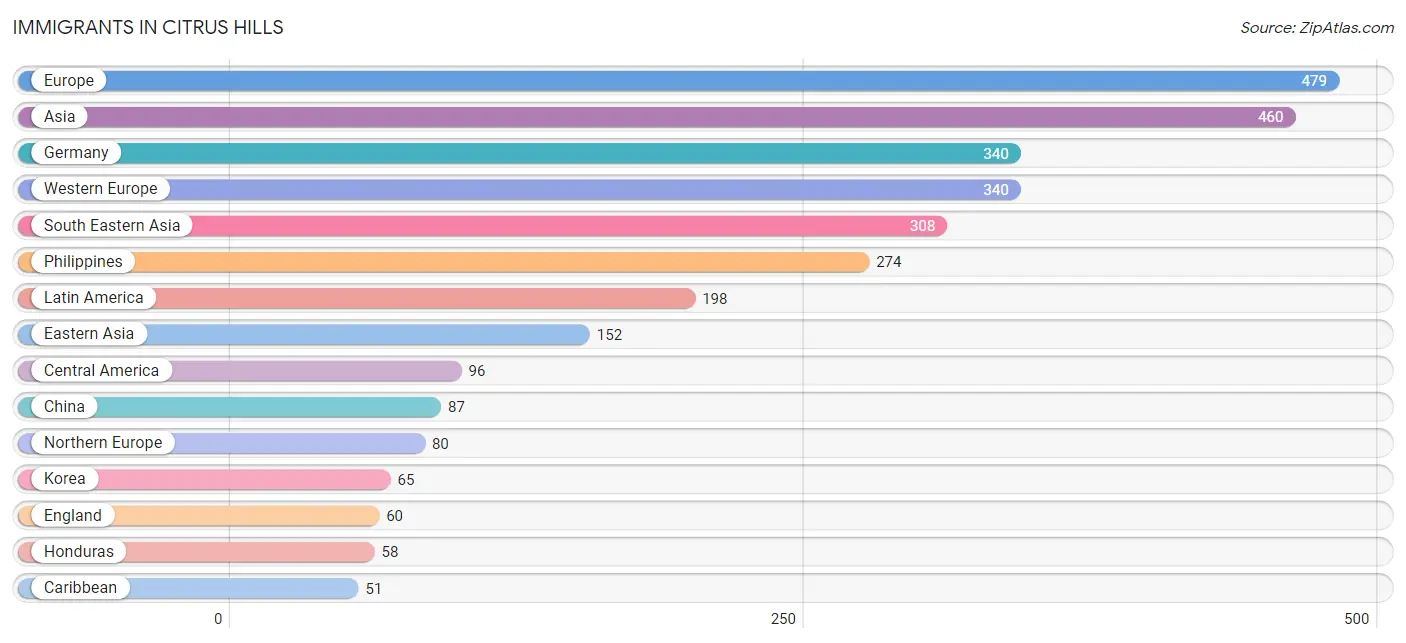
Immigrants in Citrus Hills
The most numerous immigrant groups reported in Citrus Hills came from Europe (479 | 5.6%), Asia (460 | 5.3%), Germany (340 | 4.0%), Western Europe (340 | 4.0%), and South Eastern Asia (308 | 3.6%), together accounting for 22.4% of all Citrus Hills residents.
| Immigration Origin | # Population | % Population |
| Asia | 460 | 5.3% |
| Brazil | 14 | 0.2% |
| Canada | 47 | 0.5% |
| Caribbean | 51 | 0.6% |
| Central America | 96 | 1.1% |
| China | 87 | 1.0% |
| Dominican Republic | 21 | 0.2% |
| Eastern Asia | 152 | 1.8% |
| Eastern Europe | 15 | 0.2% |
| Ecuador | 37 | 0.4% |
| England | 60 | 0.7% |
| Europe | 479 | 5.6% |
| Germany | 340 | 4.0% |
| Haiti | 21 | 0.2% |
| Honduras | 58 | 0.7% |
| Italy | 27 | 0.3% |
| Jamaica | 9 | 0.1% |
| Korea | 65 | 0.8% |
| Latin America | 198 | 2.3% |
| Mexico | 38 | 0.4% |
| Northern Europe | 80 | 0.9% |
| Philippines | 274 | 3.2% |
| Poland | 15 | 0.2% |
| South America | 51 | 0.6% |
| South Eastern Asia | 308 | 3.6% |
| Southern Europe | 44 | 0.5% |
| Spain | 17 | 0.2% |
| Vietnam | 34 | 0.4% |
| Western Europe | 340 | 4.0% | View All 29 Rows |
Sex and Age in Citrus Hills
Sex and Age in Citrus Hills
The most populous age groups in Citrus Hills are 70 to 74 Years (778 | 20.5%) for men and 70 to 74 Years (763 | 15.9%) for women.
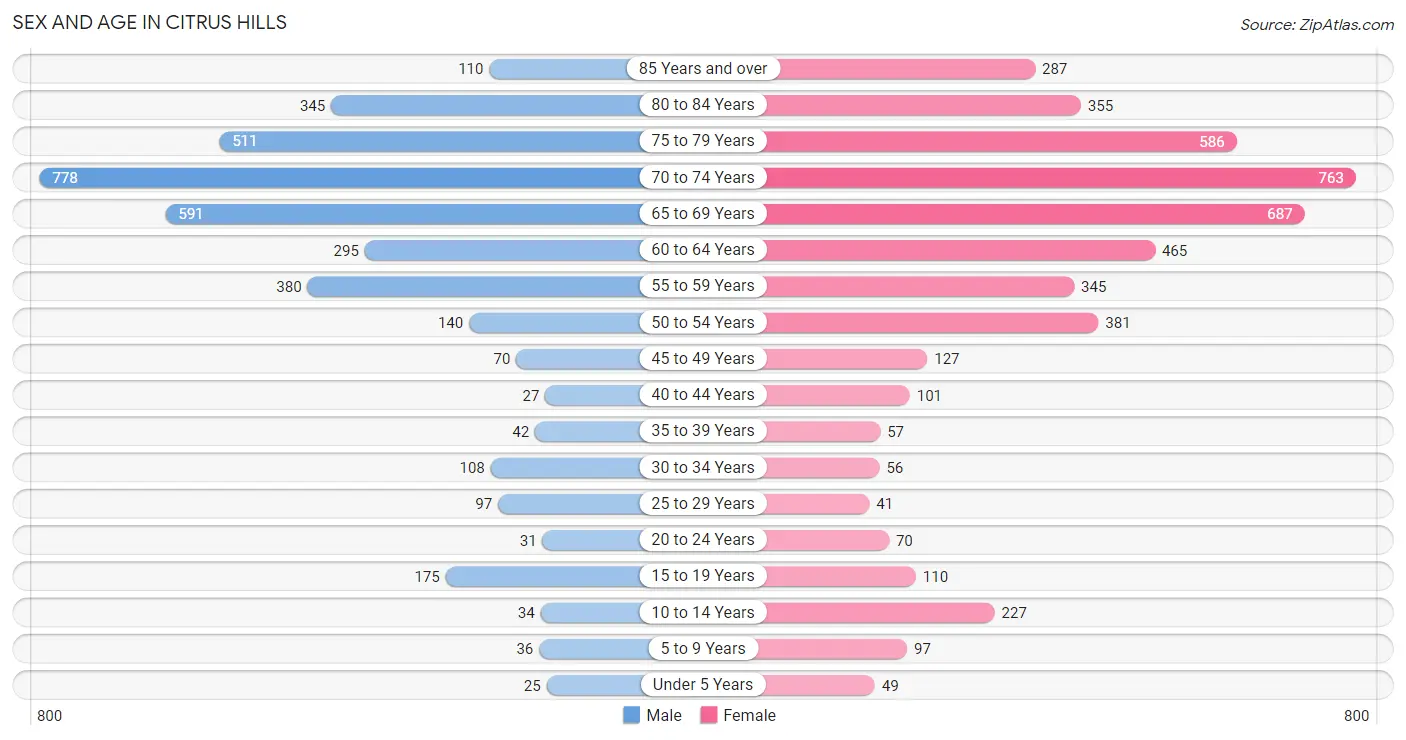
| Age Bracket | Male | Female |
| Under 5 Years | 25 (0.7%) | 49 (1.0%) |
| 5 to 9 Years | 36 (0.9%) | 97 (2.0%) |
| 10 to 14 Years | 34 (0.9%) | 227 (4.7%) |
| 15 to 19 Years | 175 (4.6%) | 110 (2.3%) |
| 20 to 24 Years | 31 (0.8%) | 70 (1.5%) |
| 25 to 29 Years | 97 (2.6%) | 41 (0.9%) |
| 30 to 34 Years | 108 (2.9%) | 56 (1.2%) |
| 35 to 39 Years | 42 (1.1%) | 57 (1.2%) |
| 40 to 44 Years | 27 (0.7%) | 101 (2.1%) |
| 45 to 49 Years | 70 (1.8%) | 127 (2.6%) |
| 50 to 54 Years | 140 (3.7%) | 381 (7.9%) |
| 55 to 59 Years | 380 (10.0%) | 345 (7.2%) |
| 60 to 64 Years | 295 (7.8%) | 465 (9.7%) |
| 65 to 69 Years | 591 (15.6%) | 687 (14.3%) |
| 70 to 74 Years | 778 (20.5%) | 763 (15.9%) |
| 75 to 79 Years | 511 (13.5%) | 586 (12.2%) |
| 80 to 84 Years | 345 (9.1%) | 355 (7.4%) |
| 85 Years and over | 110 (2.9%) | 287 (6.0%) |
| Total | 3,795 (100.0%) | 4,804 (100.0%) |
Families and Households in Citrus Hills
Median Family Size in Citrus Hills
The median family size in Citrus Hills is 2.42 persons per family, with single female/mother families (111 | 3.8%) accounting for the largest median family size of 3.64 persons per family. On the other hand, married-couple families (2,807 | 95.4%) represent the smallest median family size with 2.37 persons per family.
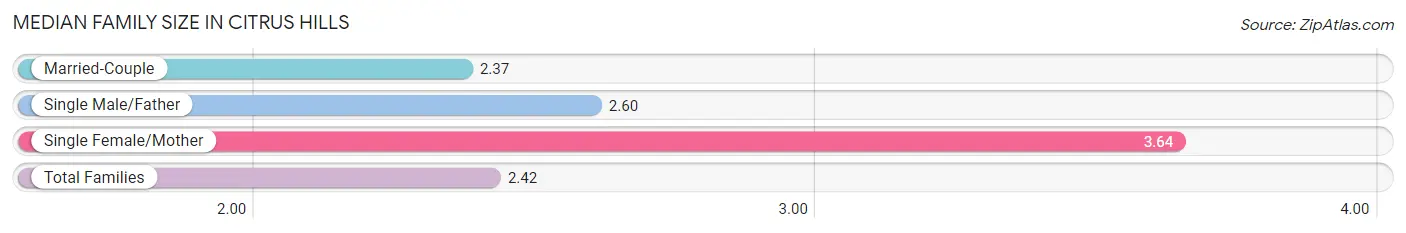
| Family Type | # Families | Family Size |
| Married-Couple | 2,807 (95.4%) | 2.37 |
| Single Male/Father | 25 (0.9%) | 2.60 |
| Single Female/Mother | 111 (3.8%) | 3.64 |
| Total Families | 2,943 (100.0%) | 2.42 |
Median Household Size in Citrus Hills
The median household size in Citrus Hills is 2.13 persons per household, with single female/mother households (111 | 2.8%) accounting for the largest median household size of 3.64 persons per household. non-family households (1,024 | 25.8%) represent the smallest median household size with 1.28 persons per household.
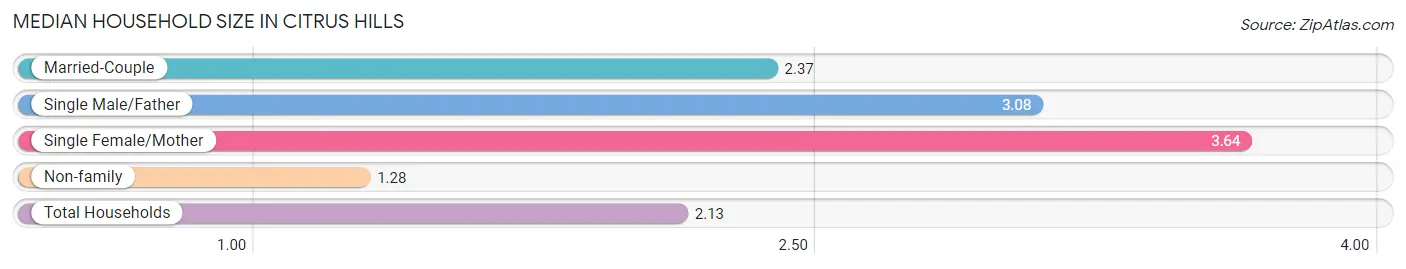
| Household Type | # Households | Household Size |
| Married-Couple | 2,807 (70.8%) | 2.37 |
| Single Male/Father | 25 (0.6%) | 3.08 |
| Single Female/Mother | 111 (2.8%) | 3.64 |
| Non-family | 1,024 (25.8%) | 1.28 |
| Total Households | 3,967 (100.0%) | 2.13 |
Household Size by Marriage Status in Citrus Hills
Out of a total of 3,967 households in Citrus Hills, 2,943 (74.2%) are family households, while 1,024 (25.8%) are nonfamily households. The most numerous type of family households are 2-person households, comprising 2,302, and the most common type of nonfamily households are 1-person households, comprising 780.
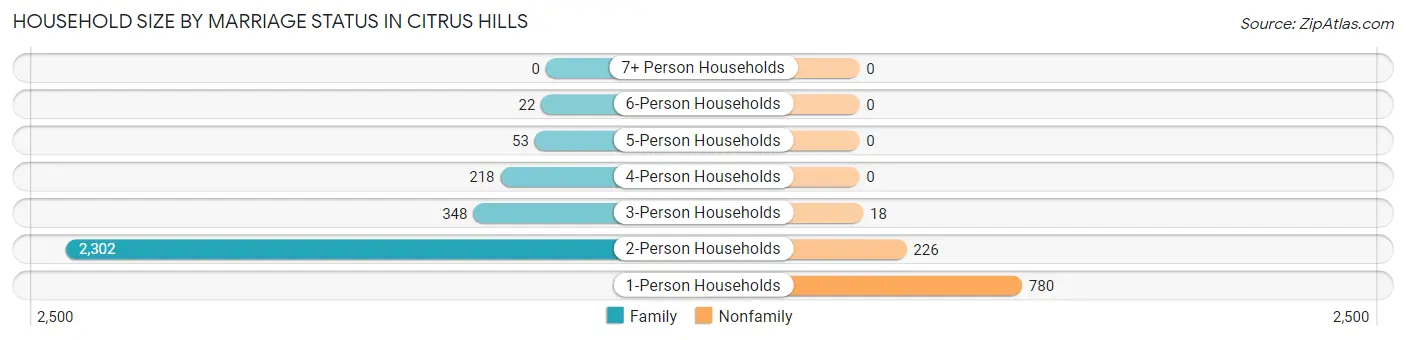
| Household Size | Family Households | Nonfamily Households |
| 1-Person Households | - | 780 (19.7%) |
| 2-Person Households | 2,302 (58.0%) | 226 (5.7%) |
| 3-Person Households | 348 (8.8%) | 18 (0.4%) |
| 4-Person Households | 218 (5.5%) | 0 (0.0%) |
| 5-Person Households | 53 (1.3%) | 0 (0.0%) |
| 6-Person Households | 22 (0.5%) | 0 (0.0%) |
| 7+ Person Households | 0 (0.0%) | 0 (0.0%) |
| Total | 2,943 (74.2%) | 1,024 (25.8%) |
Female Fertility in Citrus Hills
Fertility by Age in Citrus Hills
| Age Bracket | Women with Births | Births / 1,000 Women |
| 15 to 19 years | 0 (0.0%) | 0.0 |
| 20 to 34 years | 0 (0.0%) | 0.0 |
| 35 to 50 years | 0 (0.0%) | 0.0 |
| Total | 0 (0.0%) | 0.0 |
Fertility by Age by Marriage Status in Citrus Hills
| Age Bracket | Married | Unmarried |
| 15 to 19 years | 0 (0.0%) | 0 (0.0%) |
| 20 to 34 years | 0 (0.0%) | 0 (0.0%) |
| 35 to 50 years | 0 (0.0%) | 0 (0.0%) |
| Total | 0 (0.0%) | 0 (0.0%) |
Fertility by Education in Citrus Hills
| Educational Attainment | Women with Births | Births / 1,000 Women |
| Less than High School | 0 (0.0%) | 0.0 |
| High School Diploma | 0 (0.0%) | 0.0 |
| College or Associate's Degree | 0 (0.0%) | 0.0 |
| Bachelor's Degree | 0 (0.0%) | 0.0 |
| Graduate Degree | 0 (0.0%) | 0.0 |
| Total | 0 (0.0%) | 0.0 |
Fertility by Education by Marriage Status in Citrus Hills
| Educational Attainment | Married | Unmarried |
| Less than High School | 0 (0.0%) | 0 (0.0%) |
| High School Diploma | 0 (0.0%) | 0 (0.0%) |
| College or Associate's Degree | 0 (0.0%) | 0 (0.0%) |
| Bachelor's Degree | 0 (0.0%) | 0 (0.0%) |
| Graduate Degree | 0 (0.0%) | 0 (0.0%) |
| Total | 0 (0.0%) | 0 (0.0%) |
Income in Citrus Hills
Income Overview in Citrus Hills
Per Capita Income in Citrus Hills is $49,418, while median incomes of families and households are $89,836 and $79,206 respectively.
| Characteristic | Number | Measure |
| Per Capita Income | 8,599 | $49,418 |
| Median Family Income | 2,943 | $89,836 |
| Mean Family Income | 2,943 | $118,063 |
| Median Household Income | 3,967 | $79,206 |
| Mean Household Income | 3,967 | $105,629 |
| Income Deficit | 2,943 | $0 |
| Wage / Income Gap (%) | 8,599 | 61.57% |
| Wage / Income Gap ($) | 8,599 | 38.43¢ per $1 |
| Gini / Inequality Index | 8,599 | 0.46 |
Earnings by Sex in Citrus Hills
Average Earnings in Citrus Hills are $36,594, $65,670 for men and $25,234 for women, a difference of 61.6%.
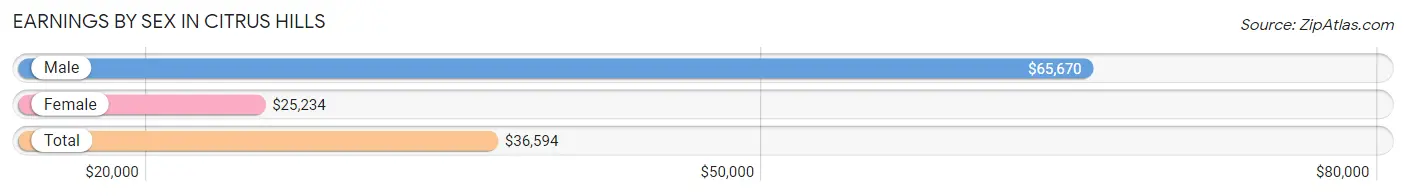
| Sex | Number | Average Earnings |
| Male | 1,048 (48.9%) | $65,670 |
| Female | 1,095 (51.1%) | $25,234 |
| Total | 2,143 (100.0%) | $36,594 |
Earnings by Sex by Income Bracket in Citrus Hills
The most common earnings brackets in Citrus Hills are $100,000+ for men (420 | 40.1%) and $2,500 to $4,999 for women (146 | 13.3%).
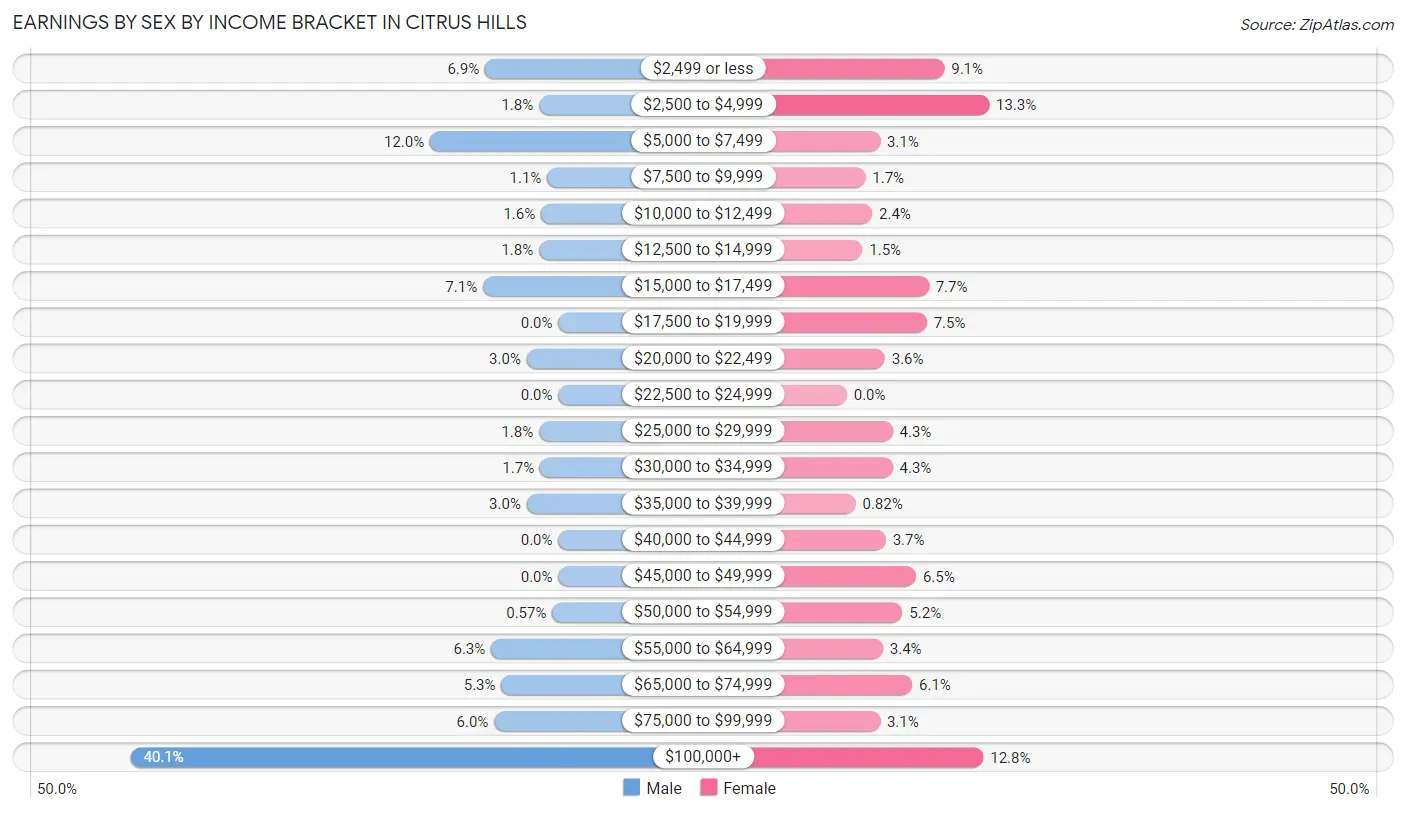
| Income | Male | Female |
| $2,499 or less | 72 (6.9%) | 100 (9.1%) |
| $2,500 to $4,999 | 19 (1.8%) | 146 (13.3%) |
| $5,000 to $7,499 | 126 (12.0%) | 34 (3.1%) |
| $7,500 to $9,999 | 11 (1.1%) | 19 (1.7%) |
| $10,000 to $12,499 | 17 (1.6%) | 26 (2.4%) |
| $12,500 to $14,999 | 19 (1.8%) | 16 (1.5%) |
| $15,000 to $17,499 | 74 (7.1%) | 84 (7.7%) |
| $17,500 to $19,999 | 0 (0.0%) | 82 (7.5%) |
| $20,000 to $22,499 | 31 (3.0%) | 39 (3.6%) |
| $22,500 to $24,999 | 0 (0.0%) | 0 (0.0%) |
| $25,000 to $29,999 | 19 (1.8%) | 47 (4.3%) |
| $30,000 to $34,999 | 18 (1.7%) | 47 (4.3%) |
| $35,000 to $39,999 | 31 (3.0%) | 9 (0.8%) |
| $40,000 to $44,999 | 0 (0.0%) | 40 (3.6%) |
| $45,000 to $49,999 | 0 (0.0%) | 71 (6.5%) |
| $50,000 to $54,999 | 6 (0.6%) | 57 (5.2%) |
| $55,000 to $64,999 | 66 (6.3%) | 37 (3.4%) |
| $65,000 to $74,999 | 56 (5.3%) | 67 (6.1%) |
| $75,000 to $99,999 | 63 (6.0%) | 34 (3.1%) |
| $100,000+ | 420 (40.1%) | 140 (12.8%) |
| Total | 1,048 (100.0%) | 1,095 (100.0%) |
Earnings by Sex by Educational Attainment in Citrus Hills
Average earnings in Citrus Hills are $77,727 for men and $30,714 for women, a difference of 60.5%. Men with an educational attainment of graduate degree enjoy the highest average annual earnings of $107,277, while those with high school diploma education earn the least with $56,736. Women with an educational attainment of college or associate's degree earn the most with the average annual earnings of $19,784, while those with college or associate's degree education have the smallest earnings of $19,784.
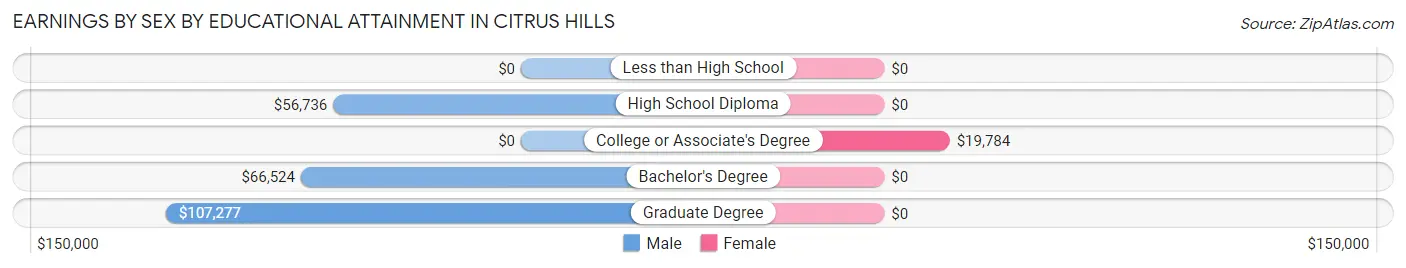
| Educational Attainment | Male Income | Female Income |
| Less than High School | - | - |
| High School Diploma | $56,736 | $0 |
| College or Associate's Degree | - | - |
| Bachelor's Degree | $66,524 | $0 |
| Graduate Degree | $107,277 | $0 |
| Total | $77,727 | $30,714 |
Family Income in Citrus Hills
Family Income Brackets in Citrus Hills
According to the Citrus Hills family income data, there are 650 families falling into the $100,000 to $149,999 income range, which is the most common income bracket and makes up 22.1% of all families. Conversely, the $10,000 to $14,999 income bracket is the least frequent group with only 24 families (0.8%) belonging to this category.
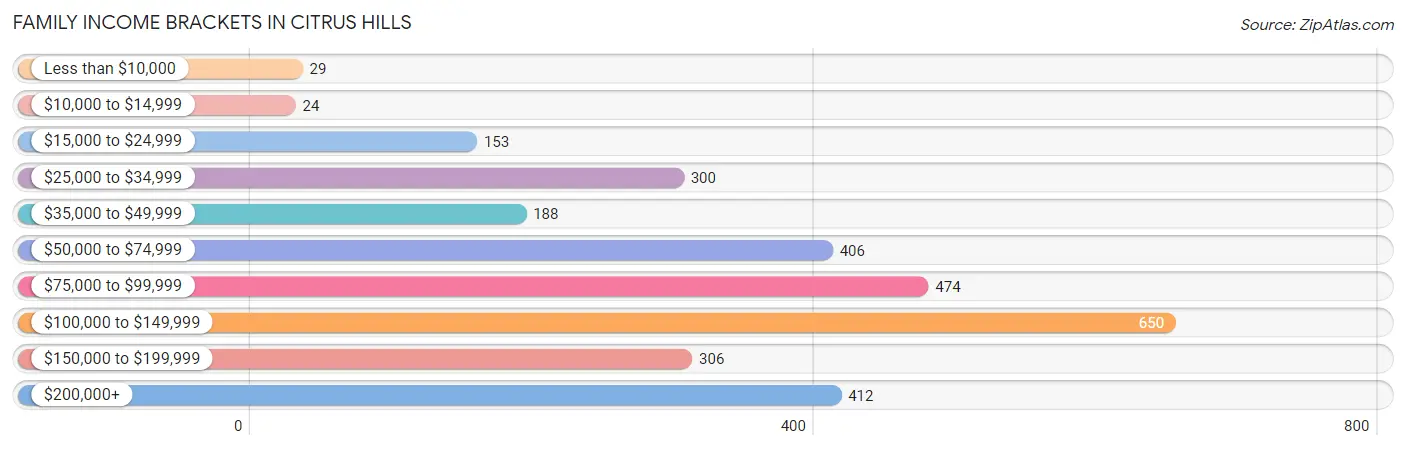
| Income Bracket | # Families | % Families |
| Less than $10,000 | 29 | 1.0% |
| $10,000 to $14,999 | 24 | 0.8% |
| $15,000 to $24,999 | 153 | 5.2% |
| $25,000 to $34,999 | 300 | 10.2% |
| $35,000 to $49,999 | 188 | 6.4% |
| $50,000 to $74,999 | 406 | 13.8% |
| $75,000 to $99,999 | 474 | 16.1% |
| $100,000 to $149,999 | 650 | 22.1% |
| $150,000 to $199,999 | 306 | 10.4% |
| $200,000+ | 412 | 14.0% |
Family Income by Famaliy Size in Citrus Hills
5-person families (53 | 1.8%) account for the highest median family income in Citrus Hills with $250,001 per family, while 5-person families (53 | 1.8%) have the highest median income of $50,000 per family member.
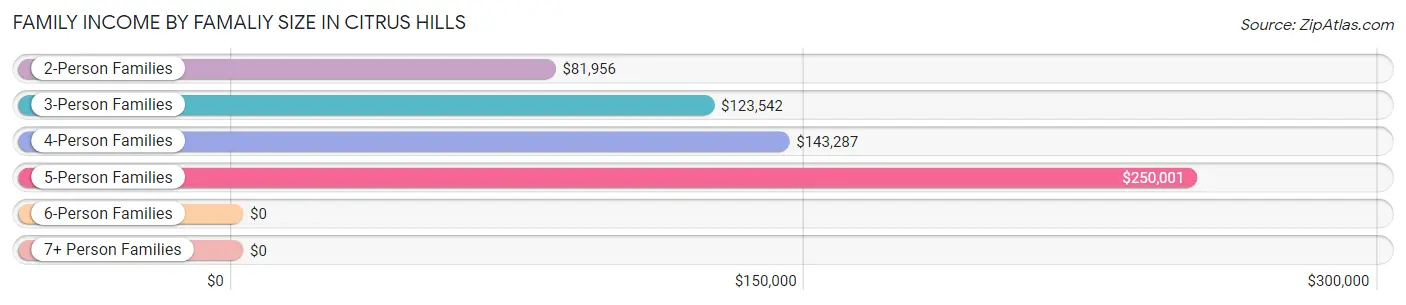
| Income Bracket | # Families | Median Income |
| 2-Person Families | 2,329 (79.1%) | $81,956 |
| 3-Person Families | 321 (10.9%) | $123,542 |
| 4-Person Families | 218 (7.4%) | $143,287 |
| 5-Person Families | 53 (1.8%) | $250,001 |
| 6-Person Families | 22 (0.7%) | $0 |
| 7+ Person Families | 0 (0.0%) | $0 |
| Total | 2,943 (100.0%) | $89,836 |
Family Income by Number of Earners in Citrus Hills
The median family income in Citrus Hills is $89,836, with families comprising 3+ earners (99) having the highest median family income of $228,750, while families with no earners (1,845) have the lowest median family income of $78,118, accounting for 3.4% and 62.7% of families, respectively.
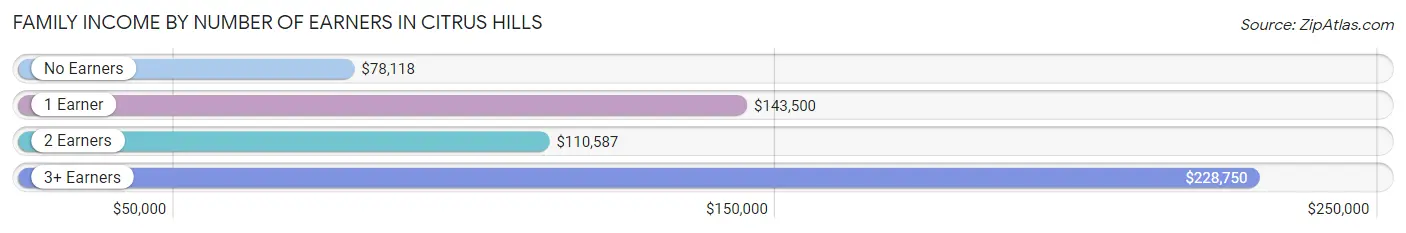
| Number of Earners | # Families | Median Income |
| No Earners | 1,845 (62.7%) | $78,118 |
| 1 Earner | 546 (18.5%) | $143,500 |
| 2 Earners | 453 (15.4%) | $110,587 |
| 3+ Earners | 99 (3.4%) | $228,750 |
| Total | 2,943 (100.0%) | $89,836 |
Household Income in Citrus Hills
Household Income Brackets in Citrus Hills
With 778 households falling in the category, the $100,000 to $149,999 income range is the most frequent in Citrus Hills, accounting for 19.6% of all households. In contrast, only 119 households (3.0%) fall into the $10,000 to $14,999 income bracket, making it the least populous group.
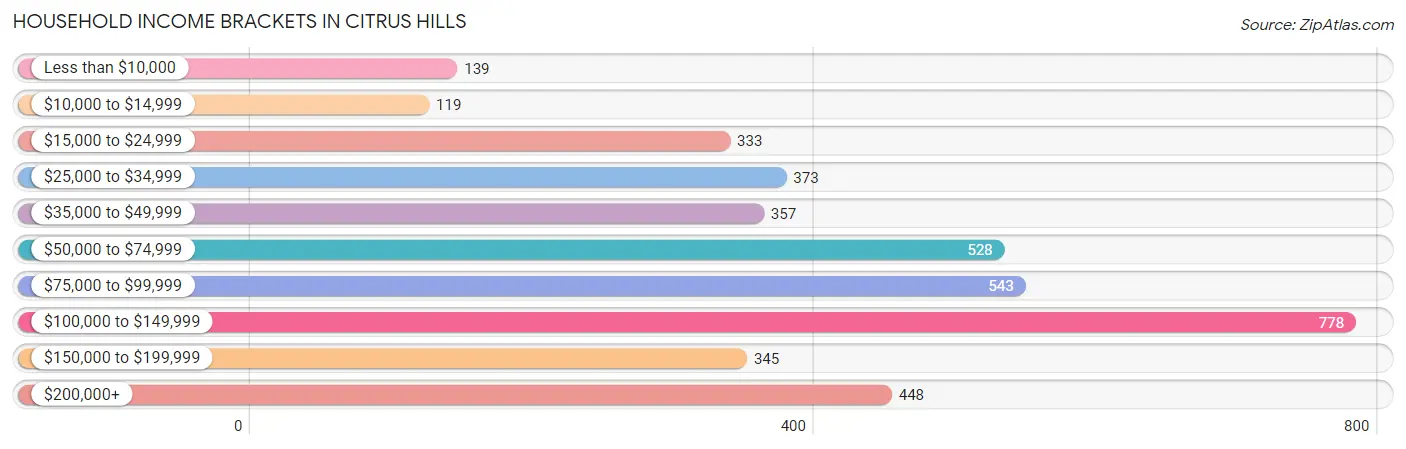
| Income Bracket | # Households | % Households |
| Less than $10,000 | 139 | 3.5% |
| $10,000 to $14,999 | 119 | 3.0% |
| $15,000 to $24,999 | 333 | 8.4% |
| $25,000 to $34,999 | 373 | 9.4% |
| $35,000 to $49,999 | 357 | 9.0% |
| $50,000 to $74,999 | 528 | 13.3% |
| $75,000 to $99,999 | 543 | 13.7% |
| $100,000 to $149,999 | 778 | 19.6% |
| $150,000 to $199,999 | 345 | 8.7% |
| $200,000+ | 448 | 11.3% |
Household Income by Householder Age in Citrus Hills
The median household income in Citrus Hills is $79,206, with the highest median household income of $119,286 found in the 25 to 44 years age bracket for the primary householder. A total of 96 households (2.4%) fall into this category.
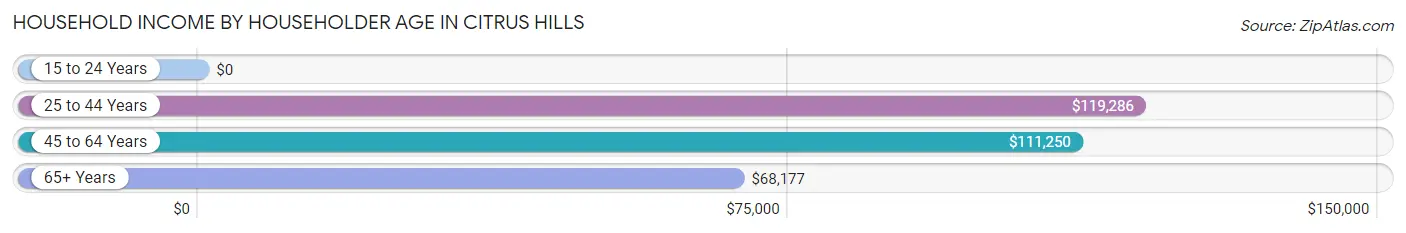
| Income Bracket | # Households | Median Income |
| 15 to 24 Years | 0 (0.0%) | $0 |
| 25 to 44 Years | 96 (2.4%) | $119,286 |
| 45 to 64 Years | 1,034 (26.1%) | $111,250 |
| 65+ Years | 2,837 (71.5%) | $68,177 |
| Total | 3,967 (100.0%) | $79,206 |
Poverty in Citrus Hills
Income Below Poverty by Sex and Age in Citrus Hills
With 6.8% poverty level for males and 8.6% for females among the residents of Citrus Hills, 16 and 17 year old males and 12 to 14 year old females are the most vulnerable to poverty, with 45 males (56.2%) and 54 females (29.0%) in their respective age groups living below the poverty level.
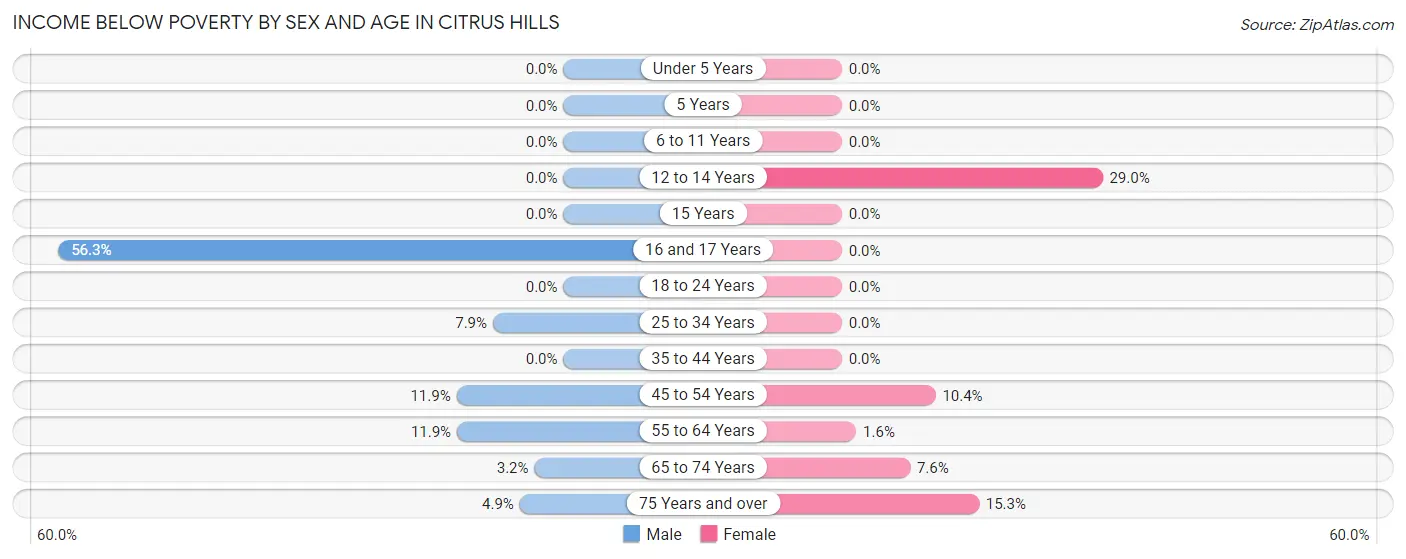
| Age Bracket | Male | Female |
| Under 5 Years | 0 (0.0%) | 0 (0.0%) |
| 5 Years | 0 (0.0%) | 0 (0.0%) |
| 6 to 11 Years | 0 (0.0%) | 0 (0.0%) |
| 12 to 14 Years | 0 (0.0%) | 54 (29.0%) |
| 15 Years | 0 (0.0%) | 0 (0.0%) |
| 16 and 17 Years | 45 (56.2%) | 0 (0.0%) |
| 18 to 24 Years | 0 (0.0%) | 0 (0.0%) |
| 25 to 34 Years | 15 (7.9%) | 0 (0.0%) |
| 35 to 44 Years | 0 (0.0%) | 0 (0.0%) |
| 45 to 54 Years | 25 (11.9%) | 53 (10.4%) |
| 55 to 64 Years | 80 (11.8%) | 13 (1.6%) |
| 65 to 74 Years | 43 (3.2%) | 110 (7.6%) |
| 75 Years and over | 45 (4.9%) | 179 (15.3%) |
| Total | 253 (6.8%) | 409 (8.6%) |
Income Above Poverty by Sex and Age in Citrus Hills
According to the poverty statistics in Citrus Hills, males aged under 5 years and females aged under 5 years are the age groups that are most secure financially, with 100.0% of males and 100.0% of females in these age groups living above the poverty line.
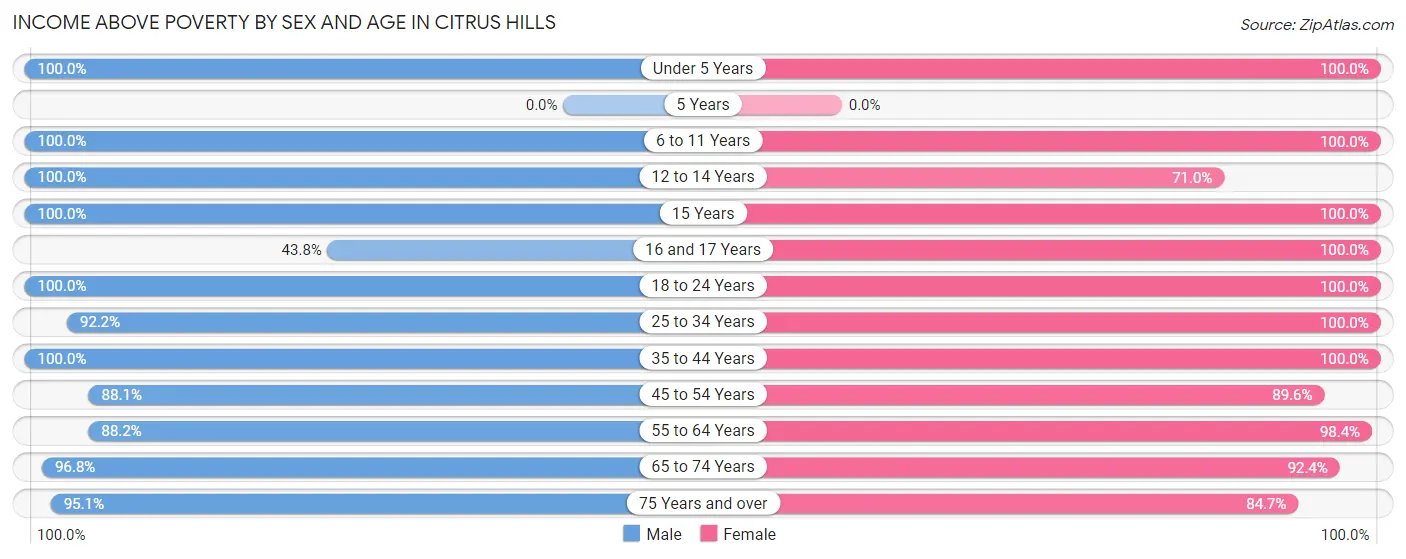
| Age Bracket | Male | Female |
| Under 5 Years | 25 (100.0%) | 49 (100.0%) |
| 5 Years | 0 (0.0%) | 0 (0.0%) |
| 6 to 11 Years | 44 (100.0%) | 138 (100.0%) |
| 12 to 14 Years | 26 (100.0%) | 132 (71.0%) |
| 15 Years | 30 (100.0%) | 10 (100.0%) |
| 16 and 17 Years | 35 (43.8%) | 86 (100.0%) |
| 18 to 24 Years | 96 (100.0%) | 84 (100.0%) |
| 25 to 34 Years | 176 (92.1%) | 97 (100.0%) |
| 35 to 44 Years | 69 (100.0%) | 158 (100.0%) |
| 45 to 54 Years | 185 (88.1%) | 455 (89.6%) |
| 55 to 64 Years | 595 (88.1%) | 797 (98.4%) |
| 65 to 74 Years | 1,287 (96.8%) | 1,340 (92.4%) |
| 75 Years and over | 880 (95.1%) | 994 (84.7%) |
| Total | 3,448 (93.2%) | 4,340 (91.4%) |
Income Below Poverty Among Married-Couple Families in Citrus Hills
The poverty statistics for married-couple families in Citrus Hills show that 3.3% or 92 of the total 2,807 families live below the poverty line. Families with 1 or 2 children have the highest poverty rate of 21.6%, comprising of 45 families. On the other hand, families with 3 or 4 children have the lowest poverty rate of 0.0%, which includes 0 families.
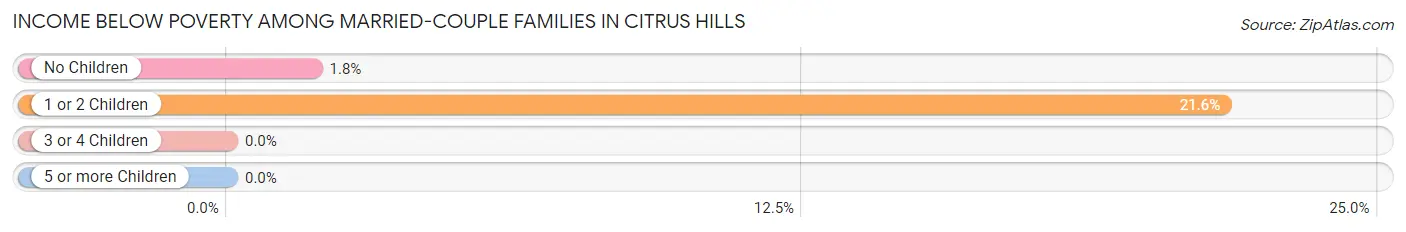
| Children | Above Poverty | Below Poverty |
| No Children | 2,513 (98.2%) | 47 (1.8%) |
| 1 or 2 Children | 163 (78.4%) | 45 (21.6%) |
| 3 or 4 Children | 39 (100.0%) | 0 (0.0%) |
| 5 or more Children | 0 (0.0%) | 0 (0.0%) |
| Total | 2,715 (96.7%) | 92 (3.3%) |
Income Below Poverty Among Single-Parent Households in Citrus Hills
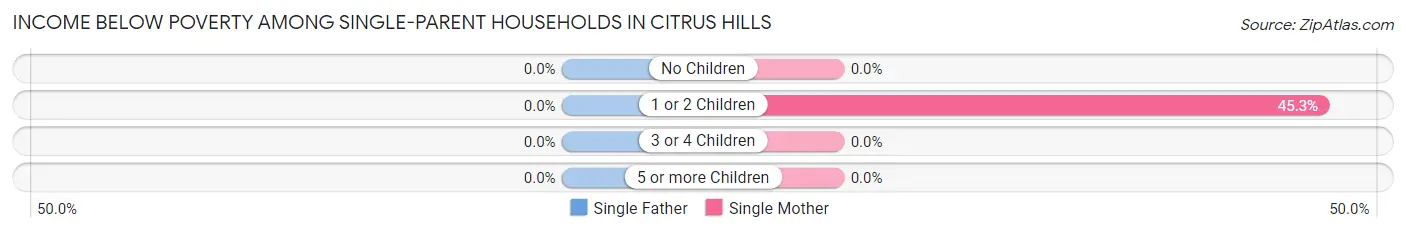
| Children | Single Father | Single Mother |
| No Children | 0 (0.0%) | 0 (0.0%) |
| 1 or 2 Children | 0 (0.0%) | 24 (45.3%) |
| 3 or 4 Children | 0 (0.0%) | 0 (0.0%) |
| 5 or more Children | 0 (0.0%) | 0 (0.0%) |
| Total | 0 (0.0%) | 24 (21.6%) |
Income Below Poverty Among Married-Couple vs Single-Parent Households in Citrus Hills
The poverty data for Citrus Hills shows that 92 of the married-couple family households (3.3%) and 24 of the single-parent households (17.6%) are living below the poverty level. Within the married-couple family households, those with 1 or 2 children have the highest poverty rate, with 45 households (21.6%) falling below the poverty line. Among the single-parent households, those with 1 or 2 children have the highest poverty rate, with 24 household (45.3%) living below poverty.
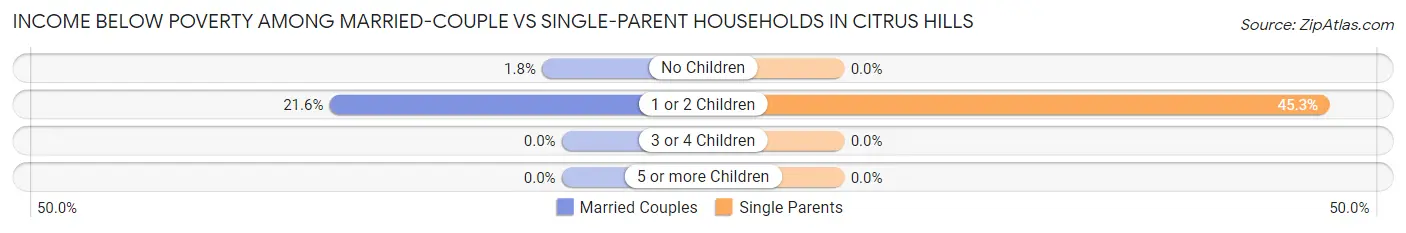
| Children | Married-Couple Families | Single-Parent Households |
| No Children | 47 (1.8%) | 0 (0.0%) |
| 1 or 2 Children | 45 (21.6%) | 24 (45.3%) |
| 3 or 4 Children | 0 (0.0%) | 0 (0.0%) |
| 5 or more Children | 0 (0.0%) | 0 (0.0%) |
| Total | 92 (3.3%) | 24 (17.6%) |
Employment Characteristics in Citrus Hills
Employment by Class of Employer in Citrus Hills
Among the 1,738 employed individuals in Citrus Hills, private company employees (1,139 | 65.5%), self-employed (incorporated) (227 | 13.1%), and not-for-profit organizations (148 | 8.5%) make up the most common classes of employment.
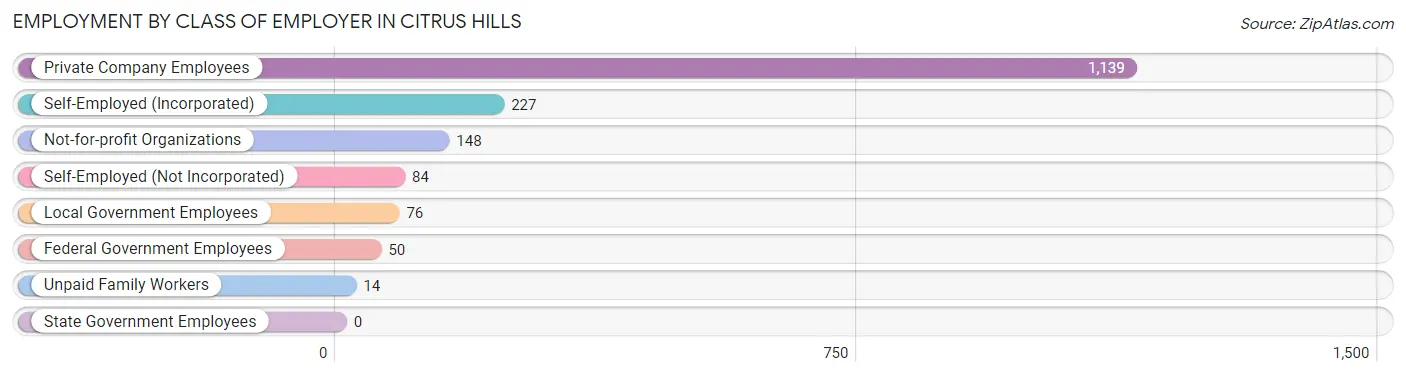
| Employer Class | # Employees | % Employees |
| Private Company Employees | 1,139 | 65.5% |
| Self-Employed (Incorporated) | 227 | 13.1% |
| Self-Employed (Not Incorporated) | 84 | 4.8% |
| Not-for-profit Organizations | 148 | 8.5% |
| Local Government Employees | 76 | 4.4% |
| State Government Employees | 0 | 0.0% |
| Federal Government Employees | 50 | 2.9% |
| Unpaid Family Workers | 14 | 0.8% |
| Total | 1,738 | 100.0% |
Employment Status by Age in Citrus Hills
According to the labor force statistics for Citrus Hills, out of the total population over 16 years of age (8,091), 25.7% or 2,079 individuals are in the labor force, with 14.3% or 297 of them unemployed. The age group with the highest labor force participation rate is 20 to 24 years, with 100.0% or 101 individuals in the labor force. Within the labor force, the 20 to 24 years age range has the highest percentage of unemployed individuals, with 51.5% or 52 of them being unemployed.
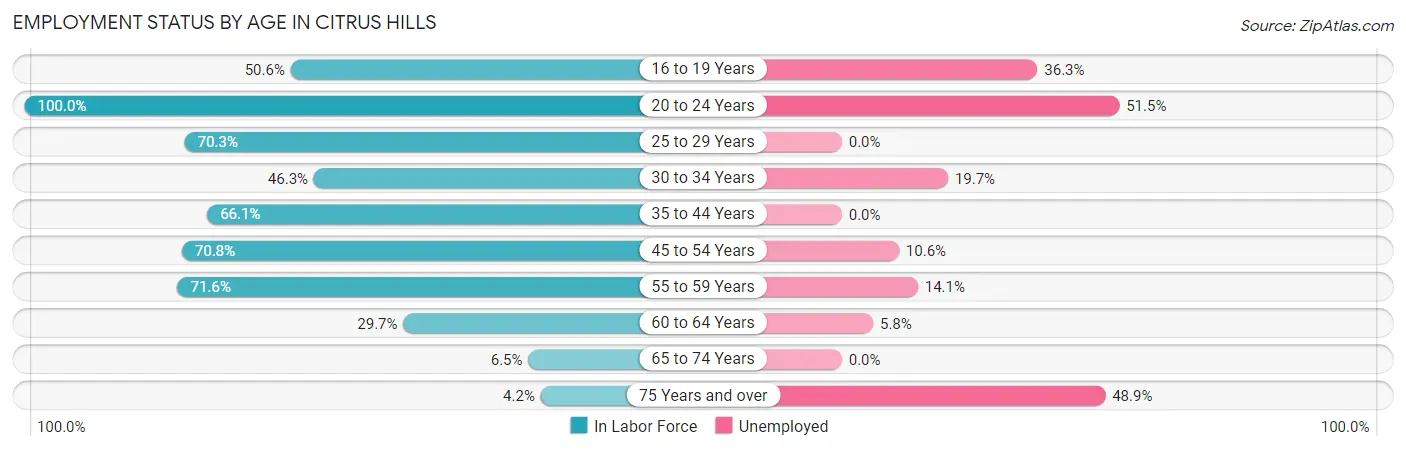
| Age Bracket | In Labor Force | Unemployed |
| 16 to 19 Years | 124 (50.6%) | 45 (36.3%) |
| 20 to 24 Years | 101 (100.0%) | 52 (51.5%) |
| 25 to 29 Years | 97 (70.3%) | 0 (0.0%) |
| 30 to 34 Years | 76 (46.3%) | 15 (19.7%) |
| 35 to 44 Years | 150 (66.1%) | 0 (0.0%) |
| 45 to 54 Years | 508 (70.8%) | 54 (10.6%) |
| 55 to 59 Years | 519 (71.6%) | 73 (14.1%) |
| 60 to 64 Years | 226 (29.7%) | 13 (5.8%) |
| 65 to 74 Years | 183 (6.5%) | 0 (0.0%) |
| 75 Years and over | 92 (4.2%) | 45 (48.9%) |
| Total | 2,079 (25.7%) | 297 (14.3%) |
Employment Status by Educational Attainment in Citrus Hills
According to labor force statistics for Citrus Hills, 57.7% of individuals (1,576) out of the total population between 25 and 64 years of age (2,732) are in the labor force, with 9.8% or 154 of them being unemployed. The group with the highest labor force participation rate are those with the educational attainment of bachelor's degree or higher, with 67.9% or 706 individuals in the labor force. Within the labor force, individuals with high school diploma education have the highest percentage of unemployment, with 21.9% or 71 of them being unemployed.
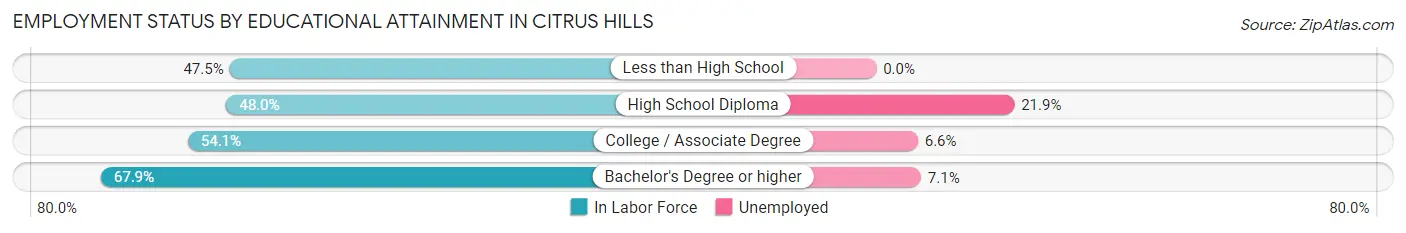
| Educational Attainment | In Labor Force | Unemployed |
| Less than High School | 28 (47.5%) | 0 (0.0%) |
| High School Diploma | 324 (48.0%) | 148 (21.9%) |
| College / Associate Degree | 518 (54.1%) | 63 (6.6%) |
| Bachelor's Degree or higher | 706 (67.9%) | 74 (7.1%) |
| Total | 1,576 (57.7%) | 268 (9.8%) |
Employment Occupations by Sex in Citrus Hills
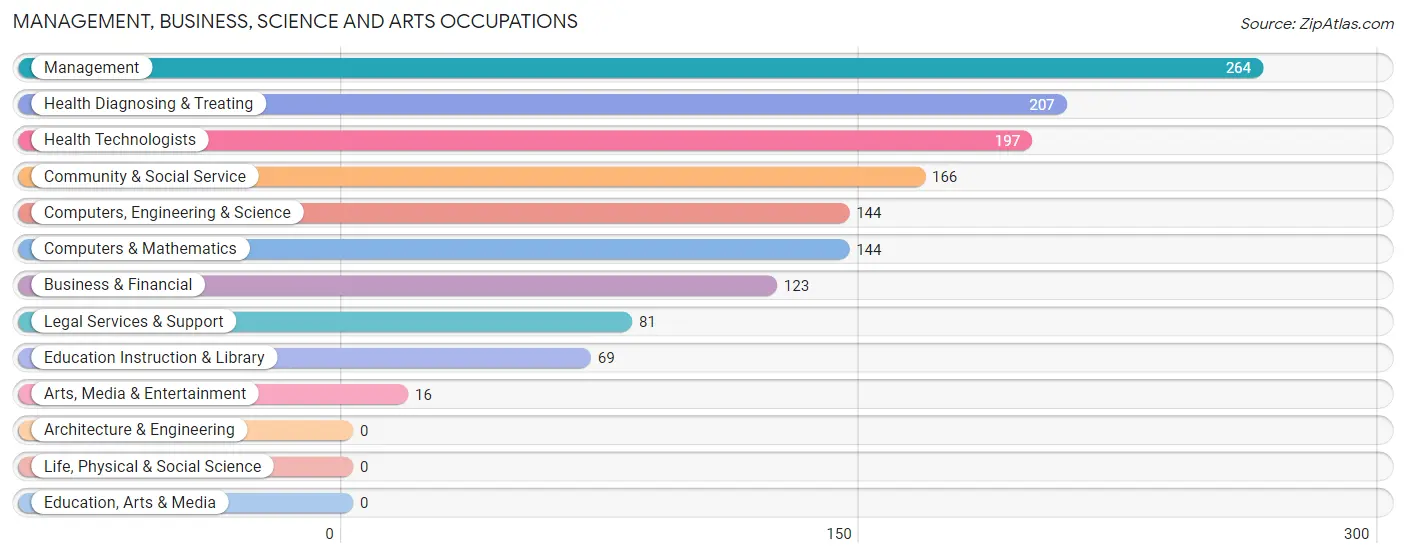
Management, Business, Science and Arts Occupations
The most common Management, Business, Science and Arts occupations in Citrus Hills are Management (264 | 14.8%), Health Diagnosing & Treating (207 | 11.6%), Health Technologists (197 | 11.1%), Community & Social Service (166 | 9.3%), and Computers, Engineering & Science (144 | 8.1%).
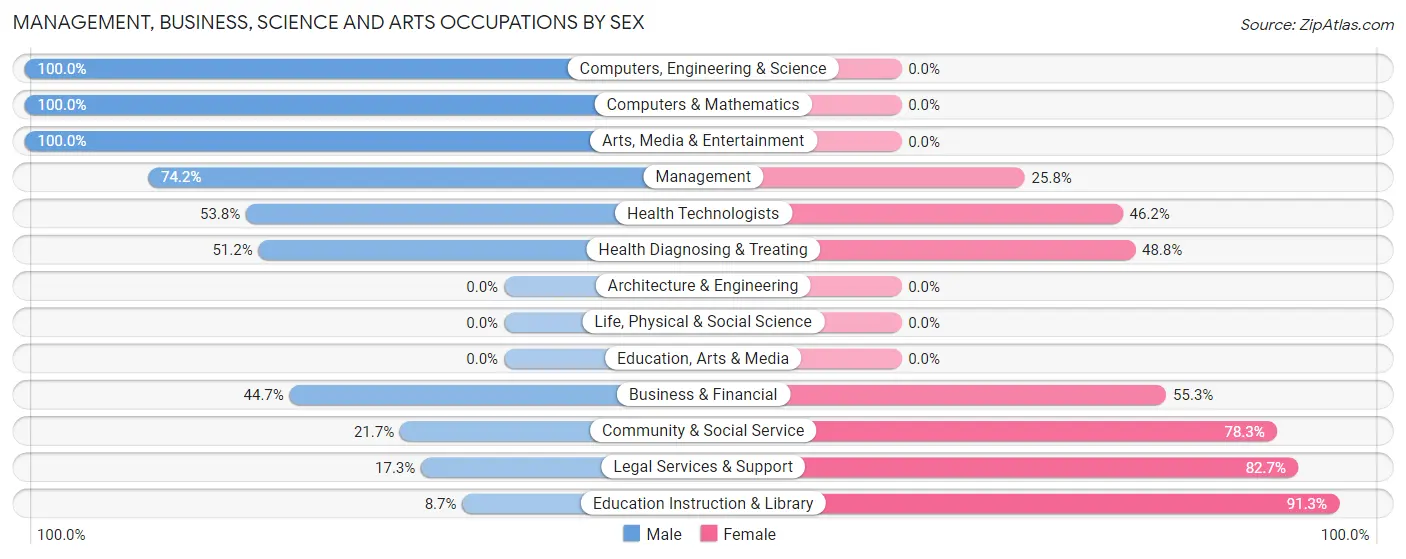
Management, Business, Science and Arts Occupations by Sex
Within the Management, Business, Science and Arts occupations in Citrus Hills, the most male-oriented occupations are Computers, Engineering & Science (100.0%), Computers & Mathematics (100.0%), and Arts, Media & Entertainment (100.0%), while the most female-oriented occupations are Education Instruction & Library (91.3%), Legal Services & Support (82.7%), and Community & Social Service (78.3%).
| Occupation | Male | Female |
| Management | 196 (74.2%) | 68 (25.8%) |
| Business & Financial | 55 (44.7%) | 68 (55.3%) |
| Computers, Engineering & Science | 144 (100.0%) | 0 (0.0%) |
| Computers & Mathematics | 144 (100.0%) | 0 (0.0%) |
| Architecture & Engineering | 0 (0.0%) | 0 (0.0%) |
| Life, Physical & Social Science | 0 (0.0%) | 0 (0.0%) |
| Community & Social Service | 36 (21.7%) | 130 (78.3%) |
| Education, Arts & Media | 0 (0.0%) | 0 (0.0%) |
| Legal Services & Support | 14 (17.3%) | 67 (82.7%) |
| Education Instruction & Library | 6 (8.7%) | 63 (91.3%) |
| Arts, Media & Entertainment | 16 (100.0%) | 0 (0.0%) |
| Health Diagnosing & Treating | 106 (51.2%) | 101 (48.8%) |
| Health Technologists | 106 (53.8%) | 91 (46.2%) |
| Total (Category) | 537 (59.4%) | 367 (40.6%) |
| Total (Overall) | 925 (52.0%) | 855 (48.0%) |
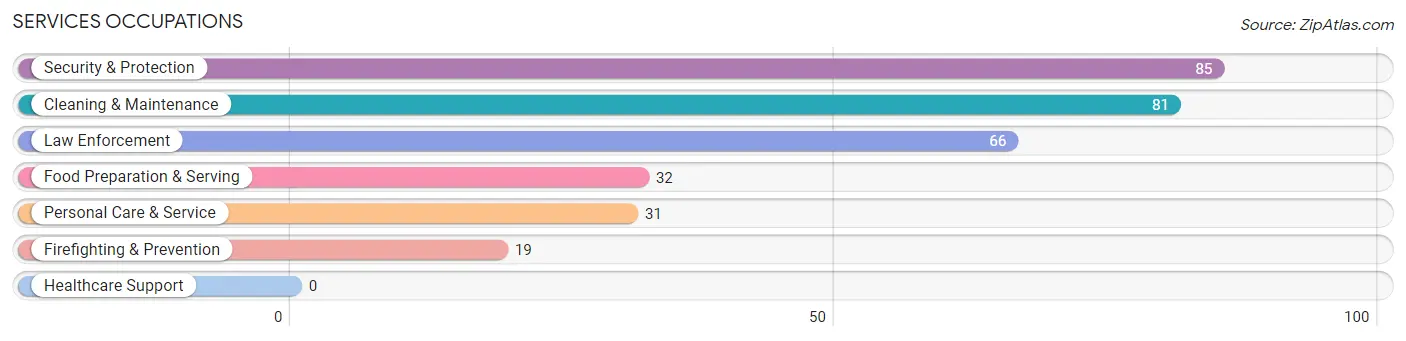
Services Occupations
The most common Services occupations in Citrus Hills are Security & Protection (85 | 4.8%), Cleaning & Maintenance (81 | 4.5%), Law Enforcement (66 | 3.7%), Food Preparation & Serving (32 | 1.8%), and Personal Care & Service (31 | 1.7%).
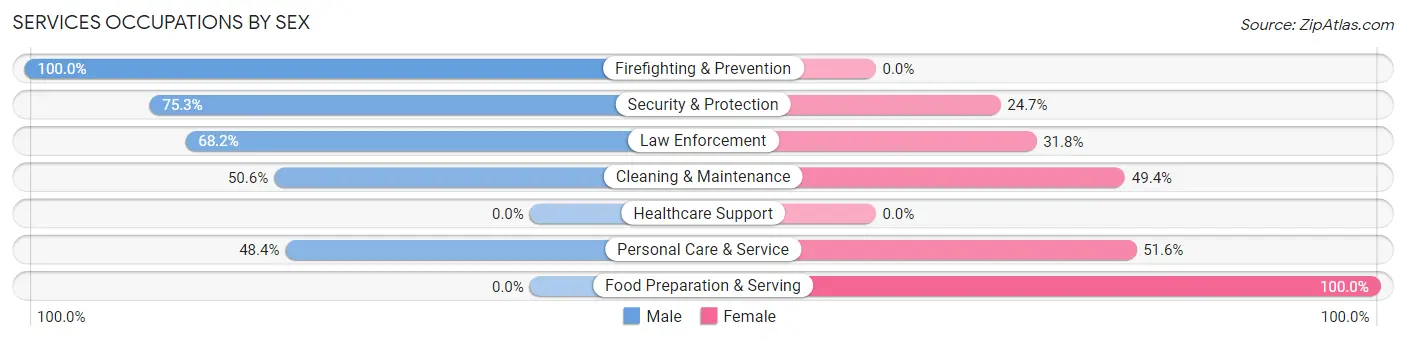
Services Occupations by Sex
Within the Services occupations in Citrus Hills, the most male-oriented occupations are Firefighting & Prevention (100.0%), Security & Protection (75.3%), and Law Enforcement (68.2%), while the most female-oriented occupations are Food Preparation & Serving (100.0%), Personal Care & Service (51.6%), and Cleaning & Maintenance (49.4%).
| Occupation | Male | Female |
| Healthcare Support | 0 (0.0%) | 0 (0.0%) |
| Security & Protection | 64 (75.3%) | 21 (24.7%) |
| Firefighting & Prevention | 19 (100.0%) | 0 (0.0%) |
| Law Enforcement | 45 (68.2%) | 21 (31.8%) |
| Food Preparation & Serving | 0 (0.0%) | 32 (100.0%) |
| Cleaning & Maintenance | 41 (50.6%) | 40 (49.4%) |
| Personal Care & Service | 15 (48.4%) | 16 (51.6%) |
| Total (Category) | 120 (52.4%) | 109 (47.6%) |
| Total (Overall) | 925 (52.0%) | 855 (48.0%) |
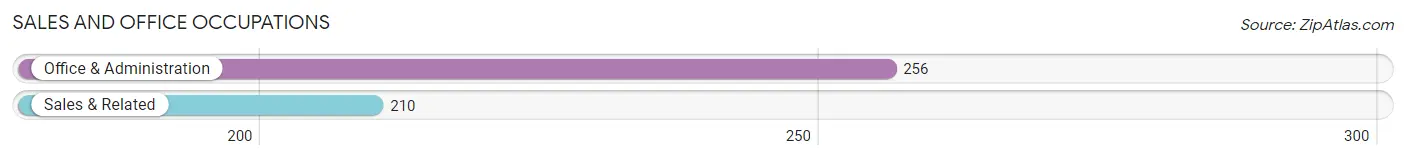
Sales and Office Occupations
The most common Sales and Office occupations in Citrus Hills are Office & Administration (256 | 14.4%), and Sales & Related (210 | 11.8%).
Sales and Office Occupations by Sex
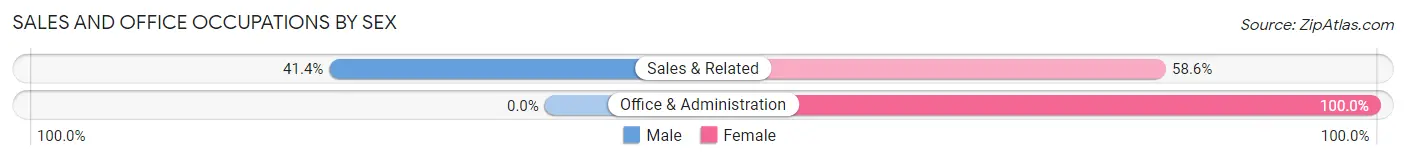
| Occupation | Male | Female |
| Sales & Related | 87 (41.4%) | 123 (58.6%) |
| Office & Administration | 0 (0.0%) | 256 (100.0%) |
| Total (Category) | 87 (18.7%) | 379 (81.3%) |
| Total (Overall) | 925 (52.0%) | 855 (48.0%) |
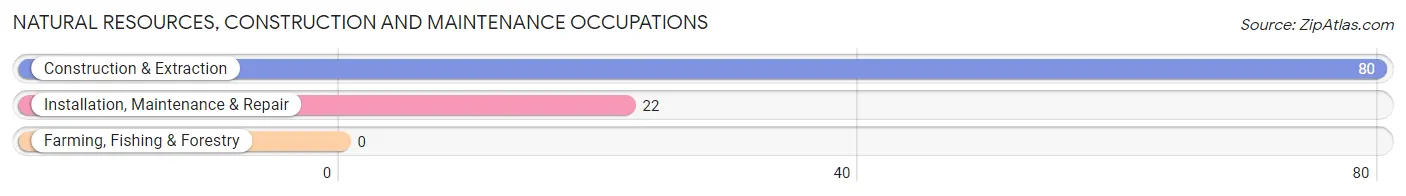
Natural Resources, Construction and Maintenance Occupations
The most common Natural Resources, Construction and Maintenance occupations in Citrus Hills are Construction & Extraction (80 | 4.5%), and Installation, Maintenance & Repair (22 | 1.2%).
Natural Resources, Construction and Maintenance Occupations by Sex
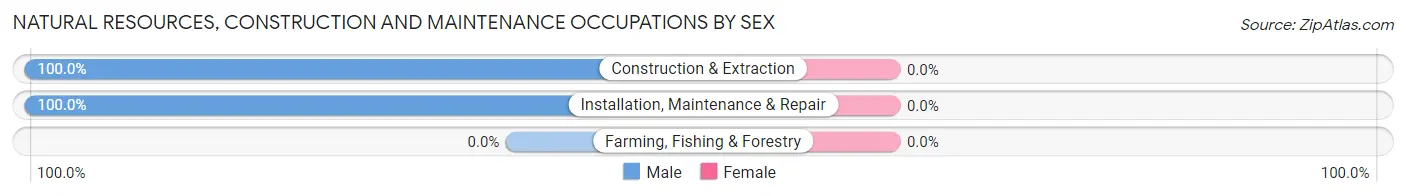
| Occupation | Male | Female |
| Farming, Fishing & Forestry | 0 (0.0%) | 0 (0.0%) |
| Construction & Extraction | 80 (100.0%) | 0 (0.0%) |
| Installation, Maintenance & Repair | 22 (100.0%) | 0 (0.0%) |
| Total (Category) | 102 (100.0%) | 0 (0.0%) |
| Total (Overall) | 925 (52.0%) | 855 (48.0%) |
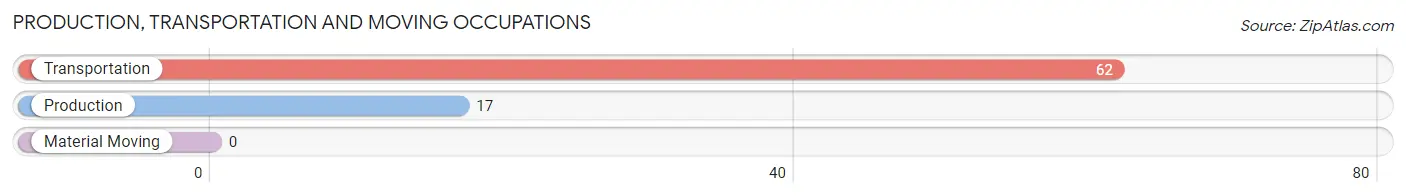
Production, Transportation and Moving Occupations
The most common Production, Transportation and Moving occupations in Citrus Hills are Transportation (62 | 3.5%), and Production (17 | 1.0%).
Production, Transportation and Moving Occupations by Sex
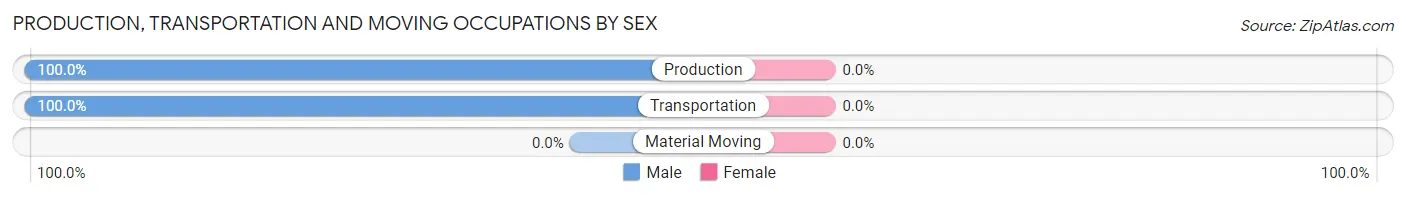
| Occupation | Male | Female |
| Production | 17 (100.0%) | 0 (0.0%) |
| Transportation | 62 (100.0%) | 0 (0.0%) |
| Material Moving | 0 (0.0%) | 0 (0.0%) |
| Total (Category) | 79 (100.0%) | 0 (0.0%) |
| Total (Overall) | 925 (52.0%) | 855 (48.0%) |
Employment Industries by Sex in Citrus Hills
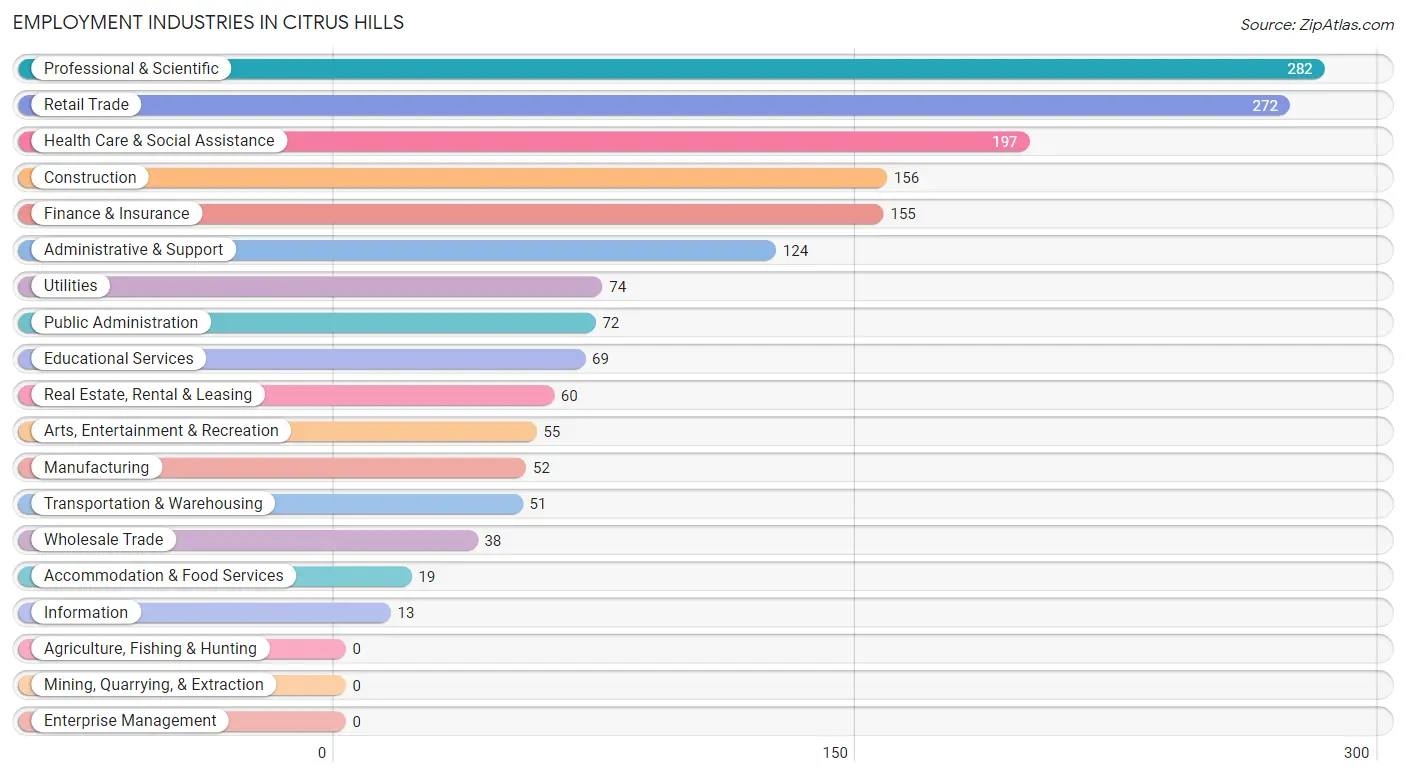
Employment Industries in Citrus Hills
The major employment industries in Citrus Hills include Professional & Scientific (282 | 15.8%), Retail Trade (272 | 15.3%), Health Care & Social Assistance (197 | 11.1%), Construction (156 | 8.8%), and Finance & Insurance (155 | 8.7%).
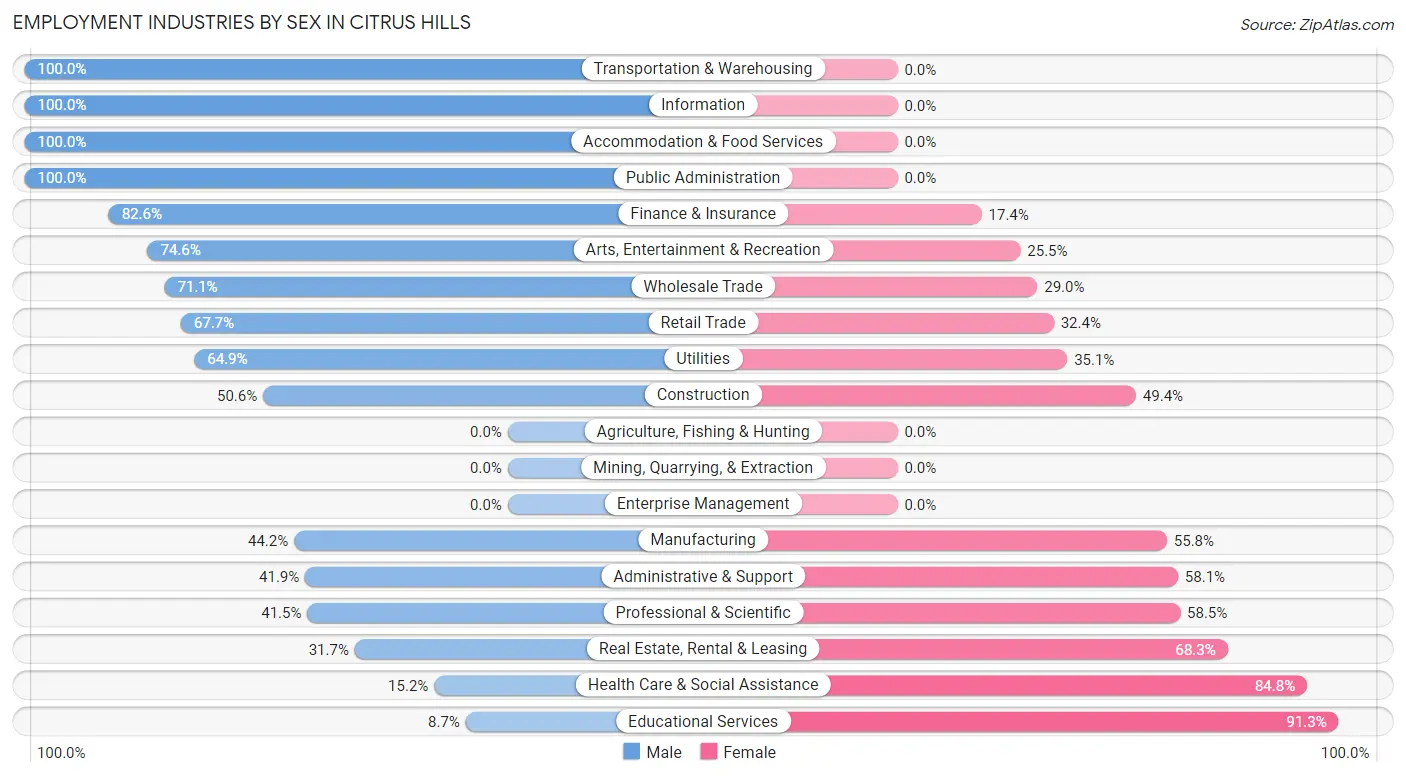
Employment Industries by Sex in Citrus Hills
The Citrus Hills industries that see more men than women are Transportation & Warehousing (100.0%), Information (100.0%), and Accommodation & Food Services (100.0%), whereas the industries that tend to have a higher number of women are Educational Services (91.3%), Health Care & Social Assistance (84.8%), and Real Estate, Rental & Leasing (68.3%).
| Industry | Male | Female |
| Agriculture, Fishing & Hunting | 0 (0.0%) | 0 (0.0%) |
| Mining, Quarrying, & Extraction | 0 (0.0%) | 0 (0.0%) |
| Construction | 79 (50.6%) | 77 (49.4%) |
| Manufacturing | 23 (44.2%) | 29 (55.8%) |
| Wholesale Trade | 27 (71.1%) | 11 (28.9%) |
| Retail Trade | 184 (67.6%) | 88 (32.4%) |
| Transportation & Warehousing | 51 (100.0%) | 0 (0.0%) |
| Utilities | 48 (64.9%) | 26 (35.1%) |
| Information | 13 (100.0%) | 0 (0.0%) |
| Finance & Insurance | 128 (82.6%) | 27 (17.4%) |
| Real Estate, Rental & Leasing | 19 (31.7%) | 41 (68.3%) |
| Professional & Scientific | 117 (41.5%) | 165 (58.5%) |
| Enterprise Management | 0 (0.0%) | 0 (0.0%) |
| Administrative & Support | 52 (41.9%) | 72 (58.1%) |
| Educational Services | 6 (8.7%) | 63 (91.3%) |
| Health Care & Social Assistance | 30 (15.2%) | 167 (84.8%) |
| Arts, Entertainment & Recreation | 41 (74.6%) | 14 (25.5%) |
| Accommodation & Food Services | 19 (100.0%) | 0 (0.0%) |
| Public Administration | 72 (100.0%) | 0 (0.0%) |
| Total | 925 (52.0%) | 855 (48.0%) |
Education in Citrus Hills
School Enrollment in Citrus Hills
The most common levels of schooling among the 718 students in Citrus Hills are high school (239 | 33.3%), middle school (174 | 24.2%), and college / undergraduate (147 | 20.5%).
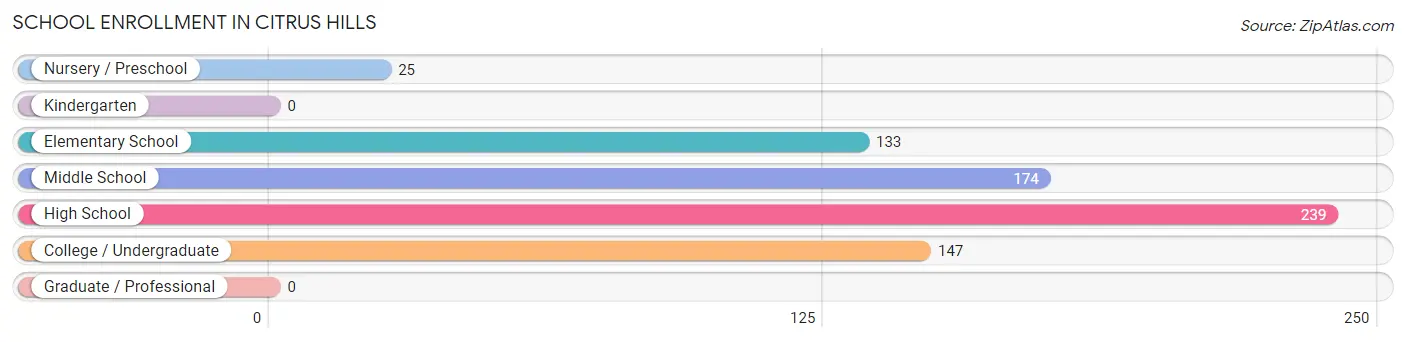
| School Level | # Students | % Students |
| Nursery / Preschool | 25 | 3.5% |
| Kindergarten | 0 | 0.0% |
| Elementary School | 133 | 18.5% |
| Middle School | 174 | 24.2% |
| High School | 239 | 33.3% |
| College / Undergraduate | 147 | 20.5% |
| Graduate / Professional | 0 | 0.0% |
| Total | 718 | 100.0% |
School Enrollment by Age by Funding Source in Citrus Hills
Out of a total of 718 students who are enrolled in schools in Citrus Hills, 127 (17.7%) attend a private institution, while the remaining 591 (82.3%) are enrolled in public schools. The age group of 10 to 14 year olds has the highest likelihood of being enrolled in private schools, with 53 (28.2% in the age bracket) enrolled. Conversely, the age group of 3 to 4 year olds has the lowest likelihood of being enrolled in a private school, with 25 (100.0% in the age bracket) attending a public institution.
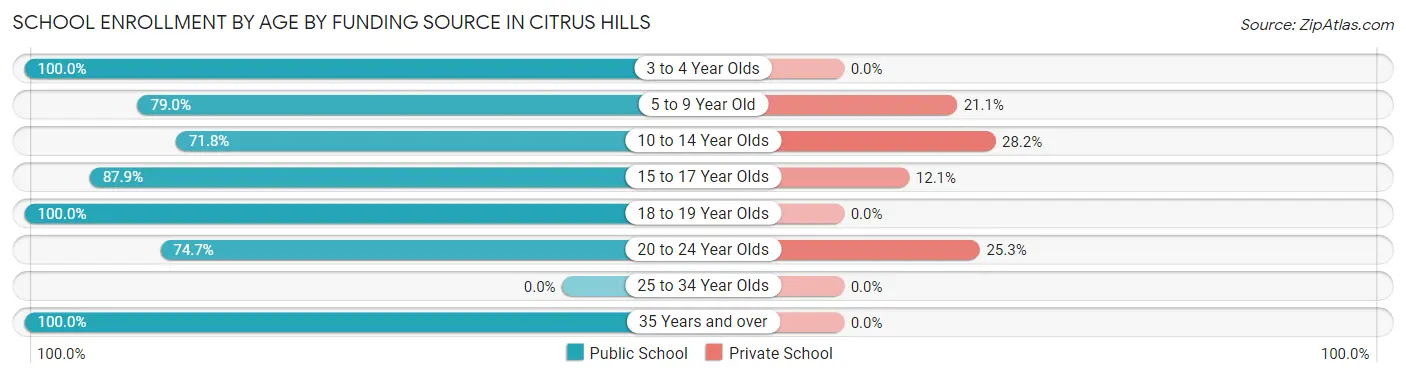
| Age Bracket | Public School | Private School |
| 3 to 4 Year Olds | 25 (100.0%) | 0 (0.0%) |
| 5 to 9 Year Old | 105 (78.9%) | 28 (21.0%) |
| 10 to 14 Year Olds | 135 (71.8%) | 53 (28.2%) |
| 15 to 17 Year Olds | 181 (87.9%) | 25 (12.1%) |
| 18 to 19 Year Olds | 65 (100.0%) | 0 (0.0%) |
| 20 to 24 Year Olds | 62 (74.7%) | 21 (25.3%) |
| 25 to 34 Year Olds | 0 (0.0%) | 0 (0.0%) |
| 35 Years and over | 18 (100.0%) | 0 (0.0%) |
| Total | 591 (82.3%) | 127 (17.7%) |
Educational Attainment by Field of Study in Citrus Hills
Education (578 | 18.4%), business (525 | 16.7%), science & technology (369 | 11.7%), bio, nature & agricultural (240 | 7.6%), and social sciences (229 | 7.3%) are the most common fields of study among 3,140 individuals in Citrus Hills who have obtained a bachelor's degree or higher.
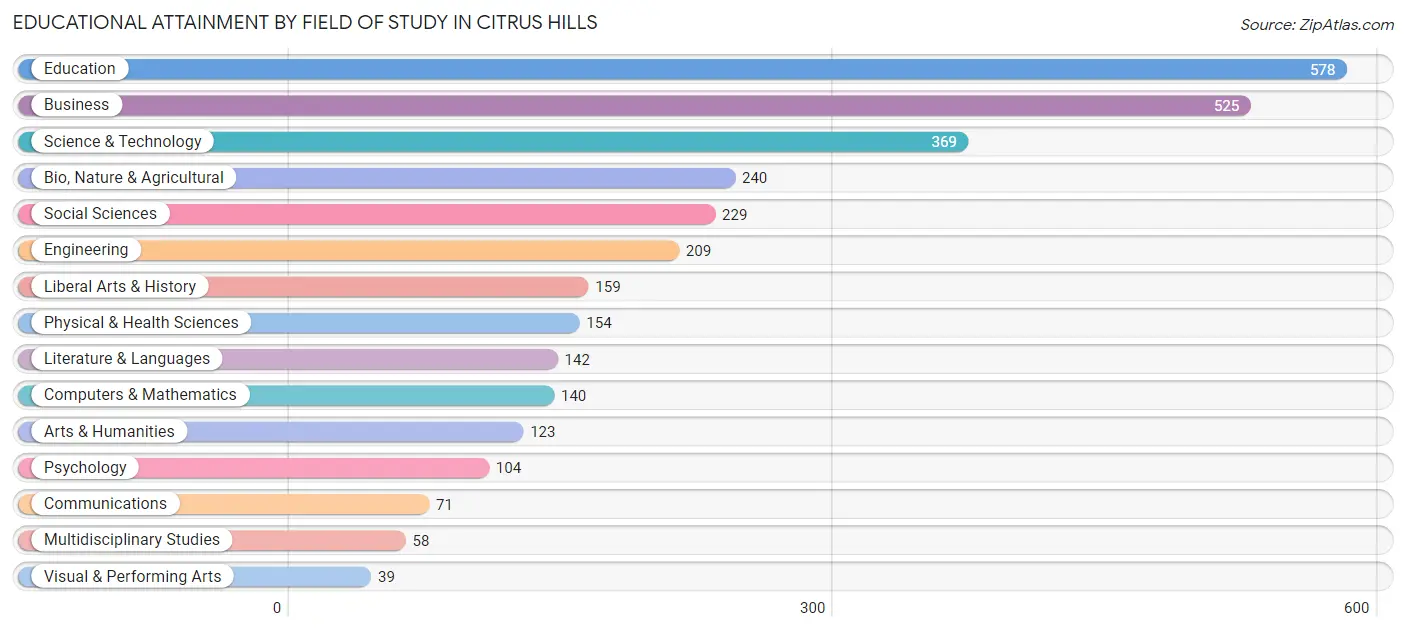
| Field of Study | # Graduates | % Graduates |
| Computers & Mathematics | 140 | 4.5% |
| Bio, Nature & Agricultural | 240 | 7.6% |
| Physical & Health Sciences | 154 | 4.9% |
| Psychology | 104 | 3.3% |
| Social Sciences | 229 | 7.3% |
| Engineering | 209 | 6.7% |
| Multidisciplinary Studies | 58 | 1.8% |
| Science & Technology | 369 | 11.7% |
| Business | 525 | 16.7% |
| Education | 578 | 18.4% |
| Literature & Languages | 142 | 4.5% |
| Liberal Arts & History | 159 | 5.1% |
| Visual & Performing Arts | 39 | 1.2% |
| Communications | 71 | 2.3% |
| Arts & Humanities | 123 | 3.9% |
| Total | 3,140 | 100.0% |
Transportation & Commute in Citrus Hills
Vehicle Availability by Sex in Citrus Hills
The most prevalent vehicle ownership categories in Citrus Hills are males with 2 vehicles (493, accounting for 54.1%) and females with 2 vehicles (388, making up 59.7%).
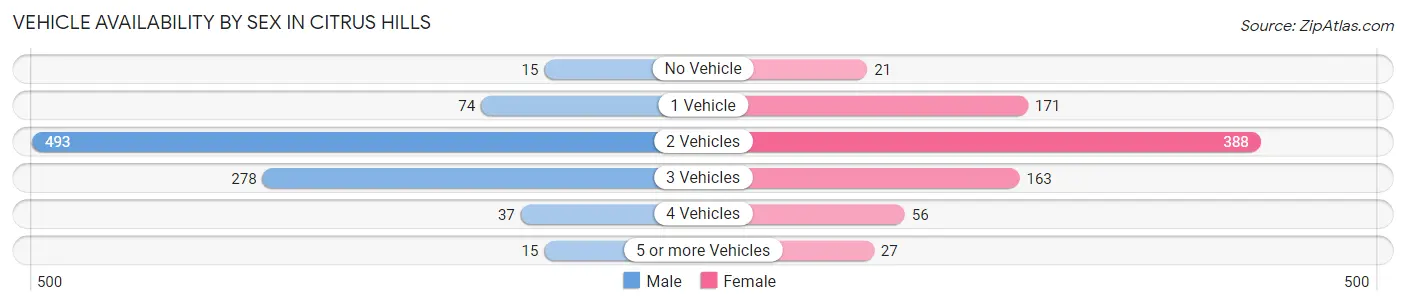
| Vehicles Available | Male | Female |
| No Vehicle | 15 (1.6%) | 21 (2.5%) |
| 1 Vehicle | 74 (8.1%) | 171 (20.7%) |
| 2 Vehicles | 493 (54.1%) | 388 (47.0%) |
| 3 Vehicles | 278 (30.5%) | 163 (19.7%) |
| 4 Vehicles | 37 (4.1%) | 56 (6.8%) |
| 5 or more Vehicles | 15 (1.6%) | 27 (3.3%) |
| Total | 912 (100.0%) | 826 (100.0%) |
Commute Time in Citrus Hills
The most frequently occuring commute durations in Citrus Hills are 15 to 19 minutes (335 commuters, 25.4%), 20 to 24 minutes (226 commuters, 17.1%), and 5 to 9 minutes (132 commuters, 10.0%).
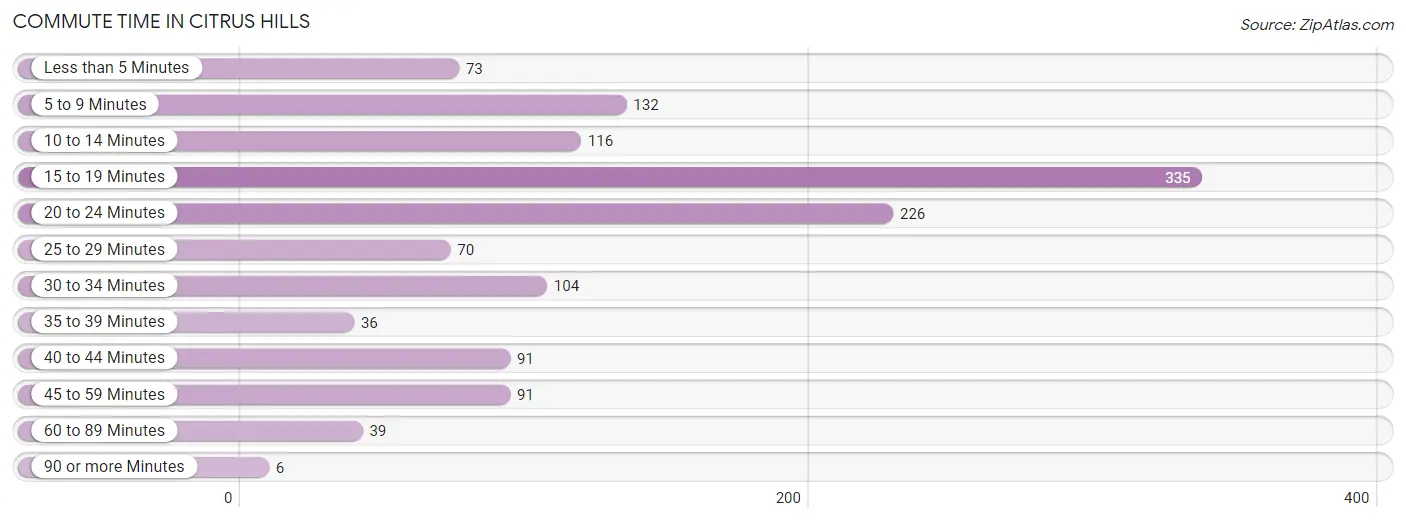
| Commute Time | # Commuters | % Commuters |
| Less than 5 Minutes | 73 | 5.5% |
| 5 to 9 Minutes | 132 | 10.0% |
| 10 to 14 Minutes | 116 | 8.8% |
| 15 to 19 Minutes | 335 | 25.4% |
| 20 to 24 Minutes | 226 | 17.1% |
| 25 to 29 Minutes | 70 | 5.3% |
| 30 to 34 Minutes | 104 | 7.9% |
| 35 to 39 Minutes | 36 | 2.7% |
| 40 to 44 Minutes | 91 | 6.9% |
| 45 to 59 Minutes | 91 | 6.9% |
| 60 to 89 Minutes | 39 | 3.0% |
| 90 or more Minutes | 6 | 0.4% |
Commute Time by Sex in Citrus Hills
The most common commute times in Citrus Hills are 15 to 19 minutes (225 commuters, 30.8%) for males and 20 to 24 minutes (136 commuters, 23.1%) for females.
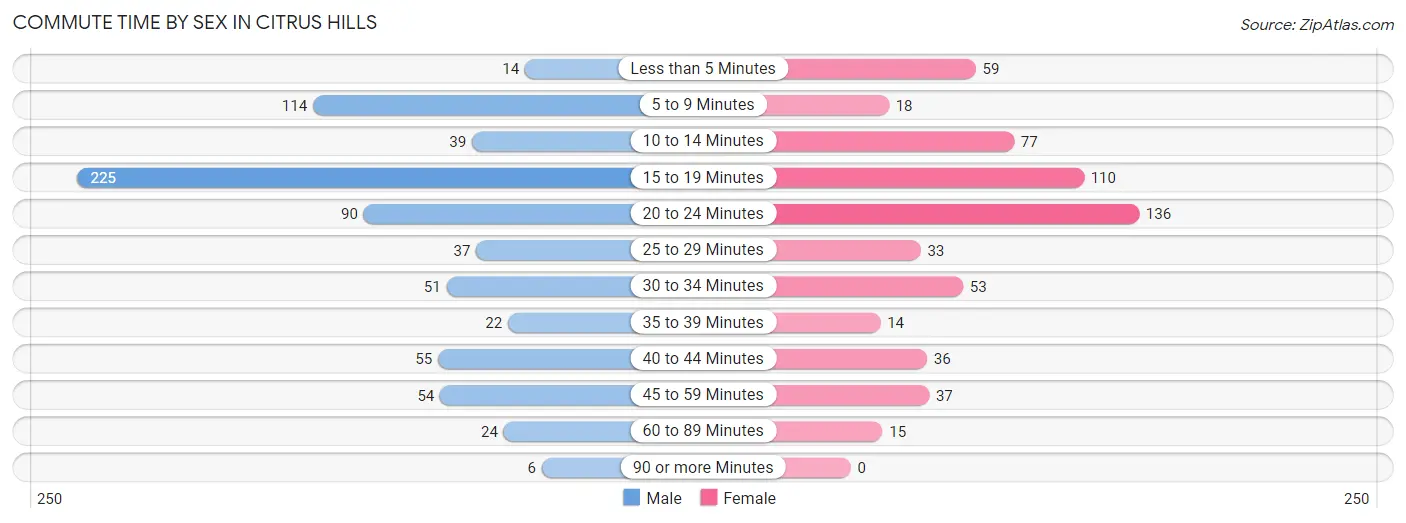
| Commute Time | Male | Female |
| Less than 5 Minutes | 14 (1.9%) | 59 (10.0%) |
| 5 to 9 Minutes | 114 (15.6%) | 18 (3.1%) |
| 10 to 14 Minutes | 39 (5.3%) | 77 (13.1%) |
| 15 to 19 Minutes | 225 (30.8%) | 110 (18.7%) |
| 20 to 24 Minutes | 90 (12.3%) | 136 (23.1%) |
| 25 to 29 Minutes | 37 (5.1%) | 33 (5.6%) |
| 30 to 34 Minutes | 51 (7.0%) | 53 (9.0%) |
| 35 to 39 Minutes | 22 (3.0%) | 14 (2.4%) |
| 40 to 44 Minutes | 55 (7.5%) | 36 (6.1%) |
| 45 to 59 Minutes | 54 (7.4%) | 37 (6.3%) |
| 60 to 89 Minutes | 24 (3.3%) | 15 (2.5%) |
| 90 or more Minutes | 6 (0.8%) | 0 (0.0%) |
Time of Departure to Work by Sex in Citrus Hills
The most frequent times of departure to work in Citrus Hills are 6:00 AM to 6:29 AM (131, 17.9%) for males and 9:00 AM to 9:59 AM (111, 18.9%) for females.
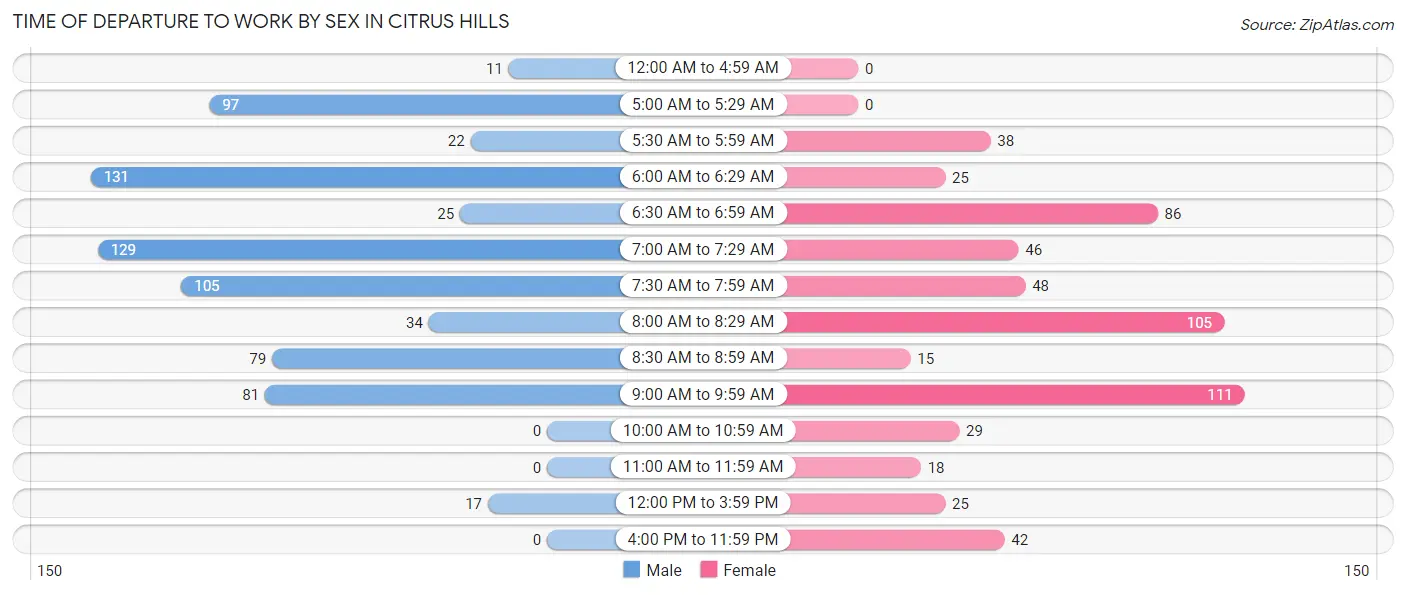
| Time of Departure | Male | Female |
| 12:00 AM to 4:59 AM | 11 (1.5%) | 0 (0.0%) |
| 5:00 AM to 5:29 AM | 97 (13.3%) | 0 (0.0%) |
| 5:30 AM to 5:59 AM | 22 (3.0%) | 38 (6.5%) |
| 6:00 AM to 6:29 AM | 131 (17.9%) | 25 (4.3%) |
| 6:30 AM to 6:59 AM | 25 (3.4%) | 86 (14.6%) |
| 7:00 AM to 7:29 AM | 129 (17.6%) | 46 (7.8%) |
| 7:30 AM to 7:59 AM | 105 (14.4%) | 48 (8.2%) |
| 8:00 AM to 8:29 AM | 34 (4.6%) | 105 (17.9%) |
| 8:30 AM to 8:59 AM | 79 (10.8%) | 15 (2.5%) |
| 9:00 AM to 9:59 AM | 81 (11.1%) | 111 (18.9%) |
| 10:00 AM to 10:59 AM | 0 (0.0%) | 29 (4.9%) |
| 11:00 AM to 11:59 AM | 0 (0.0%) | 18 (3.1%) |
| 12:00 PM to 3:59 PM | 17 (2.3%) | 25 (4.3%) |
| 4:00 PM to 11:59 PM | 0 (0.0%) | 42 (7.1%) |
| Total | 731 (100.0%) | 588 (100.0%) |
Housing Occupancy in Citrus Hills
Occupancy by Ownership in Citrus Hills
Of the total 3,967 dwellings in Citrus Hills, owner-occupied units account for 3,707 (93.4%), while renter-occupied units make up 260 (6.6%).
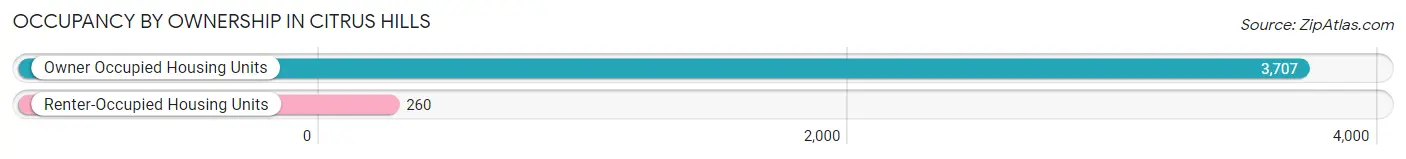
| Occupancy | # Housing Units | % Housing Units |
| Owner Occupied Housing Units | 3,707 | 93.4% |
| Renter-Occupied Housing Units | 260 | 6.6% |
| Total Occupied Housing Units | 3,967 | 100.0% |
Occupancy by Household Size in Citrus Hills
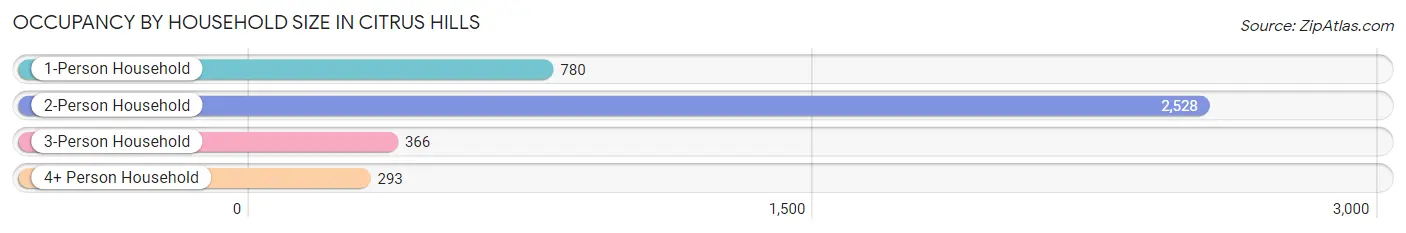
| Household Size | # Housing Units | % Housing Units |
| 1-Person Household | 780 | 19.7% |
| 2-Person Household | 2,528 | 63.7% |
| 3-Person Household | 366 | 9.2% |
| 4+ Person Household | 293 | 7.4% |
| Total Housing Units | 3,967 | 100.0% |
Occupancy by Ownership by Household Size in Citrus Hills
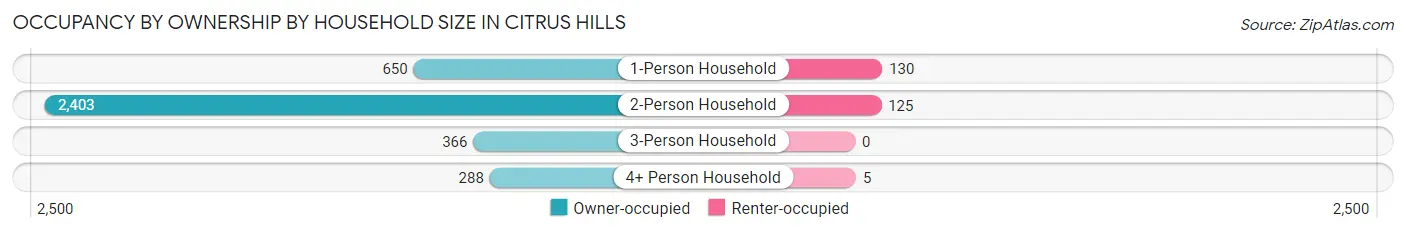
| Household Size | Owner-occupied | Renter-occupied |
| 1-Person Household | 650 (83.3%) | 130 (16.7%) |
| 2-Person Household | 2,403 (95.1%) | 125 (4.9%) |
| 3-Person Household | 366 (100.0%) | 0 (0.0%) |
| 4+ Person Household | 288 (98.3%) | 5 (1.7%) |
| Total Housing Units | 3,707 (93.4%) | 260 (6.6%) |
Occupancy by Educational Attainment in Citrus Hills
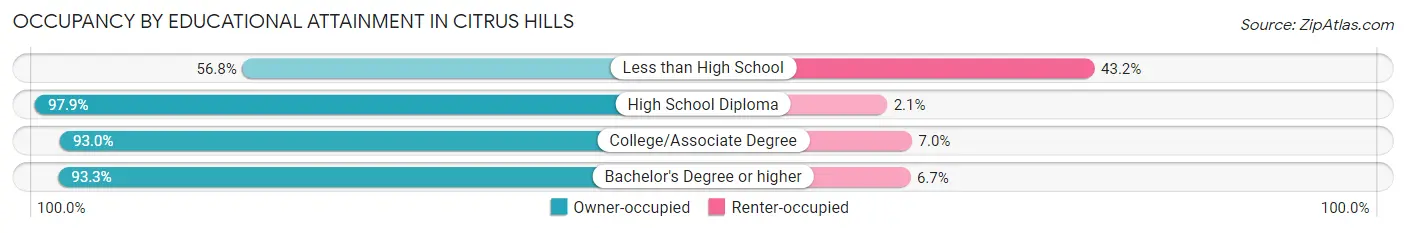
| Household Size | Owner-occupied | Renter-occupied |
| Less than High School | 46 (56.8%) | 35 (43.2%) |
| High School Diploma | 845 (97.9%) | 18 (2.1%) |
| College/Associate Degree | 1,257 (93.0%) | 95 (7.0%) |
| Bachelor's Degree or higher | 1,559 (93.3%) | 112 (6.7%) |
Occupancy by Age of Householder in Citrus Hills
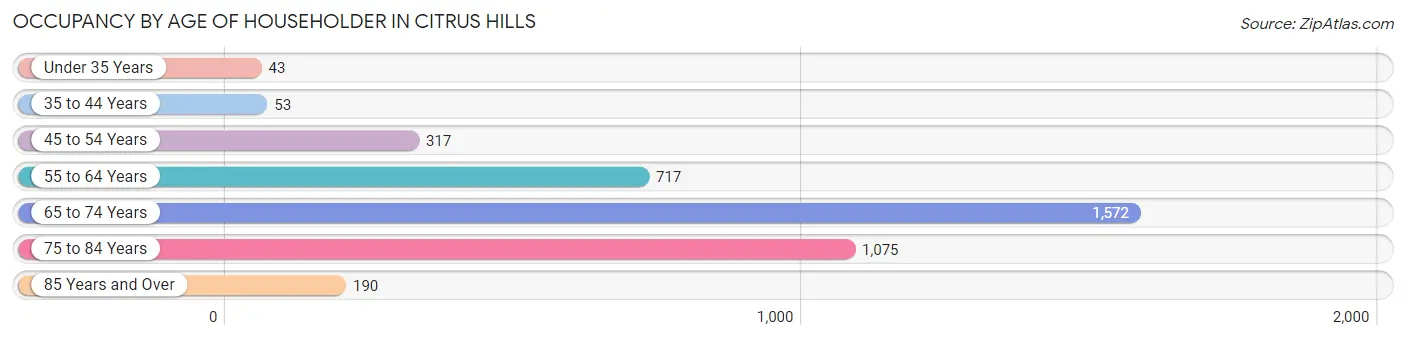
| Age Bracket | # Households | % Households |
| Under 35 Years | 43 | 1.1% |
| 35 to 44 Years | 53 | 1.3% |
| 45 to 54 Years | 317 | 8.0% |
| 55 to 64 Years | 717 | 18.1% |
| 65 to 74 Years | 1,572 | 39.6% |
| 75 to 84 Years | 1,075 | 27.1% |
| 85 Years and Over | 190 | 4.8% |
| Total | 3,967 | 100.0% |
Housing Finances in Citrus Hills
Median Income by Occupancy in Citrus Hills
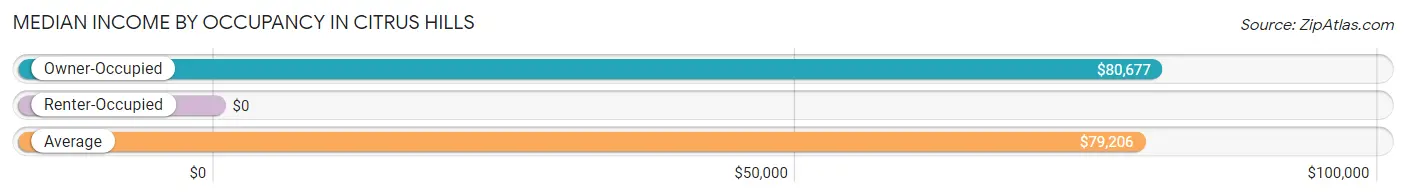
| Occupancy Type | # Households | Median Income |
| Owner-Occupied | 3,707 (93.4%) | $80,677 |
| Renter-Occupied | 260 (6.6%) | $0 |
| Average | 3,967 (100.0%) | $79,206 |
Occupancy by Householder Income Bracket in Citrus Hills
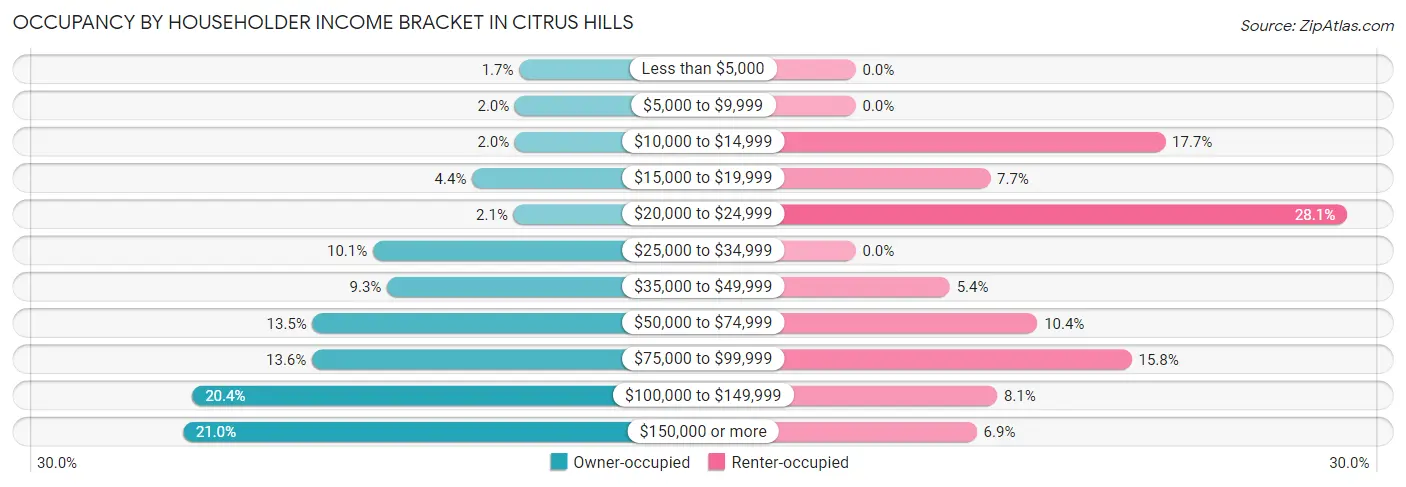
| Income Bracket | Owner-occupied | Renter-occupied |
| Less than $5,000 | 64 (1.7%) | 0 (0.0%) |
| $5,000 to $9,999 | 73 (2.0%) | 0 (0.0%) |
| $10,000 to $14,999 | 73 (2.0%) | 46 (17.7%) |
| $15,000 to $19,999 | 164 (4.4%) | 20 (7.7%) |
| $20,000 to $24,999 | 76 (2.1%) | 73 (28.1%) |
| $25,000 to $34,999 | 374 (10.1%) | 0 (0.0%) |
| $35,000 to $49,999 | 344 (9.3%) | 14 (5.4%) |
| $50,000 to $74,999 | 502 (13.5%) | 27 (10.4%) |
| $75,000 to $99,999 | 503 (13.6%) | 41 (15.8%) |
| $100,000 to $149,999 | 757 (20.4%) | 21 (8.1%) |
| $150,000 or more | 777 (21.0%) | 18 (6.9%) |
| Total | 3,707 (100.0%) | 260 (100.0%) |
Monthly Housing Cost Tiers in Citrus Hills
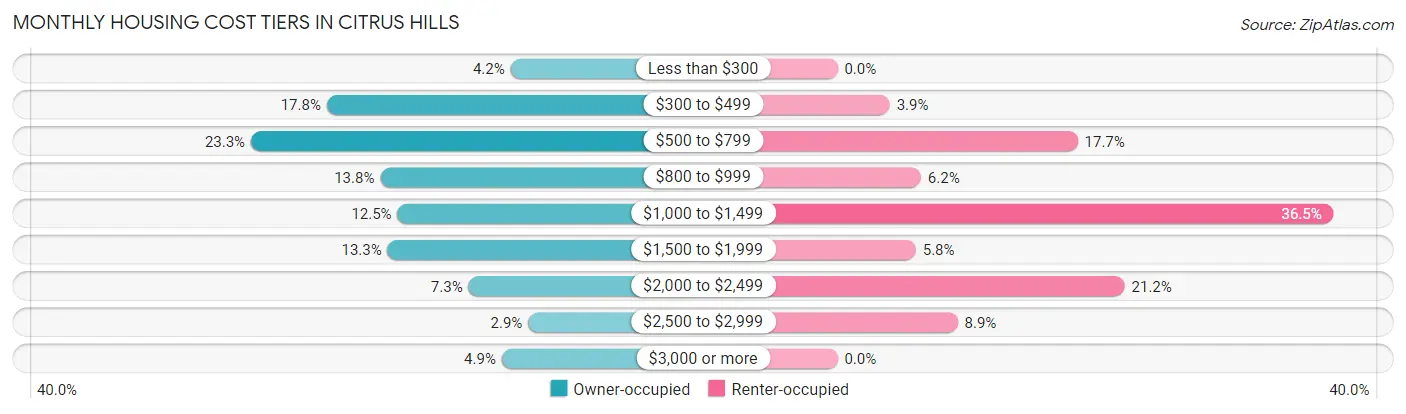
| Monthly Cost | Owner-occupied | Renter-occupied |
| Less than $300 | 156 (4.2%) | 0 (0.0%) |
| $300 to $499 | 658 (17.7%) | 10 (3.8%) |
| $500 to $799 | 865 (23.3%) | 46 (17.7%) |
| $800 to $999 | 512 (13.8%) | 16 (6.1%) |
| $1,000 to $1,499 | 465 (12.5%) | 95 (36.5%) |
| $1,500 to $1,999 | 492 (13.3%) | 15 (5.8%) |
| $2,000 to $2,499 | 271 (7.3%) | 55 (21.1%) |
| $2,500 to $2,999 | 108 (2.9%) | 23 (8.8%) |
| $3,000 or more | 180 (4.9%) | 0 (0.0%) |
| Total | 3,707 (100.0%) | 260 (100.0%) |
Physical Housing Characteristics in Citrus Hills
Housing Structures in Citrus Hills
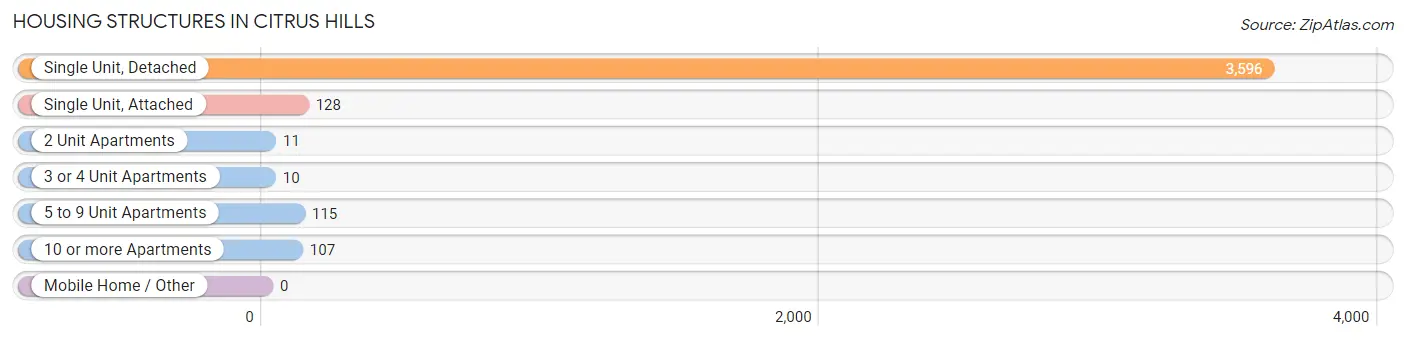
| Structure Type | # Housing Units | % Housing Units |
| Single Unit, Detached | 3,596 | 90.6% |
| Single Unit, Attached | 128 | 3.2% |
| 2 Unit Apartments | 11 | 0.3% |
| 3 or 4 Unit Apartments | 10 | 0.3% |
| 5 to 9 Unit Apartments | 115 | 2.9% |
| 10 or more Apartments | 107 | 2.7% |
| Mobile Home / Other | 0 | 0.0% |
| Total | 3,967 | 100.0% |
Housing Structures by Occupancy in Citrus Hills
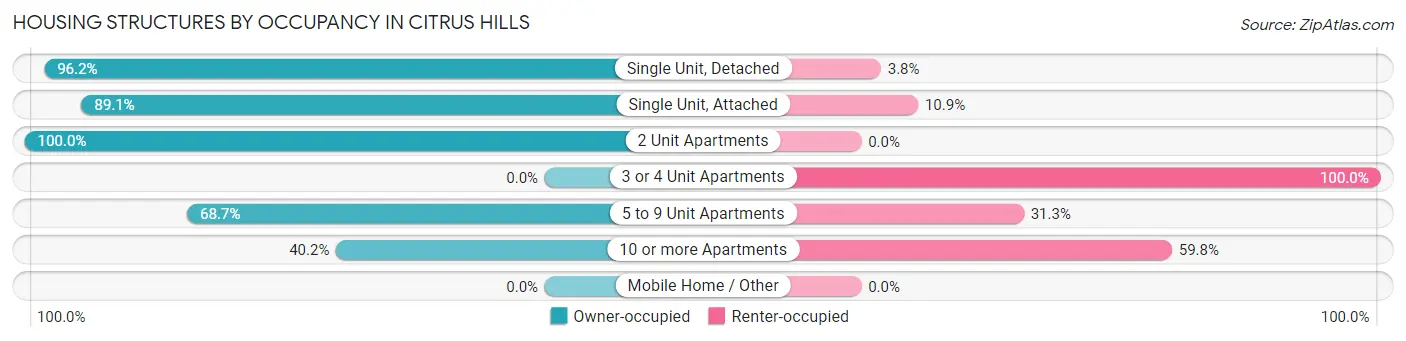
| Structure Type | Owner-occupied | Renter-occupied |
| Single Unit, Detached | 3,460 (96.2%) | 136 (3.8%) |
| Single Unit, Attached | 114 (89.1%) | 14 (10.9%) |
| 2 Unit Apartments | 11 (100.0%) | 0 (0.0%) |
| 3 or 4 Unit Apartments | 0 (0.0%) | 10 (100.0%) |
| 5 to 9 Unit Apartments | 79 (68.7%) | 36 (31.3%) |
| 10 or more Apartments | 43 (40.2%) | 64 (59.8%) |
| Mobile Home / Other | 0 (0.0%) | 0 (0.0%) |
| Total | 3,707 (93.4%) | 260 (6.6%) |
Housing Structures by Number of Rooms in Citrus Hills
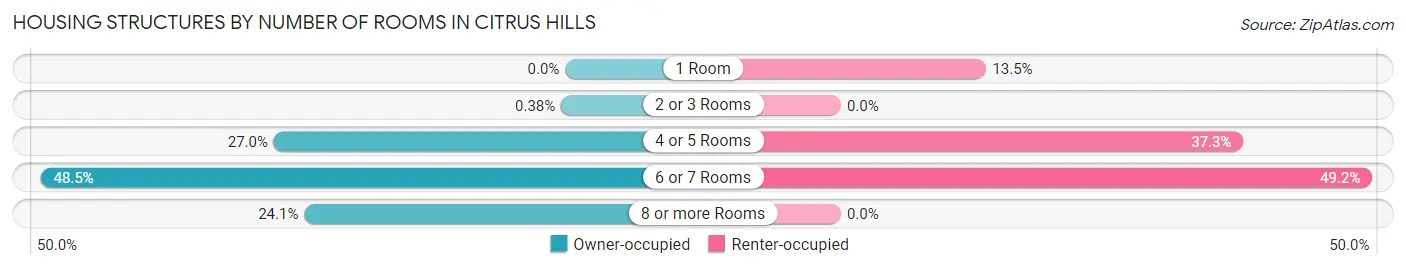
| Number of Rooms | Owner-occupied | Renter-occupied |
| 1 Room | 0 (0.0%) | 35 (13.5%) |
| 2 or 3 Rooms | 14 (0.4%) | 0 (0.0%) |
| 4 or 5 Rooms | 999 (27.0%) | 97 (37.3%) |
| 6 or 7 Rooms | 1,799 (48.5%) | 128 (49.2%) |
| 8 or more Rooms | 895 (24.1%) | 0 (0.0%) |
| Total | 3,707 (100.0%) | 260 (100.0%) |
Housing Structure by Heating Type in Citrus Hills
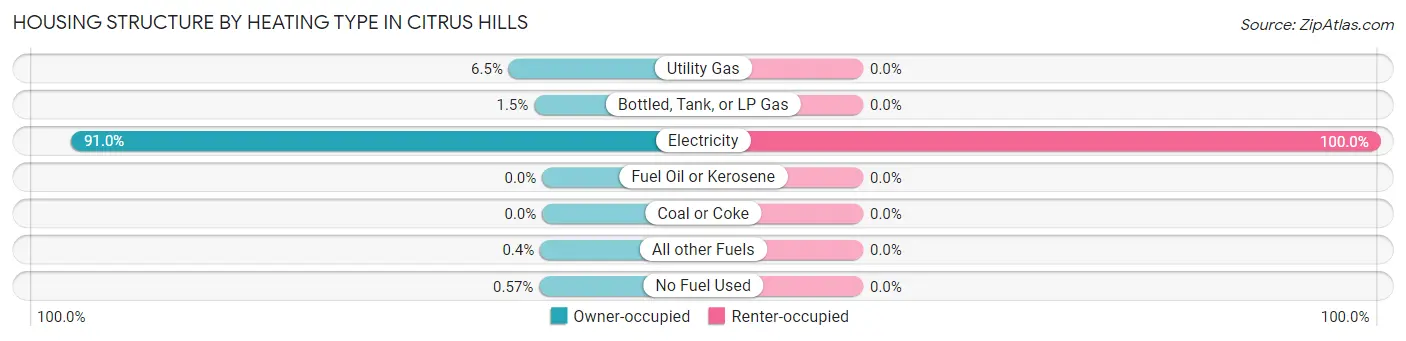
| Heating Type | Owner-occupied | Renter-occupied |
| Utility Gas | 239 (6.5%) | 0 (0.0%) |
| Bottled, Tank, or LP Gas | 57 (1.5%) | 0 (0.0%) |
| Electricity | 3,375 (91.0%) | 260 (100.0%) |
| Fuel Oil or Kerosene | 0 (0.0%) | 0 (0.0%) |
| Coal or Coke | 0 (0.0%) | 0 (0.0%) |
| All other Fuels | 15 (0.4%) | 0 (0.0%) |
| No Fuel Used | 21 (0.6%) | 0 (0.0%) |
| Total | 3,707 (100.0%) | 260 (100.0%) |
Household Vehicle Usage in Citrus Hills
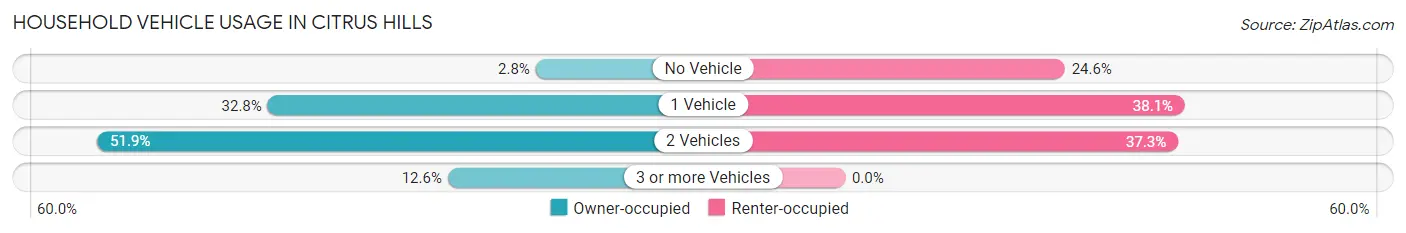
| Vehicles per Household | Owner-occupied | Renter-occupied |
| No Vehicle | 102 (2.8%) | 64 (24.6%) |
| 1 Vehicle | 1,215 (32.8%) | 99 (38.1%) |
| 2 Vehicles | 1,923 (51.9%) | 97 (37.3%) |
| 3 or more Vehicles | 467 (12.6%) | 0 (0.0%) |
| Total | 3,707 (100.0%) | 260 (100.0%) |
Real Estate & Mortgages in Citrus Hills
Real Estate and Mortgage Overview in Citrus Hills
| Characteristic | Without Mortgage | With Mortgage |
| Housing Units | 2,057 | 1,650 |
| Median Property Value | $336,000 | $353,600 |
| Median Household Income | $66,595 | $436 |
| Monthly Housing Costs | $568 | $180 |
| Real Estate Taxes | $2,495 | $14 |
Property Value by Mortgage Status in Citrus Hills
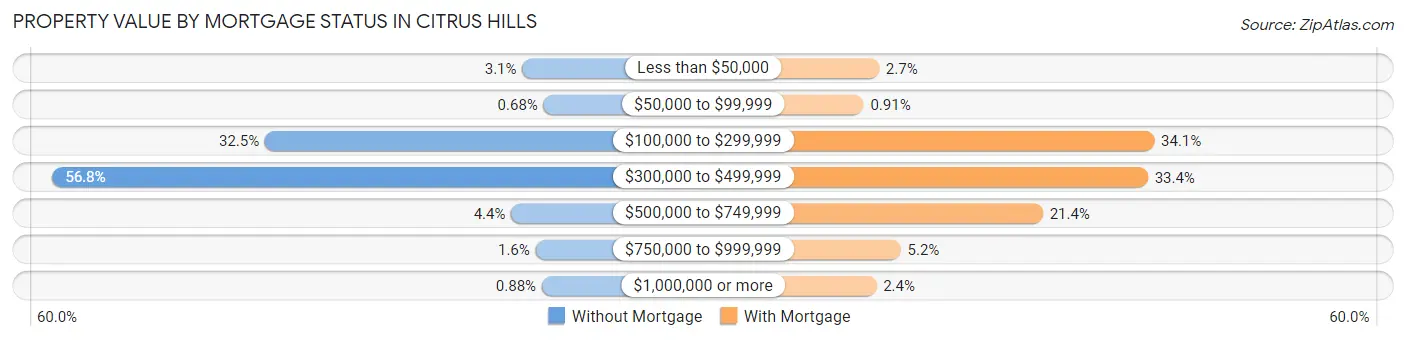
| Property Value | Without Mortgage | With Mortgage |
| Less than $50,000 | 64 (3.1%) | 44 (2.7%) |
| $50,000 to $99,999 | 14 (0.7%) | 15 (0.9%) |
| $100,000 to $299,999 | 669 (32.5%) | 563 (34.1%) |
| $300,000 to $499,999 | 1,169 (56.8%) | 551 (33.4%) |
| $500,000 to $749,999 | 90 (4.4%) | 353 (21.4%) |
| $750,000 to $999,999 | 33 (1.6%) | 85 (5.1%) |
| $1,000,000 or more | 18 (0.9%) | 39 (2.4%) |
| Total | 2,057 (100.0%) | 1,650 (100.0%) |
Household Income by Mortgage Status in Citrus Hills
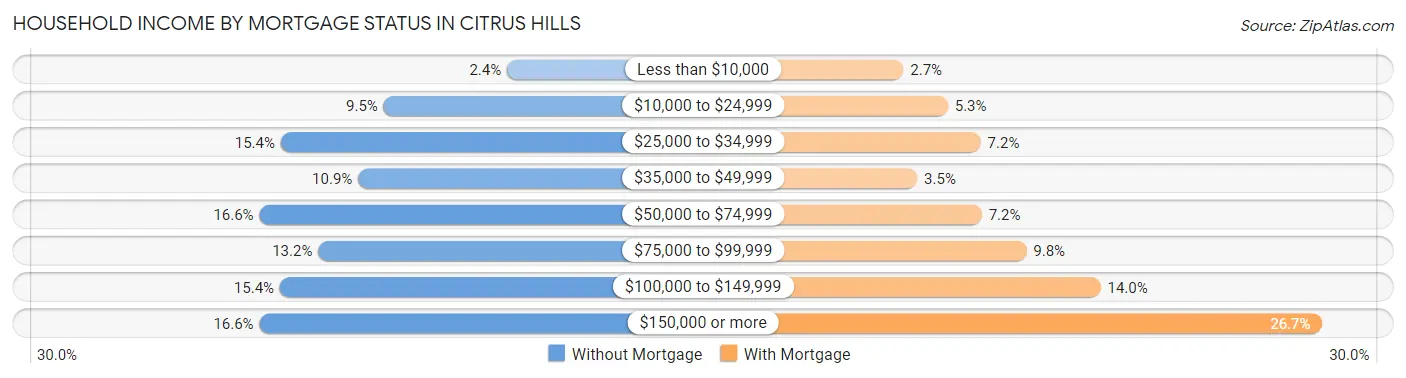
| Household Income | Without Mortgage | With Mortgage |
| Less than $10,000 | 50 (2.4%) | 45 (2.7%) |
| $10,000 to $24,999 | 195 (9.5%) | 87 (5.3%) |
| $25,000 to $34,999 | 316 (15.4%) | 118 (7.1%) |
| $35,000 to $49,999 | 225 (10.9%) | 58 (3.5%) |
| $50,000 to $74,999 | 341 (16.6%) | 119 (7.2%) |
| $75,000 to $99,999 | 272 (13.2%) | 161 (9.8%) |
| $100,000 to $149,999 | 317 (15.4%) | 231 (14.0%) |
| $150,000 or more | 341 (16.6%) | 440 (26.7%) |
| Total | 2,057 (100.0%) | 1,650 (100.0%) |
Property Value to Household Income Ratio in Citrus Hills
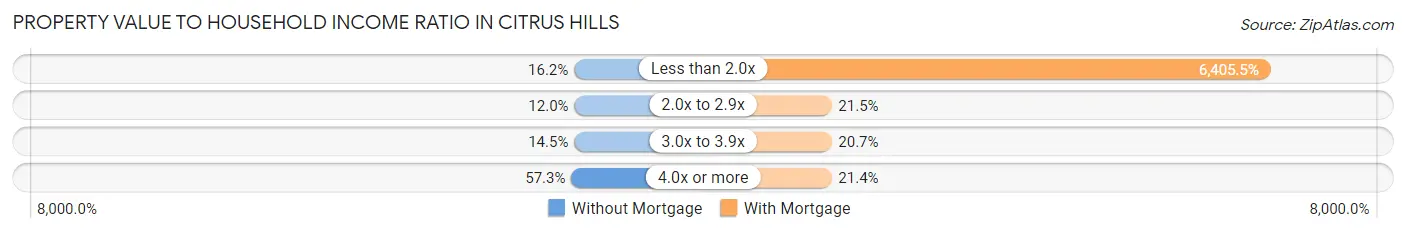
| Value-to-Income Ratio | Without Mortgage | With Mortgage |
| Less than 2.0x | 333 (16.2%) | 105,690 (6,405.5%) |
| 2.0x to 2.9x | 247 (12.0%) | 354 (21.4%) |
| 3.0x to 3.9x | 299 (14.5%) | 341 (20.7%) |
| 4.0x or more | 1,178 (57.3%) | 353 (21.4%) |
| Total | 2,057 (100.0%) | 1,650 (100.0%) |
Real Estate Taxes by Mortgage Status in Citrus Hills
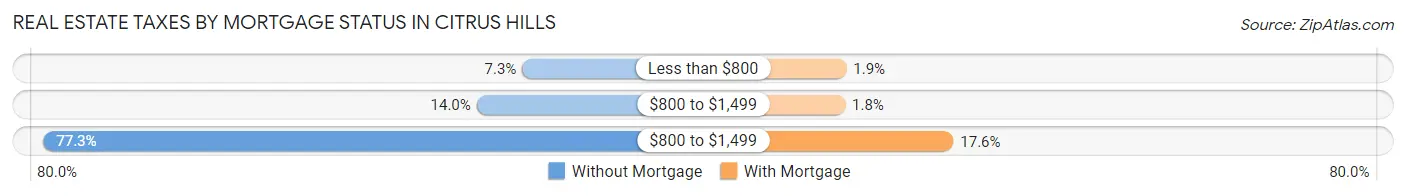
| Property Taxes | Without Mortgage | With Mortgage |
| Less than $800 | 150 (7.3%) | 32 (1.9%) |
| $800 to $1,499 | 287 (14.0%) | 29 (1.8%) |
| $800 to $1,499 | 1,589 (77.2%) | 290 (17.6%) |
| Total | 2,057 (100.0%) | 1,650 (100.0%) |
Health & Disability in Citrus Hills
Health Insurance Coverage by Age in Citrus Hills
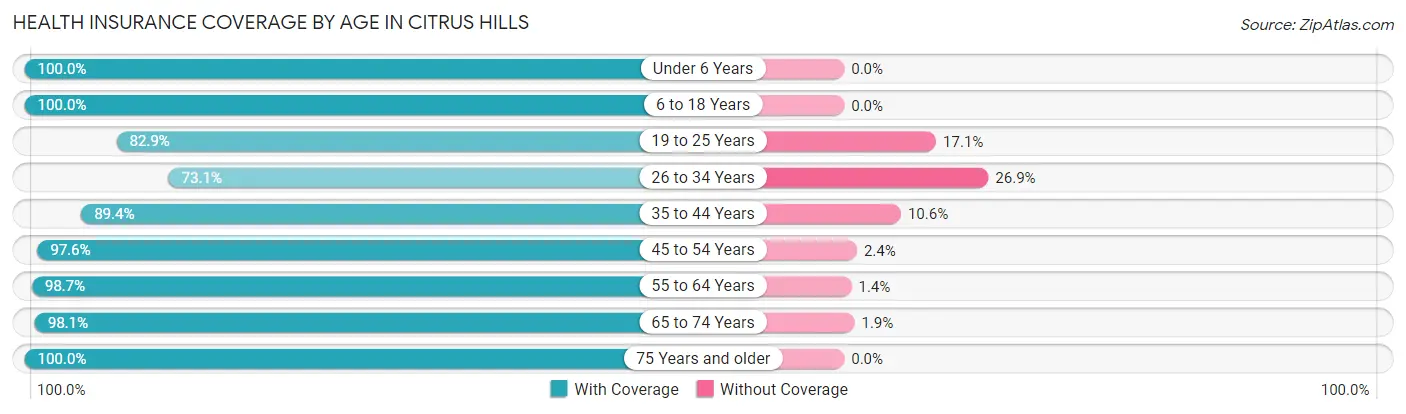
| Age Bracket | With Coverage | Without Coverage |
| Under 6 Years | 74 (100.0%) | 0 (0.0%) |
| 6 to 18 Years | 619 (100.0%) | 0 (0.0%) |
| 19 to 25 Years | 150 (82.9%) | 31 (17.1%) |
| 26 to 34 Years | 196 (73.1%) | 72 (26.9%) |
| 35 to 44 Years | 203 (89.4%) | 24 (10.6%) |
| 45 to 54 Years | 701 (97.6%) | 17 (2.4%) |
| 55 to 64 Years | 1,465 (98.7%) | 20 (1.3%) |
| 65 to 74 Years | 2,727 (98.1%) | 53 (1.9%) |
| 75 Years and older | 2,098 (100.0%) | 0 (0.0%) |
| Total | 8,233 (97.4%) | 217 (2.6%) |
Health Insurance Coverage by Citizenship Status in Citrus Hills
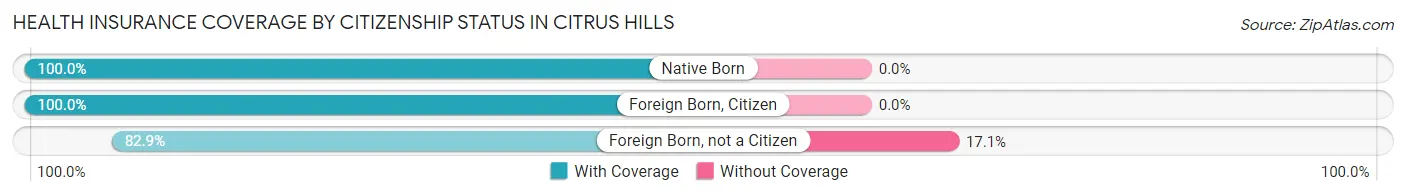
| Citizenship Status | With Coverage | Without Coverage |
| Native Born | 74 (100.0%) | 0 (0.0%) |
| Foreign Born, Citizen | 619 (100.0%) | 0 (0.0%) |
| Foreign Born, not a Citizen | 150 (82.9%) | 31 (17.1%) |
Health Insurance Coverage by Household Income in Citrus Hills
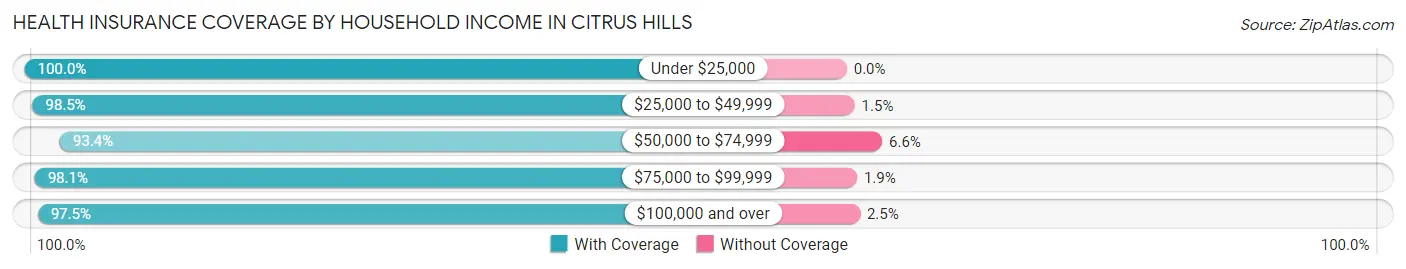
| Household Income | With Coverage | Without Coverage |
| Under $25,000 | 946 (100.0%) | 0 (0.0%) |
| $25,000 to $49,999 | 1,140 (98.5%) | 17 (1.5%) |
| $50,000 to $74,999 | 1,144 (93.4%) | 81 (6.6%) |
| $75,000 to $99,999 | 1,189 (98.1%) | 23 (1.9%) |
| $100,000 and over | 3,814 (97.5%) | 96 (2.5%) |
Public vs Private Health Insurance Coverage by Age in Citrus Hills
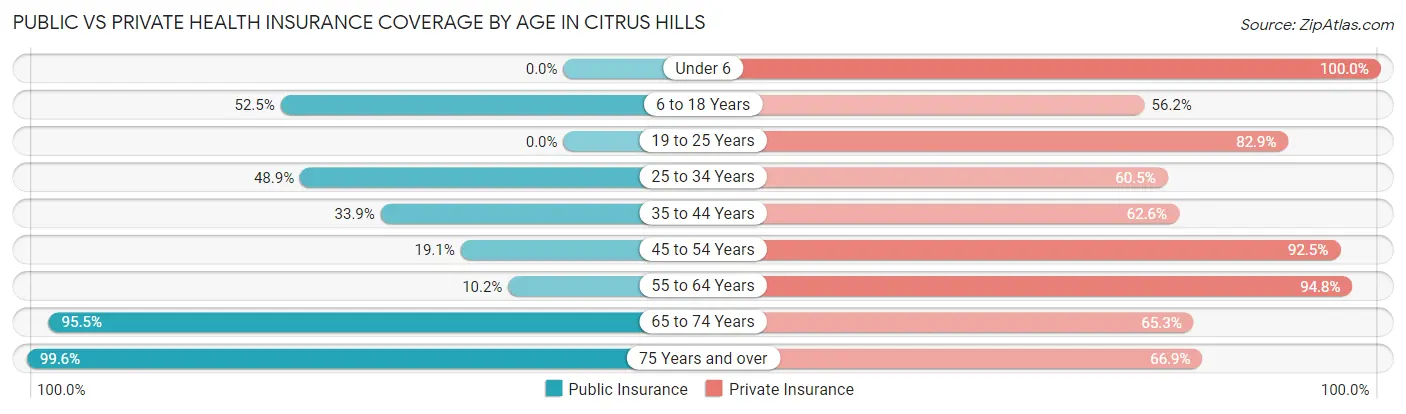
| Age Bracket | Public Insurance | Private Insurance |
| Under 6 | 0 (0.0%) | 74 (100.0%) |
| 6 to 18 Years | 325 (52.5%) | 348 (56.2%) |
| 19 to 25 Years | 0 (0.0%) | 150 (82.9%) |
| 25 to 34 Years | 131 (48.9%) | 162 (60.5%) |
| 35 to 44 Years | 77 (33.9%) | 142 (62.6%) |
| 45 to 54 Years | 137 (19.1%) | 664 (92.5%) |
| 55 to 64 Years | 152 (10.2%) | 1,407 (94.8%) |
| 65 to 74 Years | 2,656 (95.5%) | 1,815 (65.3%) |
| 75 Years and over | 2,089 (99.6%) | 1,404 (66.9%) |
| Total | 5,567 (65.9%) | 6,166 (73.0%) |
Disability Status by Sex by Age in Citrus Hills
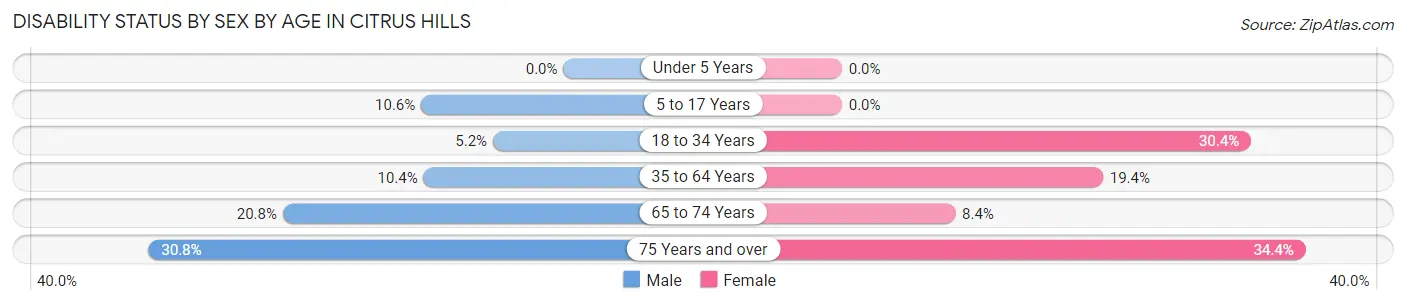
| Age Bracket | Male | Female |
| Under 5 Years | 0 (0.0%) | 0 (0.0%) |
| 5 to 17 Years | 19 (10.6%) | 0 (0.0%) |
| 18 to 34 Years | 15 (5.2%) | 55 (30.4%) |
| 35 to 64 Years | 99 (10.4%) | 286 (19.4%) |
| 65 to 74 Years | 277 (20.8%) | 122 (8.4%) |
| 75 Years and over | 285 (30.8%) | 404 (34.4%) |
Disability Class by Sex by Age in Citrus Hills
Disability Class: Hearing Difficulty
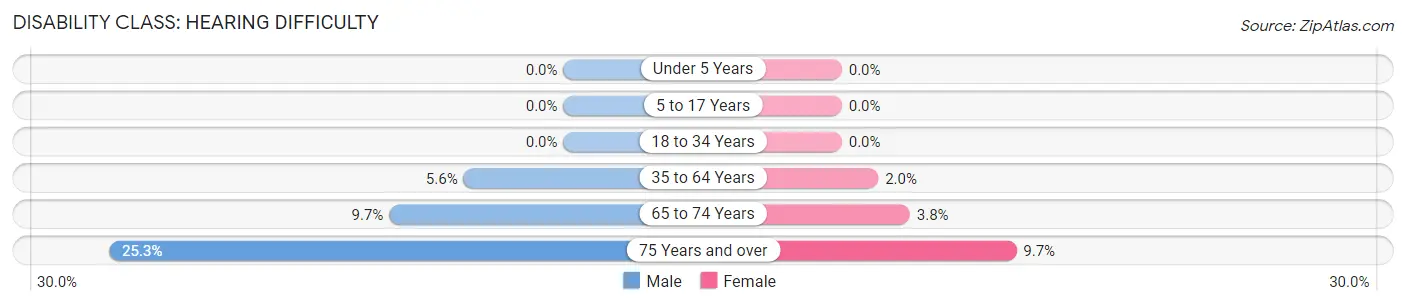
| Age Bracket | Male | Female |
| Under 5 Years | 0 (0.0%) | 0 (0.0%) |
| 5 to 17 Years | 0 (0.0%) | 0 (0.0%) |
| 18 to 34 Years | 0 (0.0%) | 0 (0.0%) |
| 35 to 64 Years | 53 (5.6%) | 30 (2.0%) |
| 65 to 74 Years | 129 (9.7%) | 55 (3.8%) |
| 75 Years and over | 234 (25.3%) | 114 (9.7%) |
Disability Class: Vision Difficulty
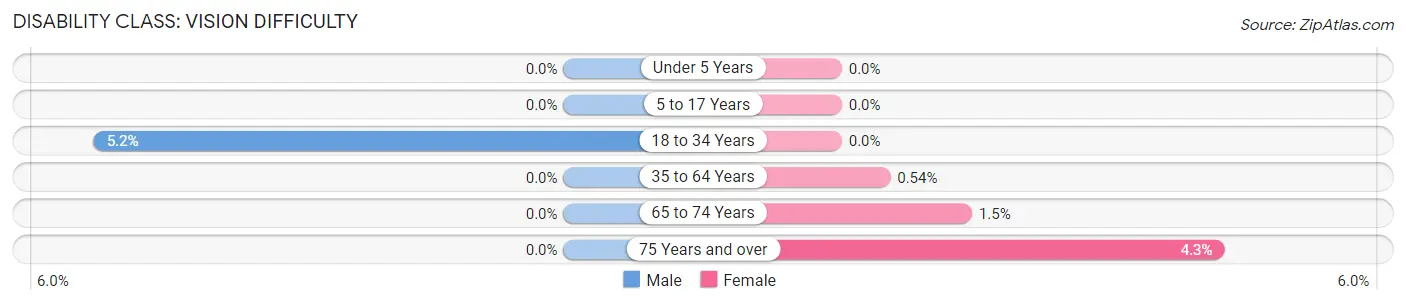
| Age Bracket | Male | Female |
| Under 5 Years | 0 (0.0%) | 0 (0.0%) |
| 5 to 17 Years | 0 (0.0%) | 0 (0.0%) |
| 18 to 34 Years | 15 (5.2%) | 0 (0.0%) |
| 35 to 64 Years | 0 (0.0%) | 8 (0.5%) |
| 65 to 74 Years | 0 (0.0%) | 21 (1.5%) |
| 75 Years and over | 0 (0.0%) | 50 (4.3%) |
Disability Class: Cognitive Difficulty
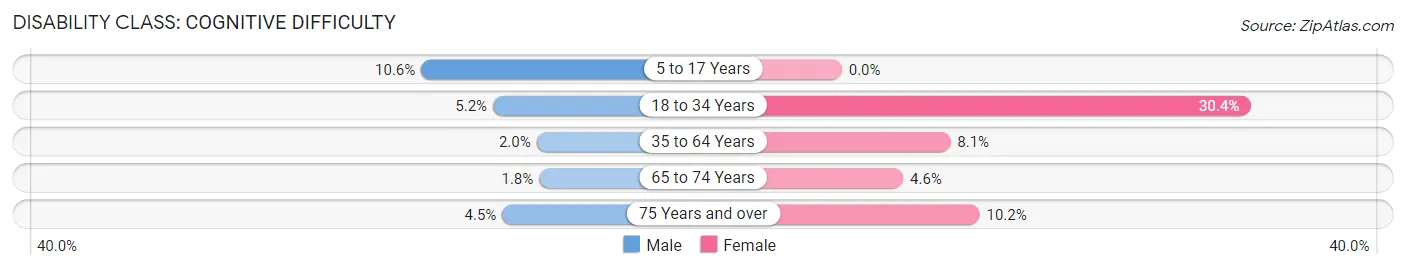
| Age Bracket | Male | Female |
| 5 to 17 Years | 19 (10.6%) | 0 (0.0%) |
| 18 to 34 Years | 15 (5.2%) | 55 (30.4%) |
| 35 to 64 Years | 19 (2.0%) | 119 (8.1%) |
| 65 to 74 Years | 24 (1.8%) | 66 (4.5%) |
| 75 Years and over | 42 (4.5%) | 120 (10.2%) |
Disability Class: Ambulatory Difficulty
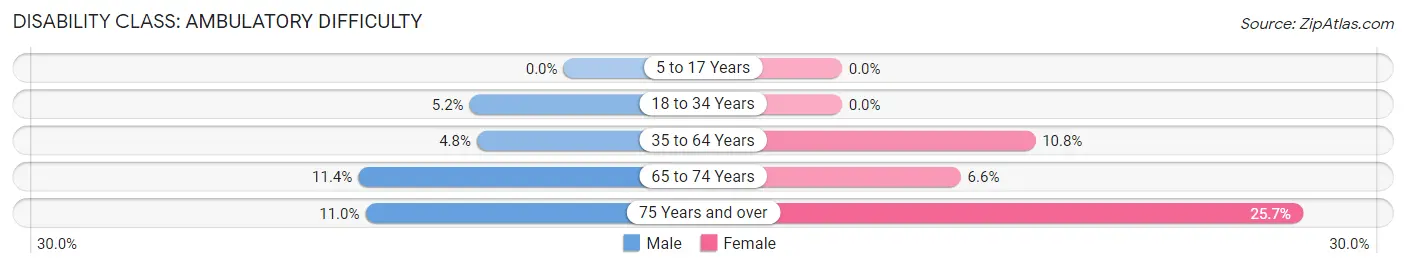
| Age Bracket | Male | Female |
| 5 to 17 Years | 0 (0.0%) | 0 (0.0%) |
| 18 to 34 Years | 15 (5.2%) | 0 (0.0%) |
| 35 to 64 Years | 46 (4.8%) | 159 (10.8%) |
| 65 to 74 Years | 152 (11.4%) | 96 (6.6%) |
| 75 Years and over | 102 (11.0%) | 301 (25.7%) |
Disability Class: Self-Care Difficulty
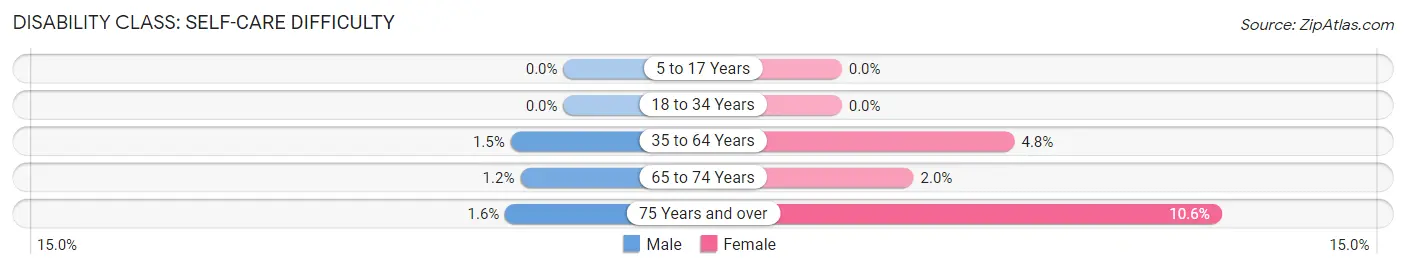
| Age Bracket | Male | Female |
| 5 to 17 Years | 0 (0.0%) | 0 (0.0%) |
| 18 to 34 Years | 0 (0.0%) | 0 (0.0%) |
| 35 to 64 Years | 14 (1.5%) | 71 (4.8%) |
| 65 to 74 Years | 16 (1.2%) | 29 (2.0%) |
| 75 Years and over | 15 (1.6%) | 124 (10.6%) |
Technology Access in Citrus Hills
Computing Device Access in Citrus Hills
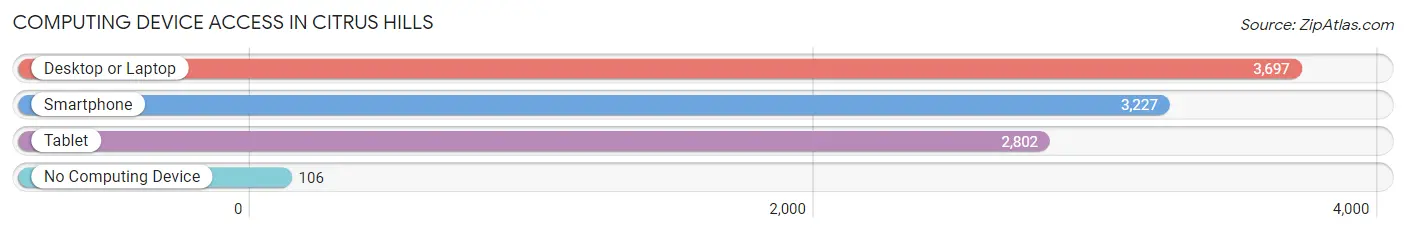
| Device Type | # Households | % Households |
| Desktop or Laptop | 3,697 | 93.2% |
| Smartphone | 3,227 | 81.4% |
| Tablet | 2,802 | 70.6% |
| No Computing Device | 106 | 2.7% |
| Total | 3,967 | 100.0% |
Internet Access in Citrus Hills
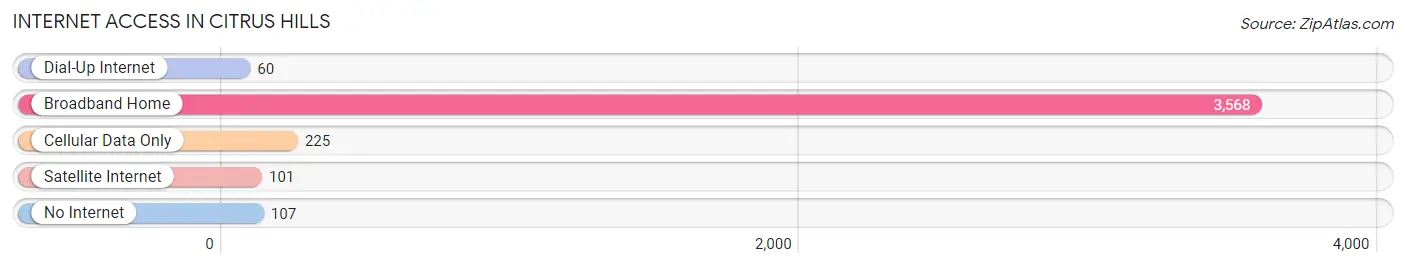
| Internet Type | # Households | % Households |
| Dial-Up Internet | 60 | 1.5% |
| Broadband Home | 3,568 | 89.9% |
| Cellular Data Only | 225 | 5.7% |
| Satellite Internet | 101 | 2.5% |
| No Internet | 107 | 2.7% |
| Total | 3,967 | 100.0% |
Citrus Hills Summary
Citrus Hills is a census-designated place (CDP) located in Hernando County, Florida, United States. The population was 8,945 at the 2010 census. It is part of the Tampa-St. Petersburg-Clearwater Metropolitan Statistical Area.
History
Citrus Hills was founded in the late 1970s by the Deltona Corporation, a Florida-based real estate development company. The company purchased over 10,000 acres of land in the area and began developing the community. The first homes were built in 1979 and the community was officially incorporated in 1984.
Geography
Citrus Hills is located in the central part of Hernando County, approximately 25 miles north of Tampa. It is bordered by the Withlacoochee State Forest to the north and the Citrus County line to the west. The CDP has a total area of 11.2 square miles, of which 11.1 square miles is land and 0.1 square miles (0.9%) is water.
Economy
Citrus Hills is primarily a residential community, with most of its residents employed in nearby cities such as Tampa and Ocala. The community is home to several small businesses, including a golf course, a country club, and a few restaurants.
Demographics
As of the 2010 census, there were 8,945 people, 4,093 households, and 2,845 families residing in the CDP. The population density was 809.3 people per square mile. The racial makeup of the CDP was 94.3% White, 1.7% African American, 0.3% Native American, 1.2% Asian, 0.1% Pacific Islander, 1.2% from other races, and 1.2% from two or more races. Hispanic or Latino of any race were 5.2% of the population.
The median income for a household in the CDP was $50,945, and the median income for a family was $58,945. Males had a median income of $41,945 versus $30,945 for females. The per capita income for the CDP was $25,945. About 4.2% of families and 5.2% of the population were below the poverty line, including 6.2% of those under age 18 and 4.2% of those age 65 or over.
Common Questions
What is the Total Population of Citrus Hills?
Total Population of Citrus Hills is 8,599.
What is the Total Male Population of Citrus Hills?
Total Male Population of Citrus Hills is 3,795.
What is the Total Female Population of Citrus Hills?
Total Female Population of Citrus Hills is 4,804.
What is the Ratio of Males per 100 Females in Citrus Hills?
There are 79.00 Males per 100 Females in Citrus Hills.
What is the Ratio of Females per 100 Males in Citrus Hills?
There are 126.59 Females per 100 Males in Citrus Hills.
What is the Median Population Age in Citrus Hills?
Median Population Age in Citrus Hills is 67.9 Years.
What is the Average Family Size in Citrus Hills
Average Family Size in Citrus Hills is 2.4 People.
What is the Average Household Size in Citrus Hills
Average Household Size in Citrus Hills is 2.1 People.
What is Per Capita Income in Citrus Hills?
Per Capita income in Citrus Hills is $49,418.
What is the Median Family Income in Citrus Hills?
Median Family Income in Citrus Hills is $89,836.
What is the Median Household income in Citrus Hills?
Median Household Income in Citrus Hills is $79,206.
What is Income or Wage Gap in Citrus Hills?
Income or Wage Gap in Citrus Hills is 61.6%.
Women in Citrus Hills earn 38.4 cents for every dollar earned by a man.
What is Inequality or Gini Index in Citrus Hills?
Inequality or Gini Index in Citrus Hills is 0.46.
How Large is the Labor Force in Citrus Hills?
There are 2,079 People in the Labor Forcein in Citrus Hills.
What is the Percentage of People in the Labor Force in Citrus Hills?
25.7% of People are in the Labor Force in Citrus Hills.
What is the Unemployment Rate in Citrus Hills?
Unemployment Rate in Citrus Hills is 14.3%.