Fanning Springs, FL
Fanning Springs Map
Fanning Springs Overview
1,114
TOTAL POPULATION
553
MALE POPULATION
561
FEMALE POPULATION
98.57
MALES / 100 FEMALES
101.45
FEMALES / 100 MALES
55.3
MEDIAN AGE
2.6
AVG FAMILY SIZE
2.2
AVG HOUSEHOLD SIZE
$31,198
PER CAPITA INCOME
$62,841
AVG FAMILY INCOME
$48,281
AVG HOUSEHOLD INCOME
2.3%
WAGE / INCOME GAP [ % ]
97.7¢/ $1
WAGE / INCOME GAP [ $ ]
0.49
INEQUALITY / GINI INDEX
448
LABOR FORCE [ PEOPLE ]
45.0%
PERCENT IN LABOR FORCE
4.0%
UNEMPLOYMENT RATE
Fanning Springs Area Codes
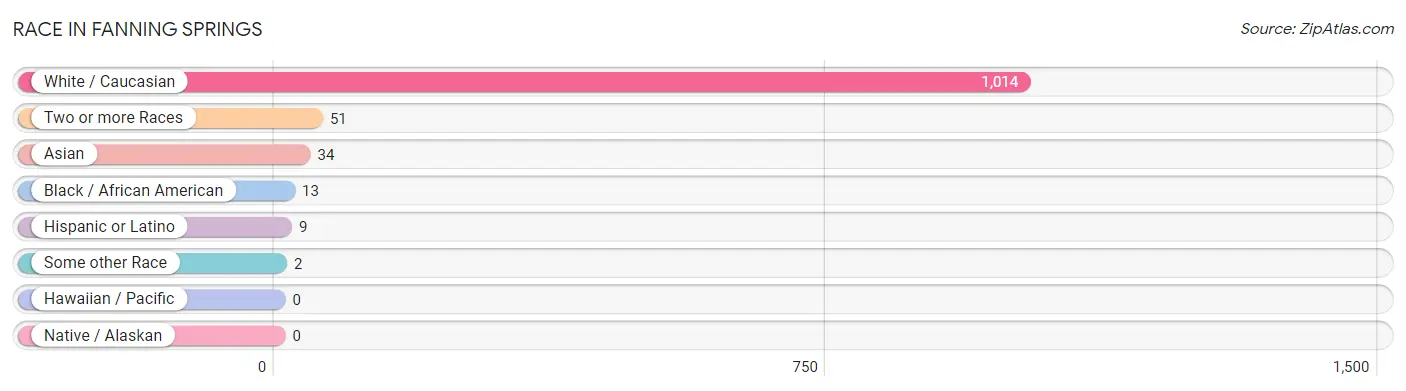
Race in Fanning Springs
The most populous races in Fanning Springs are White / Caucasian (1,014 | 91.0%), Two or more Races (51 | 4.6%), and Asian (34 | 3.0%).
| Race | # Population | % Population |
| Asian | 34 | 3.0% |
| Black / African American | 13 | 1.2% |
| Hawaiian / Pacific | 0 | 0.0% |
| Hispanic or Latino | 9 | 0.8% |
| Native / Alaskan | 0 | 0.0% |
| White / Caucasian | 1,014 | 91.0% |
| Two or more Races | 51 | 4.6% |
| Some other Race | 2 | 0.2% |
| Total | 1,114 | 100.0% |
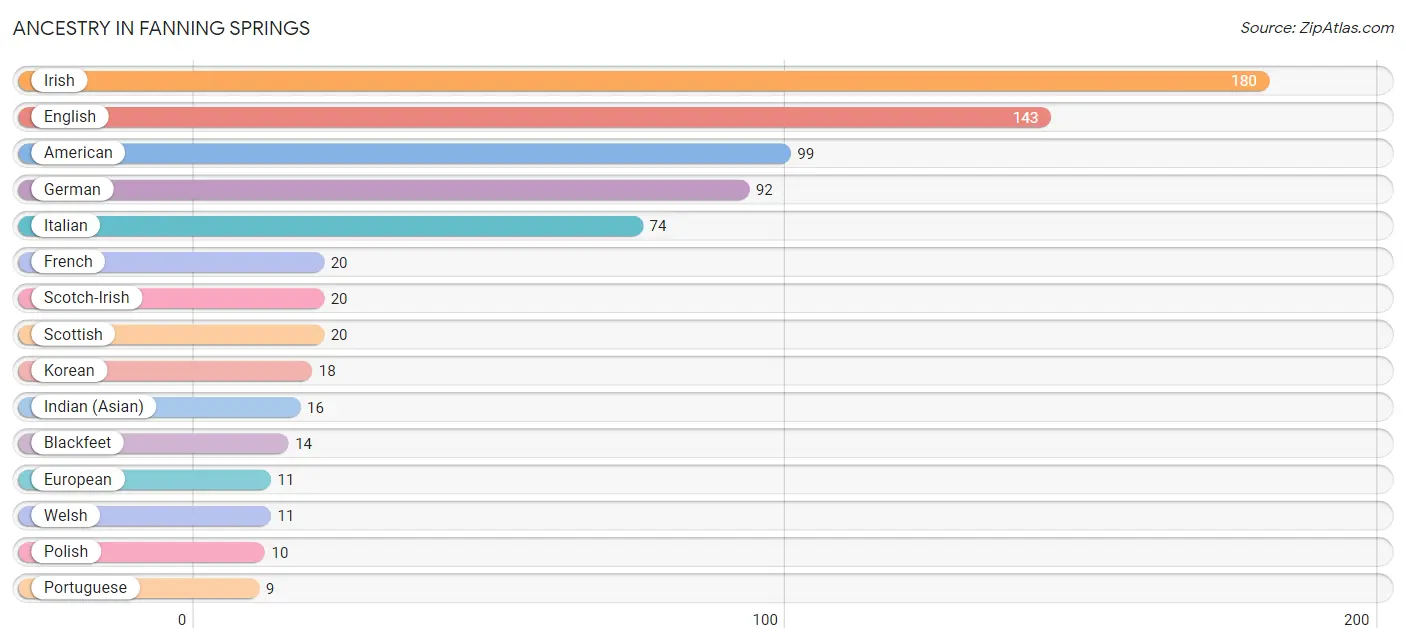
Ancestry in Fanning Springs
The most populous ancestries reported in Fanning Springs are Irish (180 | 16.2%), English (143 | 12.8%), American (99 | 8.9%), German (92 | 8.3%), and Italian (74 | 6.6%), together accounting for 52.8% of all Fanning Springs residents.
| Ancestry | # Population | % Population |
| American | 99 | 8.9% |
| Belgian | 2 | 0.2% |
| Blackfeet | 14 | 1.3% |
| British | 3 | 0.3% |
| Canadian | 3 | 0.3% |
| Cherokee | 8 | 0.7% |
| Choctaw | 4 | 0.4% |
| Creek | 4 | 0.4% |
| Cuban | 2 | 0.2% |
| Dutch | 3 | 0.3% |
| English | 143 | 12.8% |
| European | 11 | 1.0% |
| French | 20 | 1.8% |
| French Canadian | 3 | 0.3% |
| German | 92 | 8.3% |
| Indian (Asian) | 16 | 1.4% |
| Irish | 180 | 16.2% |
| Italian | 74 | 6.6% |
| Japanese | 8 | 0.7% |
| Korean | 18 | 1.6% |
| Lithuanian | 6 | 0.5% |
| Mexican | 2 | 0.2% |
| Polish | 10 | 0.9% |
| Portuguese | 9 | 0.8% |
| Puerto Rican | 2 | 0.2% |
| Scotch-Irish | 20 | 1.8% |
| Scottish | 20 | 1.8% |
| Seminole | 6 | 0.5% |
| Spanish | 3 | 0.3% |
| Swedish | 4 | 0.4% |
| Swiss | 4 | 0.4% |
| Welsh | 11 | 1.0% | View All 32 Rows |
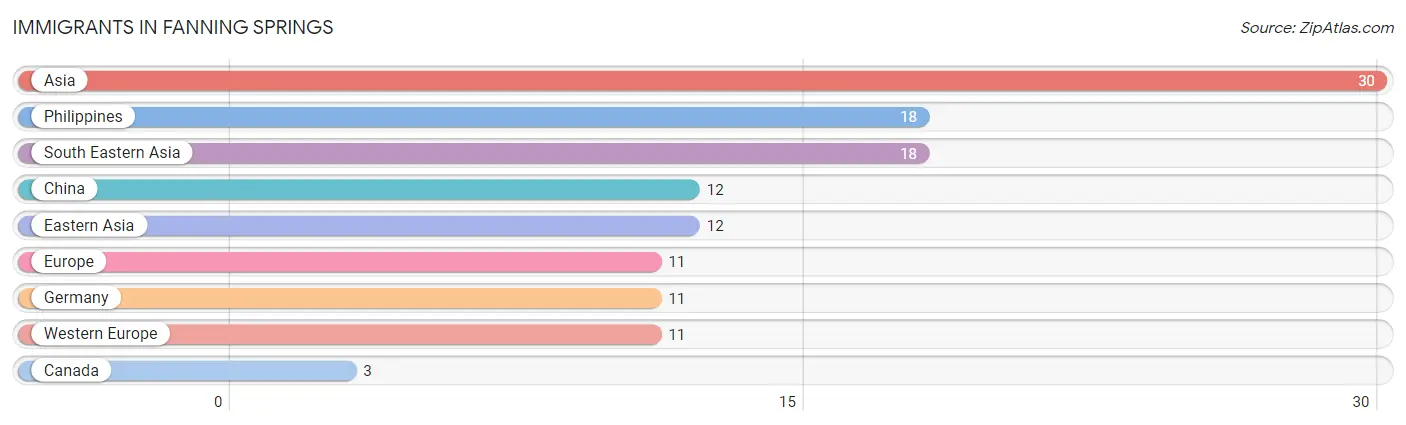
Immigrants in Fanning Springs
The most numerous immigrant groups reported in Fanning Springs came from Asia (30 | 2.7%), Philippines (18 | 1.6%), South Eastern Asia (18 | 1.6%), China (12 | 1.1%), and Eastern Asia (12 | 1.1%), together accounting for 8.1% of all Fanning Springs residents.
| Immigration Origin | # Population | % Population |
| Asia | 30 | 2.7% |
| Canada | 3 | 0.3% |
| China | 12 | 1.1% |
| Eastern Asia | 12 | 1.1% |
| Europe | 11 | 1.0% |
| Germany | 11 | 1.0% |
| Philippines | 18 | 1.6% |
| South Eastern Asia | 18 | 1.6% |
| Western Europe | 11 | 1.0% | View All 9 Rows |
Sex and Age in Fanning Springs
Sex and Age in Fanning Springs
The most populous age groups in Fanning Springs are 55 to 59 Years (74 | 13.4%) for men and 85 Years and over (60 | 10.7%) for women.
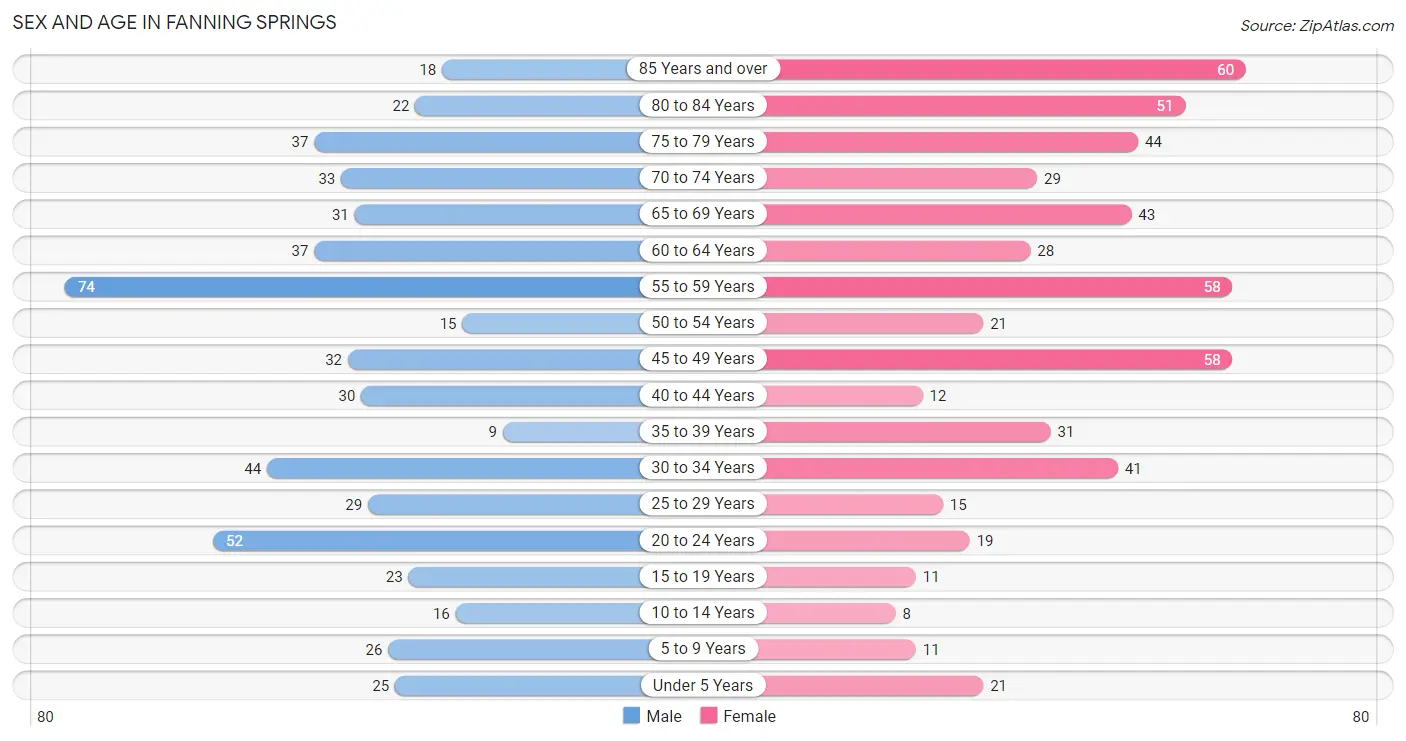
| Age Bracket | Male | Female |
| Under 5 Years | 25 (4.5%) | 21 (3.7%) |
| 5 to 9 Years | 26 (4.7%) | 11 (2.0%) |
| 10 to 14 Years | 16 (2.9%) | 8 (1.4%) |
| 15 to 19 Years | 23 (4.2%) | 11 (2.0%) |
| 20 to 24 Years | 52 (9.4%) | 19 (3.4%) |
| 25 to 29 Years | 29 (5.2%) | 15 (2.7%) |
| 30 to 34 Years | 44 (8.0%) | 41 (7.3%) |
| 35 to 39 Years | 9 (1.6%) | 31 (5.5%) |
| 40 to 44 Years | 30 (5.4%) | 12 (2.1%) |
| 45 to 49 Years | 32 (5.8%) | 58 (10.3%) |
| 50 to 54 Years | 15 (2.7%) | 21 (3.7%) |
| 55 to 59 Years | 74 (13.4%) | 58 (10.3%) |
| 60 to 64 Years | 37 (6.7%) | 28 (5.0%) |
| 65 to 69 Years | 31 (5.6%) | 43 (7.7%) |
| 70 to 74 Years | 33 (6.0%) | 29 (5.2%) |
| 75 to 79 Years | 37 (6.7%) | 44 (7.8%) |
| 80 to 84 Years | 22 (4.0%) | 51 (9.1%) |
| 85 Years and over | 18 (3.3%) | 60 (10.7%) |
| Total | 553 (100.0%) | 561 (100.0%) |
Families and Households in Fanning Springs
Median Family Size in Fanning Springs
The median family size in Fanning Springs is 2.57 persons per family, with married-couple families (233 | 80.6%) accounting for the largest median family size of 2.65 persons per family. On the other hand, single male/father families (21 | 7.3%) represent the smallest median family size with 1.67 persons per family.
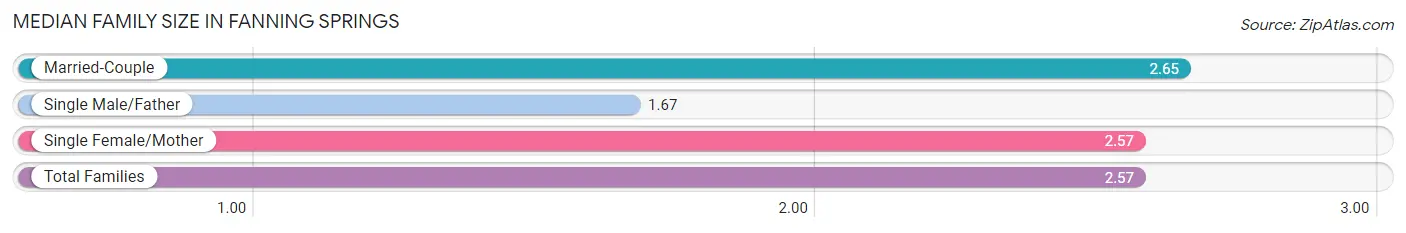
| Family Type | # Families | Family Size |
| Married-Couple | 233 (80.6%) | 2.65 |
| Single Male/Father | 21 (7.3%) | 1.67 |
| Single Female/Mother | 35 (12.1%) | 2.57 |
| Total Families | 289 (100.0%) | 2.57 |
Median Household Size in Fanning Springs
The median household size in Fanning Springs is 2.25 persons per household, with single male/father households (21 | 4.6%) accounting for the largest median household size of 4.29 persons per household. non-family households (163 | 36.1%) represent the smallest median household size with 1.26 persons per household.
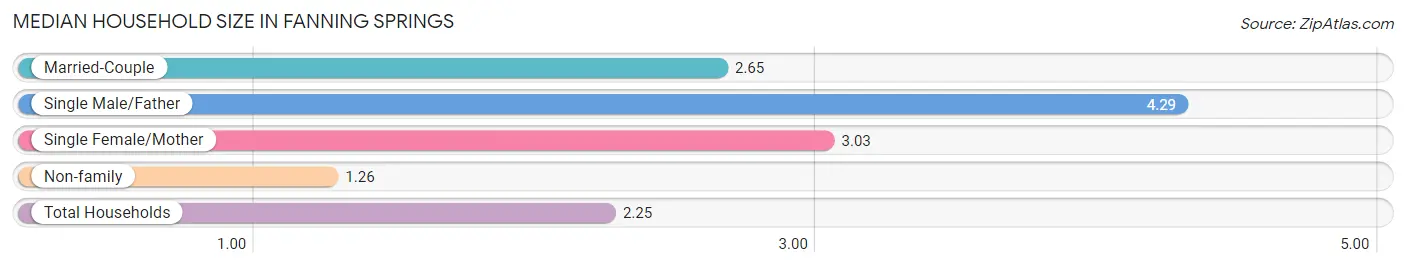
| Household Type | # Households | Household Size |
| Married-Couple | 233 (51.5%) | 2.65 |
| Single Male/Father | 21 (4.6%) | 4.29 |
| Single Female/Mother | 35 (7.7%) | 3.03 |
| Non-family | 163 (36.1%) | 1.26 |
| Total Households | 452 (100.0%) | 2.25 |
Household Size by Marriage Status in Fanning Springs
Out of a total of 452 households in Fanning Springs, 289 (63.9%) are family households, while 163 (36.1%) are nonfamily households. The most numerous type of family households are 2-person households, comprising 162, and the most common type of nonfamily households are 1-person households, comprising 121.
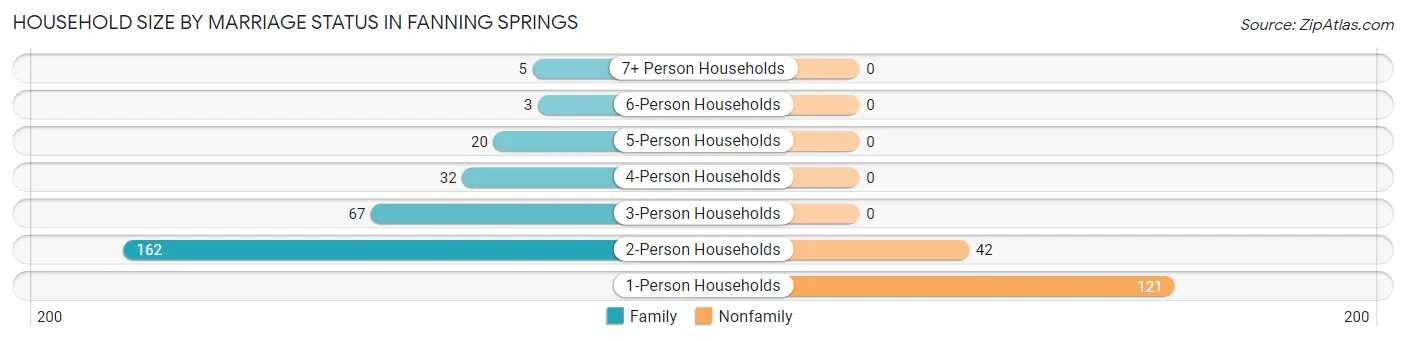
| Household Size | Family Households | Nonfamily Households |
| 1-Person Households | - | 121 (26.8%) |
| 2-Person Households | 162 (35.8%) | 42 (9.3%) |
| 3-Person Households | 67 (14.8%) | 0 (0.0%) |
| 4-Person Households | 32 (7.1%) | 0 (0.0%) |
| 5-Person Households | 20 (4.4%) | 0 (0.0%) |
| 6-Person Households | 3 (0.7%) | 0 (0.0%) |
| 7+ Person Households | 5 (1.1%) | 0 (0.0%) |
| Total | 289 (63.9%) | 163 (36.1%) |
Female Fertility in Fanning Springs
Fertility by Age in Fanning Springs
Average fertility rate in Fanning Springs is 26.0 births per 1,000 women. Women in the age bracket of 20 to 34 years have the highest fertility rate with 67.0 births per 1,000 women. Women in the age bracket of 20 to 34 years acount for 100.0% of all women with births.
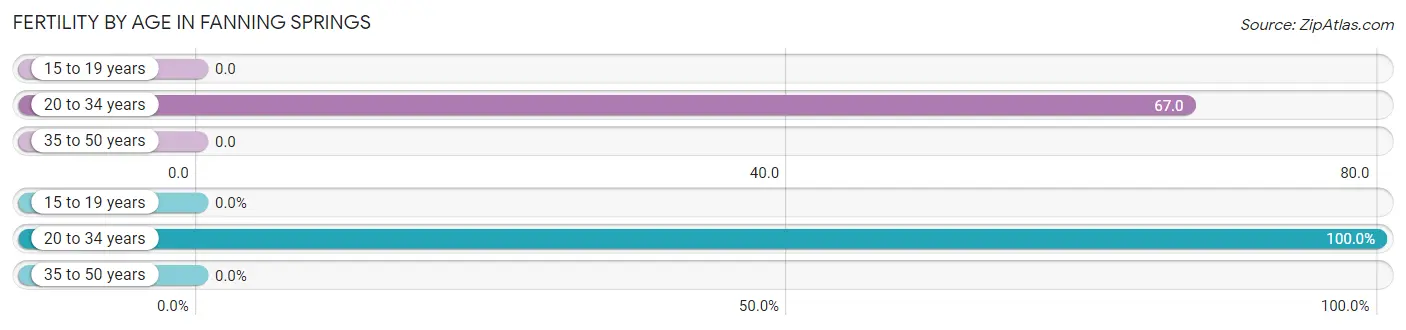
| Age Bracket | Women with Births | Births / 1,000 Women |
| 15 to 19 years | 0 (0.0%) | 0.0 |
| 20 to 34 years | 5 (100.0%) | 67.0 |
| 35 to 50 years | 0 (0.0%) | 0.0 |
| Total | 5 (100.0%) | 26.0 |
Fertility by Age by Marriage Status in Fanning Springs
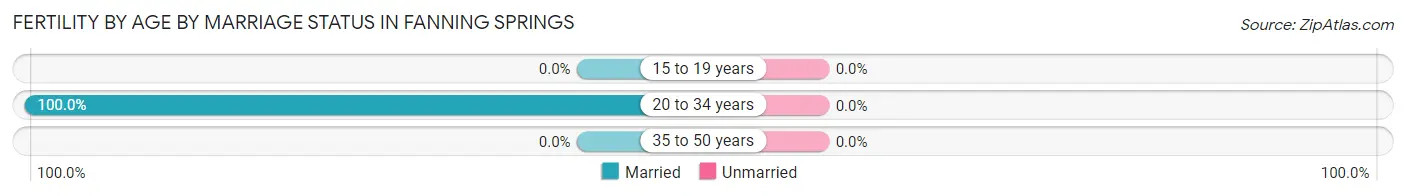
| Age Bracket | Married | Unmarried |
| 15 to 19 years | 0 (0.0%) | 0 (0.0%) |
| 20 to 34 years | 5 (100.0%) | 0 (0.0%) |
| 35 to 50 years | 0 (0.0%) | 0 (0.0%) |
| Total | 5 (100.0%) | 0 (0.0%) |
Fertility by Education in Fanning Springs
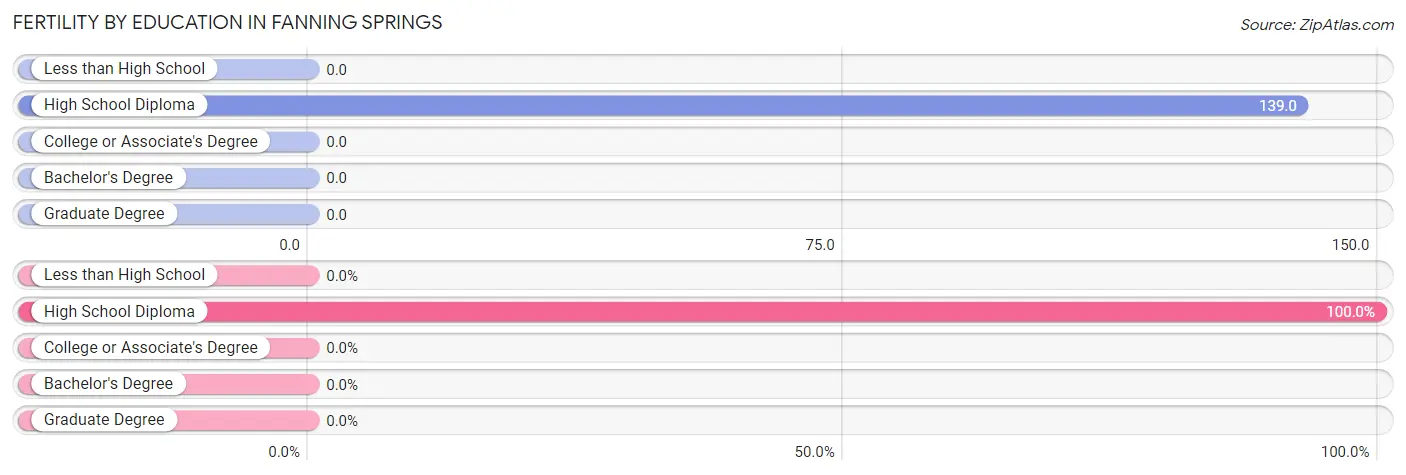
| Educational Attainment | Women with Births | Births / 1,000 Women |
| Less than High School | 0 (0.0%) | 0.0 |
| High School Diploma | 5 (100.0%) | 139.0 |
| College or Associate's Degree | 0 (0.0%) | 0.0 |
| Bachelor's Degree | 0 (0.0%) | 0.0 |
| Graduate Degree | 0 (0.0%) | 0.0 |
| Total | 5 (100.0%) | 26.0 |
Fertility by Education by Marriage Status in Fanning Springs
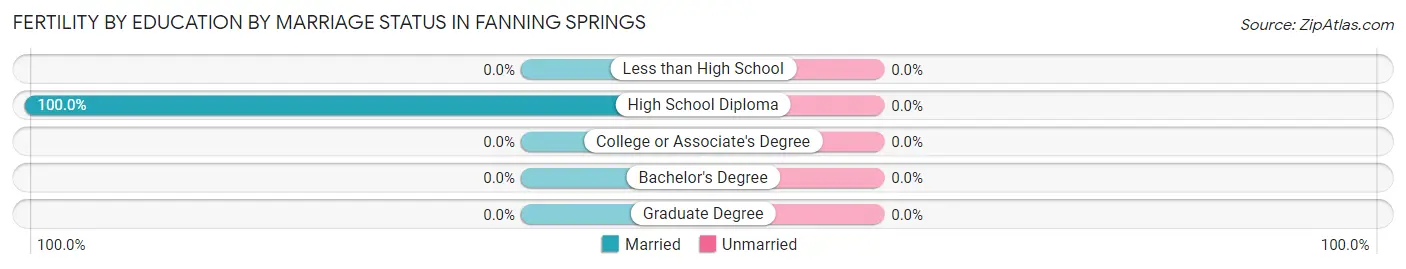
| Educational Attainment | Married | Unmarried |
| Less than High School | 0 (0.0%) | 0 (0.0%) |
| High School Diploma | 5 (100.0%) | 0 (0.0%) |
| College or Associate's Degree | 0 (0.0%) | 0 (0.0%) |
| Bachelor's Degree | 0 (0.0%) | 0 (0.0%) |
| Graduate Degree | 0 (0.0%) | 0 (0.0%) |
| Total | 5 (100.0%) | 0 (0.0%) |
Income in Fanning Springs
Income Overview in Fanning Springs
Per Capita Income in Fanning Springs is $31,198, while median incomes of families and households are $62,841 and $48,281 respectively.
| Characteristic | Number | Measure |
| Per Capita Income | 1,114 | $31,198 |
| Median Family Income | 289 | $62,841 |
| Mean Family Income | 289 | $90,376 |
| Median Household Income | 452 | $48,281 |
| Mean Household Income | 452 | $71,535 |
| Income Deficit | 289 | $0 |
| Wage / Income Gap (%) | 1,114 | 2.31% |
| Wage / Income Gap ($) | 1,114 | 97.69¢ per $1 |
| Gini / Inequality Index | 1,114 | 0.49 |
Earnings by Sex in Fanning Springs
Average Earnings in Fanning Springs are $26,366, $25,909 for men and $26,523 for women, a difference of 2.3%.
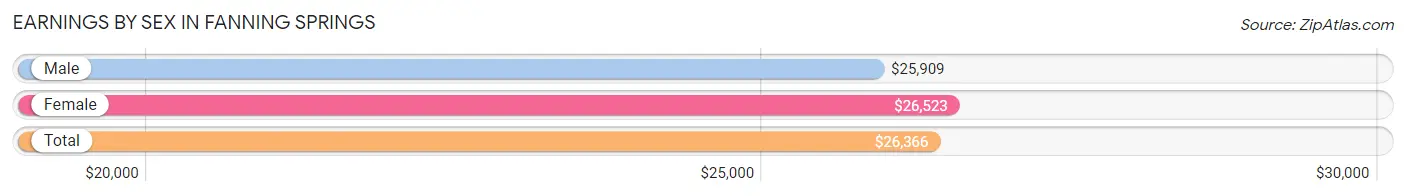
| Sex | Number | Average Earnings |
| Male | 280 (56.8%) | $25,909 |
| Female | 213 (43.2%) | $26,523 |
| Total | 493 (100.0%) | $26,366 |
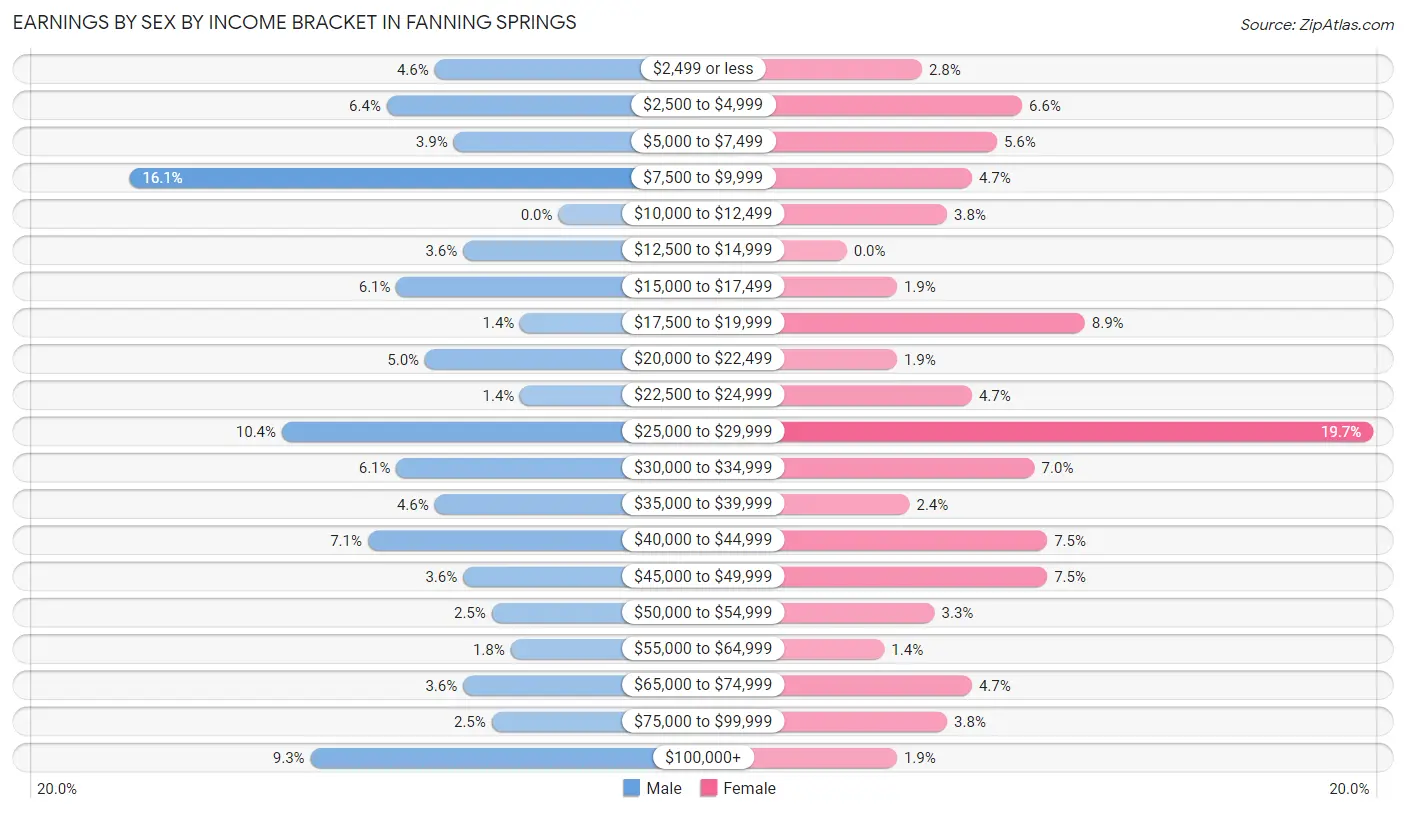
Earnings by Sex by Income Bracket in Fanning Springs
The most common earnings brackets in Fanning Springs are $7,500 to $9,999 for men (45 | 16.1%) and $25,000 to $29,999 for women (42 | 19.7%).
| Income | Male | Female |
| $2,499 or less | 13 (4.6%) | 6 (2.8%) |
| $2,500 to $4,999 | 18 (6.4%) | 14 (6.6%) |
| $5,000 to $7,499 | 11 (3.9%) | 12 (5.6%) |
| $7,500 to $9,999 | 45 (16.1%) | 10 (4.7%) |
| $10,000 to $12,499 | 0 (0.0%) | 8 (3.8%) |
| $12,500 to $14,999 | 10 (3.6%) | 0 (0.0%) |
| $15,000 to $17,499 | 17 (6.1%) | 4 (1.9%) |
| $17,500 to $19,999 | 4 (1.4%) | 19 (8.9%) |
| $20,000 to $22,499 | 14 (5.0%) | 4 (1.9%) |
| $22,500 to $24,999 | 4 (1.4%) | 10 (4.7%) |
| $25,000 to $29,999 | 29 (10.4%) | 42 (19.7%) |
| $30,000 to $34,999 | 17 (6.1%) | 15 (7.0%) |
| $35,000 to $39,999 | 13 (4.6%) | 5 (2.4%) |
| $40,000 to $44,999 | 20 (7.1%) | 16 (7.5%) |
| $45,000 to $49,999 | 10 (3.6%) | 16 (7.5%) |
| $50,000 to $54,999 | 7 (2.5%) | 7 (3.3%) |
| $55,000 to $64,999 | 5 (1.8%) | 3 (1.4%) |
| $65,000 to $74,999 | 10 (3.6%) | 10 (4.7%) |
| $75,000 to $99,999 | 7 (2.5%) | 8 (3.8%) |
| $100,000+ | 26 (9.3%) | 4 (1.9%) |
| Total | 280 (100.0%) | 213 (100.0%) |
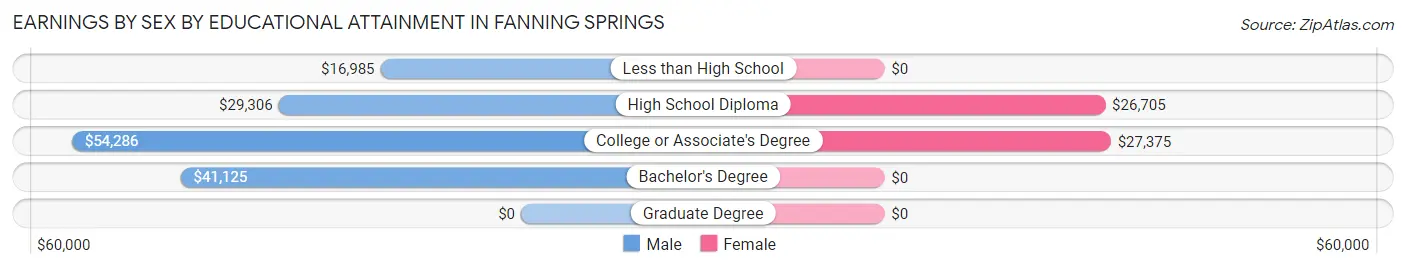
Earnings by Sex by Educational Attainment in Fanning Springs
Average earnings in Fanning Springs are $30,446 for men and $27,339 for women, a difference of 10.2%. Men with an educational attainment of college or associate's degree enjoy the highest average annual earnings of $54,286, while those with less than high school education earn the least with $16,985. Women with an educational attainment of college or associate's degree earn the most with the average annual earnings of $27,375, while those with high school diploma education have the smallest earnings of $26,705.
| Educational Attainment | Male Income | Female Income |
| Less than High School | $16,985 | $0 |
| High School Diploma | $29,306 | $26,705 |
| College or Associate's Degree | $54,286 | $27,375 |
| Bachelor's Degree | $41,125 | $0 |
| Graduate Degree | - | - |
| Total | $30,446 | $27,339 |
Family Income in Fanning Springs
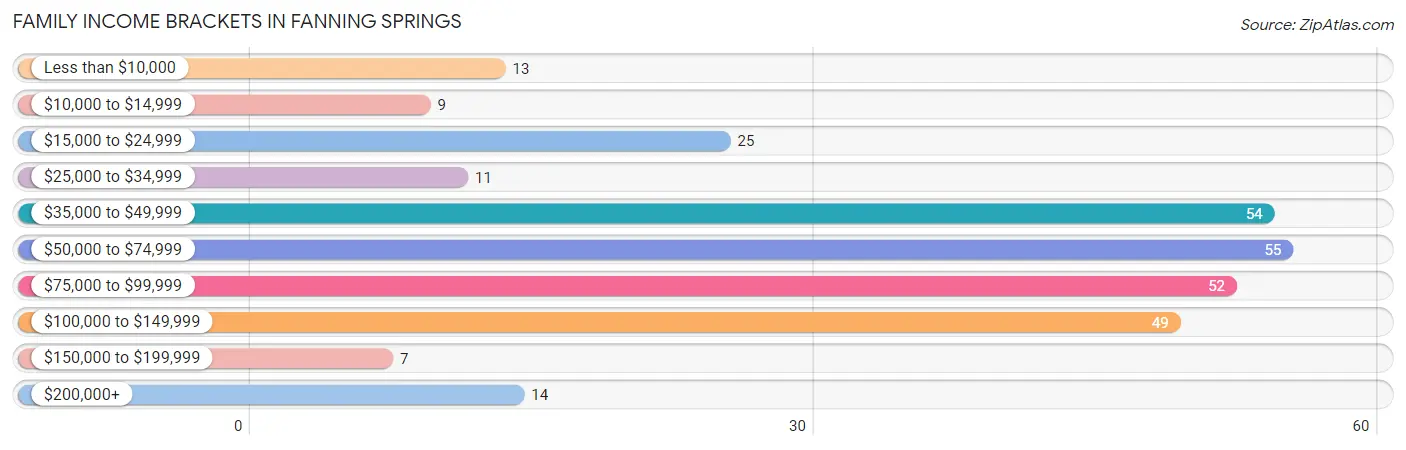
Family Income Brackets in Fanning Springs
According to the Fanning Springs family income data, there are 55 families falling into the $50,000 to $74,999 income range, which is the most common income bracket and makes up 19.0% of all families. Conversely, the $150,000 to $199,999 income bracket is the least frequent group with only 7 families (2.4%) belonging to this category.
| Income Bracket | # Families | % Families |
| Less than $10,000 | 13 | 4.5% |
| $10,000 to $14,999 | 9 | 3.1% |
| $15,000 to $24,999 | 25 | 8.7% |
| $25,000 to $34,999 | 11 | 3.8% |
| $35,000 to $49,999 | 54 | 18.7% |
| $50,000 to $74,999 | 55 | 19.0% |
| $75,000 to $99,999 | 52 | 18.0% |
| $100,000 to $149,999 | 49 | 17.0% |
| $150,000 to $199,999 | 7 | 2.4% |
| $200,000+ | 14 | 4.8% |
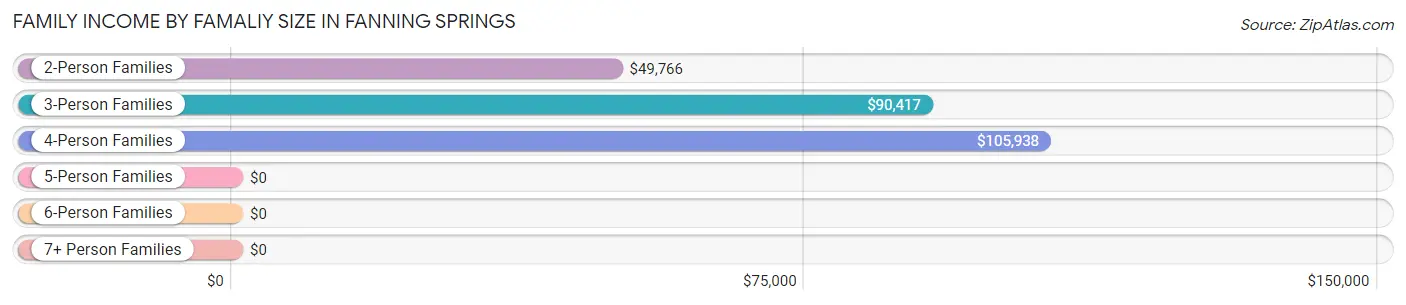
Family Income by Famaliy Size in Fanning Springs
4-person families (27 | 9.3%) account for the highest median family income in Fanning Springs with $105,938 per family, while 3-person families (55 | 19.0%) have the highest median income of $30,139 per family member.
| Income Bracket | # Families | Median Income |
| 2-Person Families | 187 (64.7%) | $49,766 |
| 3-Person Families | 55 (19.0%) | $90,417 |
| 4-Person Families | 27 (9.3%) | $105,938 |
| 5-Person Families | 12 (4.2%) | $0 |
| 6-Person Families | 3 (1.0%) | $0 |
| 7+ Person Families | 5 (1.7%) | $0 |
| Total | 289 (100.0%) | $62,841 |
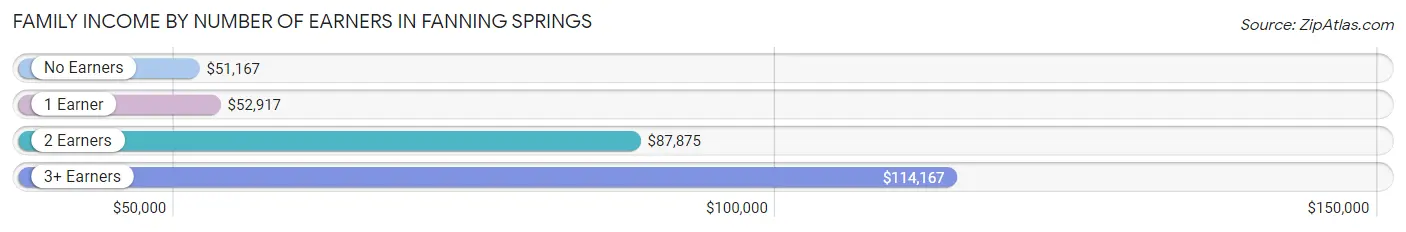
Family Income by Number of Earners in Fanning Springs
The median family income in Fanning Springs is $62,841, with families comprising 3+ earners (36) having the highest median family income of $114,167, while families with no earners (98) have the lowest median family income of $51,167, accounting for 12.5% and 33.9% of families, respectively.
| Number of Earners | # Families | Median Income |
| No Earners | 98 (33.9%) | $51,167 |
| 1 Earner | 93 (32.2%) | $52,917 |
| 2 Earners | 62 (21.4%) | $87,875 |
| 3+ Earners | 36 (12.5%) | $114,167 |
| Total | 289 (100.0%) | $62,841 |
Household Income in Fanning Springs
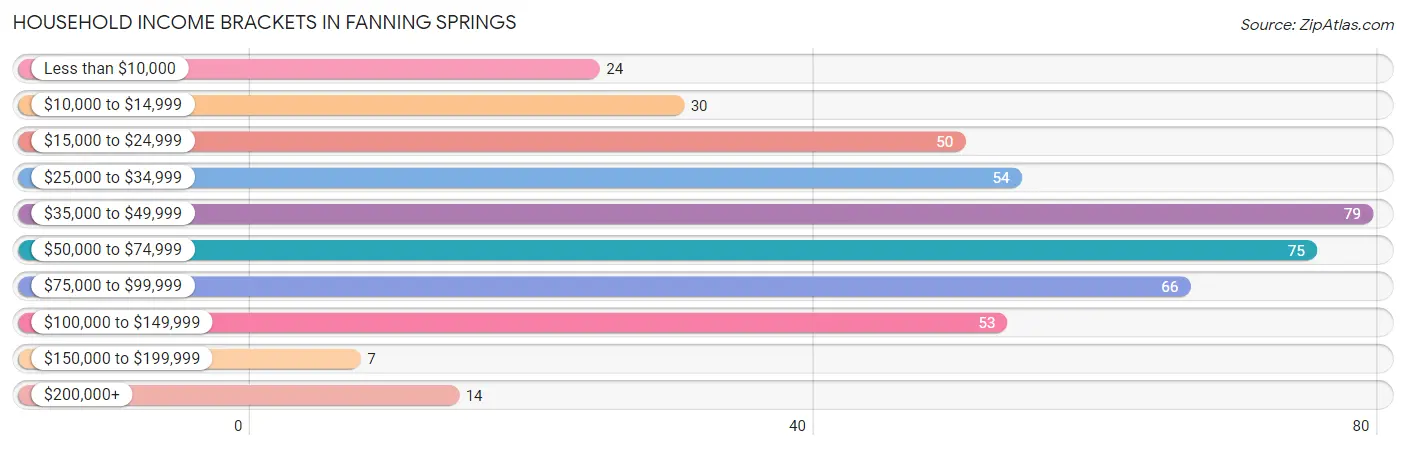
Household Income Brackets in Fanning Springs
With 79 households falling in the category, the $35,000 to $49,999 income range is the most frequent in Fanning Springs, accounting for 17.5% of all households. In contrast, only 7 households (1.5%) fall into the $150,000 to $199,999 income bracket, making it the least populous group.
| Income Bracket | # Households | % Households |
| Less than $10,000 | 24 | 5.3% |
| $10,000 to $14,999 | 30 | 6.6% |
| $15,000 to $24,999 | 50 | 11.1% |
| $25,000 to $34,999 | 54 | 11.9% |
| $35,000 to $49,999 | 79 | 17.5% |
| $50,000 to $74,999 | 75 | 16.6% |
| $75,000 to $99,999 | 66 | 14.6% |
| $100,000 to $149,999 | 53 | 11.7% |
| $150,000 to $199,999 | 7 | 1.5% |
| $200,000+ | 14 | 3.1% |
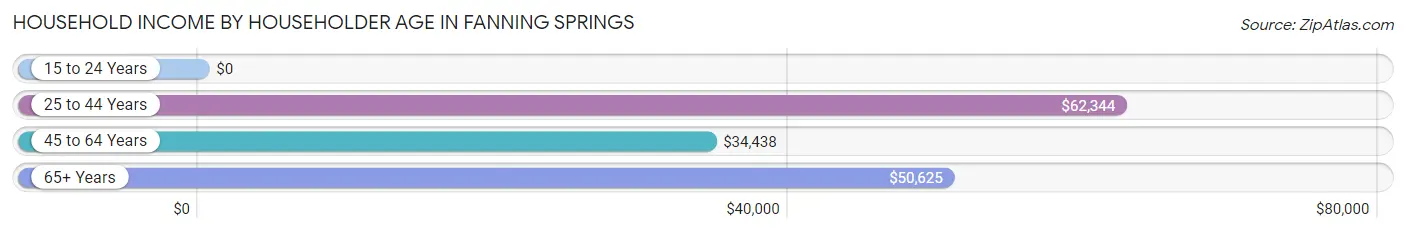
Household Income by Householder Age in Fanning Springs
The median household income in Fanning Springs is $48,281, with the highest median household income of $62,344 found in the 25 to 44 years age bracket for the primary householder. A total of 97 households (21.5%) fall into this category. Meanwhile, the 15 to 24 years age bracket for the primary householder has the lowest median household income of $0, with 16 households (3.5%) in this group.
| Income Bracket | # Households | Median Income |
| 15 to 24 Years | 16 (3.5%) | $0 |
| 25 to 44 Years | 97 (21.5%) | $62,344 |
| 45 to 64 Years | 165 (36.5%) | $34,438 |
| 65+ Years | 174 (38.5%) | $50,625 |
| Total | 452 (100.0%) | $48,281 |
Poverty in Fanning Springs
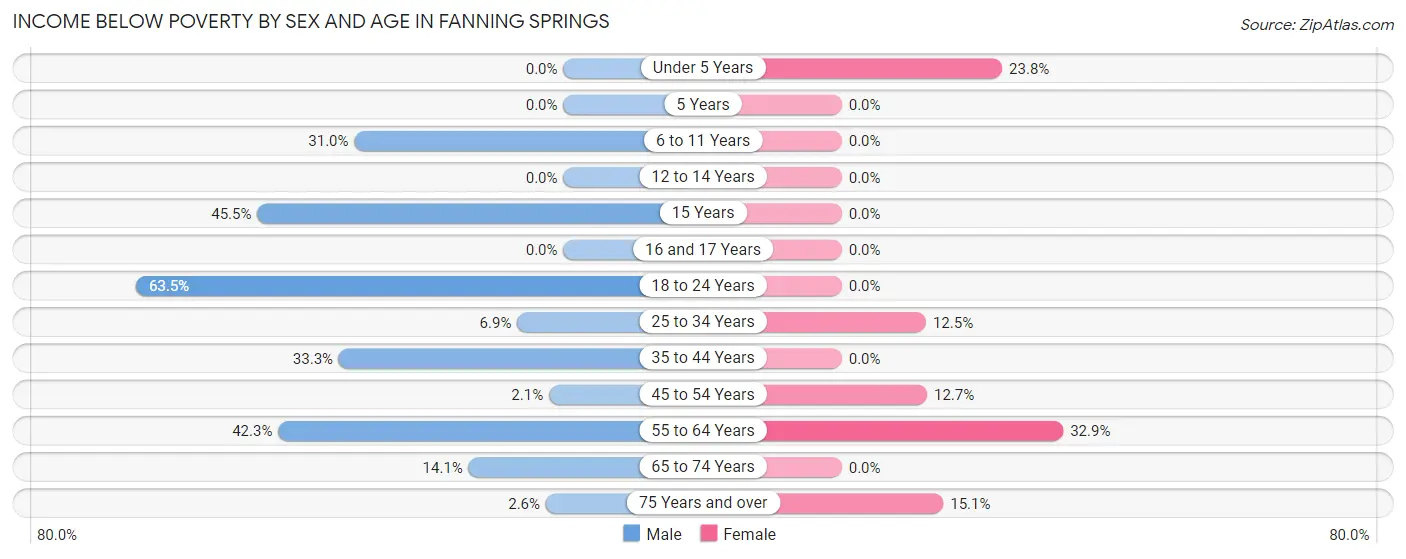
Income Below Poverty by Sex and Age in Fanning Springs
With 22.4% poverty level for males and 12.2% for females among the residents of Fanning Springs, 18 to 24 year old males and 55 to 64 year old females are the most vulnerable to poverty, with 33 males (63.5%) and 24 females (32.9%) in their respective age groups living below the poverty level.
| Age Bracket | Male | Female |
| Under 5 Years | 0 (0.0%) | 5 (23.8%) |
| 5 Years | 0 (0.0%) | 0 (0.0%) |
| 6 to 11 Years | 9 (31.0%) | 0 (0.0%) |
| 12 to 14 Years | 0 (0.0%) | 0 (0.0%) |
| 15 Years | 5 (45.5%) | 0 (0.0%) |
| 16 and 17 Years | 0 (0.0%) | 0 (0.0%) |
| 18 to 24 Years | 33 (63.5%) | 0 (0.0%) |
| 25 to 34 Years | 5 (6.9%) | 7 (12.5%) |
| 35 to 44 Years | 13 (33.3%) | 0 (0.0%) |
| 45 to 54 Years | 1 (2.1%) | 10 (12.7%) |
| 55 to 64 Years | 47 (42.3%) | 24 (32.9%) |
| 65 to 74 Years | 9 (14.1%) | 0 (0.0%) |
| 75 Years and over | 2 (2.6%) | 11 (15.1%) |
| Total | 124 (22.4%) | 57 (12.2%) |
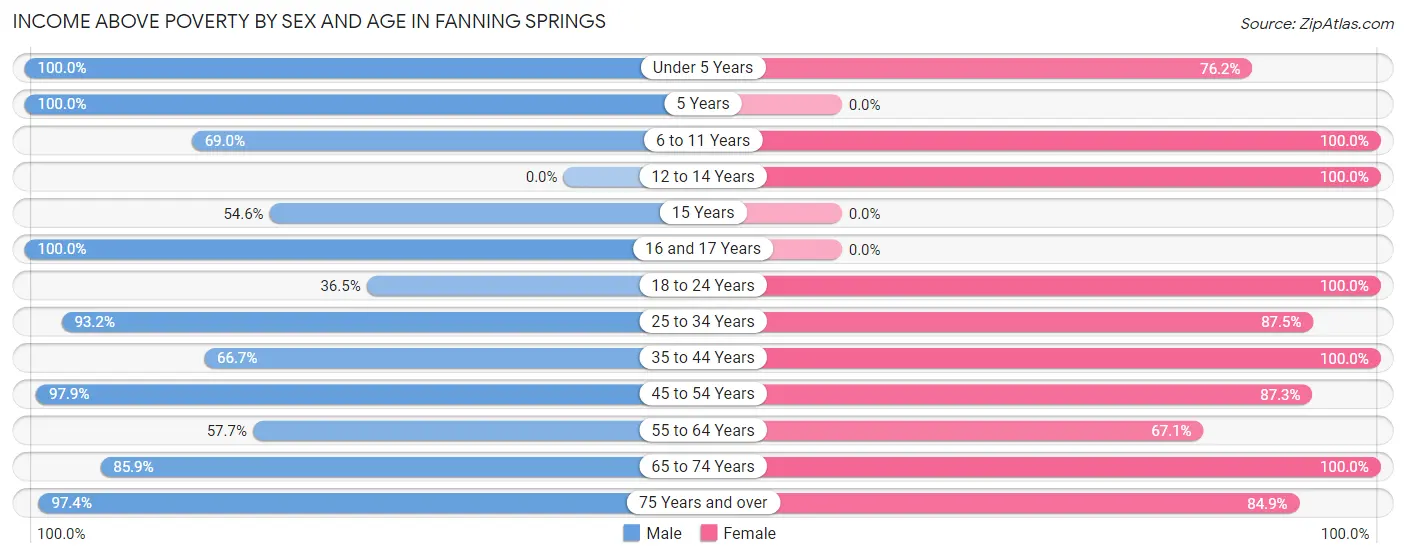
Income Above Poverty by Sex and Age in Fanning Springs
According to the poverty statistics in Fanning Springs, males aged under 5 years and females aged 6 to 11 years are the age groups that are most secure financially, with 100.0% of males and 100.0% of females in these age groups living above the poverty line.
| Age Bracket | Male | Female |
| Under 5 Years | 25 (100.0%) | 16 (76.2%) |
| 5 Years | 13 (100.0%) | 0 (0.0%) |
| 6 to 11 Years | 20 (69.0%) | 16 (100.0%) |
| 12 to 14 Years | 0 (0.0%) | 3 (100.0%) |
| 15 Years | 6 (54.5%) | 0 (0.0%) |
| 16 and 17 Years | 12 (100.0%) | 0 (0.0%) |
| 18 to 24 Years | 19 (36.5%) | 30 (100.0%) |
| 25 to 34 Years | 68 (93.1%) | 49 (87.5%) |
| 35 to 44 Years | 26 (66.7%) | 43 (100.0%) |
| 45 to 54 Years | 46 (97.9%) | 69 (87.3%) |
| 55 to 64 Years | 64 (57.7%) | 49 (67.1%) |
| 65 to 74 Years | 55 (85.9%) | 72 (100.0%) |
| 75 Years and over | 75 (97.4%) | 62 (84.9%) |
| Total | 429 (77.6%) | 409 (87.8%) |
Income Below Poverty Among Married-Couple Families in Fanning Springs
The poverty statistics for married-couple families in Fanning Springs show that 9.0% or 21 of the total 233 families live below the poverty line. Families with no children have the highest poverty rate of 12.5%, comprising of 21 families. On the other hand, families with 1 or 2 children have the lowest poverty rate of 0.0%, which includes 0 families.
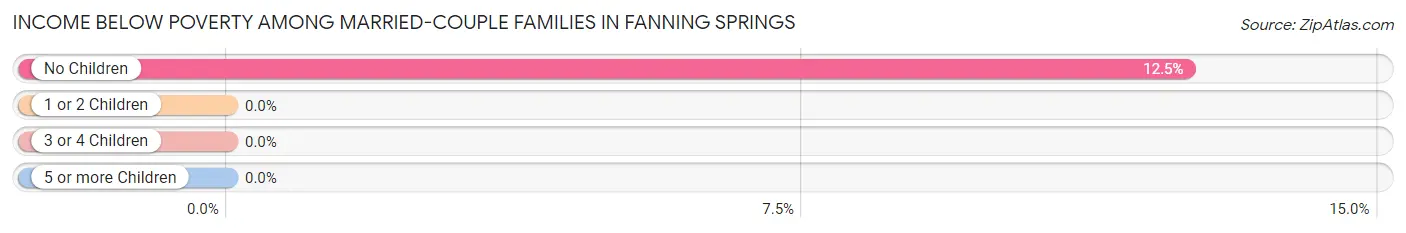
| Children | Above Poverty | Below Poverty |
| No Children | 147 (87.5%) | 21 (12.5%) |
| 1 or 2 Children | 51 (100.0%) | 0 (0.0%) |
| 3 or 4 Children | 14 (100.0%) | 0 (0.0%) |
| 5 or more Children | 0 (0.0%) | 0 (0.0%) |
| Total | 212 (91.0%) | 21 (9.0%) |
Income Below Poverty Among Single-Parent Households in Fanning Springs
According to the poverty data in Fanning Springs, 61.9% or 13 single-father households and 11.4% or 4 single-mother households are living below the poverty line. Among single-father households, those with 1 or 2 children have the highest poverty rate, with 13 households (61.9%) experiencing poverty. Likewise, among single-mother households, those with 3 or 4 children have the highest poverty rate, with 4 households (100.0%) falling below the poverty line.
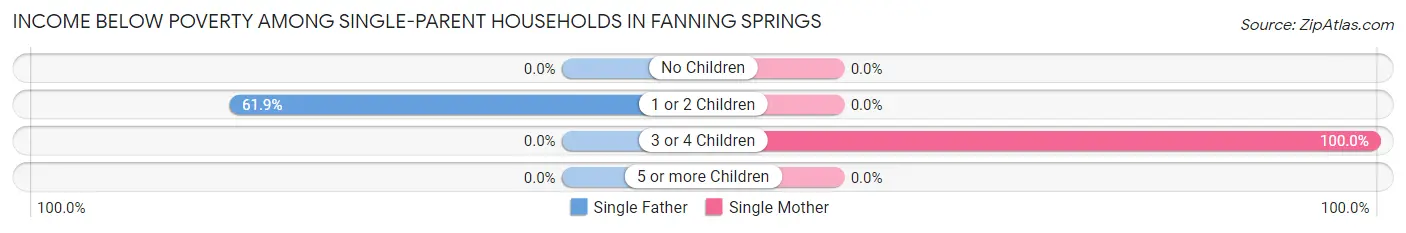
| Children | Single Father | Single Mother |
| No Children | 0 (0.0%) | 0 (0.0%) |
| 1 or 2 Children | 13 (61.9%) | 0 (0.0%) |
| 3 or 4 Children | 0 (0.0%) | 4 (100.0%) |
| 5 or more Children | 0 (0.0%) | 0 (0.0%) |
| Total | 13 (61.9%) | 4 (11.4%) |
Income Below Poverty Among Married-Couple vs Single-Parent Households in Fanning Springs
The poverty data for Fanning Springs shows that 21 of the married-couple family households (9.0%) and 17 of the single-parent households (30.4%) are living below the poverty level. Within the married-couple family households, those with no children have the highest poverty rate, with 21 households (12.5%) falling below the poverty line. Among the single-parent households, those with 3 or 4 children have the highest poverty rate, with 4 household (100.0%) living below poverty.
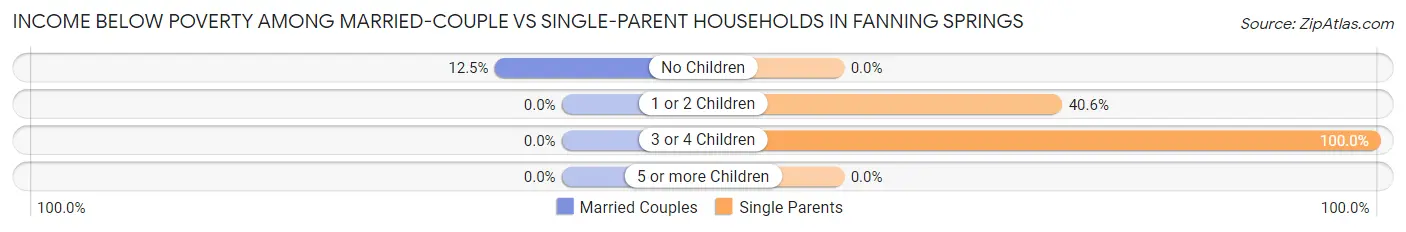
| Children | Married-Couple Families | Single-Parent Households |
| No Children | 21 (12.5%) | 0 (0.0%) |
| 1 or 2 Children | 0 (0.0%) | 13 (40.6%) |
| 3 or 4 Children | 0 (0.0%) | 4 (100.0%) |
| 5 or more Children | 0 (0.0%) | 0 (0.0%) |
| Total | 21 (9.0%) | 17 (30.4%) |
Employment Characteristics in Fanning Springs
Employment by Class of Employer in Fanning Springs
Among the 418 employed individuals in Fanning Springs, private company employees (303 | 72.5%), local government employees (43 | 10.3%), and self-employed (not incorporated) (21 | 5.0%) make up the most common classes of employment.
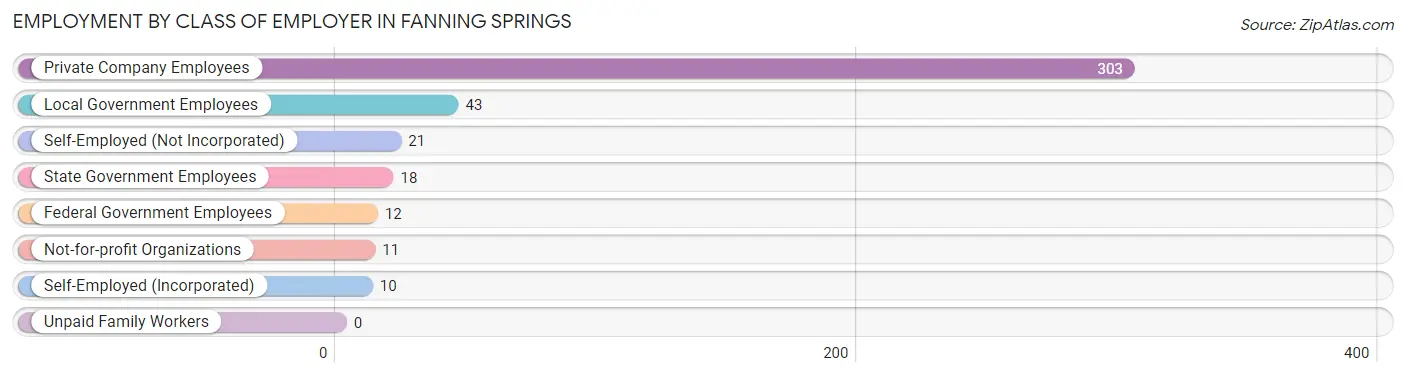
| Employer Class | # Employees | % Employees |
| Private Company Employees | 303 | 72.5% |
| Self-Employed (Incorporated) | 10 | 2.4% |
| Self-Employed (Not Incorporated) | 21 | 5.0% |
| Not-for-profit Organizations | 11 | 2.6% |
| Local Government Employees | 43 | 10.3% |
| State Government Employees | 18 | 4.3% |
| Federal Government Employees | 12 | 2.9% |
| Unpaid Family Workers | 0 | 0.0% |
| Total | 418 | 100.0% |
Employment Status by Age in Fanning Springs
According to the labor force statistics for Fanning Springs, out of the total population over 16 years of age (996), 45.0% or 448 individuals are in the labor force, with 4.0% or 18 of them unemployed. The age group with the highest labor force participation rate is 20 to 24 years, with 100.0% or 71 individuals in the labor force. Within the labor force, the 35 to 44 years age range has the highest percentage of unemployed individuals, with 18.3% or 13 of them being unemployed.
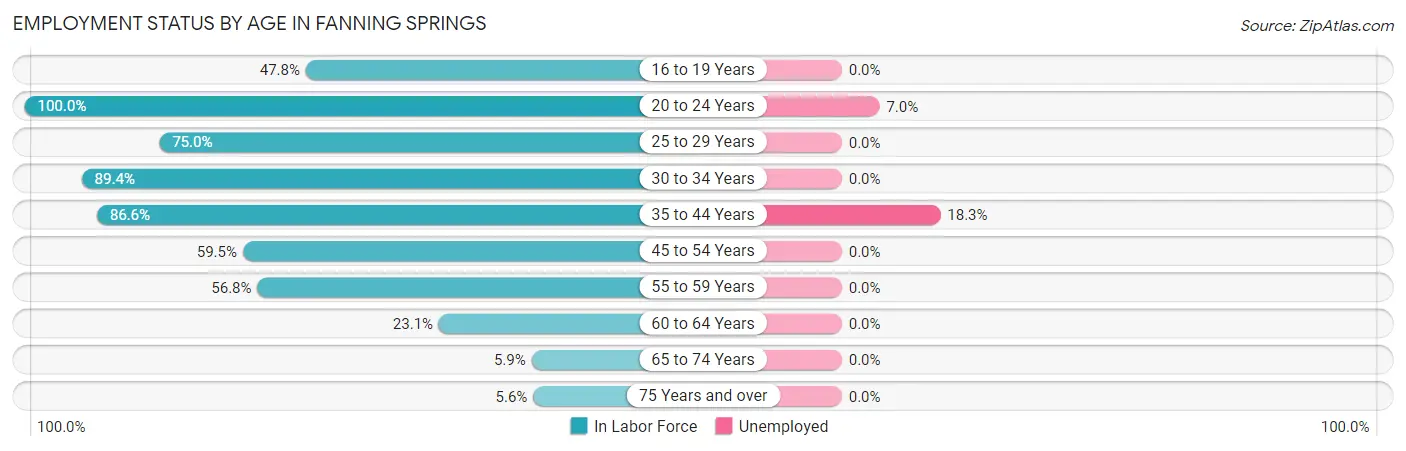
| Age Bracket | In Labor Force | Unemployed |
| 16 to 19 Years | 11 (47.8%) | 0 (0.0%) |
| 20 to 24 Years | 71 (100.0%) | 5 (7.0%) |
| 25 to 29 Years | 33 (75.0%) | 0 (0.0%) |
| 30 to 34 Years | 76 (89.4%) | 0 (0.0%) |
| 35 to 44 Years | 71 (86.6%) | 13 (18.3%) |
| 45 to 54 Years | 75 (59.5%) | 0 (0.0%) |
| 55 to 59 Years | 75 (56.8%) | 0 (0.0%) |
| 60 to 64 Years | 15 (23.1%) | 0 (0.0%) |
| 65 to 74 Years | 8 (5.9%) | 0 (0.0%) |
| 75 Years and over | 13 (5.6%) | 0 (0.0%) |
| Total | 448 (45.0%) | 18 (4.0%) |
Employment Status by Educational Attainment in Fanning Springs
According to labor force statistics for Fanning Springs, 64.6% of individuals (345) out of the total population between 25 and 64 years of age (534) are in the labor force, with 3.8% or 13 of them being unemployed. The group with the highest labor force participation rate are those with the educational attainment of less than high school, with 70.4% or 57 individuals in the labor force. Within the labor force, individuals with less than high school education have the highest percentage of unemployment, with 22.8% or 13 of them being unemployed.
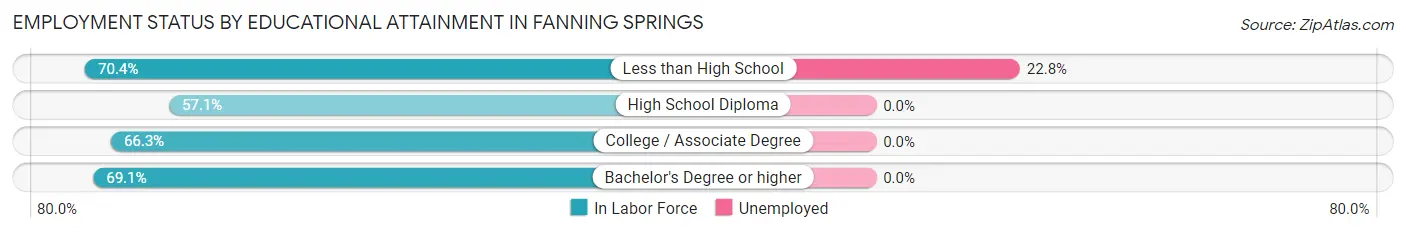
| Educational Attainment | In Labor Force | Unemployed |
| Less than High School | 57 (70.4%) | 18 (22.8%) |
| High School Diploma | 93 (57.1%) | 0 (0.0%) |
| College / Associate Degree | 130 (66.3%) | 0 (0.0%) |
| Bachelor's Degree or higher | 65 (69.1%) | 0 (0.0%) |
| Total | 345 (64.6%) | 20 (3.8%) |
Employment Occupations by Sex in Fanning Springs
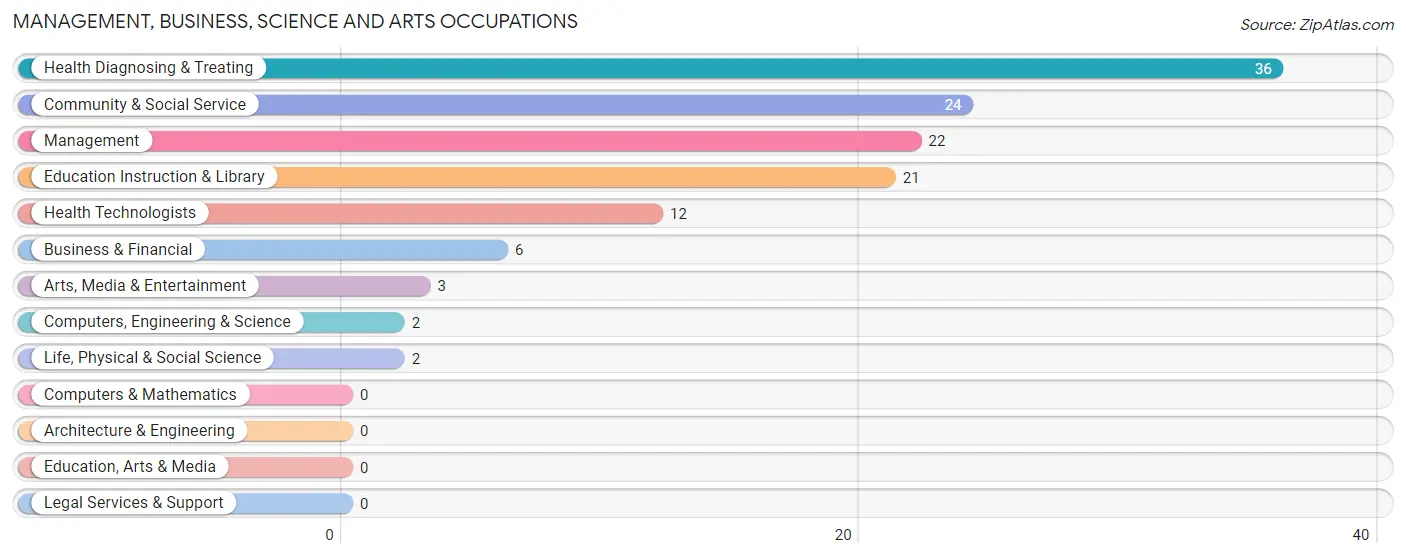
Management, Business, Science and Arts Occupations
The most common Management, Business, Science and Arts occupations in Fanning Springs are Health Diagnosing & Treating (36 | 8.4%), Community & Social Service (24 | 5.6%), Management (22 | 5.1%), Education Instruction & Library (21 | 4.9%), and Health Technologists (12 | 2.8%).
Management, Business, Science and Arts Occupations by Sex
Within the Management, Business, Science and Arts occupations in Fanning Springs, the most male-oriented occupations are Computers, Engineering & Science (100.0%), Life, Physical & Social Science (100.0%), and Arts, Media & Entertainment (100.0%), while the most female-oriented occupations are Health Diagnosing & Treating (100.0%), Health Technologists (100.0%), and Education Instruction & Library (90.5%).

| Occupation | Male | Female |
| Management | 19 (86.4%) | 3 (13.6%) |
| Business & Financial | 3 (50.0%) | 3 (50.0%) |
| Computers, Engineering & Science | 2 (100.0%) | 0 (0.0%) |
| Computers & Mathematics | 0 (0.0%) | 0 (0.0%) |
| Architecture & Engineering | 0 (0.0%) | 0 (0.0%) |
| Life, Physical & Social Science | 2 (100.0%) | 0 (0.0%) |
| Community & Social Service | 5 (20.8%) | 19 (79.2%) |
| Education, Arts & Media | 0 (0.0%) | 0 (0.0%) |
| Legal Services & Support | 0 (0.0%) | 0 (0.0%) |
| Education Instruction & Library | 2 (9.5%) | 19 (90.5%) |
| Arts, Media & Entertainment | 3 (100.0%) | 0 (0.0%) |
| Health Diagnosing & Treating | 0 (0.0%) | 36 (100.0%) |
| Health Technologists | 0 (0.0%) | 12 (100.0%) |
| Total (Category) | 29 (32.2%) | 61 (67.8%) |
| Total (Overall) | 250 (58.1%) | 180 (41.9%) |
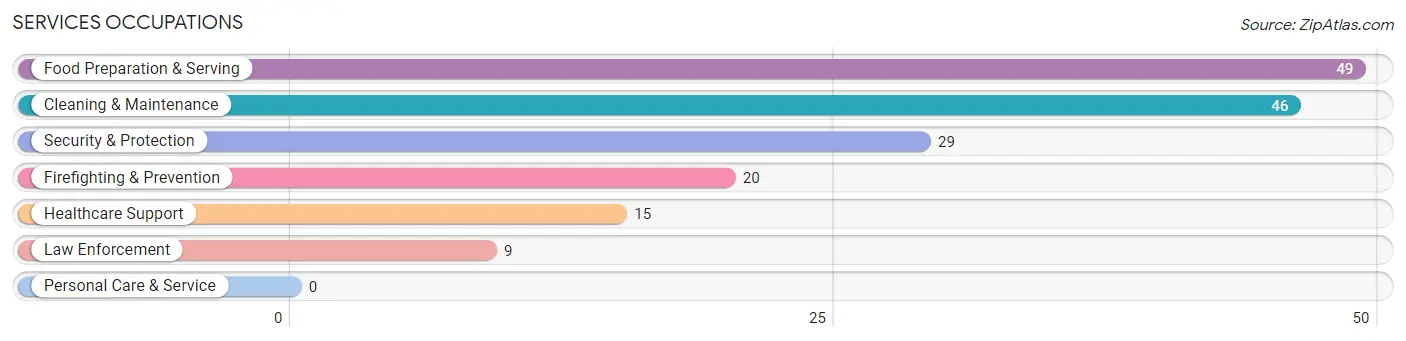
Services Occupations
The most common Services occupations in Fanning Springs are Food Preparation & Serving (49 | 11.4%), Cleaning & Maintenance (46 | 10.7%), Security & Protection (29 | 6.7%), Firefighting & Prevention (20 | 4.6%), and Healthcare Support (15 | 3.5%).
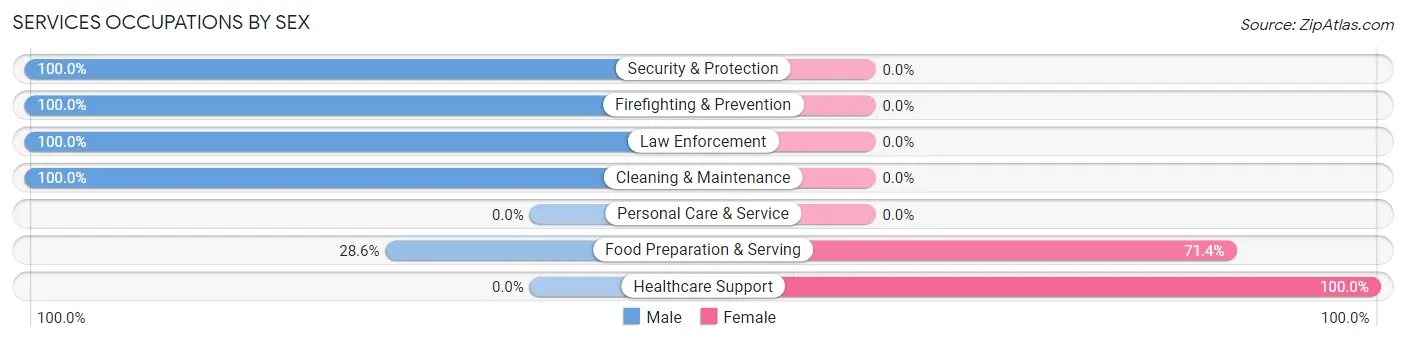
Services Occupations by Sex
Within the Services occupations in Fanning Springs, the most male-oriented occupations are Security & Protection (100.0%), Firefighting & Prevention (100.0%), and Law Enforcement (100.0%), while the most female-oriented occupations are Healthcare Support (100.0%), and Food Preparation & Serving (71.4%).
| Occupation | Male | Female |
| Healthcare Support | 0 (0.0%) | 15 (100.0%) |
| Security & Protection | 29 (100.0%) | 0 (0.0%) |
| Firefighting & Prevention | 20 (100.0%) | 0 (0.0%) |
| Law Enforcement | 9 (100.0%) | 0 (0.0%) |
| Food Preparation & Serving | 14 (28.6%) | 35 (71.4%) |
| Cleaning & Maintenance | 46 (100.0%) | 0 (0.0%) |
| Personal Care & Service | 0 (0.0%) | 0 (0.0%) |
| Total (Category) | 89 (64.0%) | 50 (36.0%) |
| Total (Overall) | 250 (58.1%) | 180 (41.9%) |
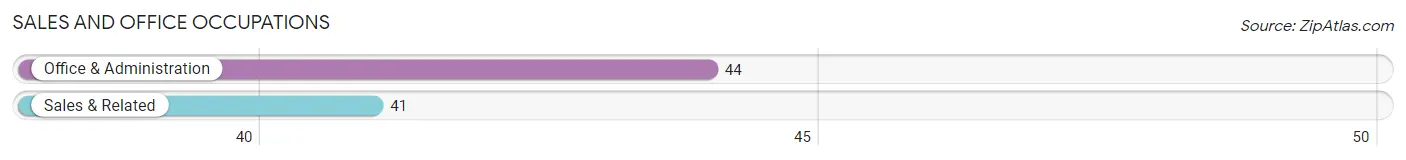
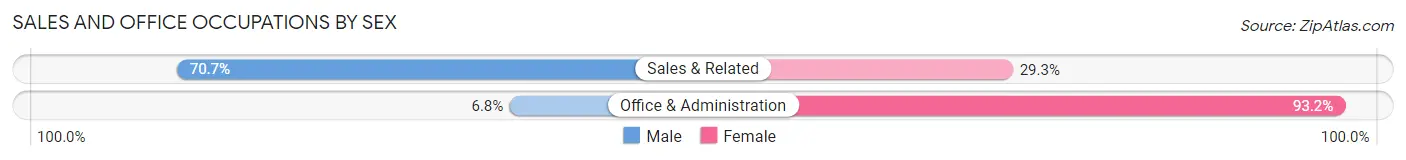
Sales and Office Occupations
The most common Sales and Office occupations in Fanning Springs are Office & Administration (44 | 10.2%), and Sales & Related (41 | 9.5%).
Sales and Office Occupations by Sex
| Occupation | Male | Female |
| Sales & Related | 29 (70.7%) | 12 (29.3%) |
| Office & Administration | 3 (6.8%) | 41 (93.2%) |
| Total (Category) | 32 (37.7%) | 53 (62.4%) |
| Total (Overall) | 250 (58.1%) | 180 (41.9%) |
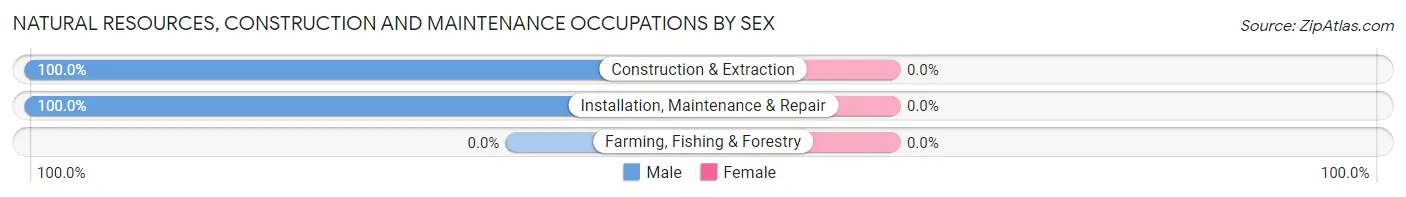
Natural Resources, Construction and Maintenance Occupations
The most common Natural Resources, Construction and Maintenance occupations in Fanning Springs are Construction & Extraction (36 | 8.4%), and Installation, Maintenance & Repair (29 | 6.7%).

Natural Resources, Construction and Maintenance Occupations by Sex
| Occupation | Male | Female |
| Farming, Fishing & Forestry | 0 (0.0%) | 0 (0.0%) |
| Construction & Extraction | 36 (100.0%) | 0 (0.0%) |
| Installation, Maintenance & Repair | 29 (100.0%) | 0 (0.0%) |
| Total (Category) | 65 (100.0%) | 0 (0.0%) |
| Total (Overall) | 250 (58.1%) | 180 (41.9%) |
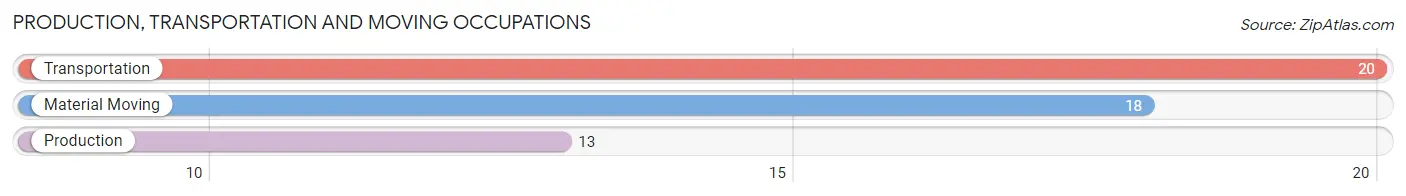
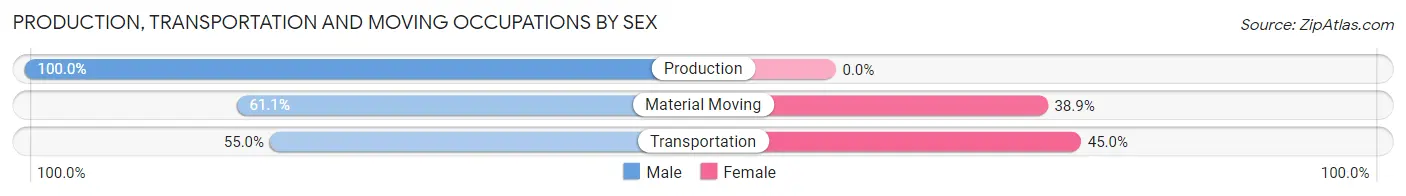
Production, Transportation and Moving Occupations
The most common Production, Transportation and Moving occupations in Fanning Springs are Transportation (20 | 4.6%), Material Moving (18 | 4.2%), and Production (13 | 3.0%).
Production, Transportation and Moving Occupations by Sex
| Occupation | Male | Female |
| Production | 13 (100.0%) | 0 (0.0%) |
| Transportation | 11 (55.0%) | 9 (45.0%) |
| Material Moving | 11 (61.1%) | 7 (38.9%) |
| Total (Category) | 35 (68.6%) | 16 (31.4%) |
| Total (Overall) | 250 (58.1%) | 180 (41.9%) |
Employment Industries by Sex in Fanning Springs
Employment Industries in Fanning Springs
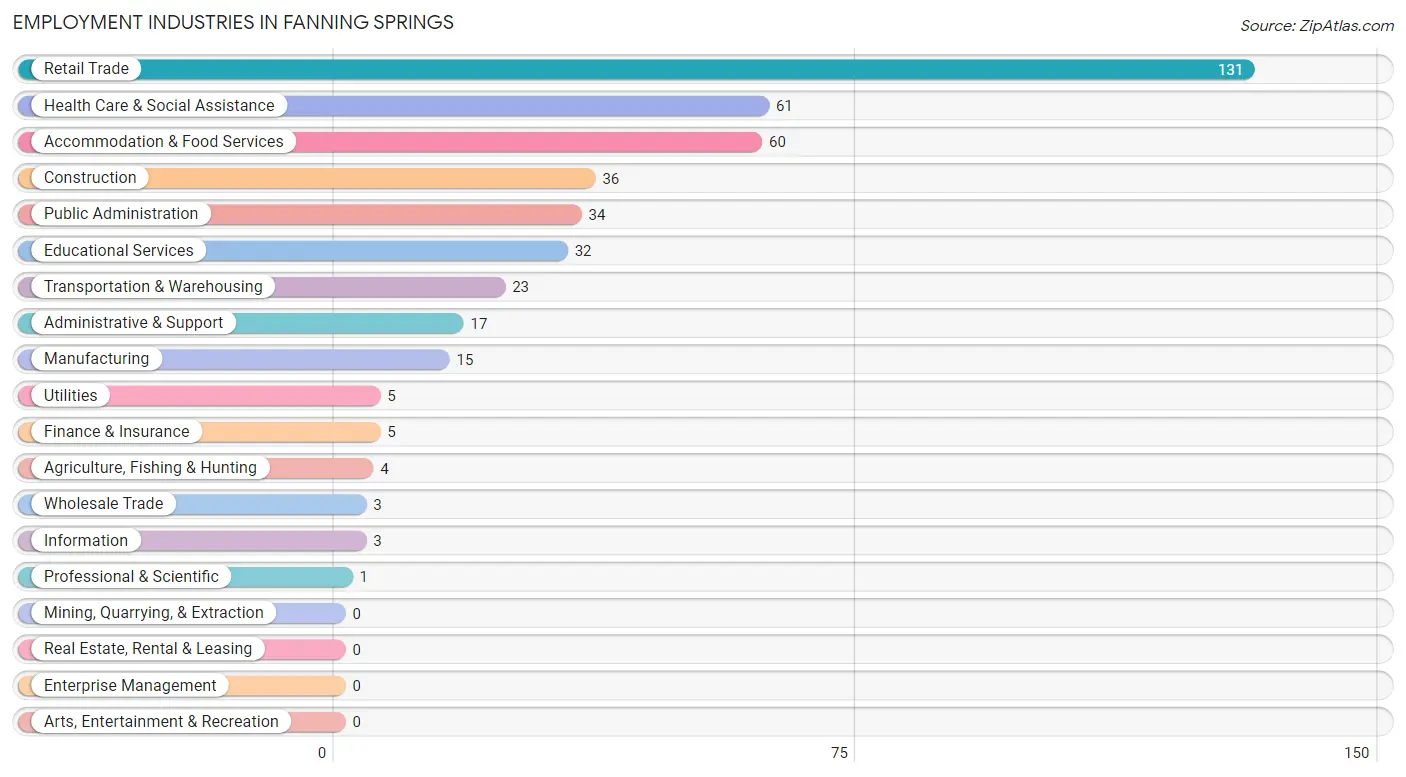
The major employment industries in Fanning Springs include Retail Trade (131 | 30.5%), Health Care & Social Assistance (61 | 14.2%), Accommodation & Food Services (60 | 14.0%), Construction (36 | 8.4%), and Public Administration (34 | 7.9%).
Employment Industries by Sex in Fanning Springs
The Fanning Springs industries that see more men than women are Agriculture, Fishing & Hunting (100.0%), Construction (100.0%), and Wholesale Trade (100.0%), whereas the industries that tend to have a higher number of women are Educational Services (84.4%), Health Care & Social Assistance (82.0%), and Accommodation & Food Services (71.7%).
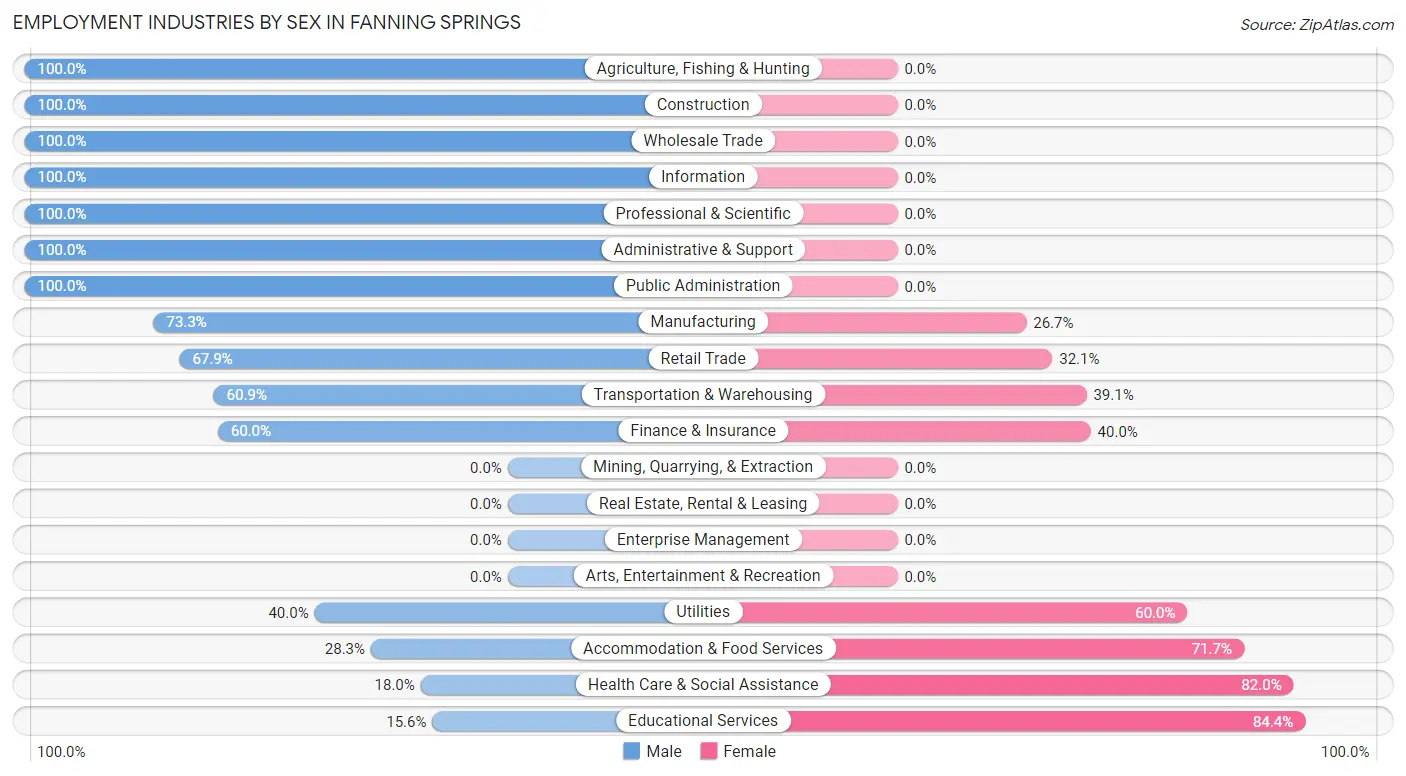
| Industry | Male | Female |
| Agriculture, Fishing & Hunting | 4 (100.0%) | 0 (0.0%) |
| Mining, Quarrying, & Extraction | 0 (0.0%) | 0 (0.0%) |
| Construction | 36 (100.0%) | 0 (0.0%) |
| Manufacturing | 11 (73.3%) | 4 (26.7%) |
| Wholesale Trade | 3 (100.0%) | 0 (0.0%) |
| Retail Trade | 89 (67.9%) | 42 (32.1%) |
| Transportation & Warehousing | 14 (60.9%) | 9 (39.1%) |
| Utilities | 2 (40.0%) | 3 (60.0%) |
| Information | 3 (100.0%) | 0 (0.0%) |
| Finance & Insurance | 3 (60.0%) | 2 (40.0%) |
| Real Estate, Rental & Leasing | 0 (0.0%) | 0 (0.0%) |
| Professional & Scientific | 1 (100.0%) | 0 (0.0%) |
| Enterprise Management | 0 (0.0%) | 0 (0.0%) |
| Administrative & Support | 17 (100.0%) | 0 (0.0%) |
| Educational Services | 5 (15.6%) | 27 (84.4%) |
| Health Care & Social Assistance | 11 (18.0%) | 50 (82.0%) |
| Arts, Entertainment & Recreation | 0 (0.0%) | 0 (0.0%) |
| Accommodation & Food Services | 17 (28.3%) | 43 (71.7%) |
| Public Administration | 34 (100.0%) | 0 (0.0%) |
| Total | 250 (58.1%) | 180 (41.9%) |
Education in Fanning Springs
School Enrollment in Fanning Springs
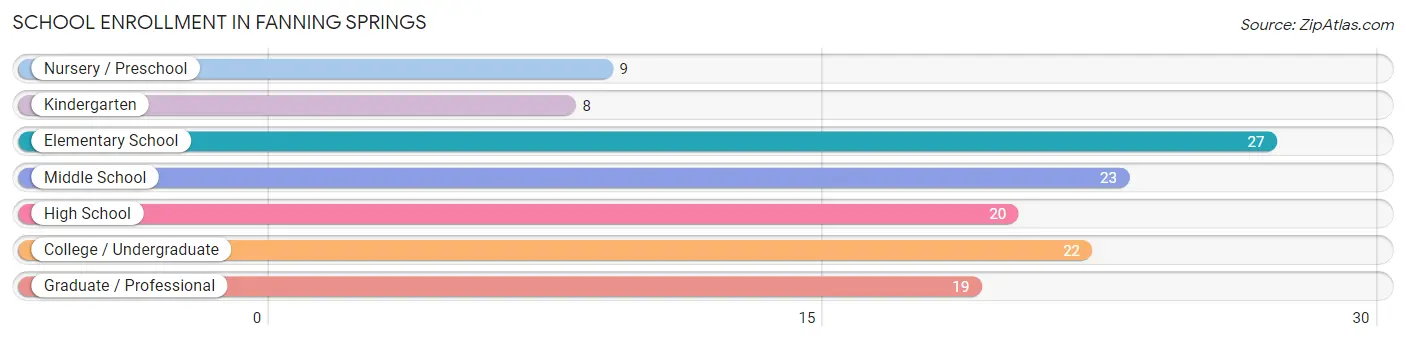
The most common levels of schooling among the 128 students in Fanning Springs are elementary school (27 | 21.1%), middle school (23 | 18.0%), and college / undergraduate (22 | 17.2%).
| School Level | # Students | % Students |
| Nursery / Preschool | 9 | 7.0% |
| Kindergarten | 8 | 6.2% |
| Elementary School | 27 | 21.1% |
| Middle School | 23 | 18.0% |
| High School | 20 | 15.6% |
| College / Undergraduate | 22 | 17.2% |
| Graduate / Professional | 19 | 14.8% |
| Total | 128 | 100.0% |
School Enrollment by Age by Funding Source in Fanning Springs
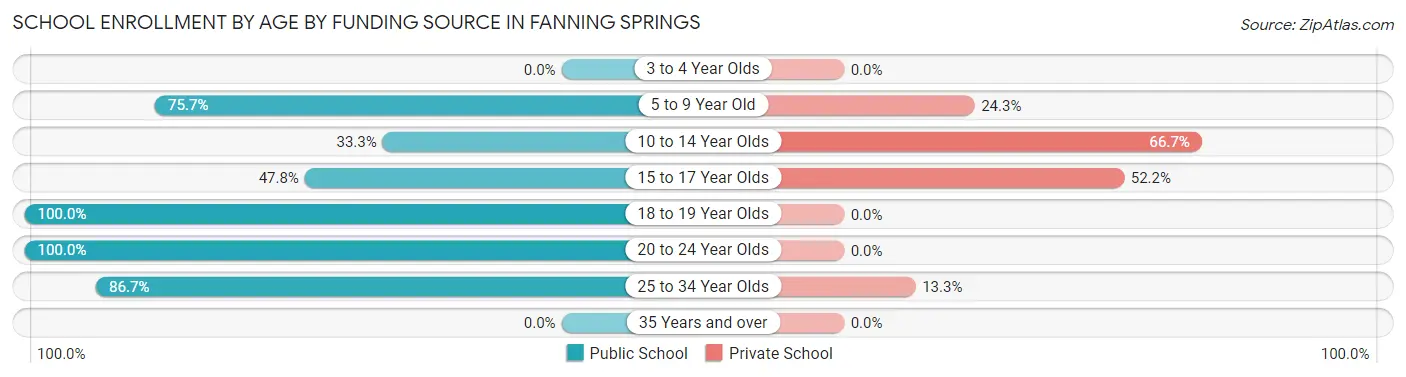
Out of a total of 128 students who are enrolled in schools in Fanning Springs, 41 (32.0%) attend a private institution, while the remaining 87 (68.0%) are enrolled in public schools. The age group of 10 to 14 year olds has the highest likelihood of being enrolled in private schools, with 16 (66.7% in the age bracket) enrolled. Conversely, the age group of 18 to 19 year olds has the lowest likelihood of being enrolled in a private school, with 11 (100.0% in the age bracket) attending a public institution.
| Age Bracket | Public School | Private School |
| 3 to 4 Year Olds | 0 (0.0%) | 0 (0.0%) |
| 5 to 9 Year Old | 28 (75.7%) | 9 (24.3%) |
| 10 to 14 Year Olds | 8 (33.3%) | 16 (66.7%) |
| 15 to 17 Year Olds | 11 (47.8%) | 12 (52.2%) |
| 18 to 19 Year Olds | 11 (100.0%) | 0 (0.0%) |
| 20 to 24 Year Olds | 3 (100.0%) | 0 (0.0%) |
| 25 to 34 Year Olds | 26 (86.7%) | 4 (13.3%) |
| 35 Years and over | 0 (0.0%) | 0 (0.0%) |
| Total | 87 (68.0%) | 41 (32.0%) |
Educational Attainment by Field of Study in Fanning Springs
Education (32 | 18.1%), science & technology (31 | 17.5%), social sciences (30 | 17.0%), business (23 | 13.0%), and liberal arts & history (18 | 10.2%) are the most common fields of study among 177 individuals in Fanning Springs who have obtained a bachelor's degree or higher.
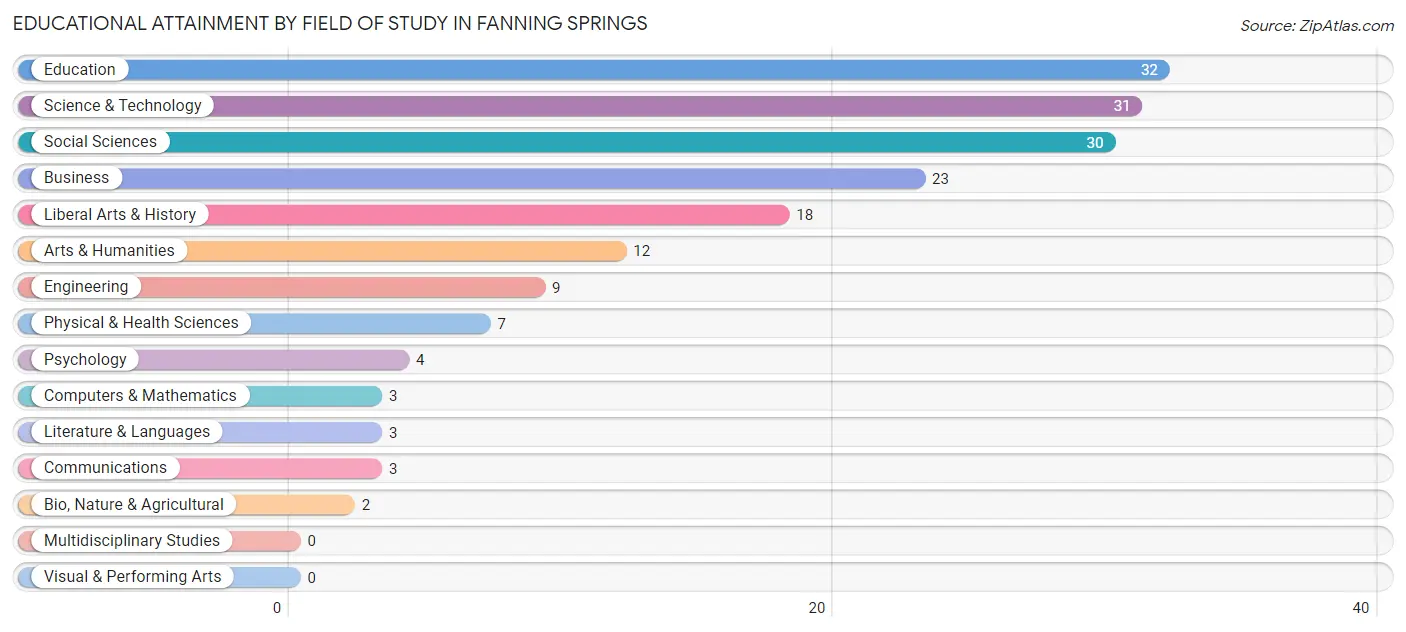
| Field of Study | # Graduates | % Graduates |
| Computers & Mathematics | 3 | 1.7% |
| Bio, Nature & Agricultural | 2 | 1.1% |
| Physical & Health Sciences | 7 | 4.0% |
| Psychology | 4 | 2.3% |
| Social Sciences | 30 | 17.0% |
| Engineering | 9 | 5.1% |
| Multidisciplinary Studies | 0 | 0.0% |
| Science & Technology | 31 | 17.5% |
| Business | 23 | 13.0% |
| Education | 32 | 18.1% |
| Literature & Languages | 3 | 1.7% |
| Liberal Arts & History | 18 | 10.2% |
| Visual & Performing Arts | 0 | 0.0% |
| Communications | 3 | 1.7% |
| Arts & Humanities | 12 | 6.8% |
| Total | 177 | 100.0% |
Transportation & Commute in Fanning Springs
Vehicle Availability by Sex in Fanning Springs
The most prevalent vehicle ownership categories in Fanning Springs are males with 2 vehicles (87, accounting for 35.8%) and females with 2 vehicles (52, making up 49.7%).
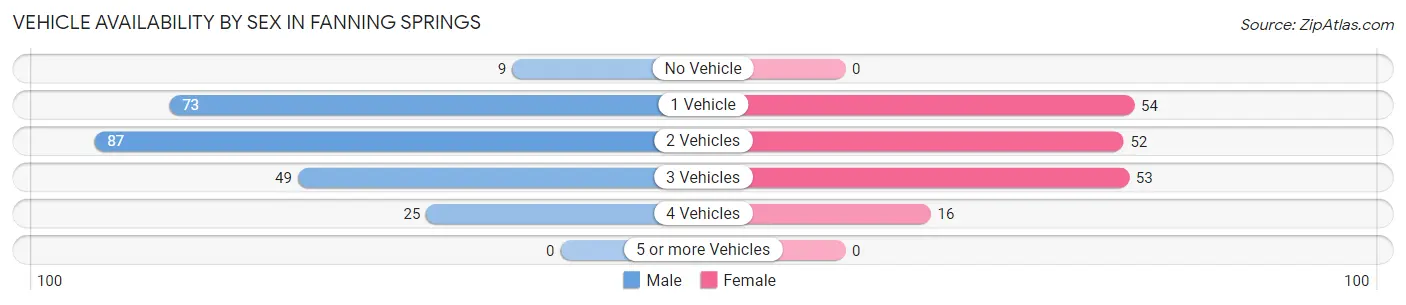
| Vehicles Available | Male | Female |
| No Vehicle | 9 (3.7%) | 0 (0.0%) |
| 1 Vehicle | 73 (30.0%) | 54 (30.9%) |
| 2 Vehicles | 87 (35.8%) | 52 (29.7%) |
| 3 Vehicles | 49 (20.2%) | 53 (30.3%) |
| 4 Vehicles | 25 (10.3%) | 16 (9.1%) |
| 5 or more Vehicles | 0 (0.0%) | 0 (0.0%) |
| Total | 243 (100.0%) | 175 (100.0%) |
Commute Time in Fanning Springs
The most frequently occuring commute durations in Fanning Springs are 15 to 19 minutes (84 commuters, 20.1%), 10 to 14 minutes (76 commuters, 18.2%), and 5 to 9 minutes (45 commuters, 10.8%).
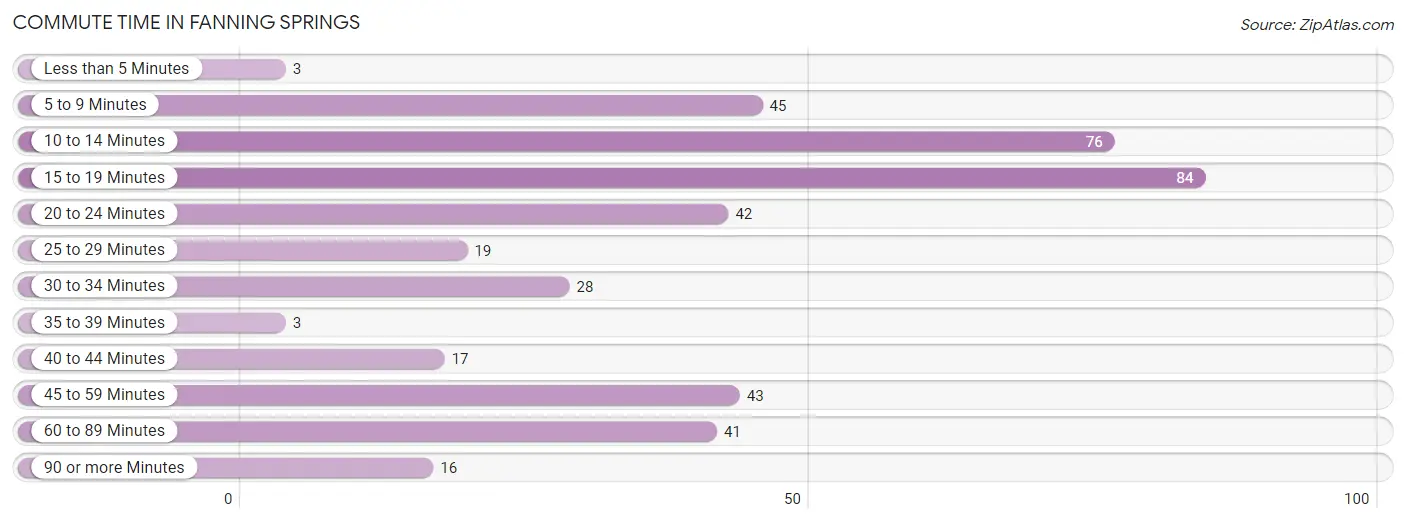
| Commute Time | # Commuters | % Commuters |
| Less than 5 Minutes | 3 | 0.7% |
| 5 to 9 Minutes | 45 | 10.8% |
| 10 to 14 Minutes | 76 | 18.2% |
| 15 to 19 Minutes | 84 | 20.1% |
| 20 to 24 Minutes | 42 | 10.1% |
| 25 to 29 Minutes | 19 | 4.6% |
| 30 to 34 Minutes | 28 | 6.7% |
| 35 to 39 Minutes | 3 | 0.7% |
| 40 to 44 Minutes | 17 | 4.1% |
| 45 to 59 Minutes | 43 | 10.3% |
| 60 to 89 Minutes | 41 | 9.8% |
| 90 or more Minutes | 16 | 3.8% |
Commute Time by Sex in Fanning Springs
The most common commute times in Fanning Springs are 10 to 14 minutes (50 commuters, 20.7%) for males and 15 to 19 minutes (57 commuters, 32.6%) for females.

| Commute Time | Male | Female |
| Less than 5 Minutes | 3 (1.2%) | 0 (0.0%) |
| 5 to 9 Minutes | 21 (8.7%) | 24 (13.7%) |
| 10 to 14 Minutes | 50 (20.7%) | 26 (14.9%) |
| 15 to 19 Minutes | 27 (11.2%) | 57 (32.6%) |
| 20 to 24 Minutes | 29 (12.0%) | 13 (7.4%) |
| 25 to 29 Minutes | 15 (6.2%) | 4 (2.3%) |
| 30 to 34 Minutes | 19 (7.9%) | 9 (5.1%) |
| 35 to 39 Minutes | 0 (0.0%) | 3 (1.7%) |
| 40 to 44 Minutes | 17 (7.0%) | 0 (0.0%) |
| 45 to 59 Minutes | 18 (7.4%) | 25 (14.3%) |
| 60 to 89 Minutes | 29 (12.0%) | 12 (6.9%) |
| 90 or more Minutes | 14 (5.8%) | 2 (1.1%) |
Time of Departure to Work by Sex in Fanning Springs
The most frequent times of departure to work in Fanning Springs are 7:00 AM to 7:29 AM (43, 17.8%) for males and 7:00 AM to 7:29 AM (31, 17.7%) for females.

| Time of Departure | Male | Female |
| 12:00 AM to 4:59 AM | 9 (3.7%) | 3 (1.7%) |
| 5:00 AM to 5:29 AM | 3 (1.2%) | 0 (0.0%) |
| 5:30 AM to 5:59 AM | 37 (15.3%) | 23 (13.1%) |
| 6:00 AM to 6:29 AM | 41 (16.9%) | 21 (12.0%) |
| 6:30 AM to 6:59 AM | 7 (2.9%) | 10 (5.7%) |
| 7:00 AM to 7:29 AM | 43 (17.8%) | 31 (17.7%) |
| 7:30 AM to 7:59 AM | 9 (3.7%) | 29 (16.6%) |
| 8:00 AM to 8:29 AM | 33 (13.6%) | 27 (15.4%) |
| 8:30 AM to 8:59 AM | 0 (0.0%) | 11 (6.3%) |
| 9:00 AM to 9:59 AM | 11 (4.5%) | 0 (0.0%) |
| 10:00 AM to 10:59 AM | 0 (0.0%) | 0 (0.0%) |
| 11:00 AM to 11:59 AM | 0 (0.0%) | 0 (0.0%) |
| 12:00 PM to 3:59 PM | 11 (4.5%) | 4 (2.3%) |
| 4:00 PM to 11:59 PM | 38 (15.7%) | 16 (9.1%) |
| Total | 242 (100.0%) | 175 (100.0%) |
Housing Occupancy in Fanning Springs
Occupancy by Ownership in Fanning Springs
Of the total 452 dwellings in Fanning Springs, owner-occupied units account for 380 (84.1%), while renter-occupied units make up 72 (15.9%).
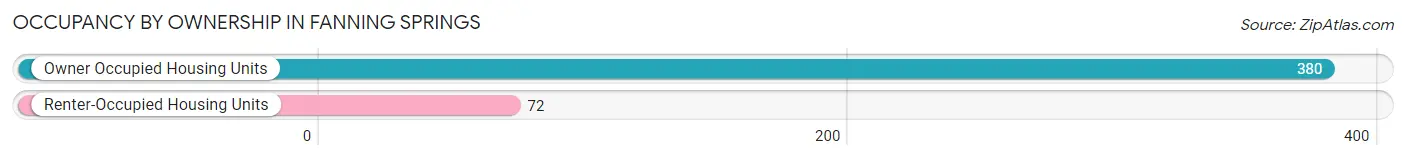
| Occupancy | # Housing Units | % Housing Units |
| Owner Occupied Housing Units | 380 | 84.1% |
| Renter-Occupied Housing Units | 72 | 15.9% |
| Total Occupied Housing Units | 452 | 100.0% |
Occupancy by Household Size in Fanning Springs
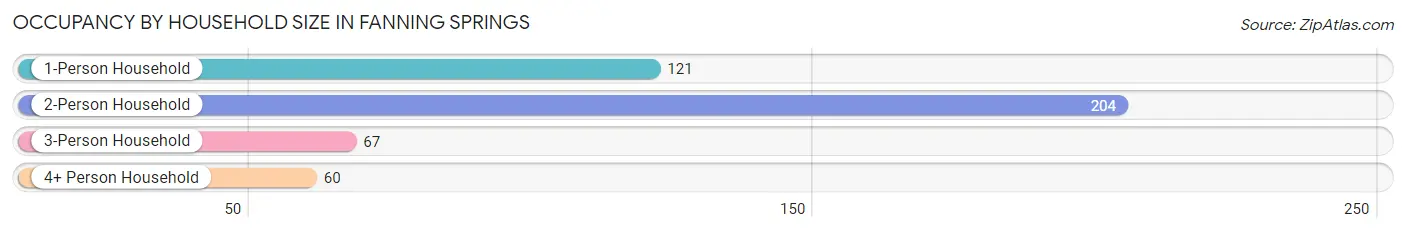
| Household Size | # Housing Units | % Housing Units |
| 1-Person Household | 121 | 26.8% |
| 2-Person Household | 204 | 45.1% |
| 3-Person Household | 67 | 14.8% |
| 4+ Person Household | 60 | 13.3% |
| Total Housing Units | 452 | 100.0% |
Occupancy by Ownership by Household Size in Fanning Springs
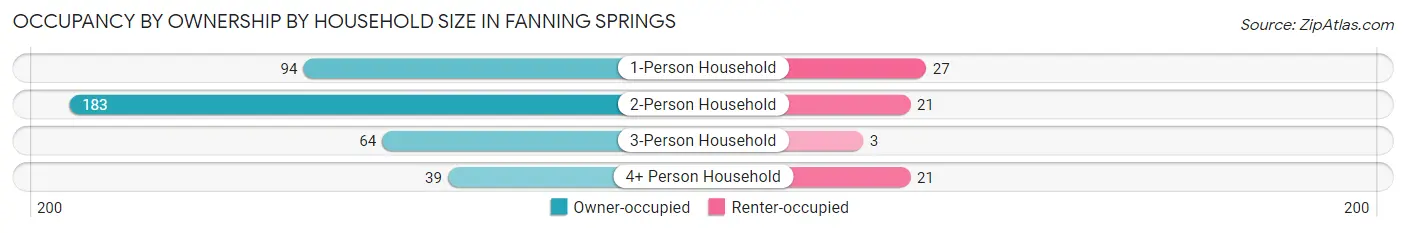
| Household Size | Owner-occupied | Renter-occupied |
| 1-Person Household | 94 (77.7%) | 27 (22.3%) |
| 2-Person Household | 183 (89.7%) | 21 (10.3%) |
| 3-Person Household | 64 (95.5%) | 3 (4.5%) |
| 4+ Person Household | 39 (65.0%) | 21 (35.0%) |
| Total Housing Units | 380 (84.1%) | 72 (15.9%) |
Occupancy by Educational Attainment in Fanning Springs
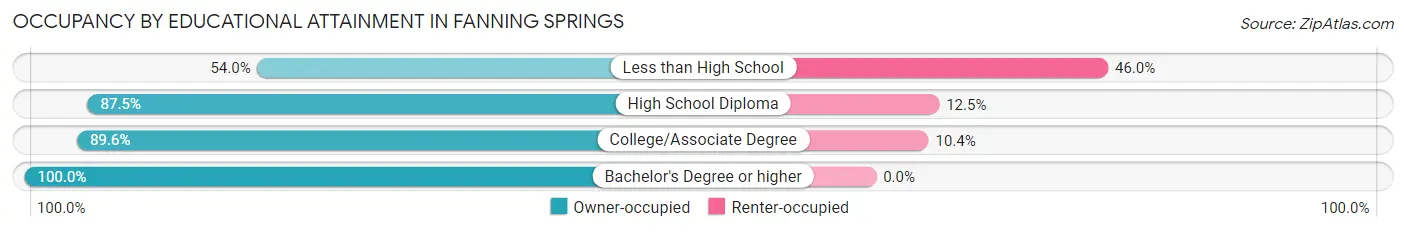
| Household Size | Owner-occupied | Renter-occupied |
| Less than High School | 47 (54.0%) | 40 (46.0%) |
| High School Diploma | 112 (87.5%) | 16 (12.5%) |
| College/Associate Degree | 138 (89.6%) | 16 (10.4%) |
| Bachelor's Degree or higher | 83 (100.0%) | 0 (0.0%) |
Occupancy by Age of Householder in Fanning Springs
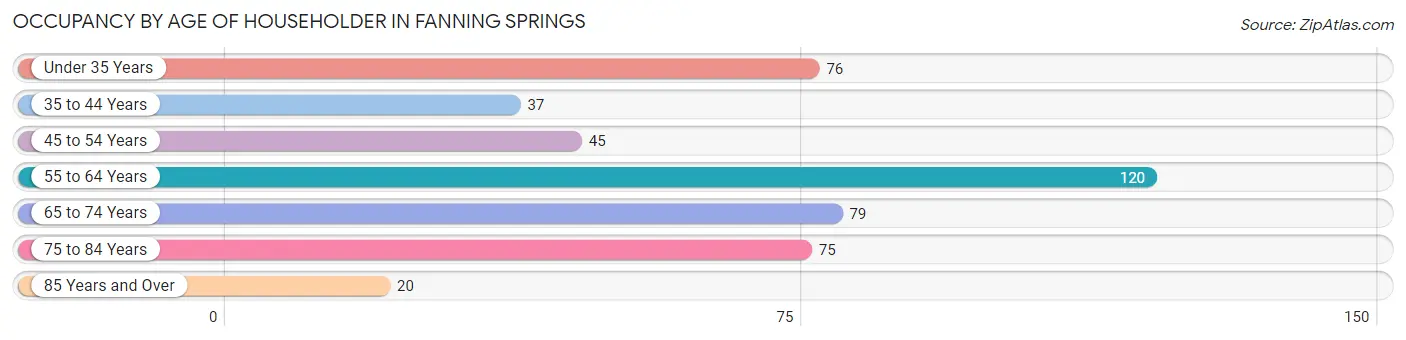
| Age Bracket | # Households | % Households |
| Under 35 Years | 76 | 16.8% |
| 35 to 44 Years | 37 | 8.2% |
| 45 to 54 Years | 45 | 10.0% |
| 55 to 64 Years | 120 | 26.6% |
| 65 to 74 Years | 79 | 17.5% |
| 75 to 84 Years | 75 | 16.6% |
| 85 Years and Over | 20 | 4.4% |
| Total | 452 | 100.0% |
Housing Finances in Fanning Springs
Median Income by Occupancy in Fanning Springs
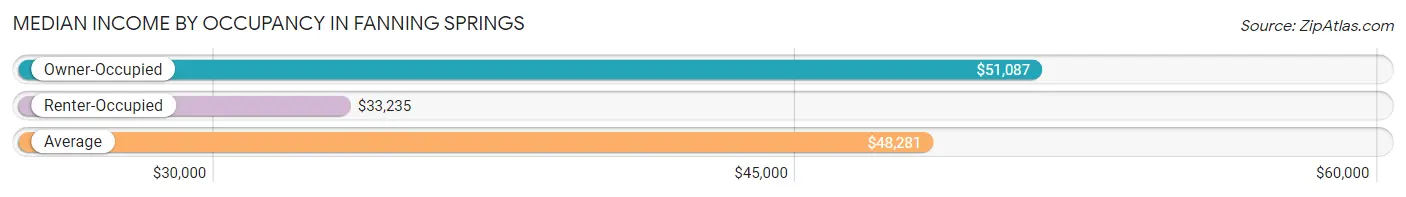
| Occupancy Type | # Households | Median Income |
| Owner-Occupied | 380 (84.1%) | $51,087 |
| Renter-Occupied | 72 (15.9%) | $33,235 |
| Average | 452 (100.0%) | $48,281 |
Occupancy by Householder Income Bracket in Fanning Springs
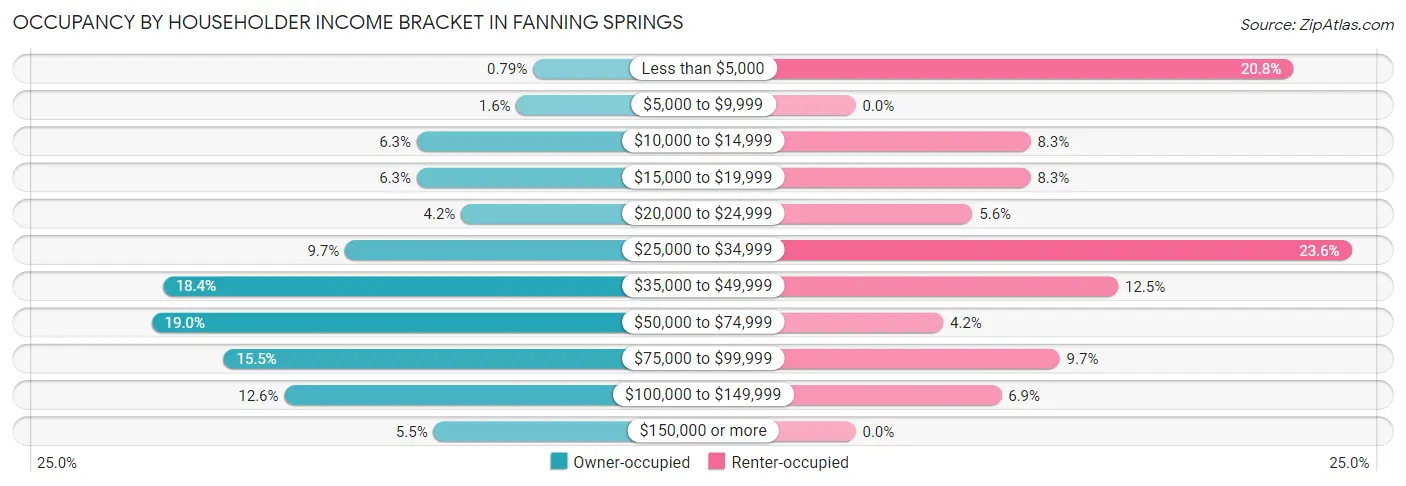
| Income Bracket | Owner-occupied | Renter-occupied |
| Less than $5,000 | 3 (0.8%) | 15 (20.8%) |
| $5,000 to $9,999 | 6 (1.6%) | 0 (0.0%) |
| $10,000 to $14,999 | 24 (6.3%) | 6 (8.3%) |
| $15,000 to $19,999 | 24 (6.3%) | 6 (8.3%) |
| $20,000 to $24,999 | 16 (4.2%) | 4 (5.6%) |
| $25,000 to $34,999 | 37 (9.7%) | 17 (23.6%) |
| $35,000 to $49,999 | 70 (18.4%) | 9 (12.5%) |
| $50,000 to $74,999 | 72 (19.0%) | 3 (4.2%) |
| $75,000 to $99,999 | 59 (15.5%) | 7 (9.7%) |
| $100,000 to $149,999 | 48 (12.6%) | 5 (6.9%) |
| $150,000 or more | 21 (5.5%) | 0 (0.0%) |
| Total | 380 (100.0%) | 72 (100.0%) |
Monthly Housing Cost Tiers in Fanning Springs
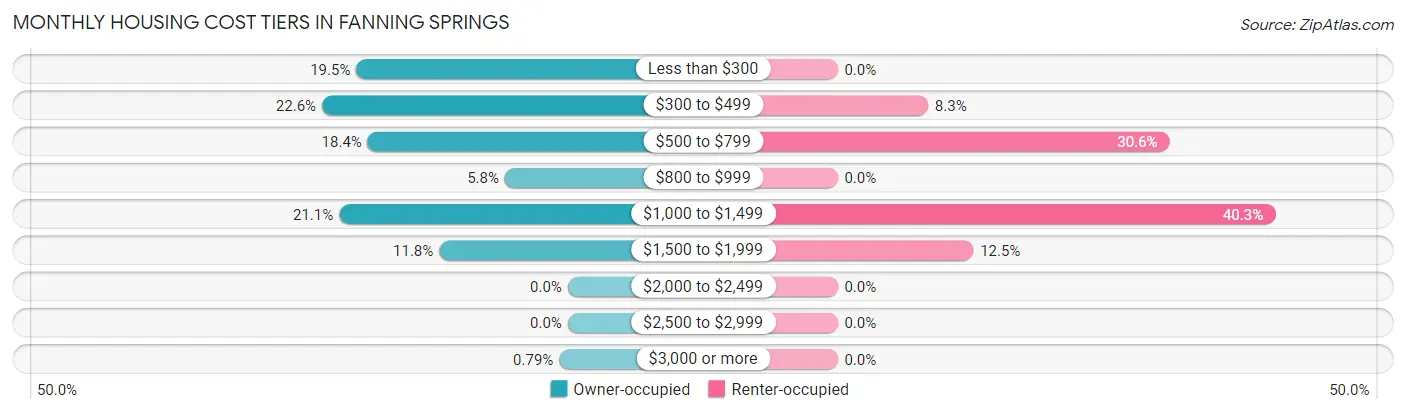
| Monthly Cost | Owner-occupied | Renter-occupied |
| Less than $300 | 74 (19.5%) | 0 (0.0%) |
| $300 to $499 | 86 (22.6%) | 6 (8.3%) |
| $500 to $799 | 70 (18.4%) | 22 (30.6%) |
| $800 to $999 | 22 (5.8%) | 0 (0.0%) |
| $1,000 to $1,499 | 80 (21.0%) | 29 (40.3%) |
| $1,500 to $1,999 | 45 (11.8%) | 9 (12.5%) |
| $2,000 to $2,499 | 0 (0.0%) | 0 (0.0%) |
| $2,500 to $2,999 | 0 (0.0%) | 0 (0.0%) |
| $3,000 or more | 3 (0.8%) | 0 (0.0%) |
| Total | 380 (100.0%) | 72 (100.0%) |
Physical Housing Characteristics in Fanning Springs
Housing Structures in Fanning Springs
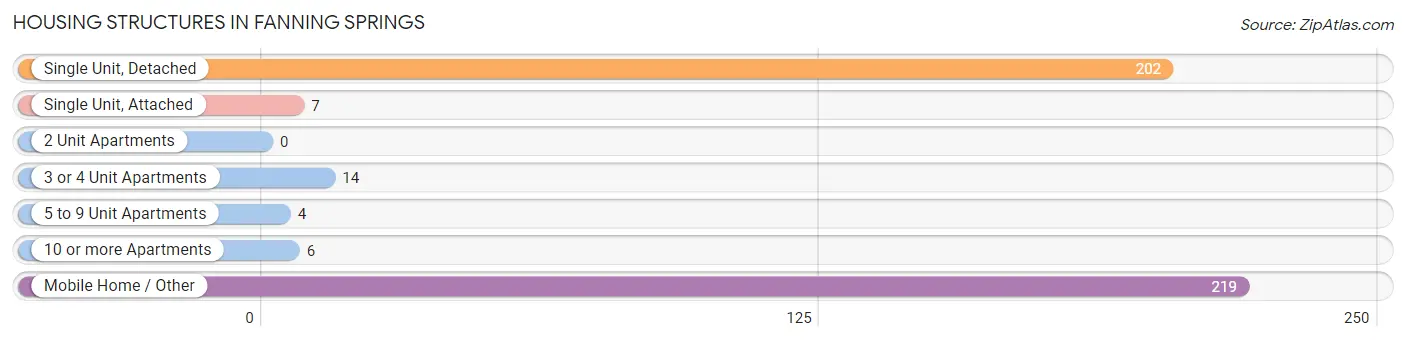
| Structure Type | # Housing Units | % Housing Units |
| Single Unit, Detached | 202 | 44.7% |
| Single Unit, Attached | 7 | 1.5% |
| 2 Unit Apartments | 0 | 0.0% |
| 3 or 4 Unit Apartments | 14 | 3.1% |
| 5 to 9 Unit Apartments | 4 | 0.9% |
| 10 or more Apartments | 6 | 1.3% |
| Mobile Home / Other | 219 | 48.4% |
| Total | 452 | 100.0% |
Housing Structures by Occupancy in Fanning Springs
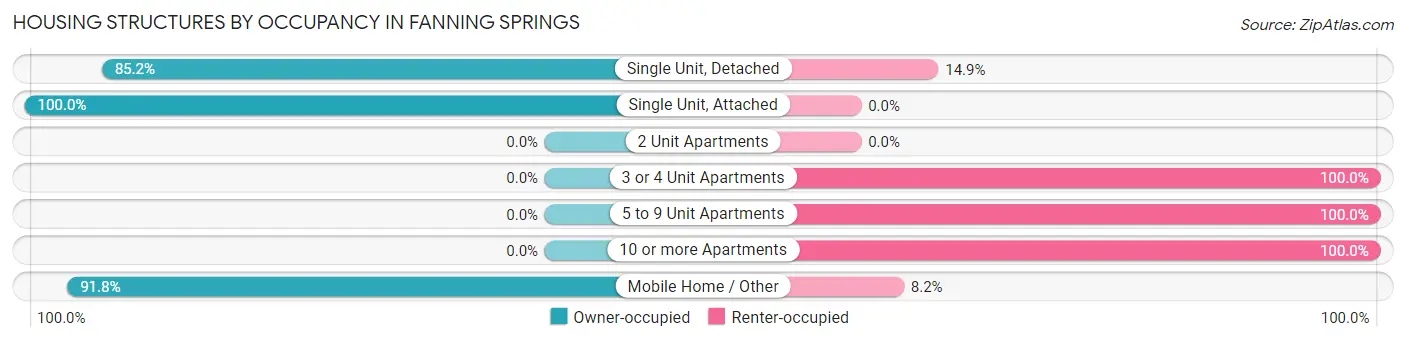
| Structure Type | Owner-occupied | Renter-occupied |
| Single Unit, Detached | 172 (85.2%) | 30 (14.8%) |
| Single Unit, Attached | 7 (100.0%) | 0 (0.0%) |
| 2 Unit Apartments | 0 (0.0%) | 0 (0.0%) |
| 3 or 4 Unit Apartments | 0 (0.0%) | 14 (100.0%) |
| 5 to 9 Unit Apartments | 0 (0.0%) | 4 (100.0%) |
| 10 or more Apartments | 0 (0.0%) | 6 (100.0%) |
| Mobile Home / Other | 201 (91.8%) | 18 (8.2%) |
| Total | 380 (84.1%) | 72 (15.9%) |
Housing Structures by Number of Rooms in Fanning Springs
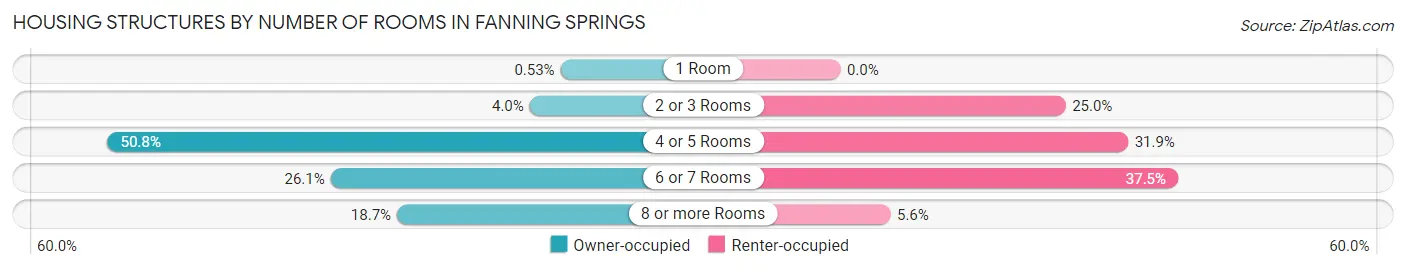
| Number of Rooms | Owner-occupied | Renter-occupied |
| 1 Room | 2 (0.5%) | 0 (0.0%) |
| 2 or 3 Rooms | 15 (4.0%) | 18 (25.0%) |
| 4 or 5 Rooms | 193 (50.8%) | 23 (31.9%) |
| 6 or 7 Rooms | 99 (26.1%) | 27 (37.5%) |
| 8 or more Rooms | 71 (18.7%) | 4 (5.6%) |
| Total | 380 (100.0%) | 72 (100.0%) |
Housing Structure by Heating Type in Fanning Springs
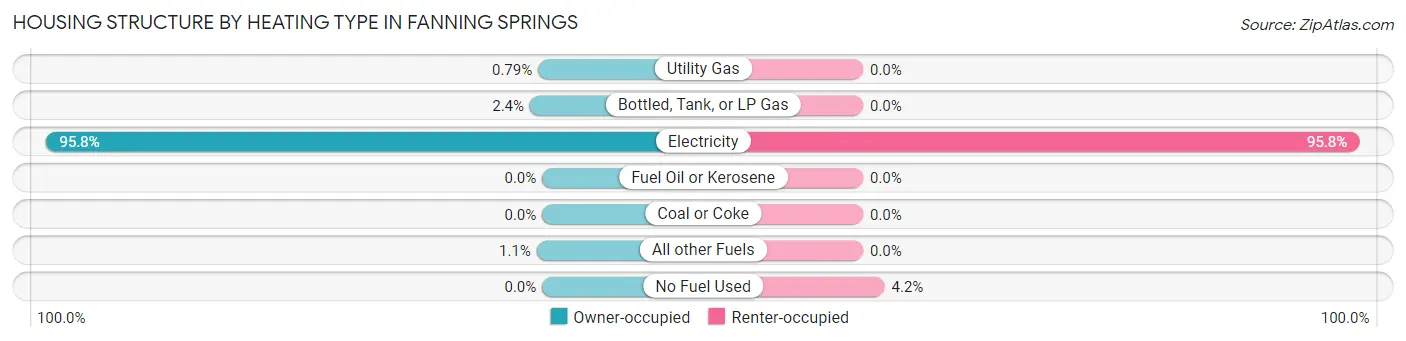
| Heating Type | Owner-occupied | Renter-occupied |
| Utility Gas | 3 (0.8%) | 0 (0.0%) |
| Bottled, Tank, or LP Gas | 9 (2.4%) | 0 (0.0%) |
| Electricity | 364 (95.8%) | 69 (95.8%) |
| Fuel Oil or Kerosene | 0 (0.0%) | 0 (0.0%) |
| Coal or Coke | 0 (0.0%) | 0 (0.0%) |
| All other Fuels | 4 (1.1%) | 0 (0.0%) |
| No Fuel Used | 0 (0.0%) | 3 (4.2%) |
| Total | 380 (100.0%) | 72 (100.0%) |
Household Vehicle Usage in Fanning Springs
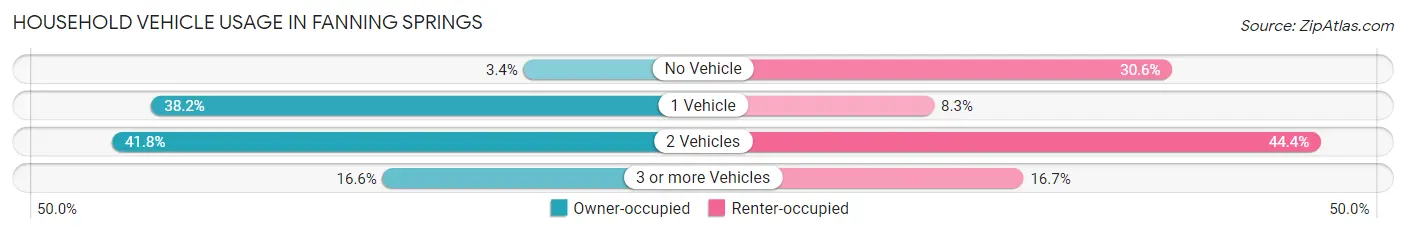
| Vehicles per Household | Owner-occupied | Renter-occupied |
| No Vehicle | 13 (3.4%) | 22 (30.6%) |
| 1 Vehicle | 145 (38.2%) | 6 (8.3%) |
| 2 Vehicles | 159 (41.8%) | 32 (44.4%) |
| 3 or more Vehicles | 63 (16.6%) | 12 (16.7%) |
| Total | 380 (100.0%) | 72 (100.0%) |
Real Estate & Mortgages in Fanning Springs
Real Estate and Mortgage Overview in Fanning Springs
| Characteristic | Without Mortgage | With Mortgage |
| Housing Units | 196 | 184 |
| Median Property Value | $108,000 | $148,800 |
| Median Household Income | $45,714 | $9 |
| Monthly Housing Costs | $350 | $3 |
| Real Estate Taxes | $533 | $4 |
Property Value by Mortgage Status in Fanning Springs
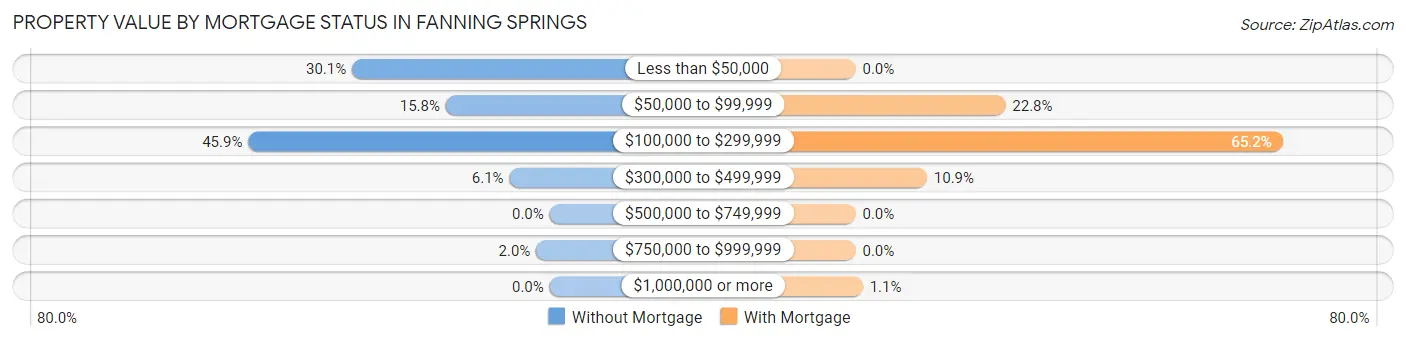
| Property Value | Without Mortgage | With Mortgage |
| Less than $50,000 | 59 (30.1%) | 0 (0.0%) |
| $50,000 to $99,999 | 31 (15.8%) | 42 (22.8%) |
| $100,000 to $299,999 | 90 (45.9%) | 120 (65.2%) |
| $300,000 to $499,999 | 12 (6.1%) | 20 (10.9%) |
| $500,000 to $749,999 | 0 (0.0%) | 0 (0.0%) |
| $750,000 to $999,999 | 4 (2.0%) | 0 (0.0%) |
| $1,000,000 or more | 0 (0.0%) | 2 (1.1%) |
| Total | 196 (100.0%) | 184 (100.0%) |
Household Income by Mortgage Status in Fanning Springs

| Household Income | Without Mortgage | With Mortgage |
| Less than $10,000 | 5 (2.5%) | 4 (2.2%) |
| $10,000 to $24,999 | 20 (10.2%) | 4 (2.2%) |
| $25,000 to $34,999 | 29 (14.8%) | 44 (23.9%) |
| $35,000 to $49,999 | 54 (27.6%) | 8 (4.3%) |
| $50,000 to $74,999 | 32 (16.3%) | 16 (8.7%) |
| $75,000 to $99,999 | 16 (8.2%) | 40 (21.7%) |
| $100,000 to $149,999 | 28 (14.3%) | 43 (23.4%) |
| $150,000 or more | 12 (6.1%) | 20 (10.9%) |
| Total | 196 (100.0%) | 184 (100.0%) |
Property Value to Household Income Ratio in Fanning Springs

| Value-to-Income Ratio | Without Mortgage | With Mortgage |
| Less than 2.0x | 99 (50.5%) | 60,962 (33,131.5%) |
| 2.0x to 2.9x | 39 (19.9%) | 55 (29.9%) |
| 3.0x to 3.9x | 3 (1.5%) | 48 (26.1%) |
| 4.0x or more | 55 (28.1%) | 8 (4.3%) |
| Total | 196 (100.0%) | 184 (100.0%) |
Real Estate Taxes by Mortgage Status in Fanning Springs
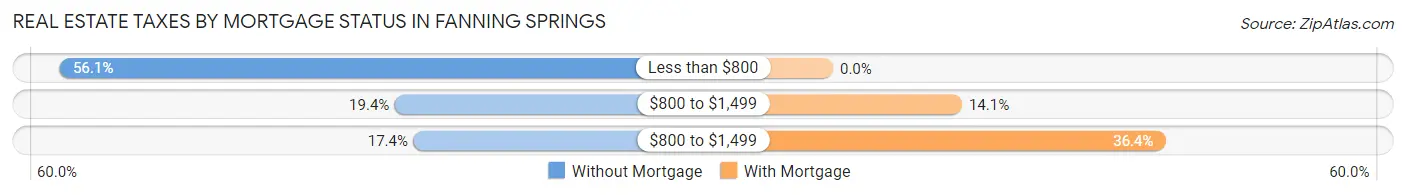
| Property Taxes | Without Mortgage | With Mortgage |
| Less than $800 | 110 (56.1%) | 0 (0.0%) |
| $800 to $1,499 | 38 (19.4%) | 26 (14.1%) |
| $800 to $1,499 | 34 (17.3%) | 67 (36.4%) |
| Total | 196 (100.0%) | 184 (100.0%) |
Health & Disability in Fanning Springs
Health Insurance Coverage by Age in Fanning Springs
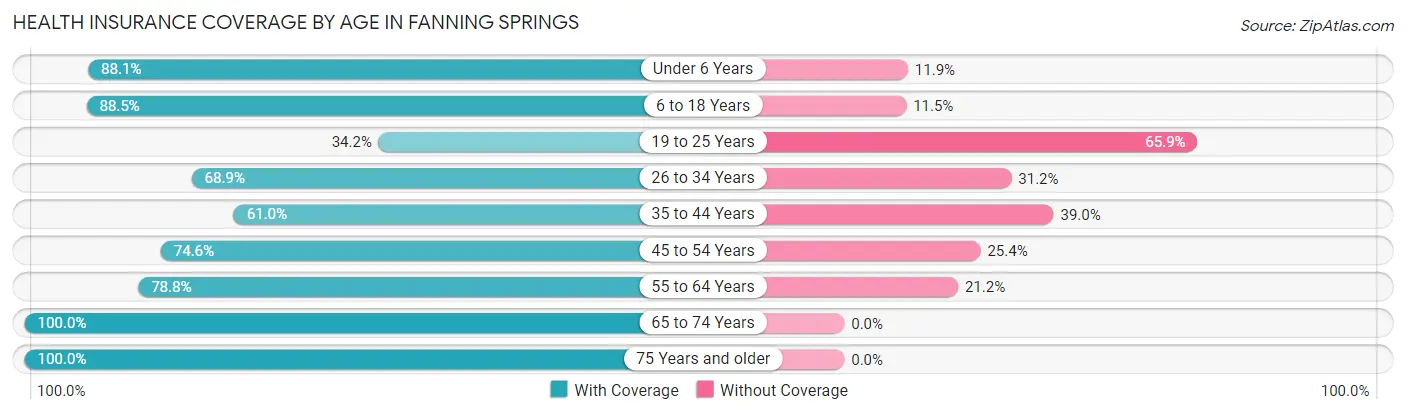
| Age Bracket | With Coverage | Without Coverage |
| Under 6 Years | 52 (88.1%) | 7 (11.9%) |
| 6 to 18 Years | 69 (88.5%) | 9 (11.5%) |
| 19 to 25 Years | 28 (34.2%) | 54 (65.8%) |
| 26 to 34 Years | 84 (68.9%) | 38 (31.1%) |
| 35 to 44 Years | 50 (61.0%) | 32 (39.0%) |
| 45 to 54 Years | 94 (74.6%) | 32 (25.4%) |
| 55 to 64 Years | 145 (78.8%) | 39 (21.2%) |
| 65 to 74 Years | 136 (100.0%) | 0 (0.0%) |
| 75 Years and older | 150 (100.0%) | 0 (0.0%) |
| Total | 808 (79.3%) | 211 (20.7%) |
Health Insurance Coverage by Citizenship Status in Fanning Springs
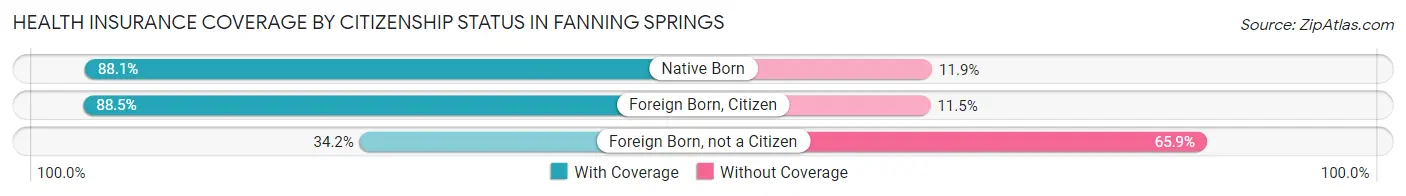
| Citizenship Status | With Coverage | Without Coverage |
| Native Born | 52 (88.1%) | 7 (11.9%) |
| Foreign Born, Citizen | 69 (88.5%) | 9 (11.5%) |
| Foreign Born, not a Citizen | 28 (34.2%) | 54 (65.8%) |
Health Insurance Coverage by Household Income in Fanning Springs
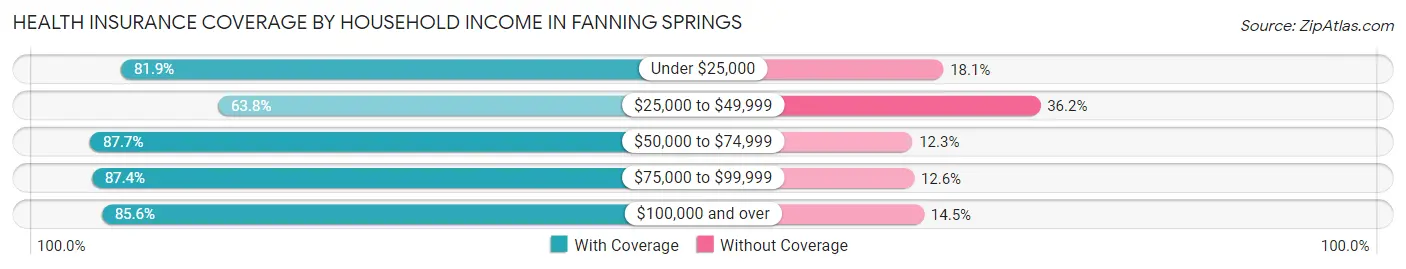
| Household Income | With Coverage | Without Coverage |
| Under $25,000 | 118 (81.9%) | 26 (18.1%) |
| $25,000 to $49,999 | 190 (63.8%) | 108 (36.2%) |
| $50,000 to $74,999 | 136 (87.7%) | 19 (12.3%) |
| $75,000 to $99,999 | 139 (87.4%) | 20 (12.6%) |
| $100,000 and over | 225 (85.6%) | 38 (14.4%) |
Public vs Private Health Insurance Coverage by Age in Fanning Springs
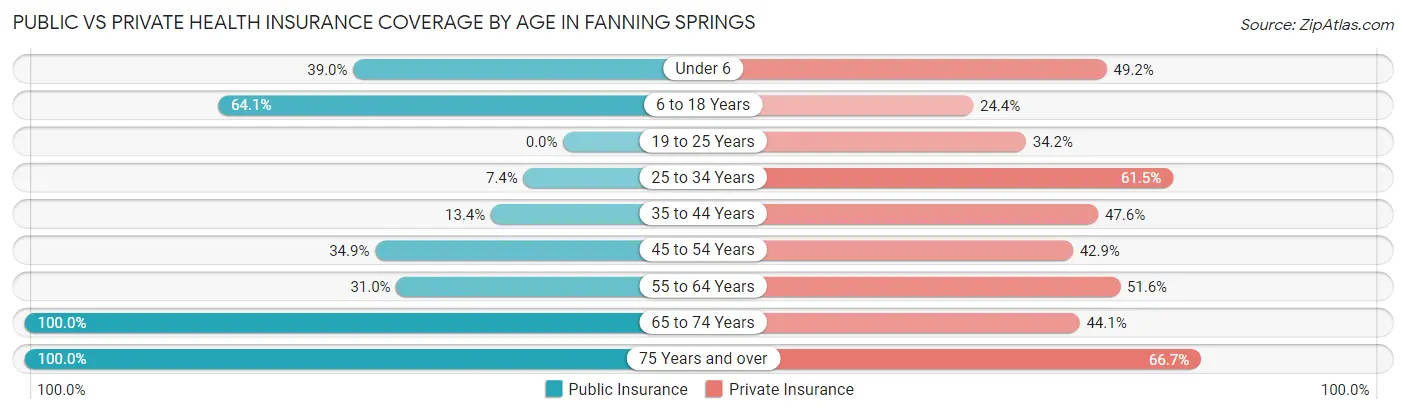
| Age Bracket | Public Insurance | Private Insurance |
| Under 6 | 23 (39.0%) | 29 (49.1%) |
| 6 to 18 Years | 50 (64.1%) | 19 (24.4%) |
| 19 to 25 Years | 0 (0.0%) | 28 (34.2%) |
| 25 to 34 Years | 9 (7.4%) | 75 (61.5%) |
| 35 to 44 Years | 11 (13.4%) | 39 (47.6%) |
| 45 to 54 Years | 44 (34.9%) | 54 (42.9%) |
| 55 to 64 Years | 57 (31.0%) | 95 (51.6%) |
| 65 to 74 Years | 136 (100.0%) | 60 (44.1%) |
| 75 Years and over | 150 (100.0%) | 100 (66.7%) |
| Total | 480 (47.1%) | 499 (49.0%) |
Disability Status by Sex by Age in Fanning Springs
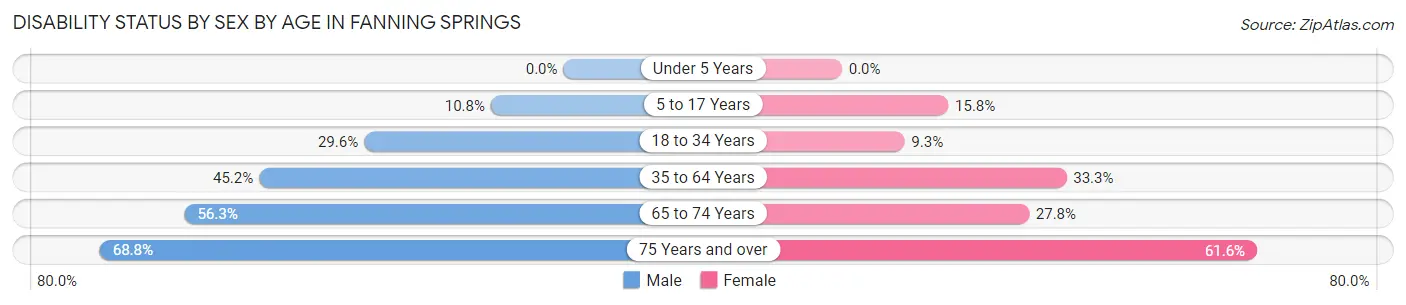
| Age Bracket | Male | Female |
| Under 5 Years | 0 (0.0%) | 0 (0.0%) |
| 5 to 17 Years | 7 (10.8%) | 3 (15.8%) |
| 18 to 34 Years | 37 (29.6%) | 8 (9.3%) |
| 35 to 64 Years | 89 (45.2%) | 65 (33.3%) |
| 65 to 74 Years | 36 (56.2%) | 20 (27.8%) |
| 75 Years and over | 53 (68.8%) | 45 (61.6%) |
Disability Class by Sex by Age in Fanning Springs
Disability Class: Hearing Difficulty
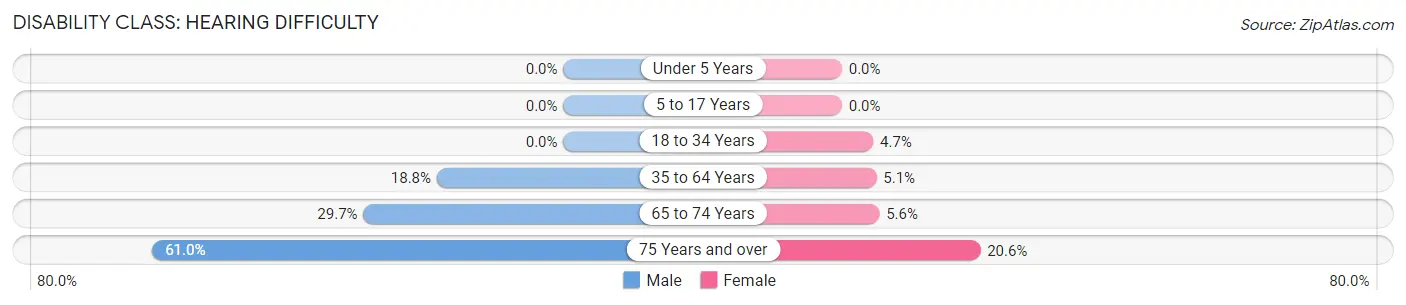
| Age Bracket | Male | Female |
| Under 5 Years | 0 (0.0%) | 0 (0.0%) |
| 5 to 17 Years | 0 (0.0%) | 0 (0.0%) |
| 18 to 34 Years | 0 (0.0%) | 4 (4.6%) |
| 35 to 64 Years | 37 (18.8%) | 10 (5.1%) |
| 65 to 74 Years | 19 (29.7%) | 4 (5.6%) |
| 75 Years and over | 47 (61.0%) | 15 (20.5%) |
Disability Class: Vision Difficulty
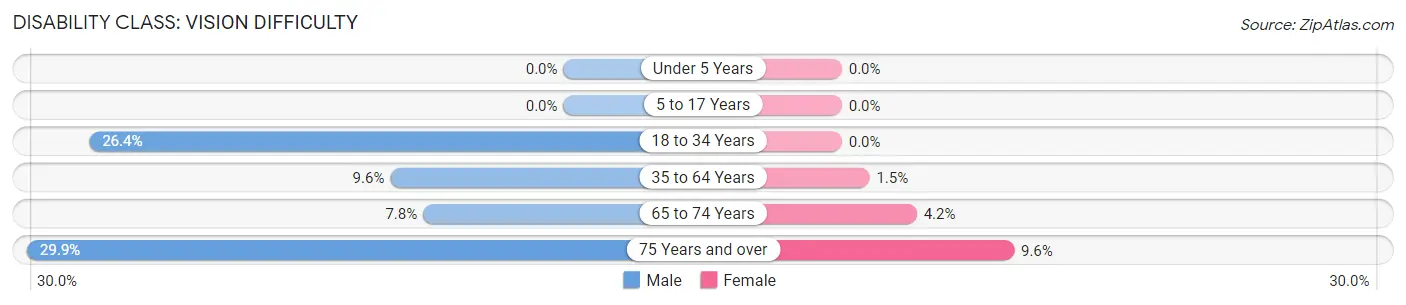
| Age Bracket | Male | Female |
| Under 5 Years | 0 (0.0%) | 0 (0.0%) |
| 5 to 17 Years | 0 (0.0%) | 0 (0.0%) |
| 18 to 34 Years | 33 (26.4%) | 0 (0.0%) |
| 35 to 64 Years | 19 (9.6%) | 3 (1.5%) |
| 65 to 74 Years | 5 (7.8%) | 3 (4.2%) |
| 75 Years and over | 23 (29.9%) | 7 (9.6%) |
Disability Class: Cognitive Difficulty
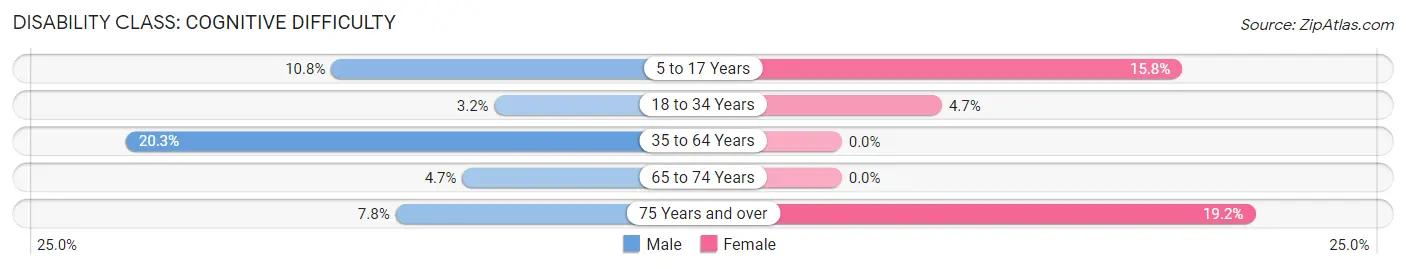
| Age Bracket | Male | Female |
| 5 to 17 Years | 7 (10.8%) | 3 (15.8%) |
| 18 to 34 Years | 4 (3.2%) | 4 (4.6%) |
| 35 to 64 Years | 40 (20.3%) | 0 (0.0%) |
| 65 to 74 Years | 3 (4.7%) | 0 (0.0%) |
| 75 Years and over | 6 (7.8%) | 14 (19.2%) |
Disability Class: Ambulatory Difficulty
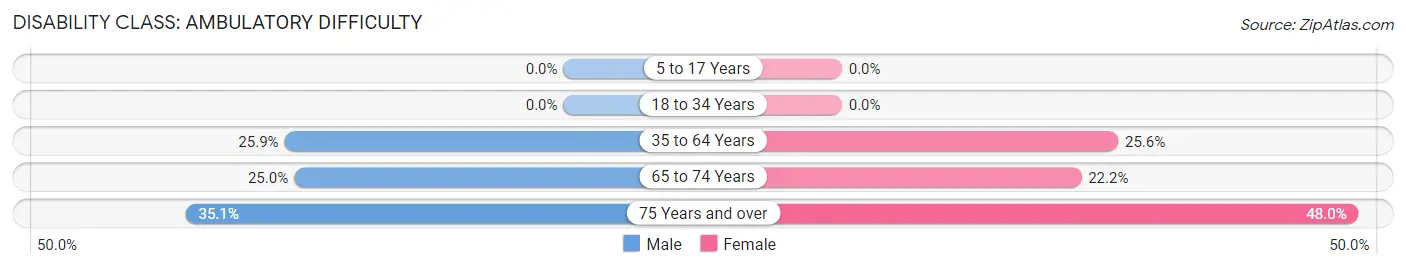
| Age Bracket | Male | Female |
| 5 to 17 Years | 0 (0.0%) | 0 (0.0%) |
| 18 to 34 Years | 0 (0.0%) | 0 (0.0%) |
| 35 to 64 Years | 51 (25.9%) | 50 (25.6%) |
| 65 to 74 Years | 16 (25.0%) | 16 (22.2%) |
| 75 Years and over | 27 (35.1%) | 35 (47.9%) |
Disability Class: Self-Care Difficulty
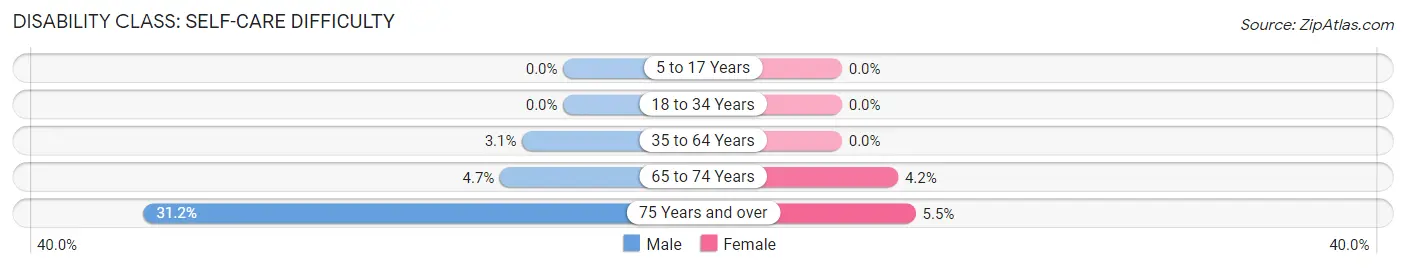
| Age Bracket | Male | Female |
| 5 to 17 Years | 0 (0.0%) | 0 (0.0%) |
| 18 to 34 Years | 0 (0.0%) | 0 (0.0%) |
| 35 to 64 Years | 6 (3.0%) | 0 (0.0%) |
| 65 to 74 Years | 3 (4.7%) | 3 (4.2%) |
| 75 Years and over | 24 (31.2%) | 4 (5.5%) |
Technology Access in Fanning Springs
Computing Device Access in Fanning Springs
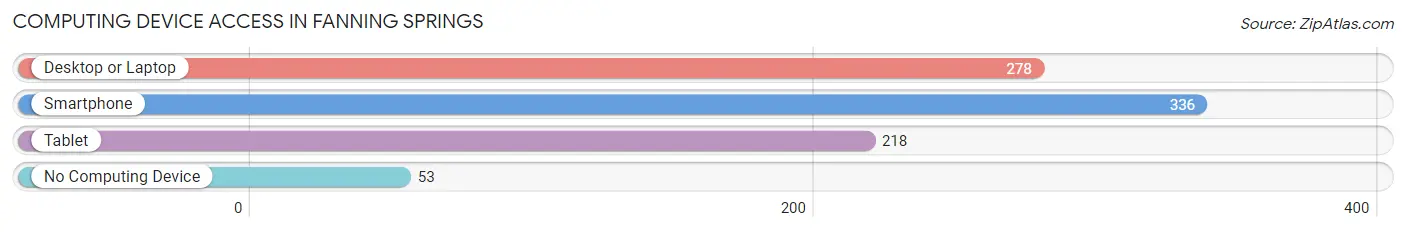
| Device Type | # Households | % Households |
| Desktop or Laptop | 278 | 61.5% |
| Smartphone | 336 | 74.3% |
| Tablet | 218 | 48.2% |
| No Computing Device | 53 | 11.7% |
| Total | 452 | 100.0% |
Internet Access in Fanning Springs
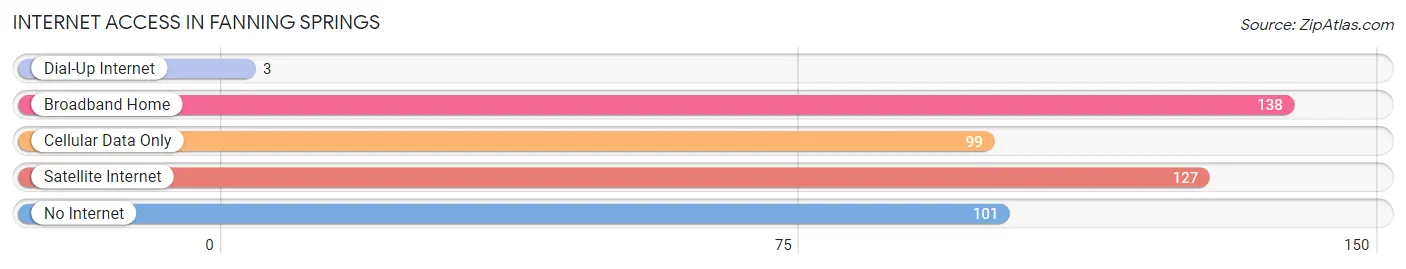
| Internet Type | # Households | % Households |
| Dial-Up Internet | 3 | 0.7% |
| Broadband Home | 138 | 30.5% |
| Cellular Data Only | 99 | 21.9% |
| Satellite Internet | 127 | 28.1% |
| No Internet | 101 | 22.4% |
| Total | 452 | 100.0% |
Fanning Springs Summary
History
Fanning Springs is a small town located in Levy County, Florida. It is situated on the banks of the Suwannee River, and is part of the Nature Coast region of Florida. The town was originally known as “Blue Springs” due to the blue-green color of the water in the springs. The town was renamed in 1883 after Captain William Fanning, a Confederate soldier who was killed in the Battle of Olustee.
The area around Fanning Springs has been inhabited for thousands of years. The first recorded inhabitants were the Timucua Indians, who lived in the area until the mid-1700s. The area was then settled by European settlers in the early 1800s. The first settlers were mostly farmers and ranchers, and the town was officially established in 1883.
Geography
Fanning Springs is located in Levy County, Florida, on the banks of the Suwannee River. The town is situated in the Nature Coast region of Florida, which is known for its natural beauty and abundance of wildlife. The town is located about 25 miles west of Gainesville, and about 50 miles north of Tampa.
The town is surrounded by natural beauty, including the Suwannee River, which is a popular destination for fishing, boating, and swimming. The town is also home to Fanning Springs State Park, which offers camping, hiking, and other outdoor activities.
Economy
The economy of Fanning Springs is largely based on tourism and agriculture. The town is home to several tourist attractions, including Fanning Springs State Park, which attracts visitors from all over the world. The town is also home to several farms and ranches, which produce a variety of crops and livestock.
The town is also home to several businesses, including restaurants, retail stores, and other services. The town is also home to a number of manufacturing companies, which produce a variety of products, including furniture, clothing, and electronics.
Demographics
As of the 2010 census, the population of Fanning Springs was 1,717. The population is predominantly white (90.2%), with a small percentage of African Americans (4.2%), Hispanics (2.7%), and other races (2.9%). The median household income in the town is $37,917, and the median age is 44.
The town is home to a number of churches, including Baptist, Methodist, and Catholic. The town is also home to a number of schools, including Fanning Springs Elementary School, Fanning Springs Middle School, and Fanning Springs High School.
Conclusion
Fanning Springs is a small town located in Levy County, Florida. It is situated on the banks of the Suwannee River, and is part of the Nature Coast region of Florida. The town was originally known as “Blue Springs” due to the blue-green color of the water in the springs. The town was renamed in 1883 after Captain William Fanning, a Confederate soldier who was killed in the Battle of Olustee. The economy of Fanning Springs is largely based on tourism and agriculture, and the town is home to several tourist attractions, including Fanning Springs State Park. The population of Fanning Springs is predominantly white, with a median household income of $37,917 and a median age of 44. The town is home to a number of churches, schools, businesses, and manufacturing companies.
Common Questions
What is the Total Population of Fanning Springs?
Total Population of Fanning Springs is 1,114.
What is the Total Male Population of Fanning Springs?
Total Male Population of Fanning Springs is 553.
What is the Total Female Population of Fanning Springs?
Total Female Population of Fanning Springs is 561.
What is the Ratio of Males per 100 Females in Fanning Springs?
There are 98.57 Males per 100 Females in Fanning Springs.
What is the Ratio of Females per 100 Males in Fanning Springs?
There are 101.45 Females per 100 Males in Fanning Springs.
What is the Median Population Age in Fanning Springs?
Median Population Age in Fanning Springs is 55.3 Years.
What is the Average Family Size in Fanning Springs
Average Family Size in Fanning Springs is 2.6 People.
What is the Average Household Size in Fanning Springs
Average Household Size in Fanning Springs is 2.2 People.
What is Per Capita Income in Fanning Springs?
Per Capita income in Fanning Springs is $31,198.
What is the Median Family Income in Fanning Springs?
Median Family Income in Fanning Springs is $62,841.
What is the Median Household income in Fanning Springs?
Median Household Income in Fanning Springs is $48,281.
What is Income or Wage Gap in Fanning Springs?
Income or Wage Gap in Fanning Springs is 2.3%.
Women in Fanning Springs earn 97.7 cents for every dollar earned by a man.
What is Inequality or Gini Index in Fanning Springs?
Inequality or Gini Index in Fanning Springs is 0.49.
How Large is the Labor Force in Fanning Springs?
There are 448 People in the Labor Forcein in Fanning Springs.
What is the Percentage of People in the Labor Force in Fanning Springs?
45.0% of People are in the Labor Force in Fanning Springs.
What is the Unemployment Rate in Fanning Springs?
Unemployment Rate in Fanning Springs is 4.0%.