Zip Codes with the Highest Percentage of Population Employed in Food Preparation & Serving in Orange, TX
RELATED REPORTS & OPTIONS
Food Preparation & Serving
Orange
Compare Zip Codes
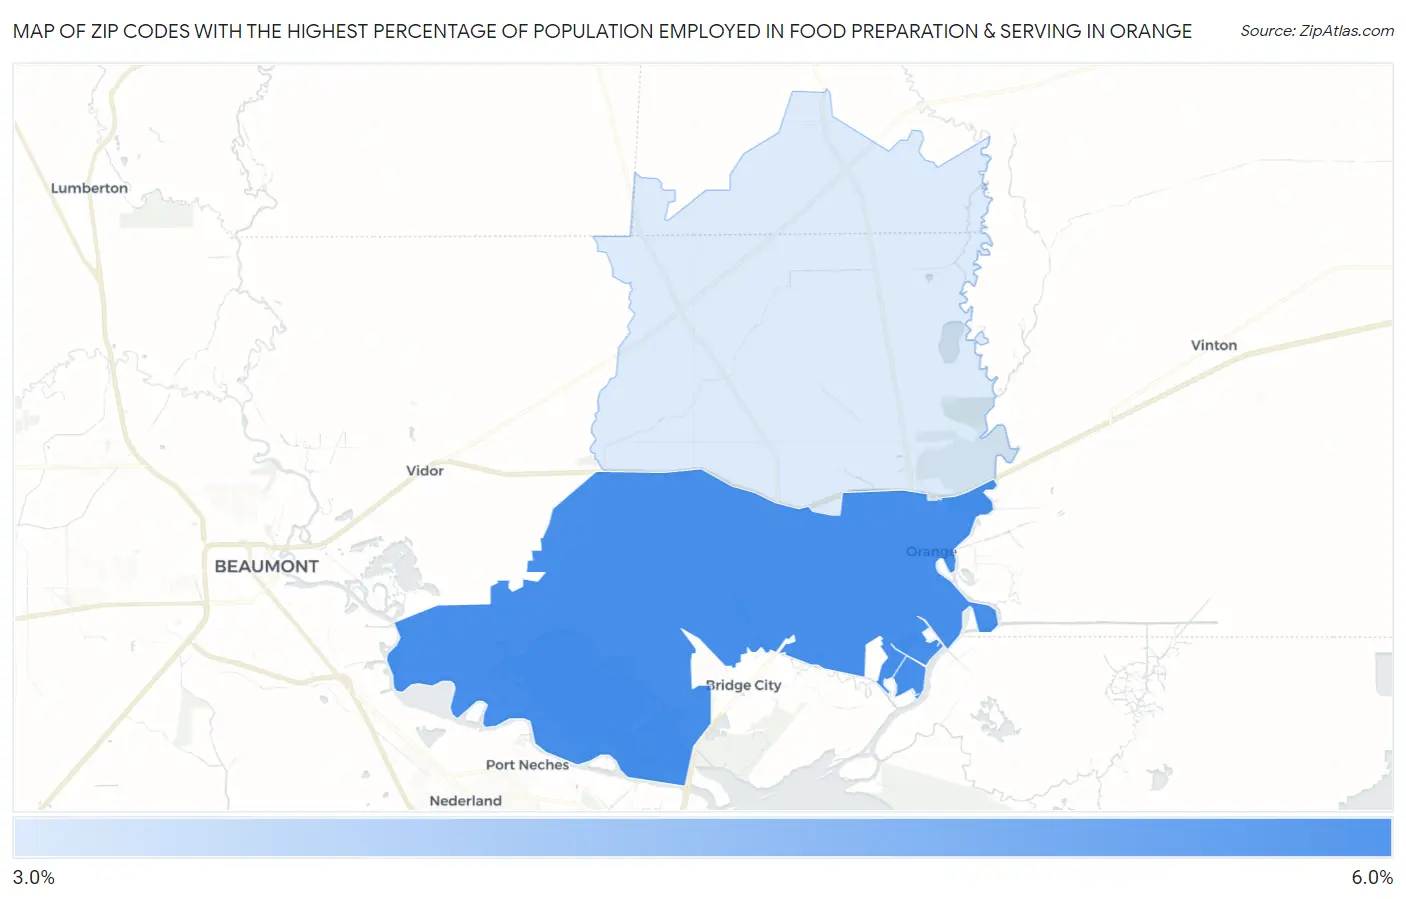
Map of Zip Codes with the Highest Percentage of Population Employed in Food Preparation & Serving in Orange
0.0%
6.0%
Zip Codes with the Highest Percentage of Population Employed in Food Preparation & Serving in Orange, TX
| Zip Code | % Employed | vs State | vs National | |
| 1. | 77630 | 5.7% | 5.4%(+0.345)#623 | 5.3%(+0.410)#10,360 |
| 2. | 77632 | 3.6% | 5.4%(-1.77)#1,137 | 5.3%(-1.71)#18,862 |
1
Common Questions
What are the Top Zip Codes with the Highest Percentage of Population Employed in Food Preparation & Serving in Orange, TX?
Top Zip Codes with the Highest Percentage of Population Employed in Food Preparation & Serving in Orange, TX are:
What zip code has the Highest Percentage of Population Employed in Food Preparation & Serving in Orange, TX?
77630 has the Highest Percentage of Population Employed in Food Preparation & Serving in Orange, TX with 5.7%.
What is the Percentage of Population Employed in Food Preparation & Serving in Orange, TX?
Percentage of Population Employed in Food Preparation & Serving in Orange is 5.4%.
What is the Percentage of Population Employed in Food Preparation & Serving in Texas?
Percentage of Population Employed in Food Preparation & Serving in Texas is 5.4%.
What is the Percentage of Population Employed in Food Preparation & Serving in the United States?
Percentage of Population Employed in Food Preparation & Serving in the United States is 5.3%.