Zip Codes with the Highest Percentage of Population Employed in Food Preparation & Serving in Wichita Falls, TX
RELATED REPORTS & OPTIONS
Food Preparation & Serving
Wichita Falls
Compare Zip Codes
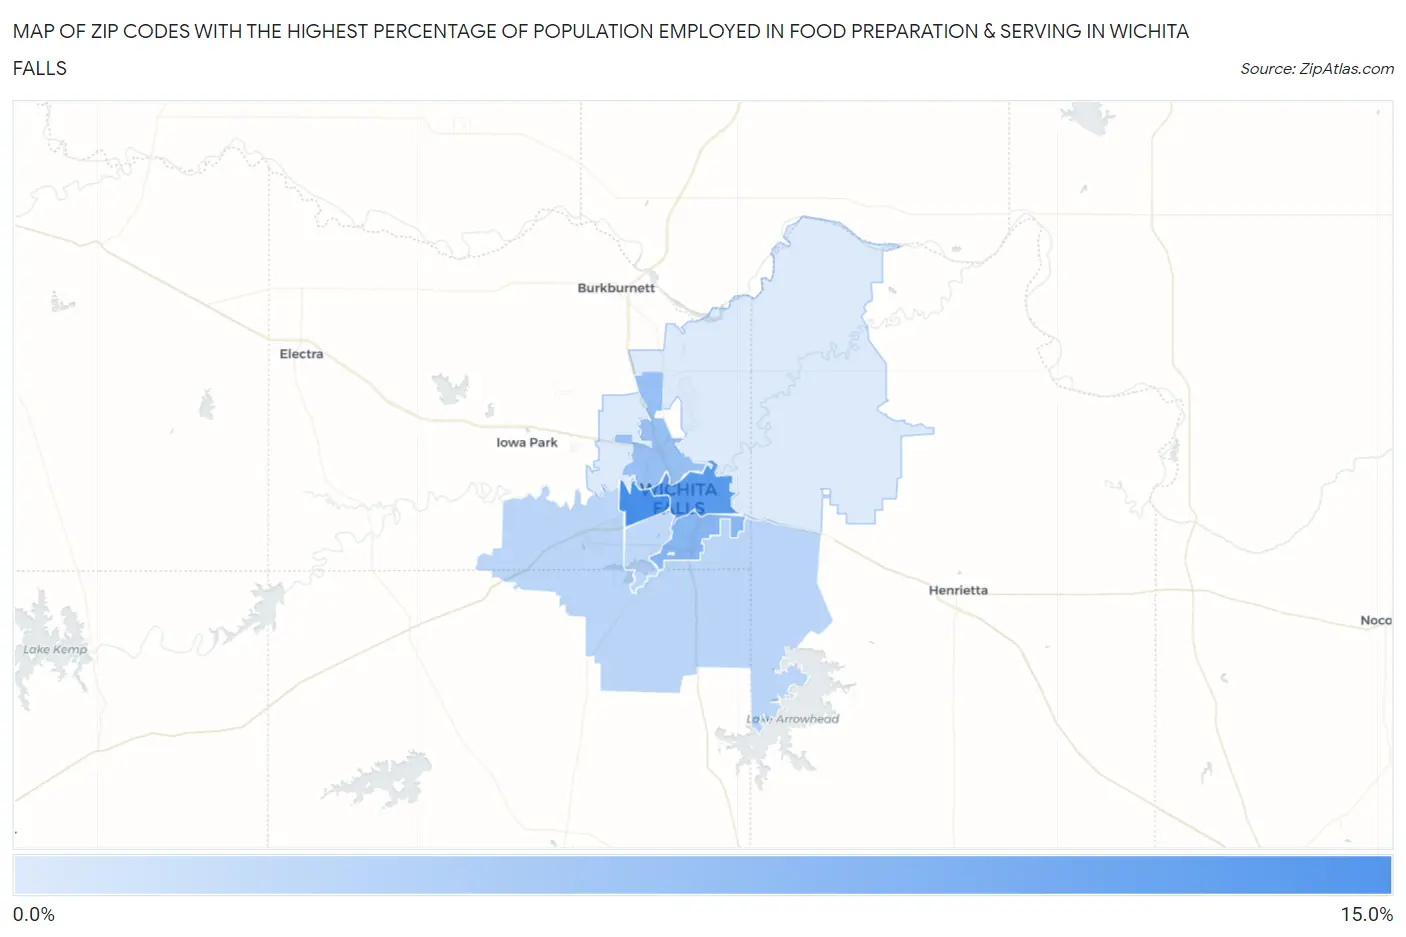
Map of Zip Codes with the Highest Percentage of Population Employed in Food Preparation & Serving in Wichita Falls
0.0%
15.0%
Zip Codes with the Highest Percentage of Population Employed in Food Preparation & Serving in Wichita Falls, TX
| Zip Code | % Employed | vs State | vs National | |
| 1. | 76309 | 14.3% | 5.4%(+8.98)#59 | 5.3%(+9.04)#1,087 |
| 2. | 76301 | 12.9% | 5.4%(+7.60)#80 | 5.3%(+7.66)#1,405 |
| 3. | 76302 | 8.8% | 5.4%(+3.48)#213 | 5.3%(+3.54)#3,688 |
| 4. | 76306 | 7.4% | 5.4%(+2.09)#356 | 5.3%(+2.16)#5,662 |
| 5. | 76310 | 4.6% | 5.4%(-0.728)#896 | 5.3%(-0.663)#14,487 |
| 6. | 76308 | 4.2% | 5.4%(-1.16)#995 | 5.3%(-1.10)#16,368 |
| 7. | 76305 | 1.9% | 5.4%(-3.49)#1,460 | 5.3%(-3.43)#25,111 |
1
Common Questions
What are the Top 5 Zip Codes with the Highest Percentage of Population Employed in Food Preparation & Serving in Wichita Falls, TX?
Top 5 Zip Codes with the Highest Percentage of Population Employed in Food Preparation & Serving in Wichita Falls, TX are:
What zip code has the Highest Percentage of Population Employed in Food Preparation & Serving in Wichita Falls, TX?
76309 has the Highest Percentage of Population Employed in Food Preparation & Serving in Wichita Falls, TX with 14.3%.
What is the Percentage of Population Employed in Food Preparation & Serving in Wichita Falls, TX?
Percentage of Population Employed in Food Preparation & Serving in Wichita Falls is 8.3%.
What is the Percentage of Population Employed in Food Preparation & Serving in Texas?
Percentage of Population Employed in Food Preparation & Serving in Texas is 5.4%.
What is the Percentage of Population Employed in Food Preparation & Serving in the United States?
Percentage of Population Employed in Food Preparation & Serving in the United States is 5.3%.