Zip Codes with the Highest Percentage of Population Employed in Food Preparation & Serving in Delaware

RELATED REPORTS & OPTIONS

Food Preparation & Serving
Population
Families and Households
Female Fertility
Female Fertility (Unmarried)
Race (Community Size)
Race (Percentage)
Ancestry (Community Size)
AfghanAfricanAlaska NativeAlaskan AthabascanAlbanianAleutAlsatianAmericanApacheArabArapahoArgentineanArmenianAssyrian / Chaldean / SyriacAustralianAustrianBahamianBangladeshiBarbadianBasqueBelgianBelizeanBermudanBhutaneseBlackfeetBolivianBrazilianBritishBritish West IndianBulgarianBurmeseCajunCambodianCanadianCape VerdeanCarpatho RusynCelticCentral AmericanCentral American IndianCherokeeCheyenneChickasawChileanChineseChippewaChoctawColombianColvilleComancheCosta RicanCreeCreekCroatianCrowCubanCypriotCzechCzechoslovakianDanishDelawareDominicanDutchDutch West IndianEastern EuropeanEcuadorianEgyptianEnglishEstonianEthiopianEuropeanFijianFilipinoFinnishFrenchFrench American IndianFrench CanadianGermanGerman RussianGhanaianGreekGuamanian / ChamorroGuatemalanGuyaneseHaitianHmongHonduranHopiHoumaHungarianIcelanderIndian (Asian)IndonesianInupiatIranianIraqiIrishIroquoisIsraeliItalianJamaicanJapaneseJordanianKenyanKiowaKoreanLaotianLatvianLebaneseLiberianLithuanianLumbeeLuxembourgerMacedonianMalaysianMalteseMarshalleseMenomineeMexicanMexican American IndianMongolianMoroccanNative HawaiianNavajoNepaleseNew ZealanderNicaraguanNigerianNorthern EuropeanNorwegianOkinawanOsageOttawaPaiutePakistaniPalestinianPanamanianParaguayanPennsylvania GermanPeruvianPimaPolishPortuguesePotawatomiPuebloPuerto RicanPuget Sound SalishRomanianRussianSalvadoranSamoanScandinavianScotch-IrishScottishSeminoleSenegaleseSerbianShoshoneSierra LeoneanSiouxSlavicSlovakSloveneSomaliSouth AfricanSouth AmericanSouth American IndianSoviet UnionSpaniardSpanishSpanish AmericanSpanish American IndianSri LankanSubsaharan AfricanSudaneseSwedishSwissSyrianTaiwaneseThaiTlingit-HaidaTohono O'OdhamTonganTrinidadian and TobagonianTsimshianTurkishU.S. Virgin IslanderUgandanUkrainianUruguayanUteVenezuelanVietnameseWelshWest IndianYakamaYaquiYugoslavianYumanYup'ikZimbabwean
Ancestry (Percentage)
AfghanAfricanAlaska NativeAlaskan AthabascanAlbanianAleutAlsatianAmericanApacheArabArapahoArgentineanArmenianAssyrian / Chaldean / SyriacAustralianAustrianBahamianBangladeshiBarbadianBasqueBelgianBelizeanBermudanBhutaneseBlackfeetBolivianBrazilianBritishBritish West IndianBulgarianBurmeseCajunCambodianCanadianCape VerdeanCarpatho RusynCelticCentral AmericanCentral American IndianCherokeeCheyenneChickasawChileanChineseChippewaChoctawColombianColvilleComancheCosta RicanCreeCreekCroatianCrowCubanCypriotCzechCzechoslovakianDanishDelawareDominicanDutchDutch West IndianEastern EuropeanEcuadorianEgyptianEnglishEstonianEthiopianEuropeanFijianFilipinoFinnishFrenchFrench American IndianFrench CanadianGermanGerman RussianGhanaianGreekGuamanian / ChamorroGuatemalanGuyaneseHaitianHmongHonduranHopiHoumaHungarianIcelanderIndian (Asian)IndonesianInupiatIranianIraqiIrishIroquoisIsraeliItalianJamaicanJapaneseJordanianKenyanKiowaKoreanLaotianLatvianLebaneseLiberianLithuanianLumbeeLuxembourgerMacedonianMalaysianMalteseMarshalleseMenomineeMexicanMexican American IndianMongolianMoroccanNative HawaiianNavajoNepaleseNew ZealanderNicaraguanNigerianNorthern EuropeanNorwegianOkinawanOsageOttawaPaiutePakistaniPalestinianPanamanianParaguayanPennsylvania GermanPeruvianPimaPolishPortuguesePotawatomiPuebloPuerto RicanPuget Sound SalishRomanianRussianSalvadoranSamoanScandinavianScotch-IrishScottishSeminoleSenegaleseSerbianShoshoneSierra LeoneanSiouxSlavicSlovakSloveneSomaliSouth AfricanSouth AmericanSouth American IndianSoviet UnionSpaniardSpanishSpanish AmericanSpanish American IndianSri LankanSubsaharan AfricanSudaneseSwedishSwissSyrianTaiwaneseThaiTlingit-HaidaTohono O'OdhamTonganTrinidadian and TobagonianTsimshianTurkishU.S. Virgin IslanderUgandanUkrainianUruguayanUteVenezuelanVietnameseWelshWest IndianYakamaYaquiYugoslavianYumanYup'ikZimbabwean
Immigrant Origin (Total)
AfghanistanAfricaAlbaniaArgentinaArmeniaAsiaAustraliaAustriaAzoresBahamasBangladeshBarbadosBelarusBelgiumBelizeBoliviaBosnia and HerzegovinaBrazilBulgariaBurma / MyanmarCabo VerdeCambodiaCameroonCanadaCaribbeanCentral AmericaChileChinaColombiaCongoCosta RicaCroatiaCubaCzechoslovakiaDenmarkDominicaDominican RepublicEastern AfricaEastern AsiaEastern EuropeEcuadorEgyptEl SalvadorEnglandEritreaEthiopiaEuropeFijiFranceGermanyGhanaGreeceGrenadaGuatemalaGuyanaHaitiHondurasHong KongHungaryIndiaIndonesiaIranIraqIrelandIsraelItalyJamaicaJapanJordanKazakhstanKenyaKoreaKuwaitLaosLatin AmericaLatviaLebanonLiberiaLithuaniaMalaysiaMexicoMicronesiaMiddle AfricaMoldovaMoroccoNepalNetherlandsNicaraguaNigeriaNorth MacedoniaNorthern AfricaNorthern EuropeNorwayOceaniaPakistanPanamaPeruPhilippinesPolandPortugalRomaniaRussiaSaudi ArabiaScotlandSenegalSerbiaSierra LeoneSingaporeSomaliaSouth AfricaSouth AmericaSouth Central AsiaSouth Eastern AsiaSouthern EuropeSpainSri LankaSt. Vincent and the GrenadinesSudanSwedenSwitzerlandSyriaTaiwanThailandTrinidad and TobagoTurkeyUgandaUkraineUruguayUzbekistanVenezuelaVietnamWest IndiesWestern AfricaWestern AsiaWestern EuropeYemenZaireZimbabwe
Immigrant Origin (Percentage)
AfghanistanAfricaAlbaniaArgentinaArmeniaAsiaAustraliaAustriaAzoresBahamasBangladeshBarbadosBelarusBelgiumBelizeBoliviaBosnia and HerzegovinaBrazilBulgariaBurma / MyanmarCabo VerdeCambodiaCameroonCanadaCaribbeanCentral AmericaChileChinaColombiaCongoCosta RicaCroatiaCubaCzechoslovakiaDenmarkDominicaDominican RepublicEastern AfricaEastern AsiaEastern EuropeEcuadorEgyptEl SalvadorEnglandEritreaEthiopiaEuropeFijiFranceGermanyGhanaGreeceGrenadaGuatemalaGuyanaHaitiHondurasHong KongHungaryIndiaIndonesiaIranIraqIrelandIsraelItalyJamaicaJapanJordanKazakhstanKenyaKoreaKuwaitLaosLatin AmericaLatviaLebanonLiberiaLithuaniaMalaysiaMexicoMicronesiaMiddle AfricaMoldovaMoroccoNepalNetherlandsNicaraguaNigeriaNorth MacedoniaNorthern AfricaNorthern EuropeNorwayOceaniaPakistanPanamaPeruPhilippinesPolandPortugalRomaniaRussiaSaudi ArabiaScotlandSenegalSerbiaSierra LeoneSingaporeSomaliaSouth AfricaSouth AmericaSouth Central AsiaSouth Eastern AsiaSouthern EuropeSpainSri LankaSt. Vincent and the GrenadinesSudanSwedenSwitzerlandSyriaTaiwanThailandTrinidad and TobagoTurkeyUgandaUkraineUruguayUzbekistanVenezuelaVietnamWest IndiesWestern AfricaWestern AsiaWestern EuropeYemenZaireZimbabwe
Income
Income (Families)
Income (Households)
Poverty
Poverty (Families)
Unemployment
Employment Occupations
Employment Industries
Employer Class
Commute Time
Commute Means
School Enrollment
Education by Degree Field
Occupancy
Finances
Physical Characteristics
Delaware
Compare Zip Codes
Comparison Subject

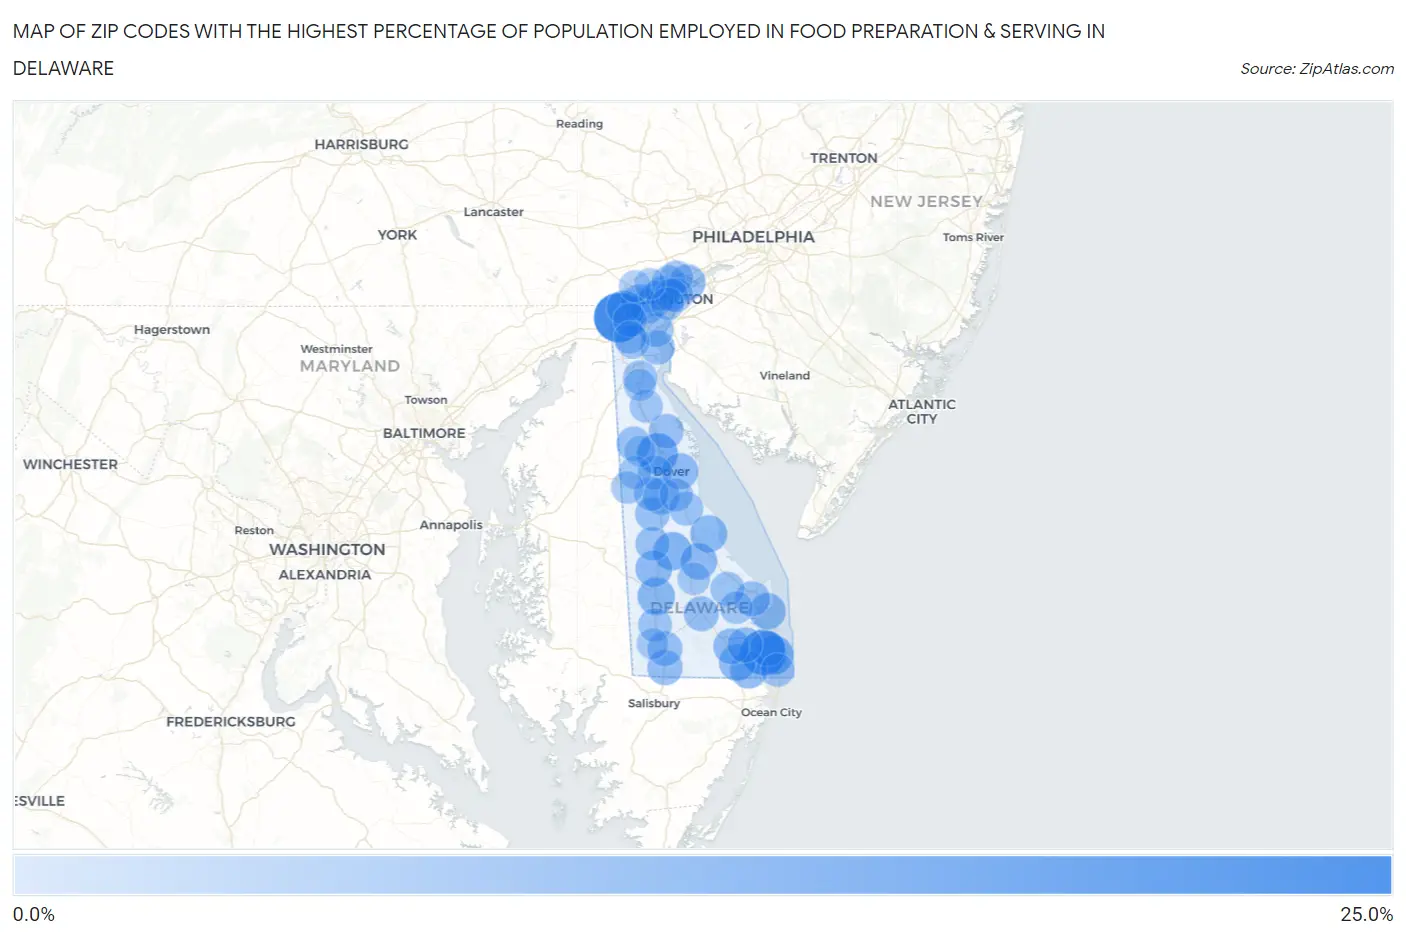
Map of Zip Codes with the Highest Percentage of Population Employed in Food Preparation & Serving in Delaware

0.0%
25.0%
Zip Codes with the Highest Percentage of Population Employed in Food Preparation & Serving in Delaware Map

Zip Codes with the Highest Percentage of Population Employed in Food Preparation & Serving in Delaware

Zip Code % Employed vs State vs National
1.1971722.1%5.0%(+17.2)#15.3%(+16.8)#416
2.1996717.6%5.0%(+12.6)#25.3%(+12.3)#697
3.1993612.1%5.0%(+7.19)#35.3%(+6.86)#1,614
4.1993010.5%5.0%(+5.58)#45.3%(+5.26)#2,305
5.199549.3%5.0%(+4.31)#55.3%(+3.99)#3,253
6.199338.2%5.0%(+3.20)#65.3%(+2.88)#4,493
7.199637.7%5.0%(+2.74)#75.3%(+2.42)#5,203
8.199757.6%5.0%(+2.67)#85.3%(+2.35)#5,317
9.199457.5%5.0%(+2.56)#95.3%(+2.23)#5,518
10.199607.3%5.0%(+2.35)#105.3%(+2.03)#5,901
11.199507.3%5.0%(+2.33)#115.3%(+2.01)#5,936
12.199807.3%5.0%(+2.33)#125.3%(+2.01)#5,938
13.199717.2%5.0%(+2.20)#135.3%(+1.88)#6,197
14.199016.9%5.0%(+1.95)#145.3%(+1.63)#6,785
15.197036.7%5.0%(+1.76)#155.3%(+1.44)#7,269
16.198086.5%5.0%(+1.56)#165.3%(+1.24)#7,811
17.199666.5%5.0%(+1.50)#175.3%(+1.18)#7,962
18.199705.8%5.0%(+0.871)#185.3%(+0.548)#9,917
19.199405.7%5.0%(+0.740)#195.3%(+0.417)#10,327
20.199585.6%5.0%(+0.658)#205.3%(+0.335)#10,636
21.199395.6%5.0%(+0.623)#215.3%(+0.300)#10,756
22.199475.4%5.0%(+0.464)#225.3%(+0.142)#11,312
23.199565.4%5.0%(+0.431)#235.3%(+0.108)#11,425
24.198055.3%5.0%(+0.336)#245.3%(+0.014)#11,763
25.198045.3%5.0%(+0.322)#255.3%(-0.000)#11,822
26.199775.1%5.0%(+0.177)#265.3%(-0.146)#12,395
27.199435.0%5.0%(+0.020)#275.3%(-0.303)#13,018
28.198064.9%5.0%(-0.102)#285.3%(-0.425)#13,509
29.199384.8%5.0%(-0.196)#295.3%(-0.519)#13,877
30.199044.7%5.0%(-0.277)#305.3%(-0.600)#14,213
31.197064.7%5.0%(-0.292)#315.3%(-0.614)#14,280
32.197204.7%5.0%(-0.301)#325.3%(-0.624)#14,318
33.197114.6%5.0%(-0.323)#335.3%(-0.645)#14,404
34.199344.6%5.0%(-0.343)#345.3%(-0.665)#14,499
35.199524.5%5.0%(-0.506)#355.3%(-0.829)#15,180
36.197014.4%5.0%(-0.554)#365.3%(-0.877)#15,380
37.197094.4%5.0%(-0.570)#375.3%(-0.893)#15,451
38.199684.4%5.0%(-0.598)#385.3%(-0.921)#15,580
39.198034.3%5.0%(-0.613)#395.3%(-0.936)#15,642
40.197134.3%5.0%(-0.668)#405.3%(-0.991)#15,903
41.198094.2%5.0%(-0.744)#415.3%(-1.07)#16,246
42.199464.2%5.0%(-0.802)#425.3%(-1.12)#16,460
43.199734.0%5.0%(-0.945)#435.3%(-1.27)#17,053
44.198104.0%5.0%(-1.00)#445.3%(-1.33)#17,288
45.199623.7%5.0%(-1.22)#455.3%(-1.54)#18,157
46.199443.7%5.0%(-1.30)#465.3%(-1.63)#18,536
47.198023.5%5.0%(-1.50)#475.3%(-1.82)#19,333
48.197343.3%5.0%(-1.66)#485.3%(-1.98)#20,043
49.198013.1%5.0%(-1.87)#495.3%(-2.19)#20,886
50.199513.0%5.0%(-1.97)#505.3%(-2.29)#21,267
51.199532.9%5.0%(-2.05)#515.3%(-2.37)#21,595
52.197022.8%5.0%(-2.11)#525.3%(-2.44)#21,865
53.199642.8%5.0%(-2.16)#535.3%(-2.48)#22,043
54.199412.6%5.0%(-2.34)#545.3%(-2.66)#22,700
55.197302.3%5.0%(-2.67)#555.3%(-3.00)#23,807
56.197072.0%5.0%(-2.92)#565.3%(-3.24)#24,581
57.199311.7%5.0%(-3.28)#575.3%(-3.61)#25,575
58.199551.4%5.0%(-3.59)#585.3%(-3.92)#26,273
59.198071.3%5.0%(-3.67)#595.3%(-3.99)#26,425

Common Questions

What are the Top 10 Zip Codes with the Highest Percentage of Population Employed in Food Preparation & Serving in Delaware?
Top 10 Zip Codes with the Highest Percentage of Population Employed in Food Preparation & Serving in Delaware are:
#1
22.1%
#2
17.6%
#3
12.1%
#4
10.5%
#5
9.3%
#6
8.2%
#7
7.7%
#8
7.6%
#9
7.5%
#10
7.3%
What zip code has the Highest Percentage of Population Employed in Food Preparation & Serving in Delaware?
19717 has the Highest Percentage of Population Employed in Food Preparation & Serving in Delaware with 22.1%.
What is the Percentage of Population Employed in Food Preparation & Serving in the State of Delaware?
Percentage of Population Employed in Food Preparation & Serving in Delaware is 5.0%.
What is the Percentage of Population Employed in Food Preparation & Serving in the United States?
Percentage of Population Employed in Food Preparation & Serving in the United States is 5.3%.