Zip Codes with the Highest Percentage of Population Employed in Food Preparation & Serving in Keller, TX
RELATED REPORTS & OPTIONS
Food Preparation & Serving
Keller
Compare Zip Codes
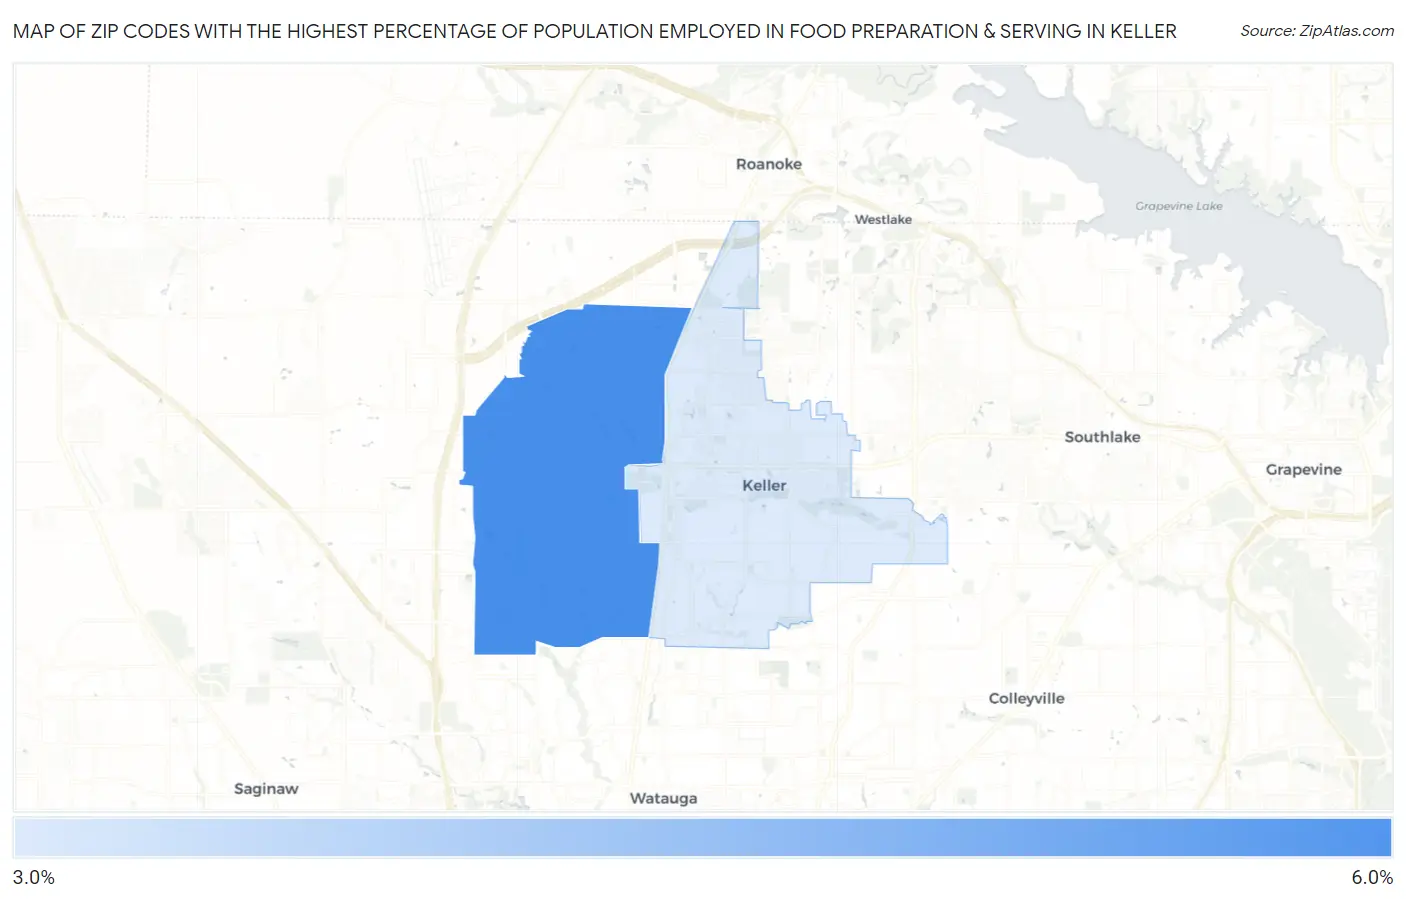
Map of Zip Codes with the Highest Percentage of Population Employed in Food Preparation & Serving in Keller
0.0%
6.0%
Zip Codes with the Highest Percentage of Population Employed in Food Preparation & Serving in Keller, TX
| Zip Code | % Employed | vs State | vs National | |
| 1. | 76244 | 5.3% | 5.4%(-0.075)#735 | 5.3%(-0.010)#11,853 |
| 2. | 76248 | 3.0% | 5.4%(-2.32)#1,263 | 5.3%(-2.26)#21,149 |
1
Common Questions
What are the Top Zip Codes with the Highest Percentage of Population Employed in Food Preparation & Serving in Keller, TX?
Top Zip Codes with the Highest Percentage of Population Employed in Food Preparation & Serving in Keller, TX are:
What zip code has the Highest Percentage of Population Employed in Food Preparation & Serving in Keller, TX?
76244 has the Highest Percentage of Population Employed in Food Preparation & Serving in Keller, TX with 5.3%.
What is the Percentage of Population Employed in Food Preparation & Serving in Keller, TX?
Percentage of Population Employed in Food Preparation & Serving in Keller is 2.7%.
What is the Percentage of Population Employed in Food Preparation & Serving in Texas?
Percentage of Population Employed in Food Preparation & Serving in Texas is 5.4%.
What is the Percentage of Population Employed in Food Preparation & Serving in the United States?
Percentage of Population Employed in Food Preparation & Serving in the United States is 5.3%.