Zip Codes with the Highest Percentage of Population Employed in Food Preparation & Serving in Humble, TX
RELATED REPORTS & OPTIONS
Food Preparation & Serving
Humble
Compare Zip Codes
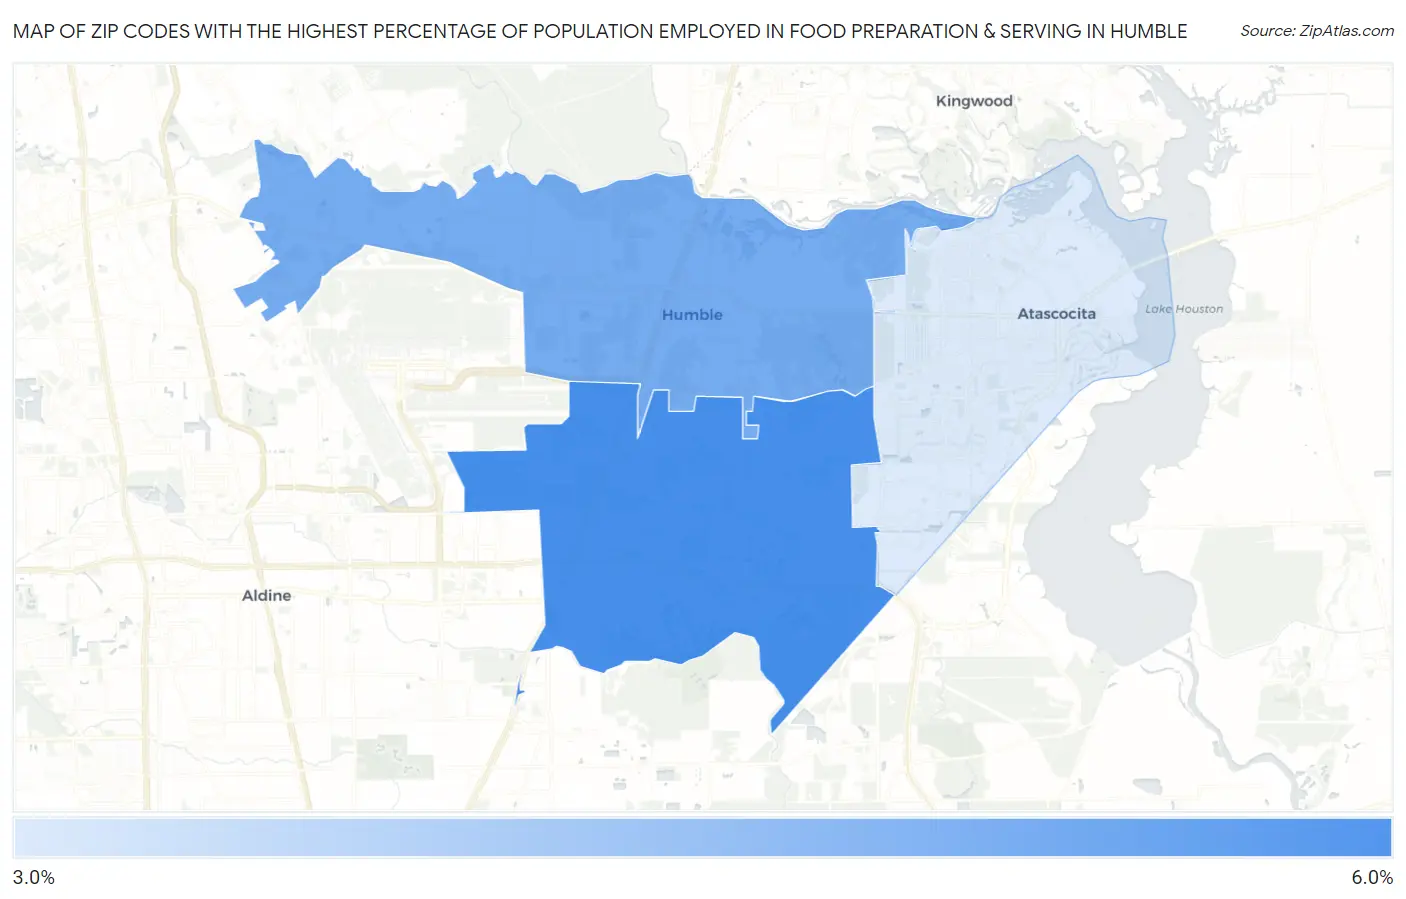
Map of Zip Codes with the Highest Percentage of Population Employed in Food Preparation & Serving in Humble
0.0%
6.0%
Zip Codes with the Highest Percentage of Population Employed in Food Preparation & Serving in Humble, TX
| Zip Code | % Employed | vs State | vs National | |
| 1. | 77396 | 6.0% | 5.4%(+0.636)#568 | 5.3%(+0.701)#9,386 |
| 2. | 77338 | 5.1% | 5.4%(-0.223)#773 | 5.3%(-0.158)#12,430 |
| 3. | 77346 | 3.2% | 5.4%(-2.19)#1,228 | 5.3%(-2.13)#20,622 |
1
Common Questions
What are the Top Zip Codes with the Highest Percentage of Population Employed in Food Preparation & Serving in Humble, TX?
Top Zip Codes with the Highest Percentage of Population Employed in Food Preparation & Serving in Humble, TX are:
What zip code has the Highest Percentage of Population Employed in Food Preparation & Serving in Humble, TX?
77396 has the Highest Percentage of Population Employed in Food Preparation & Serving in Humble, TX with 6.0%.
What is the Percentage of Population Employed in Food Preparation & Serving in Humble, TX?
Percentage of Population Employed in Food Preparation & Serving in Humble is 3.2%.
What is the Percentage of Population Employed in Food Preparation & Serving in Texas?
Percentage of Population Employed in Food Preparation & Serving in Texas is 5.4%.
What is the Percentage of Population Employed in Food Preparation & Serving in the United States?
Percentage of Population Employed in Food Preparation & Serving in the United States is 5.3%.