Zip Codes with the Highest Percentage of Population Employed in Food Preparation & Serving in Laredo, TX
RELATED REPORTS & OPTIONS
Food Preparation & Serving
Laredo
Compare Zip Codes
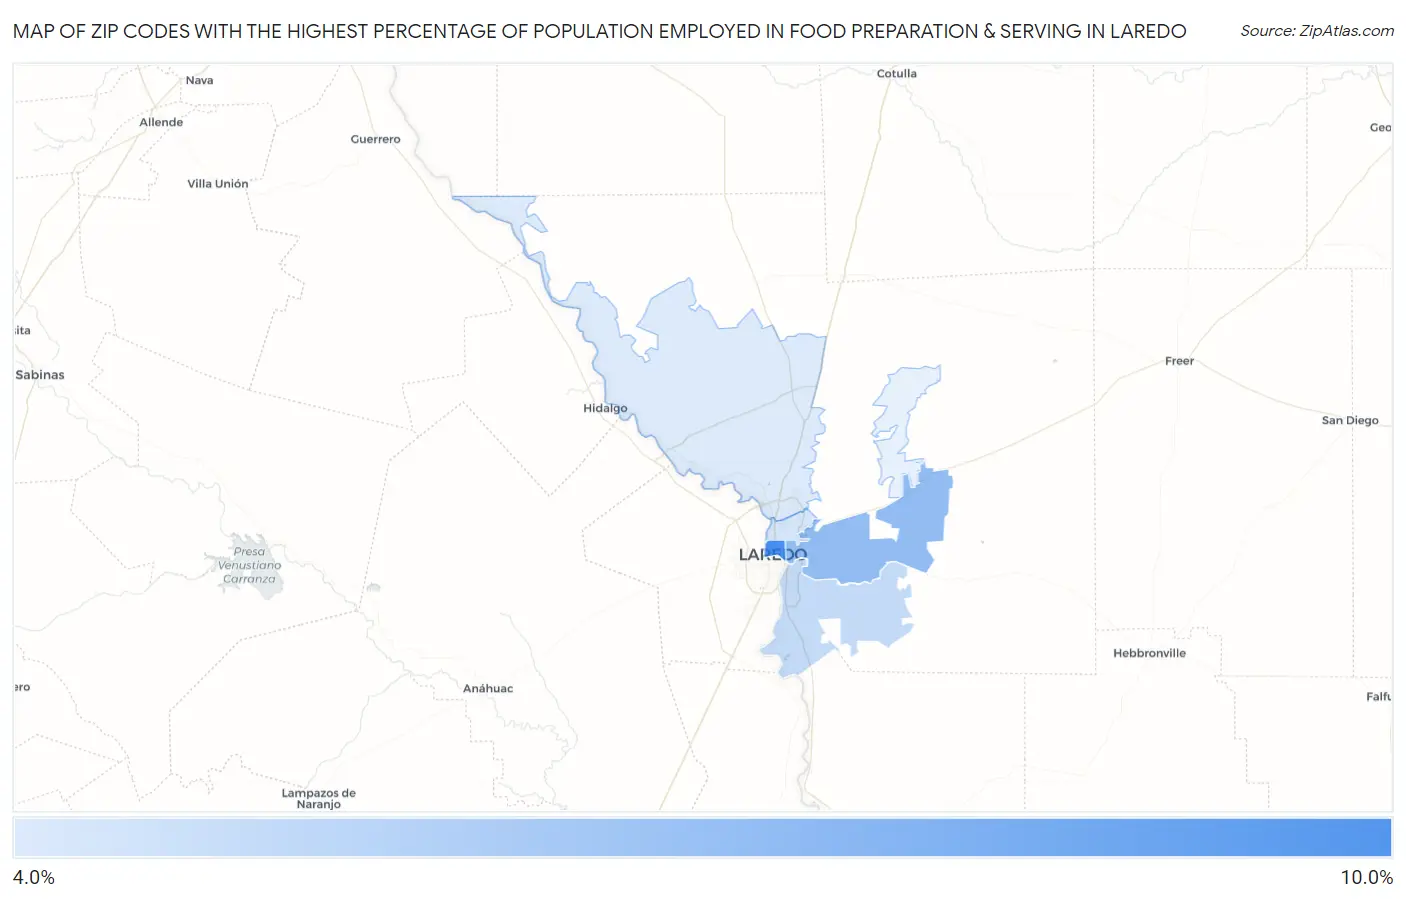
Map of Zip Codes with the Highest Percentage of Population Employed in Food Preparation & Serving in Laredo
0.0%
10.0%
Zip Codes with the Highest Percentage of Population Employed in Food Preparation & Serving in Laredo, TX
| Zip Code | % Employed | vs State | vs National | |
| 1. | 78040 | 10.0% | 5.4%(+4.61)#146 | 5.3%(+4.68)#2,662 |
| 2. | 78043 | 7.4% | 5.4%(+2.05)#361 | 5.3%(+2.11)#5,751 |
| 3. | 78046 | 5.8% | 5.4%(+0.463)#599 | 5.3%(+0.528)#9,981 |
| 4. | 78041 | 5.2% | 5.4%(-0.137)#748 | 5.3%(-0.072)#12,085 |
| 5. | 78045 | 5.0% | 5.4%(-0.385)#818 | 5.3%(-0.320)#13,072 |
1
Common Questions
What are the Top 5 Zip Codes with the Highest Percentage of Population Employed in Food Preparation & Serving in Laredo, TX?
Top 5 Zip Codes with the Highest Percentage of Population Employed in Food Preparation & Serving in Laredo, TX are:
What zip code has the Highest Percentage of Population Employed in Food Preparation & Serving in Laredo, TX?
78040 has the Highest Percentage of Population Employed in Food Preparation & Serving in Laredo, TX with 10.0%.
What is the Percentage of Population Employed in Food Preparation & Serving in Laredo, TX?
Percentage of Population Employed in Food Preparation & Serving in Laredo is 6.1%.
What is the Percentage of Population Employed in Food Preparation & Serving in Texas?
Percentage of Population Employed in Food Preparation & Serving in Texas is 5.4%.
What is the Percentage of Population Employed in Food Preparation & Serving in the United States?
Percentage of Population Employed in Food Preparation & Serving in the United States is 5.3%.