Zip Codes with the Highest Percentage of Population Employed in Food Preparation & Serving in Lancaster, TX
RELATED REPORTS & OPTIONS
Food Preparation & Serving
Lancaster
Compare Zip Codes
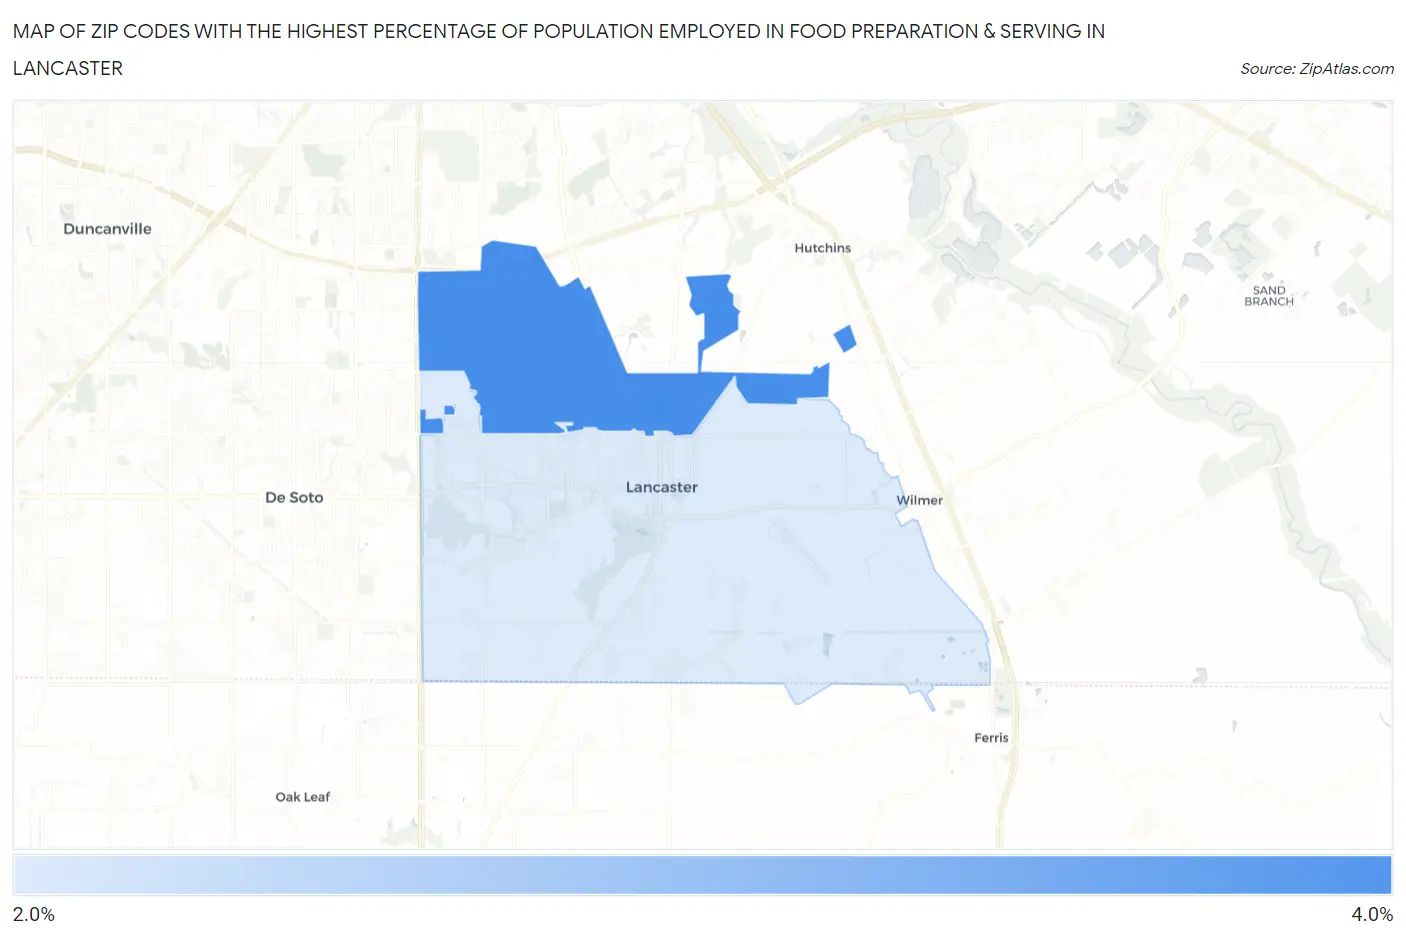
Map of Zip Codes with the Highest Percentage of Population Employed in Food Preparation & Serving in Lancaster
0.0%
4.0%
Zip Codes with the Highest Percentage of Population Employed in Food Preparation & Serving in Lancaster, TX
| Zip Code | % Employed | vs State | vs National | |
| 1. | 75134 | 3.3% | 5.4%(-2.05)#1,198 | 5.3%(-1.99)#20,079 |
| 2. | 75146 | 2.1% | 5.4%(-3.25)#1,422 | 5.3%(-3.19)#24,402 |
1
Common Questions
What are the Top Zip Codes with the Highest Percentage of Population Employed in Food Preparation & Serving in Lancaster, TX?
Top Zip Codes with the Highest Percentage of Population Employed in Food Preparation & Serving in Lancaster, TX are:
What zip code has the Highest Percentage of Population Employed in Food Preparation & Serving in Lancaster, TX?
75134 has the Highest Percentage of Population Employed in Food Preparation & Serving in Lancaster, TX with 3.3%.
What is the Percentage of Population Employed in Food Preparation & Serving in Lancaster, TX?
Percentage of Population Employed in Food Preparation & Serving in Lancaster is 2.9%.
What is the Percentage of Population Employed in Food Preparation & Serving in Texas?
Percentage of Population Employed in Food Preparation & Serving in Texas is 5.4%.
What is the Percentage of Population Employed in Food Preparation & Serving in the United States?
Percentage of Population Employed in Food Preparation & Serving in the United States is 5.3%.