Zip Codes with the Highest Percentage of Population Employed in Food Preparation & Serving in Flower Mound, TX
RELATED REPORTS & OPTIONS
Food Preparation & Serving
Flower Mound
Compare Zip Codes
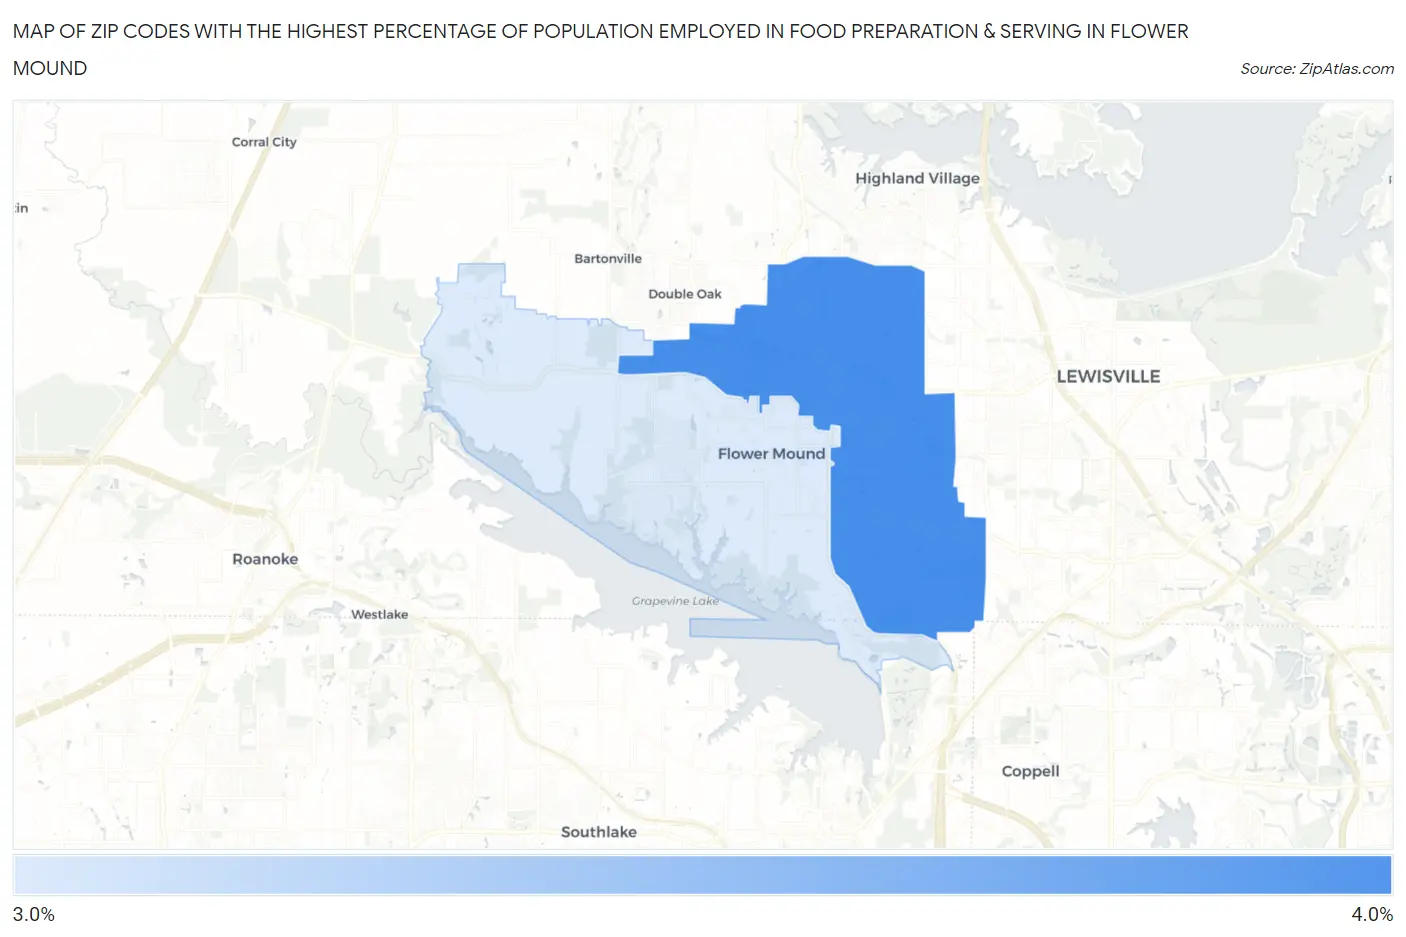
Map of Zip Codes with the Highest Percentage of Population Employed in Food Preparation & Serving in Flower Mound
0.0%
4.0%
Zip Codes with the Highest Percentage of Population Employed in Food Preparation & Serving in Flower Mound, TX
| Zip Code | % Employed | vs State | vs National | |
| 1. | 75028 | 3.1% | 5.4%(-2.28)#1,256 | 5.3%(-2.22)#20,998 |
| 2. | 75022 | 3.1% | 5.4%(-2.29)#1,260 | 5.3%(-2.23)#21,026 |
1
Common Questions
What are the Top Zip Codes with the Highest Percentage of Population Employed in Food Preparation & Serving in Flower Mound, TX?
Top Zip Codes with the Highest Percentage of Population Employed in Food Preparation & Serving in Flower Mound, TX are:
What zip code has the Highest Percentage of Population Employed in Food Preparation & Serving in Flower Mound, TX?
75028 has the Highest Percentage of Population Employed in Food Preparation & Serving in Flower Mound, TX with 3.1%.
What is the Percentage of Population Employed in Food Preparation & Serving in Flower Mound, TX?
Percentage of Population Employed in Food Preparation & Serving in Flower Mound is 3.0%.
What is the Percentage of Population Employed in Food Preparation & Serving in Texas?
Percentage of Population Employed in Food Preparation & Serving in Texas is 5.4%.
What is the Percentage of Population Employed in Food Preparation & Serving in the United States?
Percentage of Population Employed in Food Preparation & Serving in the United States is 5.3%.