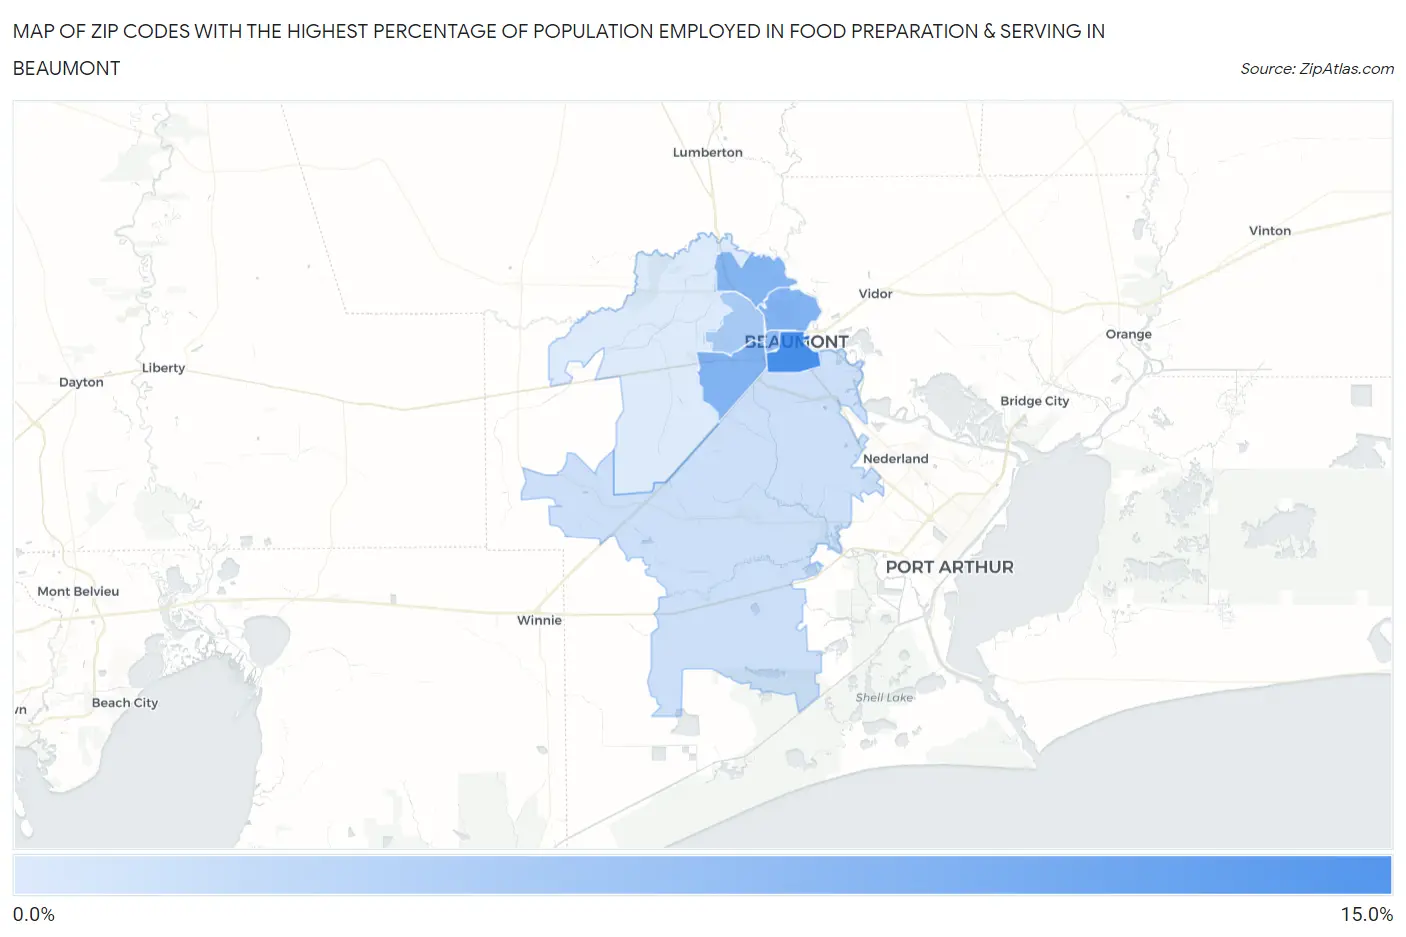
Zip Codes with the Highest Percentage of Population Employed in Food Preparation & Serving in Beaumont, TX
RELATED REPORTS & OPTIONS
Food Preparation & Serving
Beaumont
Compare Zip Codes
Map of Zip Codes with the Highest Percentage of Population Employed in Food Preparation & Serving in Beaumont
0.0%
15.0%
Zip Codes with the Highest Percentage of Population Employed in Food Preparation & Serving in Beaumont, TX
| Zip Code | % Employed | vs State | vs National | |
| 1. | 77701 | 11.9% | 5.4%(+6.59)#91 | 5.3%(+6.65)#1,691 |
| 2. | 77707 | 8.5% | 5.4%(+3.18)#241 | 5.3%(+3.25)#4,038 |
| 3. | 77703 | 8.5% | 5.4%(+3.16)#243 | 5.3%(+3.23)#4,053 |
| 4. | 77708 | 8.4% | 5.4%(+3.06)#253 | 5.3%(+3.12)#4,163 |
| 5. | 77702 | 7.7% | 5.4%(+2.38)#323 | 5.3%(+2.44)#5,172 |
| 6. | 77706 | 6.3% | 5.4%(+0.974)#511 | 5.3%(+1.04)#8,350 |
| 7. | 77705 | 4.1% | 5.4%(-1.22)#1,008 | 5.3%(-1.16)#16,587 |
| 8. | 77713 | 3.3% | 5.4%(-2.06)#1,199 | 5.3%(-1.99)#20,104 |
1
Common Questions
What are the Top 5 Zip Codes with the Highest Percentage of Population Employed in Food Preparation & Serving in Beaumont, TX?
Top 5 Zip Codes with the Highest Percentage of Population Employed in Food Preparation & Serving in Beaumont, TX are:
What zip code has the Highest Percentage of Population Employed in Food Preparation & Serving in Beaumont, TX?
77701 has the Highest Percentage of Population Employed in Food Preparation & Serving in Beaumont, TX with 11.9%.
What is the Percentage of Population Employed in Food Preparation & Serving in Beaumont, TX?
Percentage of Population Employed in Food Preparation & Serving in Beaumont is 7.6%.
What is the Percentage of Population Employed in Food Preparation & Serving in Texas?
Percentage of Population Employed in Food Preparation & Serving in Texas is 5.4%.
What is the Percentage of Population Employed in Food Preparation & Serving in the United States?
Percentage of Population Employed in Food Preparation & Serving in the United States is 5.3%.