Zip Codes with the Highest Percentage of Population Employed in Food Preparation & Serving in Leander, TX
RELATED REPORTS & OPTIONS
Food Preparation & Serving
Leander
Compare Zip Codes
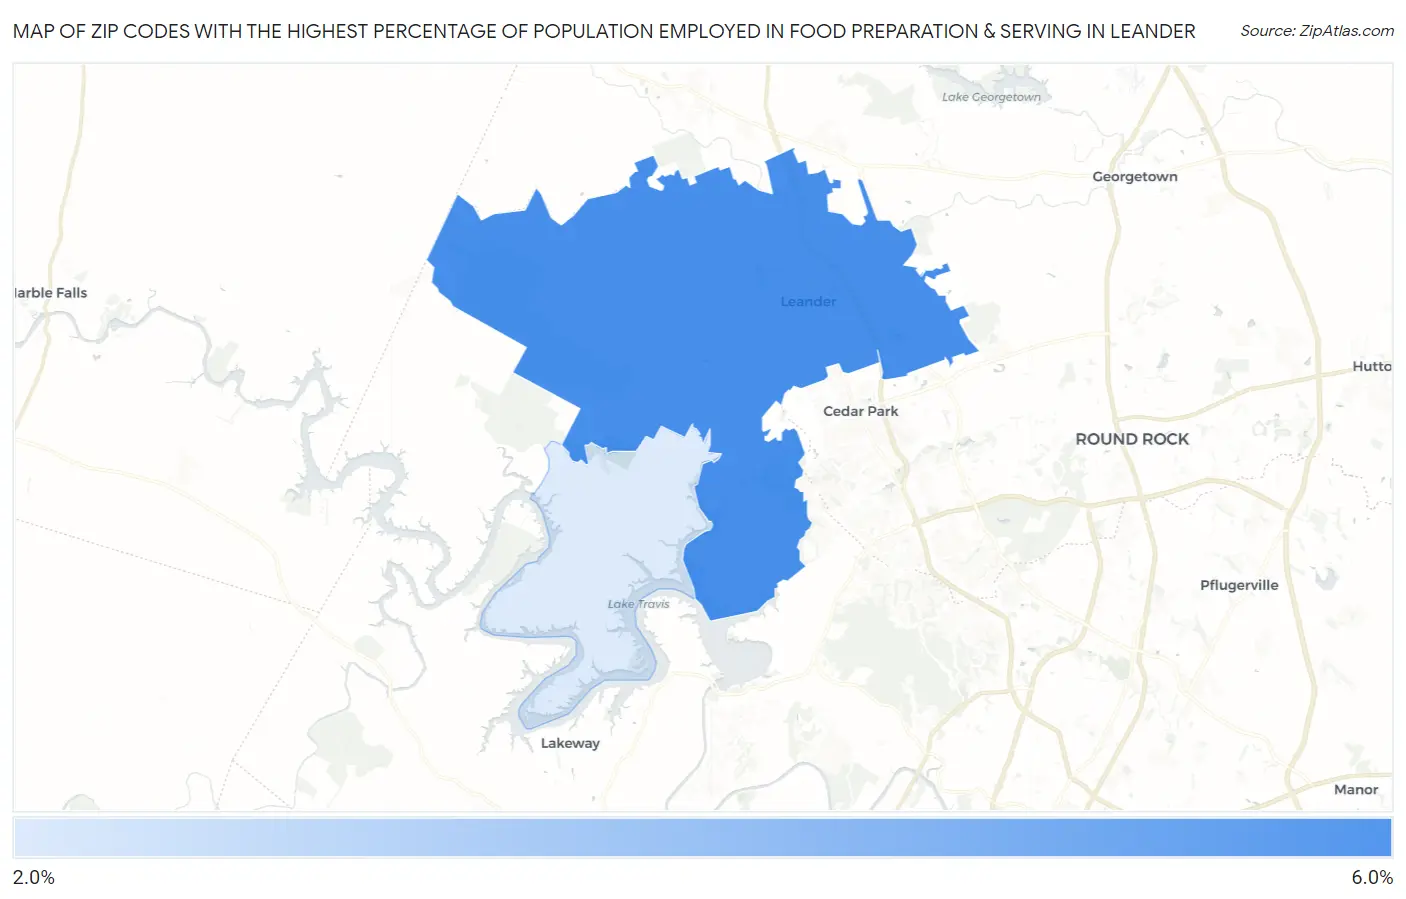
Map of Zip Codes with the Highest Percentage of Population Employed in Food Preparation & Serving in Leander
0.0%
6.0%
Zip Codes with the Highest Percentage of Population Employed in Food Preparation & Serving in Leander, TX
| Zip Code | % Employed | vs State | vs National | |
| 1. | 78641 | 5.2% | 5.4%(-0.192)#765 | 5.3%(-0.127)#12,326 |
| 2. | 78645 | 2.5% | 5.4%(-2.81)#1,353 | 5.3%(-2.74)#23,008 |
1
Common Questions
What are the Top Zip Codes with the Highest Percentage of Population Employed in Food Preparation & Serving in Leander, TX?
Top Zip Codes with the Highest Percentage of Population Employed in Food Preparation & Serving in Leander, TX are:
What zip code has the Highest Percentage of Population Employed in Food Preparation & Serving in Leander, TX?
78641 has the Highest Percentage of Population Employed in Food Preparation & Serving in Leander, TX with 5.2%.
What is the Percentage of Population Employed in Food Preparation & Serving in Leander, TX?
Percentage of Population Employed in Food Preparation & Serving in Leander is 5.0%.
What is the Percentage of Population Employed in Food Preparation & Serving in Texas?
Percentage of Population Employed in Food Preparation & Serving in Texas is 5.4%.
What is the Percentage of Population Employed in Food Preparation & Serving in the United States?
Percentage of Population Employed in Food Preparation & Serving in the United States is 5.3%.