Zip Codes with the Highest Percentage of Population Employed in Food Preparation & Serving in Corpus Christi, TX
RELATED REPORTS & OPTIONS
Food Preparation & Serving
Corpus Christi
Compare Zip Codes
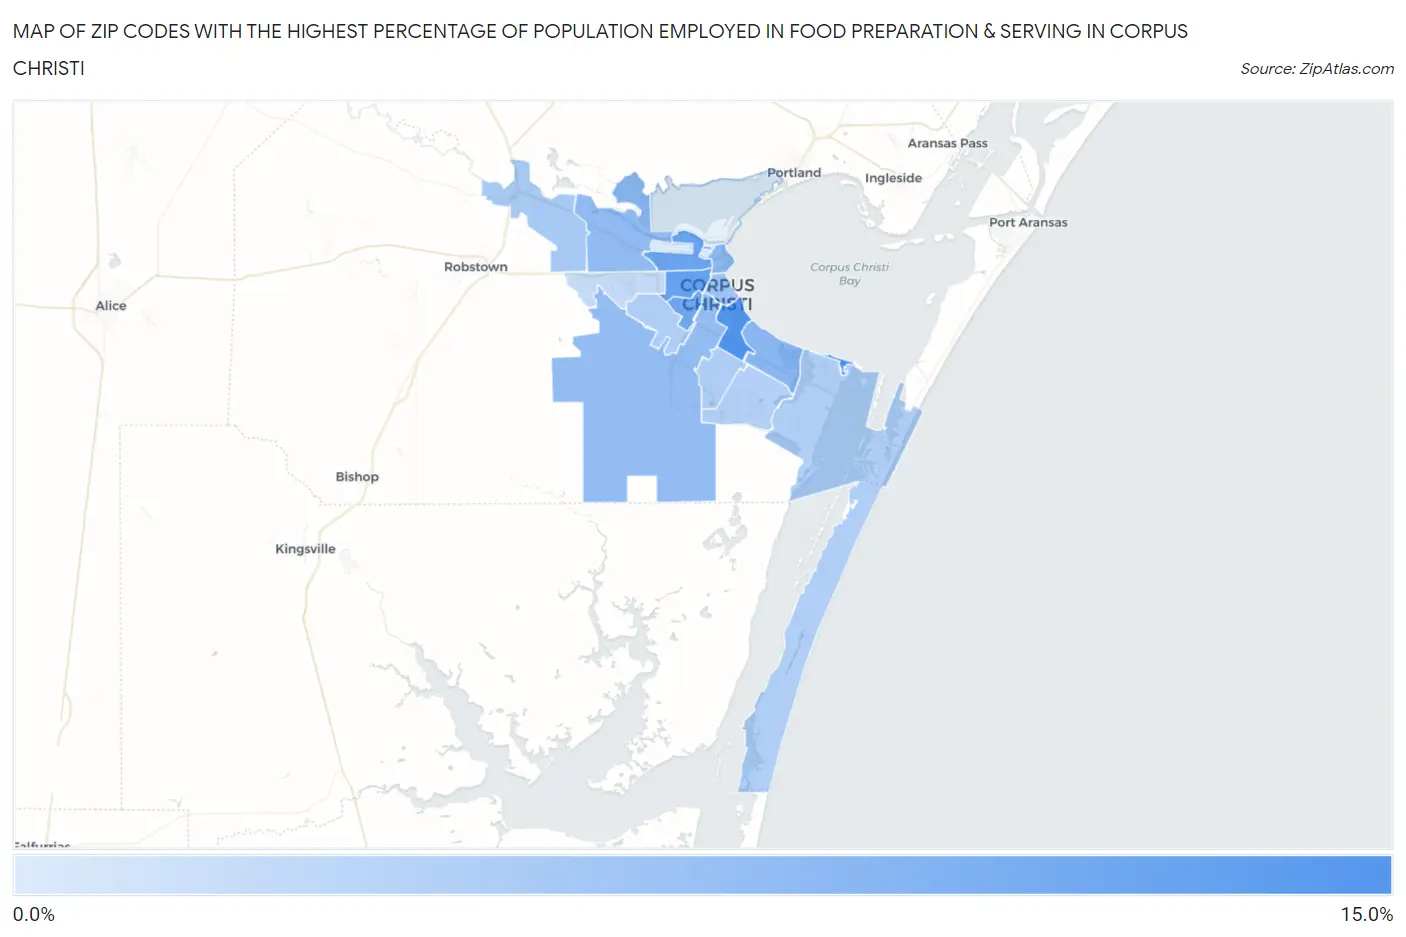
Map of Zip Codes with the Highest Percentage of Population Employed in Food Preparation & Serving in Corpus Christi
0.0%
15.0%
Zip Codes with the Highest Percentage of Population Employed in Food Preparation & Serving in Corpus Christi, TX
| Zip Code | % Employed | vs State | vs National | |
| 1. | 78419 | 13.4% | 5.4%(+8.09)#73 | 5.3%(+8.16)#1,288 |
| 2. | 78411 | 12.9% | 5.4%(+7.58)#81 | 5.3%(+7.65)#1,407 |
| 3. | 78405 | 11.0% | 5.4%(+5.61)#110 | 5.3%(+5.67)#2,075 |
| 4. | 78408 | 10.6% | 5.4%(+5.27)#123 | 5.3%(+5.33)#2,251 |
| 5. | 78416 | 10.3% | 5.4%(+4.95)#134 | 5.3%(+5.01)#2,425 |
| 6. | 78401 | 8.1% | 5.4%(+2.77)#278 | 5.3%(+2.83)#4,551 |
| 7. | 78412 | 8.1% | 5.4%(+2.72)#286 | 5.3%(+2.78)#4,629 |
| 8. | 78409 | 7.6% | 5.4%(+2.20)#336 | 5.3%(+2.27)#5,459 |
| 9. | 78415 | 7.5% | 5.4%(+2.10)#352 | 5.3%(+2.17)#5,648 |
| 10. | 78404 | 6.5% | 5.4%(+1.19)#483 | 5.3%(+1.25)#7,774 |
| 11. | 78410 | 5.7% | 5.4%(+0.373)#615 | 5.3%(+0.439)#10,261 |
| 12. | 78413 | 5.3% | 5.4%(-0.027)#723 | 5.3%(+0.039)#11,671 |
| 13. | 78417 | 5.3% | 5.4%(-0.062)#732 | 5.3%(+0.003)#11,812 |
| 14. | 78418 | 5.1% | 5.4%(-0.255)#782 | 5.3%(-0.189)#12,556 |
| 15. | 78414 | 4.9% | 5.4%(-0.405)#821 | 5.3%(-0.340)#13,161 |
| 16. | 78406 | 3.6% | 5.4%(-1.70)#1,126 | 5.3%(-1.64)#18,565 |
| 17. | 78407 | 1.8% | 5.4%(-3.55)#1,465 | 5.3%(-3.48)#25,256 |
1
Common Questions
What are the Top 10 Zip Codes with the Highest Percentage of Population Employed in Food Preparation & Serving in Corpus Christi, TX?
Top 10 Zip Codes with the Highest Percentage of Population Employed in Food Preparation & Serving in Corpus Christi, TX are:
What zip code has the Highest Percentage of Population Employed in Food Preparation & Serving in Corpus Christi, TX?
78419 has the Highest Percentage of Population Employed in Food Preparation & Serving in Corpus Christi, TX with 13.4%.
What is the Percentage of Population Employed in Food Preparation & Serving in Corpus Christi, TX?
Percentage of Population Employed in Food Preparation & Serving in Corpus Christi is 7.1%.
What is the Percentage of Population Employed in Food Preparation & Serving in Texas?
Percentage of Population Employed in Food Preparation & Serving in Texas is 5.4%.
What is the Percentage of Population Employed in Food Preparation & Serving in the United States?
Percentage of Population Employed in Food Preparation & Serving in the United States is 5.3%.