Zip Codes with the Highest Percentage of Population Employed in Food Preparation & Serving in Marshall, TX
RELATED REPORTS & OPTIONS
Food Preparation & Serving
Marshall
Compare Zip Codes
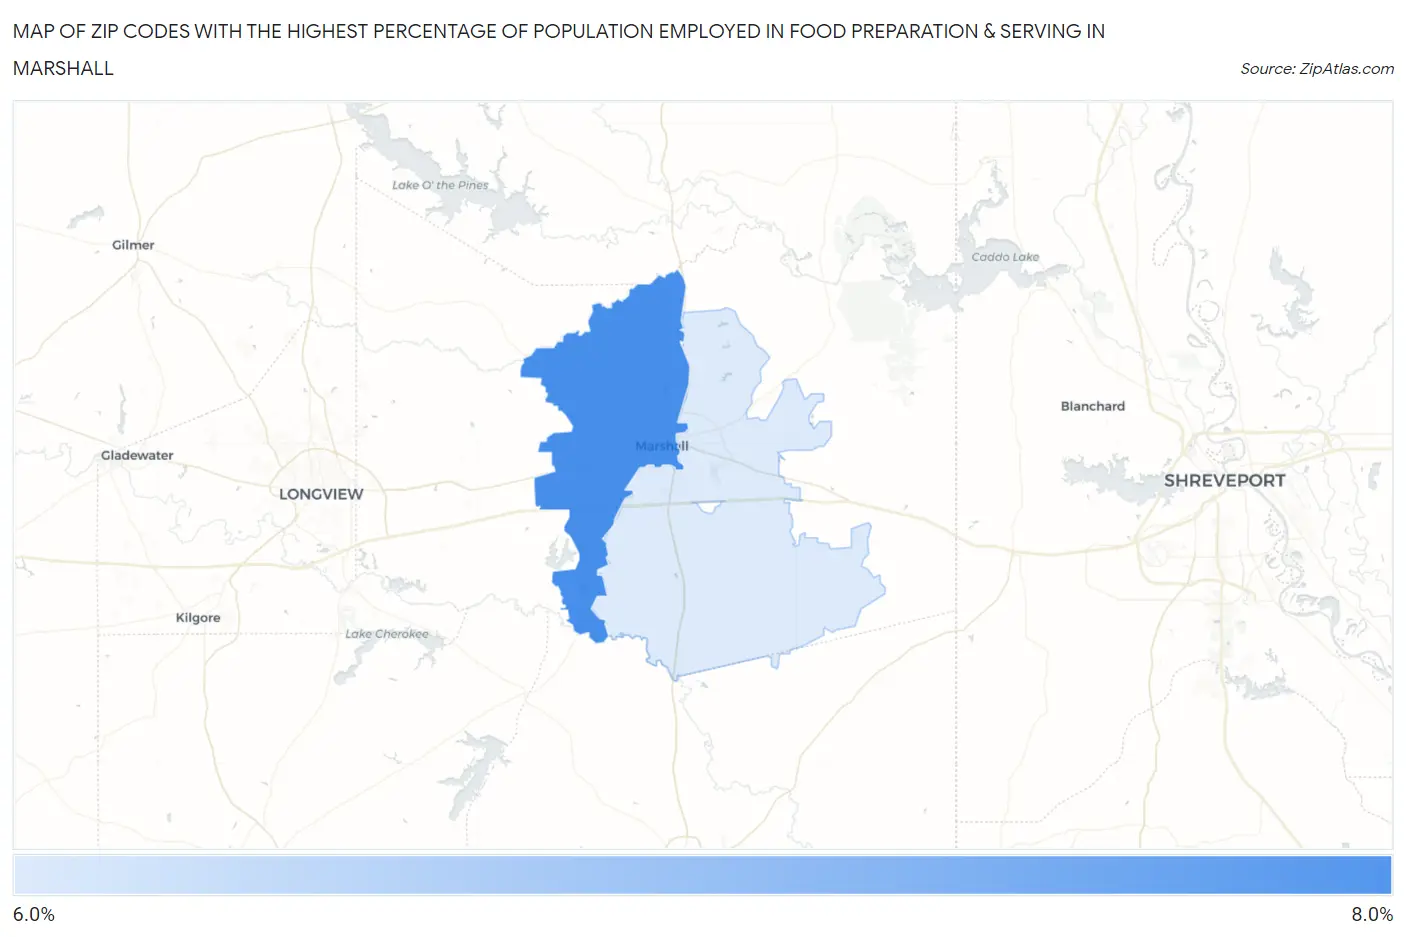
Map of Zip Codes with the Highest Percentage of Population Employed in Food Preparation & Serving in Marshall
0.0%
8.0%
Zip Codes with the Highest Percentage of Population Employed in Food Preparation & Serving in Marshall, TX
| Zip Code | % Employed | vs State | vs National | |
| 1. | 75670 | 6.5% | 5.4%(+1.11)#490 | 5.3%(+1.17)#7,976 |
| 2. | 75672 | 6.3% | 5.4%(+0.906)#519 | 5.3%(+0.971)#8,557 |
1
Common Questions
What are the Top Zip Codes with the Highest Percentage of Population Employed in Food Preparation & Serving in Marshall, TX?
Top Zip Codes with the Highest Percentage of Population Employed in Food Preparation & Serving in Marshall, TX are:
What zip code has the Highest Percentage of Population Employed in Food Preparation & Serving in Marshall, TX?
75670 has the Highest Percentage of Population Employed in Food Preparation & Serving in Marshall, TX with 6.5%.
What is the Percentage of Population Employed in Food Preparation & Serving in Marshall, TX?
Percentage of Population Employed in Food Preparation & Serving in Marshall is 6.3%.
What is the Percentage of Population Employed in Food Preparation & Serving in Texas?
Percentage of Population Employed in Food Preparation & Serving in Texas is 5.4%.
What is the Percentage of Population Employed in Food Preparation & Serving in the United States?
Percentage of Population Employed in Food Preparation & Serving in the United States is 5.3%.